1. Introduction
The European Union (EU) has started a progressive decarbonisation process to become carbon neutral by 2050. A 55% CO
2 emissions reduction objective needs to be fulfilled before 2030 [
1]. To achieve such an ambitious target, multiple conditions must be accomplished first. The introduction in the market of deep retrofitting solutions for the EU industrial landscape and integration of renewable-based and clean processes without hampering their competitiveness are part of these conditions [
2]. The worldwide economic and energetic context has clarified that manufacturers need solutions to the abovementioned challenges.
The iron and steel manufacturing sector is considered an Energy Intensive Industry (EII). Nowadays, its energy needs are fulfilled with non-renewable sources such as coal and natural gas. This fact makes the iron and steel sector one of the highest CO
2 emitters in the industrial landscape. It is estimated that 1.4–2.2 tons of CO
2 were emitted per ton of steel produced in 2018, which is translated into ca. 7–8% of global CO
2 emissions [
2,
3,
4,
5,
6]. The manufacturing of steel requires temperatures usually higher than 1600 °C and specific operating conditions, such as reductive atmospheres, which cannot be met with electricity.
One of the main fossil-based fuels in the sector is coke, which provides high-temperature heat to the process (>1600 °C) and is the most important reducing agent in hot metal production due to the high carbon content. Coke can be produced from coal pyrolysis by heating coal in an oxygen-free atmosphere up to 1300–1400 °C. The major drawback of using coal is its associated emissions which account for 40% of the world’s CO
2 emissions [
7]. These CO
2 emissions could be reduced by replacing fossil-based coke with biochar that can be obtained from solid biomass. The total long-term solid biomass potential in the EU is estimated to be 913 million m
3 [
8].
Among the multiple thermochemical technologies available for the conversion of biomass, gasification stands out as a process capable of producing biochar. The gasification technology consists of converting solid biomass into syngas and biochar, whereas the main drawback would be tar generation, which is not assessed in this paper. The syngas has medium-high heating power and can be used for power generation or synthetic fuel production. The biochar includes the unconverted organic fraction [
9].
It is foreseen that biomass gasification will be a promising technology to decarbonise the iron and steel industry [
10]. The produced syngas and biochar could be directly employed as fuels for thermal generation or even as reducing gas for the process: the gasification technology provides a particular flexibility by giving the possibility of modulating process conditions. Even though the gasification technology is usually focused on syngas production [
11,
12,
13,
14], it is also possible to maximize biochar over the production of syngas at lower temperatures or stoichiometric ratios. In this context, recent examples can be found on the co-production of syngas and biochar through gasification processes [
11,
15,
16,
17].
This research proposes the use of biomass gasification technology as an alternative energy source for industries to reduce carbon emissions. The combined production of syngas and biochar can serve as a fuel or an alternative source of carbon for other processes. However, the economic feasibility of gasification is affected negatively when only syngas is considered as a product, as in common heating or CHP applications. To address this, this study explores the potential of gasification to produce the aforementioned fuels. The research highlights the volatility of natural gas and coke prices, which depend on geopolitical context and international policies.
Economic, technological, and sensitivity analyses have been conducted to determine the technology’s viability. The present analysis allows an estimation of the investment cost of a gasification facility in correlation with its processing capacity (plant scale).
This work had a three-fold aim:
- (i)
Bibliographic survey to shape a techno-economic model, developing a trend for stablishing a trend in the investment costs of a gasification facility depending on its scale;
- (ii)
Development and validation of the proposed approach’s techno-economics to estimate its potential as a solution for EIIs requiring char and fuel gas;
- (iii)
Sensitivity analysis to check which of the different variables of the process had a deeper impact on the viability of a gasification facility.
By addressing these objectives, this analysis aimed to provide insights into the technical and economic aspects of biomass gasification, offering a comprehensive assessment of its potential as a solution for EIIs.
2. Materials and Methods
2.1. Overall Methodology
The main objective of the techno-economic analysis performed in this work was to properly assess the gasification technology economics bringing together two different perspectives:
- (i)
Comparing the cost of the typical biochar production from biogenic sources with the costs of coke purchase. This comparison allowed assessing the economic viability of using biochar as a substitute for coke in industrial applications;
- (ii)
Evaluating the feasibility of syngas production in relation with the evolution and purchase of natural gas in the market. This comparison was carried out by studying the cost of producing each mega-joule (MJ) of energy in syngas compared to the equivalent cost of purchasing natural gas and the associated CO2 credits.
The techno-economic analysis will provide insights into the cost-effectiveness of gasification technology, thus enabling decision-making processes and increasing the availability of information to facilitate it. The utilization of biochar as an alternative to coke and the production of syngas as an alternative to natural gas, involving the CO2-associated emissions, will be the main considerations to feed this model.
2.2. Estimation of Fossil-Based Fuels (Coke and Natural Gas) and CO2 Credits Costs
The evolution of the historical costs of coke, natural gas, and CO2 credits has been assessed. This analysis established a trend in the evolution of the prices and set an average price in the techno-economic assessment for their substitution with syngas and biochar. This historical analysis allowed for a more accurate estimation of the economic implications and cost-effectiveness of the utilization of syngas and biochar as fossil fuel alternatives. It provided valuable insights into the long-term trends and average prices of coke, natural gas, and CO2 credits. It also ensured a comprehensive and robust techno-economic assessment of the substitution of these commodities with syngas and biochar.
The research period spanned from 2019 to 2021, and this temporal range was attributed to two main factors. The upper limit, set at 2021, was dictated by the availability of data during the time of conducting this research in 2022. As more recent data beyond 2021 were not accessible at that point, it was regrettably unfeasible to incorporate more up-to-date information.
Regarding the lower limit, established in 2019, it was chosen to assess specific parameters such as natural gas, coke, and CO2. Up until 2019, these parameters displayed a stable trend, characterized by relatively constant prices. However, subsequent to 2019, prices experienced a significant surge due to multifaceted reasons. It is precisely this abrupt escalation in energy prices that served as the impetus for this investigation, seeking to identify alternative energy sources that can offer a viable solution to the challenges posed by an increasingly unstable and escalating global energy market.
2.3. Overall Efficiency of the Gasification Process
It has been assessed to determine the scale influence on the economic evaluation. Four different case scenarios have been proposed by varying the amount of biomass processed in the gasification unit between 1000–20,000 ton/year (dry base). The efficiency for biomass conversion into medium-low calorific value syngas has been determined based on data found on bibliography [
15,
18,
19,
20]. Biochar and gas yields are also crucial parameters to be considered for the analysis, as they will determine the quantity of solid and gaseous products obtained, thus affecting the cost-effectiveness of the proposed facility. Finally, coke and natural gas energetic parameters and average costs have also been included for easy comparison. For the natural gas and coke costs, data from Eurostat were gathered for the last three years, establishing the average price considered in the analysis [
21,
22].
2.4. Mass and Energy Balances of Syngas and Biochar Production
These have been calculated in each case to determine the quantity of syngas and biochar produced in each of the proposed case scenarios. The facilities’ total energy outputs have also been calculated to compare the natural gas and coke substitution potential.
The third step in the techno-economic analysis is calculating the energy cost at different scales [
23,
24,
25,
26,
27,
28,
29,
30,
31]. Several reference projects have been included in the analysis. Some remarkable cases are the Güssing or the GoBiGas projects. These plants process the following amounts of biomass: 20,000 t/y and 5800 kg/h, respectively [
26,
30].
2.5. Sensitivity Analysis
A profitability analysis was made considering the investment cost obtained, operational expenditures, and other assets. A comparison between the production costs of syngas and biochar, in comparison to the purchase costs for natural gas and coke, have been stated. CO2 emissions-related costs for the natural gas and coke-burning process have also been referred to in the final cost of these products, thus providing a more realistic picture of the current situation of the industries that use these energy sources as heat providers.
A sensitivity analysis was also conducted to assess some critical parameters’ influences on gasification projects’ economic feasibilities. Among the selected parameters, (i) syngas energy content, (ii) CO2 emissions credits, and (iii) natural gas costs can be found. These have been selected in line with the current energy and policy scenario, aiming at complementing the previous techno-economic analysis.
Three financial indicators were calculated: internal rate of return (IRR), net present value (NPV), and payback time. An inflation rate of 5% was considered. This position was considered conservative, as CO
2 taxes and natural gas prices were expected to increase much more than 2% per year. Considering this inflation rate, the yearly savings would increase faster than operational expenditures [
21,
22].
3. Results
3.1. Techno-Economic Assessment
3.1.1. Analysis of Coke, Biochar, and Natural Gas Cost Evolution
In this section, the cost related to the typical biochar production from biogenic sources has been assessed and compared with updated coke purchase costs.
The average biochar production costs for an industrial scale biochar production might vary between 0.03–0.04 EUR/kWh [
32]. The analysis of the available public data shows a wide range of yields to produce biochar via gasification. They can vary between 10 and 200 g
biochar/kg
biomass [
16,
17,
33,
34,
35]. This situation can be explained due to the different gasification technologies, feedstocks, or process conditions affecting the generation of this material. Waste tires, sewage sludge, and rice husks show the highest biochar yield, accounting for more than 50% of the initially fed product (>500 g/kg) [
16,
33,
34]. Considering a biomass gasification process, a defined value of 7% of generated biochar per feedstock can be selected as a realistic but conservative starting point.
Biochar is often considered a by-product of the gasification process since syngas is the main gasification product. However, biochar is an additional revenue that can improve the economic viability of a gasification project. This circumstance might be crucial considering the current worldwide energy scenario. The iron steel sector is currently considering biochar as a solution for the substitution of coke [
36,
37].
The evolution of coke prices in the last three years is illustrated in
Figure 1 [
21,
22,
32,
38]. Biochar production costs are depicted in the grey zone. Biochar production itself would be less profitable than coke since biochar triplicates coke’s production costs. However, biochar is considered a negative emission technology (NET), and this aspect should be considered for a proper economic analysis [
39]. Thus, biochar economics are balanced when CO
2 emissions are associated with the coke-burning process, as the subsequent CO
2 credits accompany it.
The evolution of the coke price [
22] from 2019 to the beginning of 2022 shows a relatively stable price, with a rising trend in the last months of 2021 and further stabilization during 2022. Coke price reached a maximum price of around 0.03 EUR/kWh. These prices are expected to keep increasing due to the decrease in the availability of this fossil fuel and the decarbonisation policies arising worldwide, especially in Europe.
Another crucial factor to consider would be the associated emissions of coke, taking as an example its use in steelmaking processes. It is estimated that between 1.5 and 3.0 tons of CO
2 are emitted into the atmosphere to produce 1-ton steel [
6]. The cost of CO
2 in the EU in the last three years keeps an increasing trend with no foreseeable end (on average) from 24.69 EUR/ton in 2020 to 83.60 EUR/ton in 2022 [
21]. The forecast for 2023 CO
2 prices shows an average cost of 72.04 EUR/ton. Biochar production is more feasible since CO
2 credits experienced an increase in 2021 (
Figure 1). In the first period studied in this work, biochar production was less efficient than coke import. From January 2022 onwards, biochar production becomes more cost-effective than coke import if the CO
2 emission costs are considered, as seen in
Figure 1.
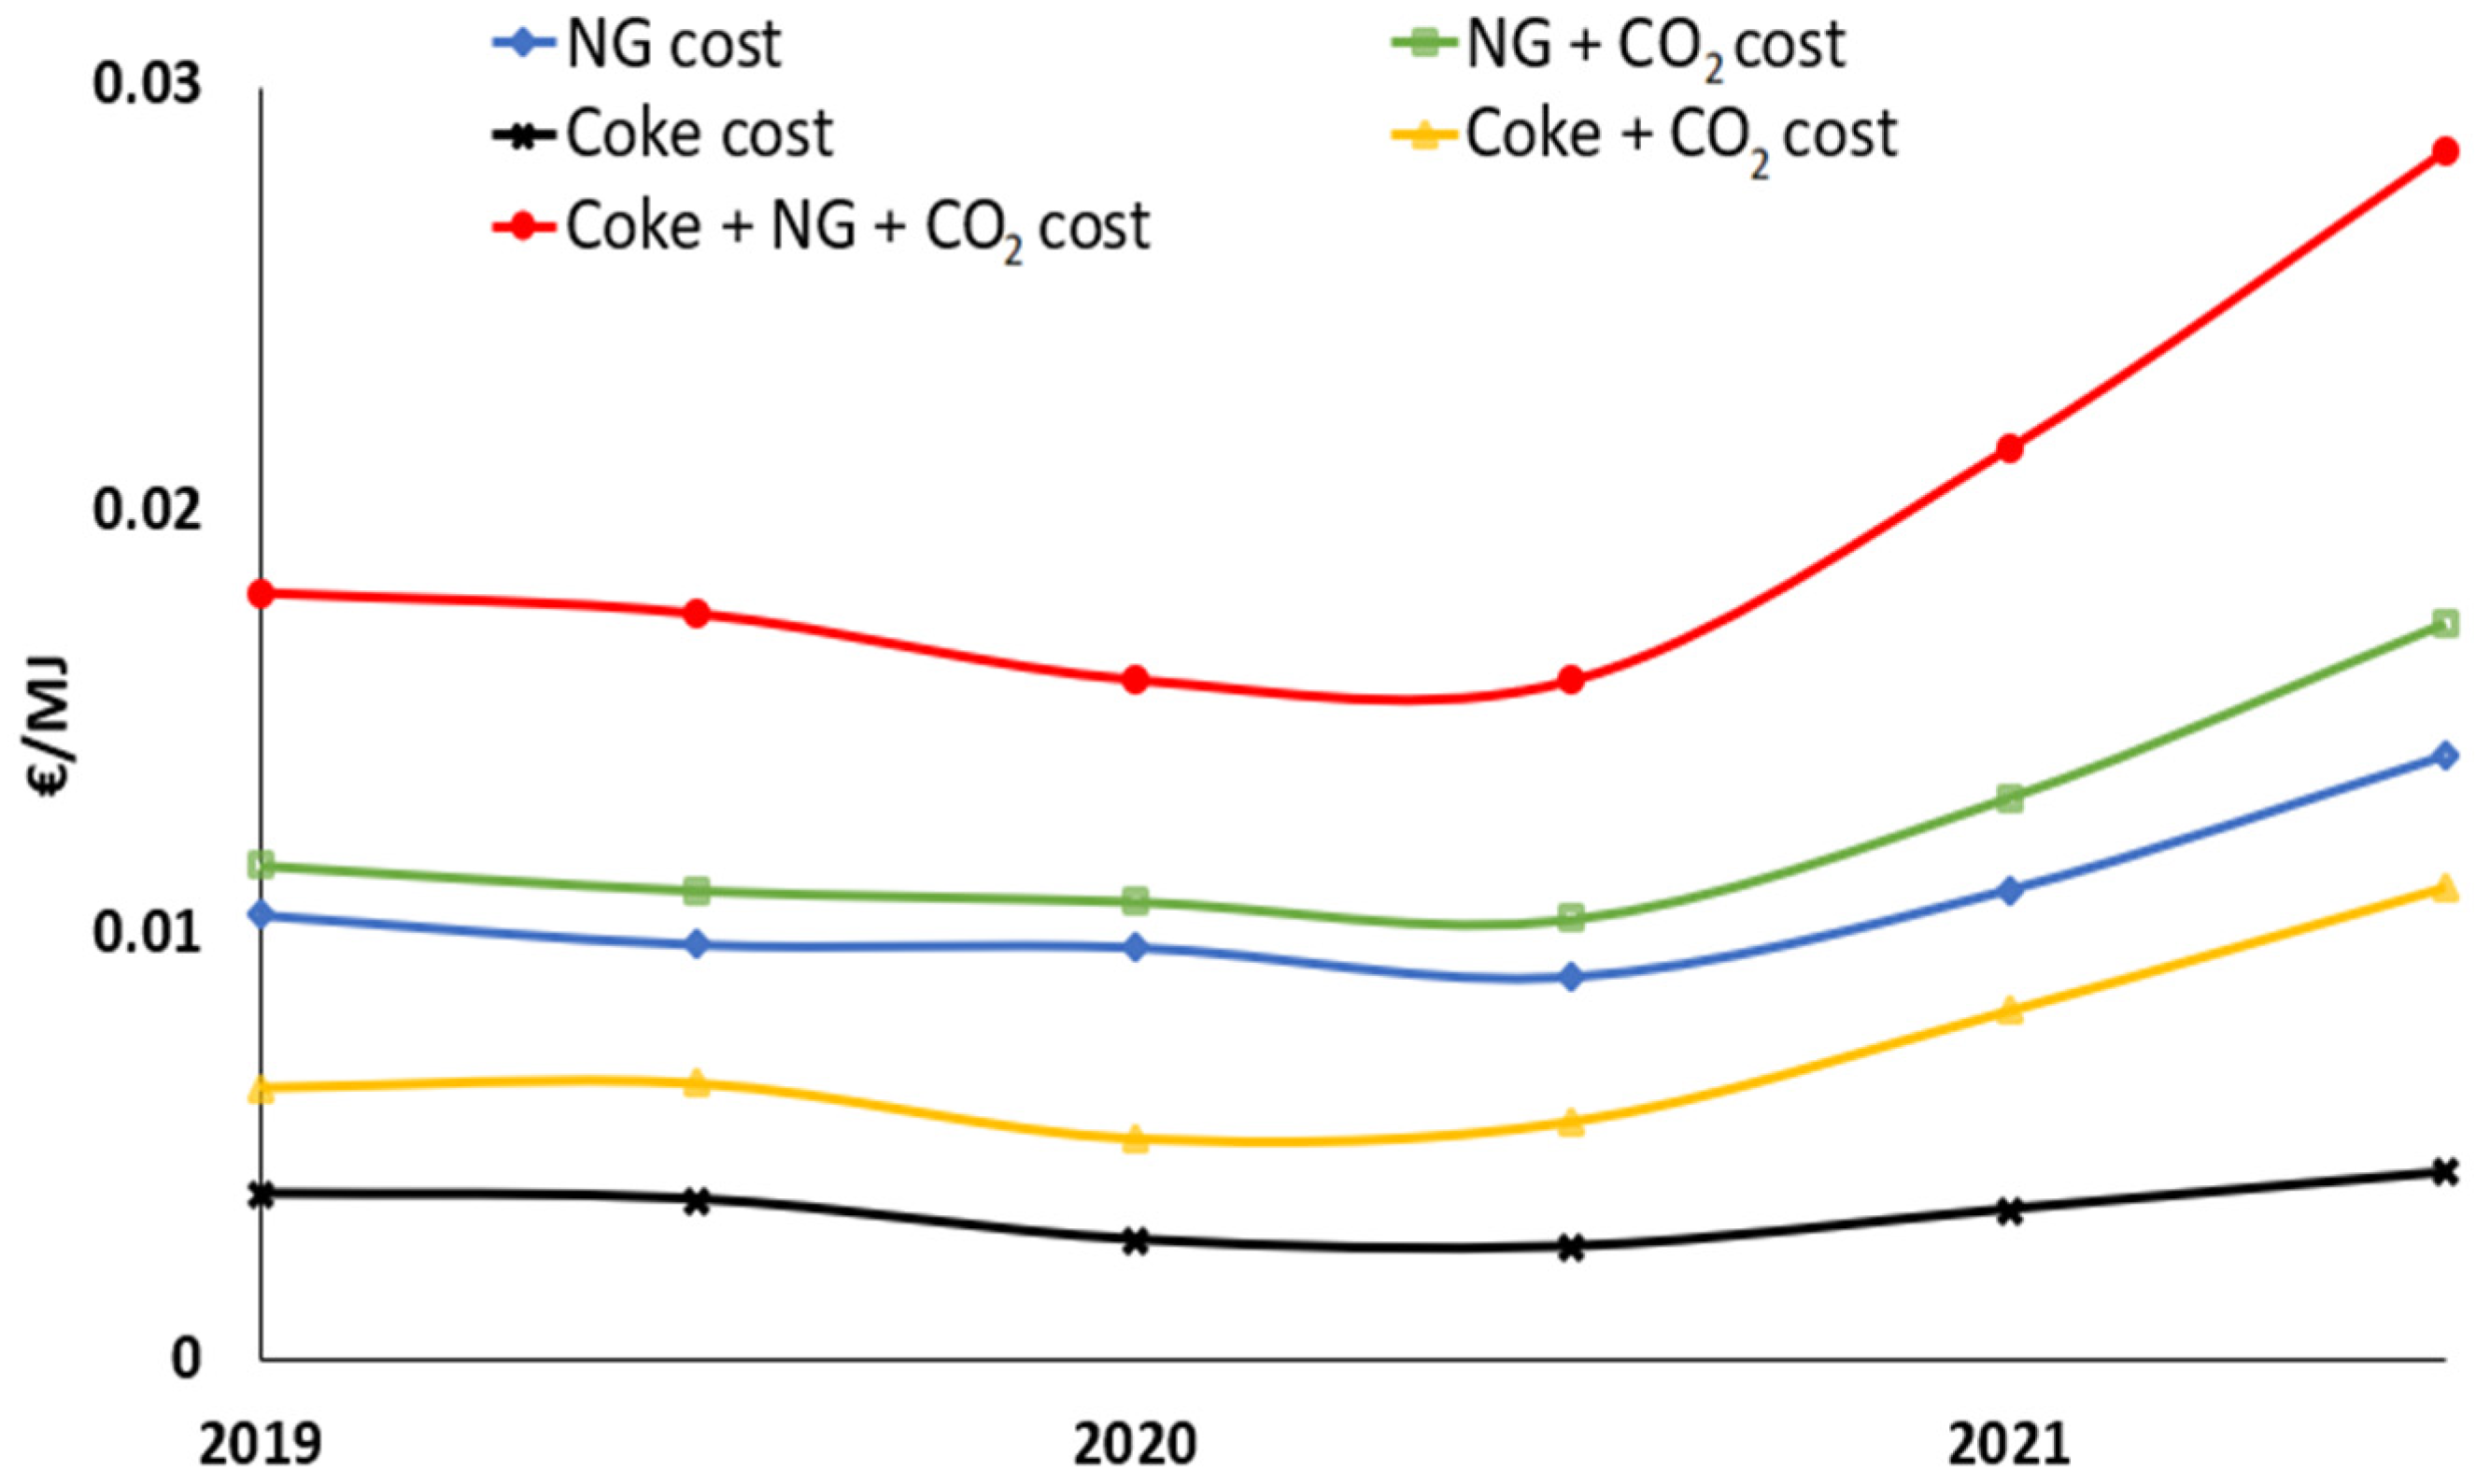
The evolution of natural gas costs through time is presented in
Figure 2, as well as the raw and upgraded syngas production cost. The natural gas cost was stable at around 0.01 EUR/MJ in previous years. Due to the current geopolitical context and international market interests, the average cost of natural gas has significantly increased. Natural gas price has reached almost 0.015 EUR/MJ in the first months of 2022. CO
2 emissions associated with an energy process where coke or natural gas are burnt also included in
Figure 2. The cost has been calculated by establishing the average CO
2 emission credits in semesters and adding them to the average natural gas (NG) or coke price. Natural gas cost is higher than the coke cost. For completeness, an additional trend has been considered to sum up the cost of purchasing coke and natural gas and their associated CO
2 credits. Such an approach has been proposed to simulate the profitability of producing a determined quantity of syngas and biochar through a gasification process compared to the same energy consumption of natural gas and coke.
3.1.2. Techno-Economic Feasibility of the Gasification Process
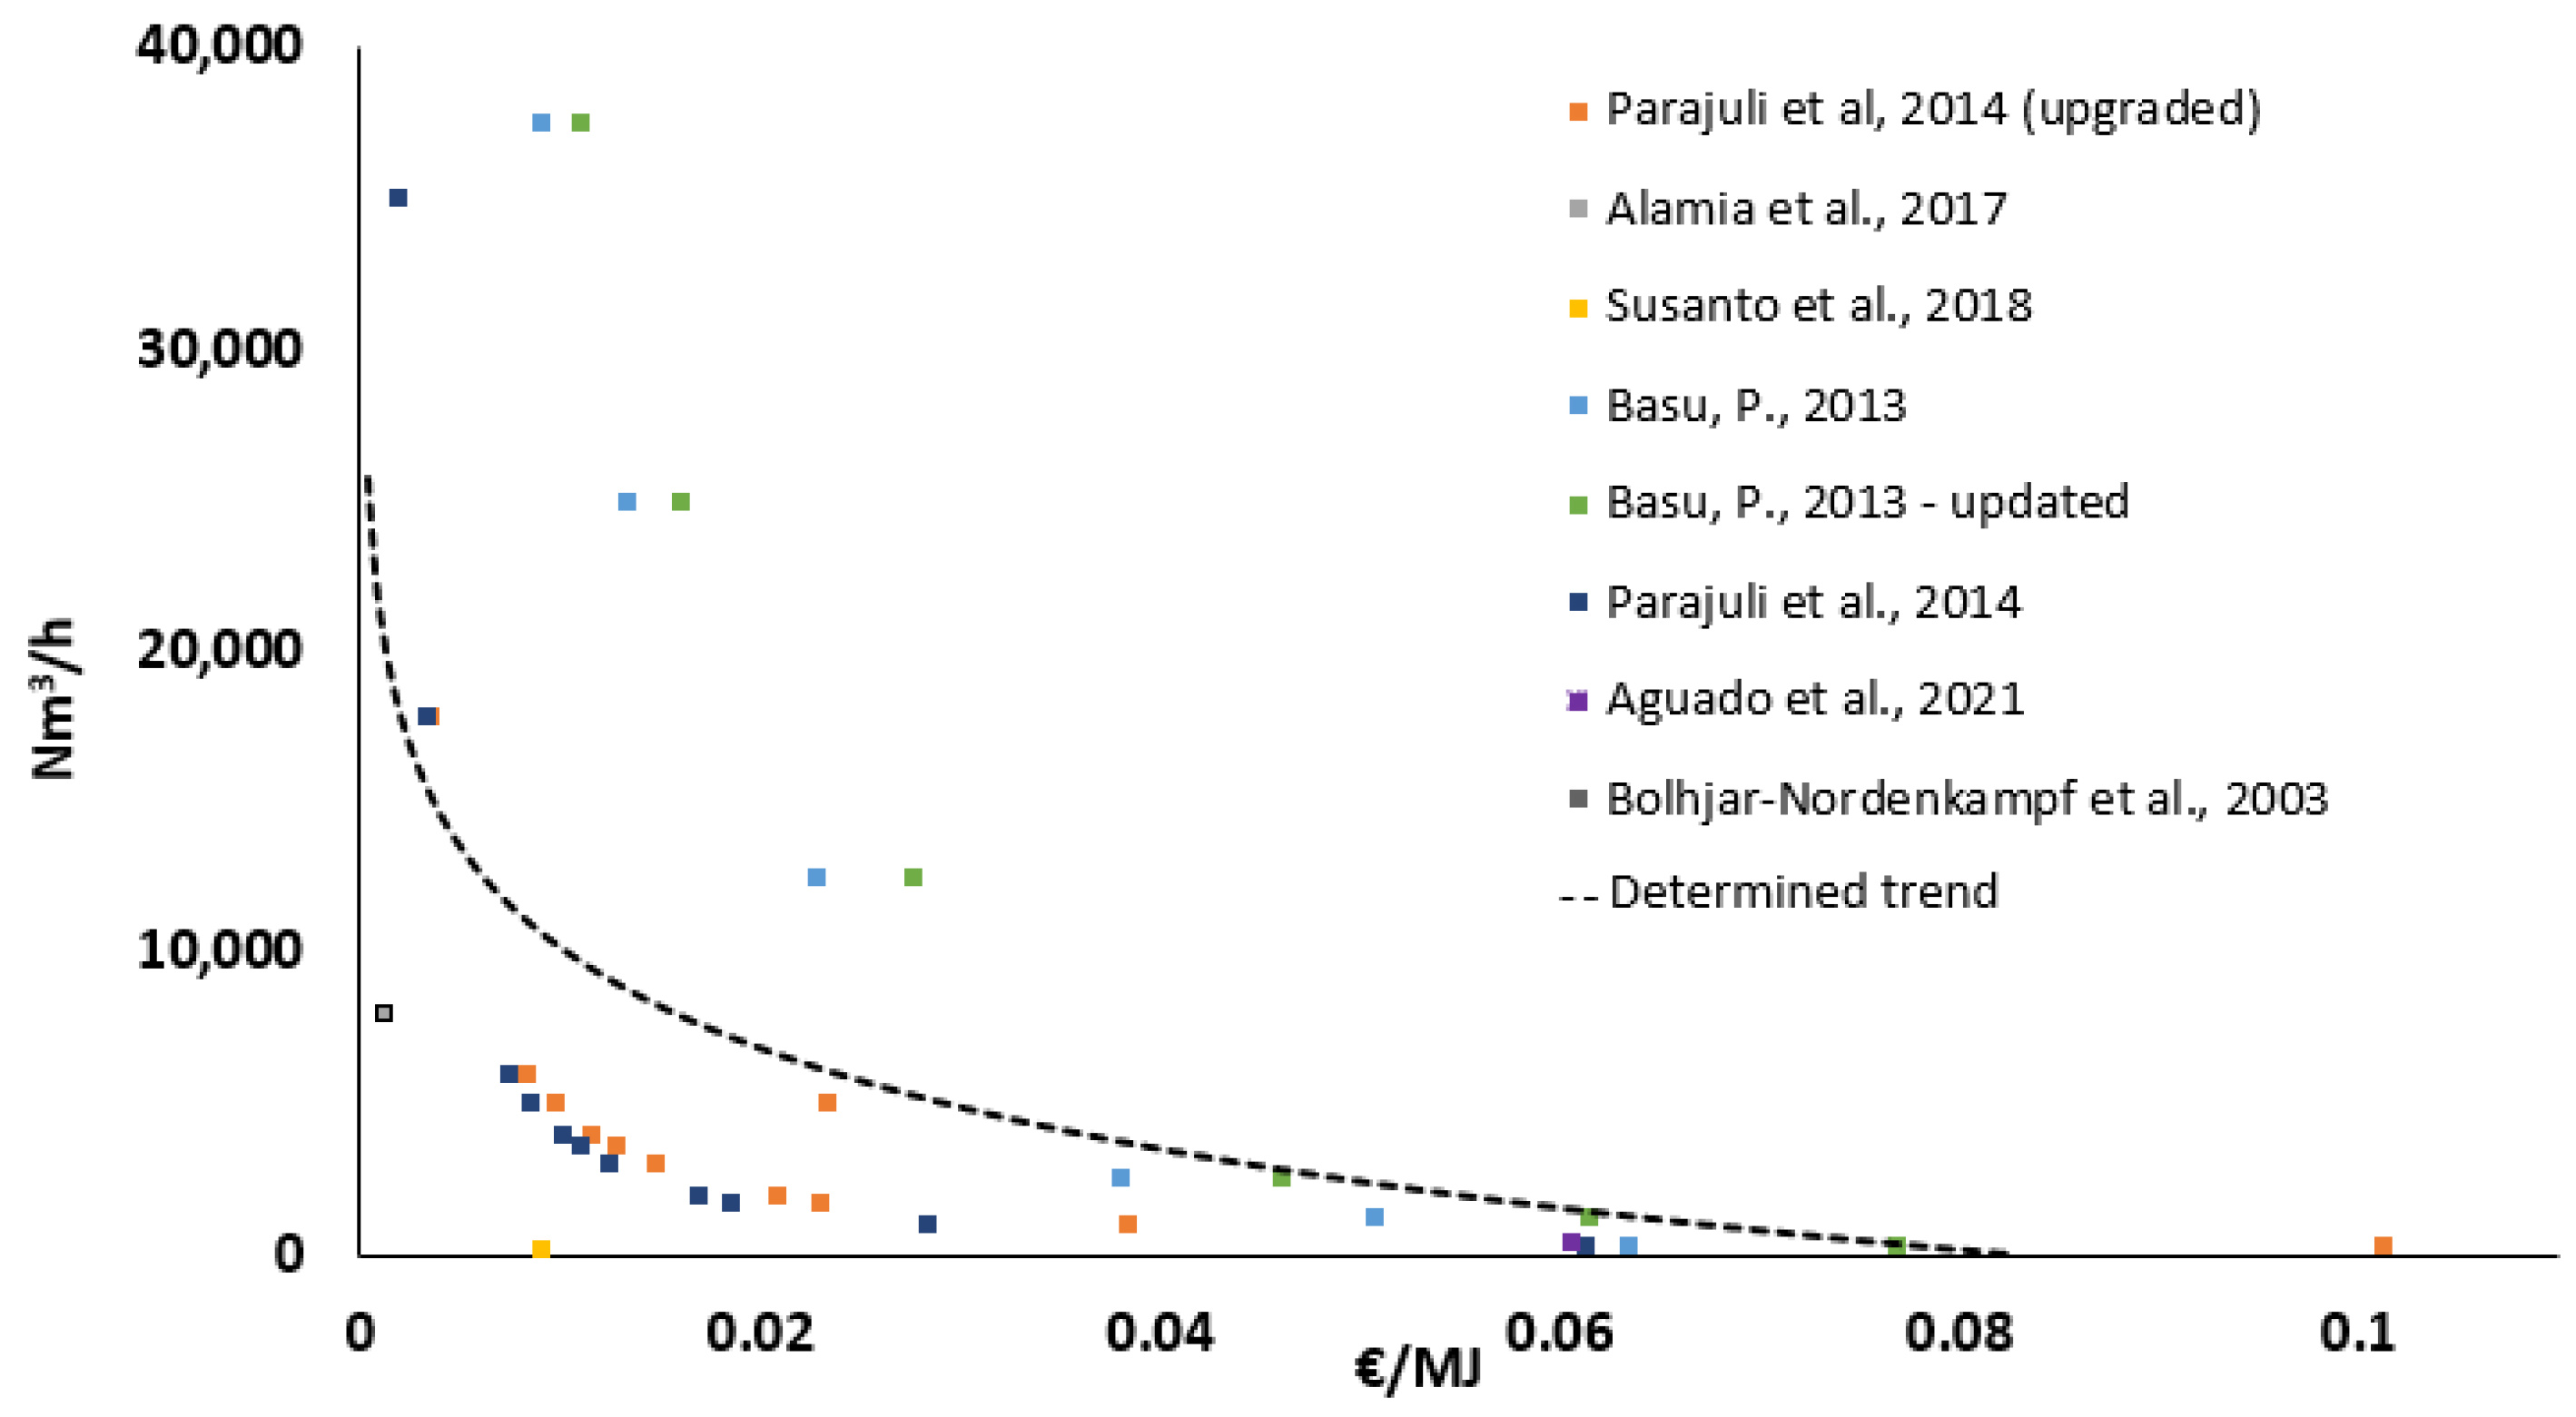
The first result of this analysis is the investment cost of the different studied facilities. As can be seen in
Figure 3, the cost of the energy is strongly dependent on the scale of the facility. An inverse correlation exists between the scale size and the cost per MJ. The variability in the prices could be explained due to the temporal difference between the sources of the information. The cost might have been affected by the technological readiness level or by the inflation rate of the currency. Data considering inflation values along the time frame has been updated to mitigate this second effect and homogenise the information for a proper analysis. This analysis has yet to consider the multiple gasification technology options, as the main objective of the present study is to give a general overview of the costs of energy production in a gasification process.
In
Table 1, the approach for the techno-economic analysis is shown. The scale of each one of the case scenarios, operating hours, yields, and energetic properties are established as input for the model. In the case scenario 1 (CS1), the gas yield, i.e., the gas quantity produced by the fed biomass, has been established as 2.5 Nm
3/kg
biomass, as several authors suggest [
40,
41,
42,
43,
44,
45]. A gas lower heating value has also been proposed with a conservative approach. Typical heating values for air gasification range from 4 to 6 MJ/Nm
3. In this case, a value in the lower half has been selected: 4.5 MJ/Nm
3. These data will serve as a starting point to define the typical characteristics of the gasification process in each one of the four case scenarios.
In
Table 2, the results of natural gas and coke substitution potential are presented, as well as the avoided CO
2 emissions related to using these fuels. According to the costs in the literature [
21,
22], economic savings have also been included. Several assumptions to establish a base scenario have been made for this purpose.
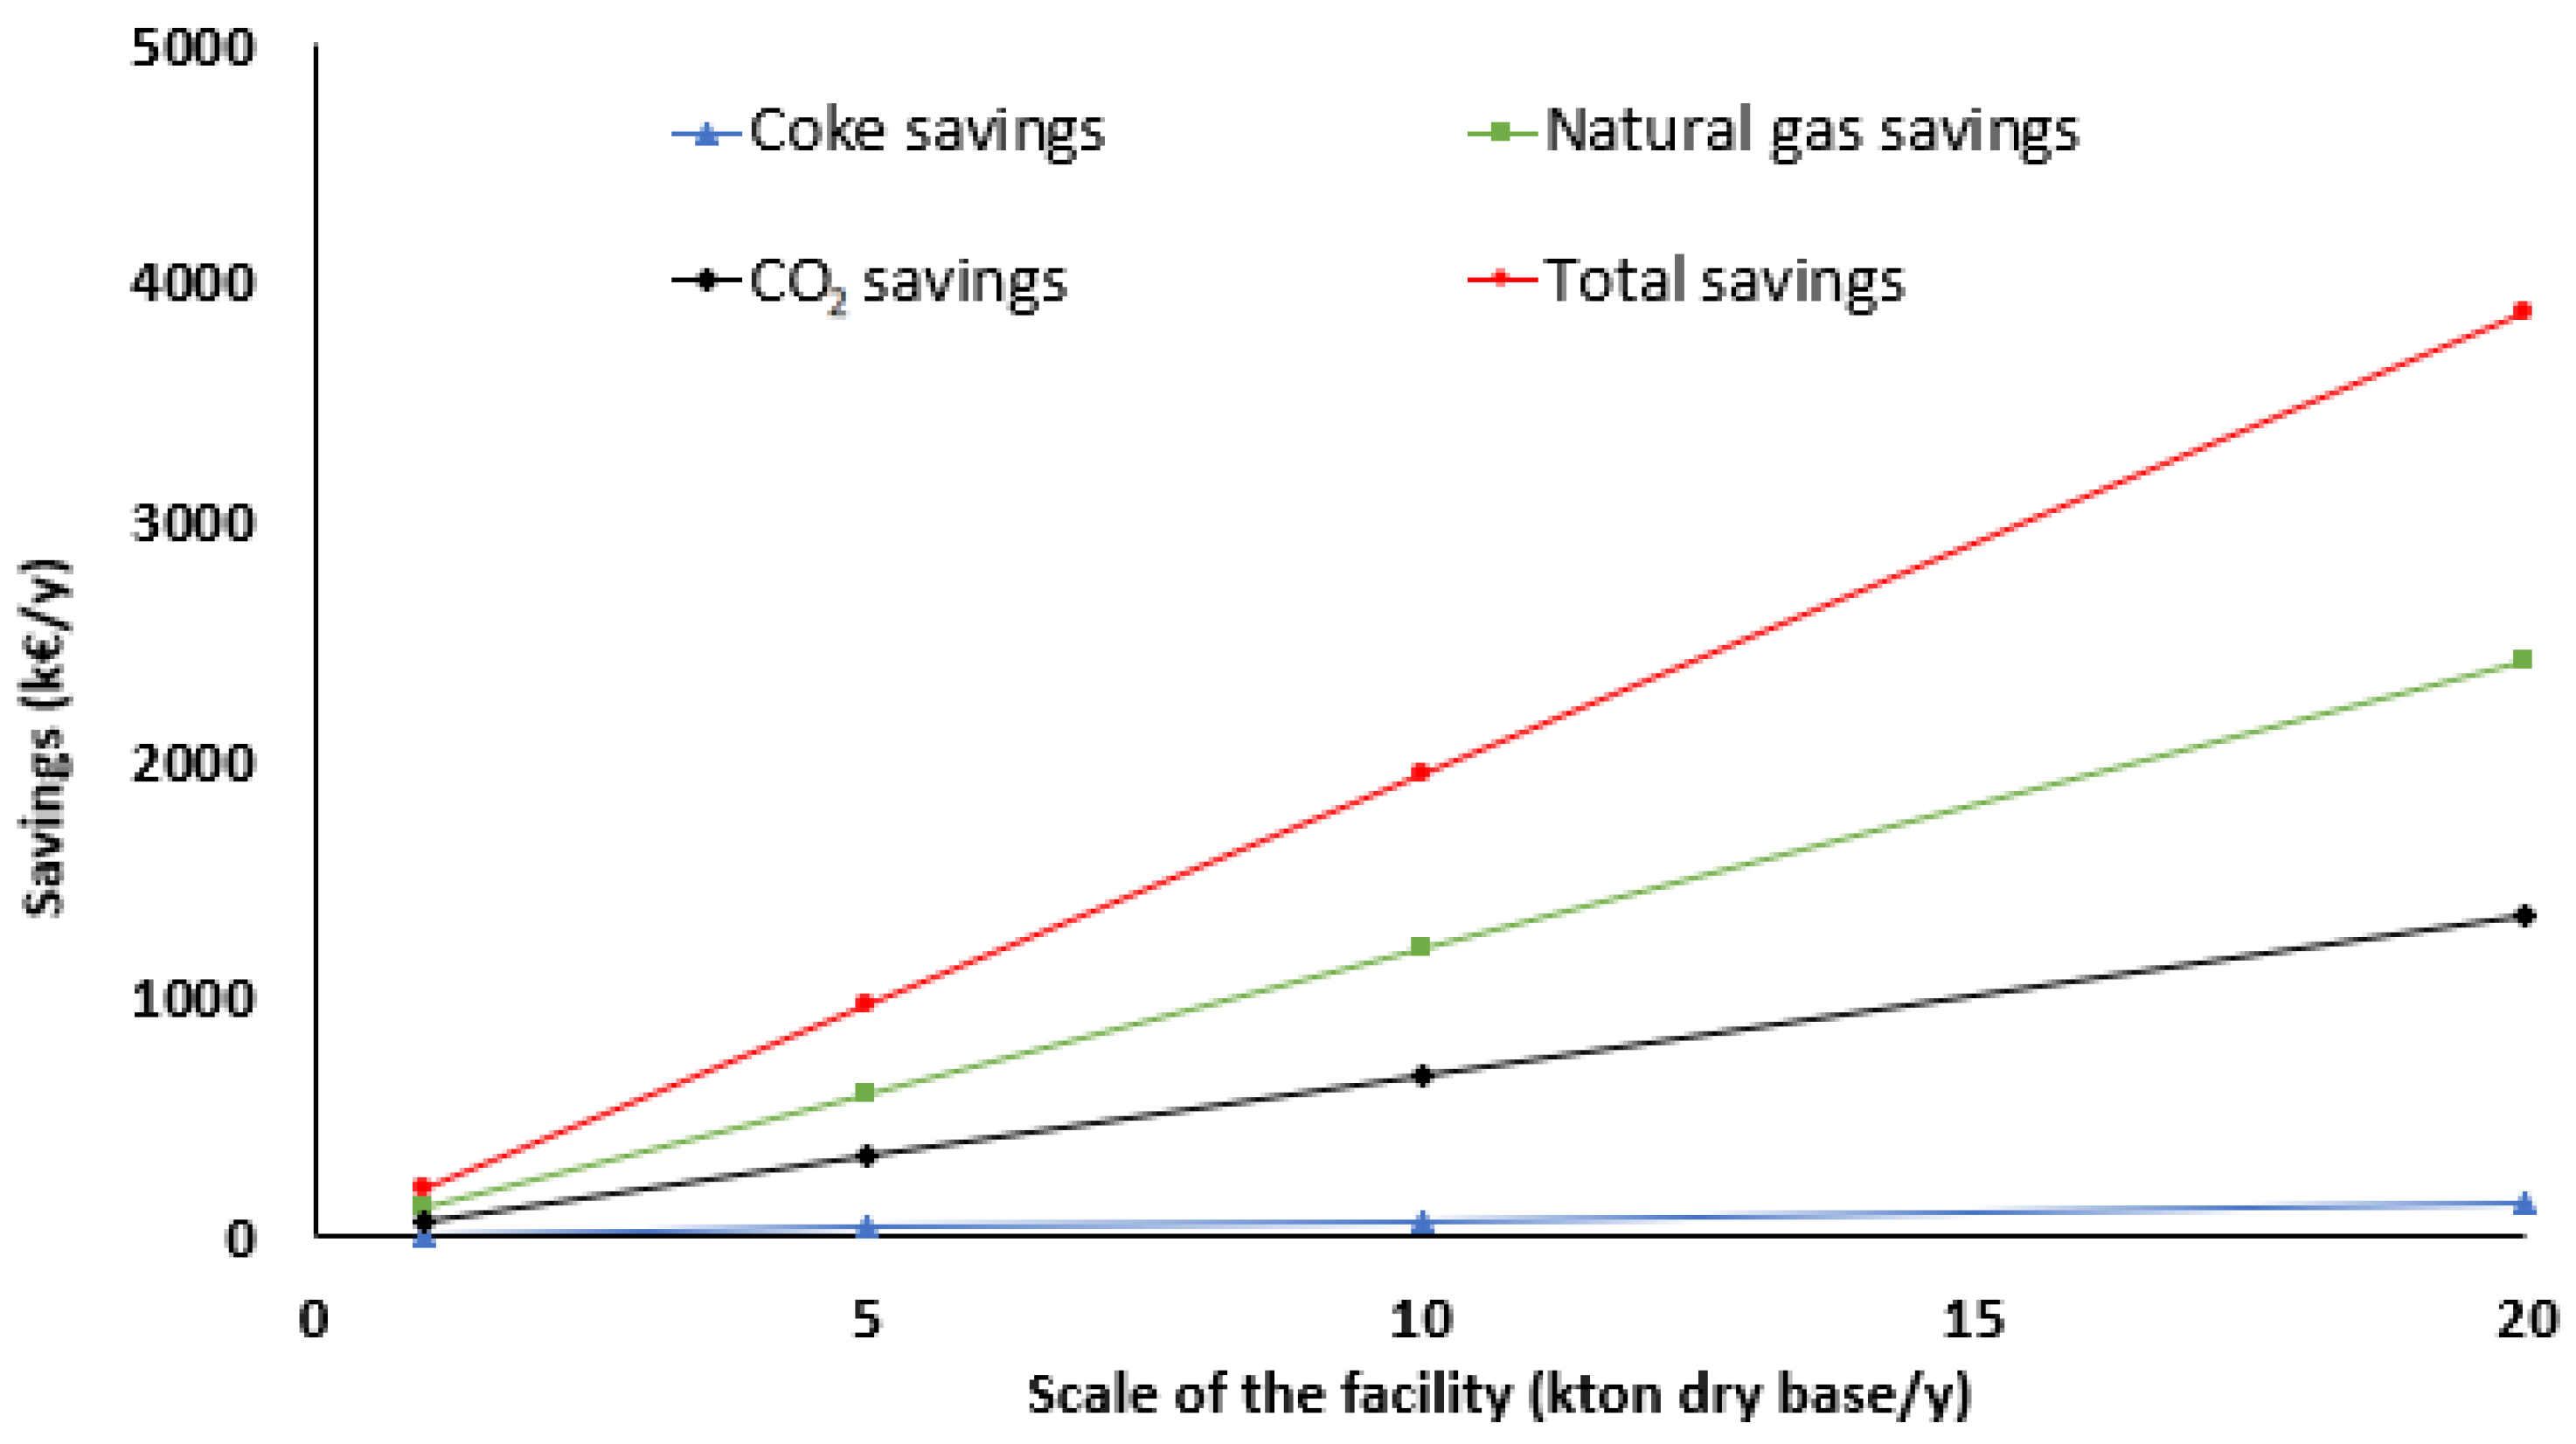
Economic savings were calculated according to the previous considerations (see
Table 1 and
Figure 4). The avoidance of natural gas and coke purchases and the savings related to the CO
2 emission taxes are included. As depicted in
Figure 4, the CO
2 emission credits have the highest impact on economic savings because of the remarkable increasing trend in CO
2 credits in previous years, mainly due to the decarbonisation policies.
Figure 4 depicts the influence of the different parameters on the savings promoted by the gasification facility. The impact of natural gas price is unquestionably significant, exerting more than twice the influence compared to the cost of CO
2 carbon credits.
A comparable situation is found with the natural gas cost, whose price has not stopped increasing in recent years and is not expected to fall soon (
Table 3). The interest rate has been considered as 5%; the facilities’ OPEX has been estimated as 12% of the capital expenditure (CAPEX), as observed in the literature [
26,
46]. Increasing the scale of the facility also increases its feasibility. While the payback time for case scenario 1 is more than ten years, the increase in the scale diminishes this time, up to more than two years in case scenario 4. An increase in the natural gas, coke, or CO
2 credits prices would have a massive impact on its economic feasibility, making it even more profitable. This analysis will be discussed in the following section.
Table 3 shows that the facilities of case scenarios 1 and 2 share the same payback period of around ten years. Although cash flow and initial investment are much higher for the second case (600 kEUR vs. 2500 kEUR), annual savings are also much higher according to this analysis. This fact is even more apparent in case scenarios 3 and 4, where initial investments are higher than in prior cases. However, case scenario 4 shows some economic parameters that do not seem realistic in such extensive facilities. The investment costs have been estimated thanks to a model that shows an exponential trend. Thus, a slight increase in the investment cost compared to the increase in the facility scale is obtained, influencing the NPV and payback period. Case scenario 3 can be considered more realistic and optimistic. In case scenarios 3 and 4, payback time is much shorter, as the savings on a year-by-year basis significantly reduce these periods. The cumulated cash will double in the first 20 years in case scenario 1. In case scenarios 2 and 3, from year 15 onwards, the cumulative cash flow might not increase significantly due to the increase in operational expenses and inflation rate. In case scenario 4, the cumulative cash flow follows a linear and increasing trend, thus presenting an excellent benefit margin in the first 20 years.
Compared to other analyses performed in the literature, it can be seen that payback periods are in the same margin as those obtained in the present work (
Table 4). The only exception is case scenario 4, in which the payback of almost 12 years found in the literature is much higher than the one obtained in this analysis [
47]. This situation might be explained due to a much higher total installed cost of 12.9 million dollars observed in the referenced work [
47], which can significantly impact the yearly cash flows and thus the payback period. In the other cases, it must be drawn to the reader’s attention that the NPVs are higher in most cases. However, payback time and IRR are similar, thus validating the main outputs of this work: a gasification facility focused on syngas and biochar co-production is economically feasible if CO
2 credits associated savings are considered, especially on intermediate scales (Case Scenarios 2 and 3).
3.2. Sensitivity Analysis
This section will explore the influence of varying certain parameters that are relevant to the technoeconomic analysis. Thus, the variations in NPV, IRR, and payback time are evaluated under these new circumstances, which have been identified as possible future scenarios and will help to determine the projects’ feasibility in these situations. The effects of the energy content in gas, the price of CO
2 emissions, and the cost of natural gas are evaluated. All the results are gathered in
Table 5.
3.2.1. Energy Content in Generated Syngas
The energy content of the generated syngas dramatically influenced the economic parameters and feasibility of the gasification plant (
Table 5). Increasing the energy content by 1.5 MJ/Nm
3 will increase the NPV of the facility by 363%, whereas the energetic increase is 133%. In this respect, the value of the facility will vastly increase. Several alternatives for this solution can be proposed. Optimizing the operational parameters and adequate biomass selection can impact the energetic content of the generated syngas and its economic feasibility. With this energetic content, the IRR will double, from 11 to 22%, and the payback time will reduce almost to half—from 7.0 years to 4.3 years.
It can be observed that an increment in the energetic content of the generated syngas will cause a proportional increase in the net present value of the facility. This issue can be explained by the fact that increasing the quality of the generated gas will directly impact the amount of natural gas that can be substituted, thus increasing the induced savings and the viability of the installation. A 133% gain in the energetic content of the gas (from 4.5 to 6 MJ/Nm3) will boost the NPV of the facility by 363%, thus being the most influencing parameter studied in this sensitivity analysis.
3.2.2. CO2 Emissions Credits
Table 5 shows the influence of CO
2 emissions on the plant’s economic viability. The base case is framed on the actual CO
2 emissions costs: 83.63 EUR/t, based on the mean cost of CO
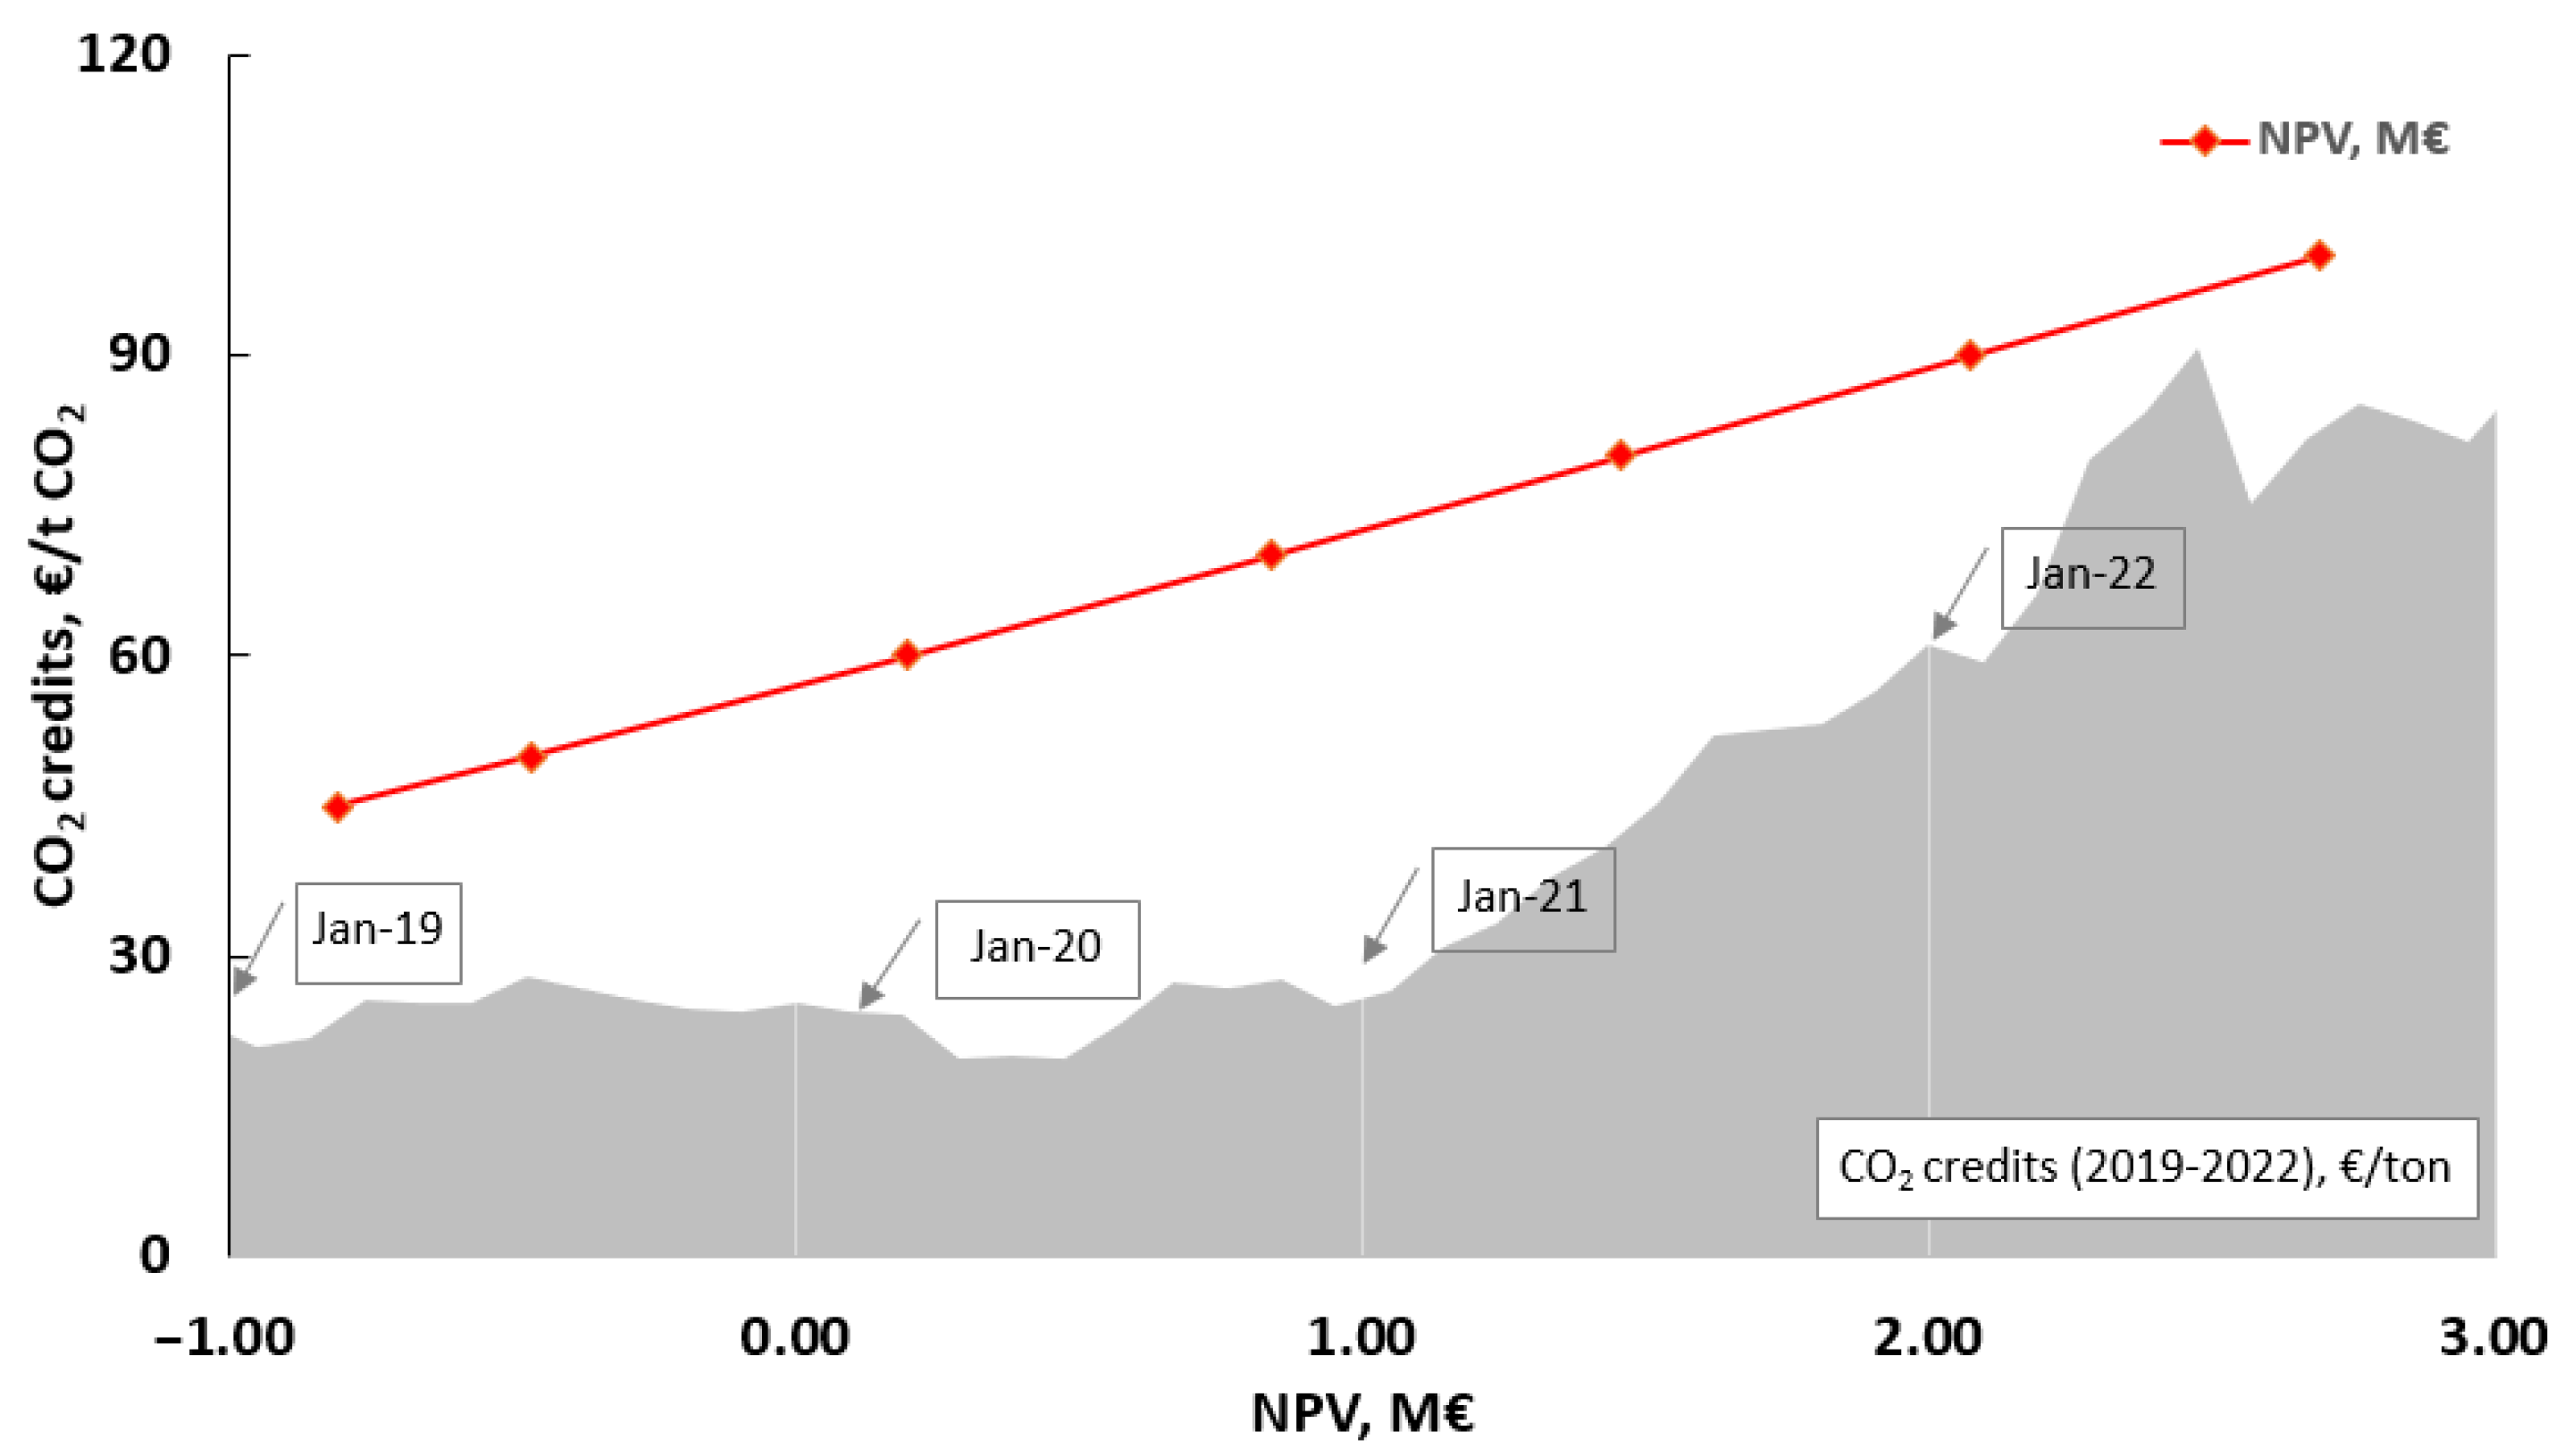
2 throughout 2022 (from January to August). Only one lower price has been proposed, as these prices are expected to increase in the following years. The current trend that is following is presented in
Figure 5 for case scenario 3. This figure also shows the evolution of the NPV concerning CO
2 credit costs. It can be observed that there is a linear influence of these costs starting at 45 EUR/t CO
2. A baseline NPV (NPV = 0 EUR) would be achieved for an associated 48.51 EUR/t CO
2. From that cost onwards, the NPV would only increase, which is very favourable, as these prices are not expected to lower any time soon.
As
Table 5 shows, increasing the CO
2 credits to 100 EUR/t will increase NPV by 163% while reducing the payback period by almost one year. IRR will also increase from 11 to 14%. In the case where CO
2 emission costs will reduce to a price of 80 EUR/t, the feasibility of the project will diminish, but it will not have such an effect as an increase. However, it is not expected to occur in the following years. In the current scenario (i.e., 83.68 EUR/t CO
2) the NPV of the facility is ca. 1,679,522 EUR. Increasing the price for emitting one ton of CO
2 would also increase this parameter linearly, reaching a final value of 2,687,955.01 EUR when the CO
2 credits cost 100 EUR/t. This 119% rise in CO
2 costs reflects an NPV increase of 160%. This cost seems reasonable, as the higher price reached 90 EUR/t in February 2022 and is expected to keep increasing in the following months due to international decarbonisation policies.
3.2.3. Natural Gas Cost
Table 5 represents the influence of the purchase price of natural gas. The base case scenario considers the average value for natural gas in the previous years from 2019–2022.
Figure 2 shows the trend followed by this price in recent years, observing an increasing trend. Two superior costs and one lower cost have been proposed. It has a more significant influence than CO
2 credits on the feasibility of the facility but a more negligible influence than the calorific value of the generated syngas. As shown, when increasing the price to 55 EUR/MWh, the savings produced by the gasification plant will reach an NPV of more than 5.5 MEUR, with a 21% IRR and a payback time of just 4.5 years. The influence of natural gas cost is evident. Increasing its price from the base case scenario from 38.55 EUR/MWh to 55 EUR/MWh (meaning a 142% increment) will increase the NPV of the facility from 1679.52 kEUR to 5615.12 kEUR (a 334% increment). This increment indicates that the natural gas cost is a very influencing parameter, although less influencing than the energetic content of the generated syngas. The most pessimistic situation shows an NPV of almost 450,000 EUR, with an IRR of 7% and a payback time more than 8.5 years, which is 1.5 years more than the current scenario. These results shed some light on the gasification technology profitability, as there is no case in which negative values have been obtained. Moreover, the payback period is comparable to those found in literature and presented in
Section 3.2, which is expected to improve in the following years.
4. Conclusions
This research explored the economic feasibility of gasification technology focusing on the co-production of syngas and biochar. A techno-economic model was developed to evaluate the cost-effectiveness of gasification projects with varying processing capacities (ranging from 1000 to 20,000 t/y).
A thorough bibliographic review allowed establishing a clear baseline in terms of investment cost, and a normalized function of these costs related to the energy produced was calculated for economic analysis. The inputs from four different case scenarios, each representing different biomass volumes for syngas and biochar co-production, shaped the techno-economic analysis. Not only have the project revenues been defined as the avoided costs related to the natural gas and coke substitution but also the taxes related to CO2 credits.
The results showed that the facility with the highest processing capacity (case scenario 4) appeared to be the most profitable. However, upon further examination, it was determined that this scenario’s investment cost lacked a realistic approach, making it an unrealistic option. A more reasonable and favourable scenario was found in case scenario 3, which required a lower capital expenditure (CAPEX). This scenario outperformed the literature’s findings in terms of payback periods, IRRs, and NPVs, making it the most viable choice. So, the gasification of 10,000 t/y of biomass seems to be the most profitable option, under the studied ones.
The comparison of results with relevant studies highlighted the limitation in the CAPEX estimation model, particularly evident in case scenario 4. However, case scenario 3 demonstrated that the co-production of syngas and biochar can be a realistic and feasible solution from both technical and economic perspectives.
Additionally, a sensitivity analysis was conducted to assess the impact of three parameters: the energetic content of the generated syngas, the costs of CO2 credits, and natural gas. The energetic content of the produced syngas positively influenced the project feasibility. In the meantime, increasing CO2 credit costs and natural gas prices further enhanced the viability of the co-production process. However, the most influencing parameters was shown to be the energetic content of the produced syngas, as the results show.
In summary, this research indicates that gasification technology for the co-production of syngas and biochar can be a viable and economically feasible solution, especially when processing 10,000 t/year of biomass, which corresponds to a facility of around 7.5 MW (case scenario 3). This scenario offers a favourable balance between investment costs and financial returns. The findings of this study shed light on the potential of this technology and provide valuable insights for decision-makers in the energy and waste management sectors.
Author Contributions
Conceptualization, J.G., C.J.-C. and I.B.; methodology J.G., C.J.-C. and I.B., investigation: J.G., S.S. and A.F.-C.; formal analysis, J.G., C.J.-C. and A.A.C.-M.; data curation, J.G., C.J.-C. and A.A.C.-M.; writing—original draft preparation: J.G., C.J.-C. and I.B.; writing—review: C.J.-C., A.A.C.-M. and I.B.; supervision, C.J.-C., A.A.C.-M. and I.B. All authors have read and agreed to the published version of the manuscript.
Funding
This work was supported by the RED CERVERA H24NEWAGE (CER-20211002) ‘Desarrollo de tecnologías avanzadas de producción, almacenamiento y distribución de hidrógeno, y su transferencia industrial para la nueva era del hidrógeno en España’ Project that has received funding from the Centro para el Desarrollo Tecnológico e Industrial (CDTI) from the Spanish Ministry of Science and Innovation. This work was also supported by the Coralis project, European Union’s Horizon 2020 Research and Innovation Programme under Grant Agreement No. 958337.
Data Availability Statement
The data presented in this study are available on request from the corresponding author. The data are not publicly available due to internal data management policies.
Acknowledgments
The authors would like to thank the RED CERVERA H24NEWAGE (CER-20211002) ‘Desarrollo de tecnologías avanzadas de producción, almacenamiento y distribución de hidrógeno, y su transferencia industrial para la nueva era del hidrógeno en España’ that has received funding from the Centro para el Desarrollo Tecnológico e Industrial (CDTI) from the Spanish Ministry of Science and Innovation. The authors would also like to thank the Coralis project, European Union’s Horizon 2020 Research and Innovation Programme under Grant Agreement No. 958337.
Conflicts of Interest
The authors declare no conflict of interest.
References
- Somers, J. Technologies to Decarbonise the EU Steel Industry; EU Publications: Luxembourg, 2022. [Google Scholar] [CrossRef]
- International Energy Agency, Iron and Steel Technology Roadmap towards More Sustainable Steelmaking, Part of the Energy Technology Perspectives Series. 2020. Available online: https://www.iea.org/reports/iron-and-steel-technology-roadmap (accessed on 1 May 2022).
- Feng, C.; Zhu, R.; Wei, G.; Dong, K.; Dong, J. Typical Case of Carbon Capture and Utilization in Chinese Iron and Steel Enterprises: CO2 Emission Analysis. J. Clean. Prod. 2022, 363, 132528. [Google Scholar] [CrossRef]
- Chen, D.; Li, J.; Wang, Z.; Lu, B.; Chen, G. Hierarchical Model to Find the Path Reducing CO2 Emissions of Integrated Iron and Steel Production. Energy 2022, 258, 124887. [Google Scholar] [CrossRef]
- Li, Z.; Hanaoka, T. Plant-Level Mitigation Strategies Could Enable Carbon Neutrality by 2060 and Reduce Non-CO2 Emissions in China’s Iron and Steel Sector. One Earth 2022, 5, 932–943. [Google Scholar] [CrossRef]
- Gerres, T.; Lehne, J.; Mete, G.; Schenk, S.; Swalec, C. Green Steel Production: How G7 Countries Can Help Change the Global Landscape. Leadersh. Group Ind. Transit. 2021, 8, 25. Available online: https://www.industrytransition.org/insights/g7-green-steel-production/ (accessed on 1 May 2022).
- Cousins, A.; Paterson, N.; Dugwell, D.R.; Kandiyoti, R. An Investigation of the Reactivity of Chars Formed in Fluidized Bed Gasifiers: The Effect of Reaction Conditions and Particle Size on Coal Char Reactivity. Energy Fuels 2006, 20, 2489–2497. [Google Scholar] [CrossRef]
- Díaz-Yáñez, O.; Mola-Yudego, B.; Anttila, P.; Röser, D.; Asikainen, A. Forest Chips for Energy in Europe: Current Procurement Methods and Potentials. Renew. Sustain. Energy Rev. 2013, 21, 562–571. [Google Scholar] [CrossRef]
- Molino, A.; Chianese, S.; Musmarra, D. Biomass Gasification Technology: The State of the Art Overview. J. Energy Chem. 2016, 25, 10–25. [Google Scholar] [CrossRef]
- Safarian, S. To What Extent Could Biochar Replace Coal and Coke in Steel Industries? Fuel 2023, 339, 127401. [Google Scholar] [CrossRef]
- Kong, G.; Wang, K.; Zhang, X.; Li, J.; Han, L.; Zhang, X. Torrefaction/Carbonization-Enhanced Gasification-Steam Reforming of Biomass for Promoting Hydrogen-Enriched Syngas Production and Tar Elimination over Gasification Biochars. Bioresour. Technol. 2022, 363, 127960. [Google Scholar] [CrossRef]
- Barco-Burgos, J.; Carles-Bruno, J.; Eicker, U.; Saldana-Robles, A.L.; Alcántar-Camarena, V. Hydrogen-Rich Syngas Production from Palm Kernel Shells (PKS) Biomass on a Downdraft Allothermal Gasifier Using Steam as a Gasifying Agent. Energy Convers. Manag. 2021, 245, 114592. [Google Scholar] [CrossRef]
- Quiroga, E.; Cifuentes, B.; Moltó, J.; Ortuño, N.; Conesa, J.; Davó-Quiñonero, A.; Cobo, M. Integration of Steam Gasification and Catalytic Reforming of Lignocellulosic Biomass as a Strategy to Improve Syngas Quality and Pollutants Removal. Waste Manag. 2022, 147, 48–59. [Google Scholar] [CrossRef] [PubMed]
- Monir, M.U.; Abd Aziz, A.; Kristanti, R.A.; Yousuf, A. Gasification of Lignocellulosic Biomass to Produce Syngas in a 50 kW Downdraft Reactor. Biomass Bioenergy 2018, 119, 335–345. [Google Scholar] [CrossRef]
- Čespiva, J.; Niedzwiecki, L.; Wnukowski, M.; Krochmalny, K.; Mularski, J.; Ochodek, T.; Pawlak-Kruczek, H. Torrefaction and Gasification of Biomass for Polygeneration: Production of Biochar and Producer Gas at Low Load Conditions. Energy Rep. 2022, 8, 134–144. [Google Scholar] [CrossRef]
- Shackley, S.; Carter, S.; Knowles, T.; Middelink, E.; Haefele, S.; Sohi, S.; Cross, A.; Haszeldine, S. Sustainable Gasification–Biochar Systems? A Case-Study of Rice-Husk Gasification in Cambodia, Part I: Context, Chemical Properties, Environmental and Health and Safety Issues. Energy Policy 2012, 42, 49–58. [Google Scholar] [CrossRef]
- Hernández, J.J.; Lapuerta, M.; Monedero, E. Characterisation of Residual Char from Biomass Gasification: Effect of the Gasifier Operating Conditions. J. Clean. Prod. 2016, 138, 83–93. [Google Scholar] [CrossRef]
- Proto, A.R.; Longo, L.; Gambella, F.; Zimbalatti, G.; Macrì, G.; Gallucci, F.; Caruso, L.; Salerno, M.; Colantoni, A. Energetic Characteristics of Syngas Obtained from Gasification of Hazelnut Prunings. Procedia Soc. Behav. Sci. 2016, 223, 835–840. [Google Scholar] [CrossRef]
- Ramos, A.; Rouboa, A. Syngas Production Strategies from Biomass Gasification: Numerical Studies for Operational Conditions and Quality Indexes. Renew. Energy 2020, 155, 1211–1221. [Google Scholar] [CrossRef]
- Ren, J.; Liu, Y.-L. Progress and Prospects of Produced Gas Utilization from Biomass Tar Reforming. J. Hazard. Mater. Lett. 2020, 1, 100008. [Google Scholar] [CrossRef]
- European CO2 Trading System. Available online: https://www.sendeco2.com/es/ (accessed on 20 October 2022).
- Statistical Office of the European Commission (Eurostat) Import Price Index, Coke and Refined Petroleum Products; Eurostat; Neither Seasonally nor Working Day Adjusted. Available online: https://ec.europa.eu/eurostat/databrowser/view/sts_inpi_q/default/table?lang=en (accessed on 20 October 2022).
- Basu, P. Biomass Gasification, Pyrolysis and Torrefaction; Elsevier: Amsterdam, The Netherlands, 2013; ISBN 9780123964885. [Google Scholar]
- Parajuli, P.B.; Deng, Y.; Kim, H.; Yu, F. Cost Analysis Model for Syngas Production Cost Evaluation Using the Graphical User Interface. Energy Power 2014, 4, 35–40. [Google Scholar]
- Colantoni, A.; Villarini, M.; Monarca, D.; Carlini, M.; Mosconi, E.M.; Bocci, E.; Rajabi Hamedani, S. Economic Analysis and Risk Assessment of Biomass Gasification CHP Systems of Different Sizes through Monte Carlo Simulation. Energy Rep. 2021, 7, 1954–1961. [Google Scholar] [CrossRef]
- Bolhjar-Nordenkampf, M.; Hofbauer, H.; Rauch, R.; Tremeeld, H. Biomass CHP Plant Güssing—Using Gasification for Power Generation. In Proceedings of the 2nd Regional Conference on Energy Technology towards a Clean Envionnment, Pukhet, Thailand, 12–14 February 2003. [Google Scholar]
- Aguado, R.; Vera, D.; López-García, D.A.; Torreglosa, J.P.; Jurado, F. Techno-Economic Assessment of a Gasification Plant for Distributed Cogeneration in the Agrifood Sector. Appl. Sci. 2021, 11, 660. [Google Scholar] [CrossRef]
- Susanto, H.; Suria, T.; Pranolo, S.H. Economic Analysis of Biomass Gasification for Generating Electricity in Rural Areas in Indonesia. IOP Conf. Ser. Mater. Sci. Eng. 2018, 334, 012012. [Google Scholar] [CrossRef]
- Powermax Biomass Gasification. Available online: https://www.alibaba.com/product-detail/Biomass-Gasification-Plant-15MW-Biomass-Gasification_60830758533.html?spm=a2700.7724857.0.0.15934e934MyT8z (accessed on 10 September 2022).
- Alamia, A.; Larsson, A.; Breitholtz, C.; Thunman, H. Performance of Large-Scale Biomass Gasifiers in a Biorefinery, a State-of-the-Art Reference. Int. J. Energy Res. 2017, 41, 2001–2019. [Google Scholar] [CrossRef]
- Singlitico, A.; Kilgallon, I.; Goggins, J.; Monaghan, R.F.D. GIS-Based Optimization Model for the Smart Design of a Nationwide Bio-SNG Production System for Ireland. In Proceedings of the 25th European Biomass Conference and Exhibition, Stockholm, Sweden, 12–15 June 2017. [Google Scholar]
- Campbell, R.M.; Anderson, N.M.; Daugaard, D.E.; Naughton, H.T. Financial Viability of Biofuel and Biochar Production from Forest Biomass in the Face of Market Price Volatility and Uncertainty. Appl. Energy 2018, 230, 330–343. [Google Scholar] [CrossRef]
- Kim, M.; Lee, Y.; Park, J.; Ryu, C.; Ohm, T.-I. Partial Oxidation of Sewage Sludge Briquettes in a Updraft Fixed Bed. Waste Manag. 2016, 49, 204–211. [Google Scholar] [CrossRef] [PubMed]
- Xiao, G.; Ni, M.-J.; Chi, Y.; Cen, K.-F. Low-Temperature Gasification of Waste Tire in a Fluidized Bed. Energy Convers. Manag. 2008, 49, 2078–2082. [Google Scholar] [CrossRef]
- Barisano, D.; Freda, C.; Nanna, F.; Fanelli, E.; Villone, A. Biomass Gasification and In-Bed Contaminants Removal: Performance of Iron Enriched Olivine and Bauxite in a Process of Steam/O2 Gasification. Bioresour. Technol. 2012, 118, 187–194. [Google Scholar] [CrossRef]
- Khanna, R.; Li, K.; Wang, Z.; Sun, M.; Zhang, J.; Mukherjee, P.S. Biochars in Iron and Steel Industries. In Char and Carbon Materials Derived from Biomass; Elsevier: Amsterdam, The Netherlands, 2019; pp. 429–446. [Google Scholar]
- Zimek, M.; Asada, R.; Baumgartner, R.J.; Brenner-Fliesser, M.; Kaltenegger, I.; Hadler, M. Sustainability Trade-Offs in the Steel Industry—A MRIO-Based Social Impact Assessment of Bio-Economy Innovations in a Belgian Steel Mill. Clean. Prod. Lett. 2022, 3, 100011. [Google Scholar] [CrossRef]
- Brassard, P.; Godbout, S.; Lévesque, V.; Palacios, J.H.; Raghavan, V.; Ahmed, A.; Hogue, R.; Jeanne, T.; Verma, M. Biochar for Soil Amendment. In Char and Carbon Materials Derived from Biomass; Elsevier: Amsterdam, The Netherlands, 2019; pp. 109–146. [Google Scholar]
- Wang, F.; Harindintwali, J.D.; Yuan, Z.; Wang, M.; Wang, F.; Li, S.; Yin, Z.; Huang, L.; Fu, Y.; Li, L.; et al. Technologies and Perspectives for Achieving Carbon Neutrality. Innovation 2021, 2, 100180. [Google Scholar] [CrossRef]
- Shahbaz, M.; Al-Ansari, T.; Inayat, M.; Sulaiman, S.A.; Parthasarathy, P.; McKay, G. A Critical Review on the Influence of Process Parameters in Catalytic Co-Gasification: Current Performance and Challenges for a Future Prospectus. Renew. Sustain. Energy Rev. 2020, 134, 110382. [Google Scholar] [CrossRef]
- Inayat, M.; Sulaiman, S.A.; Kurnia, J.C.; Naz, M.Y. Catalytic and Noncatalytic Gasification of Wood–Coconut Shell Blend under Different Operating Conditions. Environ. Prog. Sustain. Energy 2019, 38, 688–698. [Google Scholar] [CrossRef]
- Sultanguzin, I.A.; Fedyukhin, A.V.; Kurzanov, S.Y.; Gyulmaliev, A.M.; Stepanova, T.A.; Tumanovsky, V.A.; Titov, D.P. Prospects for the Development of Independent Power Supply Systems on the Basis of Solid Fuel Thermal Conversion Technology. Therm. 2015, 62, 359–364. [Google Scholar] [CrossRef]
- Wei, L.; Thomasson, J.A.; Bricka, R.M.; Sui, R.; Wooten, J.R.; Columbus, E.P. Syn-Gas Quality Evaluation for Biomass Gasification with a Downdraft Gasifier. Trans. ASABE 2009, 52, 21–37. [Google Scholar] [CrossRef]
- Allesina, G.; Pedrazzi, S.; Sgarbi, F.; Pompeo, E.; Roberti, C.; Cristiano, V.; Tartarini, P. Approaching Sustainable Development through Energy Management, the Case of Fongo Tongo, Cameroon. Int. J. Energy Environ. Eng. 2015, 6, 121–127. [Google Scholar] [CrossRef]
- Mustafa, A.; Calay, R.K.; Mustafa, M.Y. A Techno-Economic Study of a Biomass Gasification Plant for the Production of Transport Biofuel for Small Communities. Energy Procedia 2017, 112, 529–536. [Google Scholar] [CrossRef]
- Hermann, H.; Reinhard, R.; Klaus, B.; Reinhard, K.; Christian, A. Biomass CHP Plant Güssing—A Success Story. In Proceedings of the Expert Meeting on Pyrolysis and Gasification of Biomass and Waste, Strasbourg, France, 30 September–1 October 2002. [Google Scholar]
- Do, T.X.; Lim, Y.; Yeo, H.; Lee, U.; Choi, Y.; Song, J. Techno-Economic Analysis of Power Plant via Circulating Fluidized-Bed Gasification from Woodchips. Energy 2014, 70, 547–560. [Google Scholar] [CrossRef]
- Sousa Cardoso, J.; Silva, V.; Eusébio, D.; Lima Azevedo, I.; Tarelho, L.A.C. Techno-Economic Analysis of Forest Biomass Blends Gasification for Small-Scale Power Production Facilities in the Azores. Fuel 2020, 279, 118552. [Google Scholar] [CrossRef]
- Rentizelas, A.; Karellas, S.; Kakaras, E.; Tatsiopoulos, I. Comparative Techno-Economic Analysis of ORC and Gasification for Bioenergy Applications. Energy Convers. Manag. 2009, 50, 674–681. [Google Scholar] [CrossRef]
- Porcu, A.; Sollai, S.; Marotto, D.; Mureddu, M.; Ferrara, F.; Pettinau, A. Techno-Economic Analysis of a Small-Scale Biomass-to-Energy BFB Gasification-Based System. Energies 2019, 12, 494. [Google Scholar] [CrossRef]
| Disclaimer/Publisher’s Note: The statements, opinions and data contained in all publications are solely those of the individual author(s) and contributor(s) and not of MDPI and/or the editor(s). MDPI and/or the editor(s) disclaim responsibility for any injury to people or property resulting from any ideas, methods, instructions or products referred to in the content. |
© 2023 by the authors. Licensee MDPI, Basel, Switzerland. This article is an open access article distributed under the terms and conditions of the Creative Commons Attribution (CC BY) license (https://creativecommons.org/licenses/by/4.0/).


 ,
, 


