Article

Optimal Voltage Control Method for a Step Voltage Regulator Considering the Under-Load Tap Changer in a Distribution System Interconnected with a Renewable Energy Source

1
Department of Electrical Engineering, Korea Polytechnics, 85, Haseo-ro, Buk-gu 61099, Gyeonggi, Republic of Korea
2
Electric Power System Research Team, Korea Institute of Energy Research (KIER), 200 Haemajihaean-ro, Gujwa-eup, Jeju 63357, Jeju Specific Self-Governing Province, Republic of Korea
3
Department of Energy Innovative Industry R&D, Green Energy Institute, 370, Green-ro, Naju 58324, Jeollanam-do, Republic of Korea
*
Authors to whom correspondence should be addressed.
Energies 2023, 16(16), 6039; https://doi.org/10.3390/en16166039
Submission received: 26 June 2023 / Revised: 7 August 2023 / Accepted: 14 August 2023 / Published: 17 August 2023
(This article belongs to the Section A1: Smart Grids and Microgrids)

Abstract

:
The voltage in distribution systems is controlled by the under-load tap changer of the substation and the pole transformer of the primary feeders. Recently, as one of the main countermeasures, a step voltage regulator is being introduced to solve voltage problems such as overvoltage phenomena in a distribution feeder interconnected with a renewable energy source and under voltage in a long-distance feeder. However, the tap of the step voltage regulator may be frequently operated due to its interdependent relationship with the under-load tap changer in the distribution system. Furthermore, given the existing operating characteristics of the step voltage regulator, it is difficult to perfectly maintain the customer voltage within an allowable limit using existing methods such as the line drop compensation method for a step voltage regulator. In addition, the existing line drop compensation method, considering the distributed generators, may be not able to control the proper voltage within an allowable limit. Therefore, in order to solve such voltage problems, this paper proposes a voltage control method for a step voltage regulator by considering the output voltage of an under-load tap changer that is operated via the line drop compensation method. In other words, to overcome the limitations of existing voltage control methods for step voltage regulators, this paper proposes an optimal control method to determine the optimal compensation rate for a step voltage regulator by considering the reverse power flow from a renewable energy source and the output voltage of the under-load tap changer of the main transformer.

1. Introduction

1.1. Background and Motivation

Recently, the expansion of renewable energy sources (RESs) has been required according to carbon neutrality as a worldwide trend. Under these circumstances, through the decentralization of the power system, renewable energy resources have been actively installed in the distribution system. However, many power quality problems due to the introduction of RESs may have occurred, such as voltage variations, flicker and harmonic in variety. Especially, the issue of voltage variations due to RESs is being reported as one of the concerns under the high penetration of renewable distributed generations. To solve such problems, many solutions have been proposed in the recent literature. In general, existing reviews have dealt with methods to maintain the voltage within an allowable limit (220 ± 6%) in the distribution system. In the first instance, as listed in [1,2,3], several solutions have been proposed to deal with overvoltage phenomena in the presence of the introduction of photovoltaic (PV) systems into the distribution system. In addition, to solve these overvoltage phenomena, references [4,5] present a voltage control method using reactive power generation from PV inverters. Reference [6] deals with the voltage control on the low voltage (LV) side of the middle voltage (MV)/LV transformer via on-load tap changers (OLTC). Moreover, as listed in [7], this includes the active power de-rating of PV production in the case of overvoltage conditions. Recently, as one of the main countermeasures, a step voltage regulator (SVR) is being introduced to solve voltage problems such as overvoltage phenomena in the distribution feeder interconnected with an RES and under voltage in a long-distance feeder. However, by conventional operation characteristics of an SVR, it is difficult to perfectly maintain the customer voltage within an allowable limit using existing methods such as the LDC method of the SVR. Regarding the above contents, they are included as follows. The reference [8] proposes the contents to solve the feeder voltage problems using an LDC operating method that adjusts the sending voltage based on the increase and decrease in the load current when a photovoltaic (PV) system is interconnected with the primary feeder. Moreover, the reference [9] deals with the operation of an SVR according to the load conditions. Reference [10] presents the optimal installation of an SVR in the distribution system with a PV. On the other hands, modeling of the ULTC is proposed in reference [11]. However, it has problems in that the customer voltage could not be exactly maintained within the range of the rated voltage. Reference [12] deals with an issue of voltage regulation for power distribution systems interconnected with dispersed storage and generation systems. Additionally, as listed in [13], there are modern techniques to study the interactions between the SVR and RES in distribution systems. The method of cooperative control using an SVR and SVC has also been proposed to solve the voltage problem caused by distributed power [14]. From the reference [15], a method involving both the installation position and tap of the SVR is dealt with considering the reverse power flow. Reference [16] only considers as an SVR a tap-changing algorithm to solve the problem, considering the line load conditions and reverse power flow. As mentioned earlier, Table 1 shows difference between existing method and present method.
Therefore, in order to maintain the voltage in a stable manner when distributed power sources are interconnected at the end of the distribution feeders, this paper proposes a voltage control method for an SVR by considering the line drop compensation (LDC) method and output voltage of the ULTC, which is the control for the output voltage of the main transformer (MTR). In other words, to overcome the limitations of existing voltage control methods for an SVR, this paper presents a novel control method to determine the optimal compensation rate of the SVR by considering the reverse power flow from the RES and the output voltage of the ULTC via the LDC method. Furthermore, based on the presented method, this paper evaluates the effectiveness of the proposed method by comparing it with four control methods: (1) operation of the ULTC via the fixed sending voltage method, (2) operation via the relationship between the ULTC via the line drop compensation method and the SVR via the fixed sending voltage method, (3) operation via the relationship between the ULTC by means of line drop compensation method and the SVR by means of line drop compensation method, and (4) ULTC via the line drop compensation method and SVR via the proposed control method. From the simulation results, it is clear that the customer voltage can be kept under reasonable conditions.

1.2. Contribution

In order to maintain a reasonable voltage for as many customers as possible, this paper presents a voltage control method for the SVR by considering the voltage control characteristics (LDC method) of the ULTC, which is the control for the output voltage of the MTR. The proposed control method for the SVR makes it possible to solve the over- and under voltage when an RES is introduced into the distribution system until 7 MW per 10 MW feeder. The customer voltage could be exactly maintained within the nominal voltage boundary according to the operation of the SVR by considering the output voltage of the ULTC. It is clear that the customer voltage could be sustained under reasonable conditions. Therefore, the proposed algorithm can improve the power quality issue of the customer voltage in a distribution system with an RES.

2. Voltage Control Strategy for the SVR

2.1. Optimal Sending Voltage via the LDC Method

The voltage control method for the SVR can be classified as an LDC method, fixed sending voltage method and program method, where the LDC method adjusts the voltage by responding to the load current and the fixed sending voltage method transmits a certain voltage regardless of the load capacity. Moreover, the program method adjusts the voltage according to the programmed time. As shown in Figure 1 and referenced in [17], the LDC method, which is the most used one among the above-mentioned methods, adjusts the voltage according to the load variation in the feeder using the LDC setting values (load center voltage, equivalent impedance, bandwidth value, time delay value, etc.).
On the other hand, this paper adapts the LDC method for the SVR for coordination control between the ULTC and SVR. Specifically, the optimal sending voltage for the LDC operating method for the SVR can be expressed as shown in Equation (1).
V s e n d t = V c e + Z e q × I b t
where V s e n d t is the optimal sending voltage, V c e is the load center voltage, Z e q is the equivalent impedance, and I b t is the passing current of the SVR.
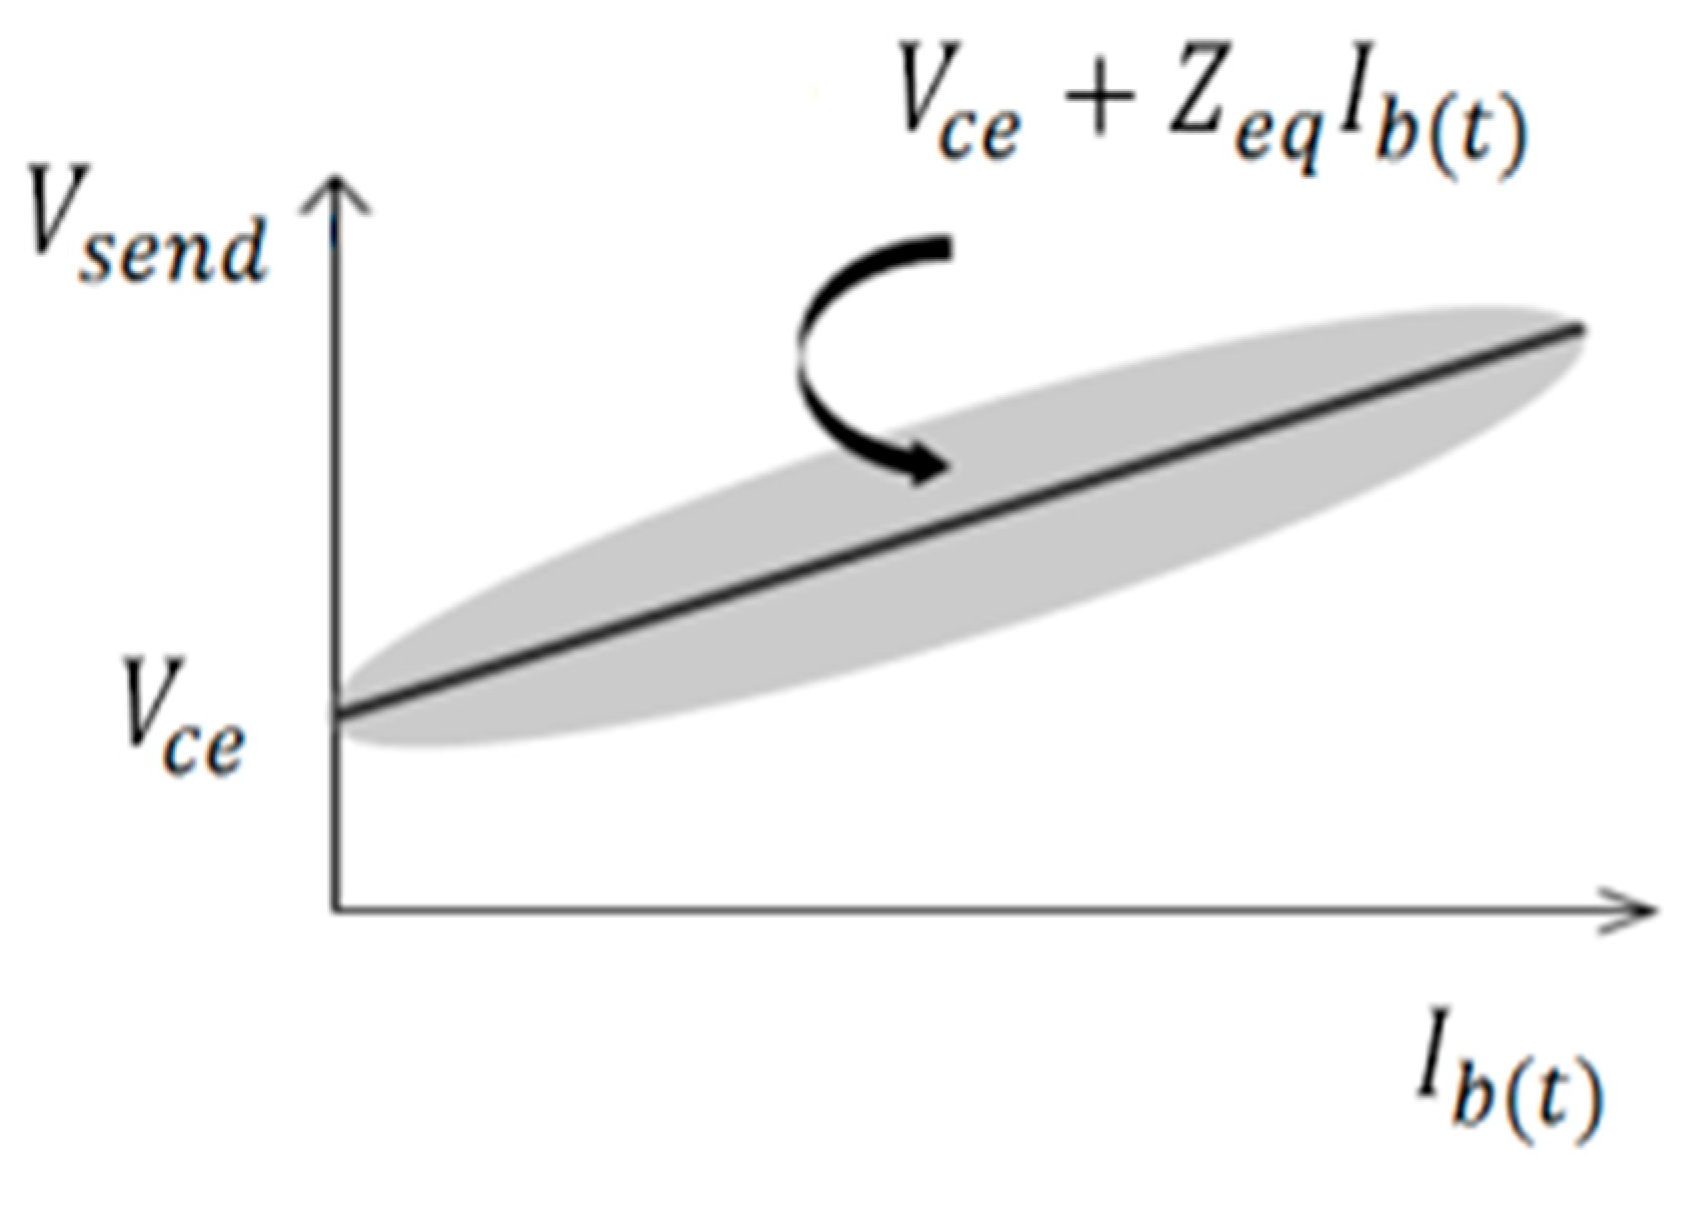
As the LDC setting value cannot be changed once it is determined, the relationship between the optimal sending voltage and through current of the SVR has non-linear distribution characteristics, as shown in Figure 2. Therefore, the setting values ( Z e q , V c e ) for the SVR can be formulated using the least squares method, which minimizes the error for entire time, as shown in Equation (2) [17].
M i n q = t = 1 n [ V s e n d t ( V c e + Z e q × I b t ) ] 2
where n is the entire time.
Equations (3) and (4) show the result of the partial differentiation of Equation (2) to calculate the LDC setting values ( Z e q , V c e ) [18].
Z e q = t = 1 n V s e n d t × t = 1 n I b t n t = 1 n ( V s e n d ( t ) × I b t ) t = 1 n I b t 2 n t = 1 n I b t 2
V c e = t = 1 n V s e n d t Z e q t = 1 n I b t n

2.2. Voltage Control Method for the SVR

The voltage control of the SVR is performed to maintain the proper voltage of the distribution system by adjusting the tap value of the SVR when the calculation result of the error between the reference voltage and optimal sending voltage deviates from the db (dead band). As shown in Figure 3, the existing voltage control method for the SVR performs voltage control to maintain the proper voltage of the distribution system by respectively adjusting the tap value when there occurs an error between the reference voltage and optimal sending voltage at each location of the SVR and ULTC.
From the information mentioned above, the voltage control method for the SVR can be described as follows.
First of all, in order to determine the tap position at each time slot, the optimal compensation rate ( V k ), which is the objective function used to determine the tap operating range by comparing the load center voltage and measured voltage ( V m ) of the SVR, can be calculated as shown in Equation (5).
V k t = V c e V m t
where V k (t) is the optimal compensation rate, V m t is the measured voltage, and V c e is the load center voltage.
To calculate the above-mentioned objective function, the measured voltage ( V m ) can be calculated as shown in Equation (6) using the line voltage ( V 2 , s v r ), through current ( I 2 , s v r ), and the equivalent impedance determined in Section 2.1.
V m t = V 2 , s v r t Z e q × I 2 , s v r t I 2 , s v r t = V 2 , s v r t V c t
where V c t is the compensation voltage, Z e q is the equivalent impedance, V 2 , s v r t is the line voltage of the secondary side of the SVR, and I 2 , s v r t is the load current passing through the SVR.
Through these concepts, the sending voltage of the SVR is controlled by changing the position of the SVR tap when the compensation rate ( V k ) at time t deviates from the range of the voltage db and the time delay ( t d ) is exceeded, as shown in Figure 4. In addition, the voltage control method for the SVR obtains the measured voltage V m by substituting the secondary feeder voltage ( V 2 , s v r ) of the SVR and the through current ( I 2 , s v r ) of the SVR, which are measured using the PT and CT installed on the secondary side of the SVR, as shown in Figure 4. Moreover, the SVR is operated after the delay time, once the tap position is determined by comparing the optimal compensation rate ( V k ), which is calculated by substituting V m in Equation (4), with the range of the db. Therefore, the voltage control sequence can be illustrated as shown below.
However, because the existing voltage control method is operated by only considering the distribution system for an arborescence structure that has the characteristic of one directional current, it can be difficult to control for voltage variations in the distribution system for a radial structure having the flow of a bidirectional current [17], where the distribution system for a radial structure means a system with an RES. Additionally, the customer voltage is controlled by the ULTC at the main transformer in advance, and then the SVR is operated by the voltage characteristic of a distribution feeder, respectively. From the mentioned earlier, the voltage control of the SVR is possible to be violated within the allowable limit at some sections of the distribution feeder installed in the SVR, because the SVR and ULTC are not operated according to coordination control. Therefore, in order to overcome the above problems, this paper presents a voltage control method for the SVR by considering the voltage control characteristics of the ULTC, which is the control for the output voltage of the MTR.

3. Voltage Control Strategy for the SVR Considering the ULTC

3.1. Voltage Control Method for the SVR Considering the ULTC

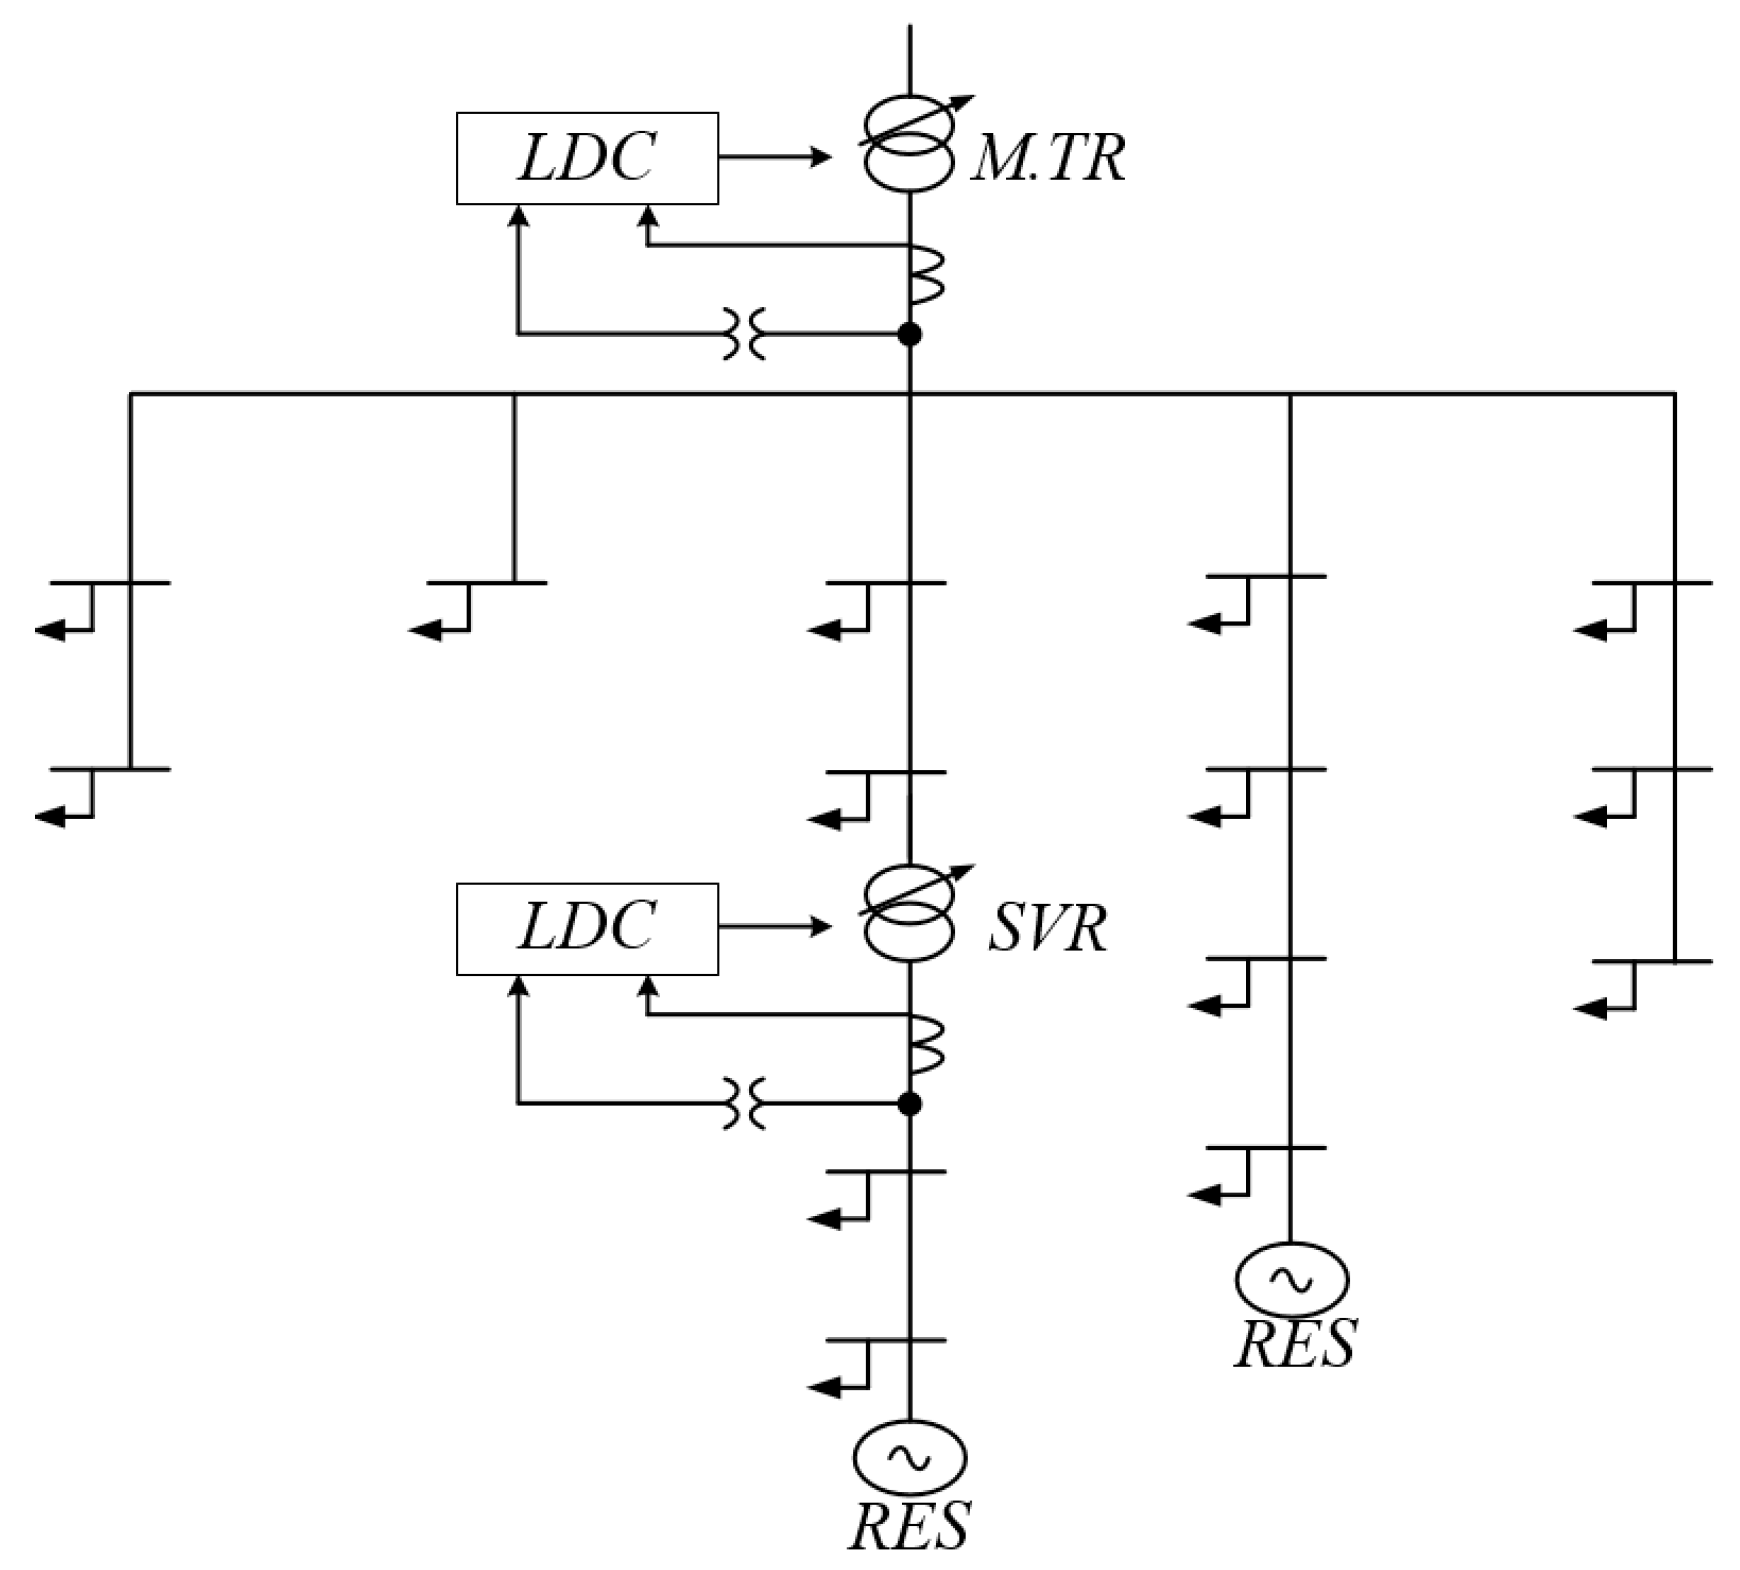
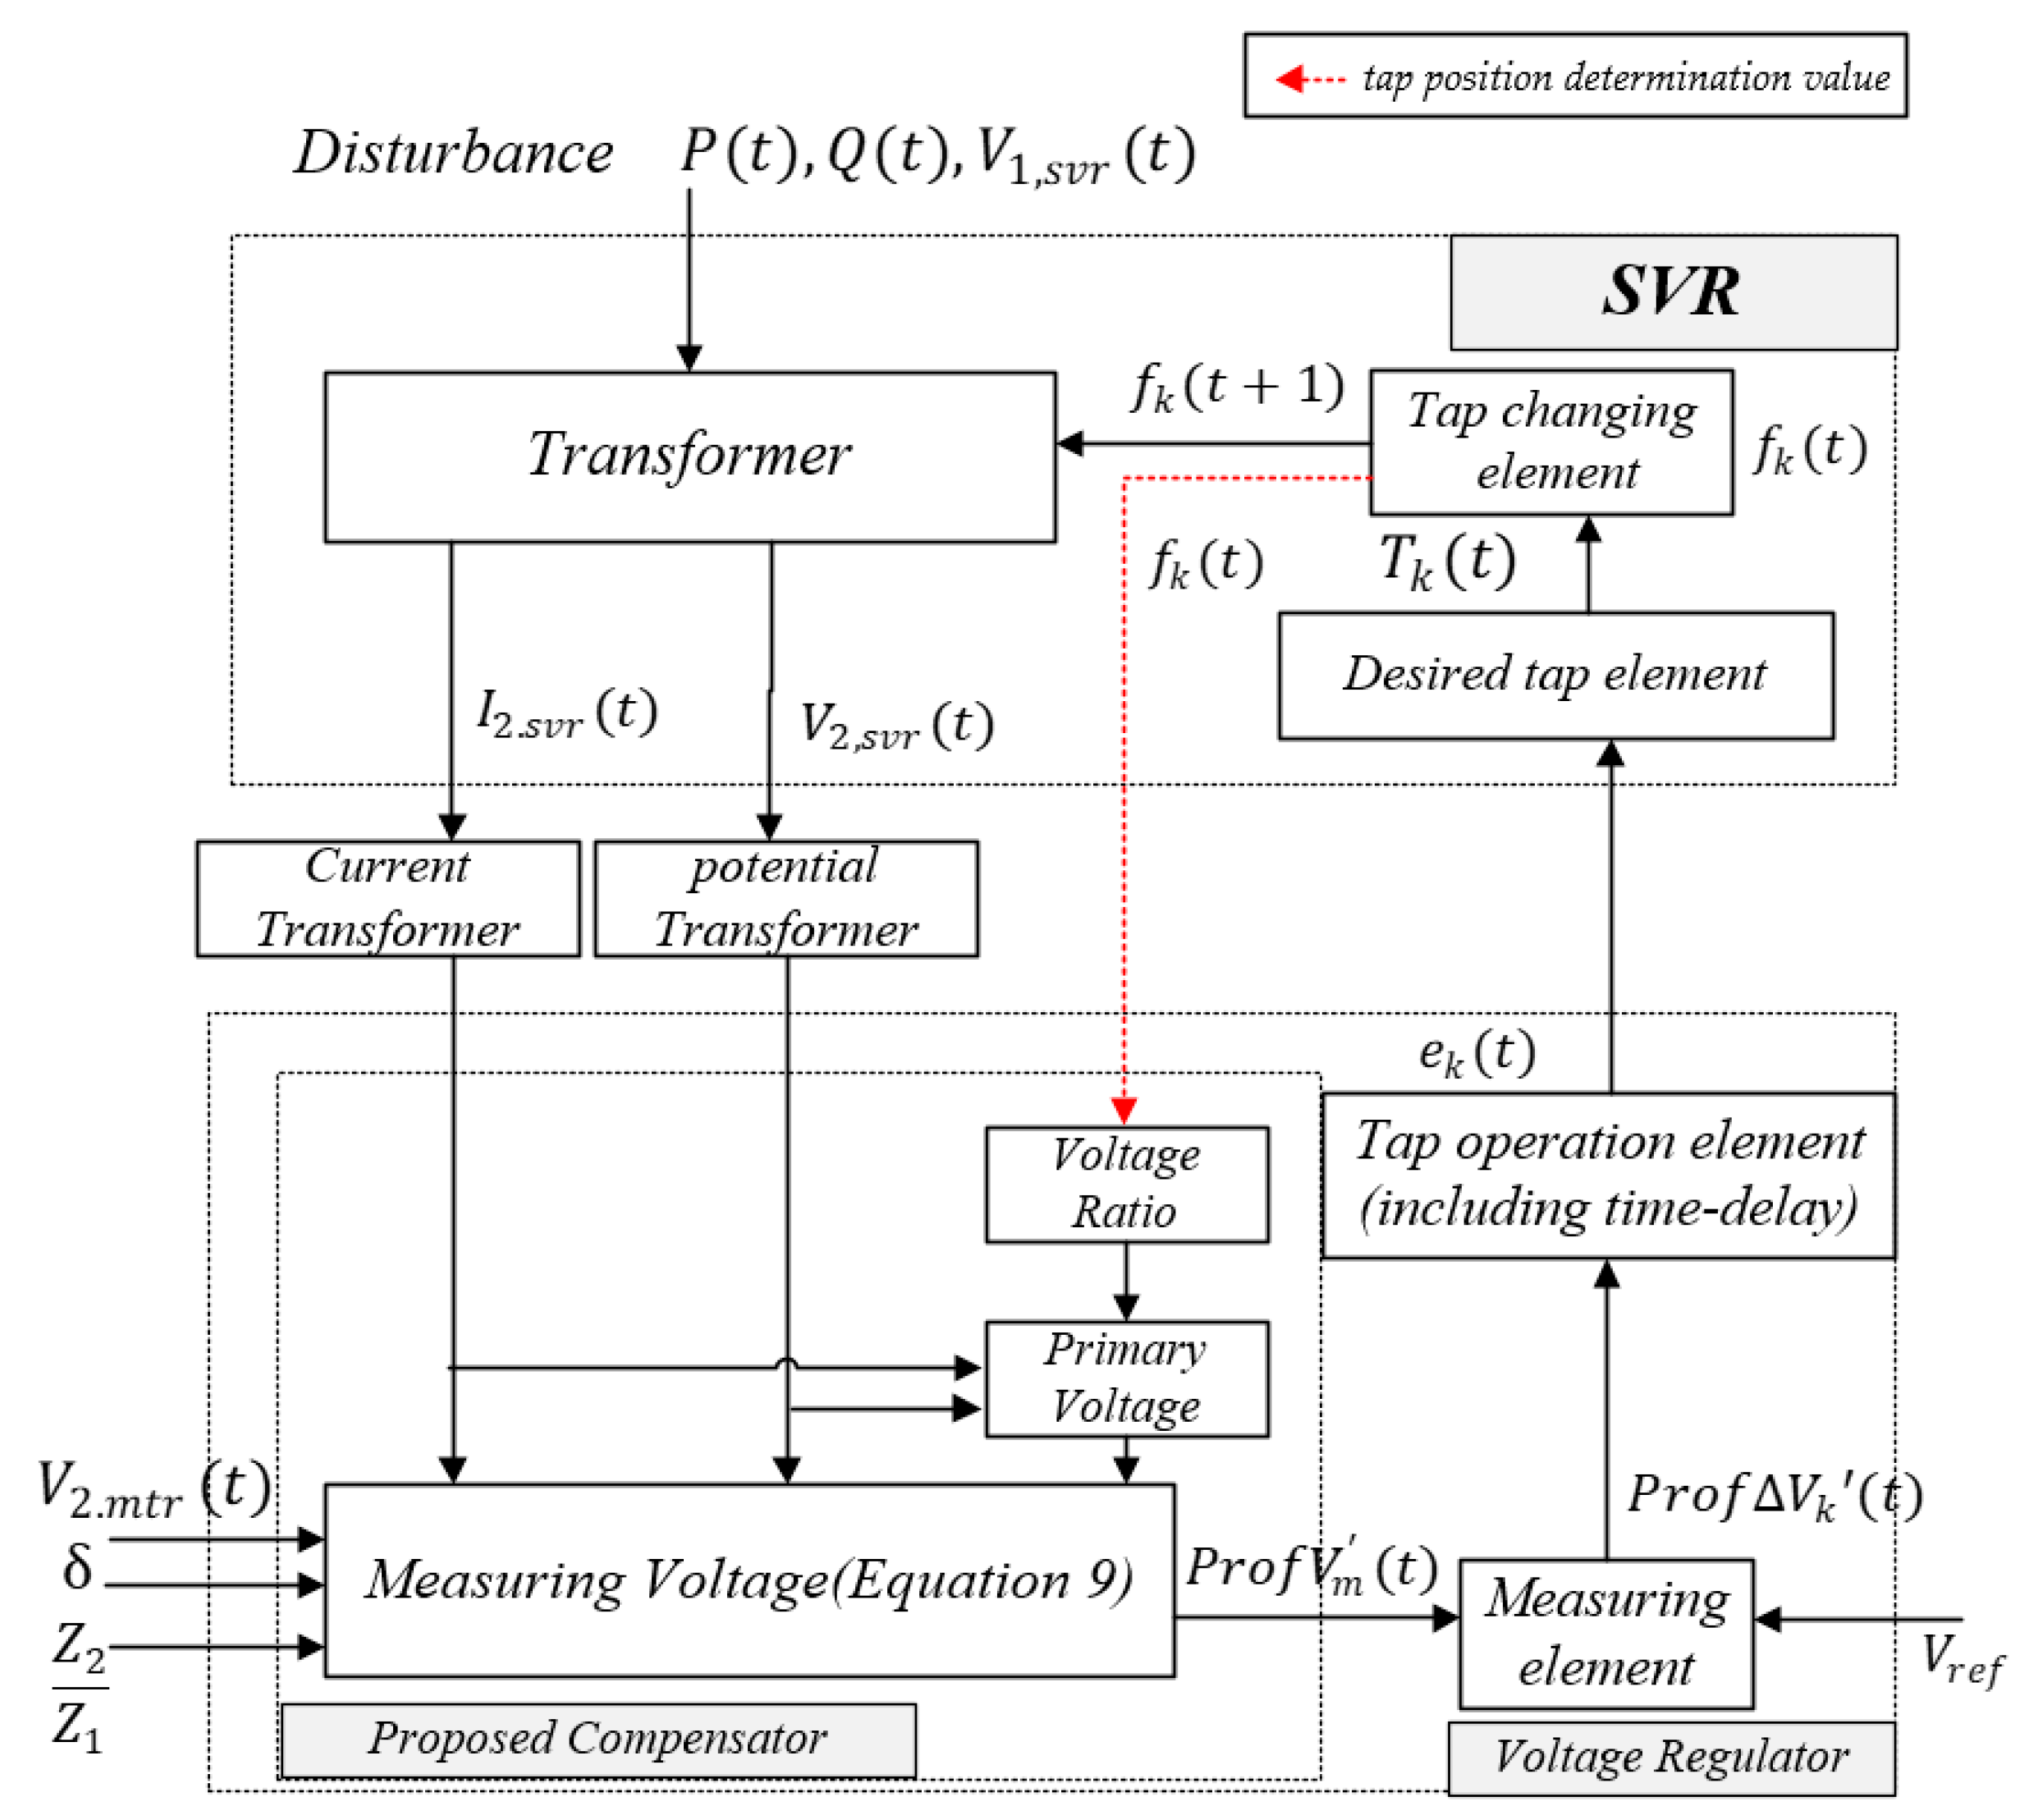
In order to overcome the limitations of the existing voltage control method for the SVR, this paper proposes a novel voltage control method for the SVR which is adapted to the optimal compensation rate ( P r o f V k ), recalculation value of the measured voltage ( P r o f V m ) with a characteristic of power flow (pf(t): forward flow: +1, reverse flow: −1) and the output voltage of the ULTC by the LDC operation. Specifically, Figure 5 shows the concept of the voltage control by the relationship between the SVR at the distribution line and the ULTC at the main transformer. Moreover, Figure 6 shows a control block diagram of the proposed voltage control method for the SVR considering the renewable energy resource and the secondary side voltage of the main transformer.
From Figure 6, the operating procedure for the voltage control method for the SVR considering the output voltage of the ULTC at the main transformer and the renewable energy resource is as follows.
[Step 1] Output voltage of the MTR ( V 2 , m t r ), output voltage ( V 2 , s v r ) of SVR and current ( I 2 , s v r ) of the SVR are carried out at each measurement point presented in Figure 2.
[Step 2] Power flow ( p f t ) at the SVR location is determined by considering the direction of the current.
[Step 3] Compensation voltage ( V p c ) considering the output voltage of the SVR is controlled by the ULTC and measured value of [Step 1, 2]. It is calculated via Equations (7) and (8).
V p c t = p f t I 2 , s v r t I m a x · Z 2 Z 1 · δ V 2 , m t r t V 1 , s v r t 1 + δ · p f t
δ = S s v r S f e e d e r
where V p c t is the compensation voltage according to the proposed method, p f t is the direction of power flow (forward flow: +1, reverse flow: −1), V 2 , m t r t is the measuring voltage on the secondary side of the MTR, I m a x is the passing current of the SVR, Z 1 is the feeder impedance on the power source side of the SVR, Z 2 is the feeder impedance on the load side of the SVR, δ is the occupation rate of the load configuration after the installation location of the SVR, S f e e d e r is the summation of the total load capacity of the installation feeder of the SVR, and S s v r is the summation of the load capacity after the installation location of the SVR
[Step 4] In order to obtain the improved optimal compensation rate ( P r o f V k ), the recalculation of the value of the measured voltage ( P r o f V m ) by considering the output voltage of the SVR ( V 2 . s v r ) and d compensation voltage ( V p c ) is performed as shown in Equation (9), where in order to minimize the tap operation, the voltage value of V 2 . s v r adapts the 5 min average value considering the tap operation time.
P r o f V m ( t ) = t = 1 t p V 2 . s v r V p c ( t ) Subject   to t p ( t )   <   tap   operation   time   ( tap   up     or   tap   down   time )
where P r o f V m is the recalculation value of measuring voltage, and tp is the tap operating time.
[Step 5] Determination of the improved optimal compensation rate ( P r o f V k ) using the reference voltage ( V r e f ) and recalculation value of the measured voltage ( P r o f V m ) of Equation (9), as expressed by Equation (10).
P r o f V k t = V r e f P r o f V m
where P r o f V k is the improved optimal compensation rate.
[Step 6] Finally, the voltage of the distribution system in the control range of the SVR is maintained within the allowable limit by the calculating tap position based on the optimal compensation rate, and the correct tap position is determined by comparing it with the db and then operating the SVR tap after the delay operation time.
As mentioned earlier, to obtain the optimal compensation rate, the calculation process is carried out with Step 1 to Step 6. Moreover, to minimize tap operations, an additional constraint equation is incorporated into Equation (9). Therefore, the optimal compensation rate can ensure not only the required performance but also minimal tap operations.

3.2. Tap Operation Method for the SVR

From the determination of the optimized compensation rate of the SVR, the tap position ( T k t ) of the SVR can be simulated by the proposed value, the incoming voltage on the SVR side, as shown in Equation (11). In addition, the tap position as an integer value is not rounded when the decimal point is 0.5 or less, where in the case that T k t is a (+) value it means tap up and where T k t is a (–) value it means tap down.
T k t = P r o f V k ( t ) T i n t
where T k t is the desired tap position of the SVR, and T i n t is the tap interval of the SVR (1.25%).
On the other hand, the tap operating signal ( e k t ) of the SVR is determined via the improved optimal compensation rate ( P r o f V k ( t ) ) in Equation (12). Meanwhile, the tap operating signal e k t is determined considering the V k and time delay of the SVR. The value of the tap operating signal ( e k t ) has a “1” or “0” in the operating or non-operating state, respectively.
e k t = 1       i f     P r o f V k t 0 ,     t = t 0 + t d e l a y 0                                   o t h e r w i s e                  
where e k t is the tap operation signal of the SVR considering the time delay, and t d e l a y t   i s   t h e time delay of the SVR.
Finally, the SVR tap is controlled via the calculation between the integral value of the t a p   o p e r a t i n g   s i g n a l   e k t   and the tap determination value ( f k t + 1 ) when the ( e k t ) value becomes a “1” signal in Equation (13).
f k t + 1 = e k ( t ) × T k t
where f k t + 1 is the tap position determination value.
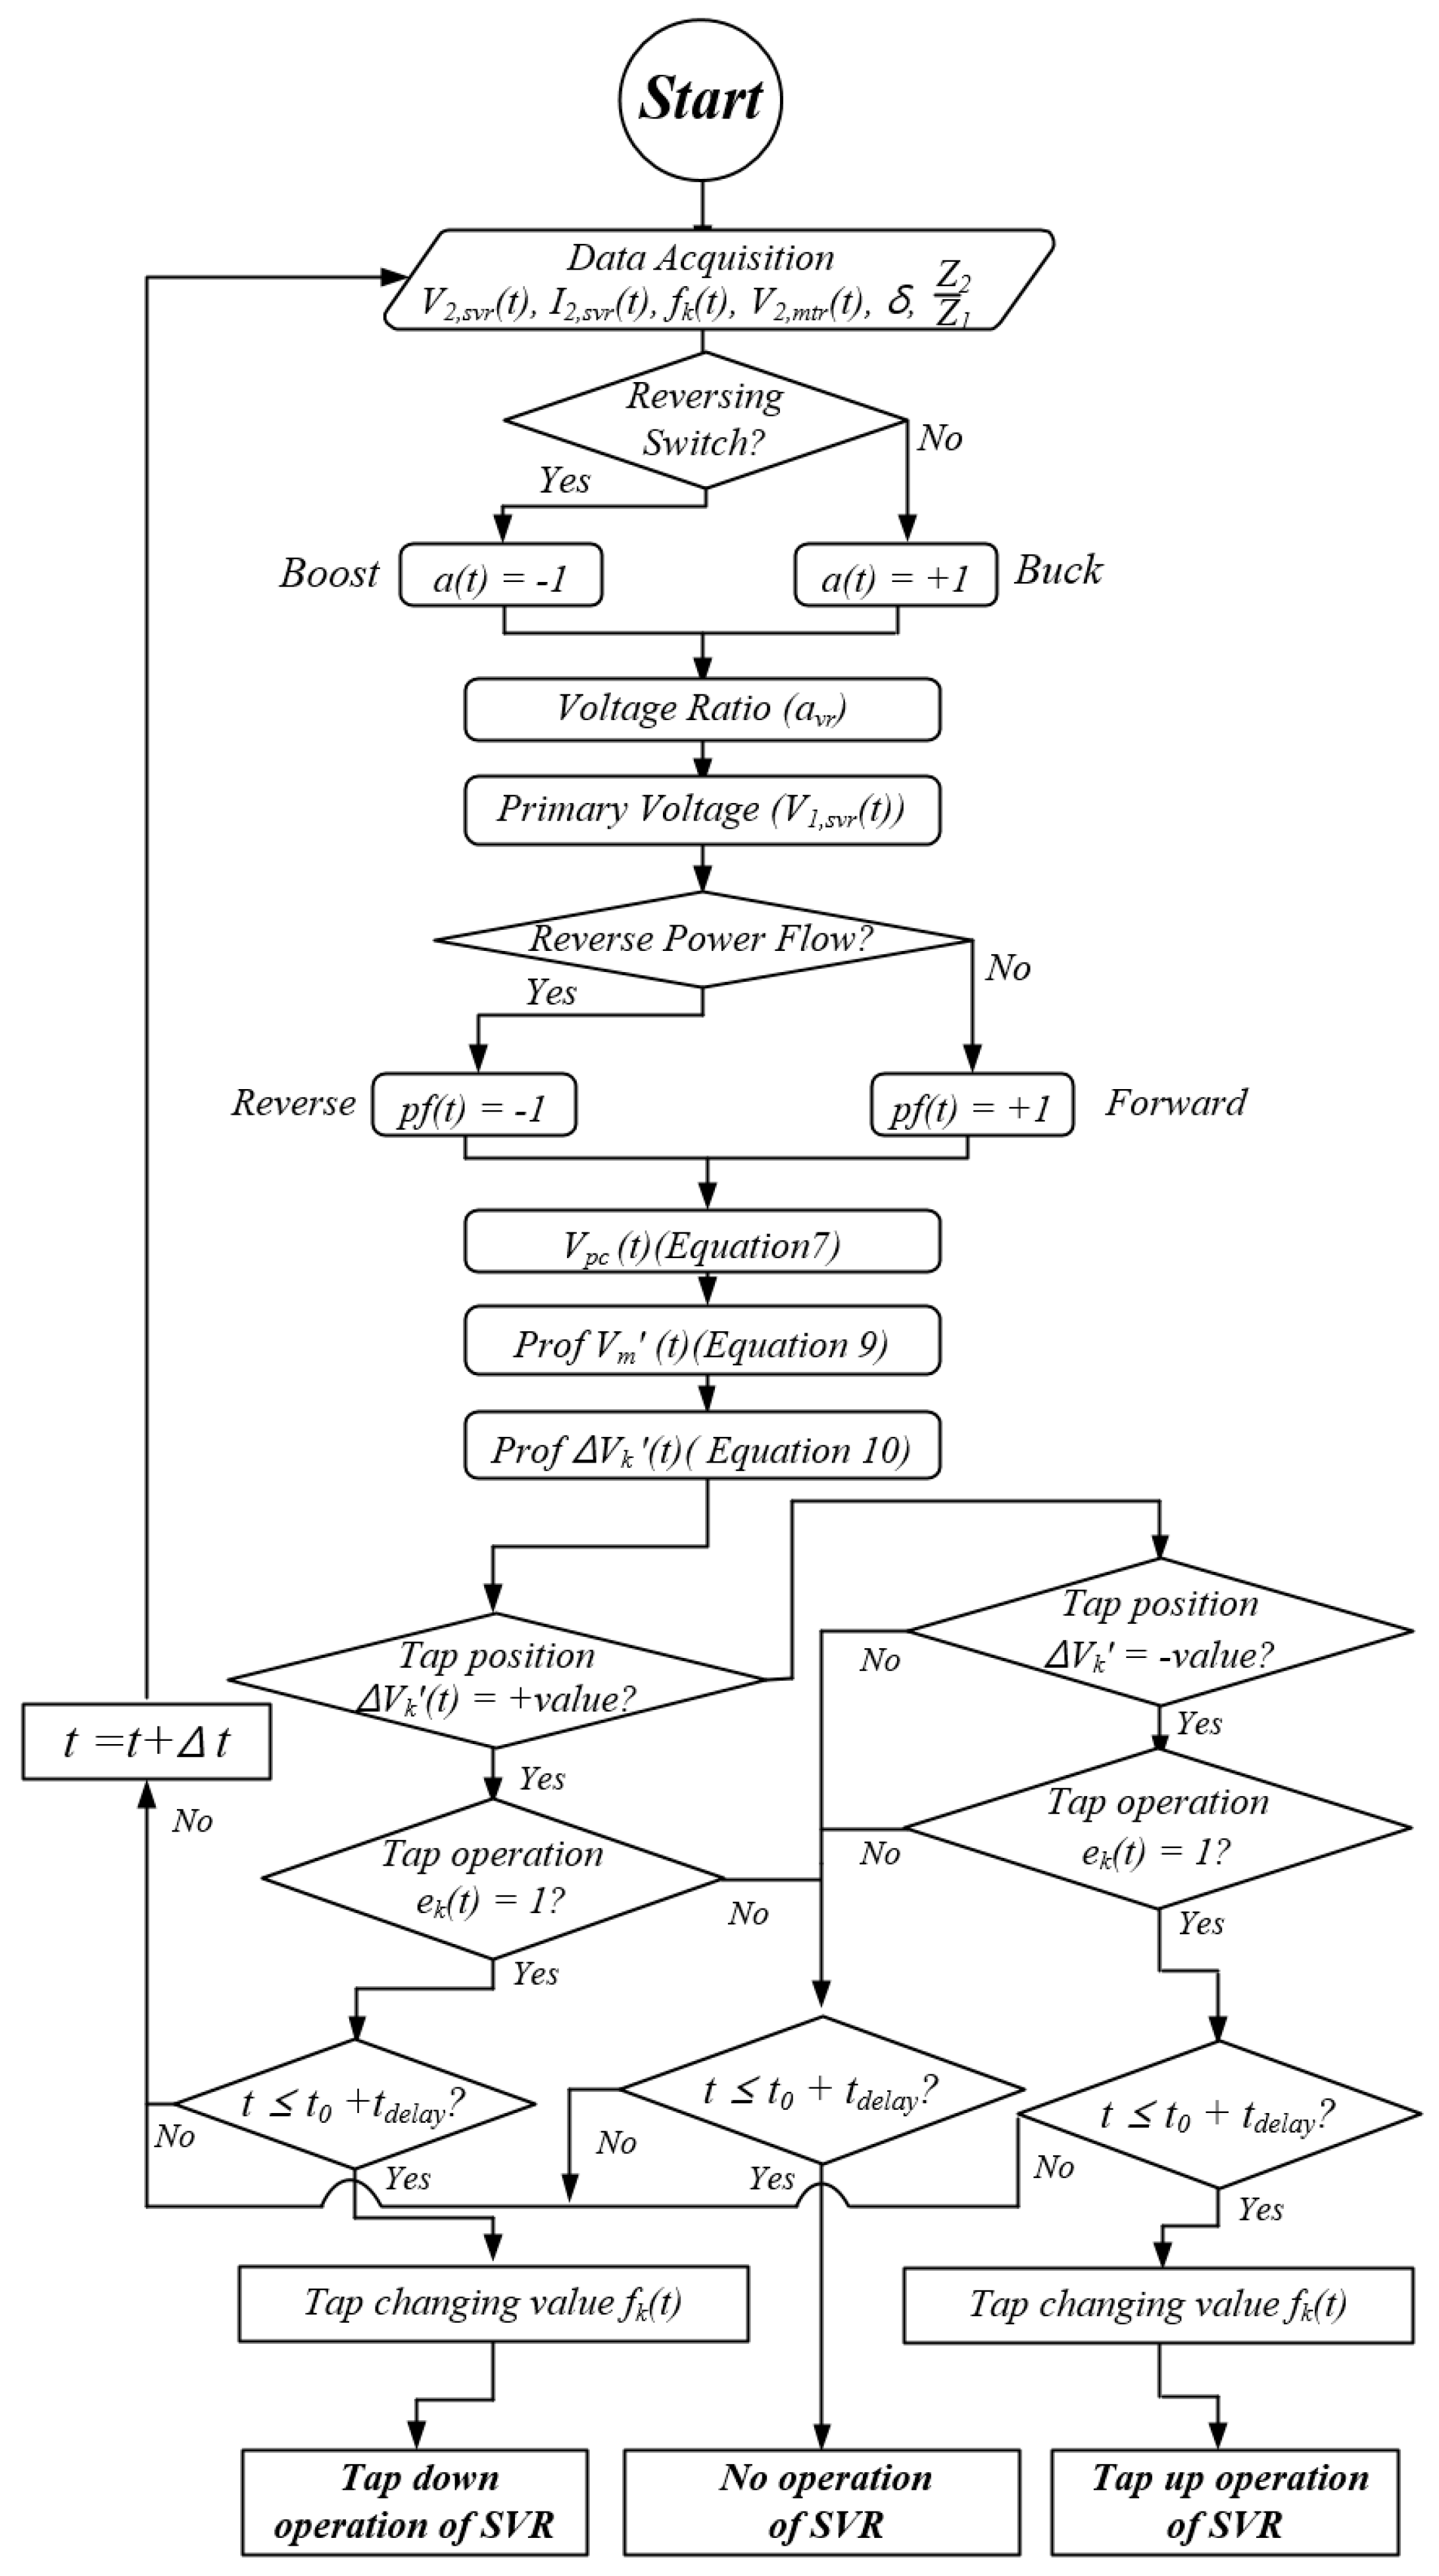
Therefore, the above-mentioned procedure can be expressed as the following flowchart (Figure 7).
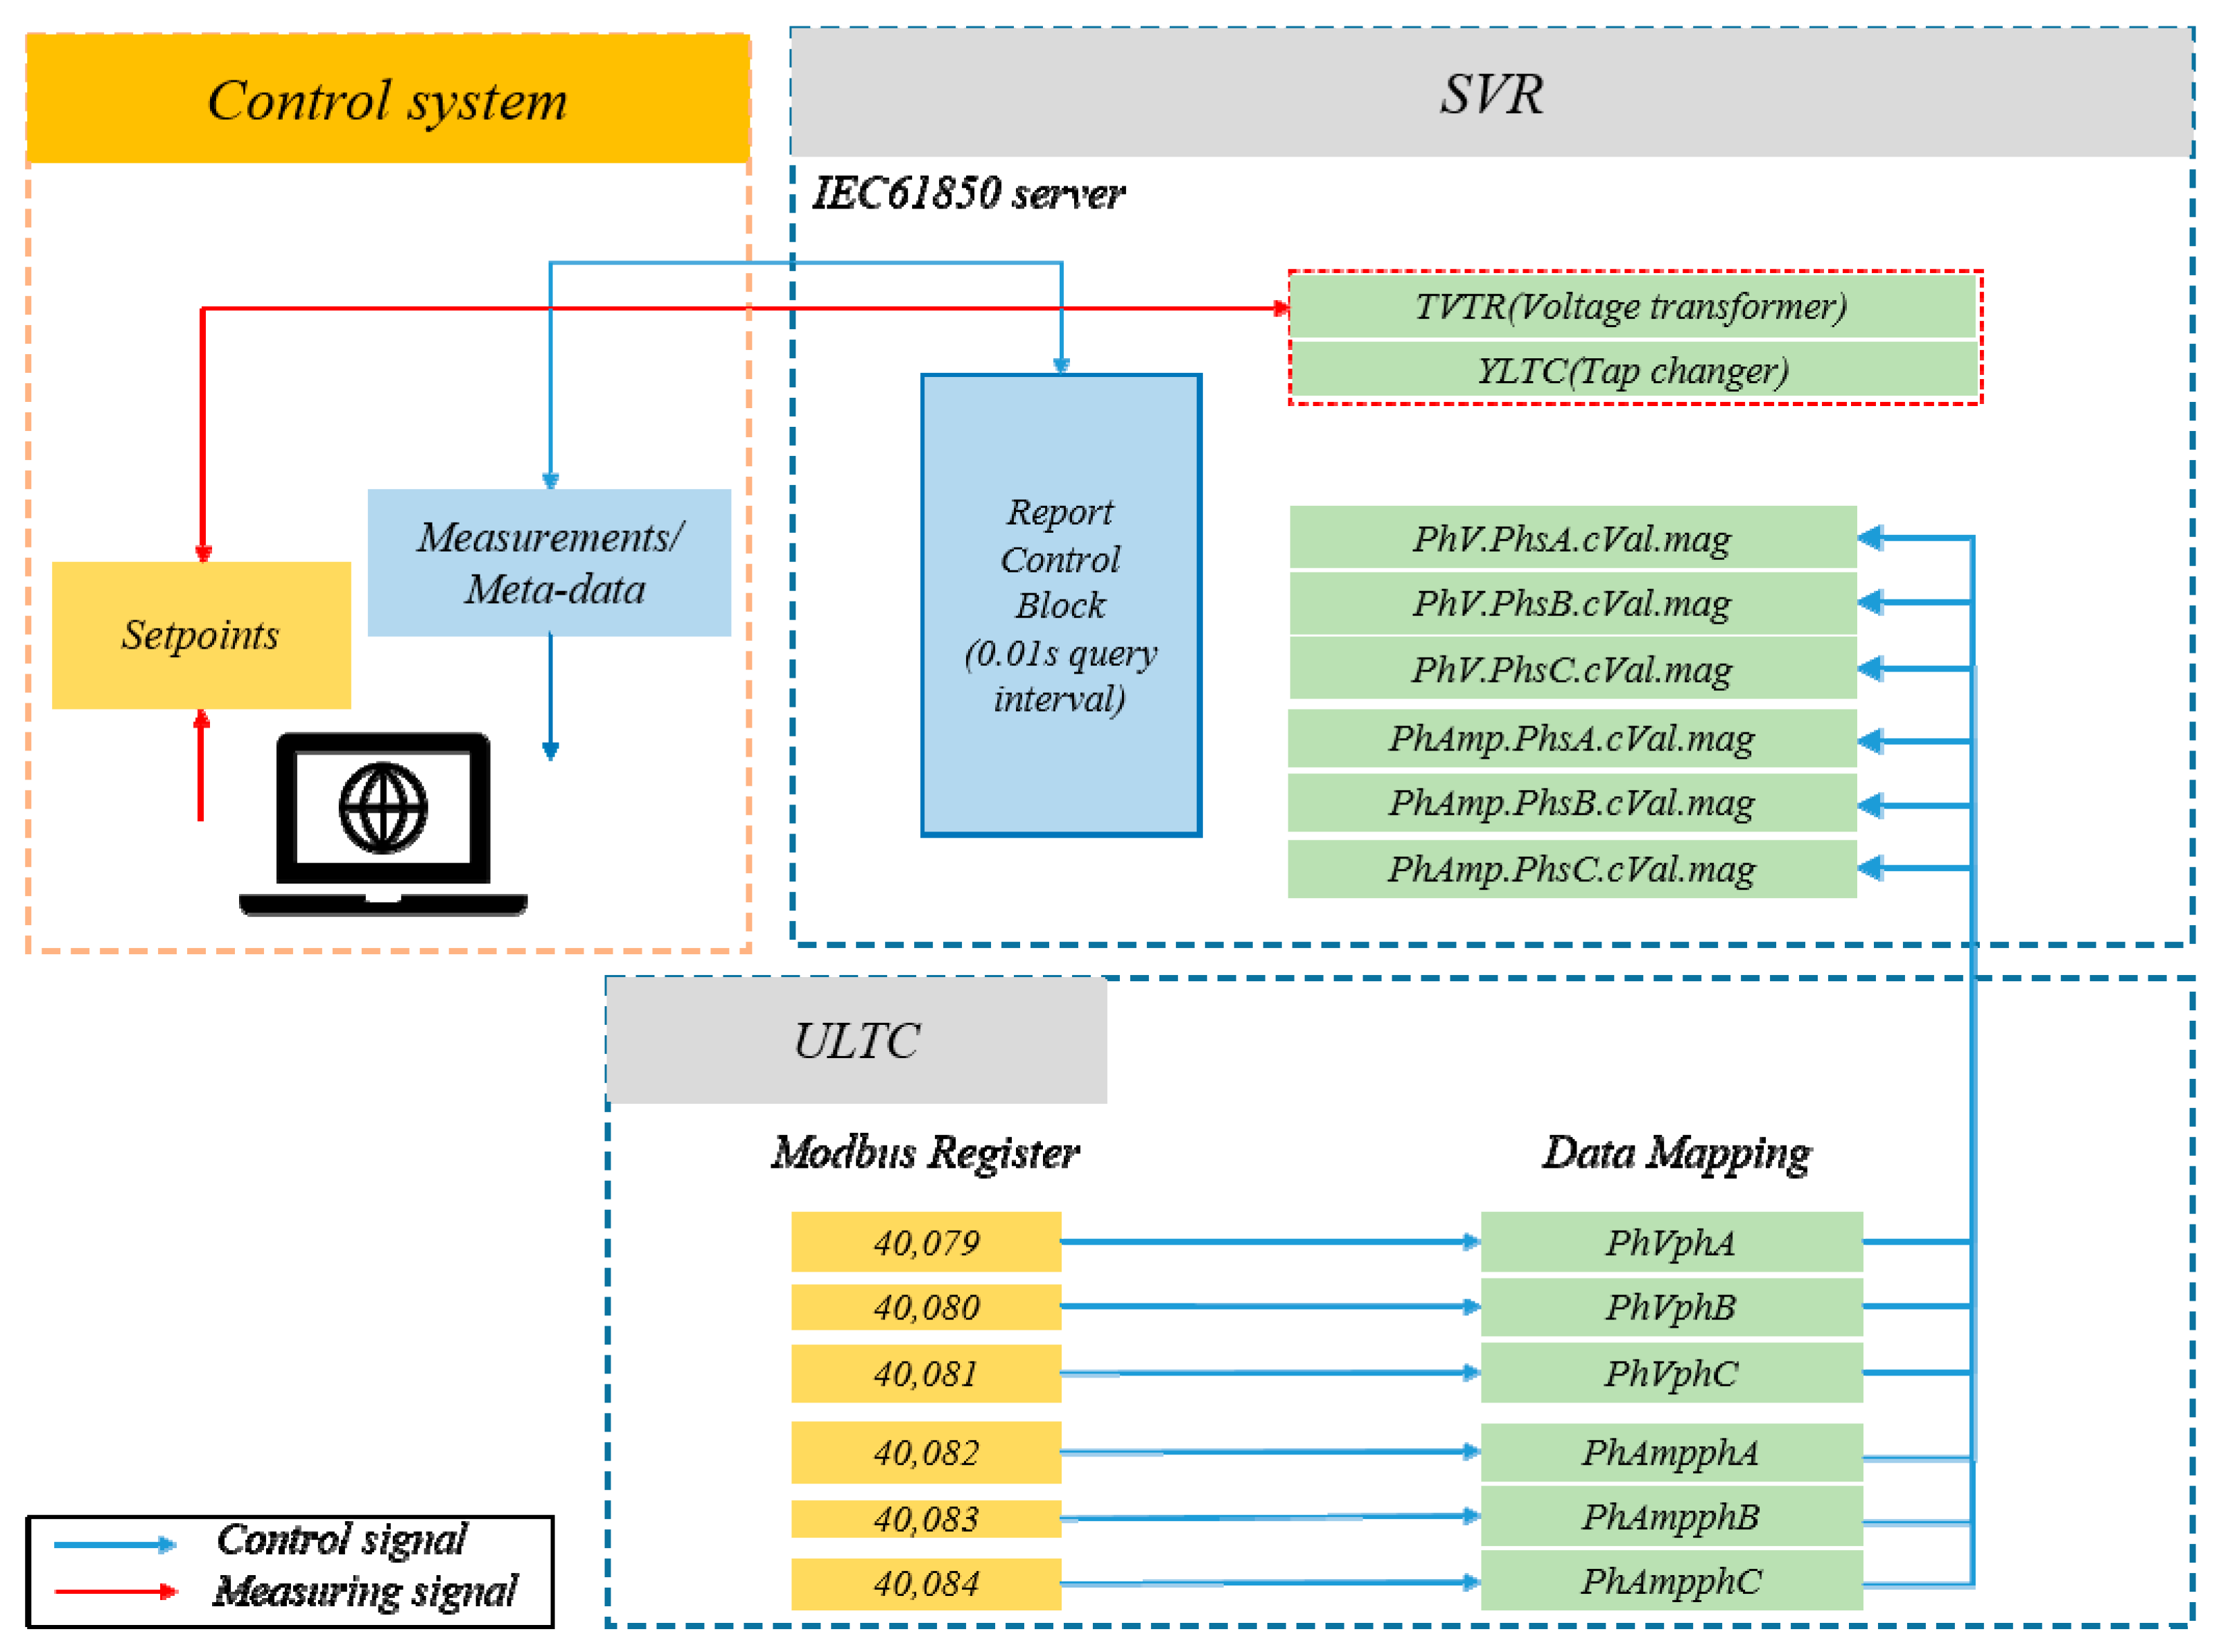
On the other hand, by utilizing the IEC 61850 communication protocol, the communication requirements between the SVR and ULTC can be achieved, as depicted in Figure 8. This enables seamless data exchange, facilitating coordinated voltage control and enhancing the overall stability and efficiency of the system.

4. Case Studies

4.1. Simulation Conditions

In order to validate the performance of the proposed method, this paper analyzes the distribution characteristics of the customer voltage according to the voltage control method of four conditions, which are composed of: (①) operation of the ULTC by only the fixed sending voltage method, (②) operation of the ULTC by the LDC method and SVR by the fixed sending voltage method, (③) individual operation of the ULTC by the LDC method and SVR by the LDC method, and (④) coordinated operation of the SVR by the proposed control method considering operation of the ULTC by the LDC method.
Case 1 (without the SVR method): Operation of the ULTC by the fixed sending (22.9 kV) voltage without the SVR.
Case 2 (fixed (SVR) method): Operation of the ULTC by the LDC and SVR by the fixed (22.9 kV) sending voltage output voltage.
Case 3 (LDC (SVR) method): Individual operation of the ULTC by the LDC method and SVR by the LDC method
Case 4 (proposed (SVR) method): Coordinated operation of the SVR by the proposed control method considering operation of the ULTC by the LDC method
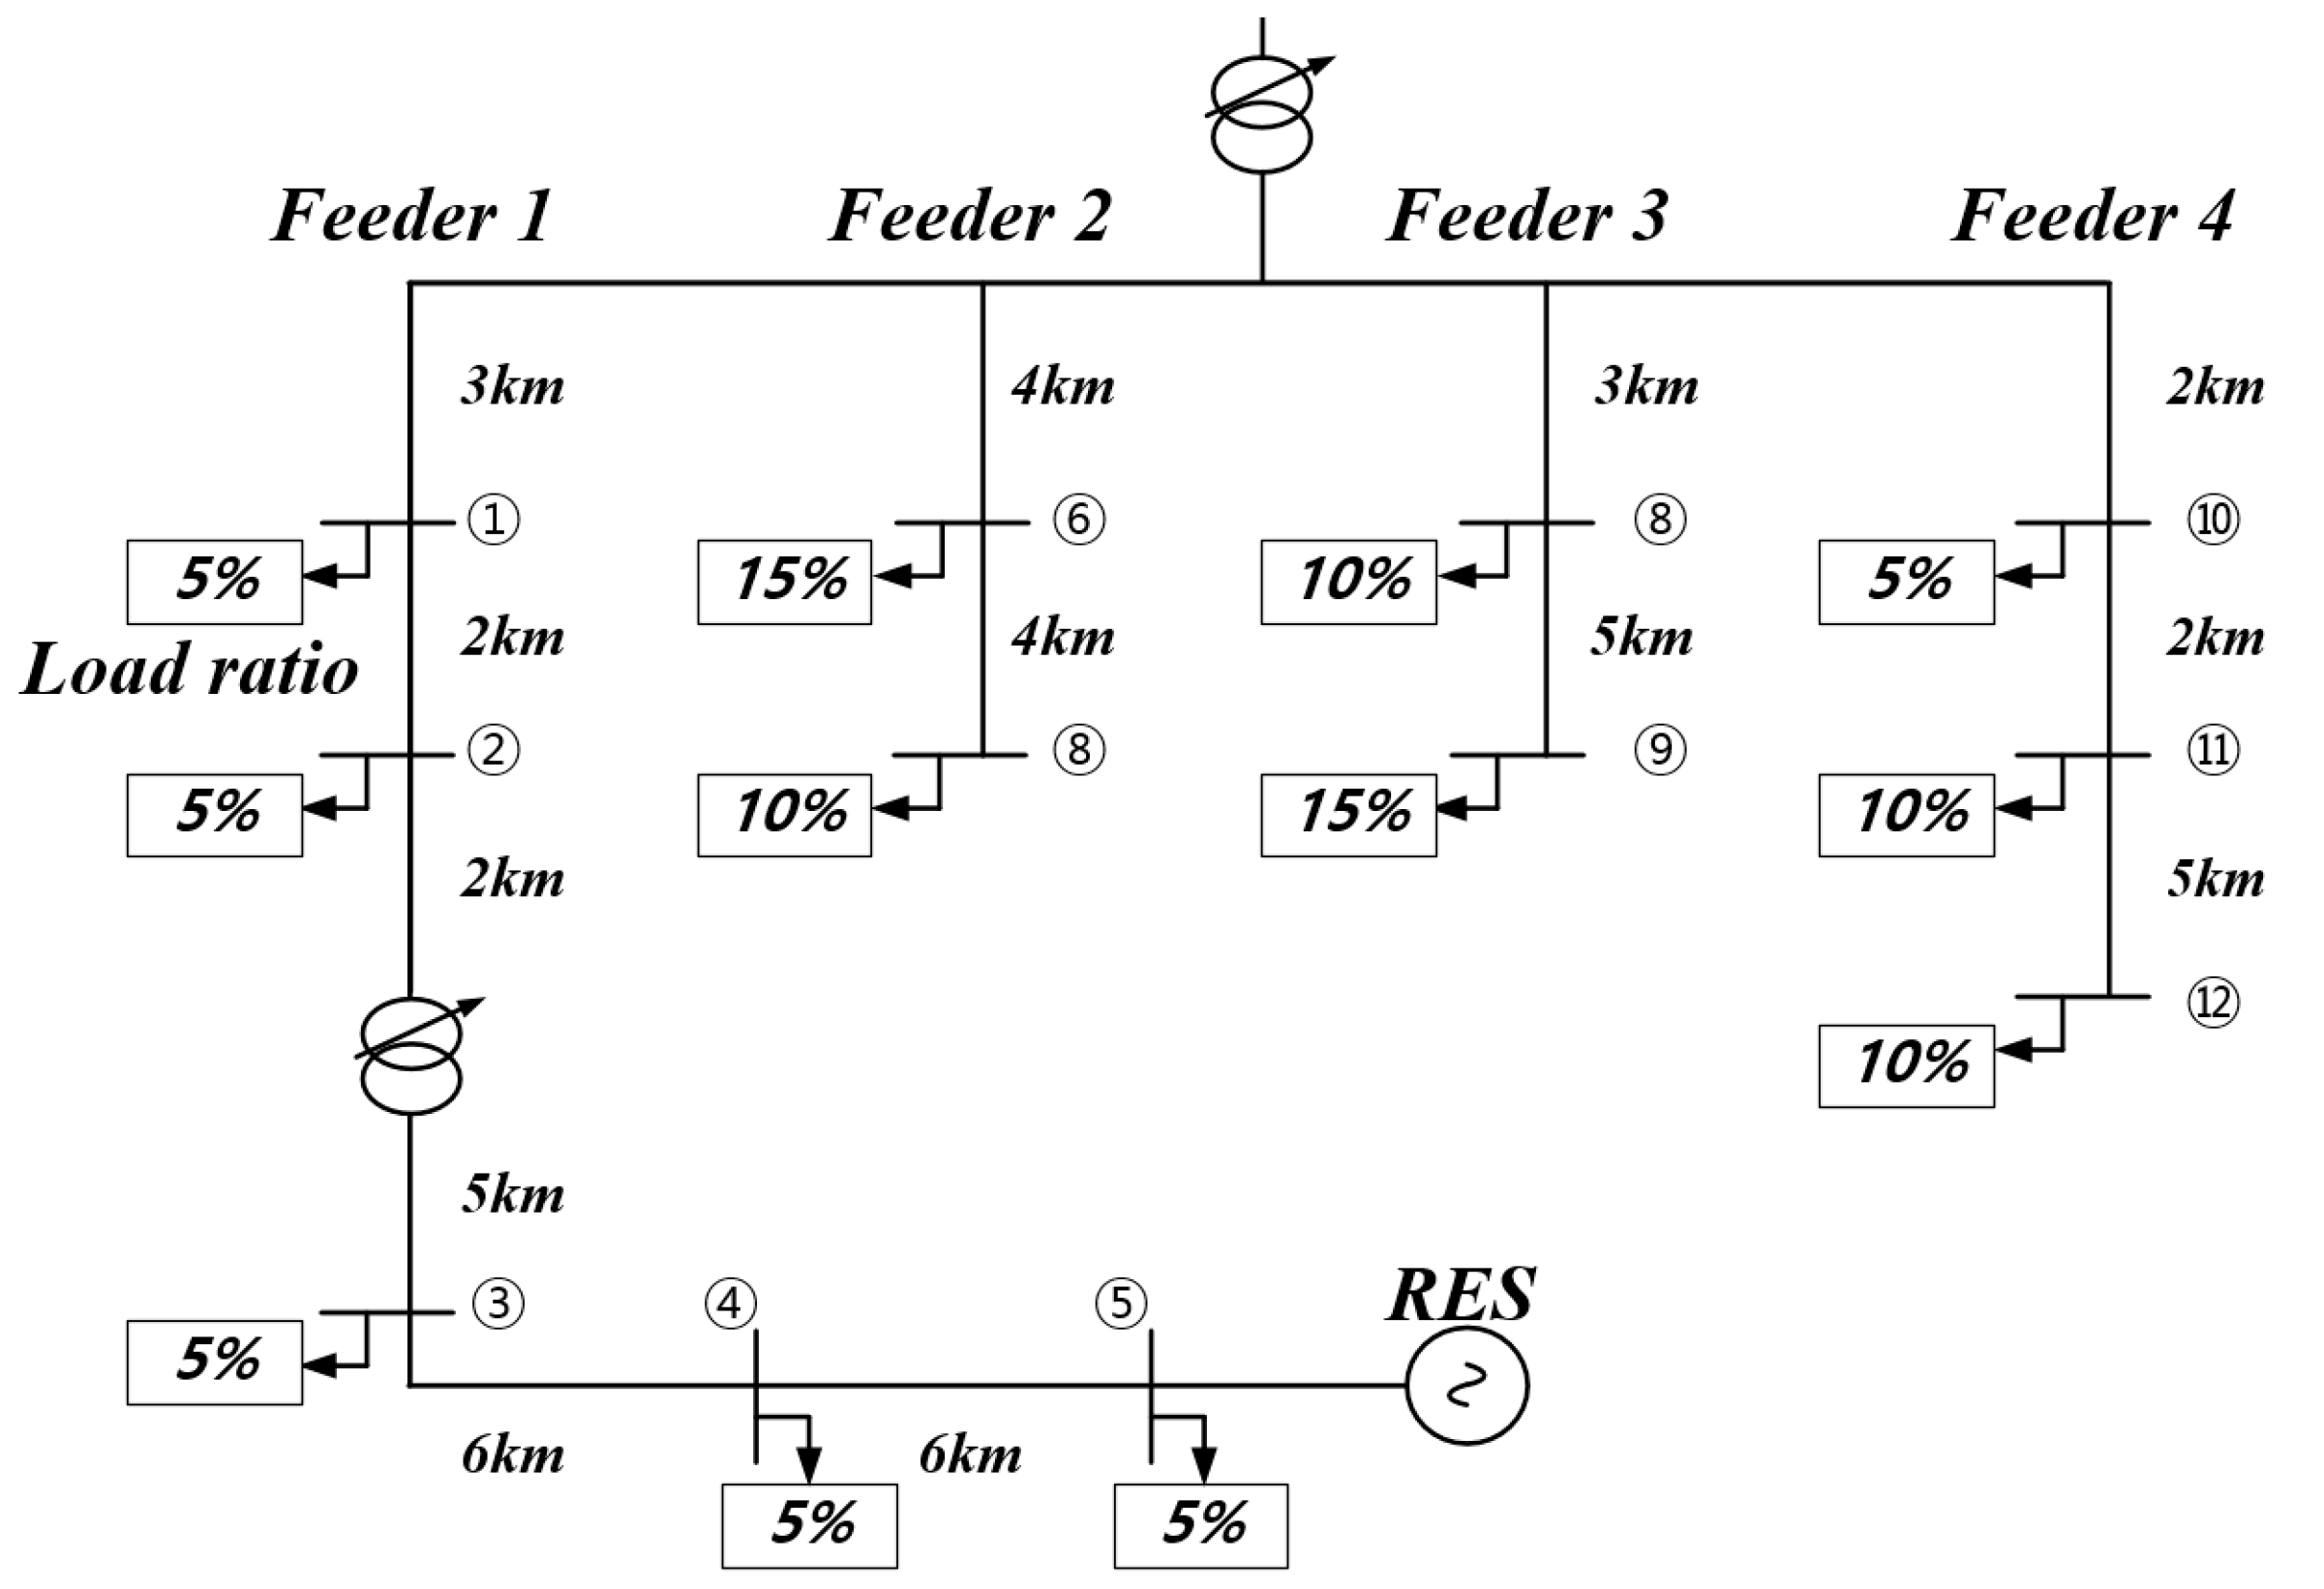
On the other hand, to analyze the characteristics of the proposed control method, the simulation modeling of the distribution system interconnected with the RES, including the SVR, ULTC and variation loads, is performed using MATLAB 2022a version. Figure 9 and Table 2 show the configuration and parameters of the modeled distribution system. The voltage drops at the pole transformer, leading wire and low voltage feeder are assumed to be 4 V and 8 V, respectively, and the installation location of the SVR is assumed to be between location sections 2 and 3 of feeder 1. Additionally, from Figure 8, an RES is introduced at the end section of feeder 1 and the introduction capacity is assumed to be 3 and 7 MW.
On the other hand, Table 3 shows the detailed distribution system parameters, including the substation and the distribution feeder with the SVR. Moreover, this paper performs a characteristics analysis using MATLAB S/W to confirm the validity of the proposed algorithm.

4.2. Simulation Results

4.2.1. Voltage Characteristic without an RES

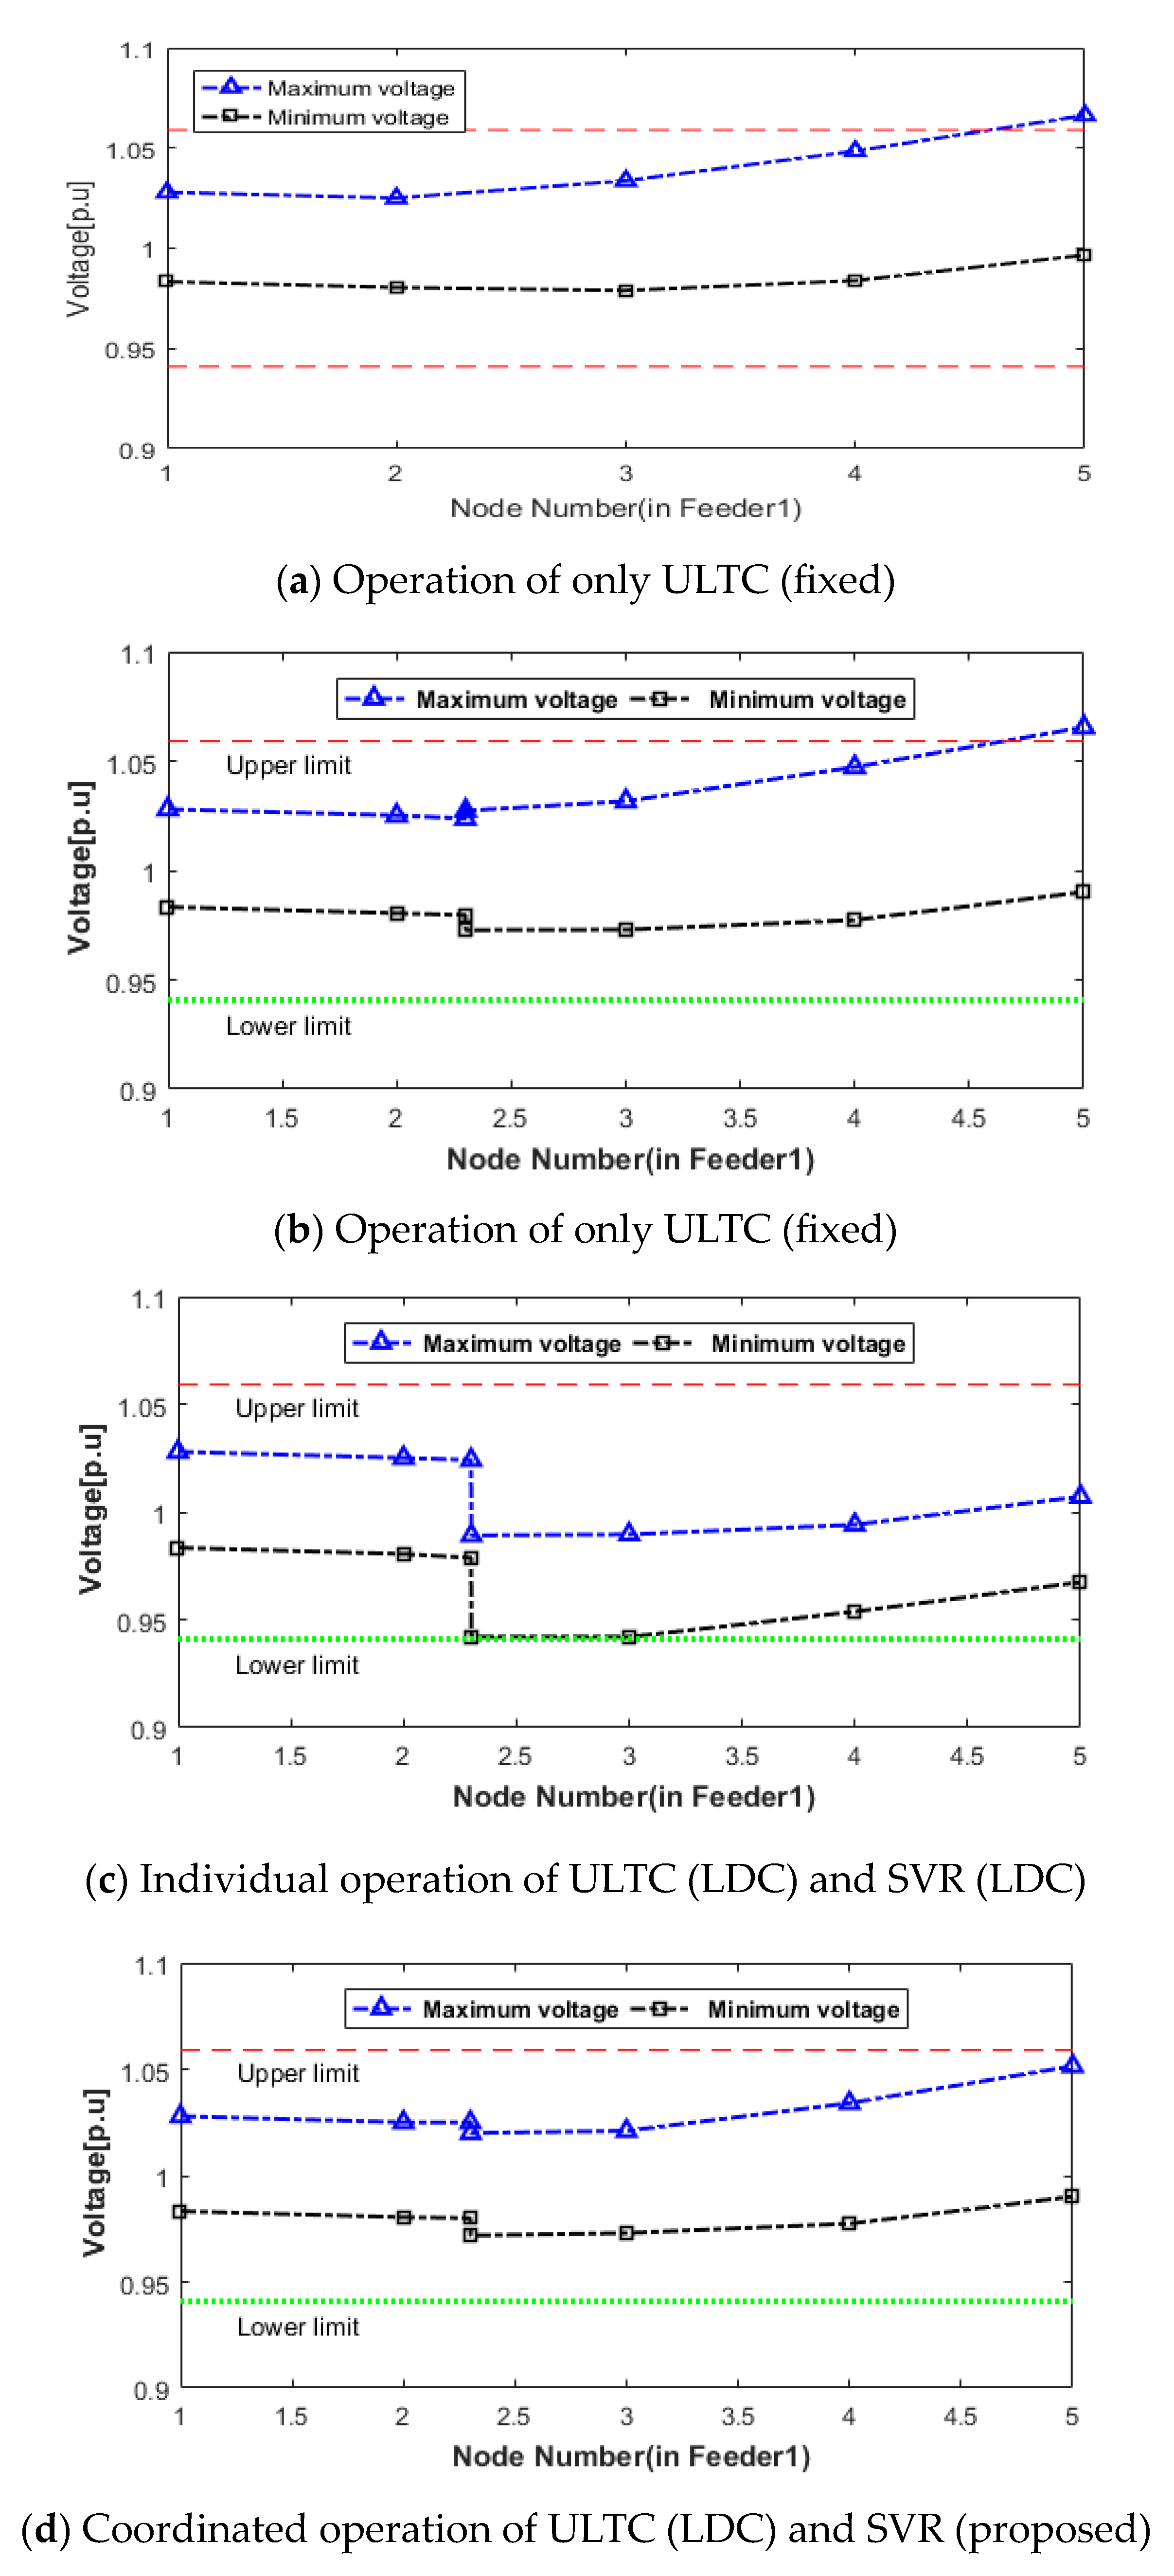
Figure 10 shows the customer voltage characteristics for each section of feeder 1 when it is operated according to the existing method (methods 1~3) and the proposed method (method 4). In addition, the RES introduced at Section 5 of feeder 1 is assumed to be a condition which is not operated during the simulation period. From the results using the existing method and the proposed method, it is confirmed that the customer voltages at feeder 1 properly can be kept within the allowable limit (rated voltage) only when it is operated with existing method 2, 3 and proposed method 4 in Figure 10b–d. On the other hand, the existing method in Figure 10a confirms that the low voltage phenomenon occurs in the last section due to the distribution characteristics of the customer load of feeder 1.

4.2.2. Voltage Characteristics with an RES of 3 MW

Figure 11 shows the customer voltage characteristics of each section of feeder 1 interconnected with an RES of 3 MW. From the results of the existing method and the proposed method, it is confirmed that all the customer voltages can be kept within the allowable limit (rated voltage) by the existing method 3 (individual operation of MTR (LDC) and SVR (LDC)) and proposed method 4 (coordinated operation of MTR (LDC) and SVR (LDC)), as shown in Figure 11c,d. However, the existing methods in Figure 11a,b confirm that the overvoltage phenomenon occurs in the last section due to the introduction of an RES of 3 MW. In other words, when 3 MW of RES was introduced at the long-distance feeder, it was clear that the feeder voltage was not maintained in Section 5 of feeder 1 because of the larger impedance size in the off-peak load state. Therefore, in order to solve overvoltage phenomena, the main transformer and step voltage regulator should be performed as independently controlled or coordinately controlled by the LDC method.

4.2.3. Voltage Characteristics with an RES of 7 MW

Figure 12 shows the customer voltage characteristics of each section of feeder 1 interconnected with an RES of 7 MW. From the results of the simulation, it is confirmed that the customer voltages at feeder 1 can be kept within the allowable limit (rated voltage) when it is only operated according to the proposed method 4 (coordinated operation of MTR: (LDC) and SVR (LDC)) in Figure 12d. On the other hand, the existing methods in Figure 12a–c confirm that the overvoltage phenomenon occurs in the last section due to the introduction of an RES of 7 MW. In other words, based on the simulation, in other words, when 7 MW of RES was introduced at the long-distance feeder, it was clear that the feeder voltage was not maintained in Section 5 of feeder 1 because of the larger impedance size and RES output in the off-peak load state. Therefore, in order to introduce the RES into the distribution system, the main transformer and step voltage regulator should be only performed in coordinated control by the LDC method.

4.3. Performance Verification

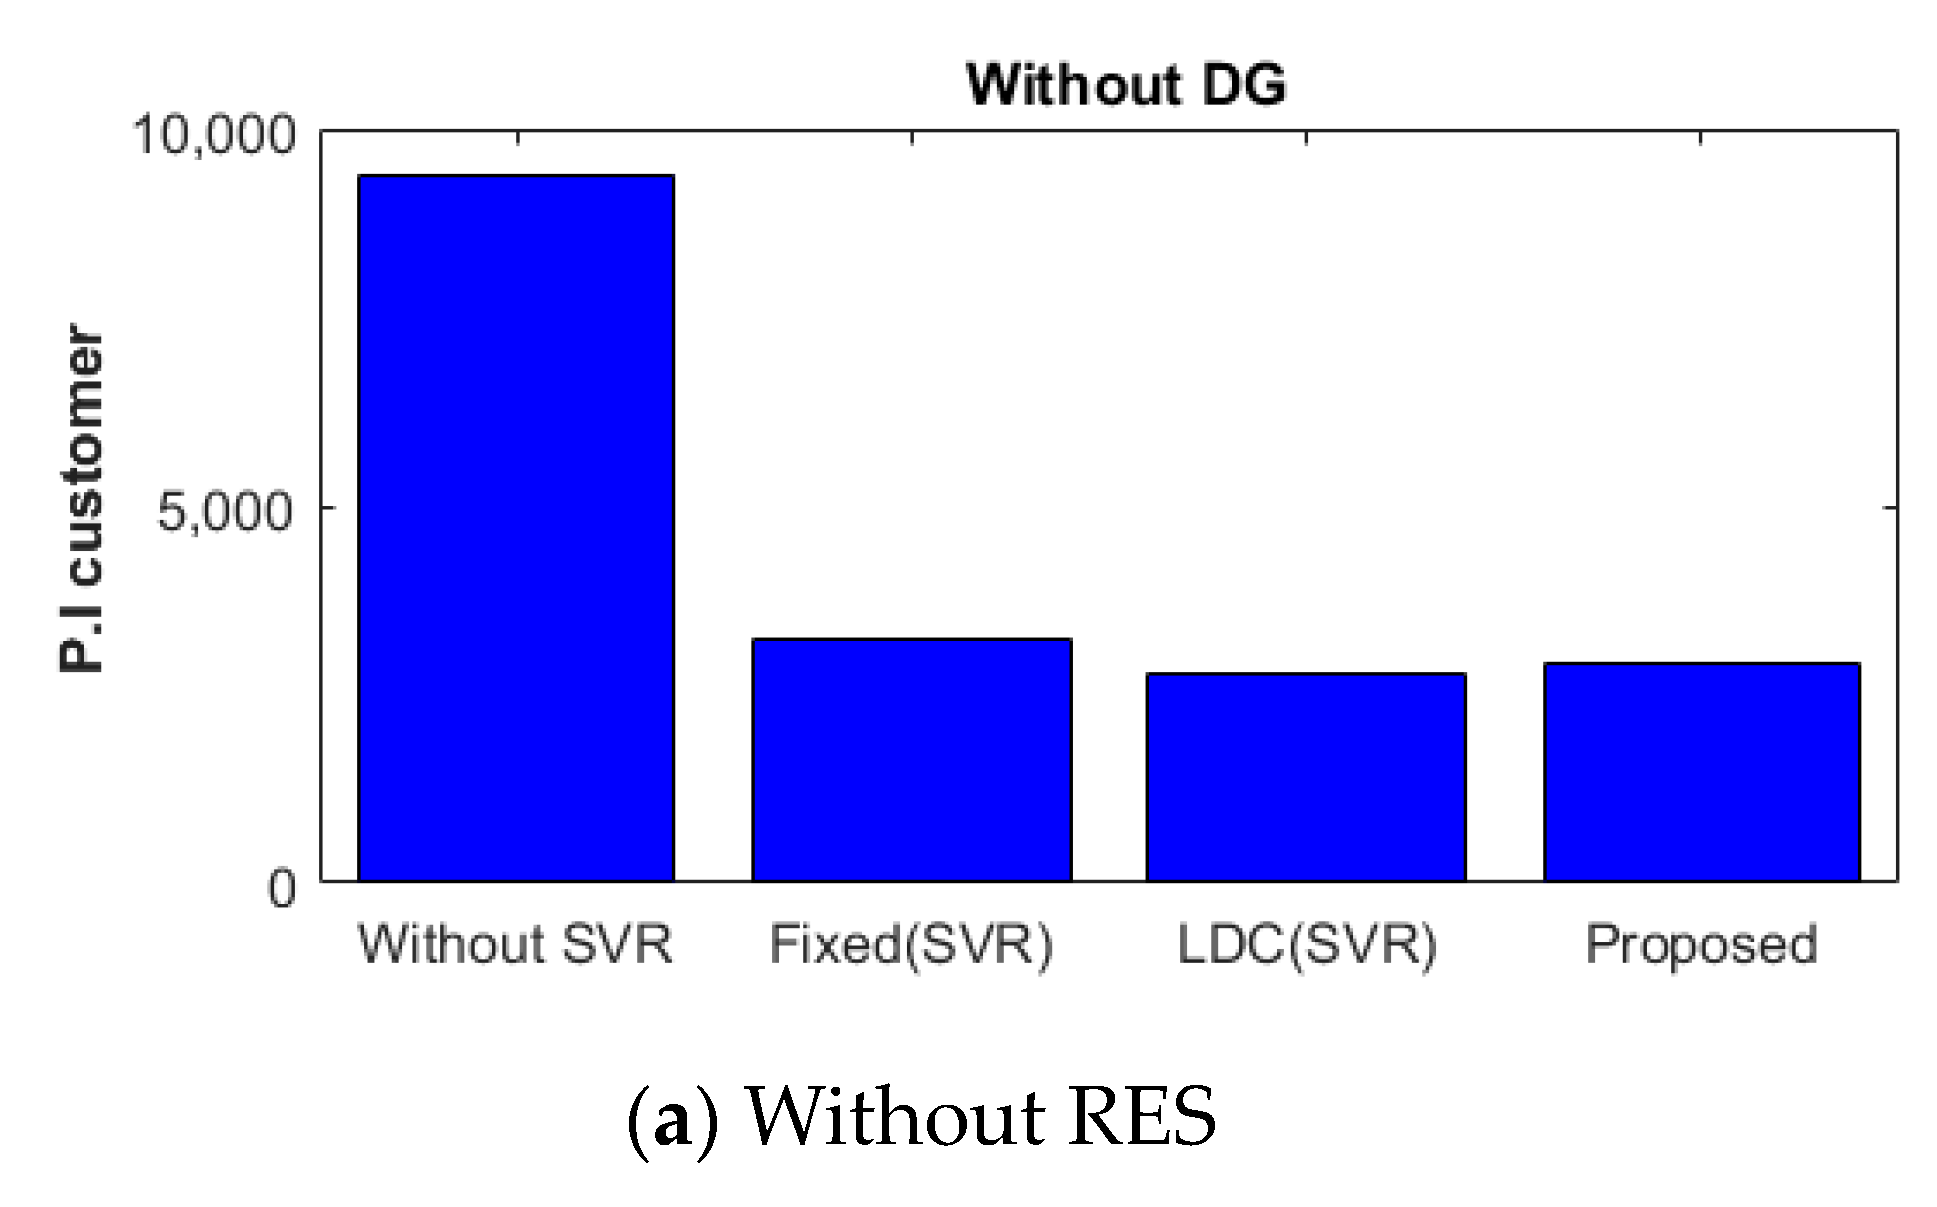
The characteristics of the customer voltage distributions can be evaluated using the degree of how close the customer voltages are kept to the rated voltage. The characteristics of the customer voltage are evaluated by calculating to what extent the customer voltage is maintained close to the standard voltage depending on the variation in the distributed power supply and load when the distributed power supply is interconnected with the distribution system and operated. Namely, the PI (performance index) can be expressed as the summation of the squared deviation between the customer voltage and rated voltage at the corresponding node at the observation time, as expressed in Equation (14).
P I = t = 1 T n = 1 N V f t , n V r 2 + V r V e t , n 2
where T is the total observation time, N is the total number of nodes in the SVR control region, V r is the rated voltage (220 [V]), V f ( t , n ) is the first customer voltages of the secondary feeder in the distribution system, and V e ( t , n ) is the last customer voltages of the secondary feeder in the distribution system
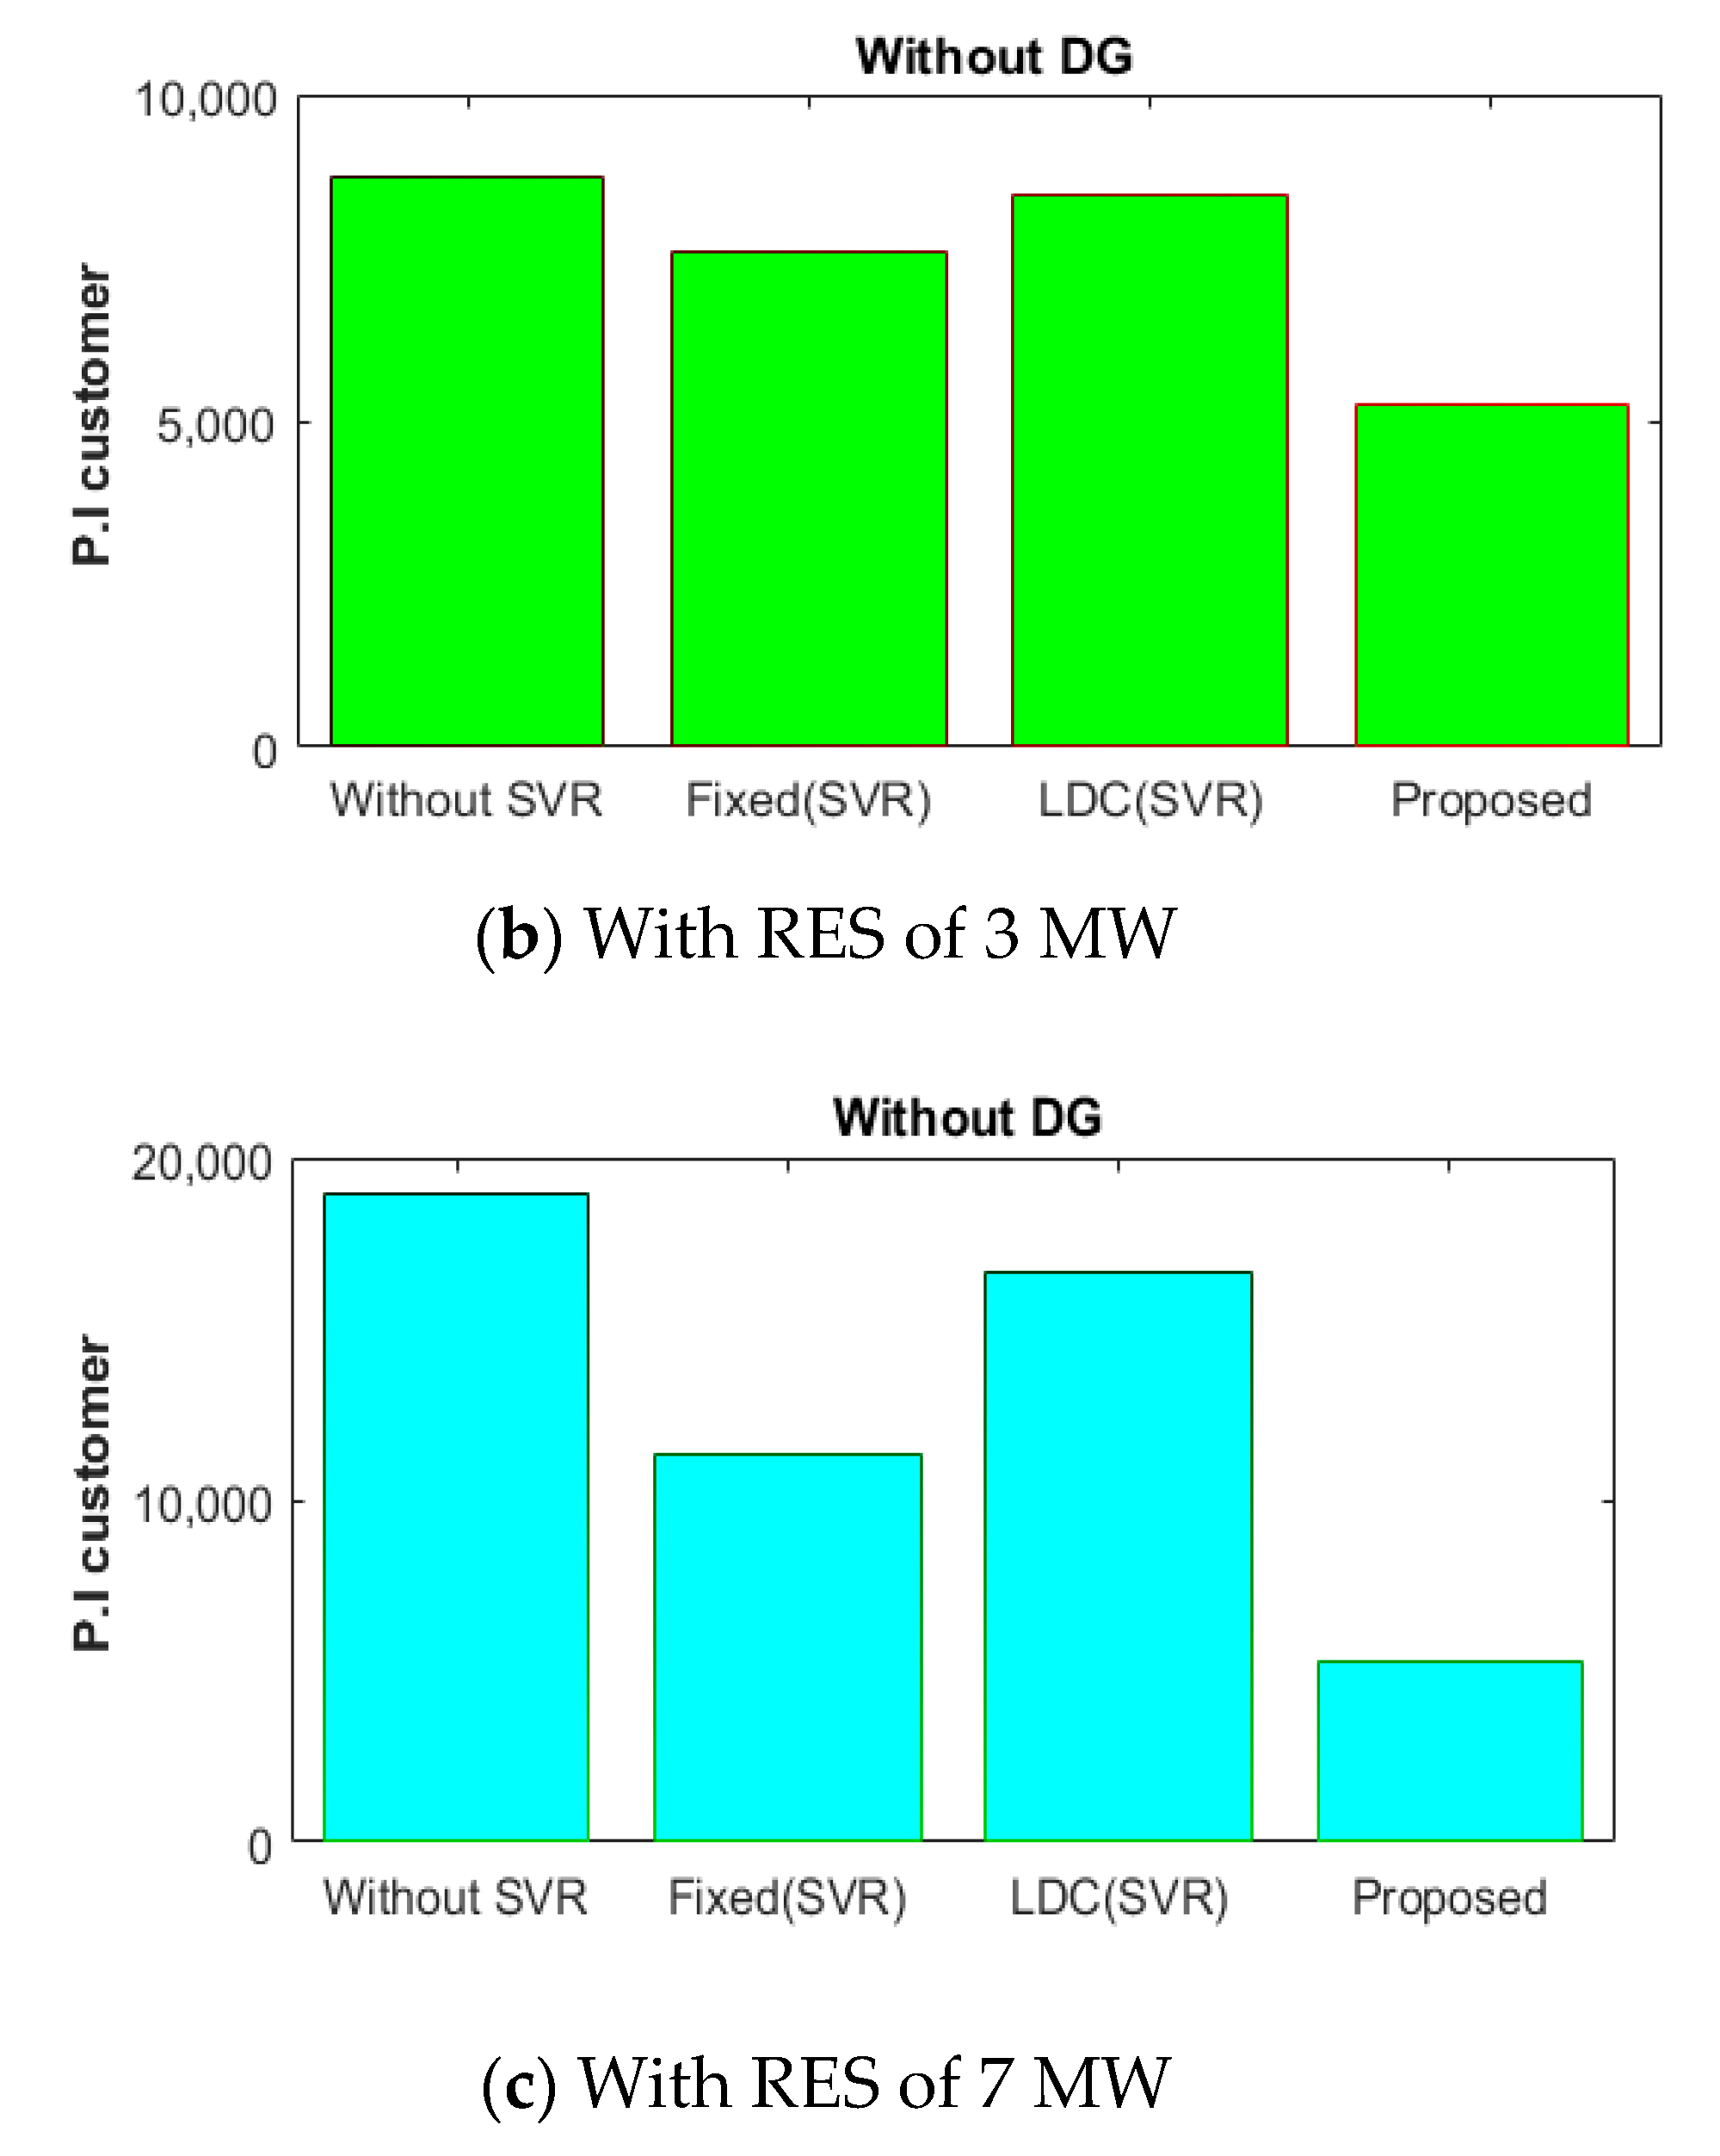
Figure 13 shows the results of the performance index considering the voltage control methods in the distribution system. From Figure 13, Figure 13a means the result of the performance index when the RES is not introduced into feeder 1 of the distribution system. Figure 13b,c show the results of the performance index in case of the RES of 3 MW and 7 MW. From the simulation results of the performance index, it is clear that the proposed coordination control method can improve the voltage distribution even if the introduction of the RES is significantly increased compared to the existing methods.

5. Conclusions

This paper proposes a voltage control method for an SVR by considering the output voltage of the ULTC, which is operated via the line drop compensation (LDC) method, when an RES is introduced into the distribution feeder. For the characteristics of the proposed method, the main results are summarized as follows:
(1)
In order to overcome the limitations of existing voltage control methods for the SVR, this paper proposes a novel voltage control method for the SVR which is adapted to the optimal compensation rate, recalculation value of the measured voltage with the characteristics of the power flow and the output voltage of the ULTC via LDC operation.
(2)
This paper points out the threshold of the exiting voltage control method when an RES is introduced into the distribution system and the proposed voltage control method to overcome such problems. Additionally, the performance of the proposed method is validated by comparing it with case studies of existing methods. Based on the simulation, this paper verified that the proposed voltage control method is a useful tool for operating the SVR by receiving additional voltage control characteristics of the ULTC, which is the control for the output voltage of the MTR.
(3)
From the simulation results of the proposed control method for the SVR by considering the control method of the ULTC, it was clear that the customer voltage could be sustained under reasonable conditions. Meanwhile, the coordinated operation between the SVR and ULTC could solve the over- and under voltage. Therefore, it is confirmed that the proposed method can make the customer voltage of the distribution feeder with the RES keep better voltage conditions.
(4)
Moreover, from the simulation results of the performance index, it is clear that the proposed control method can improve the voltage distribution even if the introduction of the RES is significantly increased compared to the existing methods.

Author Contributions

B.K. and C.-S.K. carried out the modeling, simulations and compiled the manuscript. The literature review and data collection were performed by D.-J.K. and H.-o.L. All authors have read and agreed to the published version of the manuscript.

Funding

This research was funded by the Ministry of Trade, Industry and Energy and supported by the Korea Institute of Energy Technology Evaluation and Planning (No. 20213030160080).

Data Availability Statement

The data presented in this study are available on request from the corresponding author. The data are not publicly available due to for result test using the equipment owned by our institute.

Acknowledgments

This research was funded by the Ministry of Trade, Industry and Energy and supported by the Korea Institute of Energy Technology Evaluation and Planning (KETEP) (No. 20213030160080).

Conflicts of Interest

The authors declare no conflict of interest.

References

  1. Nara, K.; Ishizu, S.; Mishima, Y. Voltage control availability of distributed generators in power distribution system. In Proceedings of the 2005 IEEE Russia Power Tech, St. Petersburg, Russia, 27–30 June 2005; pp. 1–6. [Google Scholar]
  2. Nzimako, O.; Wierckx, R. Modeling and Simulation of a Grid-Integrated Photovoltaic System Using a Real-Time Digital Simulator. IEEE Trans. Ind. Appl. 2016, 53, 1326–1336. [Google Scholar] [CrossRef]
  3. Khazaei, J.; Piyasinghe, L.; Miao, Z. Real-time digital simulation modeling of single-phase PV in RT-LAB. In Proceedings of the PES General Meeting|Conference & Exposition, National Harbor, MD, USA, 27–31 July 2014; pp. 1–5. [Google Scholar]
  4. Caldon, R.; Coppo, M.; Turri, R. Distributed voltage control strategy for LV networks with inverter-interfaced generators. Electr. Power Syst. Res. 2014, 107, 85–92. [Google Scholar] [CrossRef]
  5. Meersman, B.; Renders, B.; Degroote, L.; Vandoorn, T.; Vandevelde, L. Three-phase inverter-connected DG-units and voltage unbalance. Electr. Power Syst. Res. 2011, 81, 899–906. [Google Scholar] [CrossRef]
  6. Einfalt, A.; Kupzog, F.; Brunner, H.; Lugmaier, A. Control strategies for smart Low voltage grids—The project DG DemoNet—Smart LV grid. In Proceedings of the Integration of Renewables into the Distribution Grid, CIRED 2012 Workshop, Lisbon, Portugal, 29–30 May 2012; pp. 1–4. [Google Scholar]
  7. Kechroud, A.; Ribeiro, P.F.; Kling, W.L. Distributed generation support for voltage regulation: An adaptive approach. Electr. Power Syst. Res. 2014, 107, 213–220. [Google Scholar] [CrossRef]
  8. Watanabe, K.; Aoki, U.H.; Sekizaki, S. Determination Method of Optimal Sending Voltage for Voltage Regulation by LRT Control in Distribution System with a Large amount of PVs. In Proceedings of the International Conference on Electrical Engineering, Denpasar, Indonesia, 1–11 July 2012; pp. 20–25. [Google Scholar]
  9. Lee, E.M.; Kim, M.Y.; Rho, D.S.; Sohn, S.W.; Kim, J.E.; Park, C.H. A Study on the Optimal Introduction of Step Voltage Regulator(SVR) in Distribution Feeders. Trans. KIEE 2004, 53A, 610–618. [Google Scholar]
  10. Kersting, W.H. Distribution Feeder Voltage Regulation Control. IEEE Trans. Ind. Appl. 2010, 46, 620–626. [Google Scholar] [CrossRef]
  11. Calovic, M.S. Modeling and Analysis of Under Load Tap Changing Transformer Control Systems. IEEE Trans. Power Appar. Syst. 1984, PAS-103, 1909–1915. [Google Scholar] [CrossRef]
  12. Choi, J.H.; Kim, J.C. Advanced Voltage Regulation Method at the Power Distribution Systems Interconneted with Dispersed Stroage and Generation Systems. IEEE Trans. Power Deliv. 2000, 15, 691–696. [Google Scholar] [CrossRef]
  13. Kojovic, L.A. Modern techniques to study voltage regulator-DG interactions in distribution systems. In Proceedings of the 2008 IEEE/PES Transmission and Distribution Conference and Exposition, Chicago, IL, USA, 21–24 April 2008; IEEE: Piscataway, NJ, USA, 2008; pp. 1–6. [Google Scholar]
  14. Kojovic, L.A. Coordination of distributed generation and step voltage regulator operations for improved distribution system voltage regulation. In Proceedings of the 2006 IEEE Power Engineering Society General Meeting, Montreal, QC, Canada, 18–22 June 2006. [Google Scholar]
  15. Sugimoto, J.; Yokoyama, R.; Fujita, G.; Fukuyama, Y. Cooperative Allocation of SVR and SVC for Voltage Fluctuation in Case of Connecting Distributed Generators. IEEJ Trans. Power Energy 2006, 126, 1191–1198. [Google Scholar] [CrossRef]
  16. Kim, J.-B.; Lee, M.G.; Lee, J.H.; Ryu, J.C.; Choi, T.S.; Park, M.S.; Kim, J.E. Control Method of Step Voltage Regulator on Distribution Lines with Distributed Generation. Energies 2022, 15, 9579. [Google Scholar] [CrossRef]
  17. MKim, Y.; Rho, D.S.; Oh, Y.T.; An, J.Y.; Kim, J.E.; Kim, E.S. A Study on the Optimal Voltage Regulation in Distribution Systems with Dispersed Generation Systems. Trans. KIEE 2005, 54A, 251–258. [Google Scholar]
  18. Kim, B.; Rho, D.S. Optimal voltage regulation method for distribution systems with distributed generation systems using the artificial neural networks. J. Electr. Electron. Eng. 2013, 8, 712–718. [Google Scholar] [CrossRef]
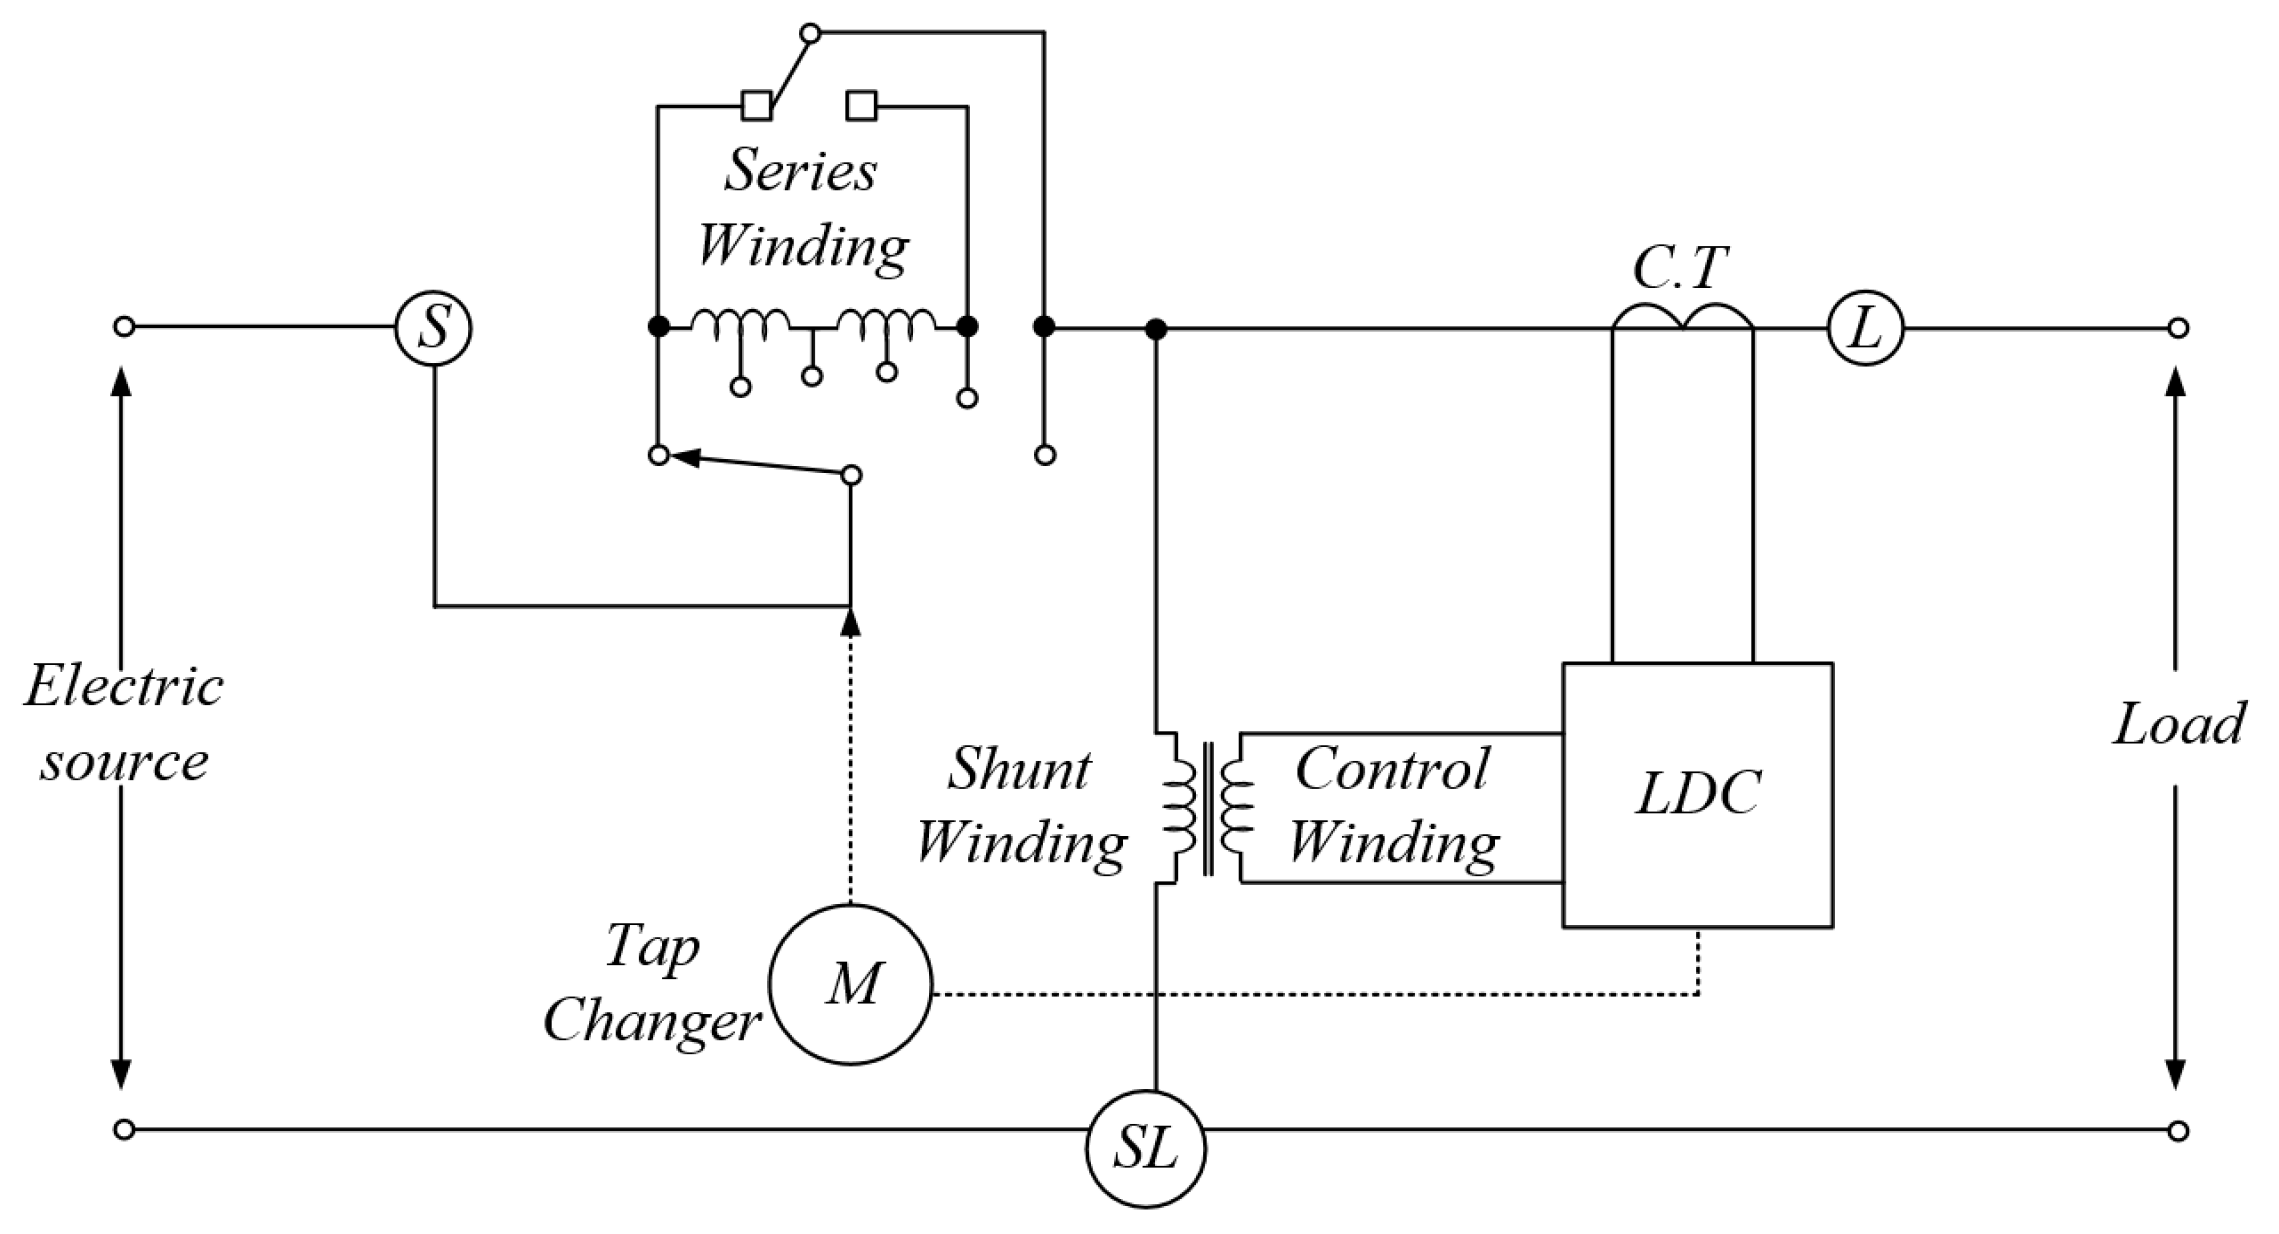
Figure 1. Operational concept of the LDC method for the SVR.
Energies 16 06039 g001
Figure 2. Distribution characteristics of the optimal sending voltage.
Energies 16 06039 g002
Figure 3. Concept of SVR voltage control using the LDC.
Energies 16 06039 g003
Figure 4. Block diagram of the conventional SVR control system.
Energies 16 06039 g004
Figure 5. Concept of the proposed SVR voltage control method considering the secondary voltage of the MTR.
Energies 16 06039 g005
Figure 6. Block diagram of the proposed SVR control system.
Energies 16 06039 g006
Figure 7. Flowchart of the proposed control method.
Energies 16 06039 g007
Figure 8. Communication architecture between the SVR and ULTC.
Energies 16 06039 g008
Figure 9. Configuration of the distribution system.
Energies 16 06039 g009
Figure 10. Customer voltage characteristics according to the voltage control method (without an RES).
Energies 16 06039 g010aEnergies 16 06039 g010b
Figure 11. Customer voltage characteristics according to the voltage control method (with an RES of 3 MW).
Energies 16 06039 g011
Figure 12. Customer voltage characteristics according to the voltage control method (with an RES of 7 MW).
Energies 16 06039 g012aEnergies 16 06039 g012b
Figure 13. The comparison of the performance index according to the capacity of the RES.
Energies 16 06039 g013aEnergies 16 06039 g013b
Table 1. Comparison between previous papers and the present paper.
Contents
Characteristics of Previous PapersCharacteristics of Present Paper
  • A method to determine the installation site and tap position of an SVR in consideration of the reverse power flow of the RES.
  • SVR tap-changing algorithm to solve the problem, considering the line load conditions and reverse power flow.
  • A method for cooperative control using an SVR and SVC has been only proposed to solve the voltage problem caused by distributed power.
  • Presenting a voltage control method for an SVR by considering the voltage control characteristics (LDC method) of the ULTC, which is the control for the output voltage of the MTR.
  • From the proposed control method for an SVR by considering the control method of the ULTC, it was clear that the customer voltage could be sustained in reasonable conditions. Meanwhile, the coordinated operation between the SVR and ULTC could solve the over- and under voltage.
Table 2. Simulation data.
Feeder
Number
Section
Number
ImpedanceLength
(km)
Power
Factor
Load (MW)
Ratio
RES, SVR
Location
R (Ω/km)X (Ω/km)
110.1820.39130.90.5 MVA (5%)-
120.1820.39120.90.5 MVA (5%)-
130.1820.39170.90.5 MVA (5%)SVR
140.1820.39160.90.5 MVA (5%)-
150.1820.39160.90.5 MVA (5%)RES
260.1820.39140.91.5 MVA (15%)-
270.1820.39140.91 MVA (10%)-
380.1820.39130.91 MVA (10%)-
390.1820.39150.91.5 MVA (15%)-
4100.1820.39120.90.5 MVA (5%)-
4100.1820.39120.91 MVA (10%)-
4110.1820.39150.91 MVA (10%)-
Table 3. Parameters of the distribution system.
ClassificationContentsValue
Main TransformerBank capacity45/60 [MVA]
Nominal voltage22.9 [kV]
% impedance of MTR0.0042 + j0.15 [p.u]
Rated capacity45/60 [MVA]
Number of taps17 taps
Range of voltage control±10 [%]
db (dead band)0.0125 [p.u]
Equivalent impedance Z e q 0.074 + j0.035 [p.u]
Load center voltage V c e 0.97 [p.u]
SVRRated capacity ( 3 )9000 [kVA]
Total number of tabs32 taps
Range of voltage control±10 [%]
db (dead band)0.00625 [p.u]
Equivalent impedance Z e q 0.088 + j0.043 [p.u]
Load center voltage V c e 0.97 [p.u]
Disclaimer/Publisher’s Note: The statements, opinions and data contained in all publications are solely those of the individual author(s) and contributor(s) and not of MDPI and/or the editor(s). MDPI and/or the editor(s) disclaim responsibility for any injury to people or property resulting from any ideas, methods, instructions or products referred to in the content.