1. Introduction
Renewable energy sources have been increasing in recent years, with emphasis on wind power. According to the Global Wind Report [
1], there is currently a total installed wind capacity of 837 GW worldwide (onshore and offshore), and global wind power could reach 2000 GW by 2030 and provide from 17 to 19 percent of global electricity.
Despite the promise of growth, due to the intermittent nature of the wind, the massive insertion of wind farms in the electrical power system (EPS) is still difficult. The unpredictability and uncertainties in power production have led planners and power operators to control the amount of wind power penetration to the detriment of other, more traditional dispatchable sources.
One of the problems associated with wind intermittency is power fluctuations that can, in specific situations, also cause frequency and voltage variations, which may then compromise the stability and reliability of the electrical system. Additionally, due to the cubic relationship between electrical power and wind speed, even rapid, small reductions in wind speed, such as during calm moments, can cause, in minutes, significant variations in the instantaneous production of generation.
In order to mitigate the issues generated by the intermittency of the wind source, the following solutions can be applied: (1) use of flexible generating centers with fast response; (2) increase interconnections with neighboring regions; (3) application of Demand Side Management; (4) use of Energy Storage Systems (ESS). Among the solutions presented, the easiest, and therefore most promising, is the use of ESS due to the wide range of options and high flexibility of applications to the electrical system.
Paper Structure
In the context of proposing a power smoothing strategy, this article proposes a management strategy embedded in the energy management system (EMS) that controls the active power dispatched by the battery with the objective of mitigating the power fluctuations of the wind farm by making use of fuzzy logic. Such control logic here is called Power Smoothing Fuzzy Control Strategy: PSFCS.
This work is organized as follows:
Section 2 presents a brief review of active power smoothing techniques;
Section 3 offers an overview of battery modeling in applications considering the presence of wind powerplants.
Section 4 describes the methodologies used to build the fuzzy model. In
Section 5, the numerical results and the assessment of the performance of the control logic (PSFCS method) are presented.
Section 6 presents the conclusions.
2. Active Power Smoothing Strategies for Wind Power Generation
Wind power generation has rapidly emerged as a viable alternative to conventional energy sources due to its environmental and economic advantages. However, wind energy is inherently intermittent and fluctuating, which can negatively affect the stability and dispatch of energy to the grid. Active power smoothing strategies play a crucial role in mitigating these issues and optimizing the performance of wind power systems.
Despite its potential, the intermittent nature of wind presents challenges in ensuring grid stability and power quality. Active power smoothing strategies help to address these challenges by regulating and stabilizing the power output from wind power generation systems.
A brief overview of wind power generation systems, including horizontal-axis wind turbines (HAWTs), vertical-axis wind turbines (VAWTs), and wind farms is provided in [
2].
Active Power Smoothing Strategies are broadly classified into three categories: (i) generator-side control strategies, (ii) grid-side control strategies, and (iii) energy storage-based strategies. Generator-side Control Strategies include techniques such as pitch angle control, torque control [
3], and maximum power point tracking (MPPT) [
4]. Each strategy is suitable for specific types of wind turbines and has different impacts on the overall system performance.
Grid-side control strategies include reactive power control [
5,
6,
7], voltage control [
8], and current control [
9,
10]. The role of power electronic converters, such as inverters and rectifiers, in implementing these strategies is discussed in [
11]. An overview of grid side control strategies is presented in [
12].
Energy Storage-based Strategies, including batteries, supercapacitors, and flywheels, are presented to actively smooth the power output from power systems [
13]. Analyses of a battery energy storage system (BESS) connected to a wind farm is presented in [
14] and [
15].
Each power smoothing strategy has advantages and limitations, considering factors such as cost, reliability, efficiency, and environmental impact. Power smoothing control strategies using energy storage are presented in [
16]. Reference [
17] proposed a fuzzy logic controller for solar power smoothing based on controlled battery energy storage and varying low pass filter. A fuzzy-logic-based control strategy for power smoothing in high-wind penetrated power systems, and its validation in a microgrid lab is descried in [
18]. In this paper, a fuzzy logic controller is proposed considering power measurements from an actual wind farm for active power smoothing using a Li-ion Battery Energy Storage System (BESS).
Since battery storage technologies are versatile, one main advantage of Energy Storage System (ESS) techniques for power smoothing is their compatibility with different wind power systems. The following section presents the general idea of using a battery system for power smoothing.
3. Battery Energy Storage System for Wind Generation Power Smoothing
Considering the available ESS technologies, the BESS (Battery Energy Storage System) type storage systems based on lithium-ion cells have gained prominence in recent years, showing significant growth applied in electrical power systems. This is essentially due to their high versatility in power applications and constant reductions in production costs (associated with an increase in the use of electric cars) [
19,
20]. Among the storage technologies that use electrochemical cells, Li-ion batteries have been the dominant choice in numerous applications that demand high energy density, higher capacity, better safety, improved performance, and lower costs [
21]. In this article, the term BESS refers to a storage system using lithium-ion battery cells.
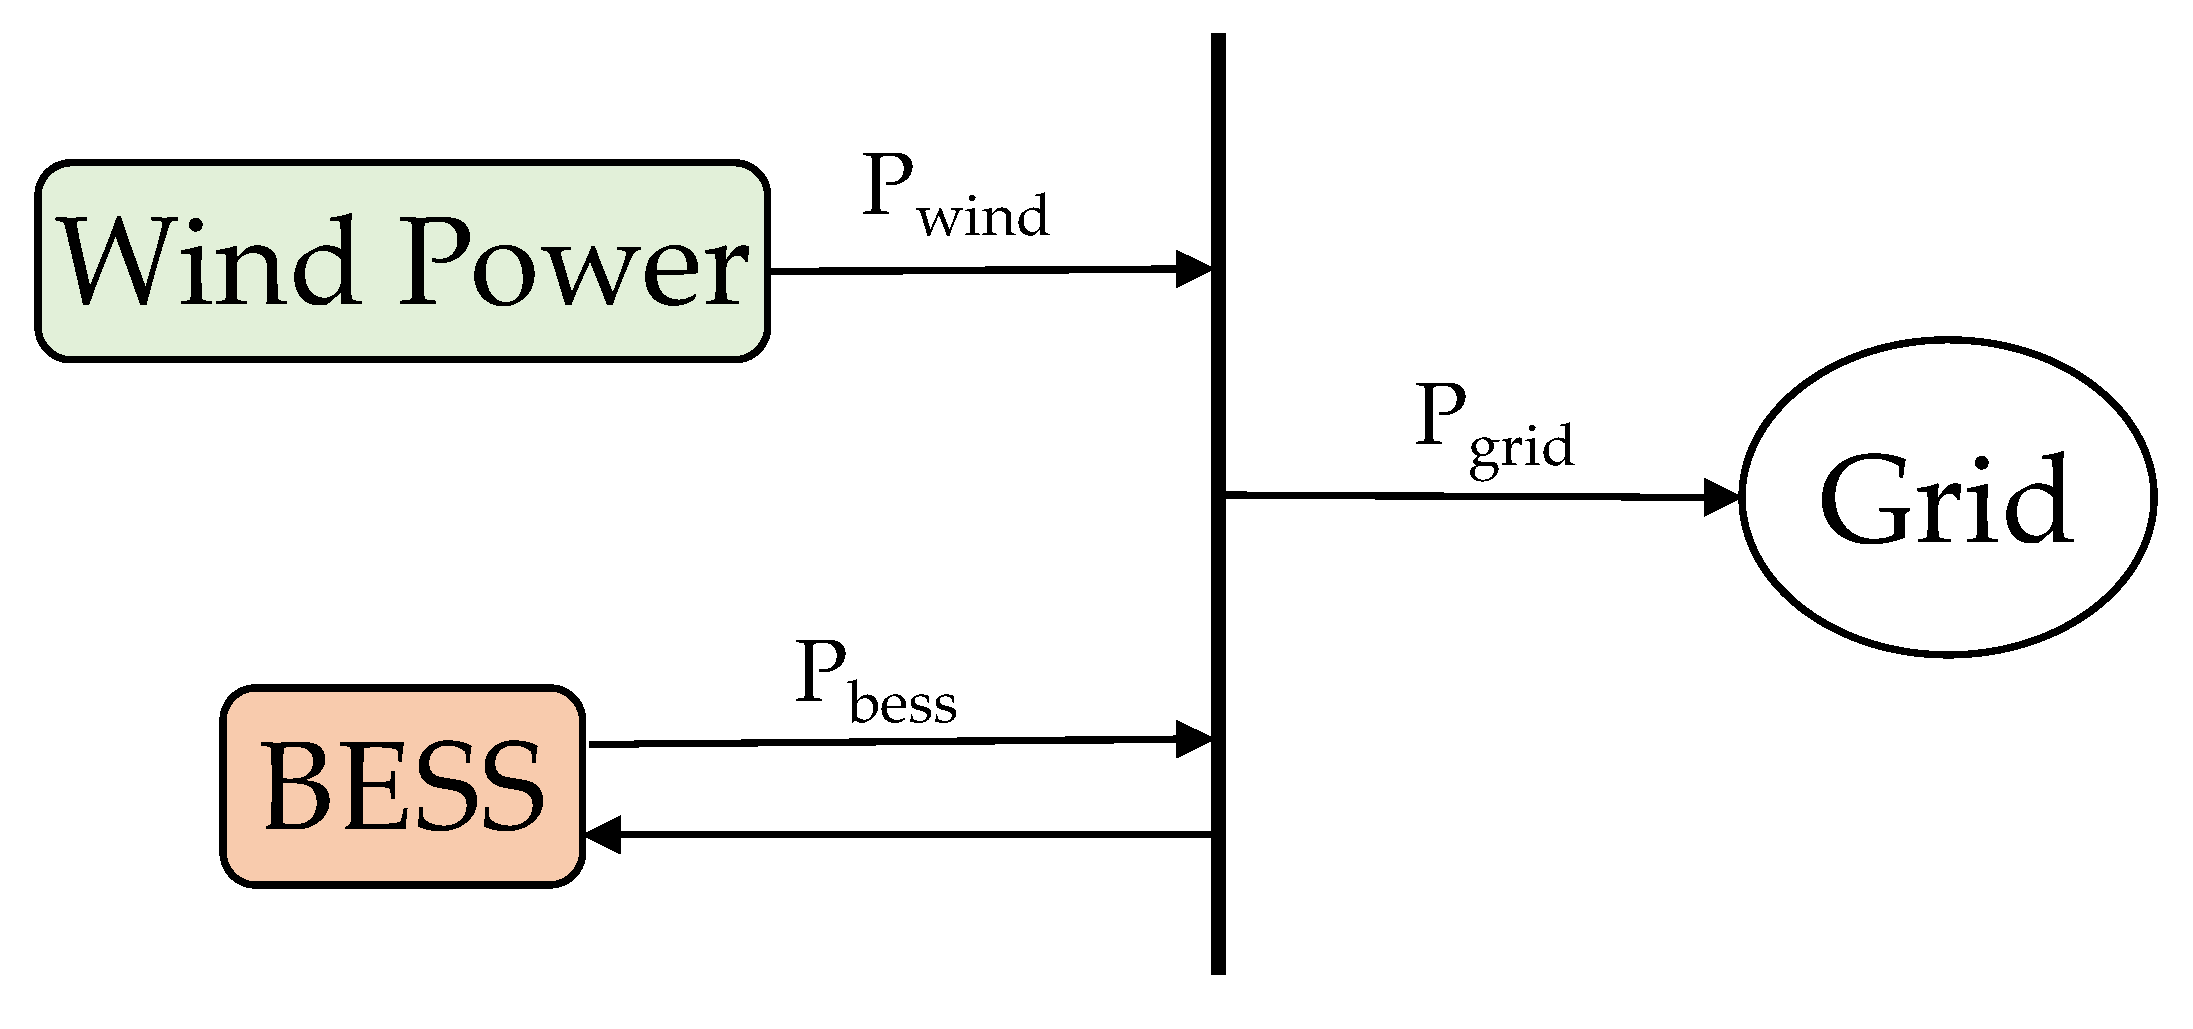
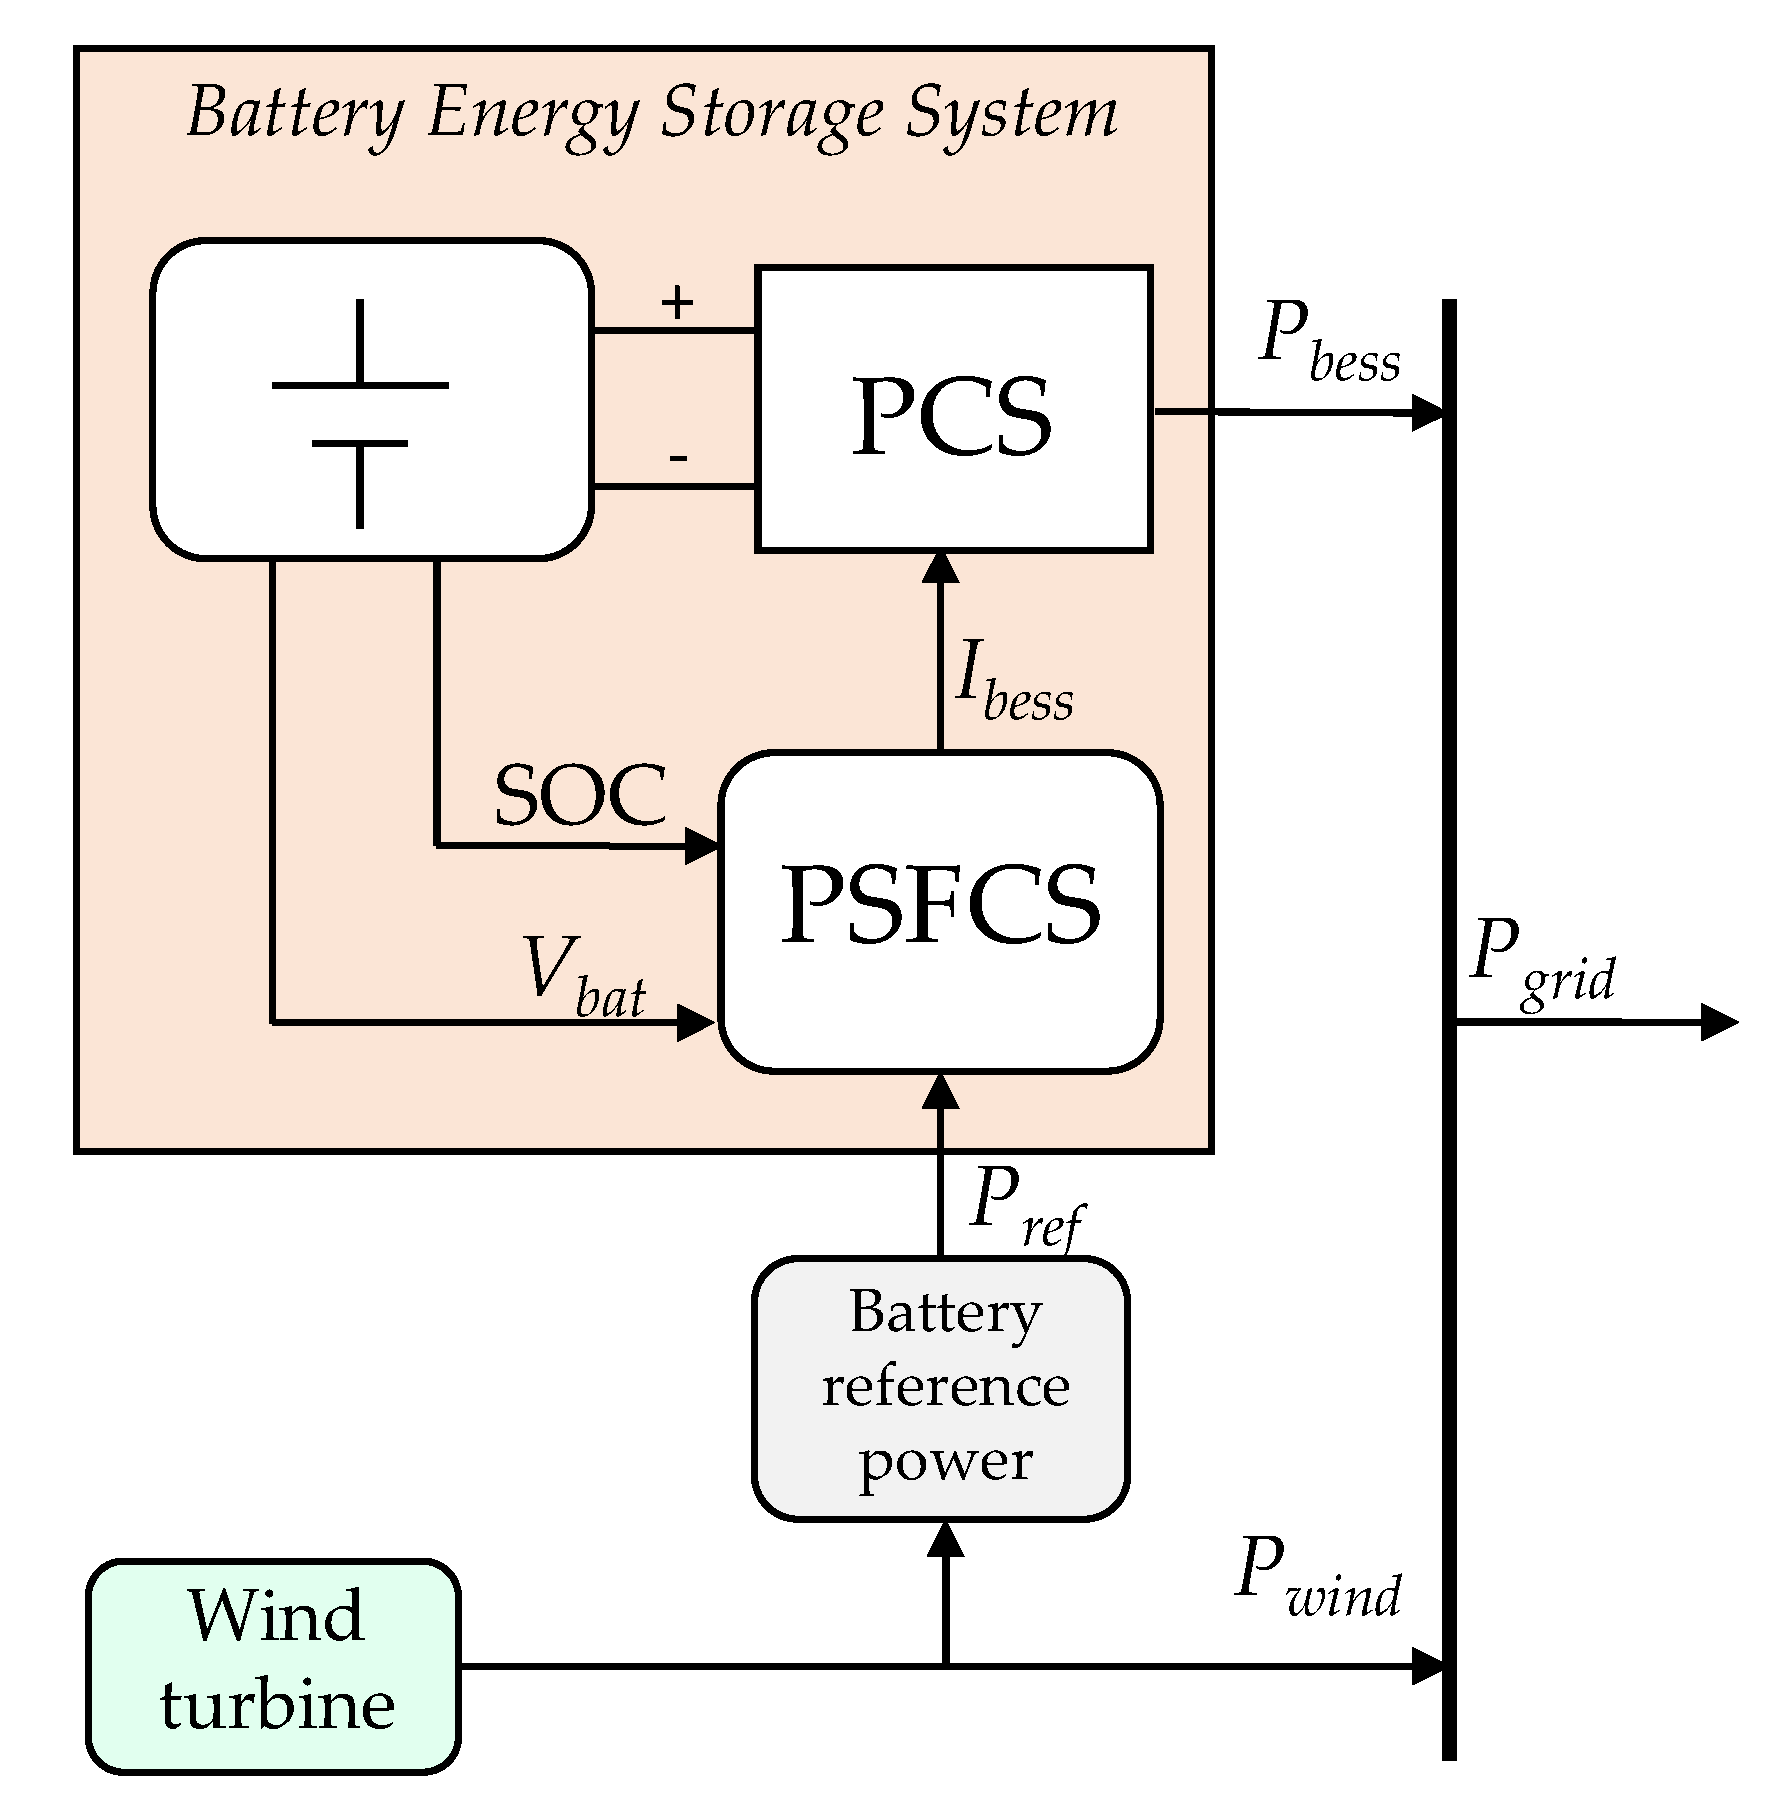
In order to reduce the power fluctuations of a wind power plant, with the objective of obtaining a more stable power output (with less variability) at the Point of Common Coupling (or at the Point of Interconnection—PoI), a BESS can be applied for power smoothing by providing or draining supplemental power, as illustrated in
Figure 1.
In the configuration illustrated in
Figure 1, the total power delivered to the grid in each interval is equivalent to the sum of the active powers of the wind source and the BESS (Equation (1)). The strategy to mitigate power variations through the BESS is to use the energy storage system to compensate for the fluctuations by injecting active power into the bus at times of reduced wind speed and absorbing active power during peak wind production. BESS also operates during quick ramp ups of instantaneous wind power variations, or when the plant is producing excess generation.
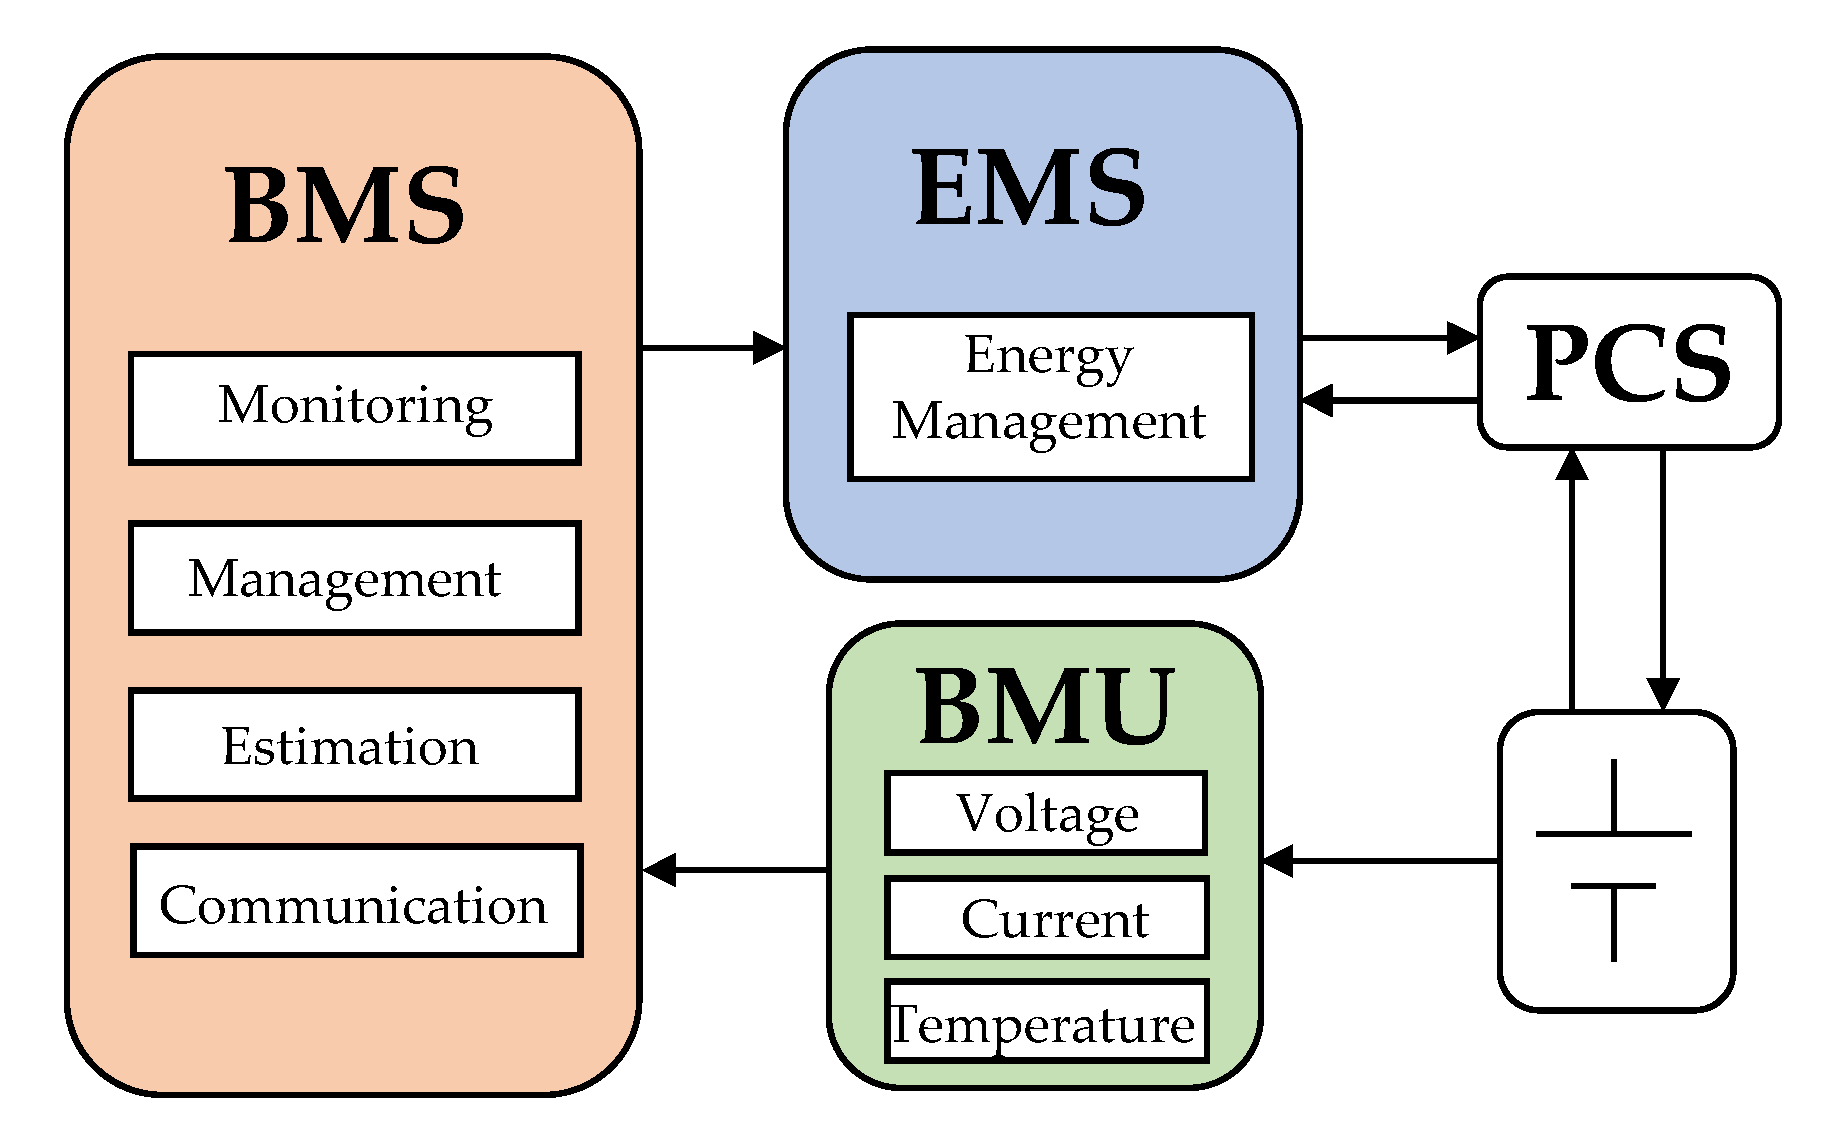
The battery energy storage system is responsible for injection and absorption of power, thereby determining the output power. Generally, it can be stated that the controllers in the BESS are divided into four main parts (as illustrated in
Figure 2): (i) Battery Monitoring Unity (BMU), which is composed of sensors that measure magnitudes inherent to the battery, such as voltage, current, and temperature; (ii) Energy Management System (EMS), which focuses on the overall energy management and optimization of the battery; (iii) Power Conversion System (PCS), which consists of a bidirectional power converter responsible for DC/AC and AC/DC conversion and connection to the main grid; and (iv) Battery Management System (BMS), which is responsible for a range of applications grouped into four main areas: monitoring, management, estimation, and communication.
Regarding the BMS main roles, a brief description of each can be made. Monitoring is where the BMS observes parameters like cell voltage, current, temperature to ensure safe and efficient battery operation. In management, the BMS is able to manage energy, cell balancing and temperature in order to keep them at acceptable operational levels. It also performs overcharge/over discharge protection and fault detection. With estimation, the BMS estimates State of Charge (SOC), State of Health (SOH), internal resistance and current capacity. During communication, the BMS manages communication with other equipment.
4. Power Smoothing Fuzzy Control Strategy
In order to understand the Power Smoothing Fuzzy Control Strategy, this section presents the methodology used.
Figure 3 presents a major view of the structure of the strategy applied.
It is important to denote that the battery and the PCS in
Figure 3, for the purpose of the simulation and validations of the proposed strategy, are considered ideal, i.e., there is no time delay and no loss. At this moment, this can be considered a reasonable argument when compared to the time constants from the wind variations in the seconds range [
22], and the losses of power converters compared to the MW-sized wind farms are neglectable [
23].
In order to investigate the Control Strategy, the application is implemented in Matlab/Simulink® (The MathWorks Inc., Natick, MA, USA), where the wind farm and the BESS were modelled as well as the control strategy acting in the EMS.
The main components of the test model are as follows: Wind Farm Block, a block that simulates the power fluctuation from a wind farm measured or simulated based on actual data; Battery block, which contains a general battery model for lithium-ion chemistry; Battery Power Reference Block, which sets the power output from the battery; and finally, the Power Smoothing Fuzzy Control. Each one of the components is explained as follows.
4.1. Wind Farm Power Block
The wind farm power block is modelled by time series collected from five wind turbines of 2.1 MW double feed type installed in the Rio Grande do Norte, Brazil. The time series were collected from the SCADA system in the wind farm during 2 years with a sampling rate of 5 min. For the sake of simplicity, this paper uses measurements in the increment of 1 month.
The wind farm is located in one of the windiest area in Brazil. It has average annual wind speed of 8.6 m/s with Weibull scale factor of 4.3 [
24] (representing a consistent wind speed). A wind speed atlas illustrating the state of Rio Grande do Norte is shown in
Figure 4, with the highlighted wind farm and associated power substation.
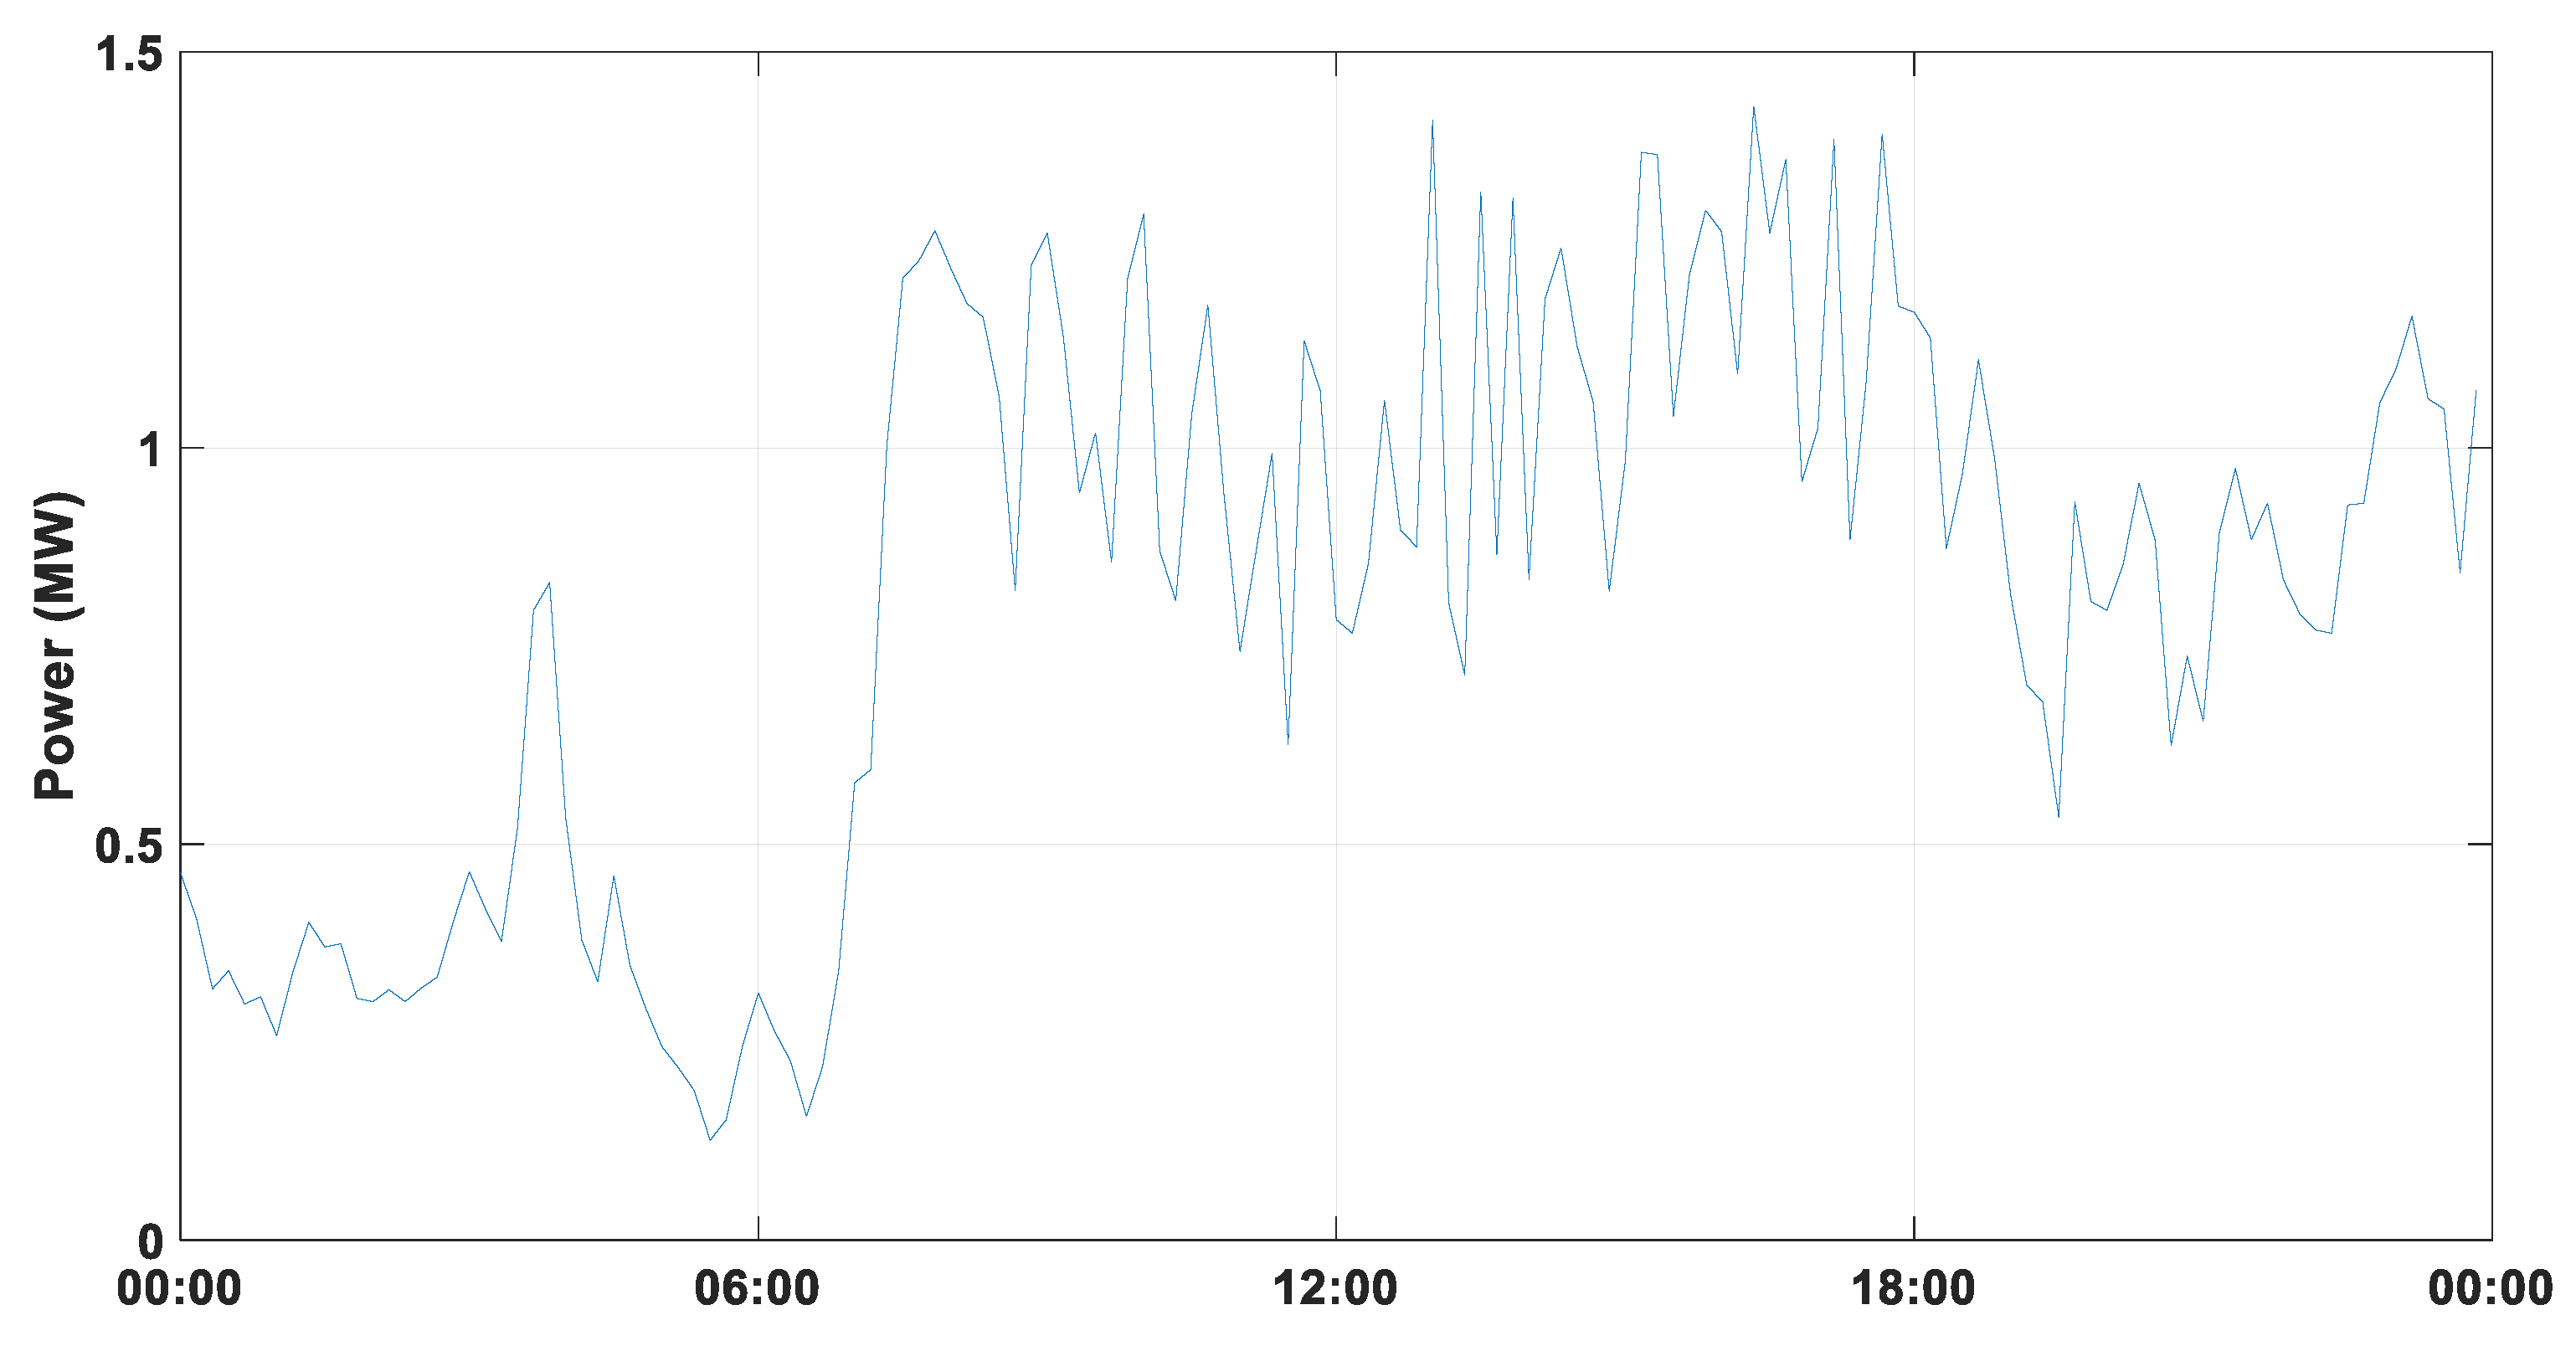
Although the local area has a consistent wind speed, the measurements showed the impacts of the sun, which created some turbulence during the solar hours, leading to more unstable power production from 6 to 18 h, as illustrated in
Figure 5.
4.2. Battery Model
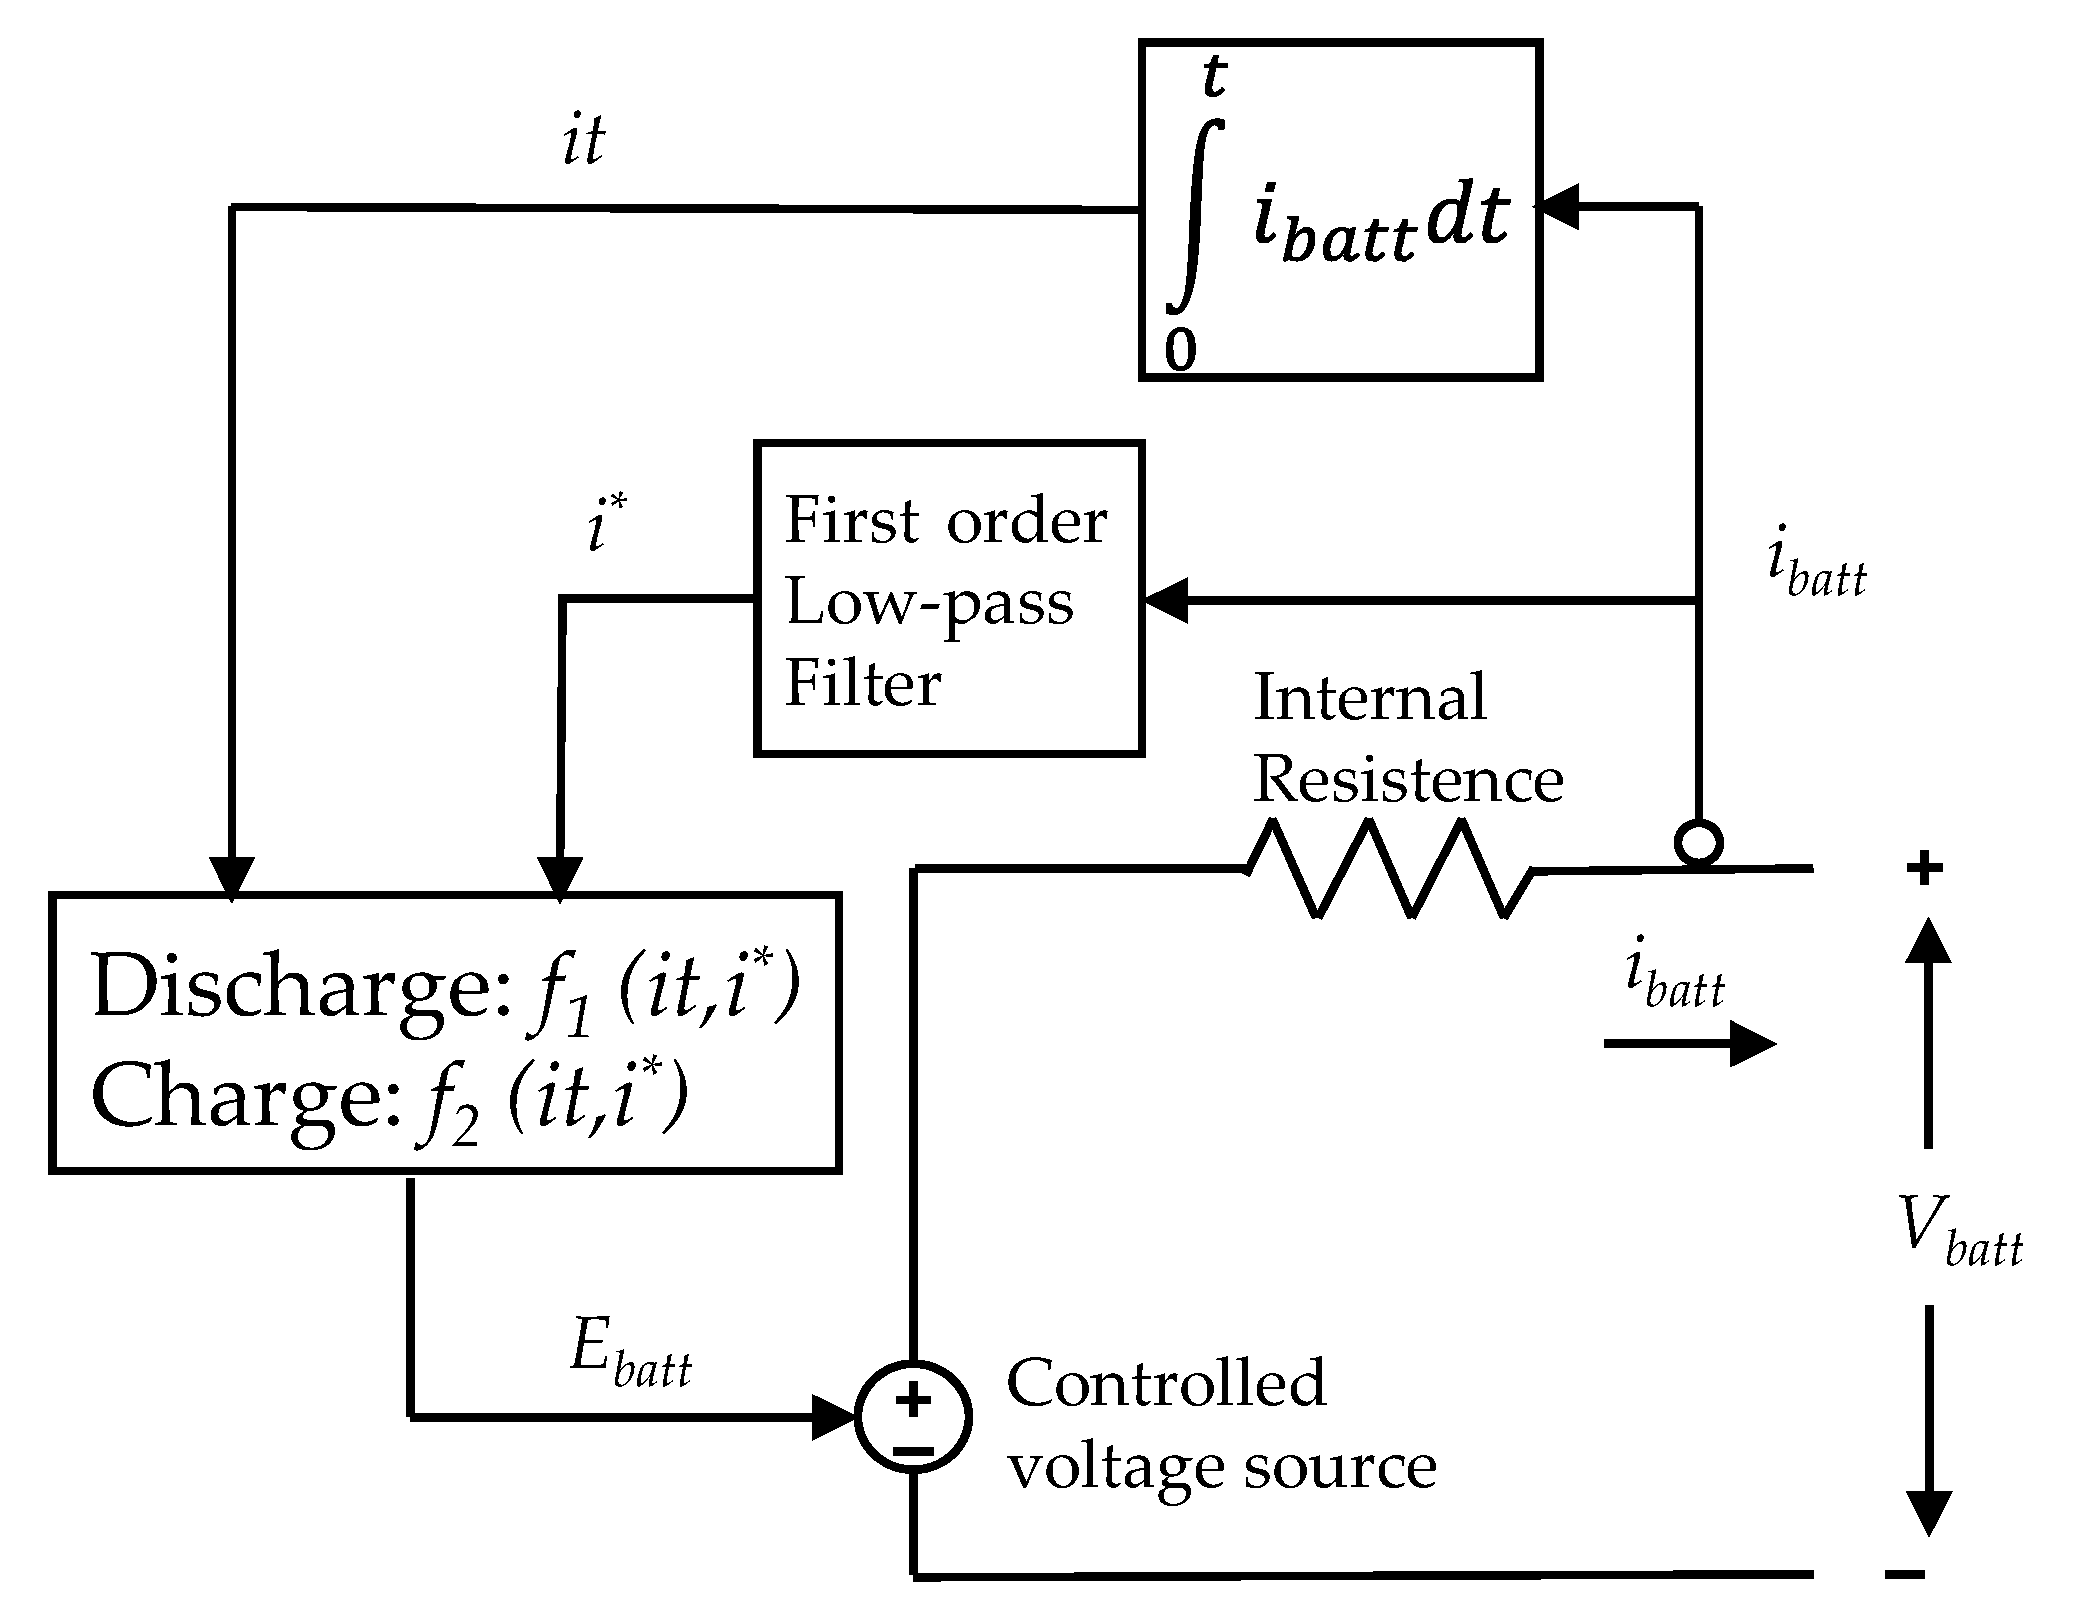
The model presented in this article, also known as the generic battery model, was proposed by Trambley in [
25,
26]. Such a model is capable of dynamically representing a battery, making it possible to reproduce non-linear behaviors, such as typical charge and discharge curve and recovery effect. In addition, the model can be parameterized with only information about the discharge curve which is normally provided by manufacturers. The model was originally conceived to simulate batteries with Li-ion, NiMH, NiCD, and lead acid chemistries. The model is implemented in Simulink, and its schematic diagram can be seen in
Figure 6.
The model has a constant internal resistance and a controlled voltage source controlled by an equation that describes the dynamic behavior of the battery and takes into account the OCV-
SOC ratio (open circuit voltage and state of charge) and the polarization voltage. The strategy proposed in this paper is applied to a lithium-ion battery energy storage system. The dynamic behavior of the batteries is described by Equations (2)–(4) [
25]:
where
E0 is the constant voltage in volts (V);
Ibatt is battery current in ampere (A);
it is the current charge of the battery in ampere-hours (Ah);
i* is the filtered current (through a low-pass filter) passing through the polarization resistance and is given in amperes (A);
R is the internal resistance of the battery in ohms (Ω).
Q is the nominal capacity of the battery in ampere-hours (Ah);
A is the exponential zone amplitude in volts (V);
B is the exponential zone time constant inverse (Ah-1);
K is the polarization constant given in volts per amper-hour (V/Ah) or polarization resistance (Ω).
During the charge and discharge, the term refers to the polarization voltage of the accumulator, while the polarization resistance is represented as during the charge and as during the discharge.
The function
refers to the hysteresis phenomenon that occurs between charging and discharging batteries with lead acid, NiMH, or NiCD chemistry, and there is no need to use it in a model and lithium-ions [
25].
The A, B, and K parameters can be determined according to [
26] and require only information that can be located on the manufacturer’s datasheet.
Another important parameter to define is the State of Charge from the battery (SOC). This parameter is relevant because it expresses the amount of energy available in the battery as well as the amount that is possible to absorb from the power system in the power smoothing concept. The SOC is measured in % of the total energy available in the battery, ranging from 0%, i.e., absolutely depleted, to 100% when fully charged.
The fuzzy controller needs this parameter to define the operation for charging or discharging in the power smooth control respecting the safe operational limits for the battery to avoid running on overcharge or excessive wearing under a low charge state.
In this paper, the Coulomb counting method is used to estimate the
SOC, which is defined as follows.
As previously stated, there are
SOC limits applied to the storage device in order protect it. The upper and lower limits prevent overloading or complete discharge operations that lead to high wear on lithium batteries that compromise their lifespan. Although the Li-ion battery cells can operate from 0 to 100% of their
SOC, using the total capacity will rapidly reduce the elements’ lifetime as well as the battery’s State of Health (SOH) [
13]. Thus, the battery
SOC is maintained from 20% (
SOCmin—lower limit) to 80% (
SOCmax—upper limit).
4.3. Reference Power (Setpoint)
The reference power (
Pref) is the set point for the control system for the active power behavior for the BESS in order to compensate for the wind power fluctuations in PoI, which can be defined as:
where
Pwind is the instantaneous active power and
Pwindpred is the short term predicted wind power for the next time interval. When
Pref is positive, it means that the battery is in the discharging mode (suppling power to the local network), and when negative, it means the battery is charging (draining power from the local network).
The reference power relies on short-term predicted wind power. The short term here applies to a time from 1 to 10 min, where the wind power fluctuations have great impacts on local power network (voltage quality), according to [
27,
28].
The short-term prediction tool used in this research was the moving average applied with the persistence model for the wind power time series. The persistence model assumes that the future values of a time series will be the same as the most recent observed value and is defined in Equation (7):
The moving average method uses a simple arithmetic average of wind power over a timespan. This is commonly used in the financial market to remove some random and short fluctuations. The key aspect is to define a window that can be used for averaging which does not compromise some important fluctuation. The moving average applied for
Pwindpred is shown in Equation (8):
where
n is the window size (i.e., the number of elements used to average), while
i is the element position in the vectorized time series. The time series of the active power produced by the wind farm were composed of a time sample of 5 min, and for the analyses, the moving average was used for hourly averages.
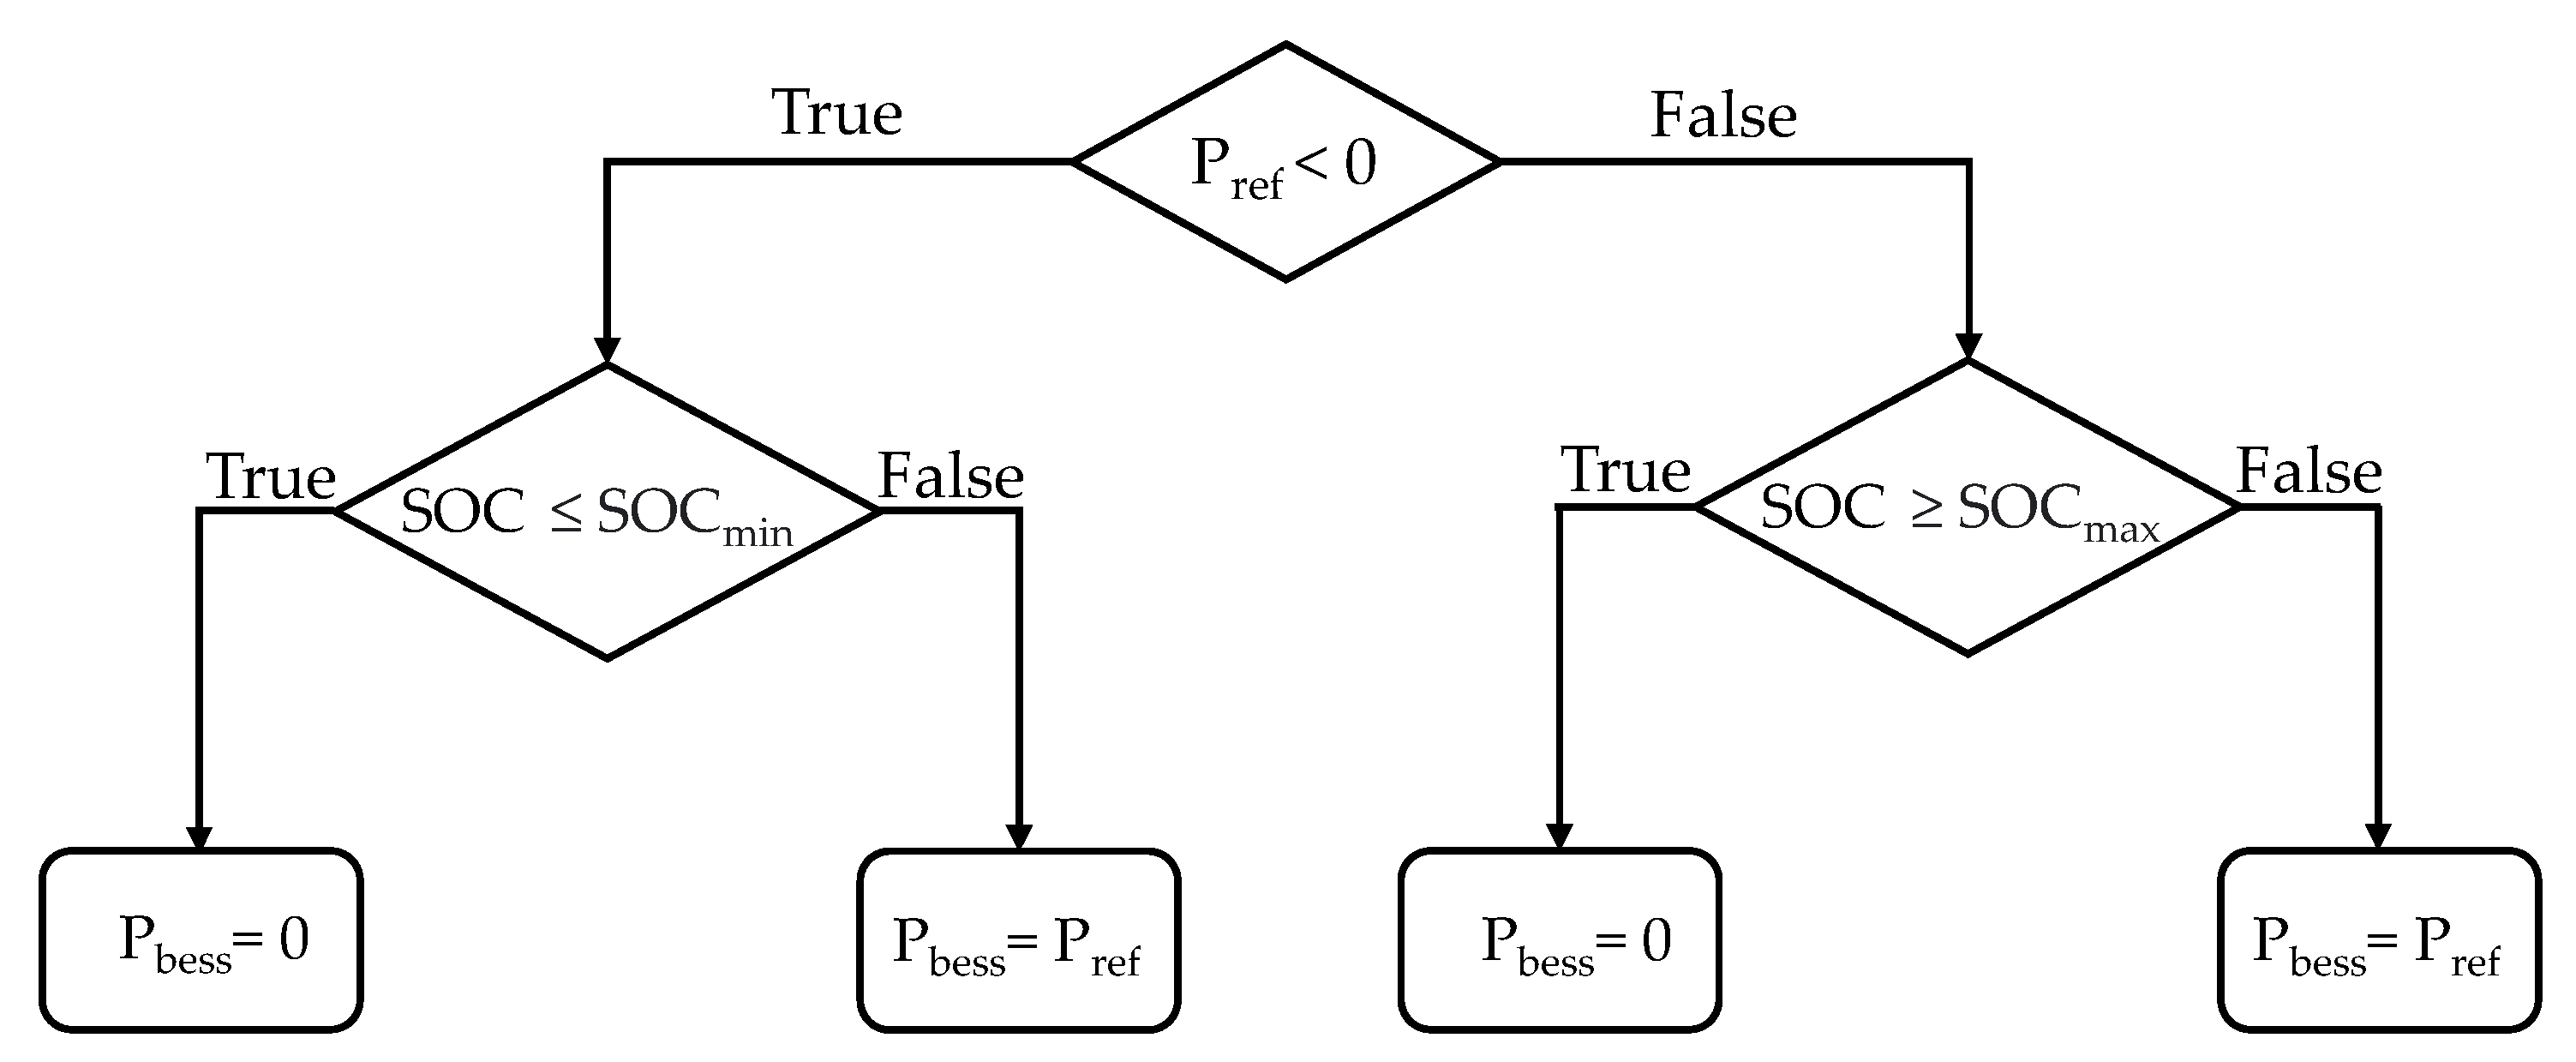
4.4. Dispatch Fuzzy Controller
The dispatch fuzzy controller is based on a rule-based controller [
29]. The control is used for power smoothing and only needs information about the
SOC level and reference power. The flowchart in
Figure 7 illustrates how this control logic works.
The rules ensure that the wind power is smoothed by the BESS operation by following the reference power while respecting the upper and lower limits for the SOC. Without this, no power will be delivered by the BESS, and in this case, the power at the PoI is exclusively produced by the wind farm.
The rules also guarantee that BESS only charges or discharges, and only if, for some reason, the SOC is not within the imposed limits. The BESS is only charged by the wind energy when the SOC is equal to or below its inferior limit and is only discharged when the SOC is equal to or above its upper limit. This situation remains until the SOC is between the operational limits.
Since the
SOC is kept within the operational limits while following the reference power, the charge or discharge current can be defined through Equation (9). In this case,
Ibess is limited by the maximum and minimum discharge current of the BESS, which can be calculated by considering the rated voltage and rated power of the BESS.
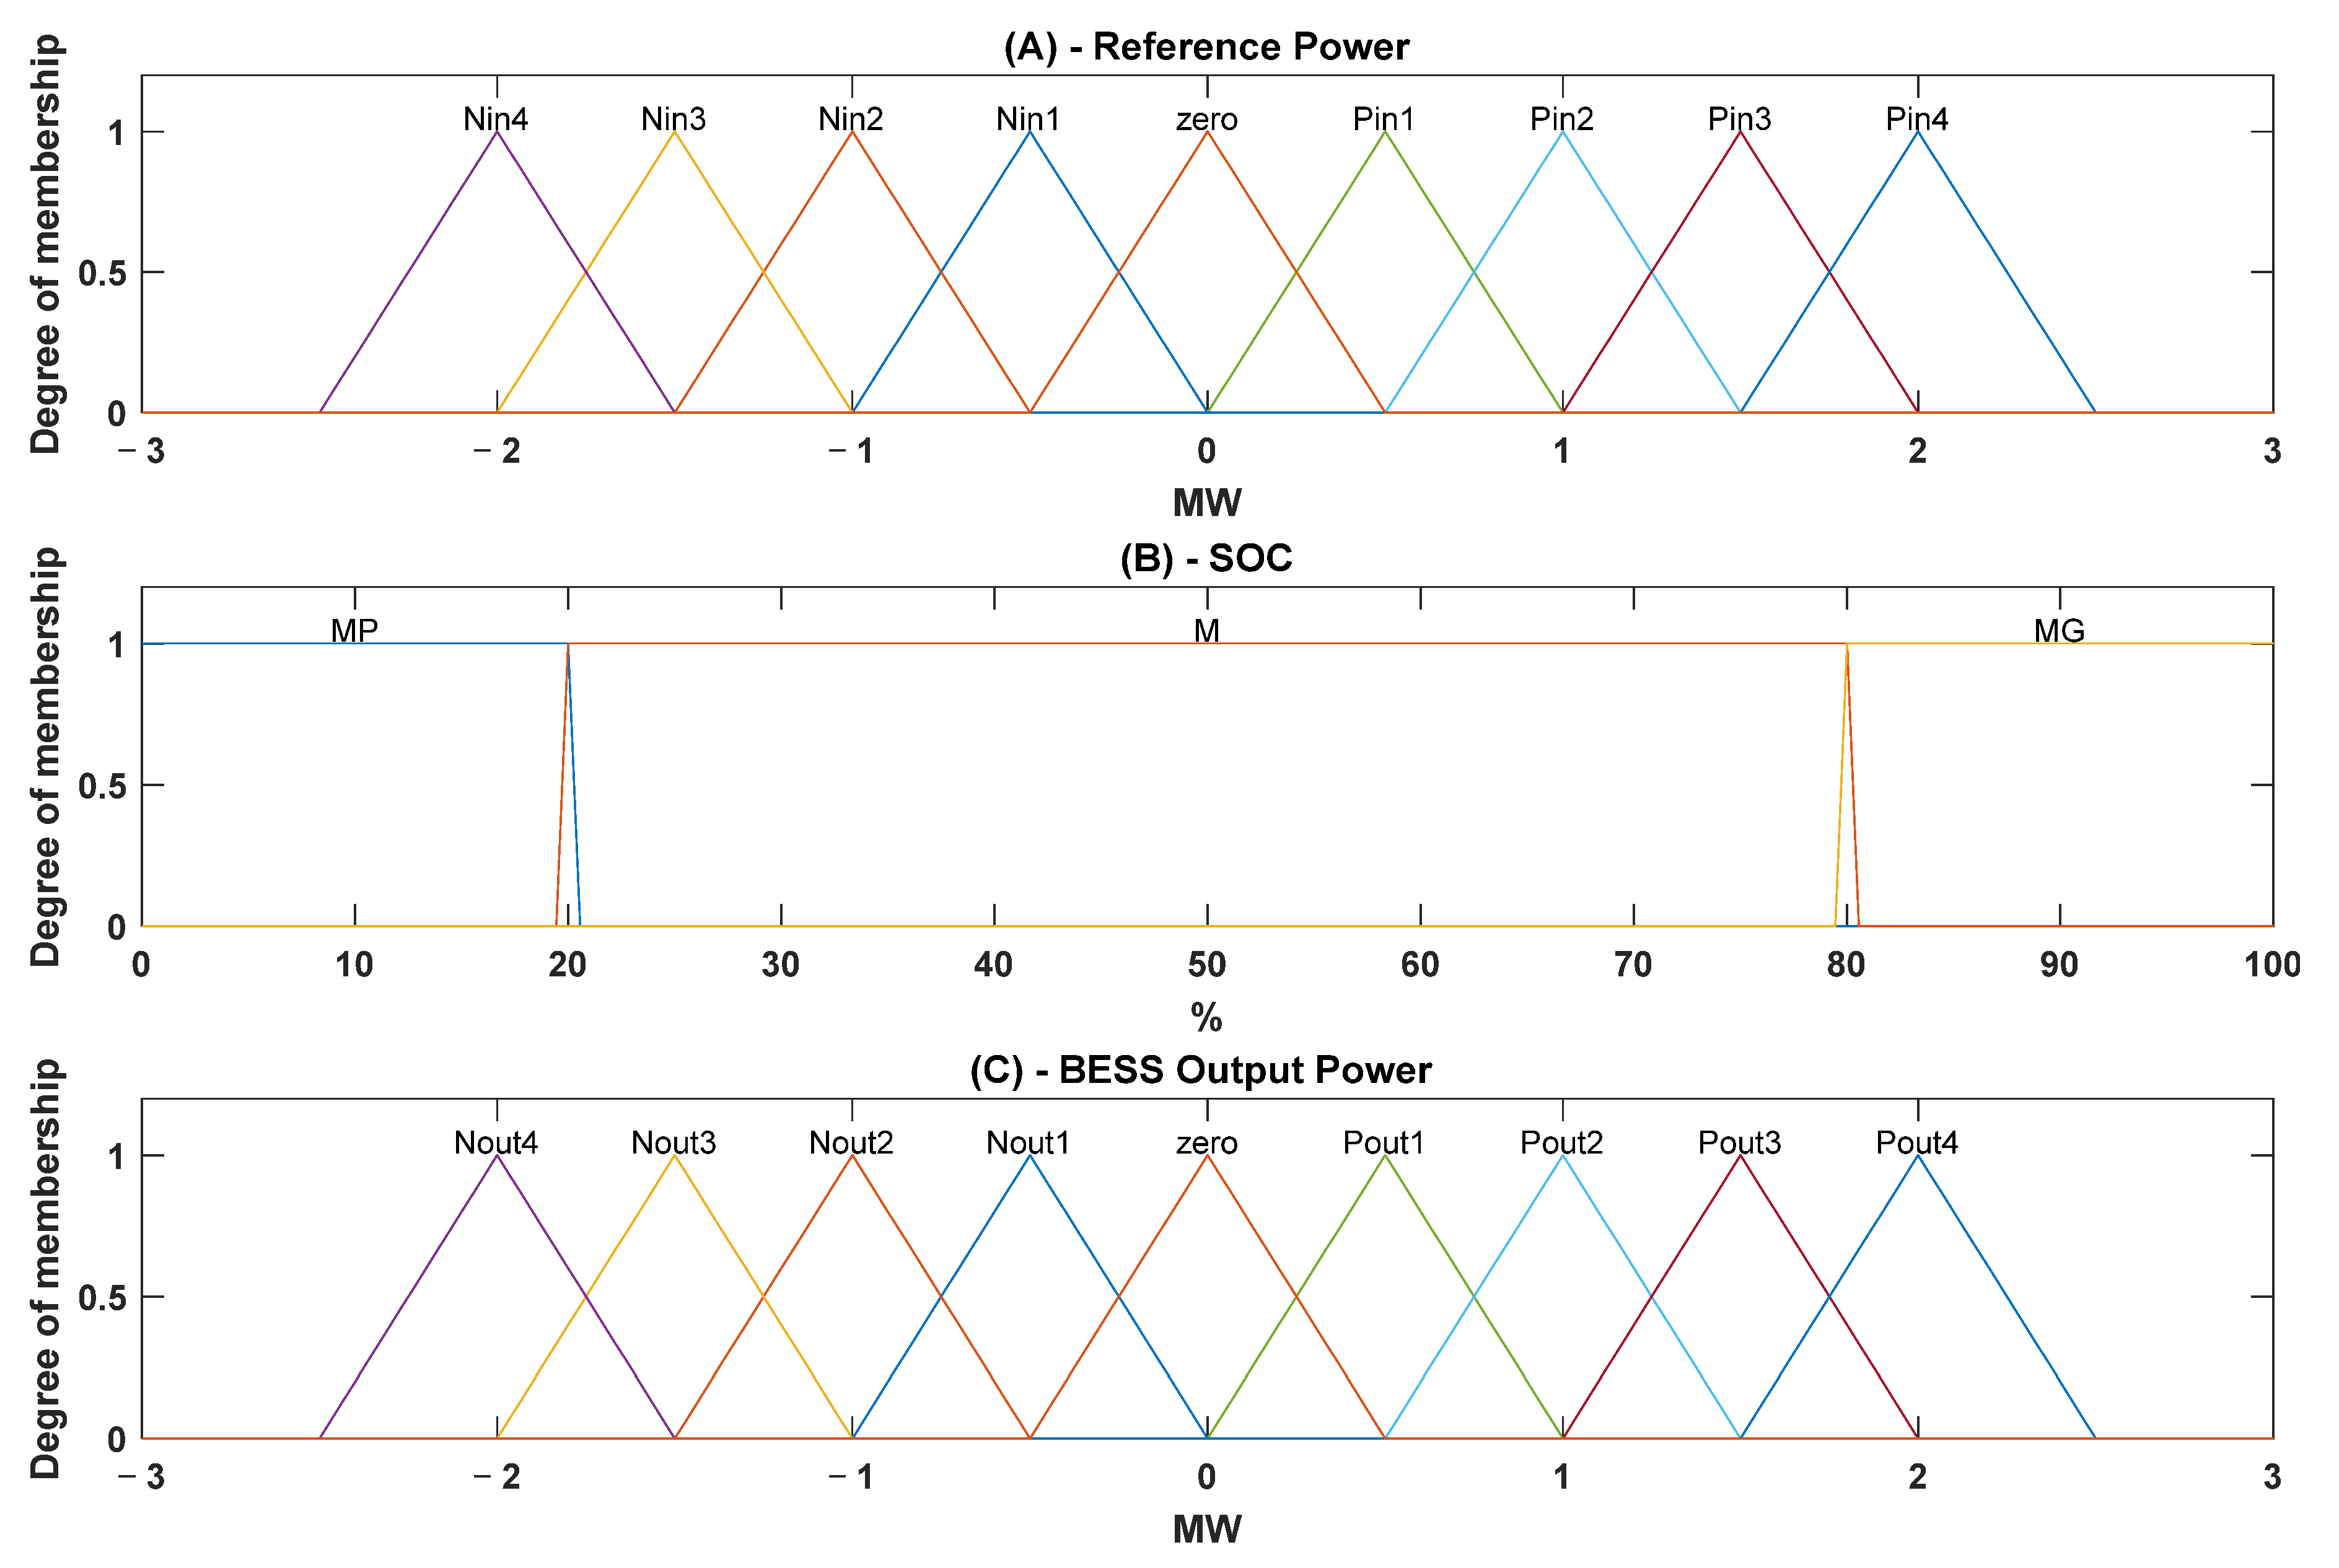
In this study, a Mamdani type 1 fuzzy dispatch controller with centroid defuzzification was utilized. The inputs to the controller are the “
SOC” and “reference power”, while “BESS output power” is the controller output. The choice of membership function type was based on empirical analysis, where different functions were assessed to determine which one yielded the lowest error. Triangular shapes were found to provide the best result for both the reference power and BESS output power, while the
SOC exhibited the best performance with trapezoidal function shapes. The fuzzy inference rules follow the rules established in
Figure 7. These rules are applied to the membership function governing the BESS active power dispatch controller and are presented in
Table 1. The membership functions are illustrated in
Figure 8.
The membership functions for the reference power and the BESS output power are divided into three subgroups: N, zero, and P. N stands for “negative”, representing the negative power, which in this work corresponds to the charging of the BESS; zero represents values equal to or close to zero; and P stands for “positive”, representing the positive power, which is responsible for discharging the BESS. The suffix “in” is used to indicate the reference power, which serves as an input to the controller, while the suffix “out” refers to the BESS output power, i.e., the power controlled and applied by the controller.
The pertinence functions for the SOC are grouped into three sets: S, M, and B. S stands for “small” and represents values that are equal to or less than the SOC lower limit; M stands for “medium” and represents the operational range for the SOC, encompassing values between the upper and lower SOC limits; and B stands for “big” and represents values equal to or greater than the SOC upper limit.
5. Smoothing Active Power—Numerical Results
This section presents the results of the fuzzy logic control strategy for wind power output smoothing using the definitions from
Section 4. The simulation setups are as indicated on
Table 2. The control system was simulated under two initial conditions. In the first condition, the initial
SOC is 100%, while in the second condition, the initial
SOC is 10%. The main objective of these two simulation sets was to analyze the charging and discharging operation coordinated by the controller in the event that the
SOC is outside of its boundaries.
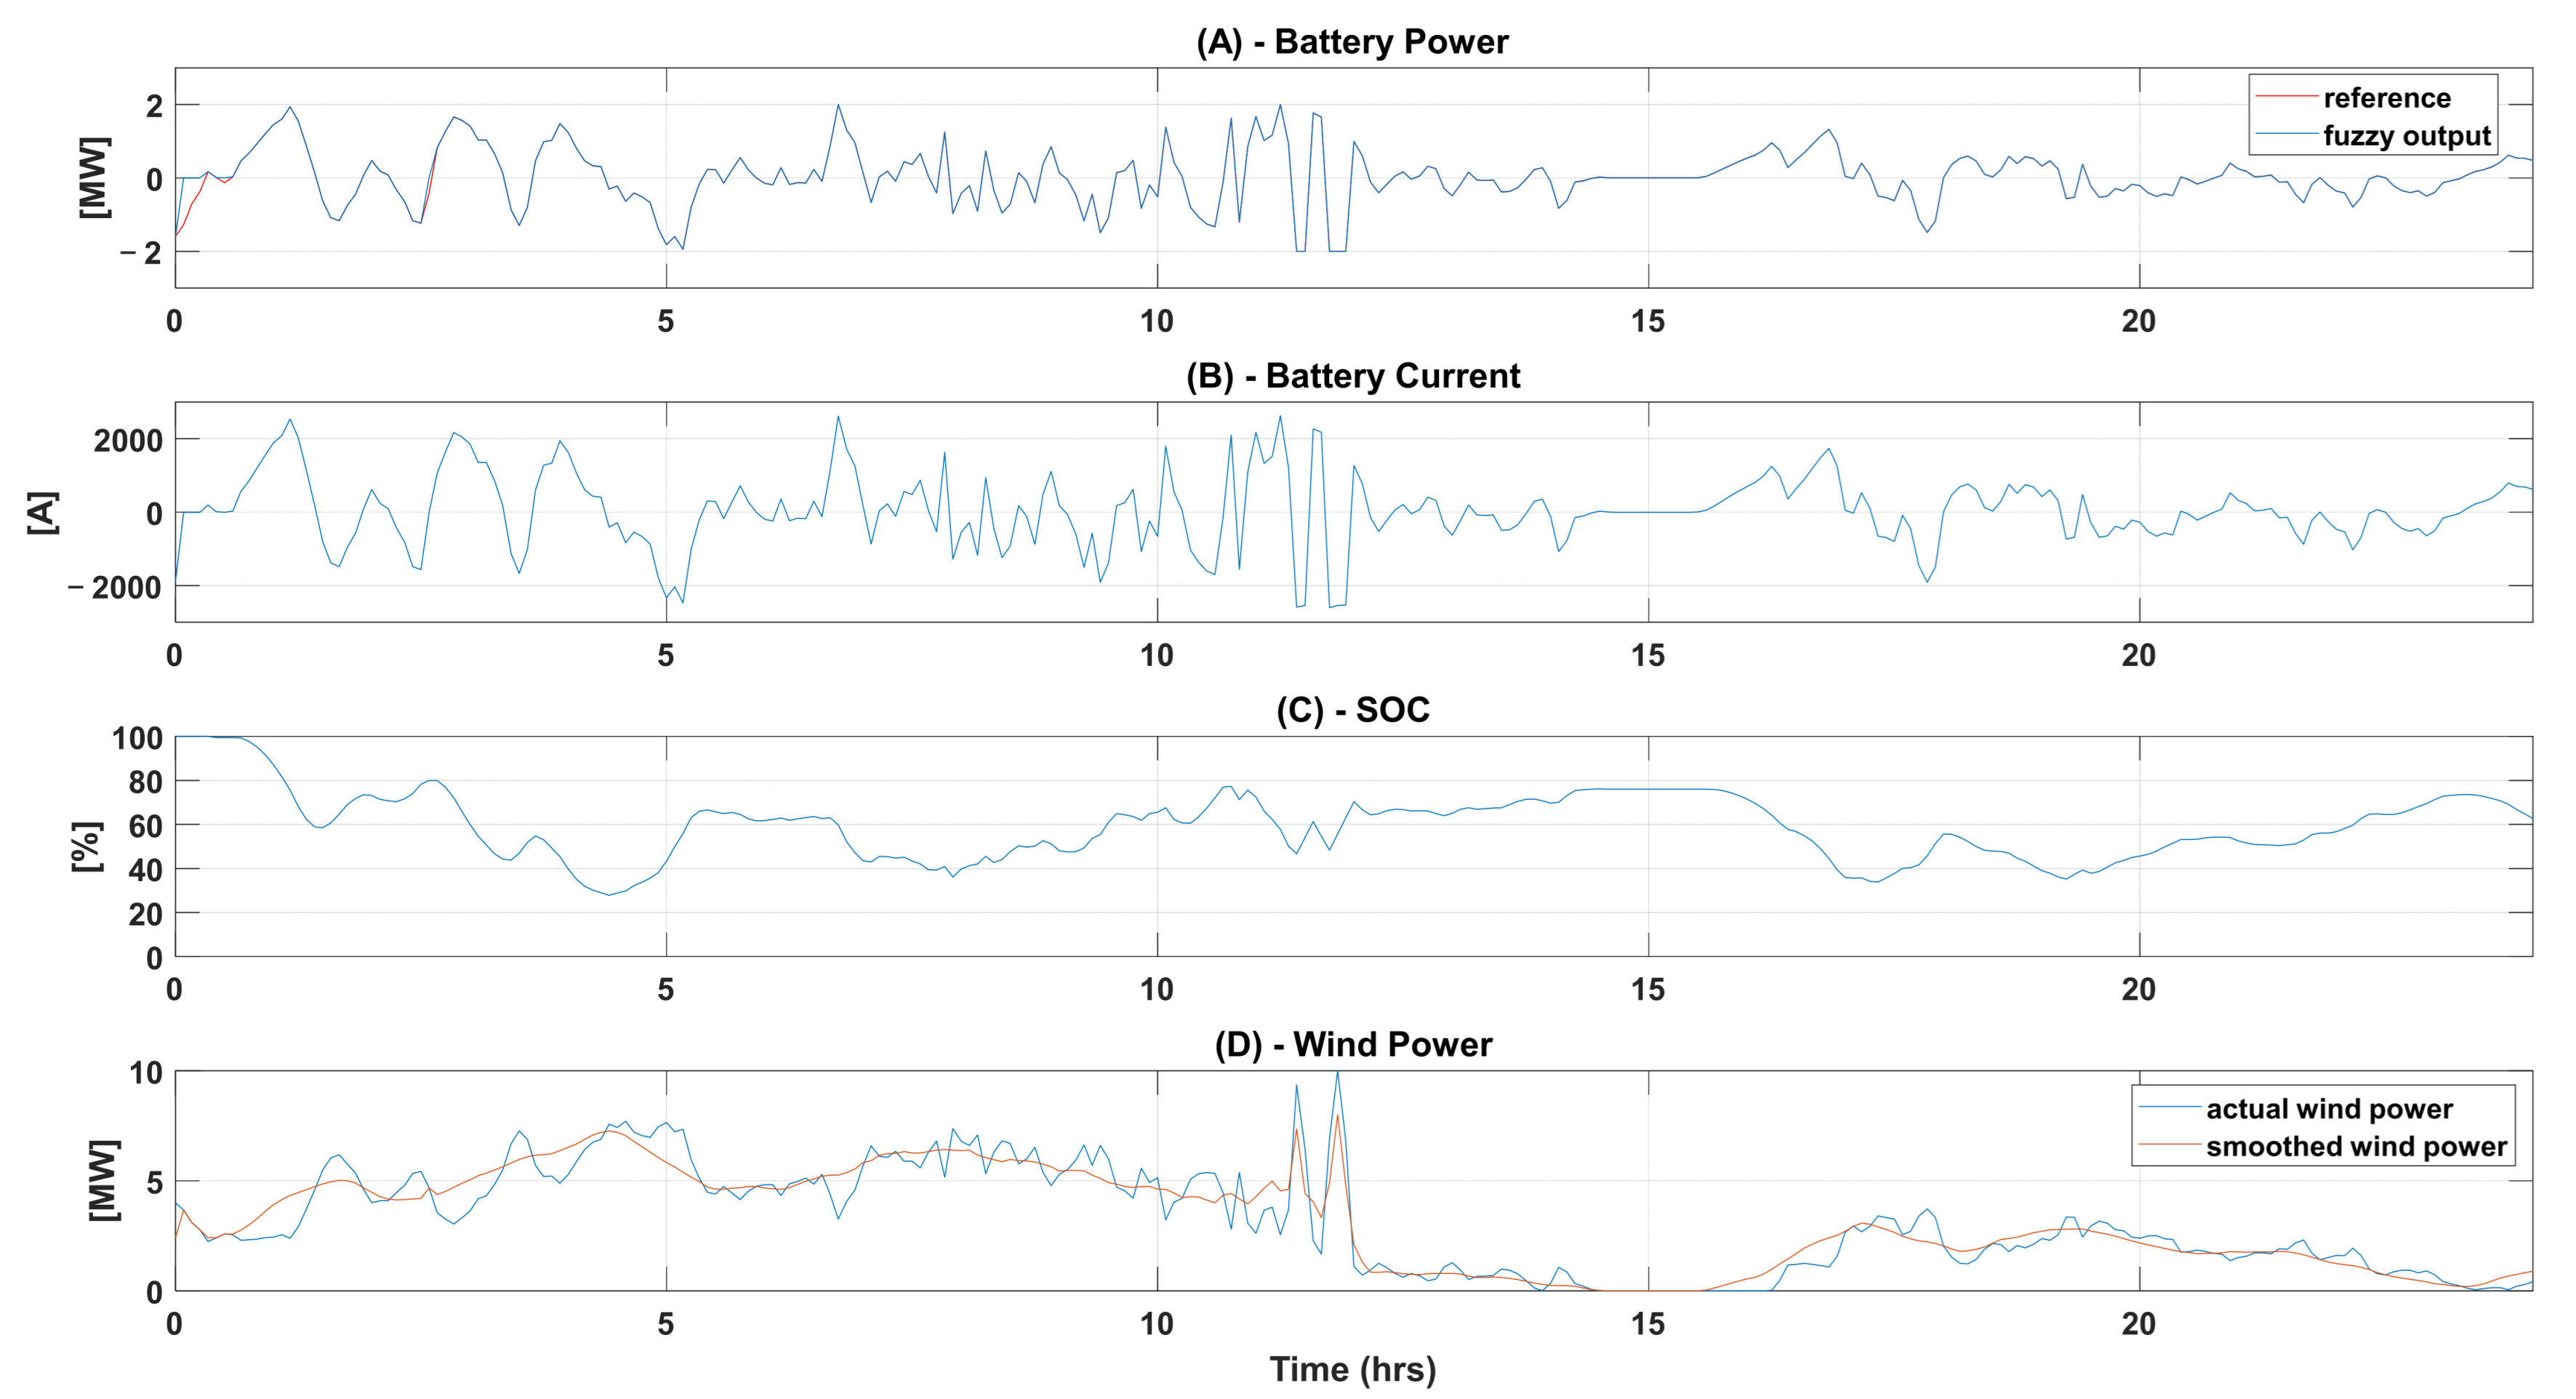
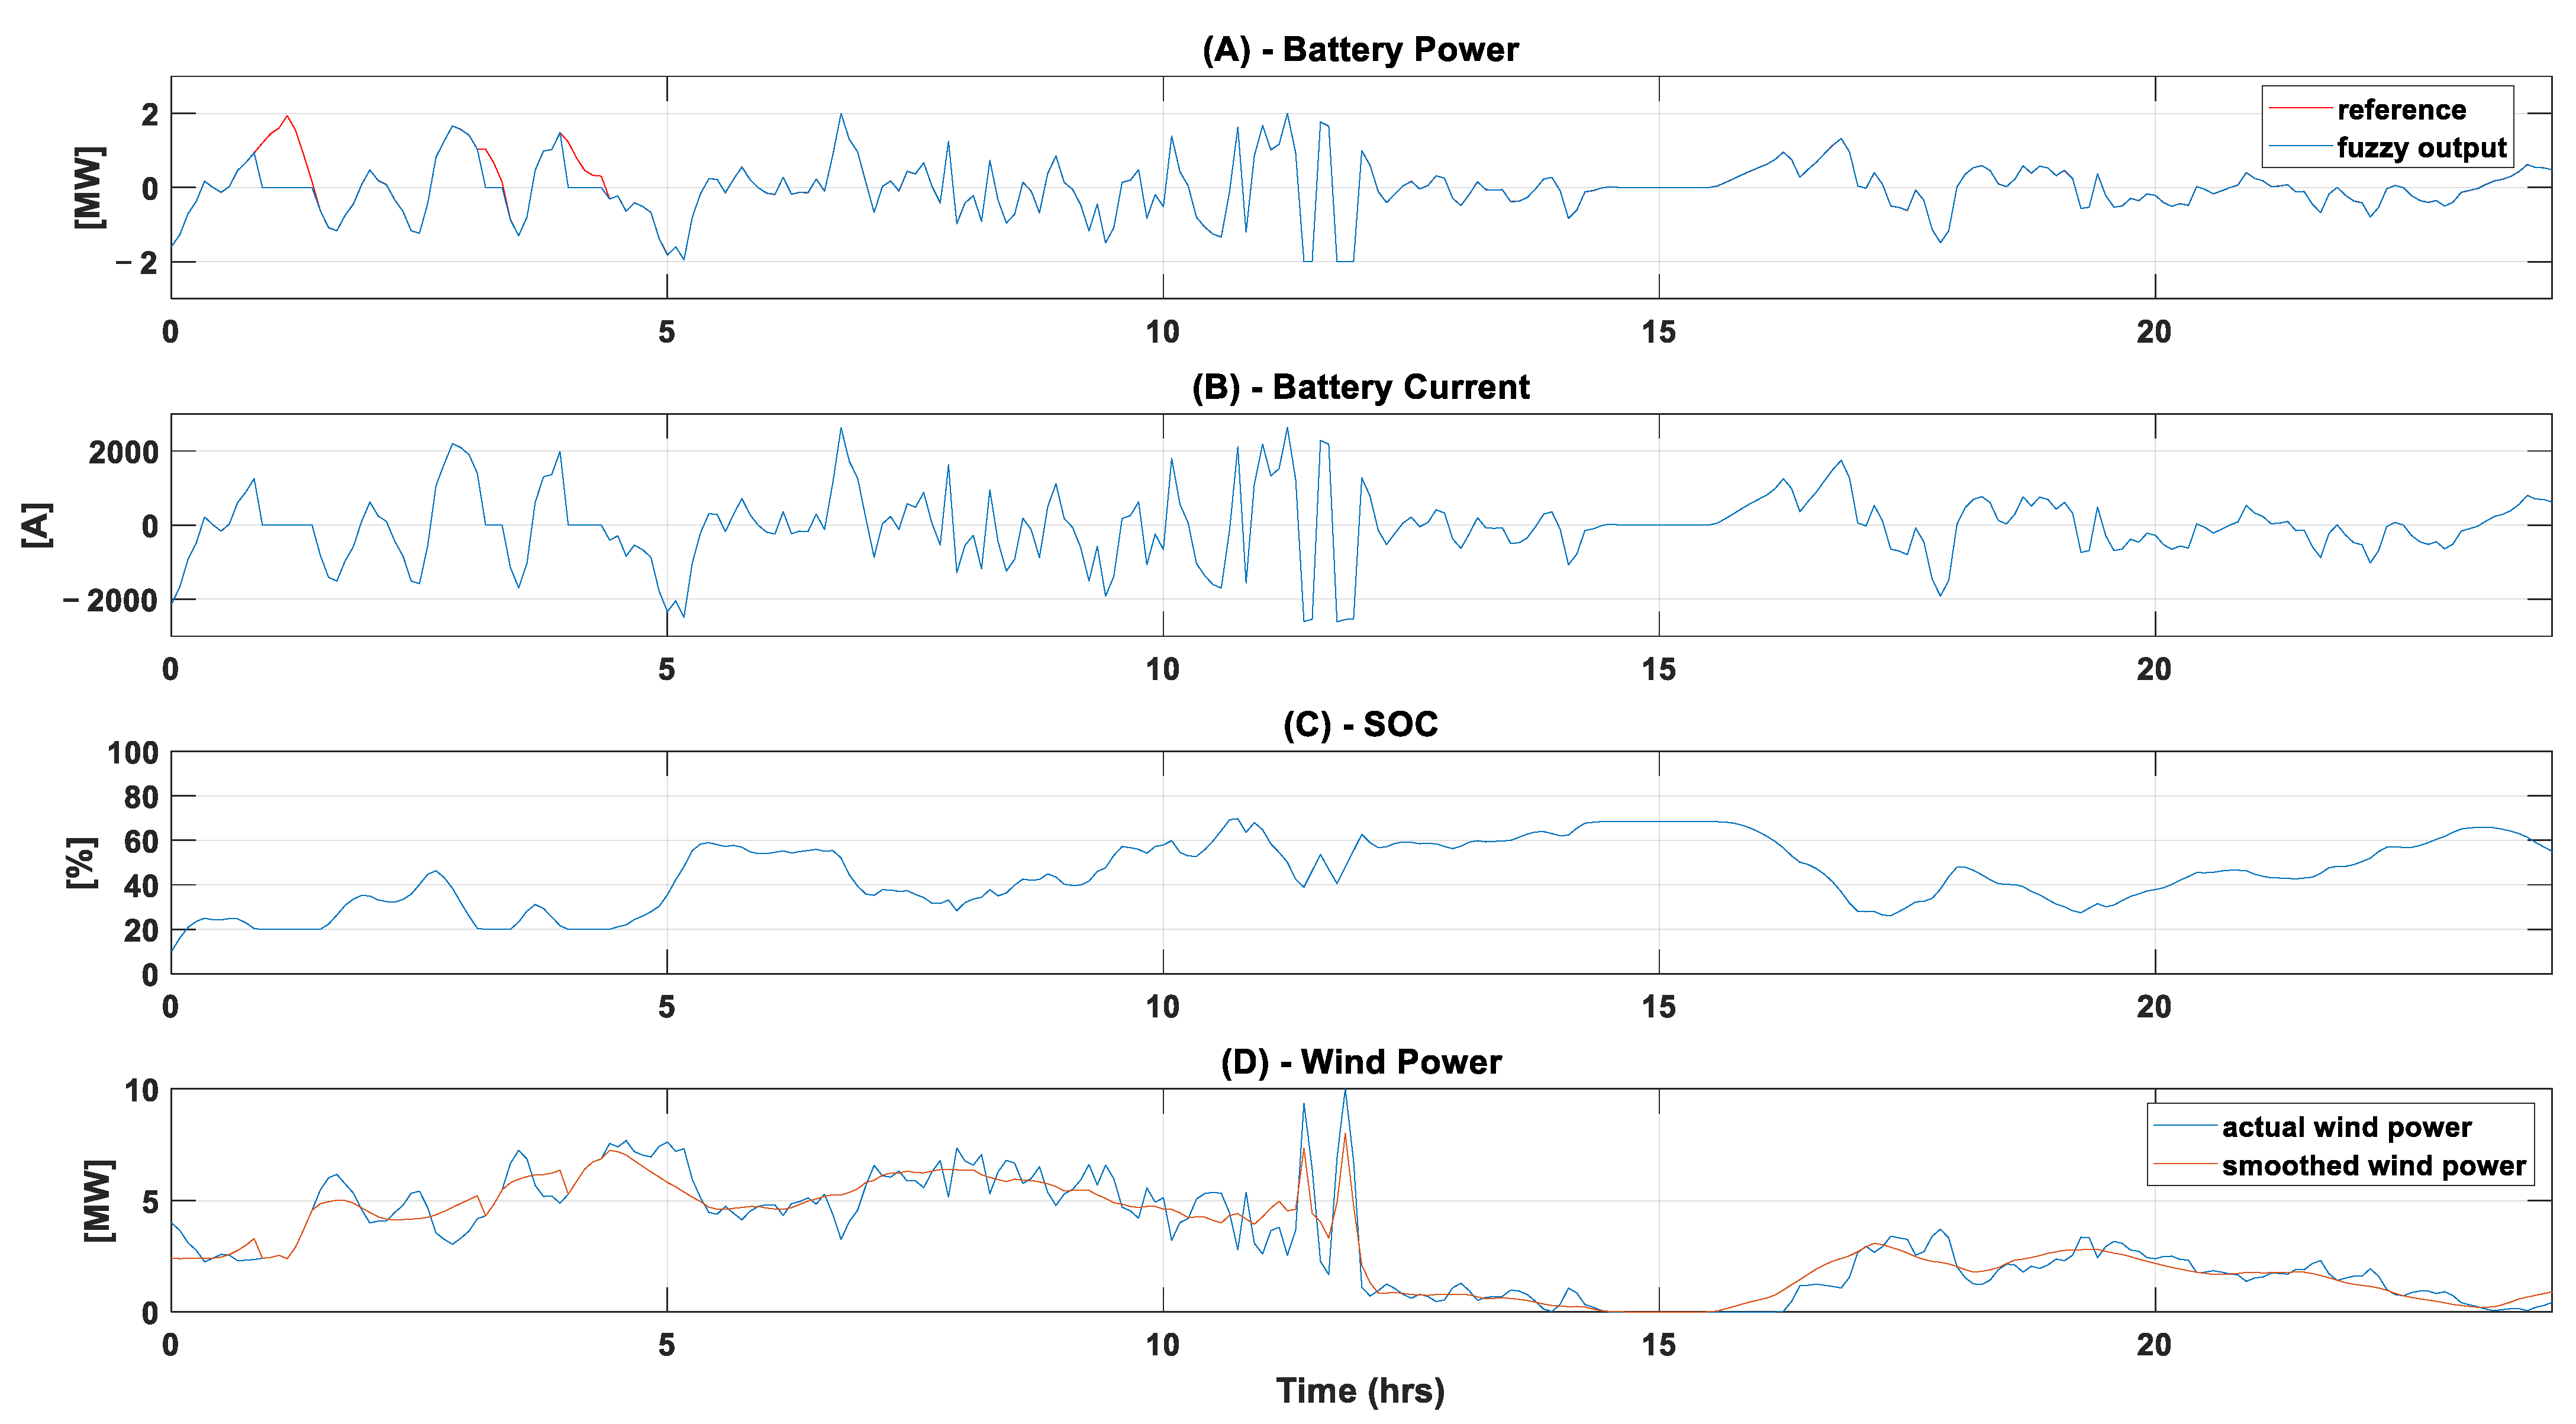
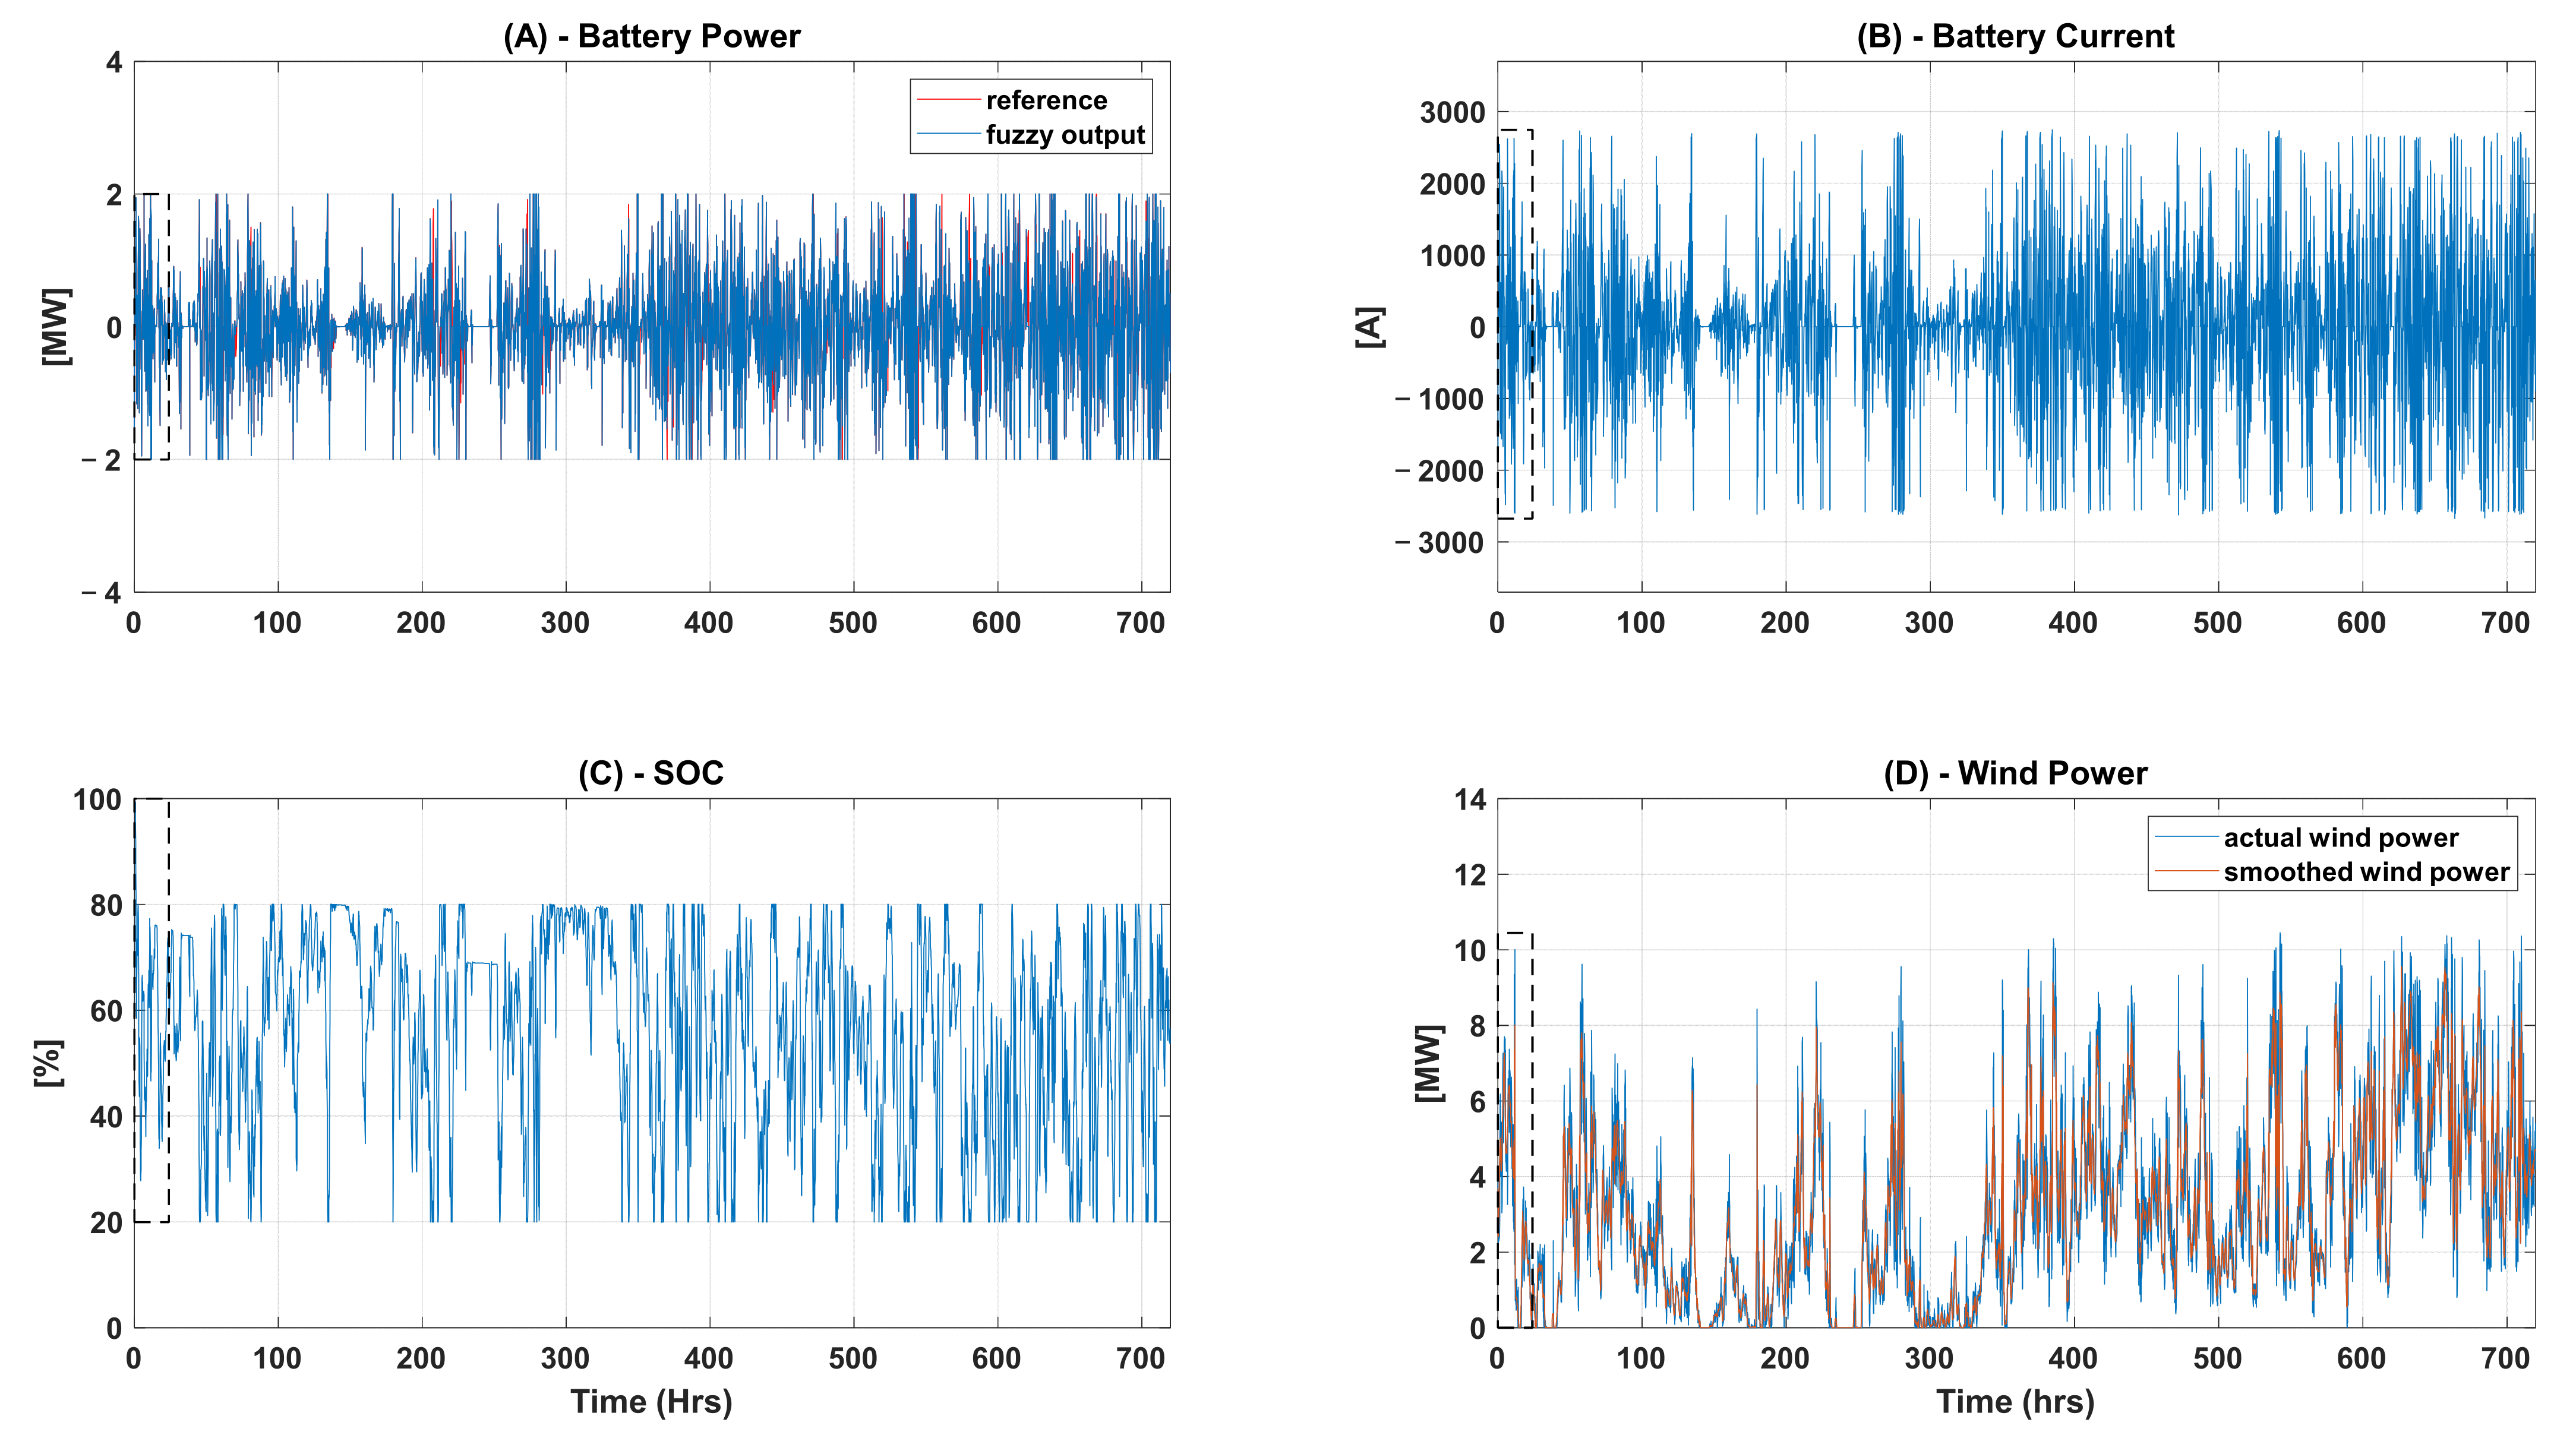
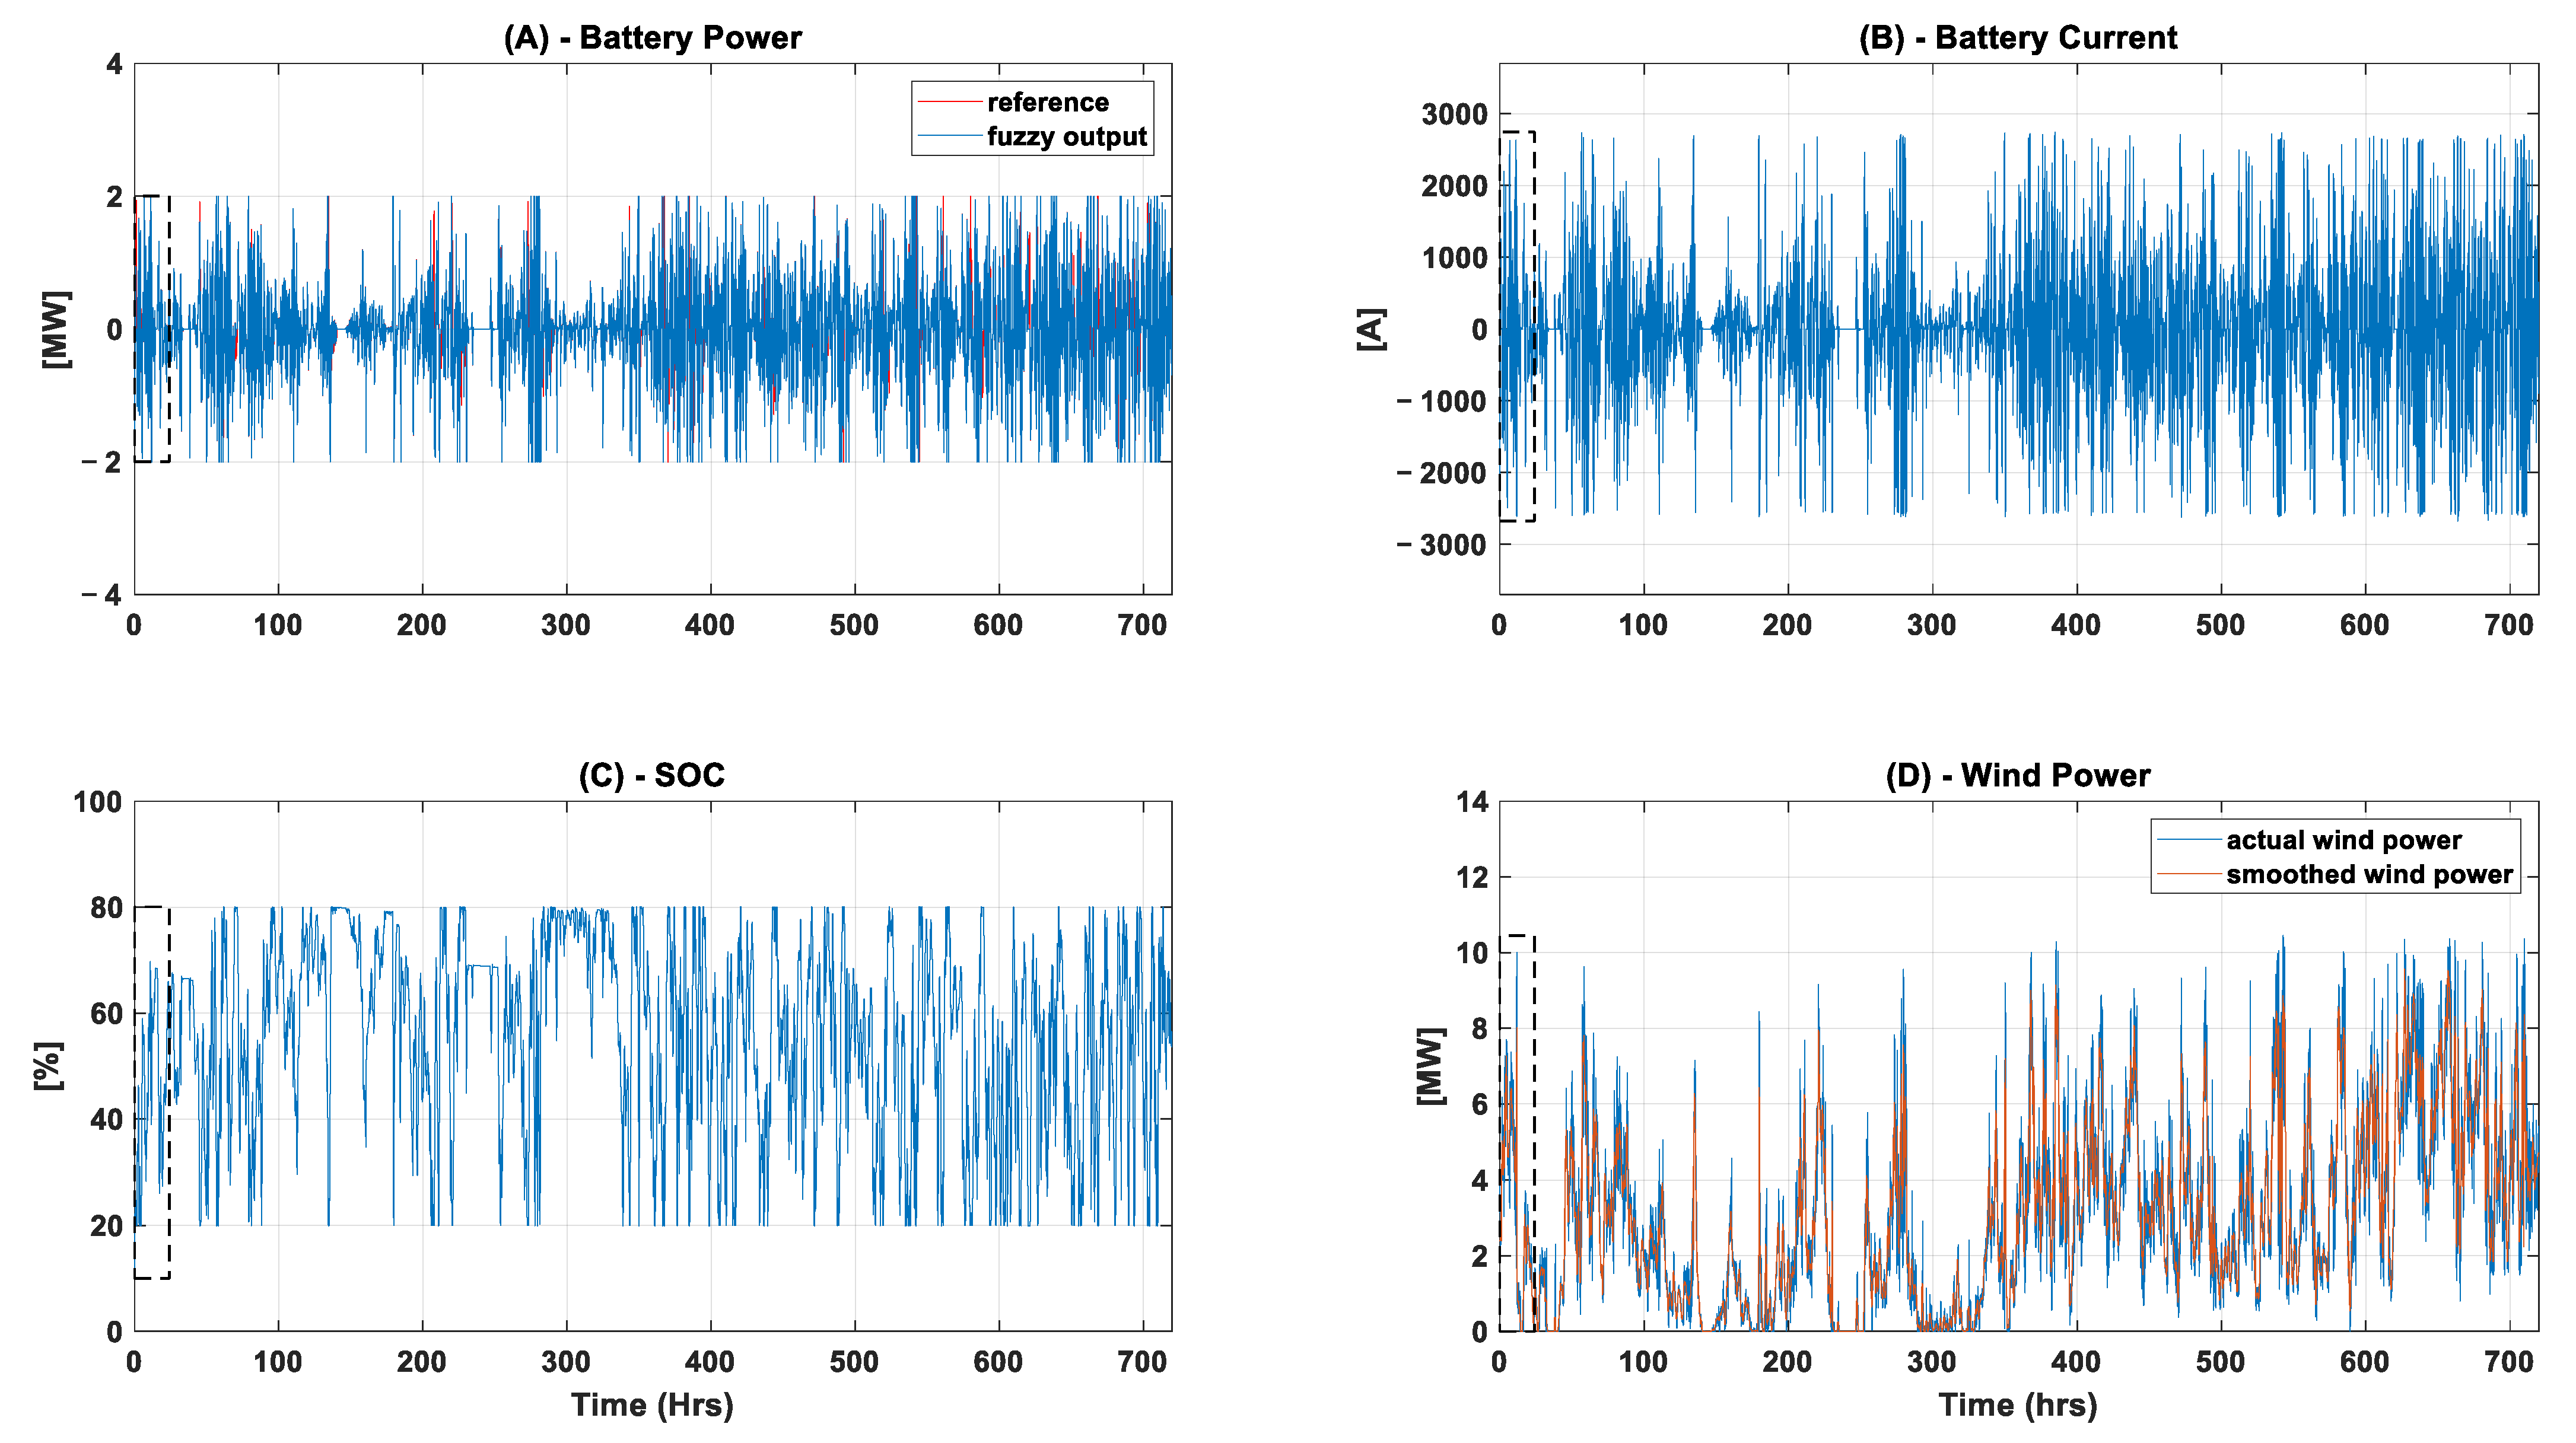
5.1. Simulation with Initial SOC at 100%
Considering the first 24 h of the one-month simulation to have an initial
SOC of 100%, the result of battery power, battery current,
SOC, and smoothed wind power are illustrated in
Figure 9.
Regarding battery power, a comparison between the reference power (red) and the power that is being delivered by the BESS (blue) is illustrated. In the initial moments, the power delivered by the BESS is null, not following the reference. This occurs because the initial
SOC is 100%, which is inferred from the fuzzy control of only discharging the battery when the reference power indicates a discharge (i.e., positive reference power); therefore the wind power is not smoothed, which can be seen in the wind power graph. This behavior is maintained until the
SOC levels are within the imposed limits. Once within the
SOC limits, the controller tries to follow the reference power while limiting the maximum charge/discharge current and observing the
SOC limits. The result of a month’s data can be seen in
Figure 10, where it is clearer that the controller does not allow the
SOC, the battery power, and the battery current to exceed operational limits.
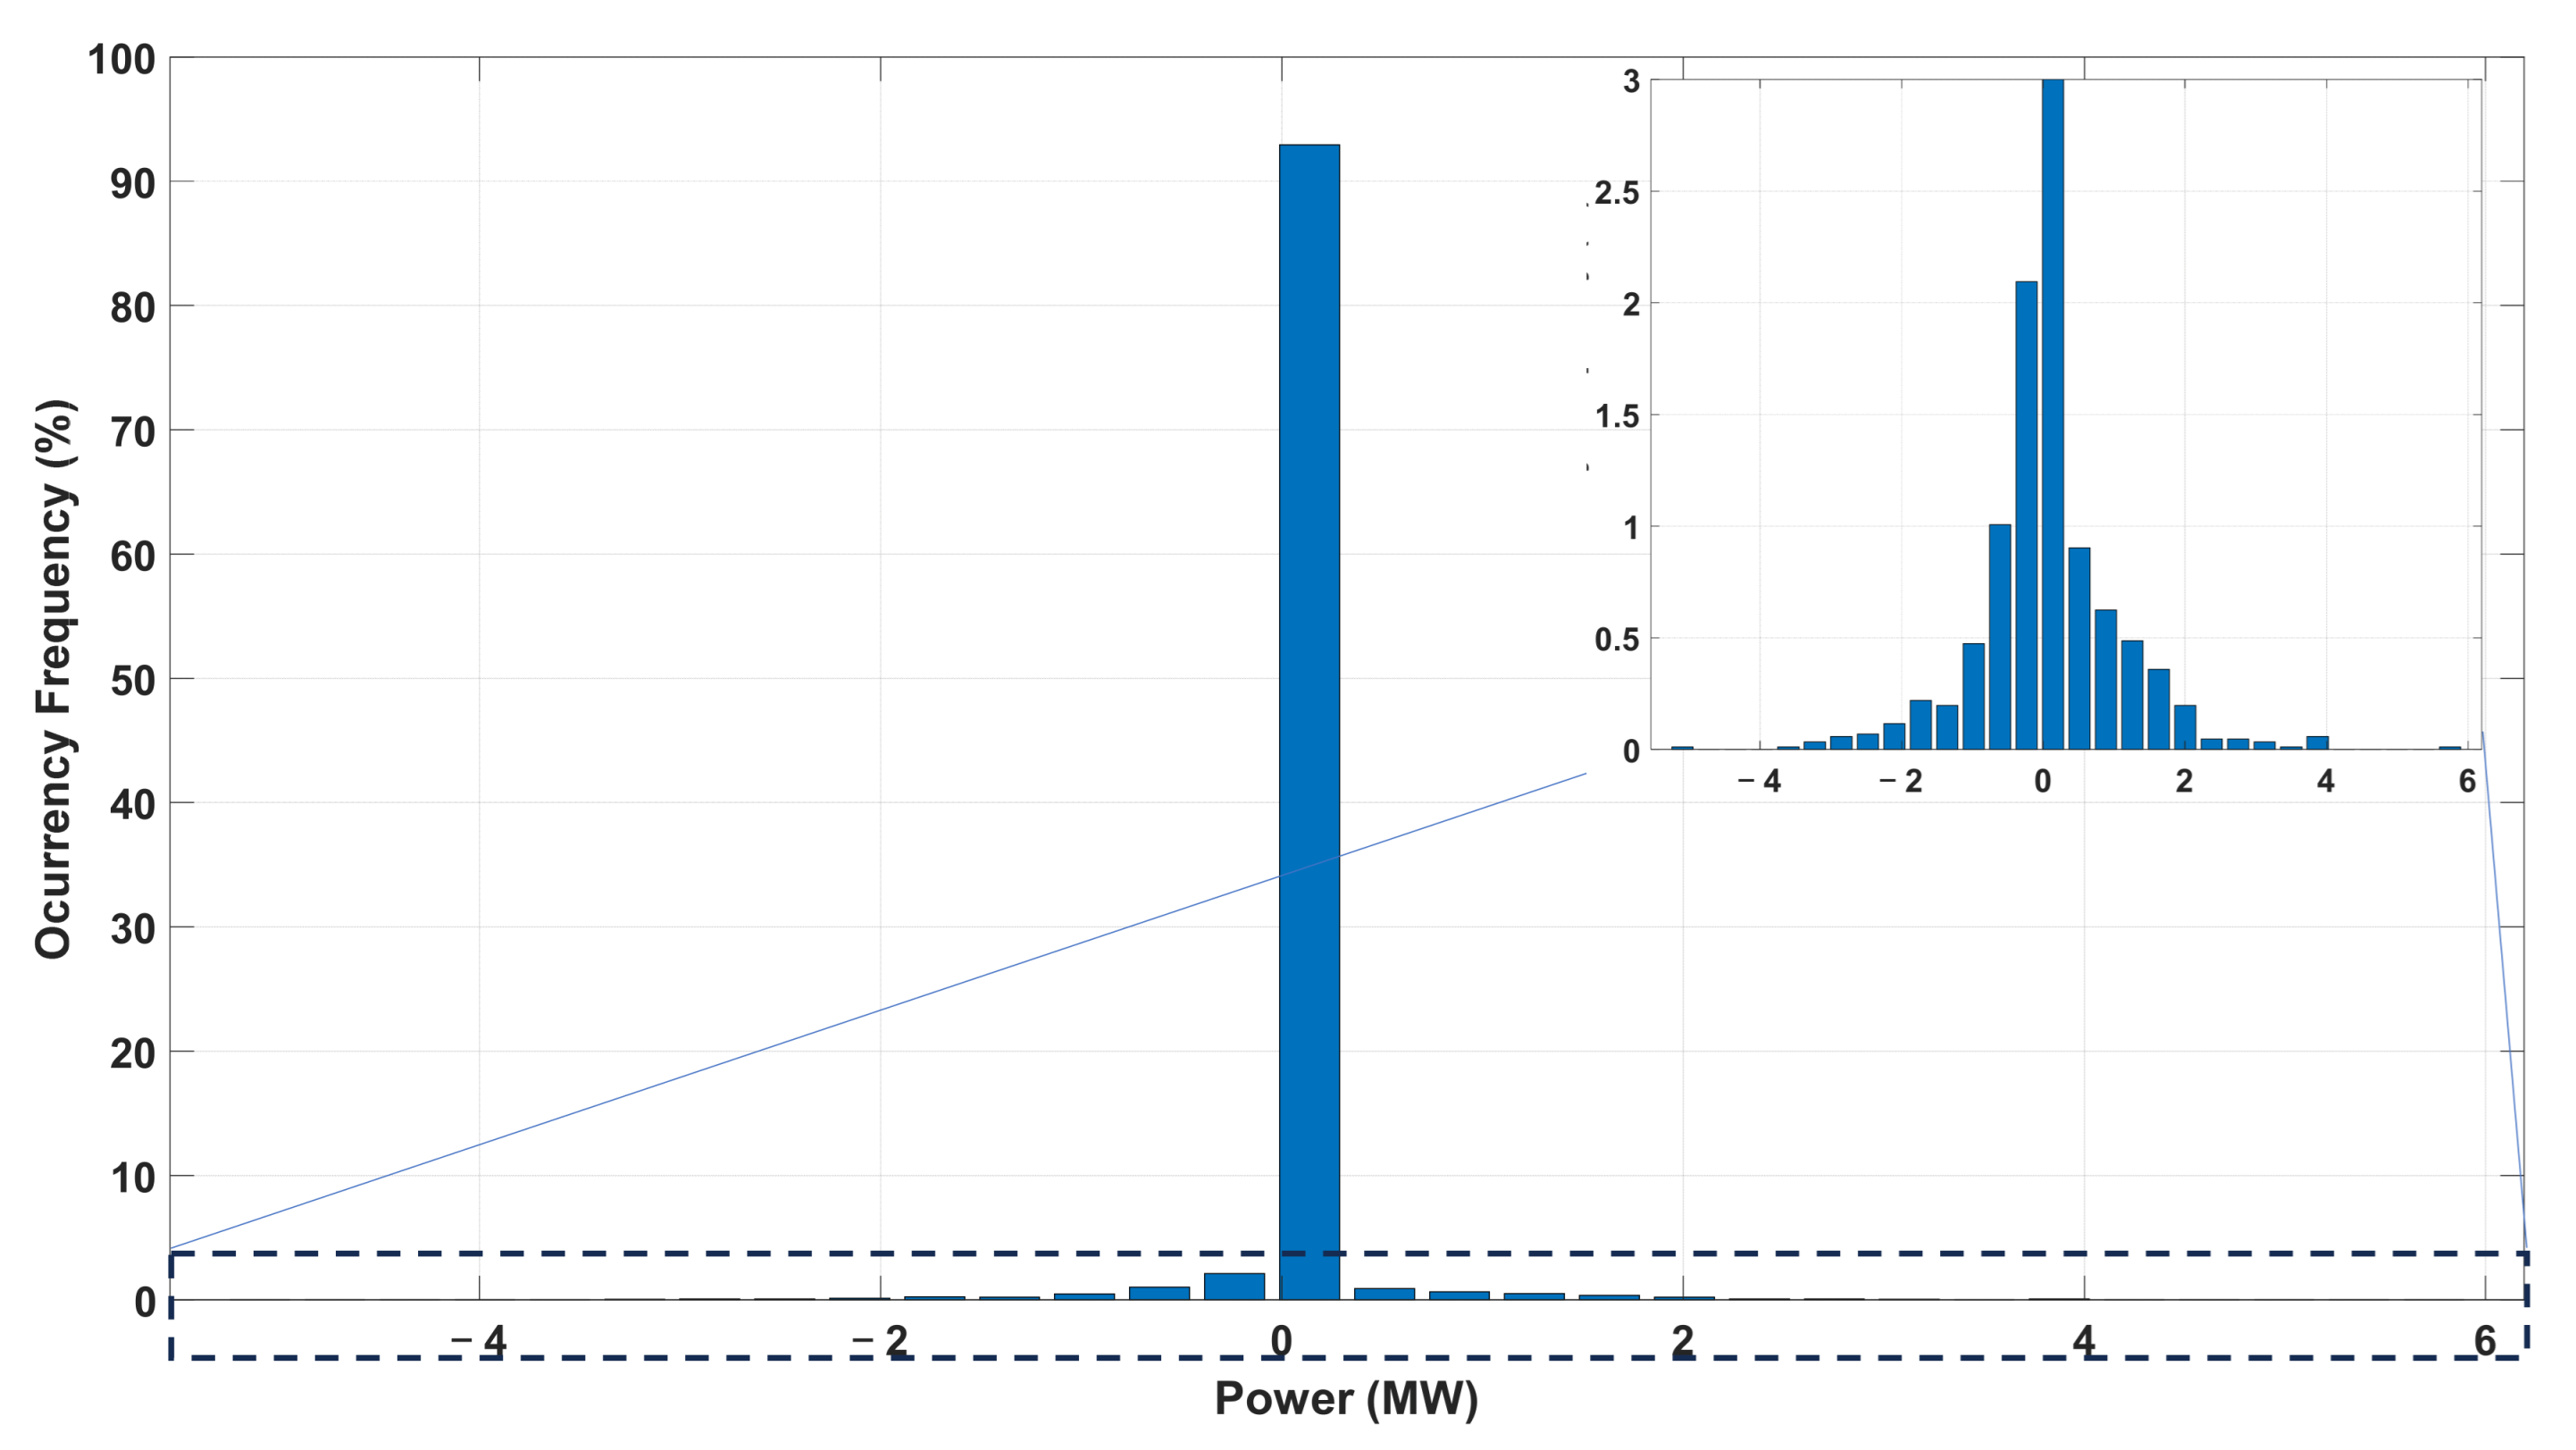
Due to the capacity and power limit of the battery, in addition to the limit imposed on the
SOC by the fuzzy controller, the wind power will not always be smoothed according to the reference power, so it is important to determine the error between the ideal case and the one obtained from the controller. This can be completed by using Equation (10).
Psmoothed reference is the smoothed reference wind power obtained from Equation (8), and
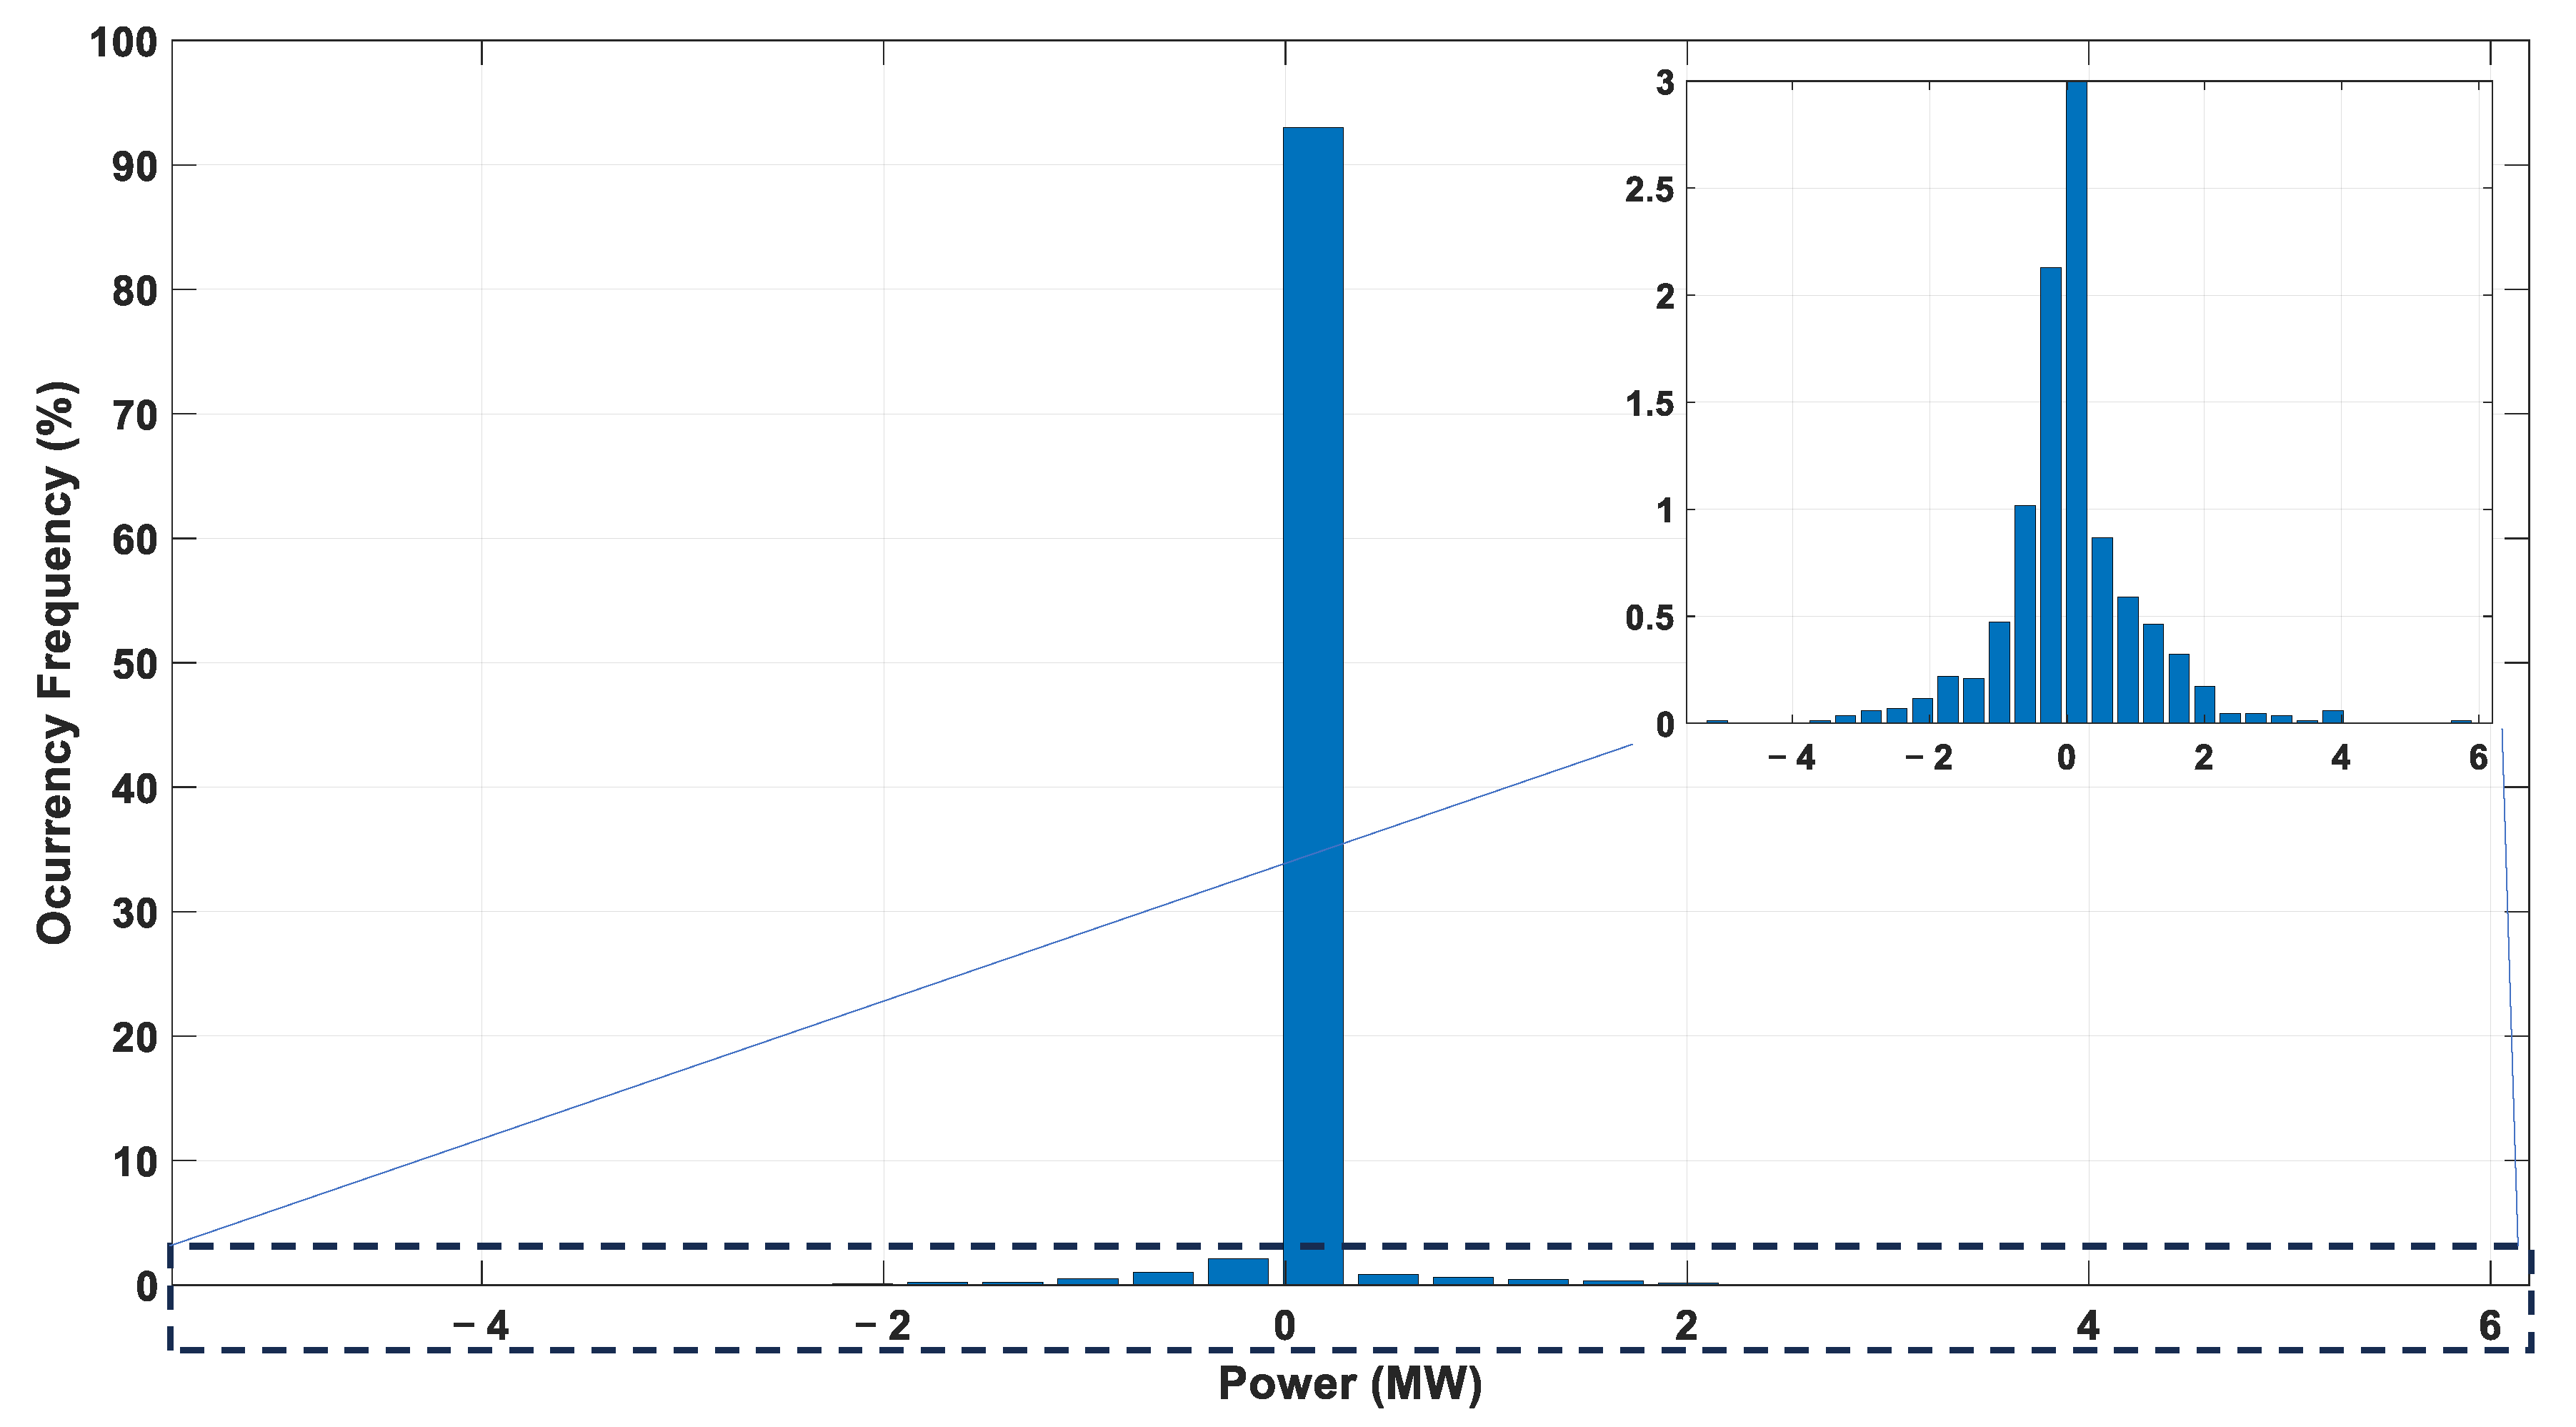
Psmoothed fuzzy is the smoothed wind power obtained through the fuzzy controller. The error is shown as a histogram in
Figure 11. In most cases, the error is about zero, meaning that, in 93% of one-month simulations, the fuzzy controller was able to smooth the output wind power. Other error values are below 3% of the total and correspond to events such as the controller being unable to smooth the power either because of operational limits or approximation errors by the fuzzy controller itself.
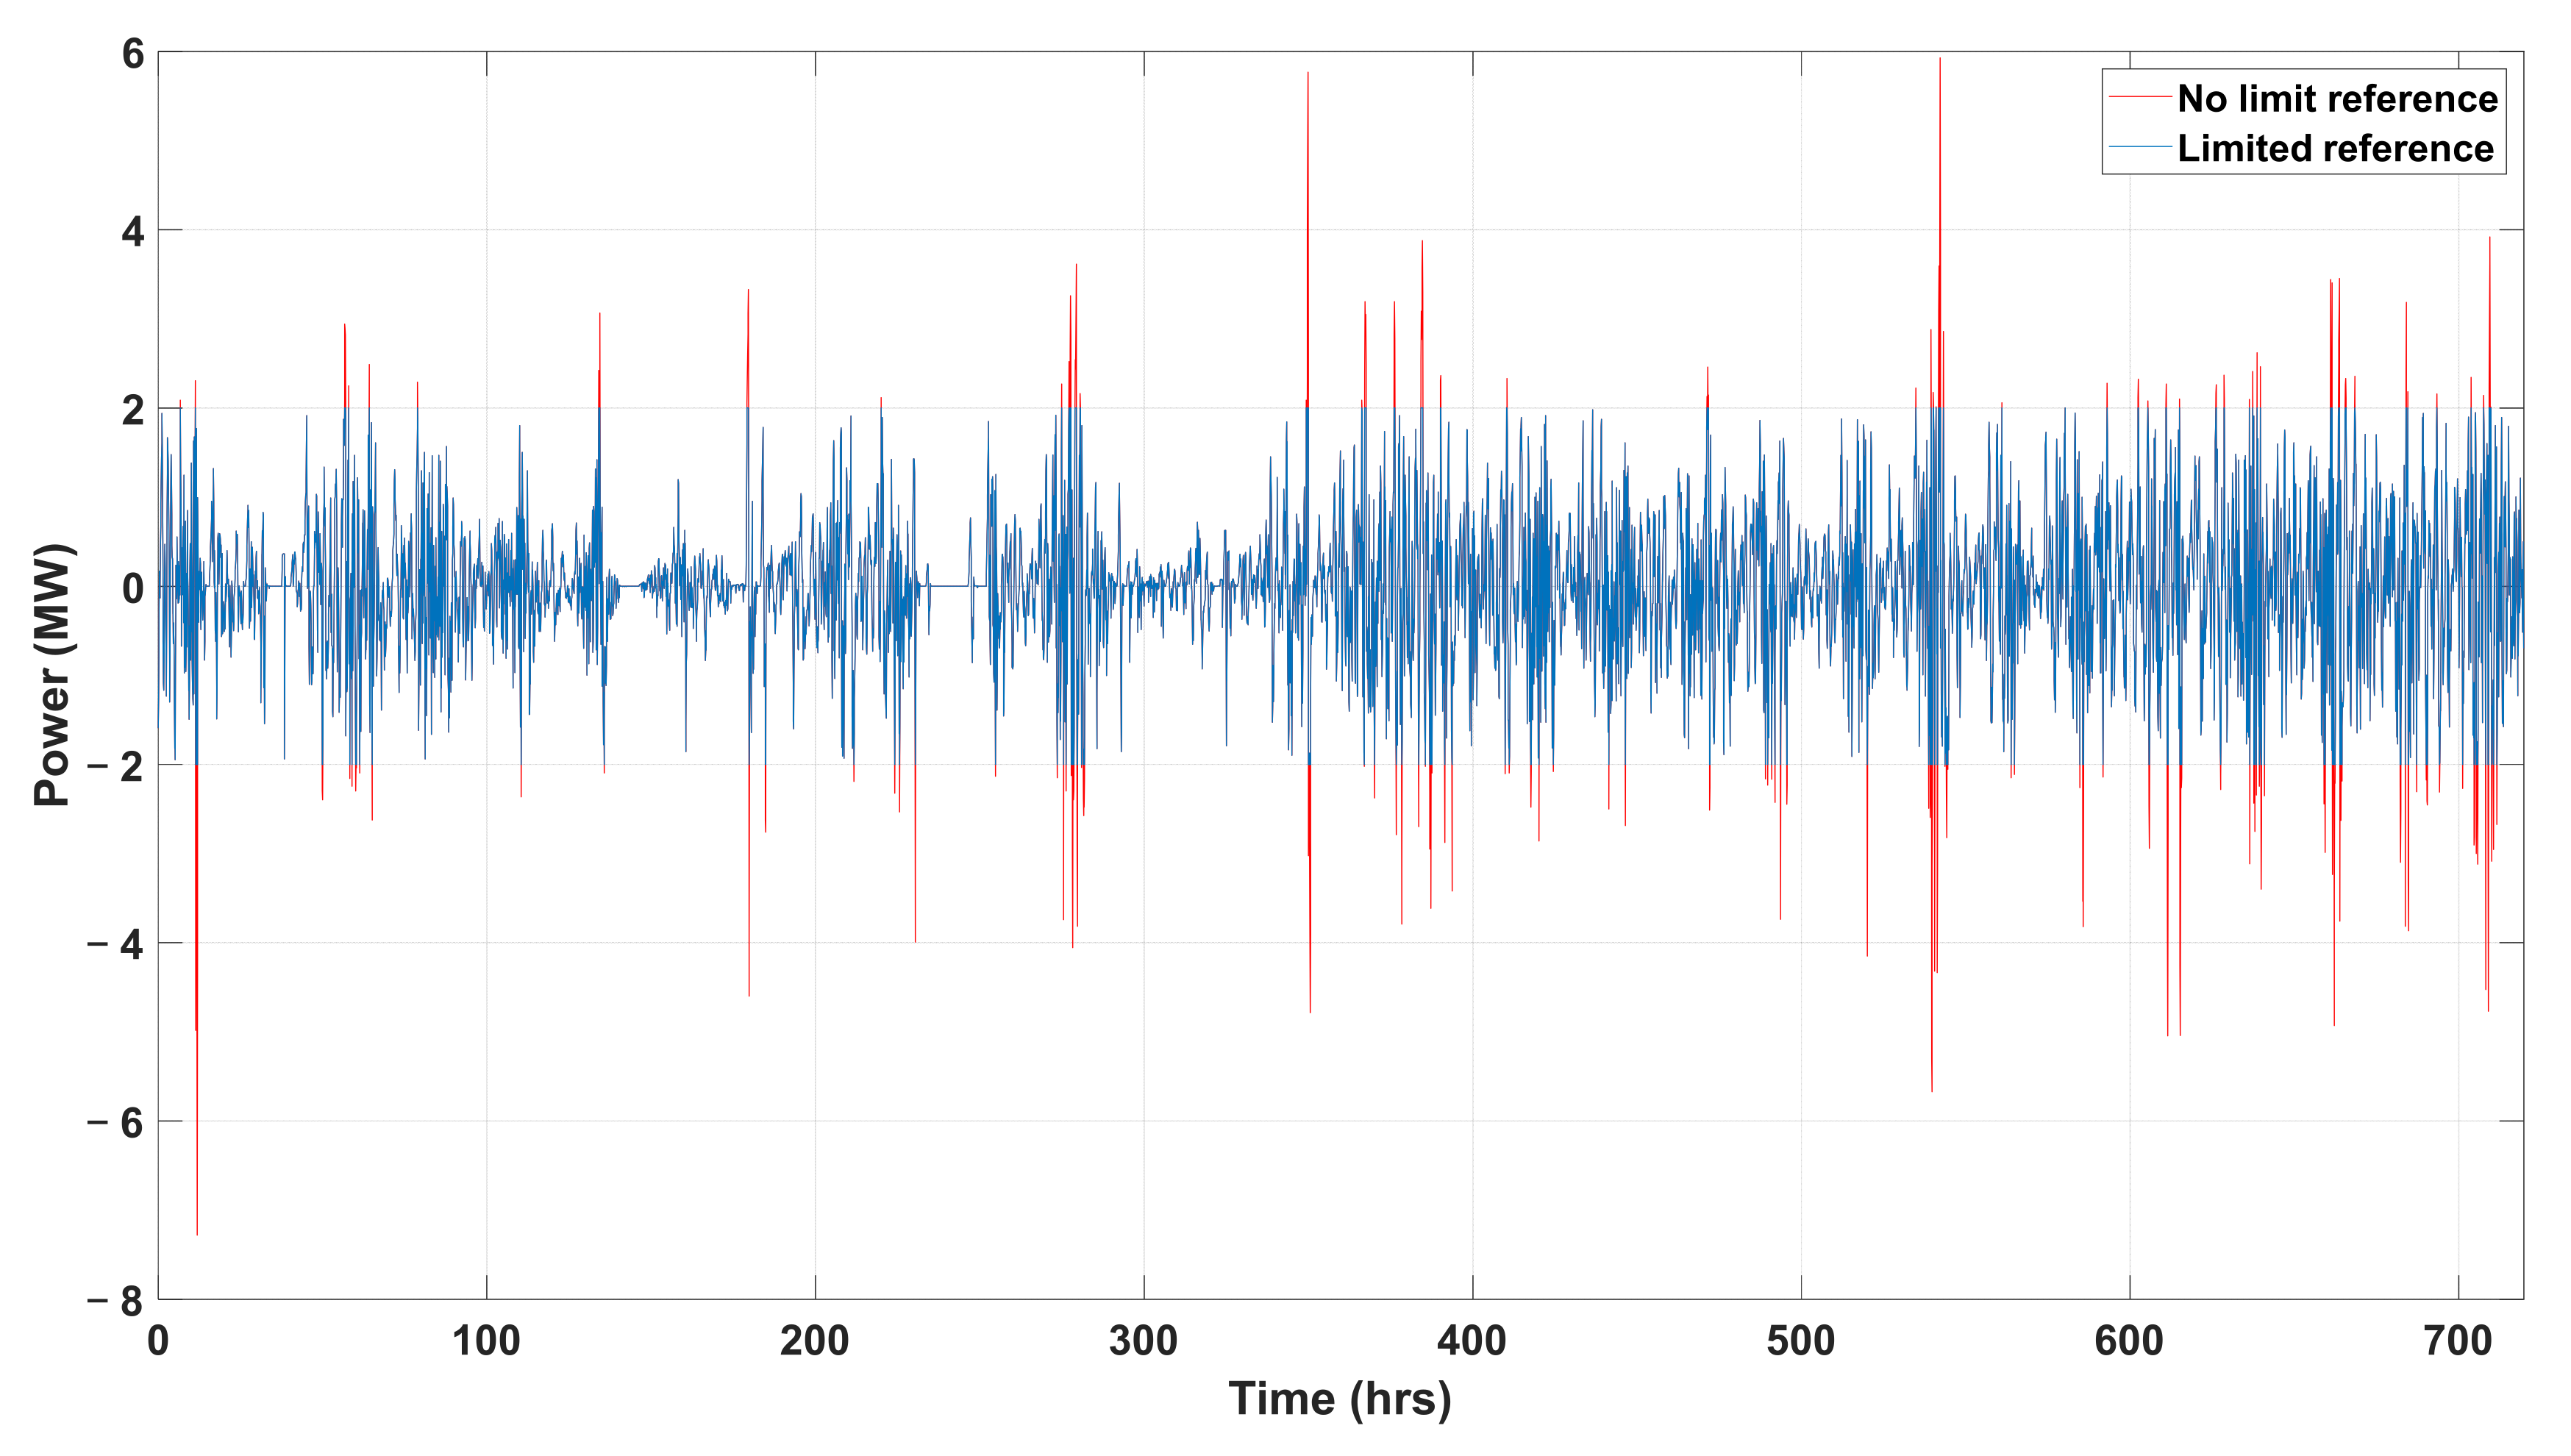
It is important to highlight that the power reference in this simulation is limited by the nominal battery power, which does not correspond to an ideal smoothing.
Figure 12 shows a comparison between ideal and limited reference power. However, with 2 MW nominal rated power, the BESS is capable of proportionally serving around 95.45% of the cases.
5.2. Simulation with Initial SOC at 10%
The result of the simulation with an initial
SOC of 10% for the first 24 h can be seen in
Figure 13. Due to the initial
SOC being 10%, the fuzzy controller can charge the battery only if the reference power is negative. As the reference in the initial moments is negative, the power starts to be smoothed immediately, and the battery is charged until it reaches the
SOC operational limits.
For this simulation scenario, it is clearer to see the fuzzy logic controller working. At around the first hour, the
SOC of the energy storage is 20%. At that moment, the output power and the battery current are null, and this state is maintained until the reference power allows the battery to be charged. The same behavior can be seen around the second and third hours. The result for a month of data for this scenario can be seen in
Figure 14.
Equation (10) was used to verify the effectiveness of the fuzzy controller for this case, and the result is illustrated in
Figure 15. It is possible to notice that the error around zero is 93%, similar to that seen in the previous scenario.
It is possible to conclude that the fuzzy controller proposed in this paper works as it should (i.e., limiting the BESS SOC, power, and current) with low error. It is also possible to conclude that a 2 MW/2.06 MWh BESS can appropriately smooth the power fluctuations caused by a wind farm composed of five wind turbines at 2.1 MW each, which is roughly five times the nominal size of the battery.
6. Conclusions
This paper presented a proposal for a controller for smoothing wind power output based on fuzzy logic for a wind farm equipped with a battery energy storage system.
The proposed controller was simulated considering several conditions that used real data collected in a real wind farm. Two conditions were chosen to be used as performance indicators. The first one shows the initial SOC condition, from 10% to 100%. The main idea was to verify the correct operation of the fuzzy controller in protecting the battery by conducting the SOC to the allowable range, from 20 to 80%.
During the simulations, it was possible to verify that, during the moments of out boundaries for the SOC, the controller freezes the smooth operation until the state of charge achieves the minimal or maximal values. During these moments, the fluctuations are not filtered out, but analyzing the results through the error from the controller made it possible to identify that the controller was not running around 3% of the time.
Analyzing the error signal, it is also inferred that the battery needed to smooth the power output from the wind farms does not need to have the same magnitude of the wind farm.
The results showed that the proposed tool was effective in its objective using fuzzy logic. The tool can also be used for the sizing of a battery in order to find the optimal size for each wind farm based on the measurements and in the simulation tool.
Author Contributions
Conceptualization, P.L.T.d.S. and P.A.C.R.; methodology, P.L.T.d.S. and P.A.C.R.; software, P.L.T.d.S.; validation, P.L.T.d.S. and D.d.C.M.; formal analysis, P.L.T.d.S.; investigation, P.L.T.d.S.; resources, G.F.R.; data curation, D.d.C.M.; writing—original draft preparation, P.L.T.d.S., J.F.C.C. and P.A.C.R.; writing—review and editing, J.F.C.C., P.A.C.R., D.d.C.M., D.C.P.B., R.C.N., R.R.B.A.; visualization, J.F.C.C., P.A.C.R., D.d.C.M., D.C.P.B., R.C.N., R.R.B.A. and G.F.R.; supervision, P.A.C.R., R.R.B.A. and G.F.R.; project administration, P.A.C.R. and G.F.R.; funding acquisition, G.F.R. All authors have read and agreed to the published version of the manuscript.
Funding
This research received no external funding.
Data Availability Statement
Data is unavailable due to privacy restrictions.
Acknowledgments
The authors thank the R&D Program of ANEEL and CPFL Energy for all the incentives to the project initial Research and Development. This work used the database associated with the Project “PA3026—Insertion of Storage System in Multiple Configurations to Support Wind Generation”.
Conflicts of Interest
The authors declare no conflict of interest.
References
- GWEC. GWEC Global Wind Report; Global Wind Energy Council: Brussels, Belgium, 2021; p. 75. [Google Scholar]
- Burton, T.; Jenkins, N.; Sharpe, D.; Bossanyi, E. Wind Energy Handbook; John Wiley & Sons: Hoboken, NJ, USA, 2011. [Google Scholar]
- Munteanu, I.; Bratcu, A.I.; CeangĂ, E.; Cutululis, N.-A. Optimal Control of Wind Energy Systems: Towards a Global Approach; Springer: Berlin/Heidelberg, Germany, 2008; Volume 22. [Google Scholar]
- Masters, G.M. Renewable and Efficient Electric Power Systems; John Wiley & Sons, Inc.: Hoboken, NJ, USA, 2013. [Google Scholar]
- Pena, R.; Clare, J.; Asher, G. Doubly fed induction generator using back-to-back PWM converters and its application to variable-speed wind-energy generation. IEE Proc.-Electr. Power Appl. 1996, 143, 231–241. [Google Scholar] [CrossRef]
- Zhai, J.; Liu, H. Reactive power control strategy of DFIG wind farms for regulating voltage of power grid. In Proceedings of the 2014 IEEE PES General Meeting|Conference & Exposition, National Harbor, MD, USA, 27–31 July 2014; pp. 1–5. [Google Scholar] [CrossRef]
- Xie, D.; Xu, Z.; Yang, L.; Ostergaard, J.; Xue, Y.; Wong, K.P. A Comprehensive LVRT Control Strategy for DFIG Wind Turbines With Enhanced Reactive Power Support. IEEE Trans. Power Syst. 2013, 28, 3302–3310. [Google Scholar] [CrossRef]
- Kazmi, S.M.R.; Goto, H.; Guo, H.-J.; Ichinokura, O. A Novel Algorithm for Fast and Efficient Speed-Sensorless Maximum Power Point Tracking in Wind Energy Conversion Systems. IEEE Trans. Ind. Electron. 2010, 58, 29–36. [Google Scholar] [CrossRef]
- Rahmani, S.; Hamadi, A.; Mendalek, N.; Al-Haddad, K. A New Control Technique for Three-Phase Shunt Hybrid Power Filter. IEEE Trans. Ind. Electron. 2009, 56, 2904–2915. [Google Scholar] [CrossRef]
- Deng, J.; Qi, Z.; Xia, N.; Gao, T.; Zhang, Y.; Duan, J. Control Strategy and Parameter Optimization Based on Grid Side Current Dynamic Change Rate for Doubly-Fed Wind Turbine High Voltage Ride Through. Energies 2022, 15, 7977. [Google Scholar] [CrossRef]
- Rodriguez, P.; Pou, J.; Bergas, J.; Candela, J.I.; Burgos, R.P.; Boroyevich, D. Decoupled Double Synchronous Reference Frame PLL for Power Converters Control. IEEE Trans. Power Electron. 2007, 22, 584–592. [Google Scholar] [CrossRef]
- Jain, B.; Jain, S.; Nema, R.K. Control strategies of grid interfaced wind energy conversion system: An overview. Renew. Sustain. Energy Rev. 2015, 47, 983–996. [Google Scholar] [CrossRef]
- Luo, X.; Wang, J.; Dooner, M.; Clarke, J. Overview of current development in electrical energy storage technologies and the application potential in power system operation. Appl. Energy 2015, 137, 511–536. [Google Scholar] [CrossRef]
- Dantas, N.K.L.; Souza, A.C.M.; Vasconcelos, A.S.M.; Junior, W.d.A.S.; Rissi, G.; Dall’orto, C.; Maciel, A.M.A.; Castro, J.F.C.; Liu, Y.; Rosas, P. Impact Analysis of a Battery Energy Storage System Connected in Parallel to a Wind Farm. Energies 2022, 15, 4586. [Google Scholar] [CrossRef]
- Pontes, L.; Costa, T.; Souza, A.; Dantas, N.; Vasconcelos, A.; Rissi, G.; Dias, R.; Mohamed, M.A.; Siano, P.; Marinho, M. Operational Data Analysis of a Battery Energy Storage System to Support Wind Energy Generation. Energies 2023, 16, 1468. [Google Scholar] [CrossRef]
- Teleke, S. Control Methods for Energy Storage for Dispatching Intermittent Renewable Energy Sources; North Carolina State University: Raleigh, NC, USA, 2009. [Google Scholar]
- Atif, A.; Khalid, M. Fuzzy logic controller for solar power smoothing based on controlled battery energy storage and varying low pass filter. IET Renew. Power Gener. 2020, 14, 3824–3833. [Google Scholar] [CrossRef]
- Ochoa, D.; Martinez, S.; Arévalo, P. A Novel Fuzzy-Logic-Based Control Strategy for Power Smoothing in High-Wind Penetrated Power Systems and Its Validation in a Microgrid Lab. Electronics 2023, 12, 1721. [Google Scholar] [CrossRef]
- IRENA. Electricity Storage and Renewables: Costs and Markets to 2030; IRENA: Abu Dhabi, United Arab Emirates, 2017. [Google Scholar]
- IRENA. Battery Storage for Renewables: Market Status and Technology Outlook; IRENA: Abu Dhabi, United Arab Emirates, 2015. [Google Scholar]
- Mitali, J.; Dhinakaran, S.; Mohamad, A. Energy storage systems: A review. Energy Storage Sav. 2022, 1, 166–216. [Google Scholar] [CrossRef]
- Van der Hoven, I. Power spectrum of horizontal wind speed in the frequency range from 0.0007 to 900 cycles per hour. J. Atmos.Sci. 1957, 14, 160–164. [Google Scholar] [CrossRef]
- Leow, Y.Y.; Ooi, C.A.; Hamidi, M.N. Performance evaluation of grid-connected power conversion systems integrated with real-time battery monitoring in a battery energy storage system. Electr. Eng. 2019, 102, 245–258. [Google Scholar] [CrossRef]
- COSERN. Potencial Eólico do Estado do Rio Grande do Norte. 2003. Available online: http://www.cresesb.cepel.br/publicacoes/download/atlas_eolico/atlas_eolico_RN.pdf (accessed on 1 March 2023).
- Tremblay, O.; Dessaint, L.-A. Experimental Validation of a Battery Dynamic Model for EV Applications. World Electr. Veh. J. 2009, 3, 289–298. [Google Scholar] [CrossRef]
- Tremblay, O.; Dessaint, L.-A.; Dekkiche, A.-I. A Generic Battery Model for the Dynamic Simulation of Hybrid Electric Vehicles. In Proceedings of the IEEE Vehicle Power and Propulsion Conference, Arlington, TX, USA, 9–12 September 2007; pp. 284–289. [Google Scholar]
- Würth, I.; Valldecabres, L.; Simon, E.; Möhrlen, C.; Uzunoğlu, B.; Gilbert, C.; Giebel, G.; Schlipf, D.; Kaifel, A. Minute-Scale Forecasting of Wind Power—Results from the Collaborative Workshop of IEA Wind Task 32 and 36. Energies 2019, 12, 712. [Google Scholar] [CrossRef]
- Giebel, G.; Brownsword, R.; Kariniotakis, G.; Denhard, M.; Draxl, C. The State-of-the-Art in Short-Term Prediction of Wind Power: A Literature Overview; ANEMOS. Plus: Roskilde, Denmark, 2011. [Google Scholar]
- Teleke, S.; Baran, M.E.; Bhattacharya, S.; Huang, A.Q. Rule-Based Control of Battery Energy Storage for Dispatching Intermittent Renewable Sources. IEEE Trans. Sustain. Energy 2010, 1, 117–124. [Google Scholar] [CrossRef]
| Disclaimer/Publisher’s Note: The statements, opinions and data contained in all publications are solely those of the individual author(s) and contributor(s) and not of MDPI and/or the editor(s). MDPI and/or the editor(s) disclaim responsibility for any injury to people or property resulting from any ideas, methods, instructions or products referred to in the content. |
© 2023 by the authors. Licensee MDPI, Basel, Switzerland. This article is an open access article distributed under the terms and conditions of the Creative Commons Attribution (CC BY) license (https://creativecommons.org/licenses/by/4.0/).

 ,
, 


