1. Introduction
In recent years, the use of nonlinear loads, which draw non-sinusoidal currents, and the occurrence of faults at various locations within electrical distribution systems have led to a significant increase in Power Quality Disturbances (PQDs). Consequently, mitigating and managing PQDs has become a critical challenge in the field of power system engineering and research [
1]. Ensuring the stability and maintaining the electrical service quality of power systems remains of utmost importance, particularly during contingency events, such as the loss of transmission lines or generating units. In such situations, robust measures and novel control strategies are imperative to sustain the reliability and efficiency of electrical power networks [
2].
The power system should be maintained in a stable state considering interruptions, over and under voltages, current and voltage harmonics, voltage sag/swell, transients, unbalanced voltage, and other disturbances that could lead to instability. For instance, balanced loading plays an important role in preventing unbalanced conditions that might lead to equipment damage and inefficient power distribution. Mitigating high harmonic distortions helps improve power quality. Reactive power compensation is necessary to maintain the power factor at an optimal level, thereby enhancing the overall system efficiency. Protection devices should be employed to handle faults and disturbances without disconnecting from the grid. Several critical factors must be considered when operating a power system without compromising its security and supply quality. To enhance power quality standards within existing distribution systems, a novel concept called Power Quality Mitigation Devices (PQMDs) has been introduced. Each PQMD has specialized functionalities and capabilities in terms of design and control strategies employed. This concept offers new opportunities to reduce the negative effects of disturbances and enhance the usable capacity of existing distribution systems. PQMDs are also utilized to improve power quality, system stability, and overall system efficiency.
The Dynamic Voltage Restorer (DVR), Static VAR Compensator (SVC), Active Power Filter (APF), Thyristor-Switched Capacitor (TSC), Uninterruptible Power Supply (UPS), and Distribution Static Synchronous Compensator (D-STATCOM) are the most commonly used Power Quality Mitigation Devices (PQMDs) for enhancing the quality of distribution systems. Among these devices, the DVR is employed to regulate and stabilize the voltage supplied to sensitive loads, such as data centers, medical equipment, telecommunication networks, semiconductor manufacturing, industrial processes, and sensitive electronic devices. It safeguards electrical and electronic systems against various Power Quality Disturbances, including harmonics, over-voltage, and under-voltage conditions. DVR continuously monitors the voltage at the load side and responds almost instantaneously to any disturbances. By injecting a required voltage with the appropriate magnitude and phase, its units compensate for voltage sags, swells, voltage harmonics, lightning strikes, or switching operations. As a result, it reduces the distortion and improves the power quality at the load side. Commercially available UPS devices can be also considered as low-power versions of DVR.
Advanced control algorithms such as proportional integral control, fuzzy logic, or model predictive control can be implemented to address specific power quality issues. This adaptability allows the DVR to accommodate different operating conditions and disturbance scenarios [
1]. The primary component of its power circuit is the voltage source inverter (VSI). It converts the DC voltage obtained from the energy storage into an AC voltage, which is then injected into the power system. The energy storage (battery or capacitor bank) provides instant power when needed to stabilize the voltage. Pulse Width Modulation (PWM) techniques are employed in its power circuit to control the switching elements of the VSI, generating an AC voltage with adjustable amplitude, phase, and frequency. The power circuit is equipped with voltage and current sensors to monitor the system dynamics. These measurements are fed back to the control system to adjust the operation of the VSI accordingly. Power semiconductor devices, such as insulated-gate bipolar transistors or metal-oxide-semiconductor field-effect transistors, are used in the power circuit of the VSI as switching devices. In high-power applications, isolation transformers are positioned between the VSI and the power system. This isolation safeguards the DVR from the adverse effects of the grid or other connected equipment during its operation. Moreover, the power circuit of the DVR effectively manages high-power applications with low power levels, achieving efficient regulation at relatively low costs.
In the literature of electrical engineering, the importance of detecting disturbances and generating compensation signals for PQMDs has been emphasized by numerous papers. Among these studies, various methods based on Clarke (αβ) and Park (dq0) transformations have been utilized, and novel approaches have been proposed for both PQMDs and DVRs. For instance, a control algorithm based on extracting negative sequence voltage was proposed to compensate for unbalanced voltage conditions and faults in wind farms employing squirrel-cage induction generators [
3]. However, the voltage sag/swell detection algorithm for the DVR was not provided due to the utilization of STATCOM in the test system. Another closed-loop control algorithm employed Posicast (P) and P-Resonant controllers to enhance transient response and eliminate steady-state error [
4]. Case studies were conducted on a 13-bus balanced industrial system following IEEE Standards. Although the negative effects of the induction motor on the test system were mitigated during the starting process, voltage transients could not be fully restored while limiting the fault current. Enhanced Clarke transformation-based methods were introduced to accurately extract phase angles and promptly detect changes in voltage magnitude [
5,
6]. These methods relied on expressing sinusoidal or cosine functions by taking their first derivatives. A novel control method based on a stationary frame, integrating a proportional-resonant controller into the sequence-decouple resonant controller, was also proposed [
7]. This method’s performance was tested under various conditions, including voltage sag/swell and voltage distortions, and simulation results showcased improved power quality under these system conditions. Additionally, a pre-fault voltage compensation method based on Park’s transformation was suggested [
8]. This approach utilized a multilevel inverter-based DVR to execute the proposed control strategy. Simulation case studies demonstrated its ability to mitigate various types of voltage disturbances without requiring an injection transformer or a harmonic filter bank.
Instead of utilizing common controllers like PI or PID, digital filters are employed to predict the phase angle and magnitude of phase voltages. The power circuit was designed to operate as a UPS; therefore, no bypass switch was integrated into the circuit to remove it from service. Consequently, voltage sag–swell detection was not incorporated into the control algorithm [
9]. The positive and negative symmetrical components of phase voltage were extracted to maintain the voltage of sensitive loads within the required amplitude and phase angle boundaries during voltage disturbances. Furthermore, the negative and zero sequence components were eliminated from the supply voltage in cases of unbalanced voltage sags [
10]. In general, Instantaneous Reactive Power Theory (IRPT), Synchronous Reference Frame (SRF), Instantaneous Power Theory (PQR), and their derivatives are commonly preferred for promptly detecting voltage sag/swell and extracting compensation voltages for other disturbances [
11,
12,
13].
In these methods, the dynamics of the three-phase power system are typically utilized to transform the system into a two-quadrature unit vector system using the Clarke transformation. Subsequently, the αβ-frame is transformed into the dq-frame system using the Park transformation to extract the active and reactive components of these variables [
14,
15,
16,
17,
18,
19,
20]. The variables along the αβ-axes are adversely influenced based on the type of voltage disturbances. For instance, oscillations with varying shapes were observed in the phase–angle curve during unbalanced voltage disturbances [
21,
22]. Recent studies have introduced additional methods to mitigate the impact of unbalanced voltages on the αβ-frame. These methods include the application of Discrete Fourier Transform to extract voltage harmonics [
14], the utilization of proportional-resonant voltage and inner PID current controllers to stabilize capacitor voltage [
16], the incorporation of Fuzzy Logic and Particle Swarm Optimization to adjust PI controller parameters [
18], and the implementation of a digital-repetitive controller to suppress the adverse effects of harmonics [
20]. Nevertheless, these supplementary methods might introduce delays in the algorithm’s response during emergency conditions.
A single-phase phase-locked loop (PLL) was proposed in [
23]. It consisted of a pre-loop and two-stage all-pass filters. To track reference voltage signals, a sliding mode controller (super twisting type) was employed. Experimental case studies demonstrated its ability to detect load voltage variations and compensate to maintain a constant load voltage. A detection method based on the Hilbert Transform (HT) was proposed for identifying voltage variations [
24]. This approach also incorporated a moving average filter and a fuzzy system. The proposed method’s validity was confirmed through experimental and simulation case results. A signal processing scheme was developed using a phasor measurement unit (PMU) and a homogeneity approach [
25]. PQDs were classified using if-else functions, with PMU information directly contributing to categorizing sags, swells, and other types of PQDs. Synthetic and real signals of PQDs were utilized to validate and test the proposal, and the results from these cases demonstrated effective detection and categorization of PQDs. An average of absolute error integrated second-order generalized-integrator frequency-locked loop (SOGI-FLL) based method was also introduced [
26]. The average absolute error was obtained using a low-pass filter. Its performance was evaluated using both simulation case studies and real-time Typhoon Hardware.
Energy storage systems are among the approaches utilized to maintain the quality of power in electrical networks [
27,
28,
29]. They offer several benefits that contribute to ensuring reliable and efficient electricity quality. These advantages include grid stabilization, black start capability, peak shaving, renewable energy integration, load balancing, and microgrids. When strategically employed alongside PQMDs, these systems can enhance grid stability, reliability, and quality. The control algorithm of PQMDs plays a crucial role in this context. Generally, IRPT, SRF, and PQR-based methods are employed in the literature. These methods leverage the system dynamics (voltages, currents, and active and reactive powers) along with additional strategies (such as PLL) to generate compensation signals for disturbances and inject these signals via PQMDs into distribution systems to improve power quality. However, the compensation signals obtained from these methods are susceptible to both balanced and unbalanced disturbances, leading to inaccuracies in signal generation. In this study, a new and simple method based on the Clarke transformation was proposed to mitigate the adverse effects of both balanced and unbalanced disturbances. The proposed method involves expressing any vector of the Clarke transformation in terms of another by taking its first derivative. This approach eliminates the shortcomings of the αβ transformation mentioned earlier while preserving its fast response ability during disturbances, thereby addressing potential delays. Detailed theoretical explanations are provided, supported by implementation in the Power System Computer-aided Design (PSCAD) simulation program. Various common Power Quality Disturbances, including voltage sags, unbalanced voltage conditions, and line–ground faults, were applied to assess its effectiveness under distorted system conditions. The proposed method’s performance was evaluated through case studies encompassing various system conditions, and the results were compared with conventional methods.
The rest of this paper is organized as follows.
Section 2 provides a brief explanation of the mathematical derivation of the proposed method.
Section 3 illustrates its application for Power Quality Mitigation Devices. The case studies of the proposed method are presented in
Section 4. Finally,
Section 5 presents the conclusions.
2. Mathematical Derivation of the Proposed Method
In power system analysis, the mathematical analysis of three-phase systems involves complex equations. When dealing with unbalanced fault conditions, the analysis becomes particularly challenging. To simplify the analysis process and reduce mathematical intricacies, a transformation is employed to convert the three-phase stationary system into a two-quadrature unit vector system, where the vectors are orthogonal to each other [
30]. This approach makes the analysis more manageable, enhancing the efficiency and effectiveness of studying power systems and gaining insights into their behavior. A three-phase stationary system can be defined using
(t),
(t), and
(t) in the following form.
where
is the maximum value of line voltage, ω is the angular velocity of
.
In the three-phase stationary system, it becomes evident that only the currents and voltages of two phases possess linear independence, whereas the variables of the remaining phase can be expressed as a linear combination of these independent quantities. Leveraging this property, the voltages within the stationary reference frame can be effectively mapped to the phase voltages of the complex orthogonal frame. This mapping process is graphically illustrated in
Figure 1. The conversion of the three-phase stationary system into a two-quadrature unit vectors system is known as the Clarke transformation (αβ transformation) [
31].
This transformation is facilitated through the utilization of Equation (2). It is important to note that the combined vectors representing the B-phase and C-phase are separated into u
α and u
β vectors of the αβ-frame. In this scenario, a mathematical relationship is established between these vectors.
The u
α and u
β vectors of αβ-frame and the angle (φ) between them are calculated by using geometrical concerns and applying the trigonometric relationships in Equations (1) and (2).
where u is the instant voltage vector of the αβ-frame.
Building upon the mathematical expressions provided in Equations (3) and (4), several trigonometric relationships emerge between the voltage components u
α and u
β within the orthogonal frame. These relationships resemble complementary angles. Further examination and mathematical derivation of these relationships result in the formulation of Equation (7).
In accordance with Equation (7), a constant ratio exists between the u
α and u
β vectors within the orthogonal frame when u is constant, and it is directly affected by the disturbances occurring in the electrical power system. Additionally, these disturbances impact the calculation of φ negatively, as u
α and u
β vectors are used in the tangent calculation of φ. Examples of such disturbances include single-phase (d
1), two-phase (d
2), and three-phase unbalanced (d
3) faults to the ground. Their adverse effects result in fluctuations in the phase angle curve due to the mathematical correlation between u
α and u
β vectors. These negative effects are illustrated in
Figure 2.
Minimizing the interaction between the u
α and u
β vectors during the calculation of φ is of great significance. Fortunately, the geometric and trigonometric relationships of these vectors offer an opportunity to achieve this objective. Firstly, it is known that the waveform of the u
β vector lags 90 degrees behind the waveform of the u
α vector. Leveraging this characteristic, a reformulation of the u
β vector in the proposed method, denoted as the u
β new vector, is presented in Equation (10) by taking the first derivative of the u
α vector and expressing the u
β vector in terms of the u
α vector. This reformulation effectively breaks this interaction. For instance:
The contribution of this study to the literature is the enhancement of the αβ transform in handling unbalanced faults and harmonics through the reduction of interaction between the u
α and u
β vectors. This is achieved by employing Equation (10) instead of the u
β vector in Equation (11) to calculate the value of φ. Consequently, the proposed method minimizes the adverse effects of disturbances on φ.
The proposed method has four distinguishing features from the Clarke transformation. The highlights of these features are explained below.
The first feature involves reformulating the u
α or u
β vectors by substituting the first derivative of Equations (3) or (4) interchangeably, as demonstrated in [
20]. This reformulation facilitates the utilization of a straightforward algorithm based on φ for performing voltage sag detection and extracting compensation signals.
Mathematically, Phase-C can be expressed as a combination of Phase-A and Phase-B using trigonometric functions. As a result, this relationship establishes a proportionality between the uα and uβ vectors of the Clarke transformation. In the presence of an unbalanced system, the uα and uβ vectors are adversely affected due to this inherent association. One approach to mitigate this drawback involves expressing the uα vector or the uβ vector in terms of itself. In the proposed method, this was achieved by taking the first derivative of a chosen variable. This approach effectively eliminates the negative impact of the interrelation between the uα and uβ vectors, thereby enhancing the performance and accuracy of the system under unbalanced conditions.
Even in the presence of sudden changes in Equation (3), Equation (4) is equally influenced. In this case, the value of their ratios does not linearly increase or decrease during the calculation of φ. These changes result in fluctuations in the φ curve. However, if Equations (3) and (10) are used in the calculation of φ, the value of their ratios linearly increases or decreases. In this scenario, the effects of sudden changes do not cause any fluctuations in the φ curve. As a result, the proposed algorithm correctly achieves sag detection and compensation signal extraction.
Equation (11) is derived from pure sinusoidal signals without considering voltage harmonics and other waveform distortions. Therefore, its robustness should be increased by integrating additional methods. The improvement of the proposed method against disturbances was achieved by employing digital filters, as described in the following subsection.
3. Improvement of the Proposed Method for Power Quality Disturbances
Voltage and current harmonics are common PQDs in electrical distribution systems. They usually occur during short circuits, grounding issues, and the operation of switching mode power supplies. Consequently, to address these harmonics, modifications are required for Equations (3) and (4) [
33]. These equations can then be rewritten in the following form:
where u
αh and u
βh are the magnitudes of u
α and u
β harmonics, and h is the harmonic indices, respectively.
In a real power system, the derivation of Equation (11) is inadequate for the precise calculation of φ due to the presence of harmonics. To enhance its robustness, Equations (12) and (13) should be taken into consideration. In light of this, improvements can be achieved by mitigating the negative effects of disturbances. The second distinctive feature of the proposed method is the utilization of digital filters to minimize disturbance levels in the measured signals. The implementation of the proposed method is illustrated in
Figure 3.
The robustness of the proposed method is achieved by considering power system harmonics and waveform distortions. The application of its control mechanism can be divided into four parts. In the first part, the three-phase signals (u
a+h, u
b+h, and u
c+h) containing harmonics are transformed into orthogonal u
α+ah (Equation (12)) and u
β+βh (Equation (13)) signals using the αβ transform. To eliminate the harmonics, a second-order low-pass filter (provided in Equation (14)) from the PSCAD library is employed to obtain u
α (Equation (3)) at its output [
34].
where G is the gain,
is the damping ratio and ω
c is the characteristic frequency.
The values of G, ω
c, and ξ were selected as 0.5, 0.1, and 50 in the algorithm of the proposed method, respectively. The derivation of Equation (3) is then computed and divided by the term “ω”. As a result, the relationship between u
α and u
β of Equation (2) is minimized, and a new u
β is obtained by using Equation (10) in the second part. The value of φ obtained by using Equation (10), instead of u
β in Equation (11), is added with the phase difference (φ
dif) caused by using the low-pass filter. In the algorithm of the proposed method, φ
dif was calculated as 4.2°. After the calculation of φ, u
αnew and u
βnew are generated by using Equations (15) and (16) in the third part and the results are multiplied by U
m for the reference calibration. The value of U
m was selected as 0.311 in the algorithm of the proposed method. Then, the reference signals (u
aref, u
bref, and u
cref) of phase voltages are obtained by using the multiplication results of U
m with u
αnew and u
βnew in inverse Clarke transformation. The equation of inverse Clarke transformation is given in (17).
The voltage sag detection (uout) and compensation signal extractions (uacom, ubcom, and uccom) of the proposed method are performed in the fourth part. The output of Equation (7) can be used as a voltage sag and swell indicator. During voltage sag/swell and other waveform distortions, it is directly affected, and instant sinusoidal oscillations occur on its straight line in the Clarke transformation. The weakness of Equation (7) was eliminated by using uβnew instead of uβ, thereby making it applicable for finding the voltage drop in the proposed method. The output of Equation (7) is compared with its references using a simple comparator, where ur1 represents the maximum magnitude of voltage sag, and ur2 represents the minimum magnitude of voltage swell. In the proposed method, ur1 and ur2 were determined as 0.465 V and 0.468 V, respectively.
The output of the comparator is multiplied by the compensation signals obtained through the subtraction of three-phase voltages from their references. Additionally, the reference signals of the proposed algorithm can also serve as compensation signals for the UPS. There are two important points to note. The first important point is that if the phase voltages of the power system have no harmonics or waveform distortions, the low-pass filters can be omitted from the algorithm, and the value of φdif should be taken as 0. The second important point is that if the phase voltages have harmonics or waveform distortions, the multiplication of uout with compensation signals should be removed from the algorithm.
4. Case Studies
The performance of the proposed method was evaluated through two case studies. The results from the proposed method’s case studies were compared with common methods such as IRPT, SRF, and PQR to demonstrate its validity. In the first case study, common disturbances were applied to the test system. In the second case study, a 5th voltage harmonic was injected into the supply of the test system. The fault detection and extraction of compensation signals from these methods were obtained simultaneously, and their results were presented on the same scale.
Case 1: Fault conditions
The voltage source of the test system was chosen to be resistive, with a voltage rating of 0.220 kV (L-L) and a frequency of 50 Hz. A load with inductive characteristics was connected to the test system, with resistance and inductance values of 50 ohms and 0.16 H for each phase, respectively. Unbalanced loads were connected to the three-phase fault block to create unbalanced sag/swell voltage disturbances. The simulation time step was set to 20 µs. The power circuit of the simulation test system is illustrated in
Figure 4.
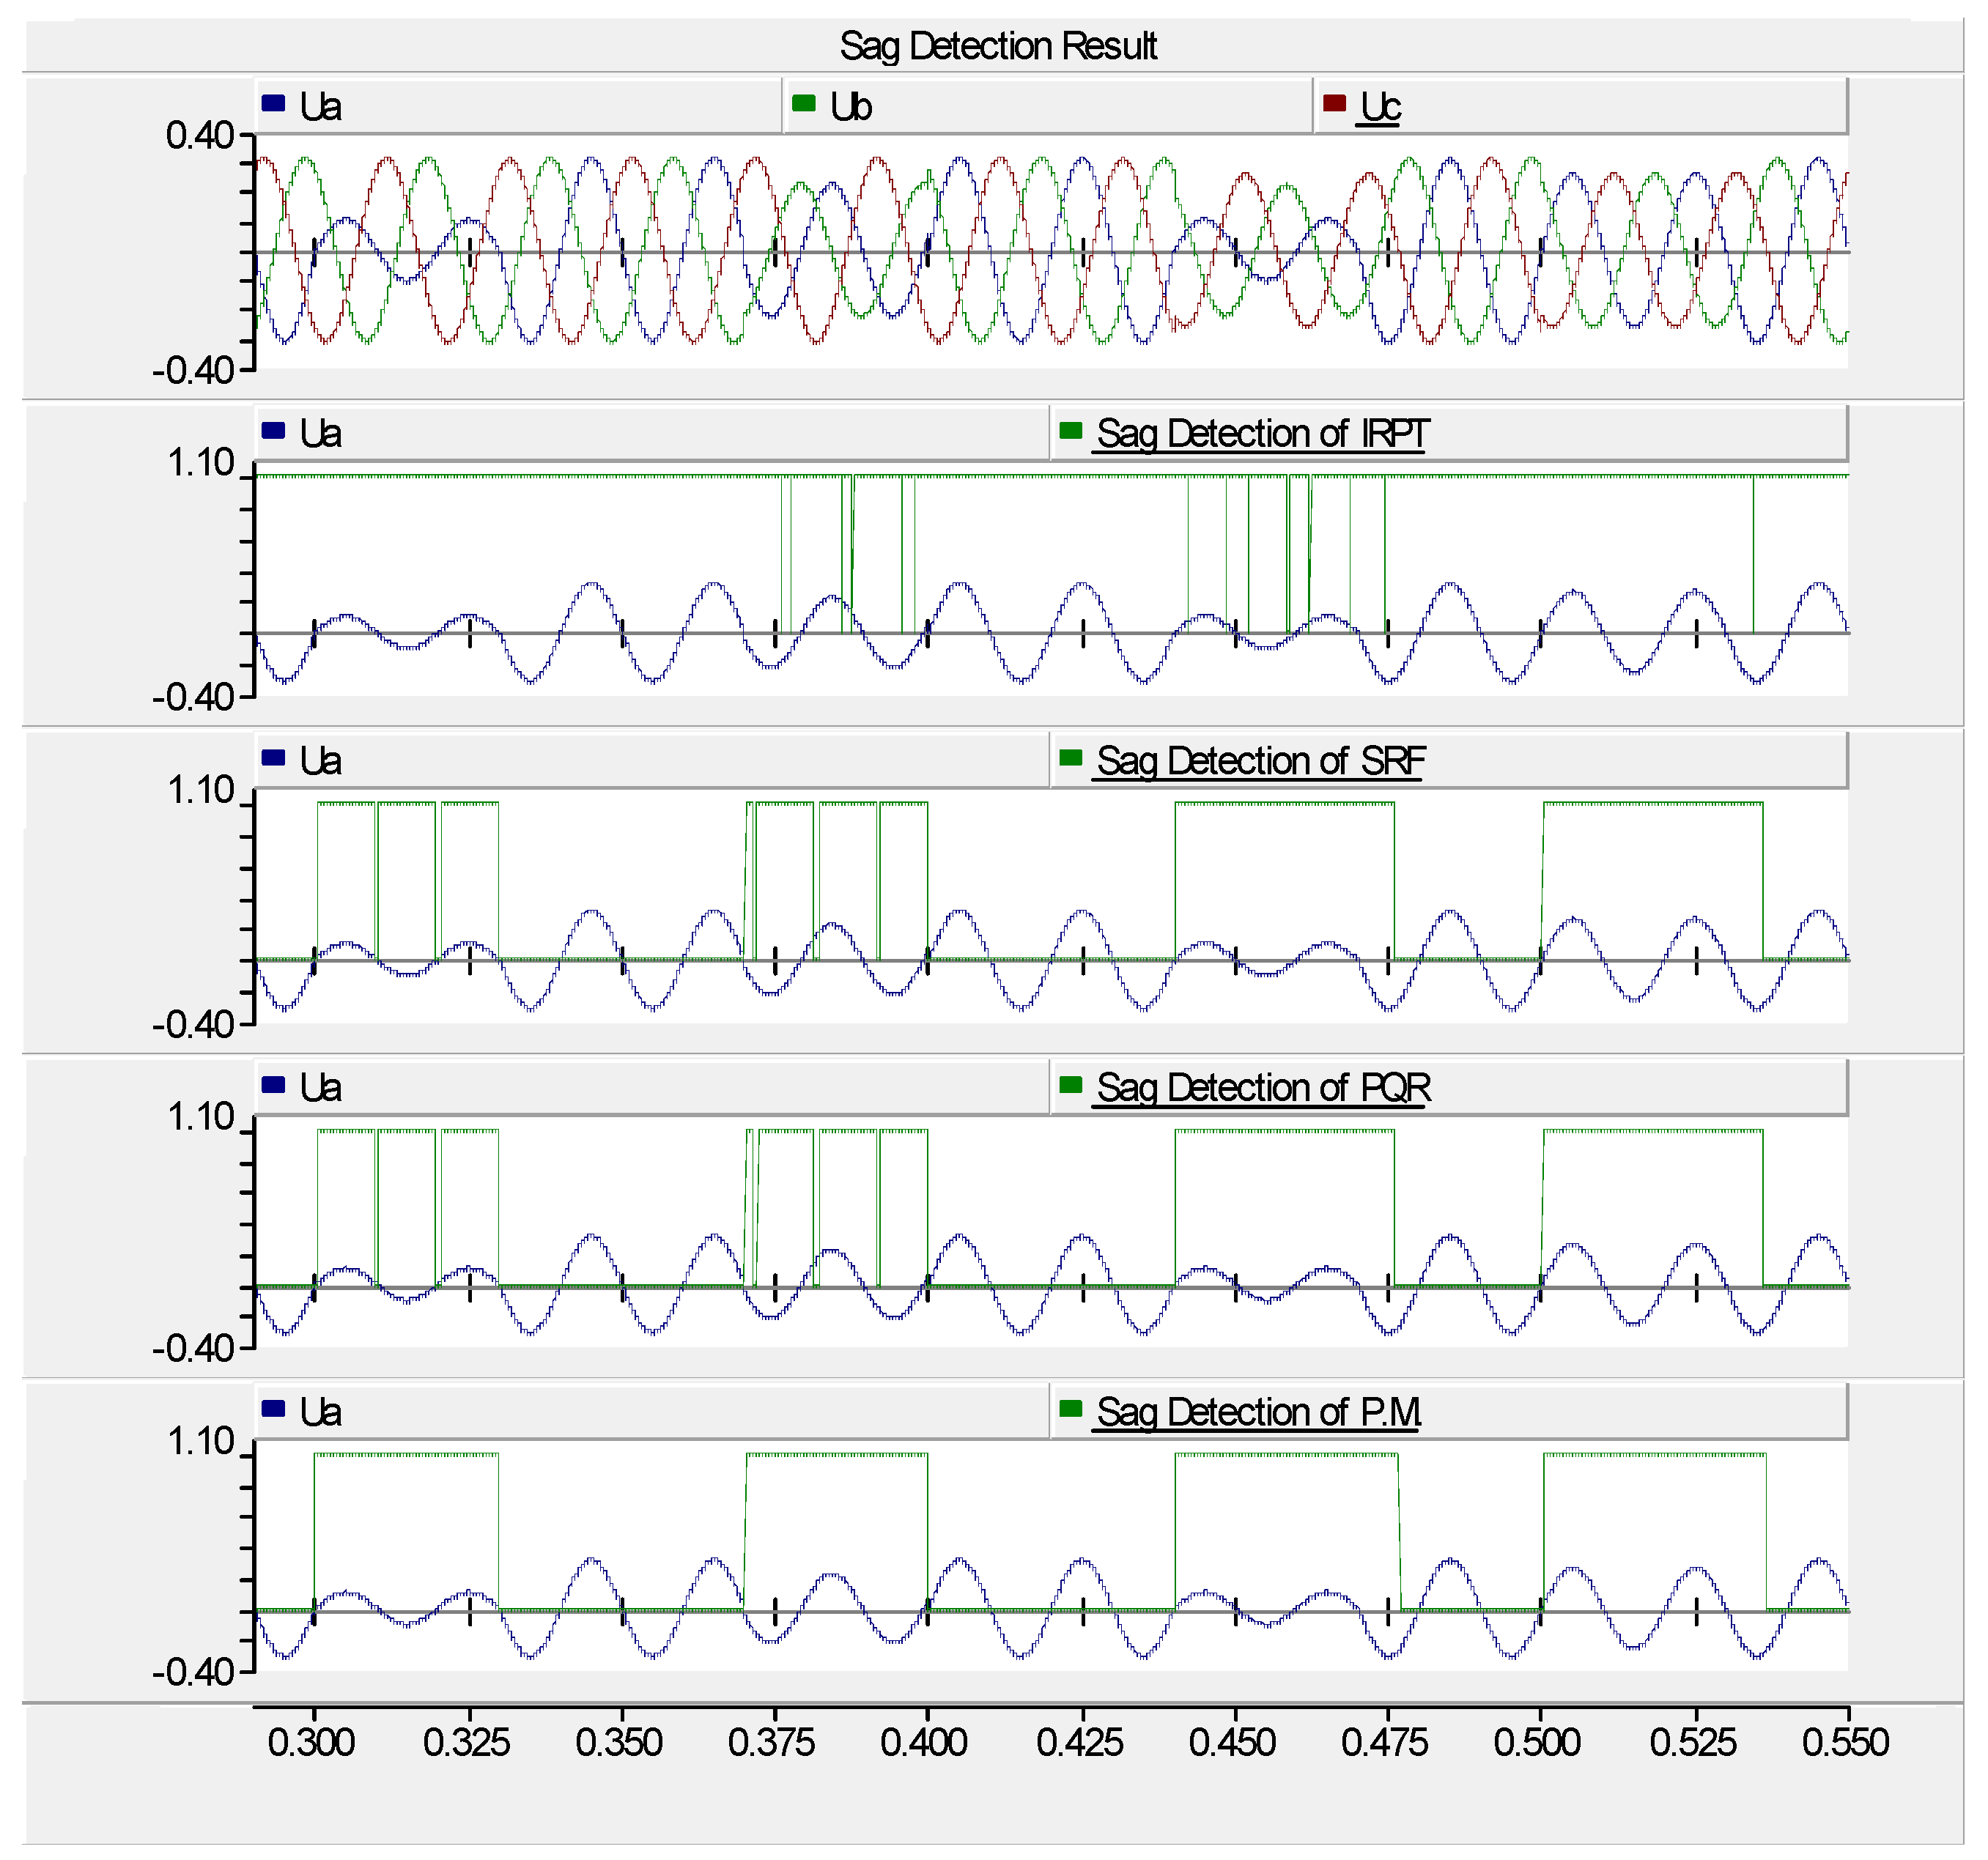
The performance of the proposed method was evaluated under several disturbances. Firstly, a single-phase voltage sag (f
1) was applied to the simulation test system by creating a phase-A to ground fault from 0.30 s to 0.33 s. Secondly, two-phase unbalanced voltage sag (f
2) was applied by creating a short circuit between phase-A and phase-B from 0.37 s to 0.40 s. Thirdly, a three-phase unbalanced voltage sag (f
3) was applied by creating a three-phase line to ground fault from 0.44 s to 0.47 s through a resistive unbalanced load. Immediately after, a three-phase balanced voltage sag (f
4) was applied by creating a three-phase line to ground fault from 0.50 s to 0.53 s through a resistive balanced load. The voltage sag detection outputs (u
out) of the proposed method (P.M.) and other methods are presented in
Figure 5.
The sag detection outputs (u
out) of the four methods are graphically presented at the same scale in
Figure 5 for easy comparison. According to the results, IRPT was consistently affected by these disturbances since it directly used line voltages and currents without employing any interface algorithm in its mathematical calculations. However, SRF and PQR methods utilized a PLL as an interface algorithm, resulting in a significant reduction of the negative effects during the occurrence of three-phase balanced and unbalanced voltage conditions. The proposed method exhibited the best performance as it minimizes the relationship between u
α and u
β by expressing u
β in terms of u
α through its first derivative.
The compensation signal outputs (u
acom) of these methods were extracted as additional results of Case 1 and are presented in
Figure 6. Each method was graphically illustrated with its corresponding u
acom and the verification signal of u
a, all on the same scale. The verification signal for each method was obtained by adding u
acom to u
a. The results indicate that the negative effects of unbalanced voltage disturbances were observed in the u
acom outputs of IRPT and its corresponding verification. During f
2, the control algorithm of IRPT generated excessive u
acom according to its requirements but failed to provide accurate compensation.
Similarly, SRF and PQR methods were also affected by both balanced and unbalanced voltage conditions. While SRF accurately compensated for the negative effect of the f
2 condition, disregarding other disturbances, the PQR method could only compensate for the negative effect of f
4. On the other hand, the proposed method demonstrated the best performance in compensating for the negative effects of both balanced and unbalanced voltage sag conditions. The u
acom and verification graphics for each method are presented in
Figure 6.
The results of Case 1 are summarized under two main topics in
Table 1. Under the first topic, the sag detection outputs were compared by considering the four voltage conditions. According to the results, IRPT showed the worst performance while SRF and PQR gave correct results for f
3 and f
4 conditions. Under the second topic, the compensation signal outputs were compared under the same voltage conditions. The compensation signal for f
2 and the compensation signal for f
4 were generated correctly by SRF and PQR, respectively. However, the proposed method gave the best performance among these methods.
Case 2: Voltage harmonic conditions
In this case, the performance of the proposed method was evaluated under voltage harmonic conditions by applying two different types of disturbances. To inject a voltage harmonic, additional sources with ratings of 0.015 kV (L-L) and 250 Hz were connected in series with the lines, thus creating 5th voltage harmonic conditions within the test system. Similarly to the previous case study, the voltage source of the test system was chosen to be resistive, with a voltage rating of 0.220 kV (L-L) and a frequency of 50 Hz. The resistance and inductance values of the load were selected as 50 ohms and 0.16 H for each phase, respectively. Balanced and unbalanced loads were connected to the three-phase fault block to create unbalanced sag/swell voltage disturbances. The simulation time step was set to 20 µs. The power circuit of the simulation test system is illustrated in
Figure 7.
Firstly, f3 was applied to the simulation test system from 0.30 s to 0.33 s, followed by the application of f4 from 0.37 s to 0.40 s. During the first fault, a high current flowed from the line to the ground. In this scenario, the magnitude of its compensation signal would be proportionally high, depending on the current’s magnitude. According to the results, the IRPT method generated a compensation signal with a significantly lower magnitude, whereas the SRF and PQR methods produced compensation signals with higher magnitudes.
During the second fault, a low current flow compared to the first fault occurred from the line to the ground. According to the results, the compensation signal could not be correctly generated by the IRPT and SRF methods, whereas the PQR method generated compensation signals correctly. However, the proposed method exhibited the best performance in both compensating for the negative effects of the disturbances and compensating for voltage harmonics. Additionally, it easily extracted the injected harmonic. This situation was indicated by enclosing it within a circle and labeling it as the 5th harmonic on the graph. The u
acom outputs of the methods, along with their verification results, are presented in
Figure 8.
The results of Case 2 are summarized in
Table 2. The compensation signal outputs are compared under the same voltage conditions. The compensation signals of IRPT, SRF, and PQR for f
4 could not be generated correctly, whereas the correct compensation signal for f4 was generated by PQR. However, the proposed method gave the best performance among these methods.
5. Conclusions
The Clarke transformation-based methods, including IRPT, SRF, and PQR, utilize phase voltages and line currents for detecting voltage sags and generating reference signals. They are also faster at detecting Power Quality Disturbances (PQDs) compared to frequency domain-based methods. However, these methods directly experience the negative effects of PQDs due to the use of current and voltage variables without any interface method in their mathematical calculations. Therefore, minimizing the negative effects on the Clarke transform becomes essential. In this study, a new and simple method is proposed based on the αβ transform to mitigate the negative effects of voltage disturbances, addressing the limitations of this transformation. A detailed mathematical derivation of the proposed method is given, followed by a graphical presentation of its application.
The first feature of the proposed method involves reformulating uα or uβ vectors by substituting the first derivative of Equations (3) or (4) in place of each other. This enables voltage sag detection and compensation signal extraction using a simple algorithm based on φ. This approach effectively eliminates the negative impact of the interrelation between uα and uβ vectors, thereby enhancing system performance and accuracy under unbalanced conditions. During disturbances, both Equations (3) and (4) are equally influenced, and their ratios do not linearly increase or decrease in the calculation of φ. Consequently, the negative effects of disturbances introduce fluctuations in the φ curve. However, if Equation (10) is used instead of Equation (4), the ratios’ values linearly increase or decrease, and the negative effects of disturbances do not cause fluctuations in the φ curve. Thus, the proposed algorithm accurately achieves sag detection and compensation signal generation. Conventional methods are negatively affected by power system harmonics, and they use digital filters to counteract these effects. Similarly, the proposed method needs enhancement against harmonics, which was achieved by implementing digital filters. The φ of the proposed method can be integrated into adaptive PLL algorithms for reference extraction. Additionally, the compensation signal extraction property presented in Case 2 can be incorporated into the control algorithm of APFs for current harmonics extraction.
The performance of the proposed method was compared with IRPT, SRF, and PQR through two case studies using PSCAD (v.4.2.1). The case studies involved the application of balanced and unbalanced disturbances to the test system. Based on the results, the proposed method demonstrates accurate fault detection and convenient extraction of the compensation signal using the nominal phase voltage, surpassing the performance of the other methods. Thus, the case studies serve to validate the effectiveness of the proposed method.


