Article

A Numerical Study on Labyrinth Screw Pump (LSP) Performance under Viscous Fluid Flow

1
State Key Laboratory of Shale Oil and Gas Enrichment Mechanisms and Effective Development, Beijing 102206, China
2
China Petrochemical Corporation, Petroleum Exploration and Production Research Institute, Beijing 102206, China
3
College of Mechanical and Transportation Engineering, China University of Petroleum-Beijing, Beijing 102249, China
4
College of Elementary Medicine, North China University of Science and Technology, Tangshan 063000, China
5
McDougall School of Petroleum Engineering, The University of Tulsa, Tulsa, OK 74104, USA
*
Authors to whom correspondence should be addressed.
Energies 2023, 16(16), 5997; https://doi.org/10.3390/en16165997
Submission received: 24 May 2023 / Revised: 11 July 2023 / Accepted: 13 July 2023 / Published: 16 August 2023
(This article belongs to the Special Issue Advances in Petroleum Exploration and Production)

Abstract

:
In this study, fluid viscosity effects on LSP performance in terms of boosting pressure were numerically investigated. A water–glycerin mixture with different concentrations corresponding to varying apparent viscosities was flowed through an in-house manufactured LSP under various flow conditions, e.g., changing flow rates, rotational speeds, and fluid viscosities. The pressure increment between the intake and discharge of the LSP was recorded using the differential pressure transducer. The same pump geometries, fluid properties and flow conditions were incorporated into the numerical configurations, where three-dimensional (3D), steady-state, Reynolds-averaged Navier–Stokes (RANS) equations with a standard SST (shear stress transport) turbulence model were solved by a commercial CFD code. With the high-quality poly-hexcore grids, the simulated pressure increment was compared with the corresponding experimental measurement. The internal flow structures and characteristics within the cavities contained by the LSP impeller and diffuser were also analyzed. The good agreement between the numerical results against the experimental data verified the methodology adopted in this study.

1. Introduction

For the past century in the petroleum industry, various artificial lift methods have been tested and applied in heavy oil wells, including the electric submersible pump (ESP) and progressive cavity pump (PCP), etc. However, this traditional equipment severely suffers from performance degradation in producing viscous fluids due to extra hydraulic losses [1,2,3]. When using the ESP to transport high-viscosity fluids, the strong shearing effect within the rotating ESP impeller results in higher viscous stress and friction losses, not only reducing the pump head and efficiency but also increasing the shaft power [4,5,6,7]. As discussed in these studies, the performance degradation is predictable but inevitable. On the other hand, PCP, a positive displacement pump, is recommended for severe flow conditions, including gases, solids, and high-viscosity oil [8,9], however, its performance can be deteriorated by a relatively high shaft speed due to the stator’s material swelling, creep and/or thermal expansion under a deep well [10,11,12]. Therefore, a new design, the labyrinth screw pump (LSP), has been established to combine the advantages of both pumps.
In addition, the first LSP mechanism was proposed by Golubiev in 1969 [13]. The working principle is hard to understand and the mechanical structure design is being improved step by step these days. By machining the threads with the same size but opposite helical directions on both the stator bush (liner) and rotor sleeve (screw), the helical seal pumping capacity can be increased significantly, and based on which, the author invented labyrinth screw seals and pumps. Accounting for the grooves of various shapes and different flow rates, the authors Golubev and Pyatigorskaya [14,15] derived the theoretical pump head and overall efficiency. The hydraulic performance and optimal parameters of the labyrinth screw seals and pump were also studied. Their fundamental work in the LSP has promoted extensive investigation into LSP design and optimization.
Ma and Wang [16] adopted Prandtl’s mixing length theory to model two-dimensional Reynolds stress equations and proposed two innovative concepts, i.e., a cell head coefficient and a pump total head coefficient. A simple empirical equation was obtained to quantify the effects of the main geometric parameters of the threads on the pump performance. This equation was compared with Golubiev’s experimental results, and the results were found to be in good agreement. The study provides a theoretical basis for LSP design. Andrenko and Lebedev [17] accounted for the shape of the screw groove and developed a new method for calculating the flow characteristics of labyrinth screw pumps, which was claimed to be more accurate than the existing models. Later, Andrenko et al. [18] proposed a new design for labyrinth screw pumps that increased the flow rate and power output by almost 10%. The design was based on a new flow channel and movable operating elements, which was validated through numerical simulation and experimental testing. More recent theoretical work has studied the leakage flow rate and tooth-clearance pressure of liquid-phase flow in a straight-through labyrinth seal [19,20].
The theoretical modeling of labyrinth pumps is important for the design of pump geometry and an in-depth understanding of the fluid transportation mechanism within the pump. However, due to the complexity of the flow field in an LSP, the non-linear nature of the governing equations prevails as the flow in an LSP is highly turbulent and three-dimensional (3D), making it difficult to model it accurately. In addition, the results of a theoretical model for an LSP are sensitive to boundary conditions, which can be difficult to define accurately. The lack of experimental data further complicates the development of theoretical models. With advancements in model numerical simulation tools, LSP design and flow behavior analyses have been profoundly improved.
Numerical simulations of fluid flow in labyrinth seals have been conducted to understand the transportation mechanism in complex structures [21,22,23]. Stoff [24] proposed a computer model to simulate the flow of incompressible fluid in a labyrinth seal, which was found to be in good agreement with experimental measurements. Selvaraji et al. [25] present a numerical study on the optimization of labyrinth seals for screw compressors using CFD analysis and experimental testing. The results showed that the optimization of labyrinth seals can significantly reduce leakage rates. Asok et al. [26] distinguished the effectiveness of different labyrinth seals via CFD simulations and confirmed that helical-grooved seals can achieve the desired pressure drop and cavitation levels. Watson et al. [27] characterized the hydraulic performance of three different helical groove seals in a multistage pump via CFD simulations and found that the groove helix angle, width, and depth played a significant role in the leakage and rotordynamic coefficients. Watson and Wood [28,29,30] continued their numerical studies on optimizing the helix angle and second stage of helical groove seals. Their work further demonstrated the significant applications of numerical methodology in labyrinth-seal-related research.
As for labyrinth screw pump simulations, Ma and Wang [31] numerically verified that the fitting clearance between the screw and sleeve of a labyrinth screw pump (LSP) affects the pump performance to a significant extent. This is consistent with the prior findings of labyrinth seals. Li and Zhang [32] presented a numerical study on three new designs of labyrinth screw pumps (LSPs) with the separated rotor or stator and concluded that pump performance can be optimized by separating the rotor or stator into sections. Woo et al. [33] also confirmed that groove seal geometries affected internal leakage significantly, which as a result impacted helical grooved pump performance. Rong et al. [34] used numerical simulations and optimization to improve the performance of a labyrinth screw pump. The study found that the pump efficiency and head can be increased by optimizing the structural parameters of the stator and rotor. The optimized pump had an efficiency increase of 13.55% and a lift increase of 19.53% when conveying a medium with a viscosity of 133 cp. Our previous work [35] designed and manufactured a new labyrinth screw pump with the cellular supercharging theory, and its performance was studied both experimentally and numerically. The results showed that the LSP is more suitable for conveying highly viscous fluids than ESPs.
From the brief literature review above, it was found that previous experimental studies and numerical simulations on labyrinth screw pumps have been conducted, but the accurate estimation of the viscosity effect on LSP boosting pressure is still difficult due to the complex geometries of the pump. In this study, the effects of fluid viscosities on LSP boosting pressure by numerical simulations are investigated. The simulated pressure increment was compared with the corresponding experimental measurement. The internal flow structures and characteristics within the cavities contained by the LSP impeller and diffuser were also analyzed. Compared to previous single honeycomb structure simulation analyses, this study not only analyzed and validated the pump performance by experimental tests, and also better evaluated its boosting mechanism at different rotor and stator positions, pitch angles, etc. Finally, a group of dimensionless coefficients was used to correlate the nonlinear boosting pressure of a labyrinth screw pump with hydraulic parameters such as fluid viscosity, liquid flow rate, and rotational speed. This provides an alternative method for quickly and easily estimating LSP performance under viscous fluid flow.

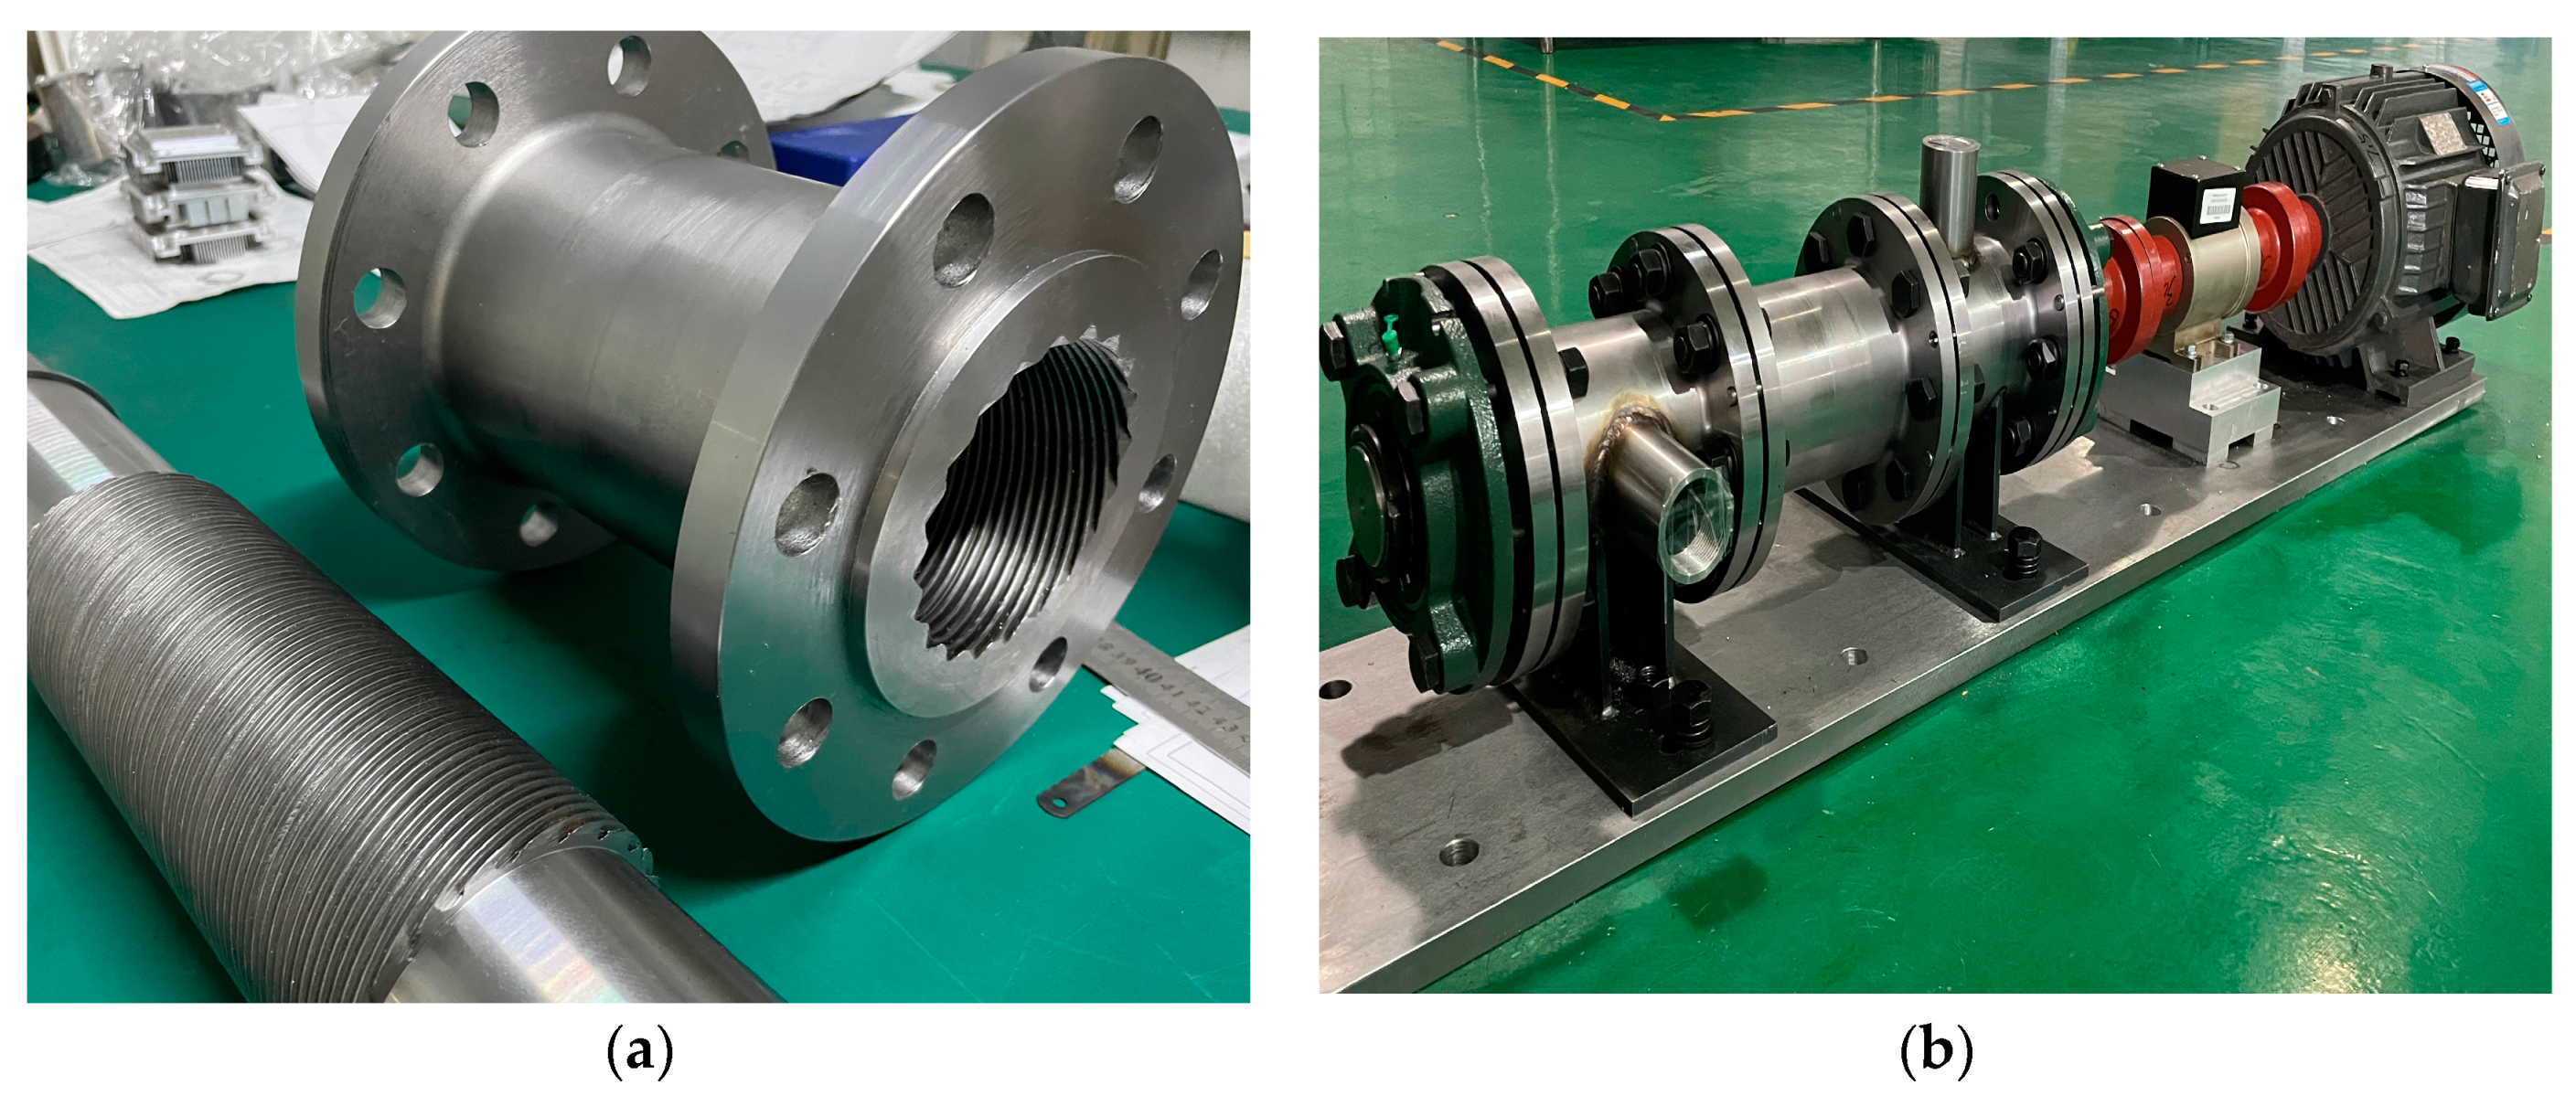
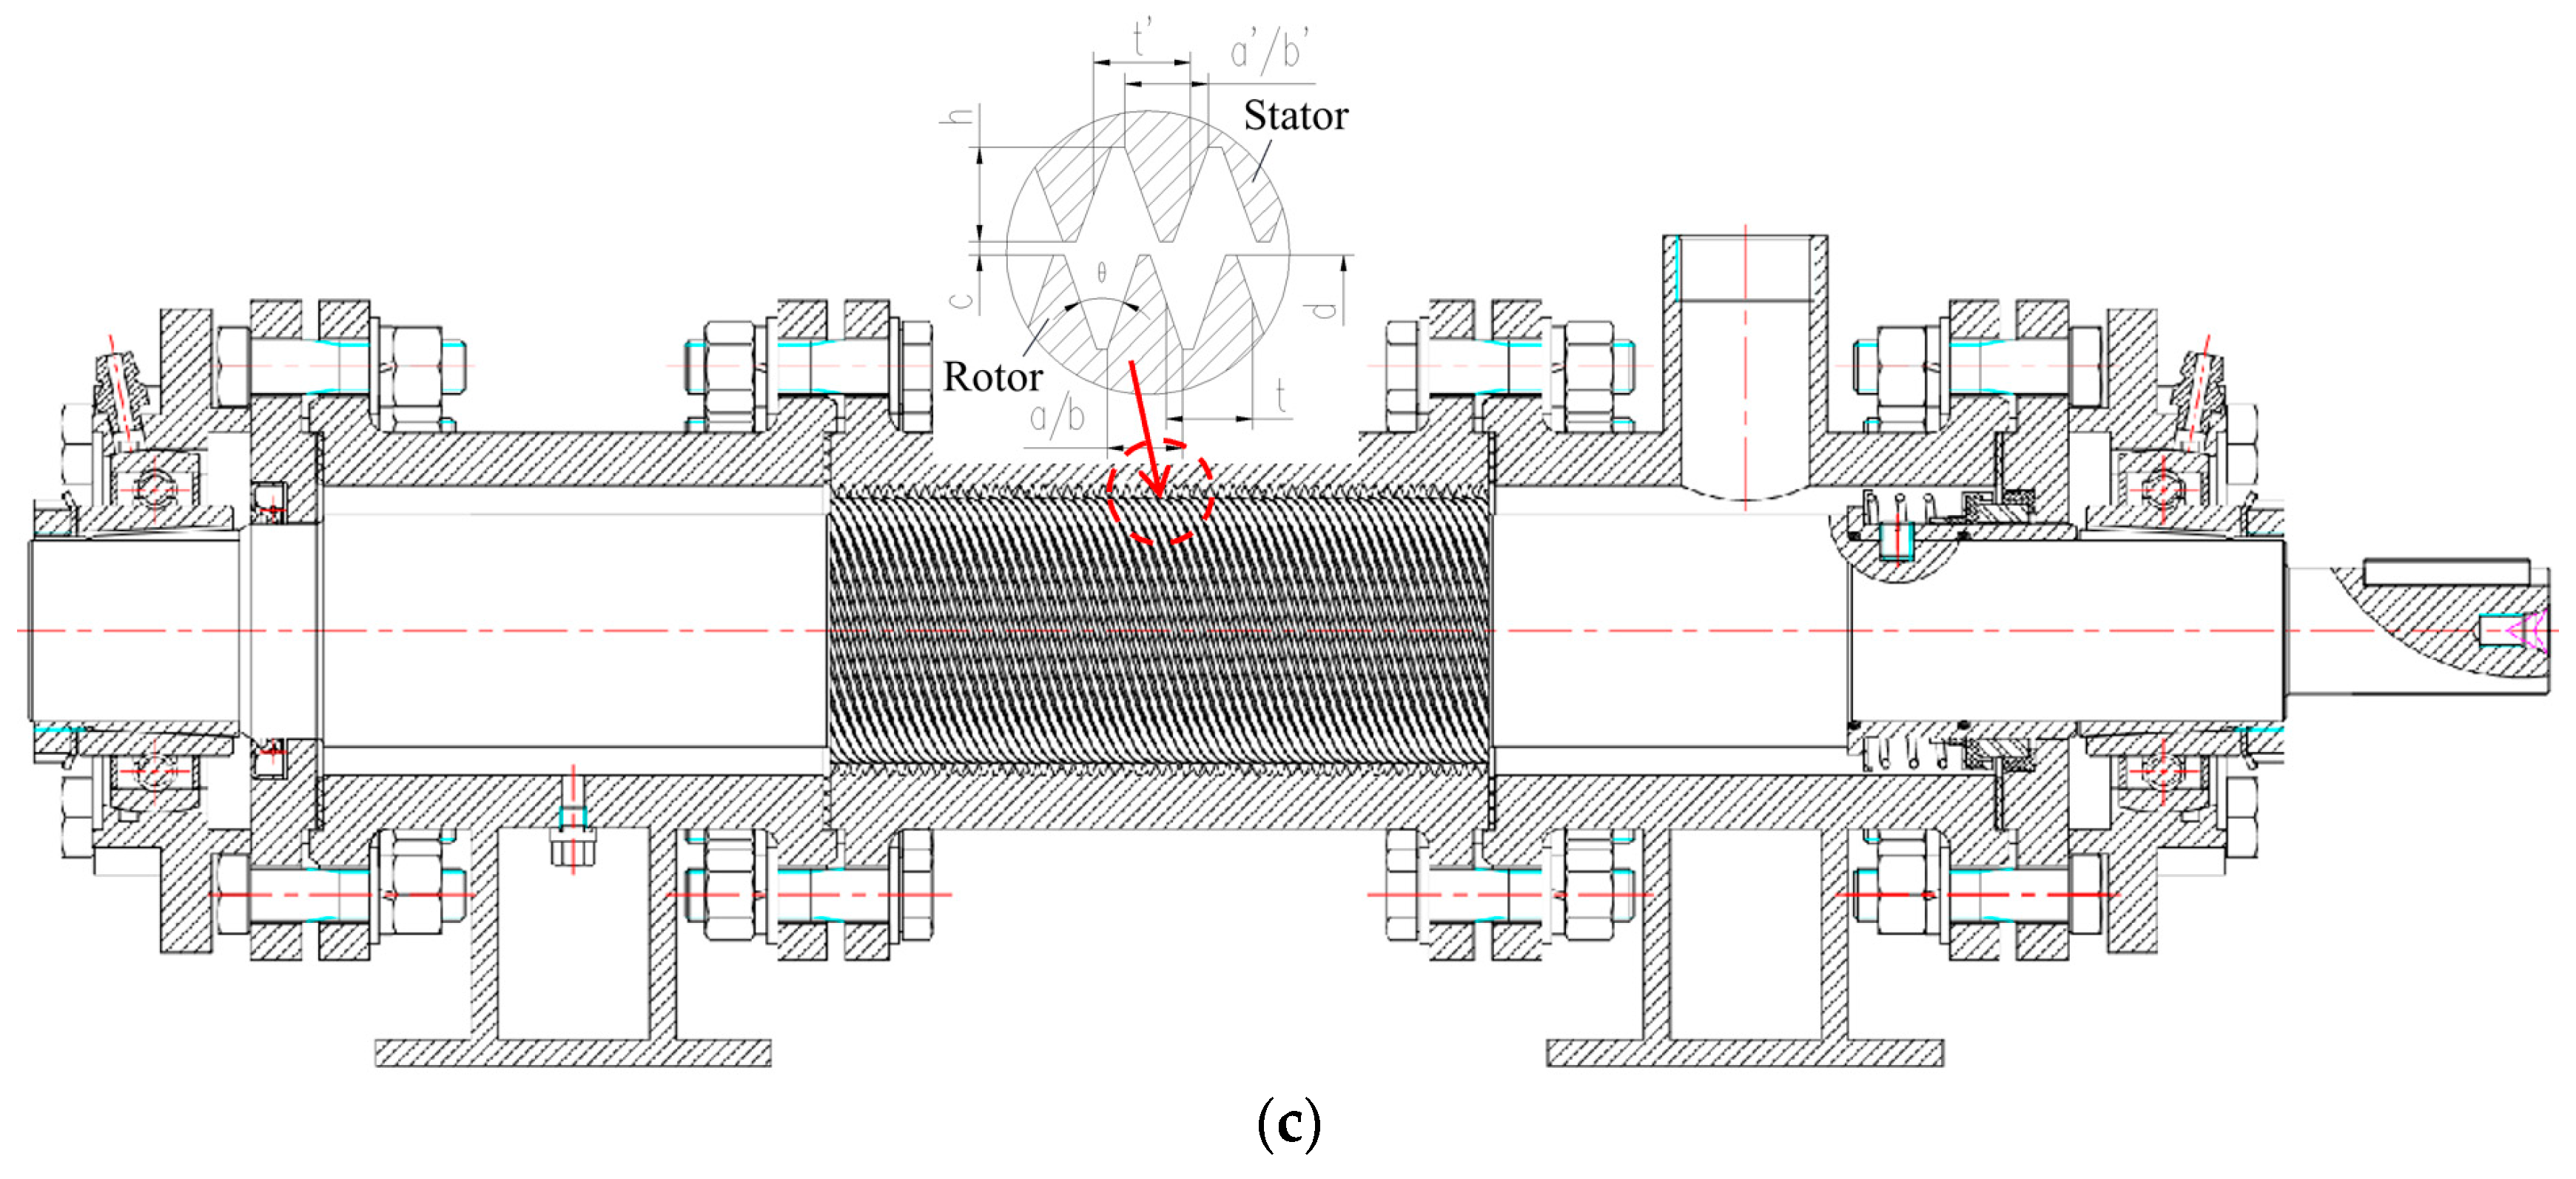
LSP Geometry and Prototype

In this study, an in-house LSP prototype was designed and manufactured. Detailed pump geometries are presented in Figure 1. As seen, the trapezoidal thread groove was designed for the stator and rotor, as recommended by Golubiev [15] and Ma et al. [4]. The major geometrical parameters of the LSP can be found in Table 1 below.
The experimental investigation on LSP hydraulic performance under viscous fluid flow has been conducted in our previous work [33], which employed a mixture of water and glycerin with different concentrations as the working fluids with different viscosities. The physical properties such as fluid density (ρ) and viscosity (μ) were measured by the rheometer. The detailed properties of water–glycerin mixture at different concentrations are listed in Table 2. During experimental testing, we controlled various flow conditions, such as flow rates, rotational speeds, and fluid viscosities. The differential pressure transducer recorded the pressure increment between the intake and discharge of the LSP, which can be used to validate numerical simulations.

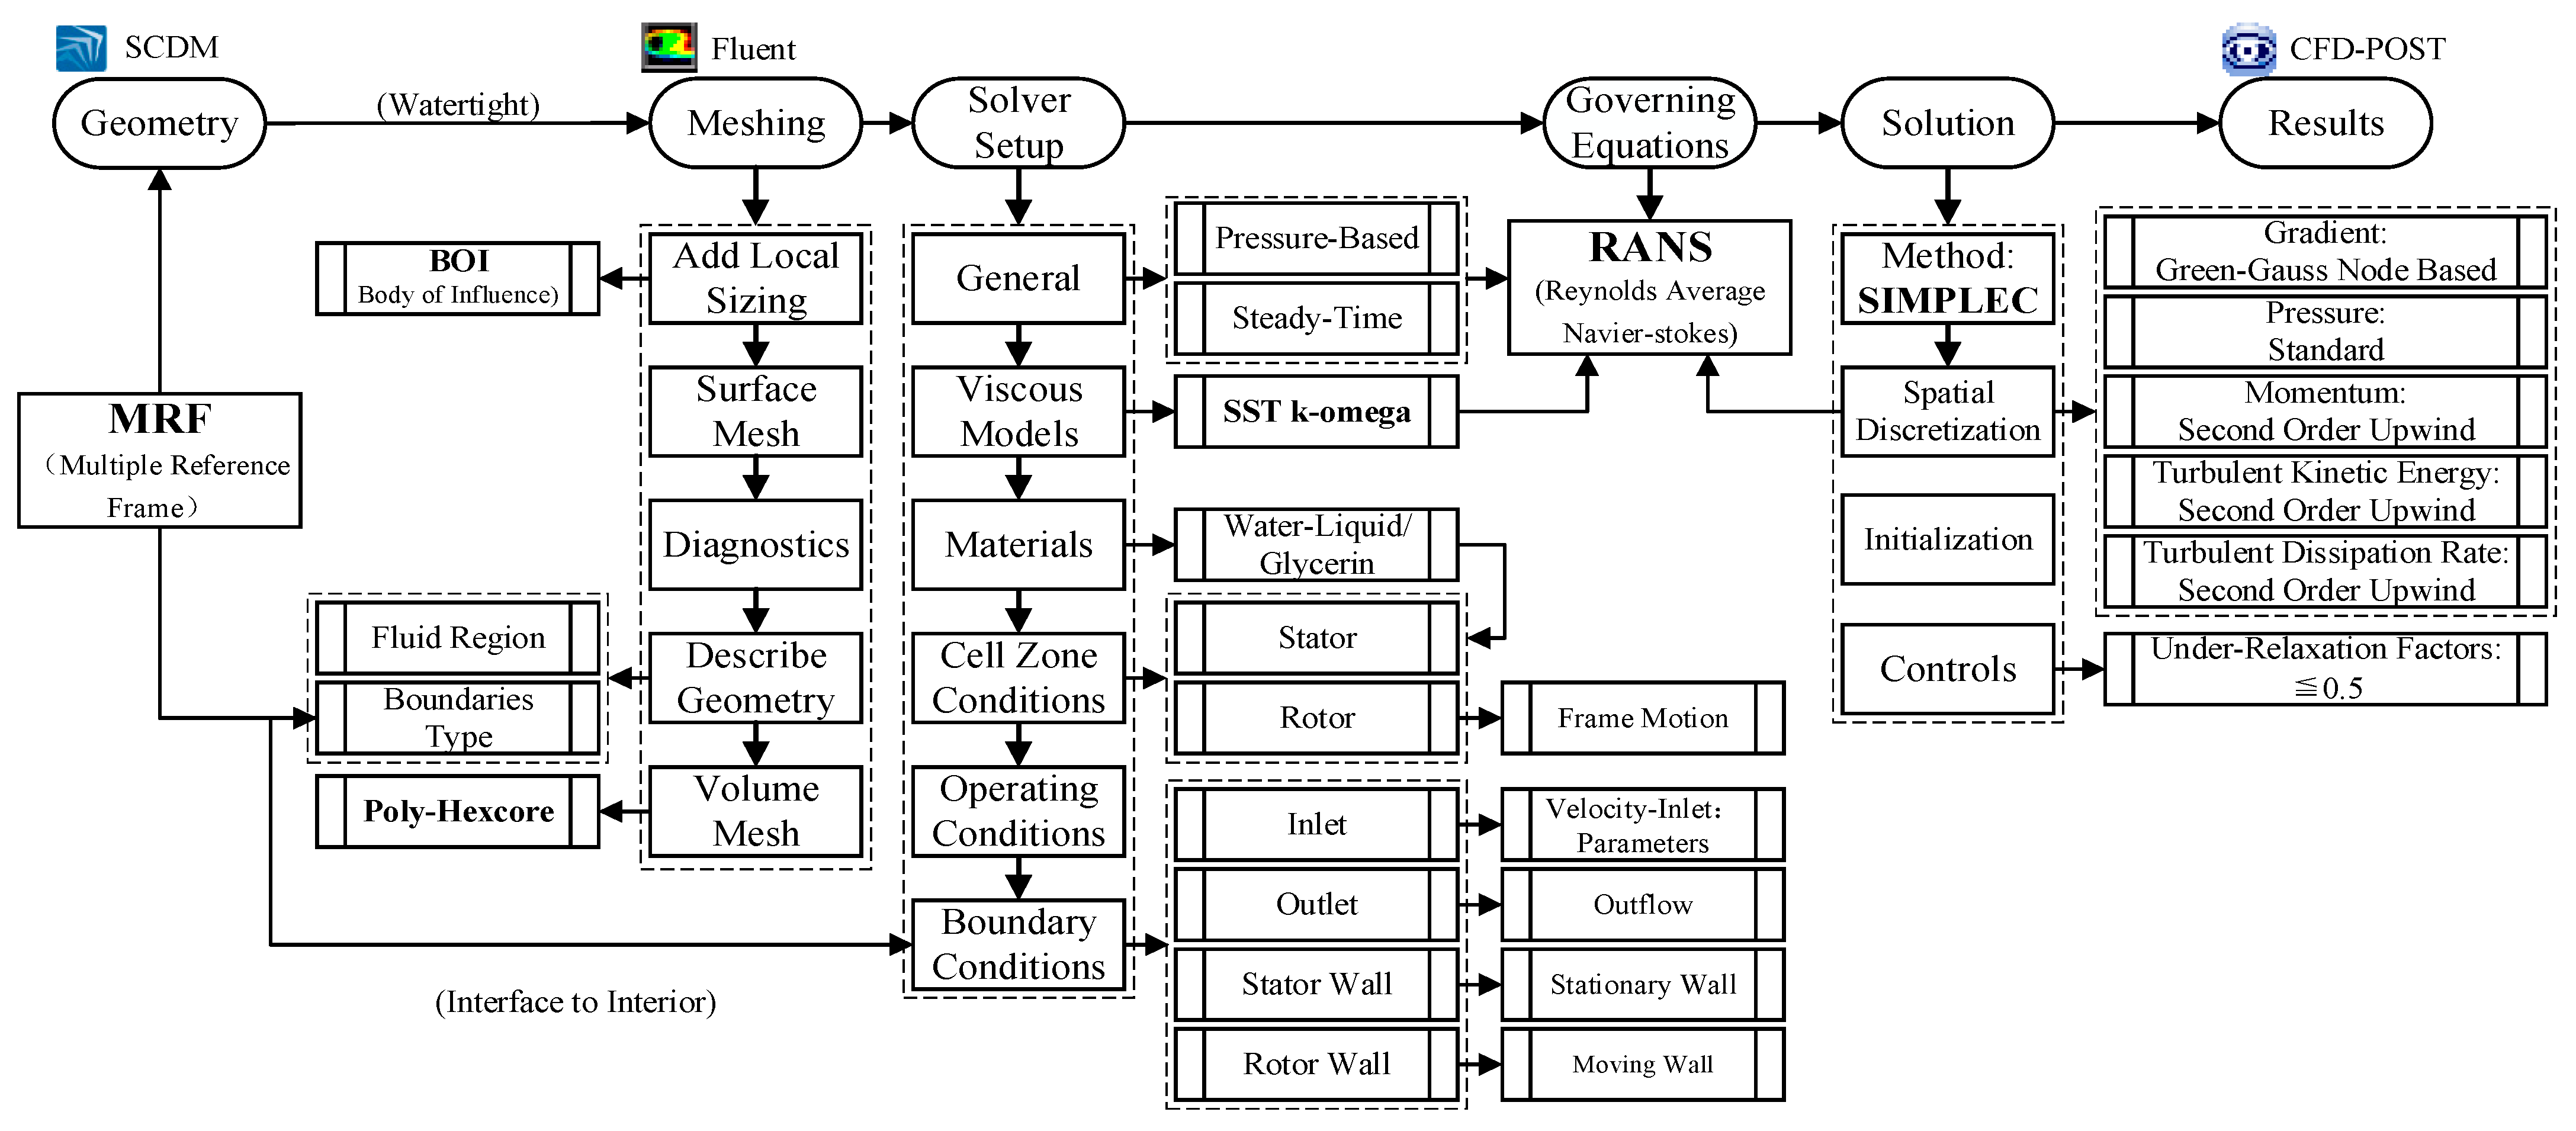
2. Numerical Methodology

The same pump geometries, fluid properties and flow conditions were incorporated into the numerical configurations, where three-dimensional (3D), steady-state Reynolds-Averaged Navier–Stokes (RANS) equations with a standard SST (shear stress transport) turbulence model were solved using a commercial CFD code (Ansys Fluent, 2021 R1, Canonsburg, PA, USA).

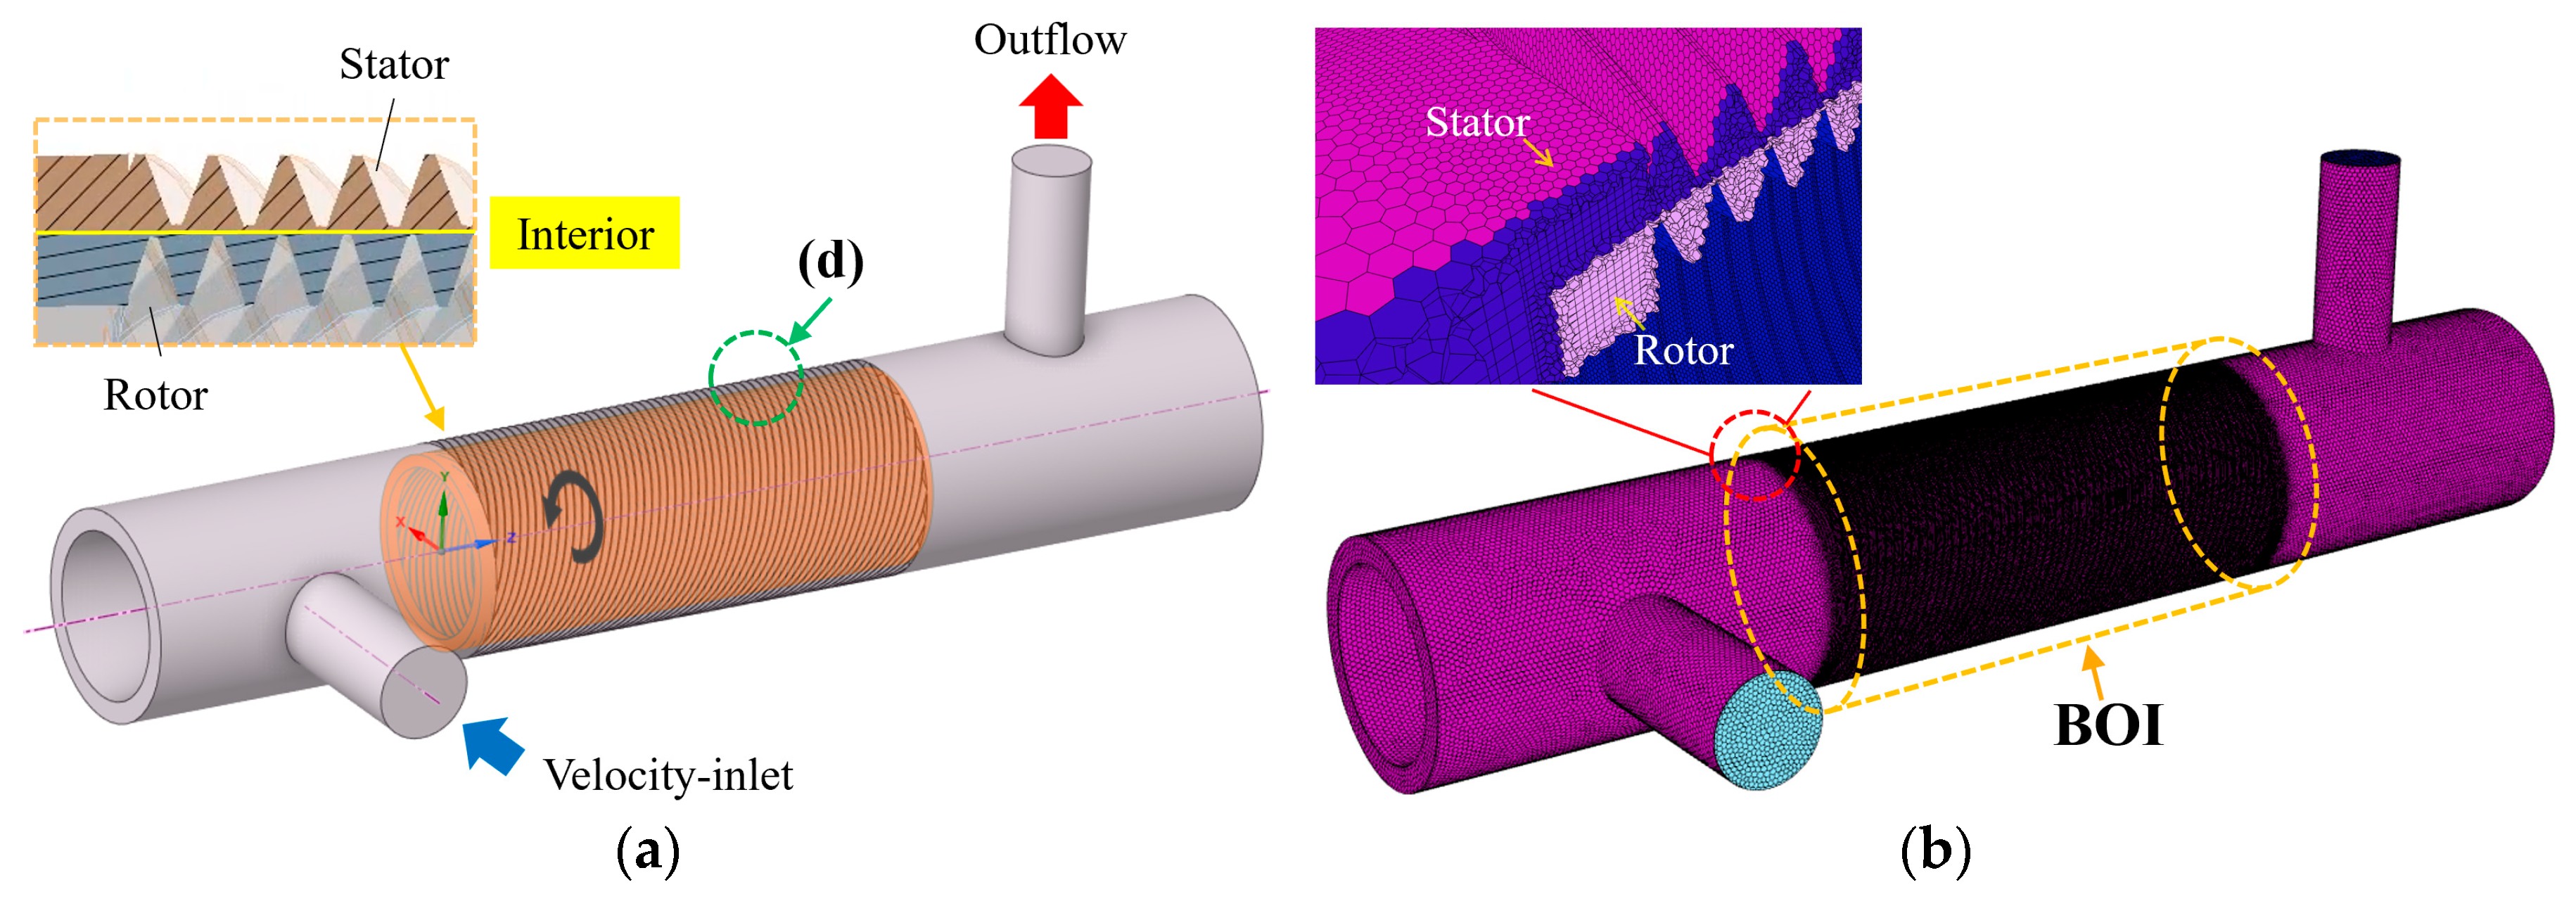
2.1. Mesh Generation

Figure 2a shows the 3D model of the internal flow domain within the LSP prototype, created by ANSYS SCDM (Space Claim Design Modeler). The corresponding mesh grids, generated by the meshing tool within ANSYS Fluent, are shown in Figure 2b. The body mesh for the LSP prototype uses poly-hexcore grids based on the mosaic mesh generation technology. The BOI (body of influence) technique was employed to control the number of grids in the internal flow domain of the stator and rotor thread grooves, thus avoiding excessive grids and saving computational costs.
To ensure mesh independence, the numerical results with varying grid numbers were compared to the experimental measurements. Thus, an optimal mesh number that considers both numerical accuracy and computational cost can be obtained. Table 3 below presents the errors between numerical simulations against corresponding experimental results under the same flow condition, i.e., N = 2900 rpm, μ = 1 cp, Q = 1 m3/h. H is the pump head (meter of fluid), which was converted from pump boosting pressure. The convergence criterion was 10−3. As can be expected, it was hard to reach the convergence criterion for a lower grid number. A quick comparison suggested that a mesh number of 188,325 was sufficient to ensure mesh independence, and the convergence residual reaches 10−3 as well. Therefore this mesh was used in subsequent numerical simulations.

2.2. Mathematical Model

In CFD simulations, a set of conservation equations are solved based on the assumption of a continuous medium. As a result, the fluid medium and its motion are infinitely differentiable in space domains with steady time. In this study, the isothermal condition was applied to the fluid flow domain. In addition, considering the complex geometry of LSP, this study focusds mainly on the steady-state characteristics of the flow domain, avoiding the high computational cost of the transient analysis. The range of Reynolds numbers is from 578–23,715. There are only a few points in laminar flow, for example, 578 comes from 543 cP fluid flows at a rate of 0.25 m3/h. As seen, the Reynolds number of the next flow rate 0.5 m3/h was 2169, already located in a turbulent flow regime. More results of laminar to turbulent flow region transition are analyzed in Section 3.2. In this study, we mainly selected the turbulent flow model, and compared it to the laminar flow model to find out the best methodology. The conservation equation of energy can be omitted and the mass conservation equation is given by:
( ρ u ) = 0
where ρ, u are liquid density and velocity vectors. The source in the mass conservation equation is not taken into account. The momentum conservation equation is written as:
( ρ u u ) = p + ( τ = ) + S
where τ = is the stress–strain tensor as given by Equation (3). S is the external force. As fluids flow through the centrifugal pump, S = SCor + SCfg. SCor and SCfg represent the Coriolis force and centrifugal force effects. In a stationary frame of reference, SCor = SCfg = 0. In a rotating frame with constant angular velocity (Ω), S C o r = 2 ρ Ω + V and S C f g = ρ Ω × ( Ω × r ) . Here, Ω and r are the angular velocity vector and position vector, respectively.
τ = = μ ( u + ( u ) T ) + ( λ 2 3 μ ) u I =
For the SST k–ω two-equation turbulence model, the turbulence kinetic energy and specific dissipation rate are obtained as:
U j k x j = P k β * k ω + x j [ ( ν + σ k ν T ) k x j ]
U j ω x j = α S 2 β ω 2 + x j [ ( ν + σ ω ν T ) ω x j ] + 2 ( 1 F 1 ) σ ω 2 1 ω k x i ω x i
where vT is kinematic eddy viscosity given in Equation (6). Both F1 and F2 are blending functions for different boundary layers given in Equations (7) and (8).
ν T = a 1 k m a x ( a 1 ω , S F 2 )
F 1 = t a n h { { m i n [ m a x ( k β * ω y , 500 ν y 2 ω ) , m a x 1 ( 2 ρ σ ω 2 1 ω k x i ω x i , 10 10 ) 4 σ ω 2 k y 2 ] } 4 }
F 2 = t a n h [ [ m a x ( 2 k β * ω y , 500 ν y 2 ω ) ] 2 ]

2.3. Numerical Scheme and Boundary Conditions

Figure 2 shows the location of different boundaries. Figure 3 shows the CFD workflow for the numerical simulation of the flow field within the labyrinth screw pump test prototype. The complete workflow consists of geometrical modeling, meshing, CFD-solving, and CFD post-processing.
The governing equations were discretized using the second-order upwind scheme. The MRF method was employed to account for the interactions between stationary and moving parts. The SMPLEC algorithm was selected for solving RANS equations, which has the same calculation steps as the SIMPLE algorithm, but with more correction steps for velocity. For gradient interpolation methods such as pressure and velocity, the “Green-gauss Node Based” method was chosen since it is recommended for unstructured grids. Each under-relaxation factor was set to no more than 0.5, by which the numerical simulation of the internal flow field of LSP under different working conditions was completed. The calculation results were then imported into CFD-post for further processing.
The boundary conditions for solving the RANS equations in this study were specified based on the corresponding experimental configurations. Since the flow condition was stable, constant values were used in all boundaries. The inlet and outlet were set to velocity-inlet and outflow, respectively, in Figure 2a. All surfaces of the rotor thread grooves were set to moving walls, rotating around the z-axis at a speed of 2900 rpm. All surfaces of the stator thread grooves were set to steady walls. The interface between the stationary and rotating domains was set to the interior. All solid walls/surfaces were assumed to be smooth and have a no-slip wall condition. The standard wall functions can be applied for the near-wall treatment because the omega-based turbulence model was selected. Since the LSP is horizontally placed, the hydrostatic elevation was ignored in the numerical simulations. The simulated flow condition is the same as testing conditions in Table 4.

3. Results and Discussion

In this section, the numerically simulated LSP boosting pressures are presented and compared with experimental results under different flow conditions. The comparison was conducted by first comparing CFD simulations with experimental results for water flow to validate the numerical methodology. The uncertainty of the simulated water performance curve is less than 5% using the SST model. Then, the experimental conditions of viscous oil flows are incorporated into numerical simulations as inputs. The error is bounded within the ±15% error bar. The outputs from CFD-post include pump pressure increment, streamlines, pressure, and velocity fields, etc.

3.1. Turbulence Model Validation

Ansys Fluent provides several options for modeling turbulence terms in RANS equations. Figure 4a compares the performance of LSP as simulated with different turbulence models. The working medium was water. The horizontal axis shows the measured pumping head (H) at varying flow rates, and the vertical axis shows the corresponding numerical simulation results. Three turbulence models were compared: SST (Shear Stress Transfer) k-omega, Standard k-epsilon, and RNG (Re-normalization Group) k-epsilon. The laminar flow model (Laminar) was also used for comparison. As seen, the average errors with different turbulence models are 4.5%, 10.6%, 8.9%, and 5.2%, respectively. Thus, the SST k-omega model has the lowest average error, indicating that it is a better choice for computing the complex flow field of the LSP. However, the numerical results via the laminar model also demonstrate acceptable accuracy compared to those via turbulence models.
The hydraulic performance of LSP under water flow with varying rotational speed was simulated using the selected turbulence model and compared to experimental results. As shown in Figure 4b, the numerical results are in good agreement with the corresponding experimental measurements. The overall computation accuracy is within less than ±15%, further validating the adopted numerical methodology.

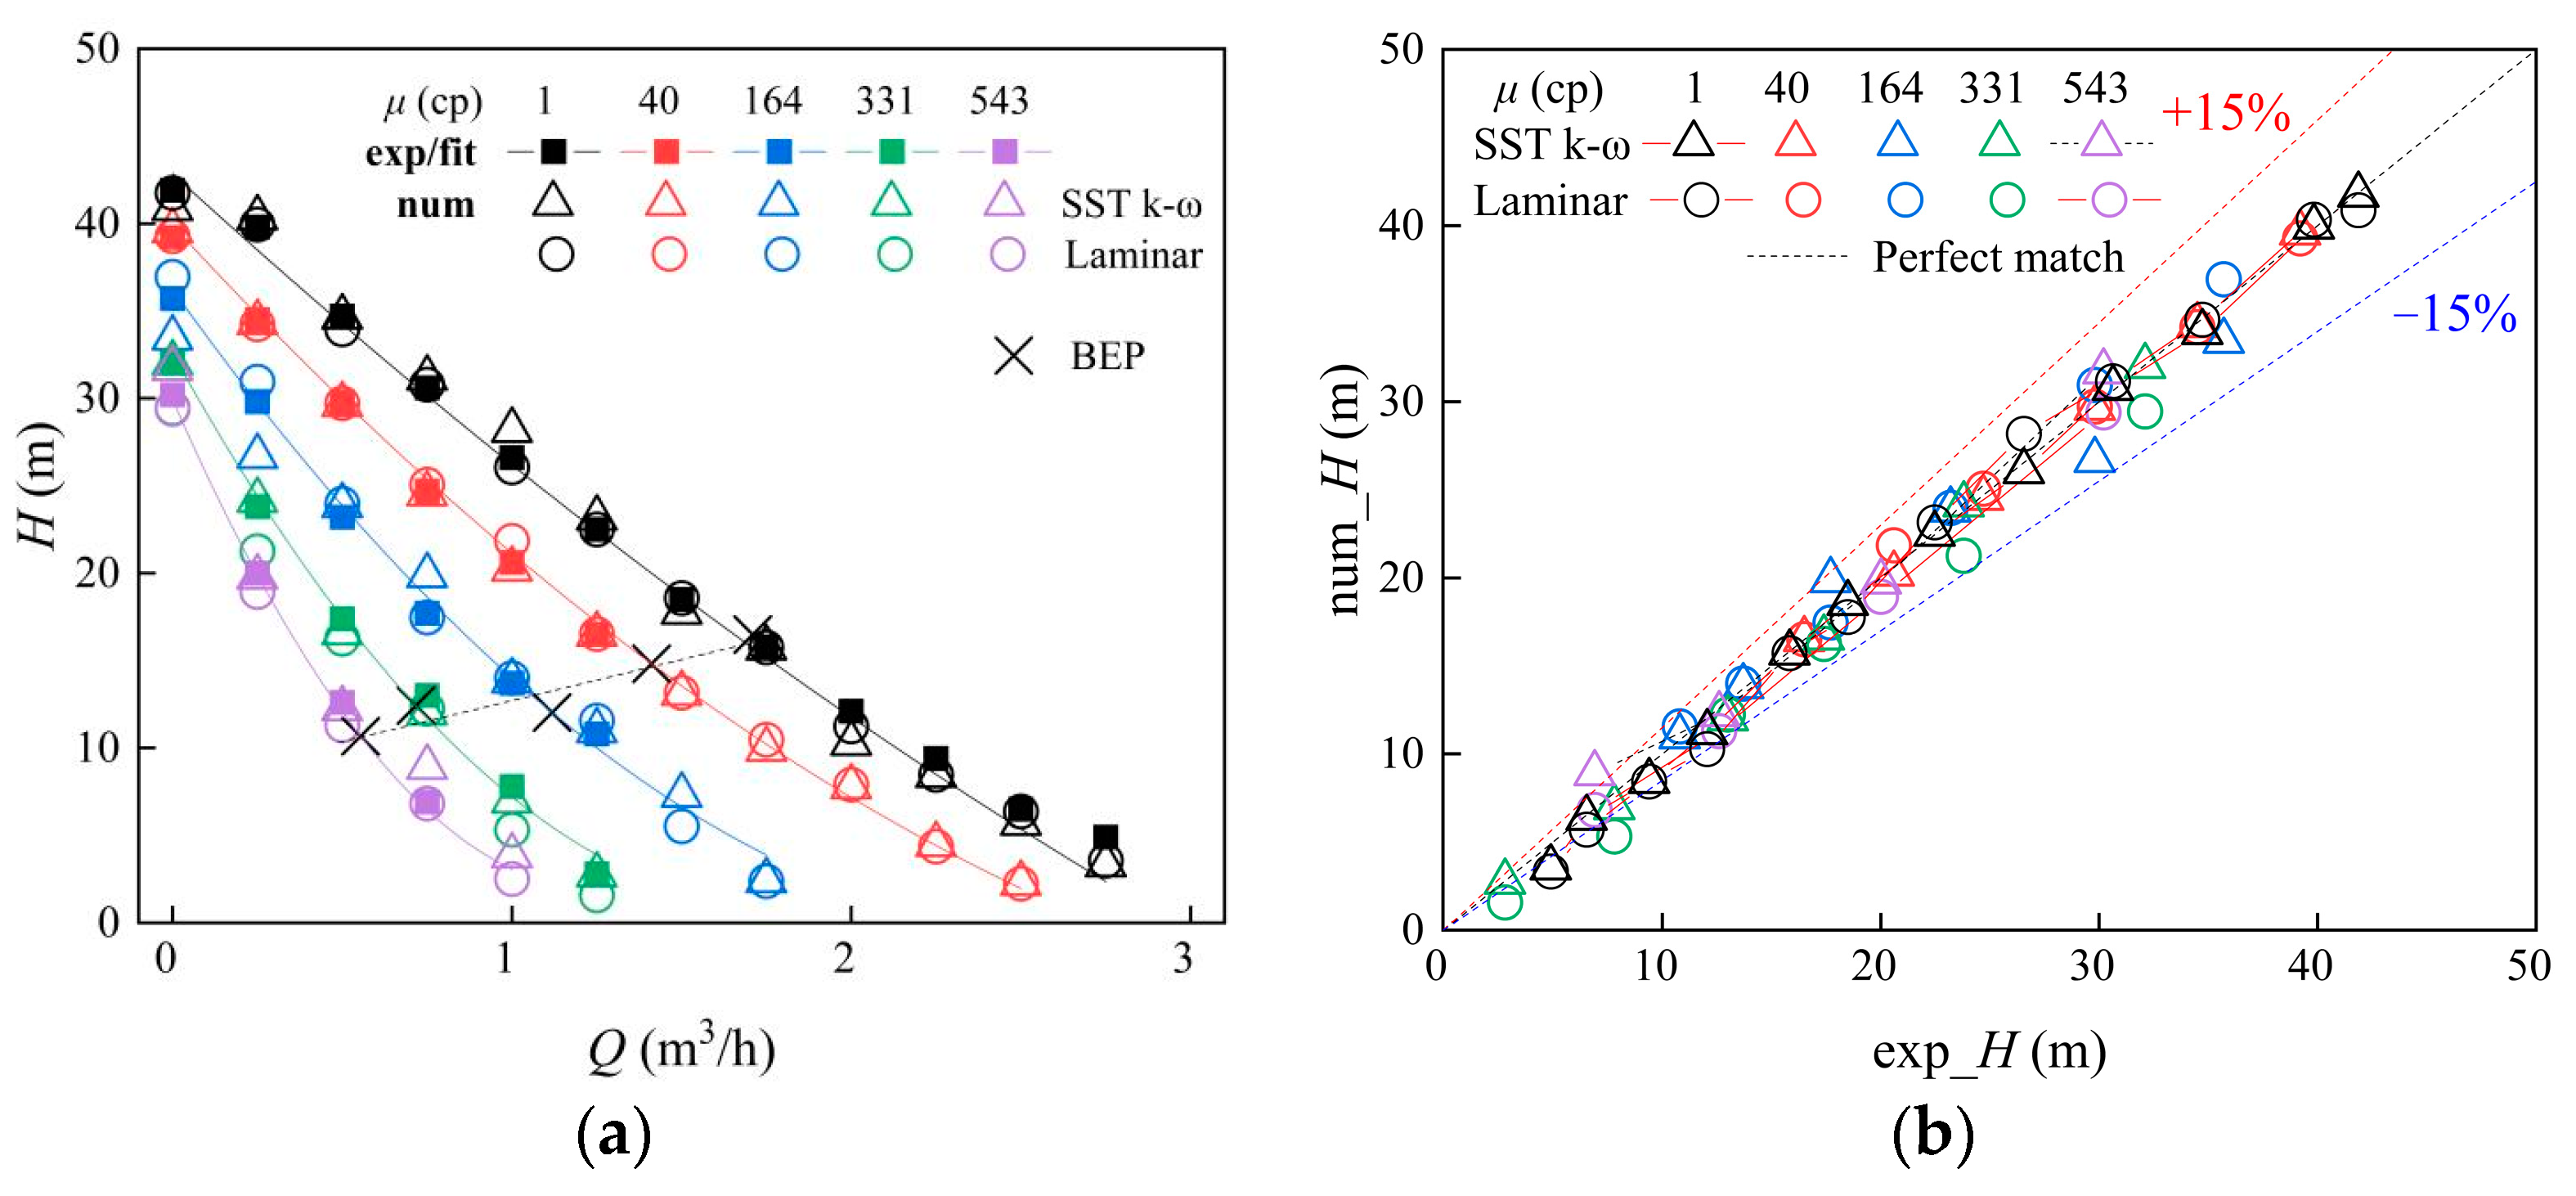
3.2. Comparison with Experimental Measurements

This section presents the overall internal flow field of LSP, including head, pressure and velocity distribution in axis and cross-section. Compared to the single honeycomb structure simulation by Ma and Wang [16], the energy exchange patterns within the LSP and its boosting mechanism can be better addressed and evaluated at different rotor and stator positions, pitch angles, etc. As shown, Figure 5 compares the CFD-simulated boosting pressure of the labyrinth screw pump against the corresponding experimental results for varying viscosities of the working fluid. All numerical simulations were based on the SST k-omega turbulence model, and the laminar simulation results are also presented. Experiments were conducted using water–glycerin mixture with viscosities ranging from 1 to 543 cp. The liquid flow rate range was 0 to 3 m3/h. The rotational speed was fixed at 2900 rpm.
Figure 5a shows that the H–Q performance curves exhibit a nonlinear decline trend with increasing fluid viscosities and liquid flow rates. The agreement between the simulation results and experimental measurements of the pump head indicates that the numerical methodology adopted in this paper is appropriate for investigating the effects of viscosity on LSP hydraulic performance. Furthermore, it can be seen from Figure 5b that the simulation error of LSP performance with either the SST k-omega or laminar model under high-viscosity fluid flow is bounded by ±15%.
Figure 6 shows the pressure distributions along the axis of the screw under different flow conditions, such as varying liquid flow rates or fluid viscosities. Here, a variable control scheme was applied to better demonstrate the numerical results. As can be seen, the liquid flow rate changes for the water flow scenario, while the liquid viscosity varies for the viscous fluid flow. For each control scheme, the other parameters were kept constant. A 3D contour plot of the pressure distribution for water flow at a flow rate of 0.5 m3/h is also presented.
As shown in Figure 6, the pressure difference between the inlet and outlet decreases gradually with increasing pumping flow rate or fluid viscosity. The angle between the pressure contour and the positive direction of the Z-axis increases accordingly, as indicated by the dashed arrow lines in Figure 6. Reynolds number was calculated based on fluid property and flow condition, and the line in Figure 6 indicates a transition from turbulent flow to laminar flow. In addition, the uniformed pressure distribution along the axial direction (Z-axis positive direction) contributes to the stable operations of the labyrinth screw pump with low vibration and noise, which is a positive asset to the field applications of conveying high-viscosity fluid flow.
Figure 7 and Figure 8 demonstrate pressure and velocity distributions in the cross-sections of LSP under various flow conditions. The axis length l denotes the overall length of the rotor, while t′ corresponds to the pitch length of a single thread. Starting from the middle position of the rotor, i.e., Z = 1 2 l , the contour plots of the cross-sections at Z + 1 3 t , Z + 2 3 t , and Z + t are shown. The top four sub-figures correspond to water flow at N = 2900 rpm, Q = 0.5 m3/h, and the bottom four show the same for water–glycerin mixture with N = 2900 rpm, μ = 40 cp, Q = 0.75 m3/h.
Due to the rotation of the labyrinth screw pump, the fluid was pressurized in the thread groove. The pressurized fluid then enters the stator thread groove, where the kinetic energy of the fluid is gradually converted into potential energy. On the axial section of the stator and rotor, the rotor moved clockwise. Therefore, the high-pressure area of the fluid in Figure 7 and Figure 8 was mainly concentrated at the position where the top of the stator thread groove is opposite to the rotation direction of the rotor.
For water flow at Q = 0.5 m3/h, a regional high-pressure area exists at the bottom of the rotor thread grooves, opposite the direction of rotation. Similar to ESPs, leakage flow is inevitable in LSPs, and it decreased with increasing fluid viscosity. Figure 7 shows that the leakage in the stator thread groove decreased as the fluid viscosity increased. In LSPs, the main leakage loss was due to the clearance between the rotor and stator. Reducing the clearance can further improved the volumetric efficiency of the LSP when transporting high-viscosity fluids, thereby improving the pumping performance.
As shown in Figure 8, when the bottoms of the stator and rotor thread grooves are in contact, the velocity distribution contours are distributed over a wider range in the radial direction. Therefore, the energy exchange at the clearancewas0 mainly caused by the conversion of the kinetic energy of rotor rotation into pressure energy in the stator thread grooves. When the rotor rotates until the bottom of its thread groove is opposite to the stator thread, i.e., when Z = 2/3 t′, the fluid in the stator and rotor thread grooves has the smallest contact area on the axial section, and the velocity distribution contours are distributed over a smaller range in the radial direction. Then, driven by the pressure difference between the stator pressure surface and the rotor suction surface, the pressurized fluid in the stator thread groove flows into the next stage rotor thread along the groove. The fluid then passes through the next-stage rotor thread and gains kinetic energy by rotating and being pressurized again. Finally, the fluid flows through the clearance into the next stage stator thread groove.
Figure 9 shows the axial velocity distribution in the upper portion of the radial section within the stator and rotor’s flow field. As seen, the fluid velocity in the stator and rotor threads increases radially from the root of the rotor thread to that of the stator thread. As the liquid flow rate increases, the energy conversion at the clearance between the stator and rotor increases, and the distance between the velocity distribution contours increases. When the fluid flow rate reaches the Best Efficiency Point (BEP), the hydraulic power is the highest, corresponding to the highest hydraulic efficiency. However, as the liquid flow rate continues to increase, the wall friction loss and leakage loss also increase. Consequently, the energy conversion is weakened at the clearance, leading to a decrease in pumping pressure.
When the fluid viscosity reaches 164 cp, the axial velocity distribution contour gradually stabilizes and no significant difference in the distribution of the axial velocity can be detected. According to the analysis of the pressure contour, as the fluid viscosity increases, the leakage loss is mainly dominated by leakage through clearance. When the friction factor of the rotor thread groove remains the same, the shaft power is linearly proportional to the fluid viscosity. Therefore, when transporting high-viscosity fluids, the power loss of LSPs is mainly due to wall friction loss. At this time, the pumping mechanism of LSPs is very similar to that of PCPs.
Figure 10 presents the total averaged pressure along the screw axis under various flow conditions. Each subfigure corresponds to a different hydraulic parameter, while the other parameters are kept constant. For instance, Figure 10a corresponds to the water flow case at a constant rotational speed of 2900 rpm and varying liquid flow rates (0.5~2.5 m3/h). The other two subfigures show the effects of changing rotational speeds and fluid viscosities on the total pressure, respectively. As shown, the total averaged pressure along the screw axis increases linearly with the screw length for all simulation cases. In addition, the LSP boosting pressure in water flow scenarios almost increases linearly with the decrease in flow rate (Figure 10a) and the increase in rotational speed (Figure 10b), indicating that LSPs perform more like ESPs. Therefore, the ESP affinity law is also applicable to LSPs. However, as the liquid viscosity increases, the LSP performance deteriorates accordingly and the decline trend appears nonlinear (Figure 10c).

4. Conclusions

In this paper, the fluid viscosity effect on LSP boosting pressure is investigated through experimental testing and CFD simulations. Based on the analyses, several conclusions can be drawn:
The SST k-omega turbulence model was used to simulate the LSP pressure increment under water flow, and the results were found to be in good agreement with experimental results, which validates the numerical methodology.
Experimental results have shown that LSP boosting pressure decreases with the fluid viscosity. At higher fluid viscosities, the H–Q curves become more linear, indicating a transition from turbulent flow to laminar flow.
The simulation accuracy of the calculated LSP pressure increment under viscous fluid flow is within ±15%. Numerical simulations can capture the linear decline trend on H–Q plots due to high fluid viscosity.
Experimental and numerical approaches have been proven to be effective in studying the effects of viscosity on LSP boosting pressure. A better understanding of clearance leakage, shear flow spreading, and separation can help develop a more accurate mechanistic model for predicting the LSP performance under viscous fluid flow. The simulation results in this study investigated and helps our research team understand the internal flow characteristics of LSP. The results are valuable for our future study in LSP geometry design and improvement, as well as for visualizing experiment development.

Author Contributions

Conceptualization, W.K., H.Z. (Haiwen Zhu) and J.Z.; methodology, W.K. and J.Z.; software, Y.L. and H.Z. (Hao Zeng); validation, Z.W. and H.Z. (Haiwen Zhu); formal analysis, Z.W. and J.Z.; investigation, W.K. and Z.W.; resources, W.K., H.Y. and J.Z.; data curation, D.Z. and H.Y.; writing—original draft preparation, W.K. and Z.W.; writing—review and editing, H.Z. (Haiwen Zhu) and H.Y.; visualization, Z.W. and H.Z. (Haiwen Zhu); supervision, J.Z. and H.Z. (Haiwen Zhu); project administration, J.Z. and H.Z. (Hao Zeng); funding acquisition, W.K. and J.Z. All authors have read and agreed to the published version of the manuscript.

Funding

This research received no external funding.

Data Availability Statement

Data sharing not applicable. No new data were created or analyzed in this study. Data sharing is not applicable to this article.

Conflicts of Interest

The authors declare no conflict of interest.

Nomenclature

alength of rotor thread crest, mm
alength of stator thread crest, mm
blength of rotor thread root, mm
blength of stator thread root, mm
cstator–rotor fitting clearance, mm
CQflow rate correction factor
CHhead correction factor
ddiameter of rotor, mm
ggravitational acceleration, m2/s
hgroove depth, mm
Hhead, mm
llength of screw, mm
nrotate speed, rpm
nrrated rotate speed, rpm
ppressure, Pa
Qvolumetric flow rate, m3/h
Qmaxmaximum volumetric flow rate, m3/h
ReΩrotational Reynolds number
tthread pitch of rotor, mm
tthread pitch of stator, mm
vvelocity, m/s
znumber of screw twist
Greek symbols
αAngle of thread profile, deg
ηhydraulic efficiency, %
θAngle of thread, deg
μdynamic viscosity, cp
νkinematic viscosity, m2/s
ρdensity, kg/m3
Φflow coefficient
Ψspecific head
ωsspecific speed
Ωangular speed, rad/s
Subscripts
convconversion value
expexperiment value
fitfitted curve
numnumerical simulation
iinlet
ooutlet
nnormalized
wvalue tested for water

References

  1. Zhu, J.; Banjar, H.; Xia, Z.; Zhang, H.-Q. CFD simulation and experimental study of oil viscosity effect on multi-stage electrical submersible pump (ESP) performance. J. Pet. Sci. Eng. 2016, 146, 735–745. [Google Scholar] [CrossRef]
  2. Zhu, H.; Zhu, J.; Rutter, R.; Zhang, H.-Q. A Numerical Study on Erosion Model Selection and Effect of Pump Type and Sand Characters in Electrical Submersible Pumps by Sandy Flow. J. Energy Resour. Technol. 2019, 141, 1–58. [Google Scholar] [CrossRef]
  3. Monte Verde, W.; Kindermann, E.; Biazussi, J.L.; Estevam, V.; Foresti, B.P.; Bannwart, A.C. Experimental Investiga-tion of the Effects of Fluid Viscosity on Electrical Submersible Pumps Performance. SPE Prod. Oper. 2022, 38, 1–19. [Google Scholar]
  4. Zhu, J.; Zhu, H.; Cao, G.; Zhang, J.; Peng, J.; Banjar, H.; Zhang, H.-Q. A New Mechanistic Model To Predict Boosting Pressure of Electrical Submersible Pumps Under High-Viscosity Fluid Flow with Validations by Experimental Data. SPE J. 2019, 25, 744–758. [Google Scholar] [CrossRef]
  5. Zhu, H.; Zhu, J.; Rutter, R.; Zhang, H.Q. Experimental Study on Deteriorated Performance, Vibration, and Geome-try Changes of an Electrical Submersible Pump Under Sand Water Flow Condition. J. Energy Resour. Technol. 2021, 143, 082104. [Google Scholar] [CrossRef]
  6. Shi, Y.; Zhu, J.; Wang, H.; Zhu, H.; Zhang, J.; Zhang, H.-Q. Experiments and mechanistic modeling of viscosity effect on a multistage ESP performance under viscous fluid flow. Proc. Inst. Mech. Eng. Part A J. Power Energy 2021, 235, 1976–1991. [Google Scholar] [CrossRef]
  7. Porcel, C.; Biazussi, J.L.; Verde, W.M.; Estevam, V.; Bannwart, A.C.; Tavares, A.; Santos, M.P.d.L.; Rocha, P.S.D.M.V. Experimental Study on the Performance of Electrical Submersible Pump Operating with Ultraviscous Oil. SPE J. 2022, 27, 2470–2490. [Google Scholar] [CrossRef]
  8. Om, I.L.; Han, U.C.; Ryo, S.I.; Kim, C.Y.; Sol, Y.N. A New Analytical Approach to Calculate a Slippage inside a Pro-gressing Cavity Pump with a Metallic Stator Using a Middle Streamline and a Structural Periodicity. SPE J. 2022, 27, 552–565. [Google Scholar] [CrossRef]
  9. Nelik, L.; Brennan, J. Progressing Cavity Pumps, Downhole Pumps, and Mudmotors; Gulf Publishing Company: Houston, TX, USA, 2005. [Google Scholar]
  10. Berton, M.; Allain, O.; Goulay, C.; Lemetayer, P. Complex fluid flow and mechanical modeling of metal progressing cavity pumps PCP’s. In Proceedings of the SPE Heavy Oil Conference and Exhibition, Kuwait City, Kuwait, 12–14 December 2011. [Google Scholar]
  11. Ramde, S.; Beauquin, J.; Bellett, D.; Duret-Thual, C.; Olivier, G.; Pierchon, A. Innovative solutions in pcp technologies, run life improvement with experimental and numerical works. In Proceedings of the SPE Artificial Lift Conference & Exhibition-North America, Huston, TX, USA, 7 October 2014. [Google Scholar]
  12. Liu, W.; Shu, M.; Sun, Y.; Fan, Y. Flow Field Numerical Simulation and Performance Analysis of Progressing Cavity Pump. SPE Prod. Oper. 2021, 36, 343–358. [Google Scholar] [CrossRef]
  13. Golubiev, A.I. The Development of a Three-stage Screw-Type Labyrinth Seal. In Proceedings of the 4th International Conference on Fluid Sealing, Weinheim, Germany, May 1969; pp. 348–350. [Google Scholar]
  14. Golubev, A.I.; Pjatigorskaja, E.I. Determination of optimal parameters of labyrinth-screw seals and pump. In Proceedings of the 16th International Conference on Fluid Sealing, BHR Group Conference Series, Brugge, Belgium, 30 November–1 December 2020; pp. 473–481. [Google Scholar]
  15. Golubev, A.I.; Pyatigorskaya, E.I. Efficiency Coefficients of a Labyrinth Pump. Chem. Pet. Eng. 2005, 41, 260–266. [Google Scholar] [CrossRef]
  16. Ma, R.; Wang, K. Modeling of Pumping Performance of Labyrinth Screw Pump (LSP) by 2D Reynolds Stress Equations. J. Fluids Eng. 2009, 131, 085001–0850015. [Google Scholar] [CrossRef]
  17. Andrenko, P.; Lebedev, A. Labyrinth screw pump theory. Motrol Motoryz. Energetyka Rol. 2014, 16, 35. [Google Scholar]
  18. Andrenko, P.; Rogovyi, A.; Hrechka, I.; Khovanskyi, S.; Svynarenko, M. Characteristics improvement of labyrinth screw pump using design modification in screw. J. Phys. Conf. Ser. 2021, 1741, 012024. [Google Scholar] [CrossRef]
  19. Han, L.; Wang, Y.; Liu, K.; Ban, Z.; Qin, B.; Liu, H.; Dai, M. Theoretical Leakage Equations Towards Liquid-Phase Flow in the Straight-Through Labyrinth Seal. J. Tribol. 2021, 144, 031802. [Google Scholar] [CrossRef]
  20. Liu, K.; Han, L.; Wang, Y.; Liu, H.; Zhao, D.; Li, X.; Jiang, S. Theoretical and experimental research towards laby-rinth sealing mechanism of liquid nitrogen in the cryogenic spindle. Mech. Syst. Signal Process. 2022, 167, 108502. [Google Scholar] [CrossRef]
  21. Luo, C.; Cao, Y.; Liu, Y.; Zhong, S.; Zhao, S.; Liu, Z.; Liu, Y.; Zheng, D. Experimental and Modeling Investigation on Gas-Liquid Two-Phase Flow in Horizontal Gas Wells. J. Energy Resour. Technol. 2022, 145, 013102. [Google Scholar] [CrossRef]
  22. Liu, Y.; Upchurch, E.R.; Ozbayoglu, E.M.; Baldino, S.; Zheng, D.; Wang, J. Gas Migration Model for Non-Newtonian Fluids Under Shut-In Well Conditions. In Proceedings of the SPE/IADC Middle East Drilling Technology Conference and Exhibition, Abu Dhabi, United Arab Emirates, 23–25 May 2023. [Google Scholar] [CrossRef]
  23. Kesana, N.R.; Throneberry, J.M.; McLaury, B.S.; Shirazi, S.A.; Rybicki, E.F. Effect of particle size and liquid vis-cosity on erosion in annular and slug flow. J. Energy Resour. Technol. 2014, 136, 012901. [Google Scholar] [CrossRef]
  24. Stoff, H. Incompressible flow in a labyrinth seal. J. Fluid Mech. 1980, 100, 817–829. [Google Scholar] [CrossRef]
  25. Selvaraji, M.; Joseph, S.P.; Nirmal, N. Optimization of Labyrinth Seal for Screw Compressor. In Proceedings of the ASME/JSME 2007 Thermal Engineering Heat Transfer Summer Conference, Vancouver, Canada, 8–12 July 2007; pp. 969–975. [Google Scholar] [CrossRef]
  26. Asok, S.P.; Sankaranarayanasamy, K.; Sundararajan, T.; Vaidyanathan, G.; Kumar, K.U. Pressure drop and cavita-tion investigations on static helical-grooved square, triangular and curved cavity liquid labyrinth seals. Nucl. Eng. Des. 2011, 241, 843–853. [Google Scholar] [CrossRef]
  27. Watson, C.; Untaroiu, A.; Wood, H.G.; Weaver, B.K.; Morgan, N.; Jin, H. Response surface mapping of performance for helical groove seals with incompressible flow. In Turbo Expo: Power for Land, Sea, and Air; American Society of Mechanical Engineers: New York, NY, USA, 2016; Volume 49842. [Google Scholar]
  28. Watson, C.; Wood, H.G. Developing an optimal helix angle as a function of pressure for helical Groove seals. In Fluids Engineering Division Summer Meeting; American Society of Mechanical Engineers: New York, NY, USA, 2017; Volume 58042, p. V01AT05A020. [Google Scholar]
  29. Watson, C.; Wood, H. Evaluating Configurations of Double Surface Helical Groove Seals Using Computational Fluid Dynamics. In Turbo Expo: Power for Land, Sea, and Air; American Society of Mechanical Engineers: New York, NY, USA, 2018; Volume 51012, p. V02CT42A053. [Google Scholar]
  30. Watson, C.; Wood, H. Second stage optimization of helical groove seals using computational fluid dynamics to evaluate the dependency of optimized design on preswirl. In Fluids Engineering Division Summer Meeting; American Society of Mechanical Engineers: New York, NY, USA, 2018; Volume 51579, p. V003T12A028. [Google Scholar]
  31. Ma, R.; Wang, K. CFD numerical simulation and experimental study of effects of screw-sleeve fitting clearance upon triangular thread labyrinth screw pump (LSP) performance. J. Appl. Fluid Mech. 2010, 3, 75–81. [Google Scholar]
  32. Li, J.J.; Zhang, Y.C. Numerical Simulation of Labyrinth Screw Pump with Separated Structure by Fluent. In Applied Mechanics and Materials; Trans Tech Publications Ltd.: Bach, Switzerland, 2014; Volume 455, pp. 242–247. [Google Scholar]
  33. Woo, S.; Jang, H.; Kwak, H.; Moon, Y.; Kim, C. Leakage analysis of helical grooved pump seal using CFD. J. Mech. Sci. Technol. 2020, 34, 4183–4191. [Google Scholar] [CrossRef]
  34. Rong, X.; Zhu, H.; Hu, B. Performance Research and Structure Optimization of Labyrinth Screw Pump. Micromachines 2021, 12, 790. [Google Scholar] [CrossRef] [PubMed]
  35. Wang, Z.; Zhu, J.; Cao, G.; Zhu, H.; Zhong, R.; Zhu, H. Study on the Labyrinth Screw Pump for Heavy Oil Production. In Proceedings of the SPE Asia Pacific Oil & Gas Conference and Exhibition, Adelaide, Australia, 17–19 October 2022. [Google Scholar]
Figure 1. LSP geometry and prototype, (a) rotor and stator, (b) pump prototype, (c) assembly drawing.
Energies 16 05997 g001aEnergies 16 05997 g001b
Figure 2. Computational domain and corresponding mesh, (a) flow domain, (b) mesh grids.
Energies 16 05997 g002
Figure 3. CFD workflow for numerical simulations of LSP performance.
Energies 16 05997 g003
Figure 4. Comparison of CFD simulated LSP performance under water flow to experimental results with varying (a) turbulence modes, (b) rotational speeds.
Energies 16 05997 g004
Figure 5. Comparison of CFD simulated LSP performances under viscous fluid flow with experimental results, (a) H–Q performance curves, (b) computation error.
Energies 16 05997 g005
Figure 6. Pressure distributions along the axis of the screw under different flow conditions.
Energies 16 05997 g006
Figure 7. Pressure distributions in the cross-section of LSP with different flow conditions.
Energies 16 05997 g007
Figure 8. Velocity distributions in the cross-sections of LSP with different flow conditions.
Energies 16 05997 g008
Figure 9. Partial and whole velocity distributions along the screw axis with different flow conditions.
Energies 16 05997 g009
Figure 10. Total pressure averaged along the screw axis under various flow conditions, (a) N = 2900 rpm, μ = 1 cp, (b) Q = 1 m3/h, μ = 1 cp, (c) N = 2900 rpm, Q = 1 m3/h.
Energies 16 05997 g010
Table 1. Geometrical specifications of the screw in the LSP prototype.
DescriptionValues
Groove depth (h, mm)3.5
Angle of thread (θ, deg)40
Angle of thread profile (α, deg)15
Number of thread (z)20
Length of thread crest of stator/rotor (a′/a, mm)0.5/0.4
Length of thread root of stator/rotor (b′/b, mm)3.1/2.8
Thread pitch of stator/rotor (t′/t, mm)3.6/3.2
Length of screw (l, mm)200
Stator–rotor clearance (c, mm)0.5
Table 2. Physical properties of water–glycerin mixture with different concentrations.
CaseCipi (kg/m3)μi (cp)
197.1%1253.4780
295.2%1248.4543
394.2%1245.8454
492.4%1241.0331
590.0%1234.7219
687.5%1228.2164
785.0%1221.6109
875.8%1197.440
969.3%1180.321
100% (Water)998.21
Table 3. Error of CFD simulated LSP prototype performances with experimental results for different grid numbers (water, 2900 rpm, 1 m3/h).
Grid Number1,088,8561,495,6431,620,8691,883,2552,125,2542,534,5592,611,7522,664,602
H (m)29.5426.9026.3726.4329.2625.4026.0626.06
error11.24%1.329%−0.702%−0.456%10.19%−4.344%−1.852%−1.854%
Table 4. Simulation/test flow conditions.
ParametersTesting Condition
Speed (Figure 4)1760, 2000, 2240, 2480, 2720, 2900 rpm
Flow rates0, 0.25, 0.5, 0.75, 1, 1.25, 1.5, 1.75, 2, 2.25, 2.5, 2.75 m3/h
Viscosity1, 40, 164, 331, 543 cP
Disclaimer/Publisher’s Note: The statements, opinions and data contained in all publications are solely those of the individual author(s) and contributor(s) and not of MDPI and/or the editor(s). MDPI and/or the editor(s) disclaim responsibility for any injury to people or property resulting from any ideas, methods, instructions or products referred to in the content.

