Article

Validation and Verification of containmentFOAM CFD Simulations in Hydrogen Safety

1
Forschungszentrum Juelich GmbH, Institute of Energy and Climate Research—Electrochemical Process Engineering (IEK-14), 52425 Jülich, Germany
2
Institute for Reactor Safety and Reactor Technology, RWTH Aachen University, 52072 Aachen, Germany
*
Author to whom correspondence should be addressed.
Energies 2023, 16(16), 5993; https://doi.org/10.3390/en16165993
Submission received: 13 June 2023 / Revised: 5 August 2023 / Accepted: 7 August 2023 / Published: 15 August 2023
(This article belongs to the Special Issue Computational Fluid Dynamics Applied to Hydrogen Safety)

Abstract

:
As the applications of hydrogen as a replacement for fossil fuels and energy storage increase, more concerns have been raised regarding its safe usage. Hydrogen’s extreme physical properties—its lower flammability limit (LFL), for instance—represent a challenge to simulating hydrogen leakage and, hence, mitigating accidents that occur due to such leakage. In this work, the OpenFOAM-based CFD simulation package containmentFOAM was validated by different experimental results. As in its original use, to simulate nuclear safety issues, the containmentFOAM package is capable of capturing different phenomena, like buoyant gas clouds and diffusion between gases and air. Despite being widely validated in nuclear safety, this CFD package was assessed with benchmark experiments used to validate hydrogen leakage scenarios. The validation cases were selected to cover different phenomena that occur during the hydrogen leakage—high-speed jet leakage, for example. These validation cases were the hallway with vent, FLAME, and GAMELAN experiments. From the comparison of the experimental and simulation results, we concluded that the containmentFOAM package showed good consistency with the experimental results and, hence, that it can be used to simulate actual leakage cases.

1. Introduction

Since the energy crisis in the 1970s, hydrogen has been considered as a potential alternative for fossil fuel [1]. Additionally, the current environmental situation, due to global warming, has forced many governments to tighten emissions regulations. These problems, among others, have motivated both research and industry sectors all over the world to find a clean alternative to fossil fuel. All these factors have given global hydrogen production an immense increase and many industries nowadays—the automotive industry, for instance—are leading the transition towards this clean energy. Also, many governments have joined a task force—Iceland [2] and Germany [3], for example—to de-carbonize their energy supply, by depending on hydrogen as an energy storage medium. Despite all these attractive facts about using hydrogen as a possible fuel and as an energy storage medium, there are major safety concerns regarding its usage, especially at the public level.
Major industrial accidents—like the hydrogen explosions during the Fukushima reactor accidents in 2011 and the explosion of a hydrogen fuel station in Sandvika near Oslo in Norway in 2019 [1]—have sent a clear message that hydrogen safety concerns may define the future of using this gas. Because of its extreme physical properties, the simulation of hydrogen leakages can be different from the simulations of other combustible gases, like petroleum gases. Therefore, different validation cases that represent different hydrogen leakage scenarios are necessary, to simulate and analyze accurately hydrogen safety hazards in actual cases. Fortunately, hydrogen leakage research has been the focus of many experiments for many decades, and there is an abundance of literature that presents the results of these experiments, to benchmark different simulation tools.
One of the most famous benchmarking experiments was the work of Swain et al. [4]. In their work, they simulated the leakage of hydrogen and helium in a semi-closed space representing a hallway with one vent close to the floor and another one on the ceiling of this room. This experiment was used by Matsuura et al. [5], to validate the results of the CFD-ACE+ Ver. 2006 CFD software before studying the effects of the vent position and the surrounding atmospheric conditions in the studied space. Many other validation works have been done based on this benchmark case, to simulate different leakage scenarios, like the effect of the geometrical shape of vents [6], the effects of forced ventilation positions and flow rates [7], and the risk mitigation of hydrogen using sensors [8]. Also, Hajji et al. [9,10] studied the ventilation of a prismatic garage in a case of hydrogen leakage, using ANSYS FLUENT CFD software v 6.3.26, and they used Swain et al.’s [4] experiment to validate their setup.
Another widely used validation experiment is the GAMELAN experiment conducted by Cariteau and Tkatschenko [11]. This experiment involved a more detailed analysis of helium leakage, as a safer replacement for hydrogen in experiments, with higher flow velocities than those simulated by Swain et al. [4]. This experiment studied the helium concentration in an enclosure with different vent sizes at different helium leakage flow rates. Similar experiments to the GAMELAN experiments were carried out by Cariteau et al. [12]. Giannissi et al. [13,14] used this validation case as a benchmark case to compare three different CFD software, so as to simulate the leakage of helium and the effect of the different vent sizes on the concentrations inside the room, with and without taking into consideration the wind effects. Also, Hussein et al. [15] validated their model, to simulate the hydrogen leakage in a small covered garage.
Many other experiments regarding hydrogen leakage scenarios have been done for different enclosure and vent geometries. For example, Cariteau et al. [16], Gupta et al. [17], Papanikolaou et al. [18], and Swain et al. [19] conducted experiments on the hydrogen cloud formation in a residential garage. Hooker et al. [20] studied the natural ventilation of a 31 m3 enclosure with hydrogen leakage and vents in different directions, at different wind speeds and directions. Also, Liang et al. [21] studied the effect of wind speeds and directions on the ventilation rates of a semi-opened room. With the presence of this large number of experiments, many benchmark simulations, like the work of Venetsanos et al. [22] and Giannissi et al. [23], have been carried out, to validate the different CFD tools in hydrogen leakage simulations.
Despite most of the validation cases discussed above having been done to validate in-house or commercial software for different research institutes, open-source software is still behind in the simulation of hydrogen safety cases. Therefore, this work aims to present the verification and validation of the open-source containmentFOAM [24] package, based on the open-source OpenFOAM® v9 CFD software. Such validation and verification should provide a foundation for future work using the containmentFOAM package in any study regarding hydrogen safety.
This work first discusses the governing partial differential equations (PDEs) used in simulating multi-species flows and the additional models used to simulate buoyant gases, hydrogen, or helium in the current work. In the next section, the results of different validation cases are discussed. Each validation case includes the numerical setup for the case, a grid independence study, simulation results, and discussion of the results. Finally, our conclusion regarding the validation work is presented, with our perspective on the future work of the containmentFOAM package.

2. CFD Simulation Solver

To simulate turbulent flows, many turbulence models have been introduced for capturing the different turbulent flow phenomena. In this section, the governing flow equations, the turbulence models, and their modifications are presented, to give an idea of how simulating low-density gases, like hydrogen and helium, can differ from the simulation of other gases.

2.1. The containmentFOAM Package

Despite including many solvers designed to solve different types of thermo-fluid problems, it is sometimes necessary to develop a new dedicated OpenFOAM® solver to fit specialized simulations. Therefore, the containmentFOAM simulation package was implemented, validated, and maintained by Forschungszentrum Jülich, to analyze hydrogen transport among many other safety issues that occur during nuclear power plant accidents. Based on OpenFOAM® foundation version 9 (openfoam.org), containmentFOAM includes all the features that can be found in the open-source simulation code, in addition to the libraries and solvers dedicated to special applications. Currently, the containmentFOAM package is being validated and extended to suit different hydrogen safety applications.
The validation in this work was carried out to validate the containmentFOAM solver package using different hydrogen benchmarking cases. Hydrogen safety simulations differ from nuclear ones in various aspects. In hydrogen safety simulations, the gas mixture is primarily between air and hydrogen (a binary mixture), while in nuclear safety the gas mixture can be between two or more gases, like air, hydrogen, carbon monoxide, carbon dioxide, steam, and possibly other gases. Another difference is the range of temperatures and pressures simulated. In hydrogen safety simulations, the ambient temperatures are usually considered between 20–25 °C at 1 bar pressure, and the hydrogen gas can either be at the same temperatures or even lower when it is leaking from a compressed source. However, in the case of nuclear safety, the ambient and gas temperatures are usually higher, and typically range between 70–150 °C and, in some cases, can exceed 1000 °C. These differences happen mainly because hydrogen leakage mostly occurs in the open atmosphere, while nuclear accidents occur within the closed containment building. Hence, despite being widely validated in the field of nuclear reactor safety, the containmentFOAM still needs to be validated for hydrogen safety.

2.2. Solution for Unsteady Multi-Species Gas Mixture

The simulation of multi-species gas mixtures in any CFD software is based on solving the mass, momentum, and energy conservation equations for the mixture. Moreover, unsteady simulations should be used to simulate the spread of the gases during the leakage. The mass conservation equations in this case take the form
ρ t + · ρ U = 0 ,
and the momentum conservation equation reads:
ρ U t + · ρ U U = p + · τ + ρ g ,
where the shear stress tensor ( τ ) takes the form
τ = ρ ( ν + ν t ) U + U T 2 3 δ · U .
Here, ν is the kinematic viscosity, ν t is the turbulent eddy viscosity, and δ is the Kronecker delta. Additionally, the species transport equation reads:
ρ Y i t + · ρ U Y i = · J i ,
where Y i is the mass fraction of species i, and J k is the diffusion mass flux, which is described by Fick’s law as
J i = ρ D i , m + ν t S c t Y i .
In this equation, D i , m is the molecular diffusivity of species i, and S c t is the turbulent Schmidt number. Additionally, the second term represents the effect of cross-diffusion, and the third term represents the thermal diffusion flux. The corresponding energy conservation equations are as follows:
ρ h t o t t + · ρ U h t o t = p t · q ˙ + · ( U · τ ) + U · ( ρ g ) · q ˙ r a d ,
where h t o t is the total enthalpy h t o t = h + 1 2 | U | 2 and the potential energy represented by the term U · ( ρ g ) . The first term on the right-hand side represents the enthalpy change due to the time change of pressure. The second term on the right-hand side represents the net heat flux due to conduction. The third term on the right-hand side represents the viscous dissipation. The last term on the right-hand side represents heat flux due to radiation. Based on the simple gradient diffusion hypothesis (SGDH), the turbulent Schmidt and Prandtl numbers in Equation (6) are set to have the values S c t = P r t = 0.9 .

2.3. k- ω SST Turbulence Model and Its Modification for Buoyancy

From previous validation work done in Forschungszentrum Jülich, the standard k- ω SST turbulence model is used in containmentFOAM, for being reliable in many industrial and research applications. The k-ω SST turbulence model is known for its good treatment of turbulence near the wall, using wall functions. This makes this specific turbulence model suitable for the current field of applications, since hydrogen leakage in closed spaces involves the flow of hydrogen clouds over complex structures and walls. This entails a proper treatment of the wall, to calculate the different turbulence parameters properly.
Moreover, many benchmark simulations, like Abe et al. [25] and Kampili et al. [26], have shown the importance of considering the buoyancy-induced turbulence effects while simulating the stratified gas layers of buoyant gases. Therefore, considering the buoyancy effects is crucial during the simulation, because of the high-density difference between the air and the leaking hydrogen or helium. Accordingly, the k- ω SST turbulence model can take the following form that was illustrated by Menter and Esch [27], with turbulence production terms added:
ρ k t + · ( ρ U k ) = · μ + μ t σ k k + P k ˜ ρ β * ω k + P k , b ;
ρ ω t + · ( ρ U ω ) = · μ + μ t σ ω ω + 2 1 F 1 ρ σ ω 2 ω k · ω + P ω + P ω , b Y ω .
The description of the variables in Equations (7) and (8) are explained in detail in Menter and Esch [27]. According to the simple gradient diffusion hypothesis (SGDH), the production terms, namely P k , b and P ω , b , can be defined as
P k , b = ν t σ ρ g i ρ x i
P ω , b = ν t ( ( γ + 1 ) C 3 · m a x ( P k , b , 0 ) P k , b ) ,
where σ ρ = 1 is the turbulent Schmidt number and C 3 is the dissipation coefficient. The above-described k- ω SST turbulence model was implemented in the containmentFOAM package and was validated as described in the next section, using experimental results from the literature. To calculate the boundary values of the turbulence parameters, the turbulence length scale (l) was taken to equal the inlet characteristic length, and the turbulence intensity (I) at the inlet was assumed. Accordingly, the k and ω values could be calculated from the equations [28]:
k = 3 2 ( U I ) 2
ω = k 0.5 C μ 0.25 l ,
where U is the inlet velocity and C μ = 0.09 .

3. The Validation Cases

It is always important to select the validation cases of the CFD codes that represent the physical phenomena studied by this code. The validation cases must be selected to represent the physical phenomena that are required to be validated. Therefore, before showing the validation cases and the achieved results of each of them, the selection strategy and the different physical phenomena studied in these experiments are discussed.

3.1. The Validation Strategy and Matrix

Three different validation cases were chosen for this study, to be simulated using the containmentFOAM package. The three cases were the hallway leakage experiment (Swain et al. [4]), the FLAME experiment (O’Hern et al. [29]), and the GAMELAN experiment (Cariteau and Tkatschenko [11]). The three experiments simulated different physical phenomena, like buoyant clouds and their behavior in closed spaces, stratification, different concentrations, buoyancy-driven and momentum-driven flows, and jet-to-plume transition. Table 1 shows which of the experiments studied the targeted phenomena for validation.

3.2. Hallway Leakage Experiment

One of the earliest experiments done to simulate hydrogen leakage in a closed space was the experiment done by Swain et al. [4]. In this experiment, pure hydrogen and helium flows were introduced to the closed space from an inlet opening with a low velocity. This meant that the hydrogen flow was buoyancy-driven. Many different research works used the results of this experiment, to validate the simulation results of different CFD codes, like the work of Matsuura et al. [5] and Qian et al. [30]. Therefore, validating the results of containmentFoam against such an experiment could show where this CFD package stands in comparison to other codes.

3.2.1. Experimental Setup

As shown in Figure 1, the experimental setup consists of a 2.62 m3 room, with three openings with an area of 4.65 × 10⁻² m2 each. The opening in the floor represents the hydrogen leakage source, while the opening in the ceiling of the room represents the vent of the hydrogen. The third opening in the side wall of the room is mainly for air supply, to compensate for the air vented from the ceiling opening.
In this experiment, the hydrogen was leaking from the floor opening to the test room at a rate of 9.44 × 10⁻⁴ m3 s−1. As a result of its lower density, compared to the atmospheric air, the hydrogen flowed from the floor opening up towards the ceiling of the room, to form a cloud that accumulated near the ceiling. After some time, the thickness of the hydrogen cloud reached its steady state, and the rate of the hydrogen supply from the inlet became equal to the hydrogen flow rate through the ceiling vent.
To study the hydrogen concentrations inside the room during the leakage, four hydrogen concentration sensors are placed inside the room, at the locations shown in Table 2, and they are marked in red points in Figure 1.

3.2.2. Numerical Setup

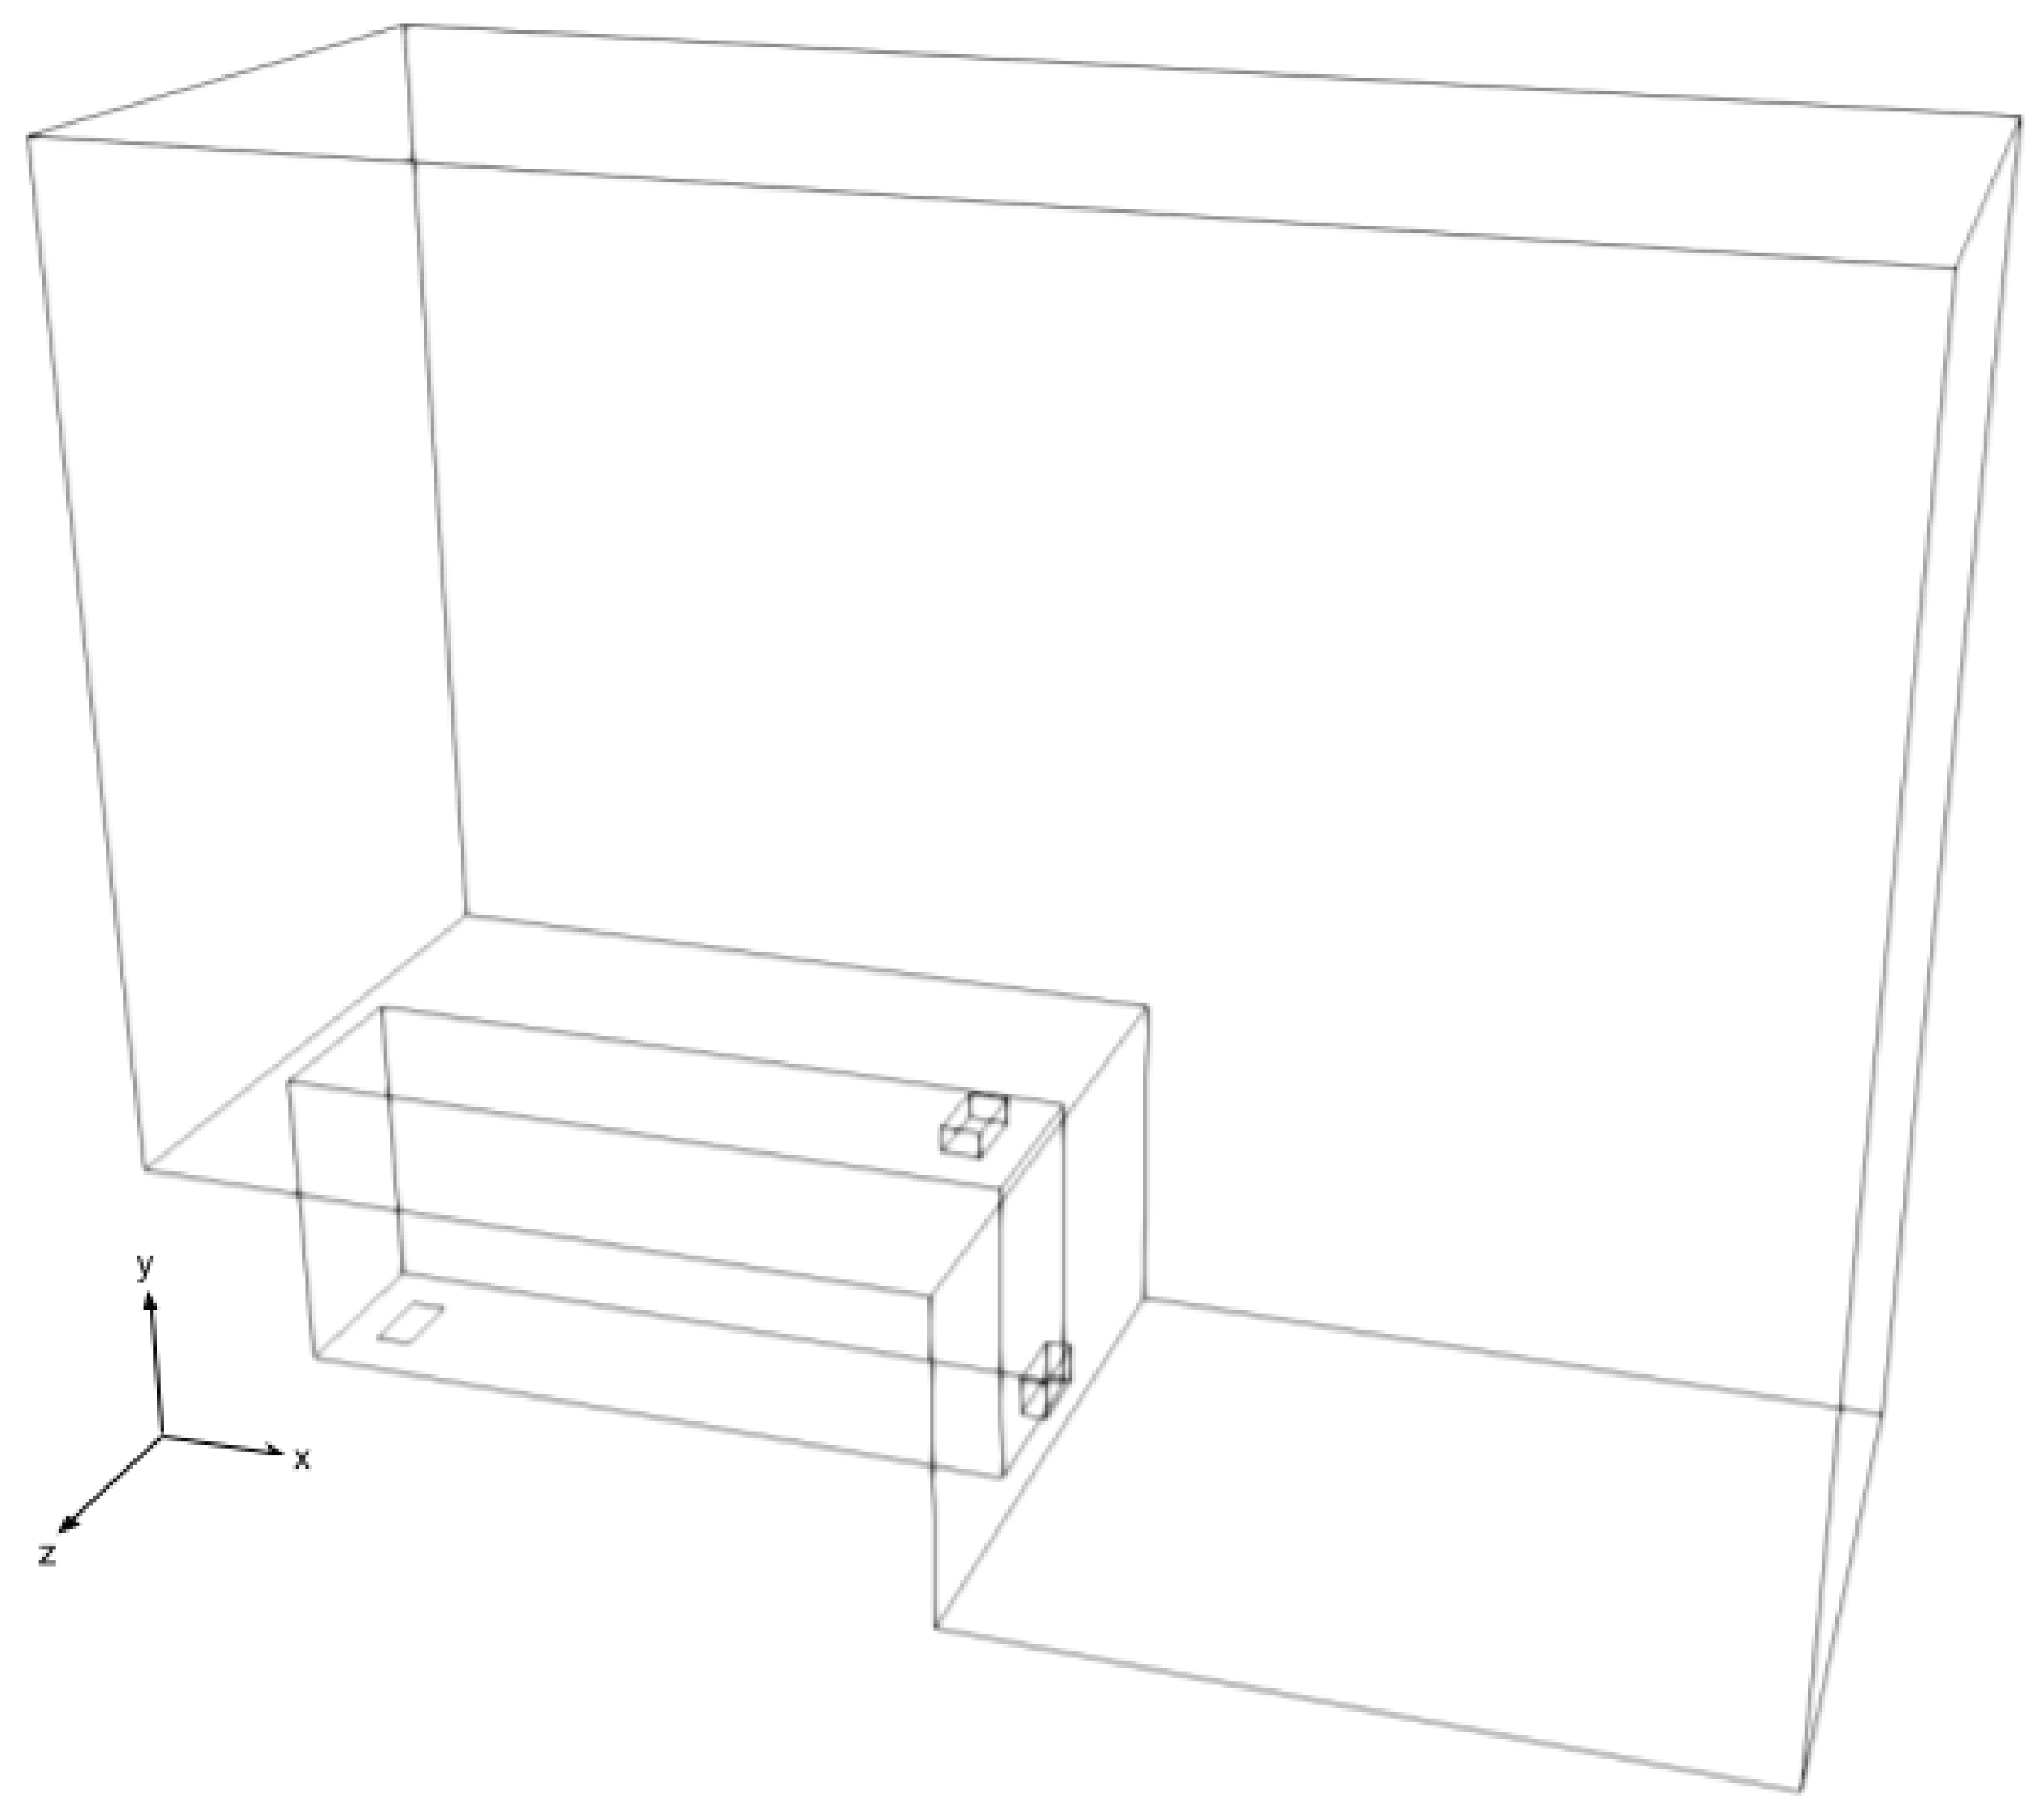
The above-described test setup is converted into a fully structured grid that is generated by using OpenFOAM’s native mesh generator, blockMesh. Despite the availability of some boundary conditions that mimic the atmosphere, the grid used in simulating this validation case is extended beyond the hallway geometry, to mimic the open atmosphere. Figure 2 shows the extension of the domain above the ceiling opening and beside the wall opening of the hallway, to avoid any influence of the boundary condition on the distribution of hydrogen gas inside the hallway itself. In the current work, the complete domain extended about 2.5 m in the y direction, with the hallway exactly in the middle, 5 m in the x direction, and 6 m in the z direction. To correctly resolve the boundary layer near the walls, the expansion ratios between the cell closest to the wall and the largest cell adjacent to the flow openings were 5, 10, and 20 in the x, y, and z directions, respectively.
For the boundary conditions, all the walls of the hallway and of the openings were considered to be walls with no-slip conditions. On the other hand, all the boundaries of the extended domain, except for the lower boundary of the extension in the x direction, were considered as “inletOutlet” boundary conditions. This meant that the outer boundaries of the domain were acting as zero gradients for the exiting flow and as fixed values for the entering flow to the domain. For the floor inlet opening, the flow velocity was fixed to give the hydrogen flow rate, at 100% hydrogen concentration. Since the test setup was located on the ground, the lower boundary of the extension in the x direction was treated as a wall with a no-slip condition. To simulate the progress of hydrogen concentration inside the test rig, the gases were simulated as a compressible unsteady simulation, with a Courant-Friedrichs-Lewy number (CFL) = 0.99, to ensure that the physical quantities were correctly simulated.

3.2.3. Grid Independence Study

A grid independence study was done for the numerical domain shown in Figure 2, to find the proper grid resolution for the given parameters of the experiment. Domains with a different number of cells were tested, to optimize the solution for a minimum number of cells in the domain with reasonable simulation accuracy. The selected cell resolutions in each direction are shown in Table 3. During the mesh generation, the first cell height near the wall was generated so that it was small enough to resolve the boundary layer of the hydrogen–air mixture. This was done by grading the cells towards the wall, as shown in Figure 3.
Figure 4 shows the hydrogen volumetric concentrations of the four sensors inside the hallway for the five different grids indicated in Table 3. In Figure 4a, the concentrations from sensor S1 are shown. As can be seen, the simulation results for Grid 1 overestimated the concentrations by an average of 2%, with very high fluctuations ranging between around 2.7% and 1.3%. The other grids show good agreement, but with some minor fluctuations beginning at 300 s after the start of the simulation.
Also, in Figure 4b–d, oscillations can be clearly seen after 300 s of simulations. These oscillations resulted from the oscillating hydrogen exit velocity from the ceiling vent of the hallway, which reflected in the concentrations of the hydrogen cloud in the hallway. Nevertheless, all the grids in these three figures provided close results with minor differences, especially for grids 3, 4, and 5. As indicated in Table 3, the only difference between grids 3 and 4 was the number of cells in the extension of the domain that did not have a significant effect on the concentrations inside the hallway. Also, grid 5 did not show a considerable difference in concentrations from grids 3 and 4. Therefore, it was concluded that the optimum grid for this study was grid 3, with a total of 473,340 cells.

3.2.4. Simulations Results and Discussion

Grid 3 was used to simulate the hydrogen leakage and the different concentrations in this experiment. The only available parameter that was measured in this experiment was the hydrogen concentration at the four sensors in the locations indicated in Table 2. However, a plausibility analysis of the results was undertaken, to make sure that the helium and air were behaving as expected.
Firstly, the flow directions into and out of the hallway had to be verified. This verification was done by plotting the velocity vector of the flow and the hydrogen volumetric concentration for the hallway after reaching the steady state—after 400 s of the simulation, in this case. In Figure 5a, it can be seen that the flow velocity reached its maximum values at the ceiling opening outwards to the hallway and at the side wall opening inwards to the hallway. This agreed with the aforementioned description of the domain shape and the purpose of these two openings. Also, Figure 5b shows the concentration of hydrogen in the mixture inside the hallway. The two figures reveal a possible flow pattern of the hydrogen–air mixture flowing through both roofs (exiting) and the side wall opening (entering).
On this basis, the simulation results of the hydrogen cloud build-up in the hallway were compared to the experimental results, as shown in Figure 6. In this figure, the measured concentrations of hydrogen recorded by the four sensors described in Table 2 are compared to the simulation results of the concentrations at the same locations. It can be seen that the simulation results agree well with the measurements, even in the period before reaching the steady state, i.e., constant cloud thickness at the ceiling.
It can be seen that the amplitude of the fluctuation in the hydrogen concentration was fading at the two sensors located far from the inlet opening. This can be explained by the rapid mixing between air and hydrogen near the inlet and by the mixture becoming more homogeneous as it moved away from the inlet. However, it can be concluded that the simulation results show good agreement with the measurements.

3.3. The FLAME Experiments

The FLAME experiments used in this validation were performed at the Fire Laboratory for Accreditation of Models by Experiments (FLAME) at SANDIA National Laboratories, and the results were published by O’Hern et al. [29]. In these experiments, the behavior of the buoyant helium plume was studied, to give a deeper insight into the concentrations, the turbulent kinetic energy, and the different helium velocity components. Unlike the other experiments involving buoyant gas leakage, the turbulence characteristics of the buoyant cloud were studied by the velocity and concentration measurements of the buoyant gas. The different phenomena studied by this experiment were studied in depth by Desjardin et al. [31], Maragkos et al. [32,33], and Chung et al. [34].

3.3.1. Experimental Setup

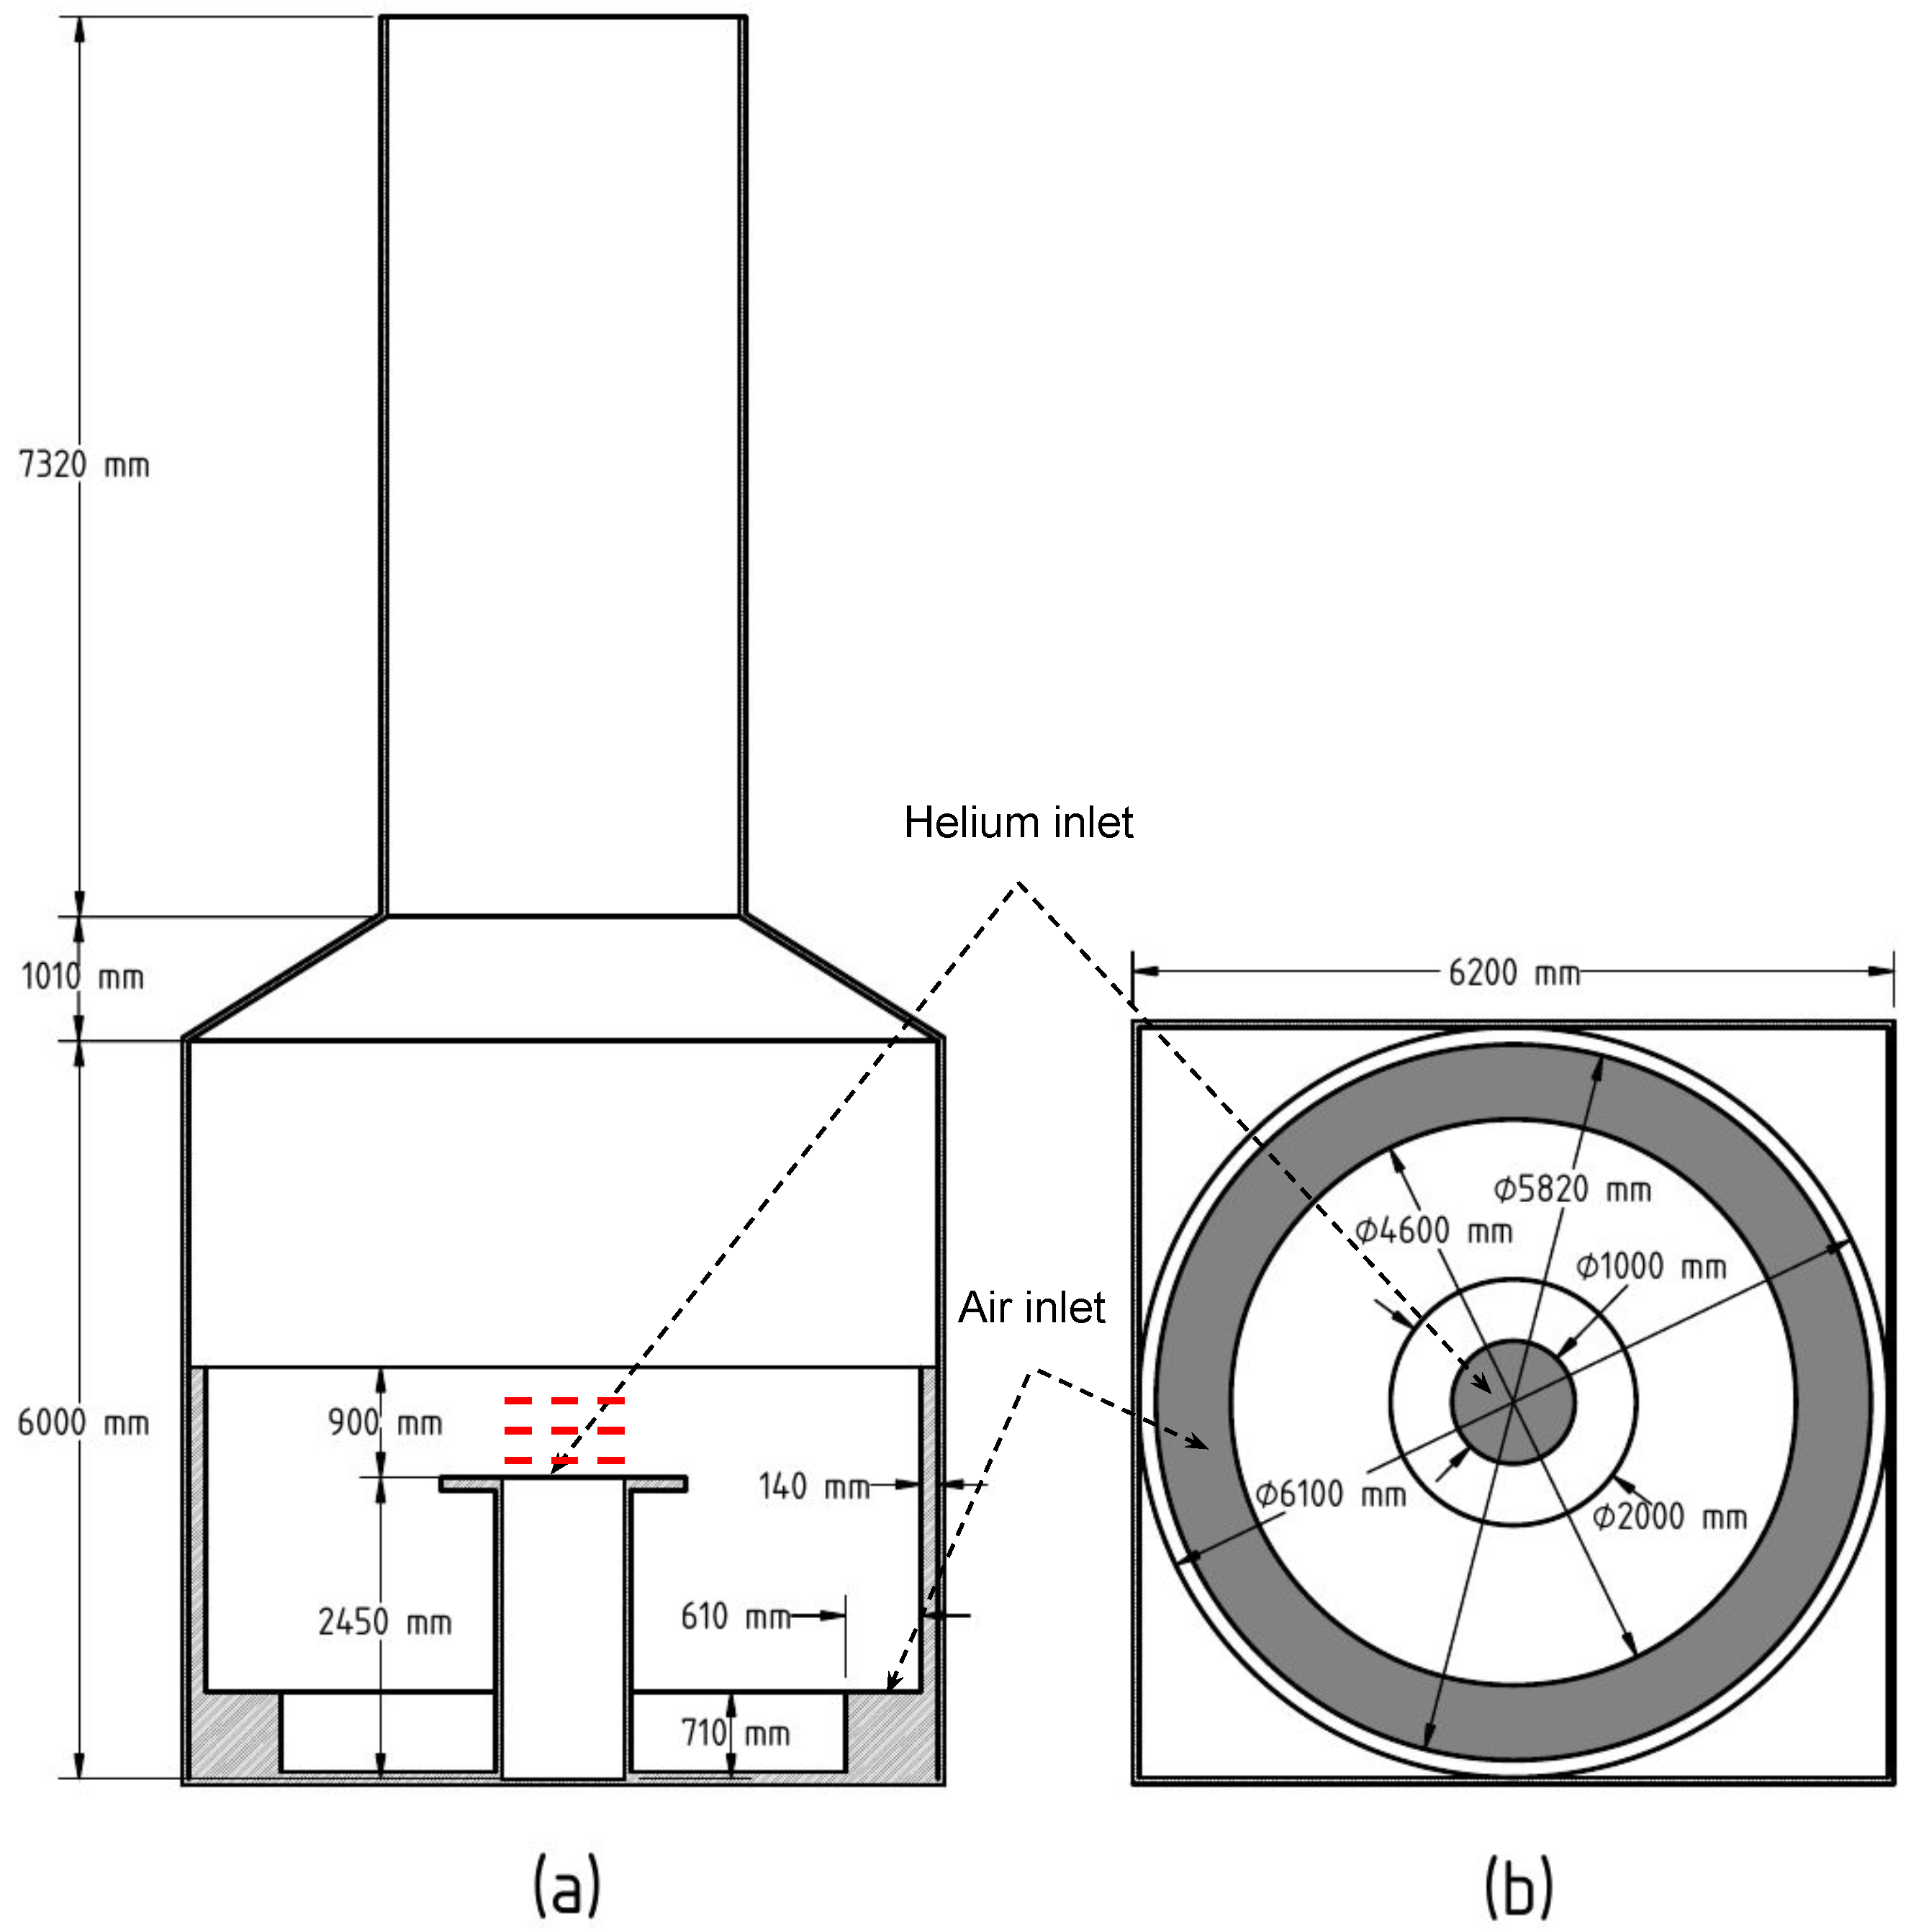
The FLAME facility consisted of a cubic chamber with 6.1 m sides, as shown in Figure 7. The helium was introduced through a 1 m diameter opening located at the center of the cubic chamber and 2.45 m above its floor. The air was supplied through a 0.61 m-wide annulus inscribed by the cubic chamber. Additionally, a 2 m diameter ring was attached to the outlet of the helium inlet pipe, to avoid any violent mixing with the air at the edge of the pipe, so as to ensure that the turbulent structures of the plume were generated only by buoyancy and its effect on mixing the helium with the air surrounding it.
For the flow measurements, particle image velocimetry (PIV) was used to measure the flow velocity in a plane passing through the axis of the supply. Planar laser-induced fluorescence (PLIF) was used to measure the helium concentration inside the chamber. Regarding the flow rates of the gases, the helium was supplied through the center inlet at 0.325 m s 1 , while the air was supplied from the annulus at 0.15 m s 1 . The introduced helium was acetone and oxygen, to enable PLIF imaging due to the fluorescence effect of the acetone, as illustrated by Chung et al. [34].

3.3.2. Numerical Setup

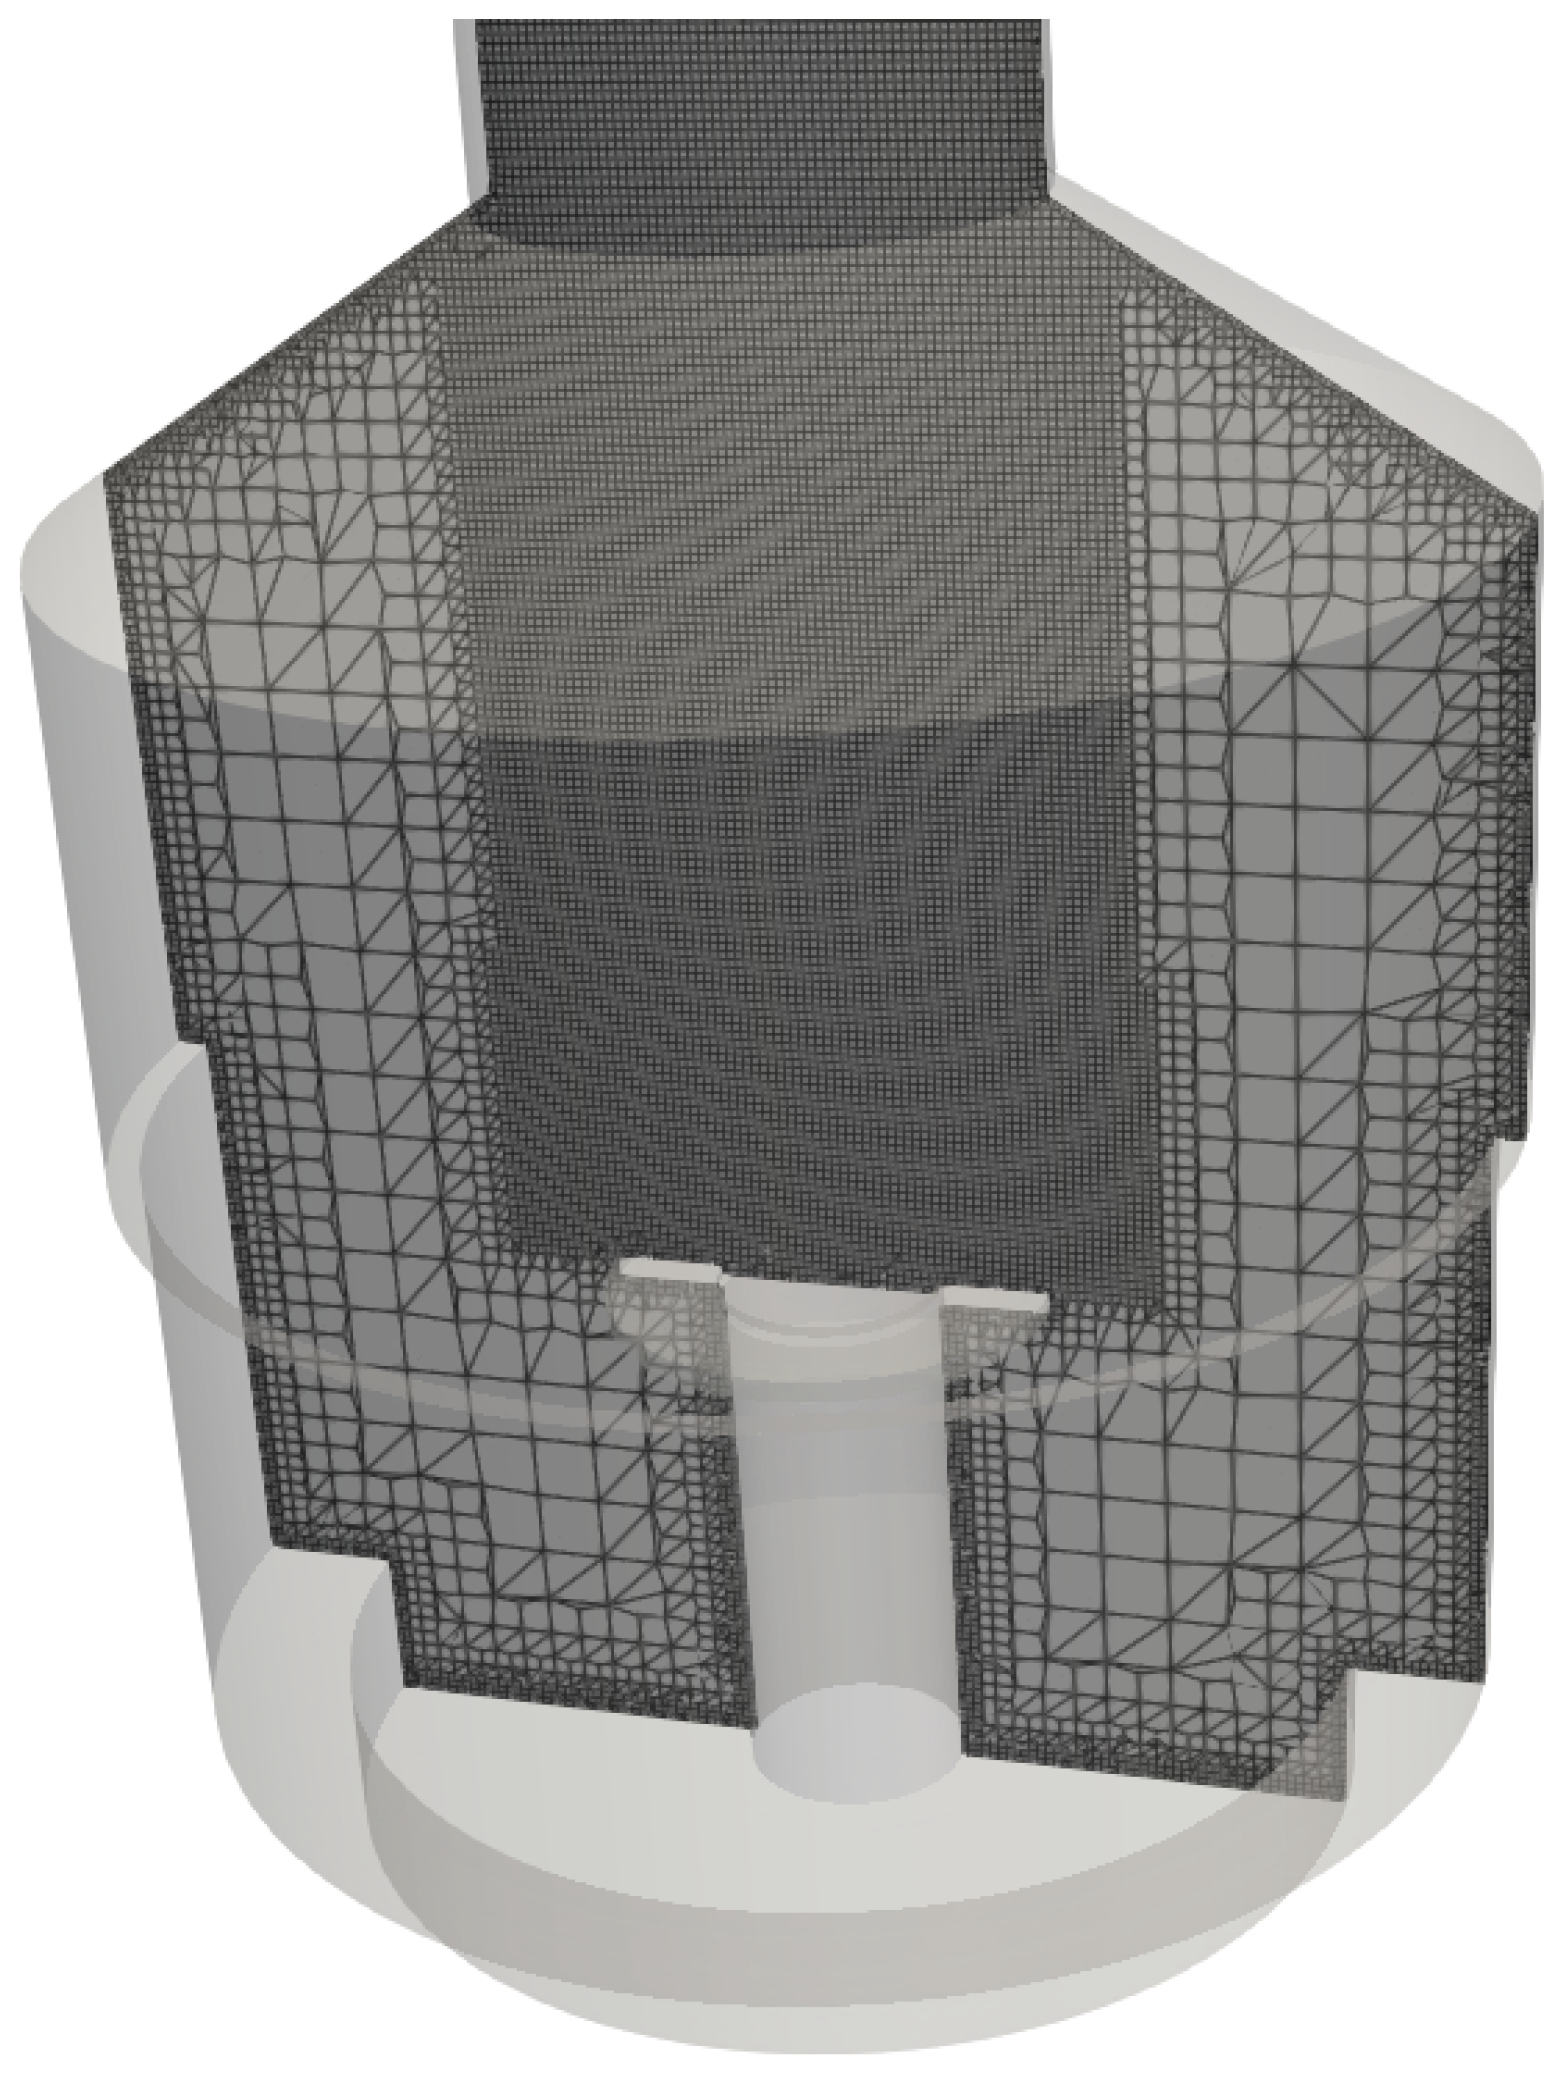
Unlike the hallway numerical setup mentioned in Section 3.2.2, the test rig in this case had a more complicated geometry, so as to use the blockMesh grid generator. Therefore, cfMesh+ v 4.4 software [36] was used to generate the Cartesian body-fitted grid (shown in Figure 7) built upon a 3D CAD model. Additionally, the same concept of an extended outlet described in Section 3.2.2 was applied, to ensure an adequate representation of the open atmosphere. To simplify the geometry, the cubic domain and the square-section chimney were approximated to cylinders with diameters equal to the cube’s and the chimney’s side: namely, 6.1 m and 2.28 m, respectively. Figure 8 shows a sectional view of a sample grid for the test rig. In the shown grid, local refinement was introduced to the grid, starting from the helium outlet and extending to the chimney, to ensure proper simulation of the different phenomena occurring within and around the buoyant plume. Also, refinement and wall layers were applied for the same reason.
For the boundary conditions, all the walls were simulated with no-slip conditions. Also, both helium and air inlet openings were considered with fixed concentrations and temperature values. The two turbulence-related values—namely, k and ω —were calculated assuming a turbulence intensity value = 5 % . As described in Section 3.2.2, the simulation for the hydrogen–air mixture was an unsteady compressible gas with CFL = 0.99.

3.3.3. Grid Independence Study

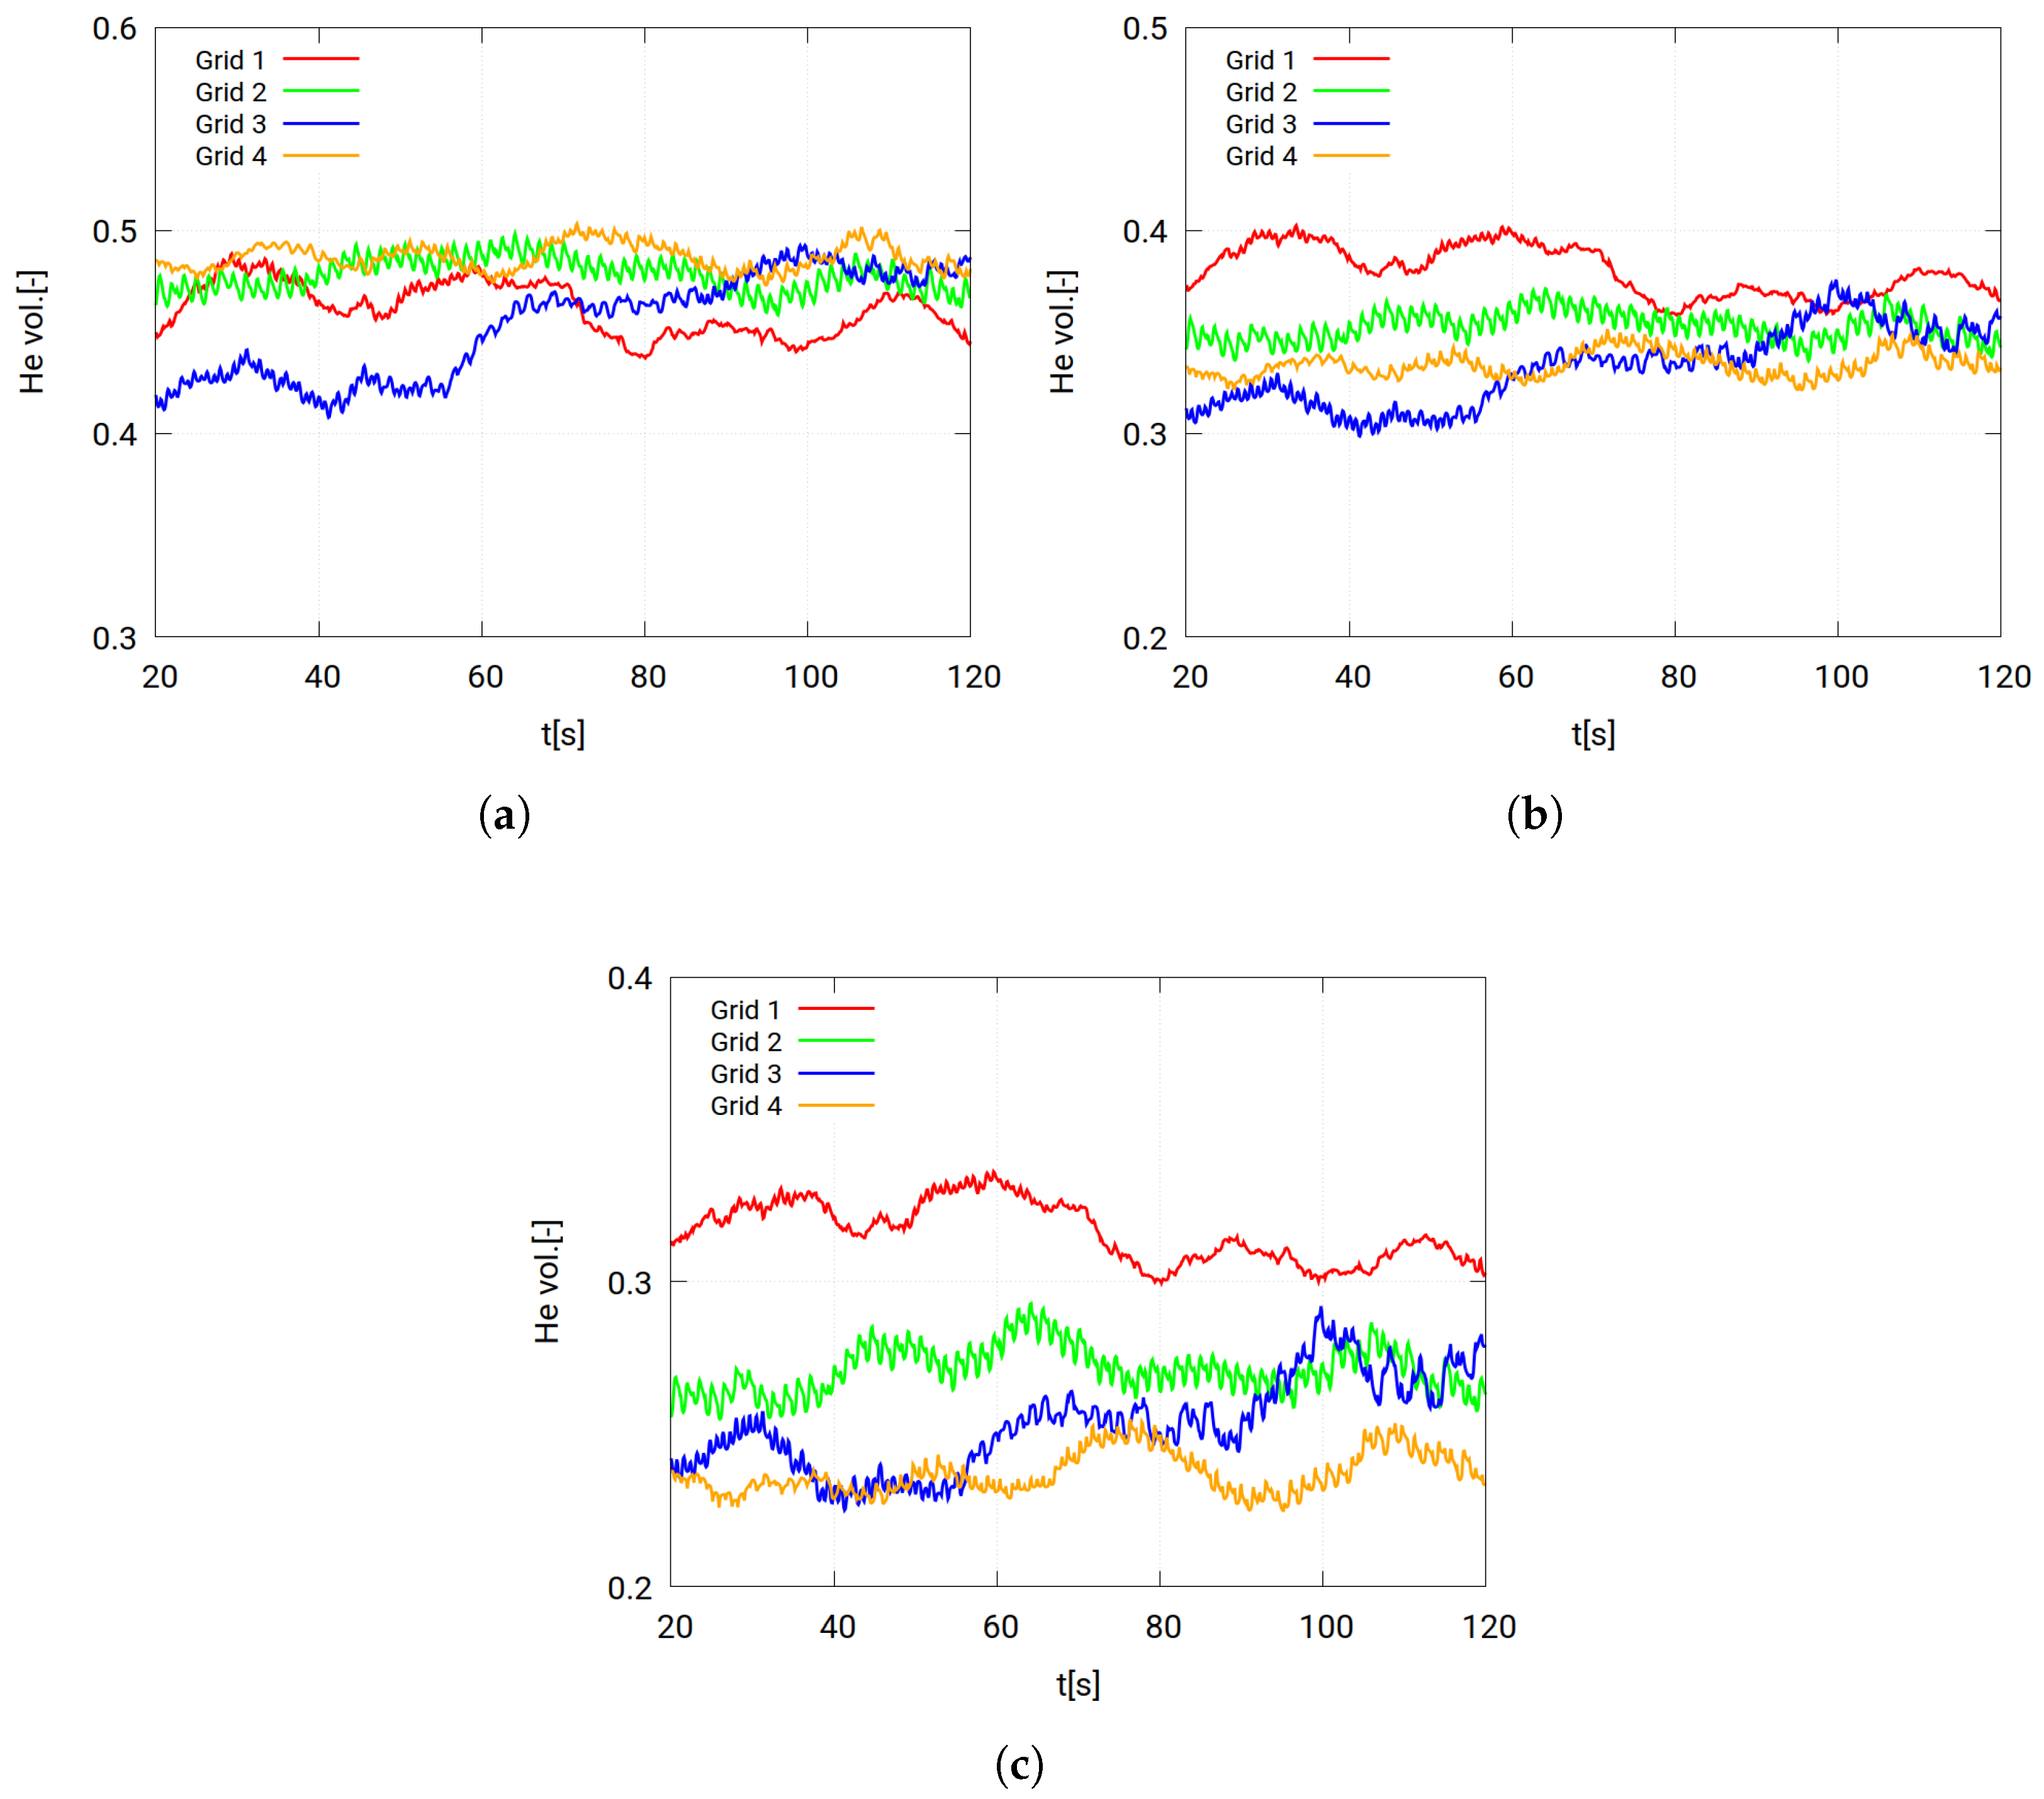
Also in this validation case, four different grids were generated for the grid independence test. In the four cases, the same 3D geometry and refinement regions were used. However, the maximum cell size was changed, to change the overall spacial resolution and, hence, the total number of cells. Table 4 shows the grid sizes of the four grid study cases. To check the differences between the four grids, helium concentrations were measured at three different heights. The three points were located at 0.2 m, 0.4 m, and 0.6 m along the axis of the helium inlet opening, and are shown as red dashed lines in Figure 7.
Figure 9 shows the helium concentrations at the three points, as described, over the period from 20 s to 120 s. From the three, it can be seen that grids 2, 3, and 4 provided close results. However, it can also be seen that grid 2 could provide close results to the finest grid—grid 4 in this case. Accordingly, grid 2 was used for the validation process of this experiment, since higher resolutions would not provide significant improvement in the main parameter in this experiment, which was helium concentrations, in this case. In this grid, three cells with an expansion ratio of 1.1 were added close to the walls of the domain, to resolve the flow near these walls.

3.3.4. Simulations Results and Discussion

The simulation results of grid 2 are shown in Figure 10. In this figure, three different values are compared at three different heights along lines extending roughly 0.5 m from both sides, passing through the axis of the helium inlet opening. These three parameters are the helium volume fraction (He vol.), the radial flow velocity (W), and the axial flow velocity (U). The error band represents the error in the measurement instruments used in the experiments. According to Desjardin et al. [31], the error in helium concentration measurements is ± 21 % , while the error in velocity measurements is ± 20 % . The light-colored regions in the plots—namely: gray, light-blue, and light-red regions—represent these errors.
For the helium concentrations plotted in Figure 10a, the simulation results show good agreement with the experimental results for concentrations at 0.2 m height from the inlet. However, such agreement decreases as the height of the measurement lines increases. Similarly, changes in the radial velocity agreement as the height increases are shown in Figure 10c. It can be seen from this figure that the agreement between simulation and experiment decreases with the increase of the height. On the other hand, the agreement of the axial velocity shows the opposite behavior in Figure 10b. In this figure, the best agreement can be seen at line 0.6 m above the inlet, and the agreement decreases as the height decreases.
From Figure 10a,b, it can be understood that the buoyancy force acting on the helium cloud was overestimated in the case of a high-density gradient, as in Equation (9), with the surrounding air, i.e., near the helium inlet. This accelerated the helium cloud against the gravity, until it accumulated with high concentrations at the top of the test rig, and the concentrations stabilized with the steady state between the helium inlet and the ventilation of the cloud. Since helium concentration in this experiment was the most relevant parameter for hydrogen safety analysis, which showed fair agreement in this validation case, it can be concluded that the results of this validation are acceptable. However, further improvement in the buoyancy model is needed, to simulate this experiment.

3.4. The GAMELAN Experiments

The GAMELAN experiments were conducted by the French Alternative Energies and Atomic Energy Commission (CEA), to study the leakage of light gases—and helium, in this experiment—in the case of natural ventilation. Unlike the previously studied validation cases, the GAMELAN experiment studied the leakage of helium cloud in cases of leakage at higher velocities. The results published by Cariteau and Tkatschenko [11] show the experimental results for helium flow rates between 5–300 NL min . 1 for three different ventilation opening dimensions: 0.9 × 0.18 m 2 , 0.18 × 0.18 m 2 , and 0.9 × 0.035 m 2 for leakage from 5 mm and 20 mm diameter pipes. However, in this work, the simulation results from only one case of ventilation opening size, leakage pipe size, and helium flow rate are shown.

3.4.1. Experimental Setup

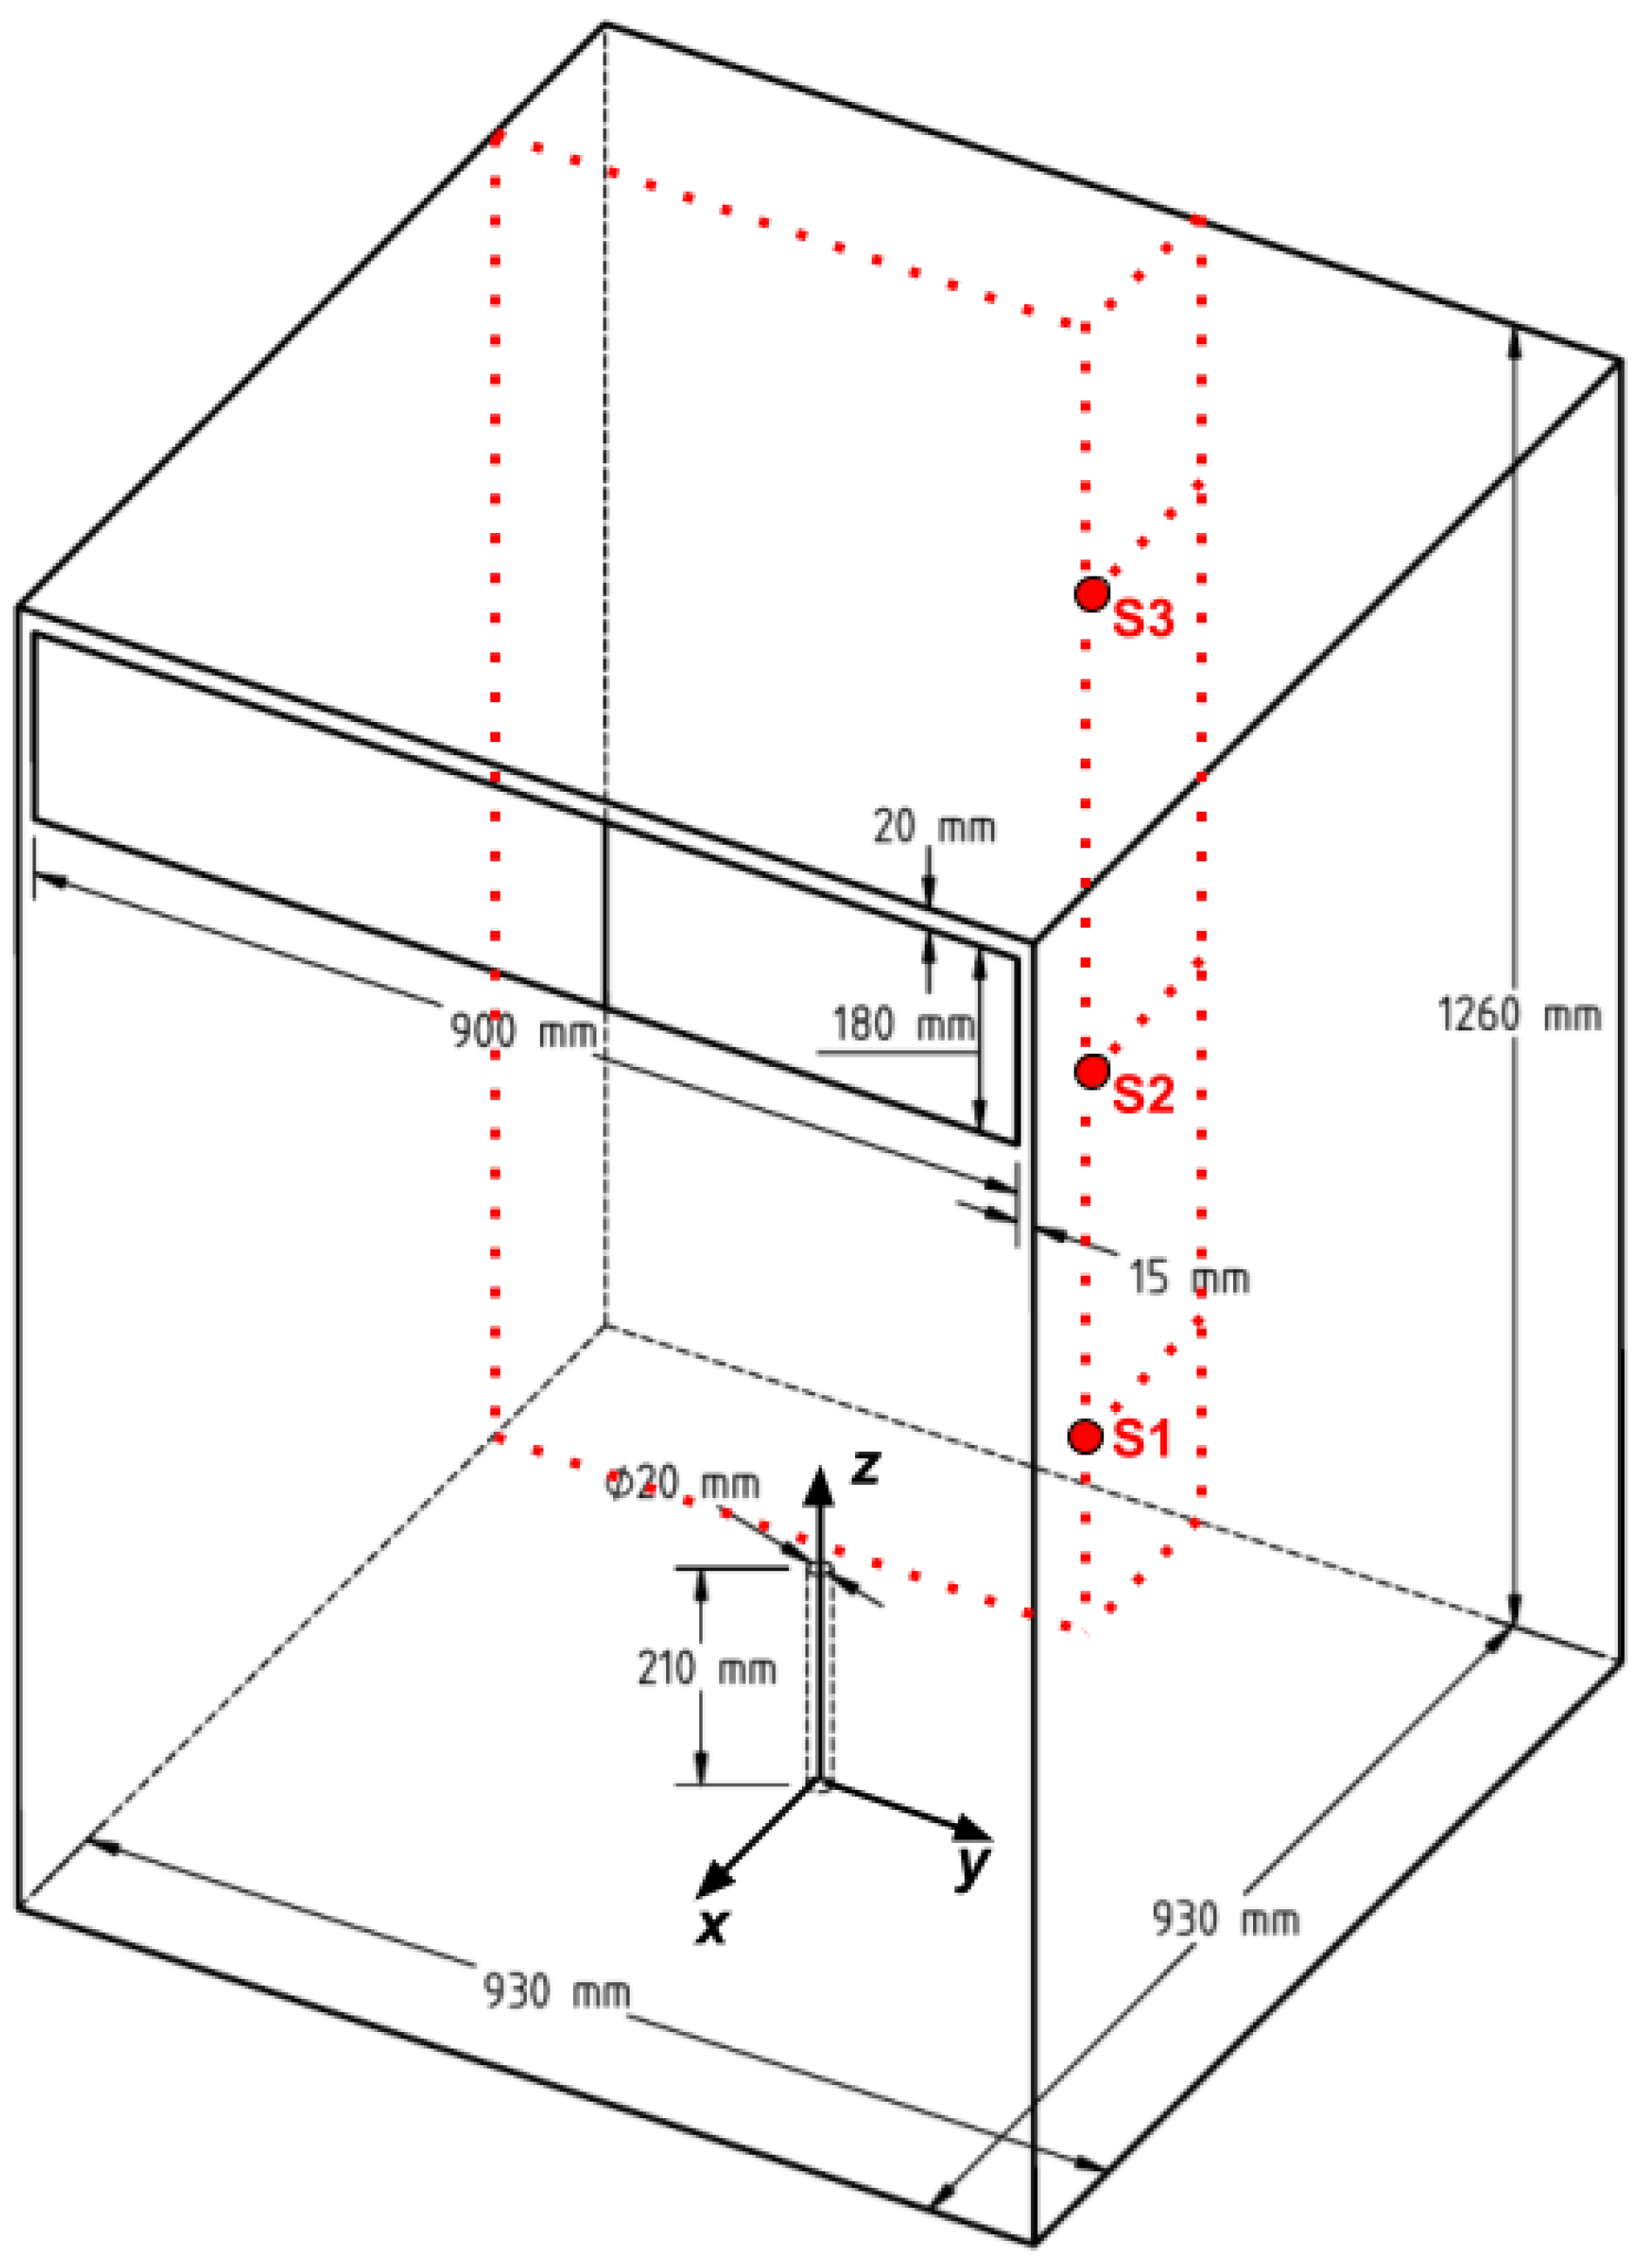
Figure 11 shows a schematic sketch of the test chamber of the GAMELAN experiment. The test chamber has a volume of 1.09 m 3 with a 0.162 m 2 located 0.02 m below the ceiling of the room. The helium is introduced inside the room by a 0.02 m diameter pipe located at the exact center of the floor, with its outlet opening located 0.21 m above the floor of the chamber. The 60 NL min . 1 helium volumetric flow rate through the leakage pipe results in a mass flow rate of 8.9195 × 10 6 kg s 1 at helium density ρ H e = 0.163 kg m 3 . Also, the temperature of the whole domain is set to 298.95 K.
The behavior of the gas cloud—helium in the GAMELAN case—is studied by analyzing the development of helium concentrations in different locations in the chamber. In the experiment, the volumetric concentrations of helium are measured using 15 concentration sensors arranged in three vertical lines with five sensors each. However, for simplicity of the analysis, and because of the limited availability of the published results, the results of only three sensors were studied here. The sensors are located along a vertical line (i.e., parallel to the z-axis) with its base on the floor at x coordinate = 0.225 m and y coordinate = 0.16 m . The three sensors, namely S1, S2, and S3, are located at 0.1 m , 0.58 m , and 1.060 m , respectively, above the floor, and are shown with red dots in Figure 11. It should be noted that, although the experiments were done and published by Cariteau and Tkatschenko [11], the experimental results used in this work were extracted from Giannissi et al. [13].

3.4.2. Numerical Setup

In general, the simulations presented in this work followed the numerical setup of the HyFOAM tutorial case published by Giannissi and Venetsanos [37]. The major differences were the application of the modified k-ω S S T turbulence model, explained in Section 2.3, along with the containmentFOAM solver and its different libraries. In addition, the grid resolution was changed, to perform the mesh grid independence study explained in the next section. In this case setup, the grid was a fully structured grid and was generated using a blockMesh grid generator.
Similar to the previous two cases, an extension for the computational domain was added to the outlet, to mimic the effects of the atmosphere surrounding the chamber, as shown in Figure 12. Since the chamber’s geometry was symmetric around the x z plane, the mesh was generated to represent only half of the computational domain required to simulate such a case. Accordingly, the patch that represented the intersection between the full domain and the x z plane passing through the center of the pipe was considered a symmetric boundary. This approach to grid generation benefited from the similarity of the geometry to half the required number of grid cells and, accordingly, the computational cost.
The grid had expansion ratios between the first cell, near the wall, and the largest cell, in the mid-distance between the wall and the pipe, of 5 and 6.7 in the x and y directions. In the z direction, all the cells had the same dimension. To ensure the numerical stability and the proper simulation of the different physical quantities, the simulation was carried out at CFL = 0.99.
From the approach explained above, the boundary conditions of the simulations were set to be wall conditions for the walls of the chamber and the inlet pipe. Also, the extension of the domain was set to be the “inletOutlet” boundary condition. For the helium inlet patch, the velocity was calculated from the helium mass flow rate, and the helium concentration at this patch was 100%. To calculate the boundary values of the turbulence parameters, the turbulence length scale (l) was taken to equal the inlet pipe diameter, and the turbulence intensity (I) at the inlet was assumed to be 3 % .

3.4.3. Grid Independence Study

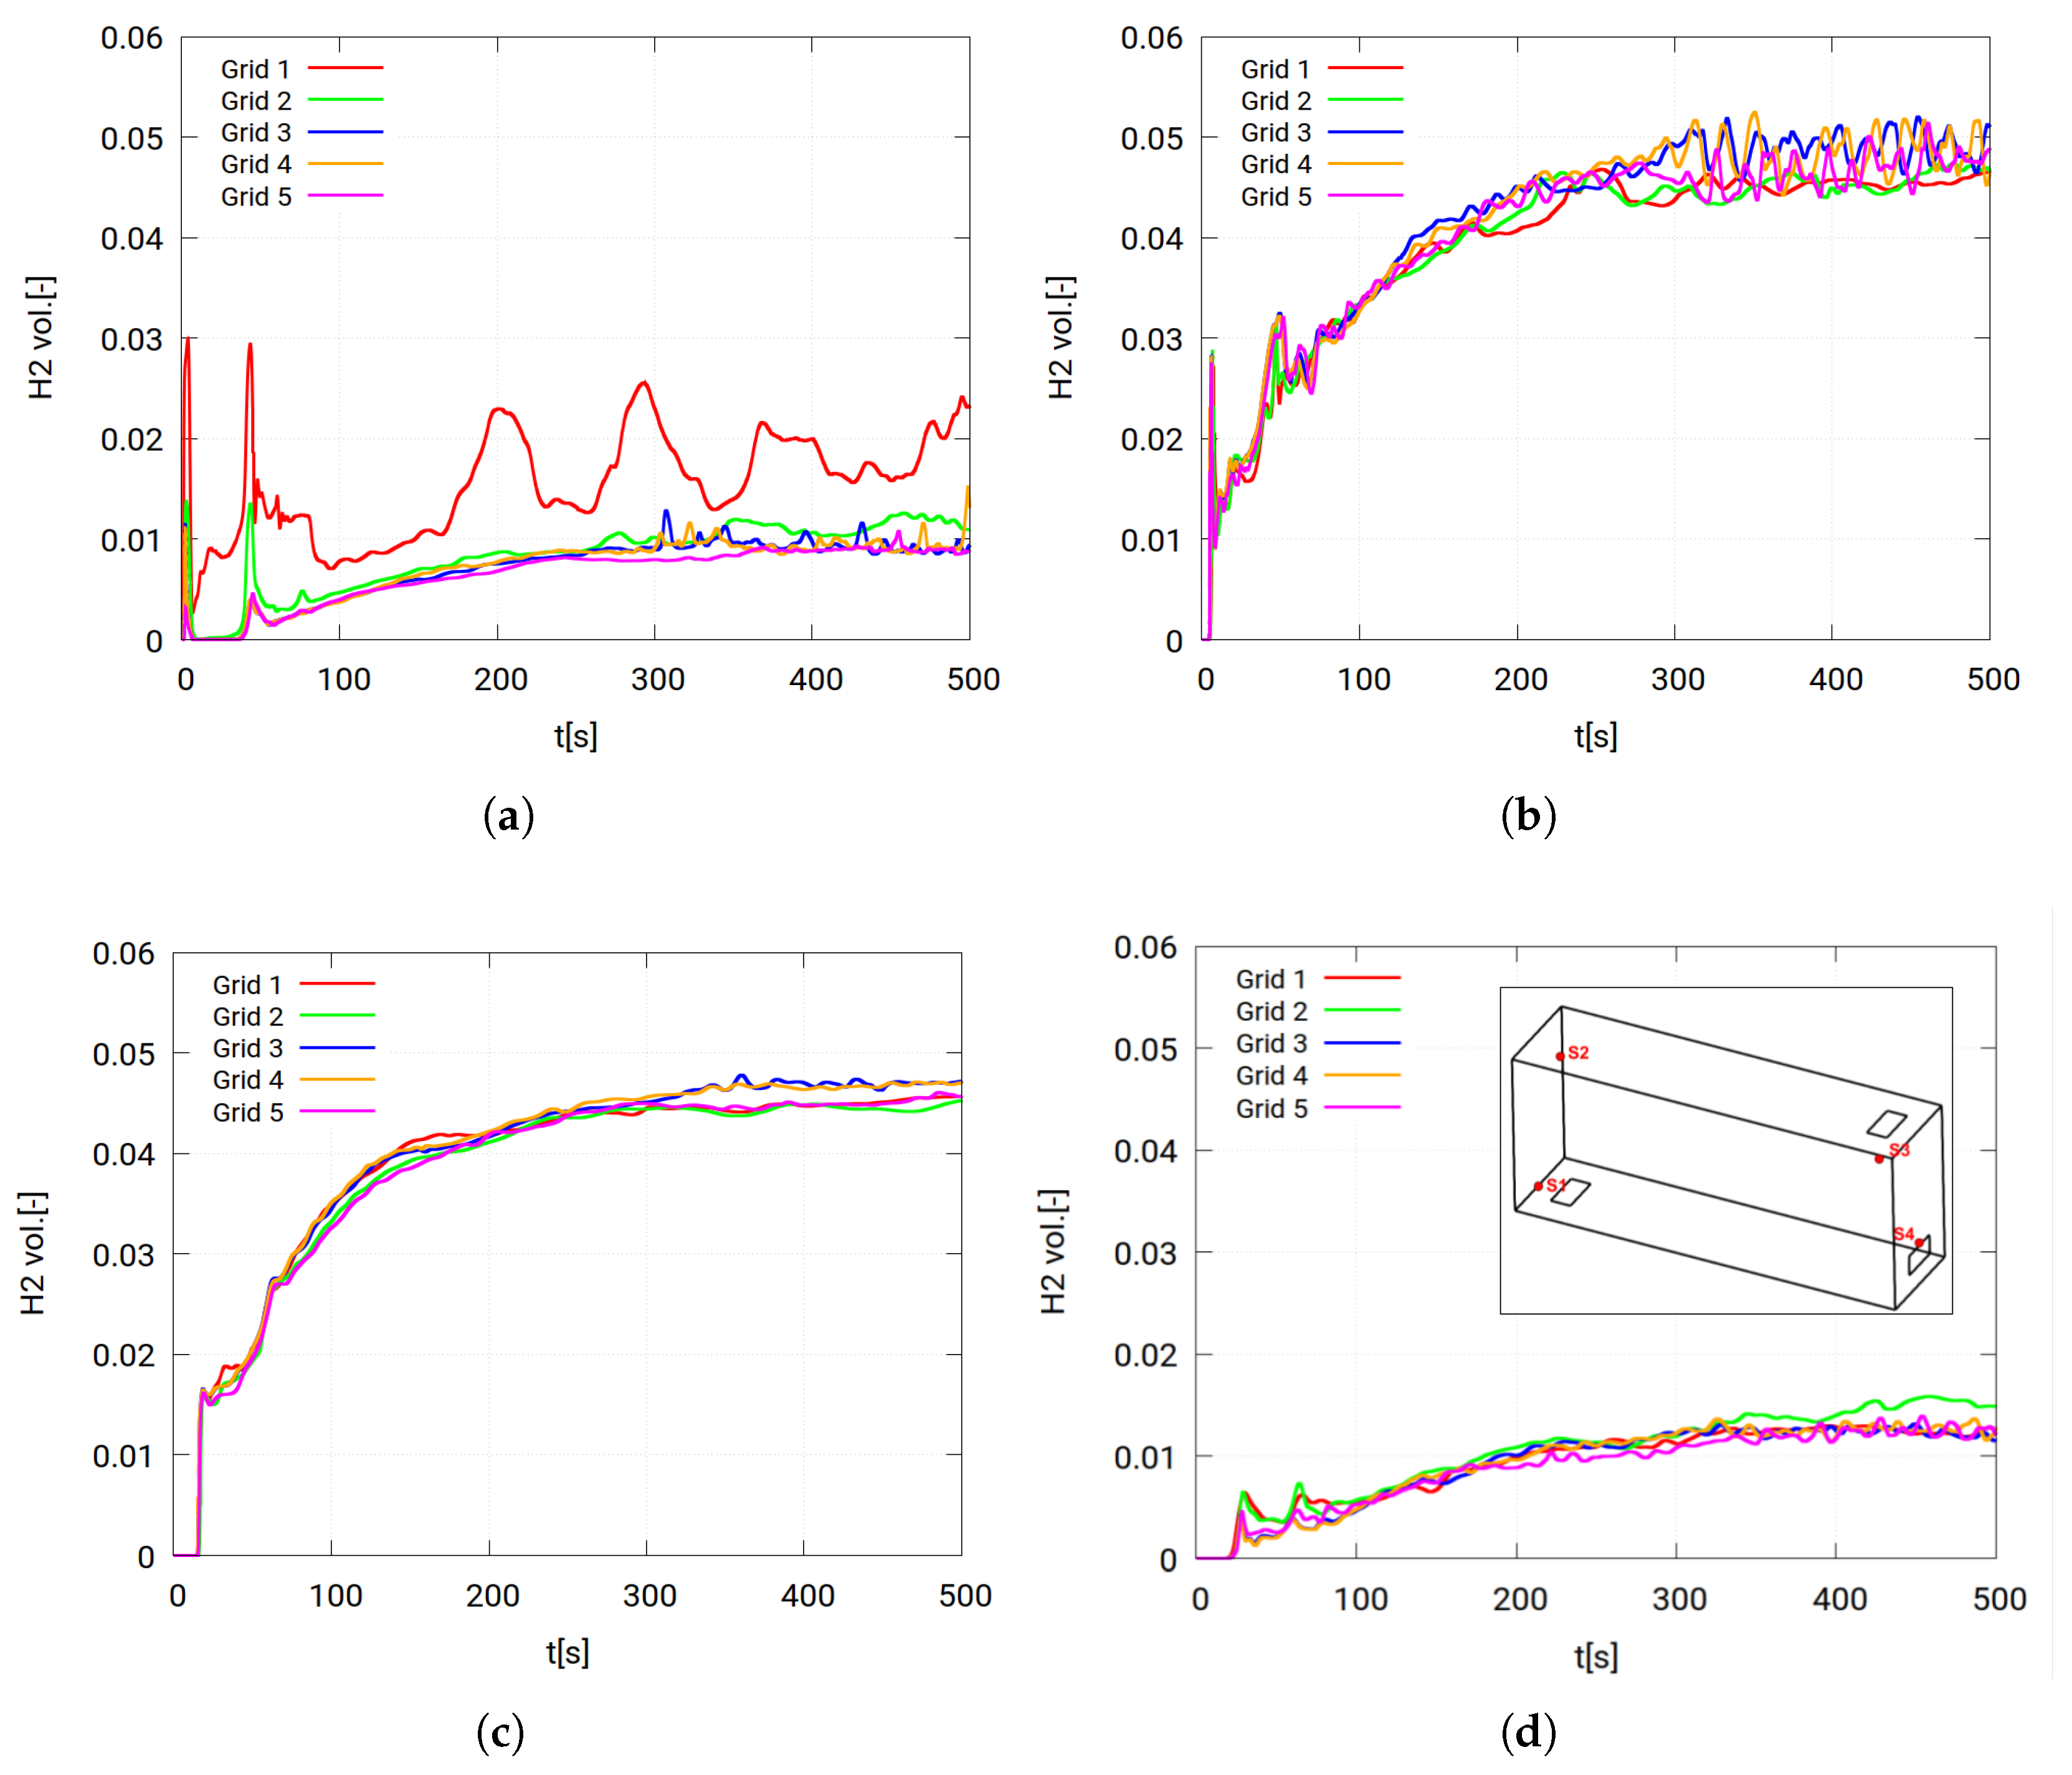
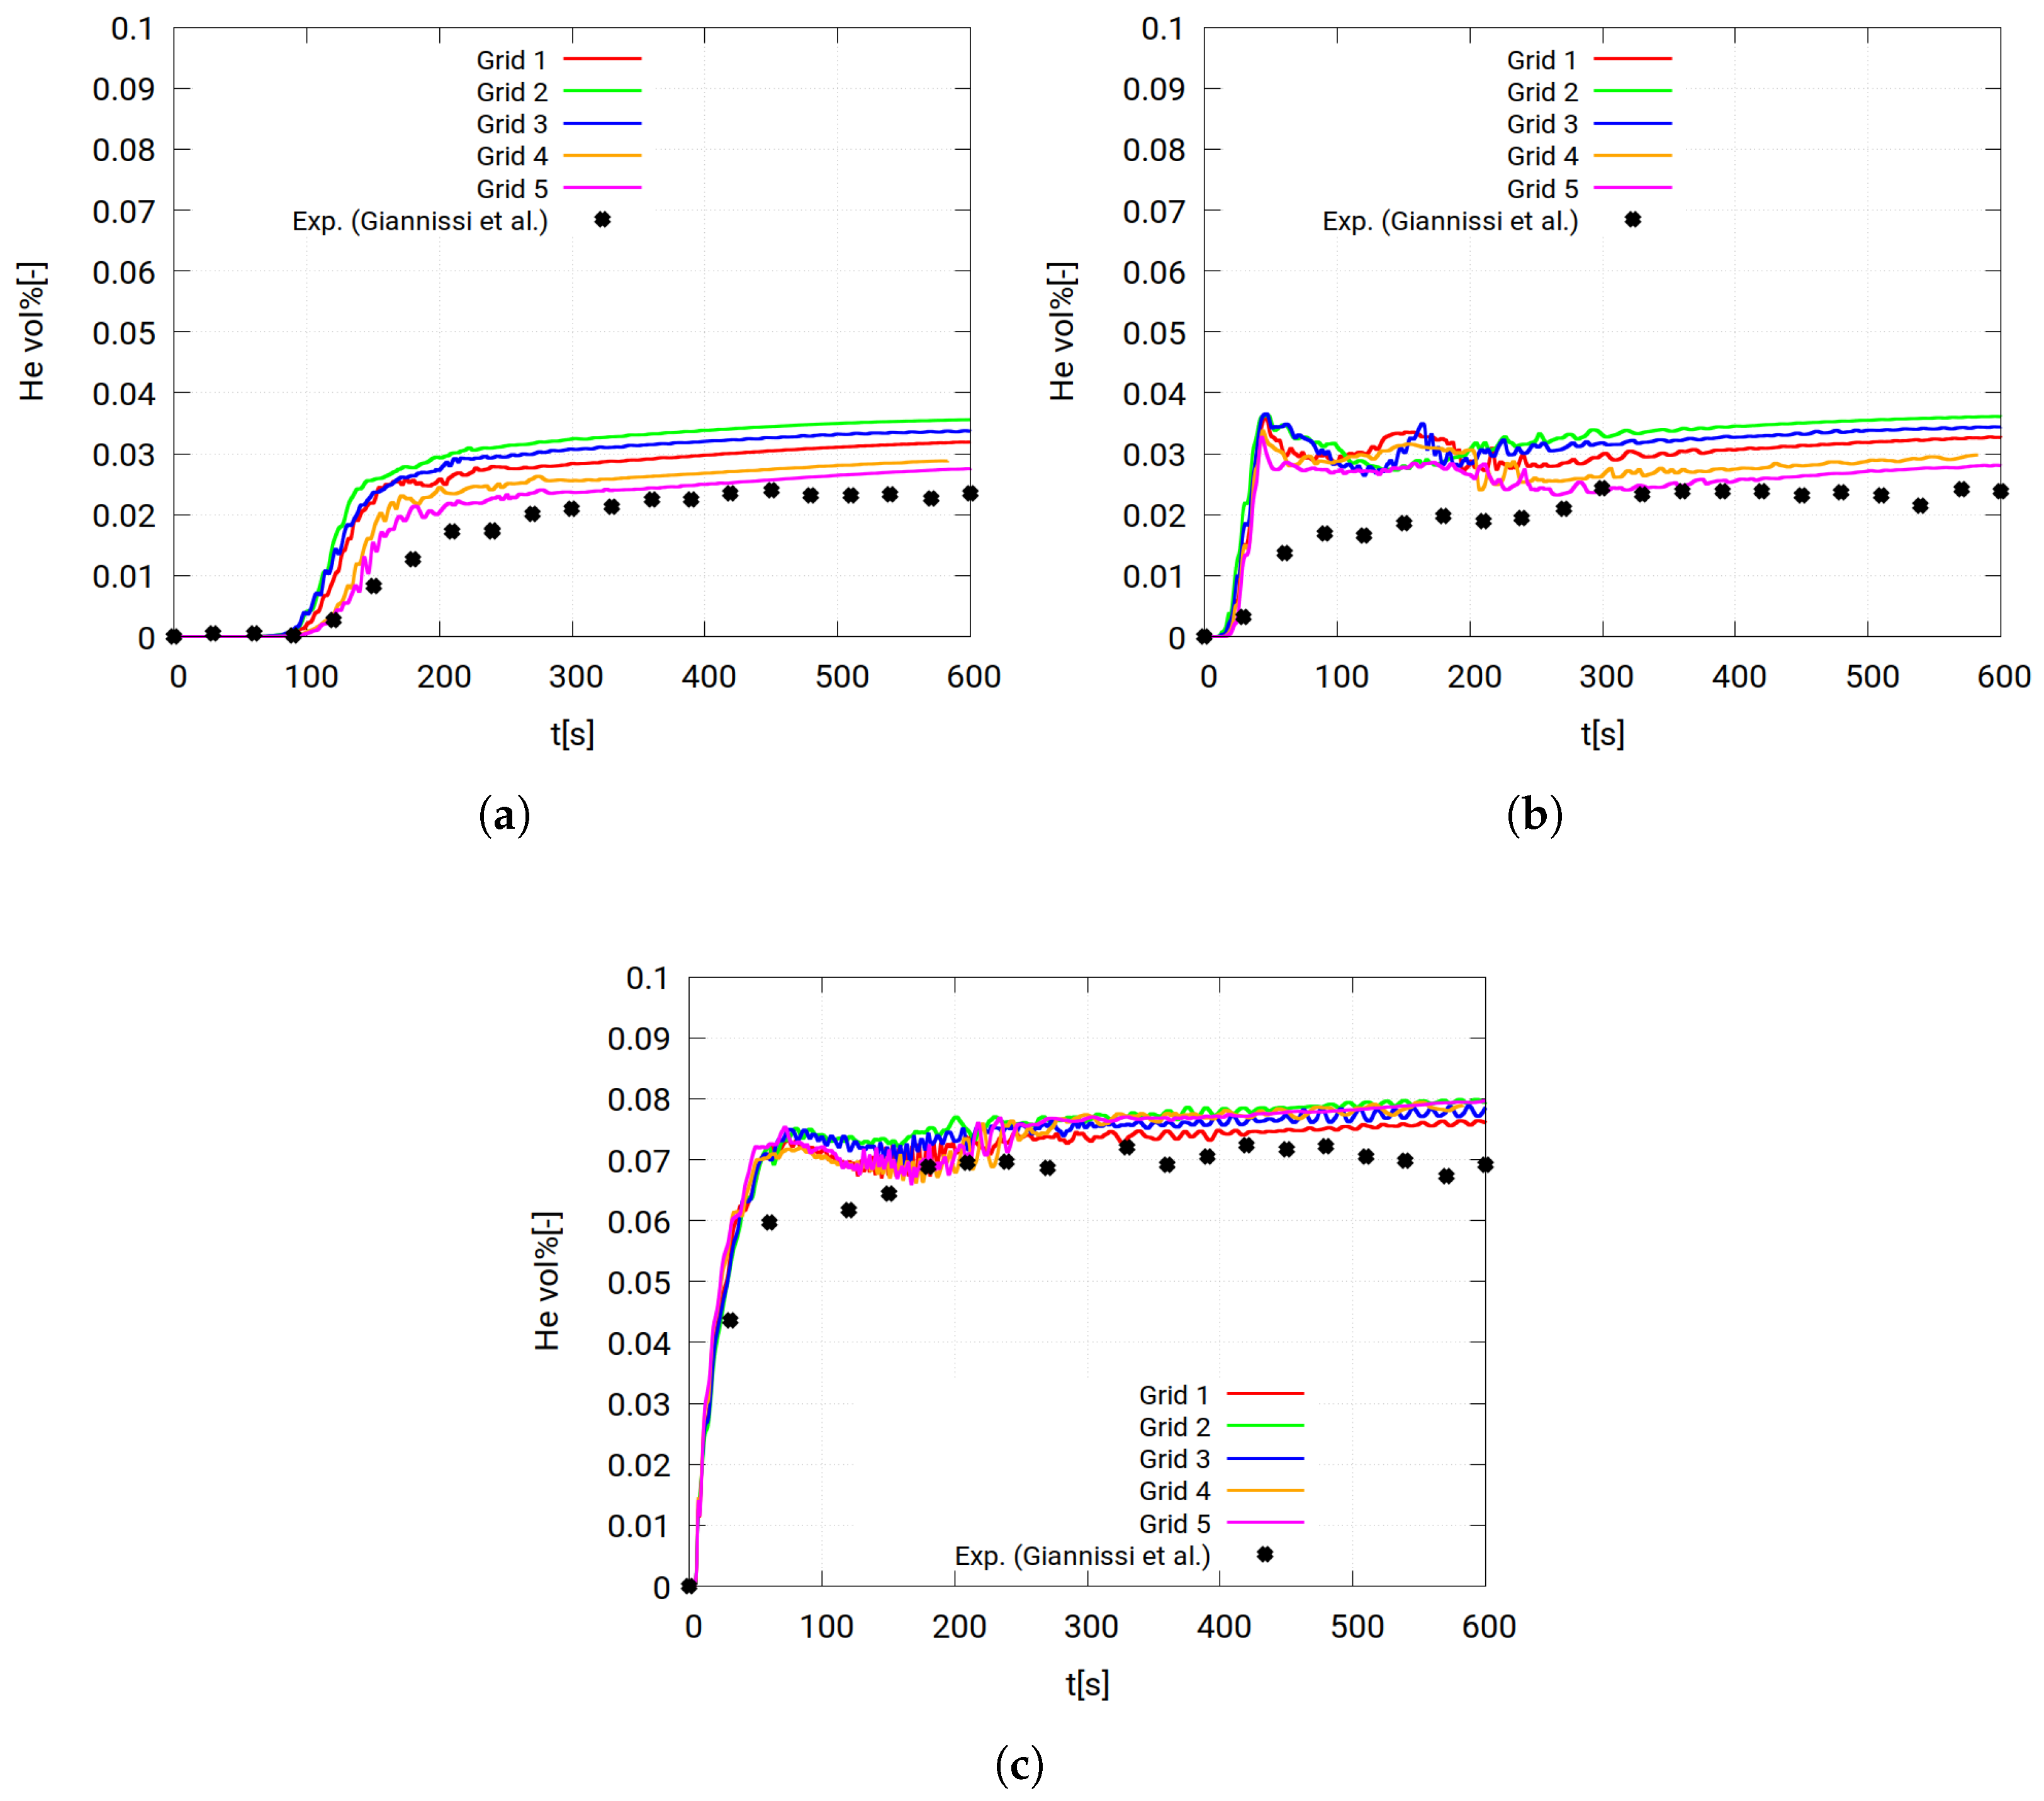
Different simulations were carried out for the domain explained in the former section, but with different grid resolutions. Table 5 shows the different grids and the corresponding resolutions in each direction, and the resulting number of cells in the chamber and in the domain extension. The simulation results of the three sensors for the five different grids are shown in Figure 13, along with the experimental results extracted from the work of Giannissi et al. [13]. The helium concentrations measured by the sensors S1 and S2 were highly affected by the mesh resolution, as can be seen in Figure 13a,b. However, the grid resolution did not have a significant effect on the measurements of sensor S3, as shown in Figure 13c. Therefore, grid no. 5 indicated in Table 5 was used in the following section, as the optimum grid with which to study the helium concentration inside the test chamber.

3.4.4. Simulation Results and Discussion

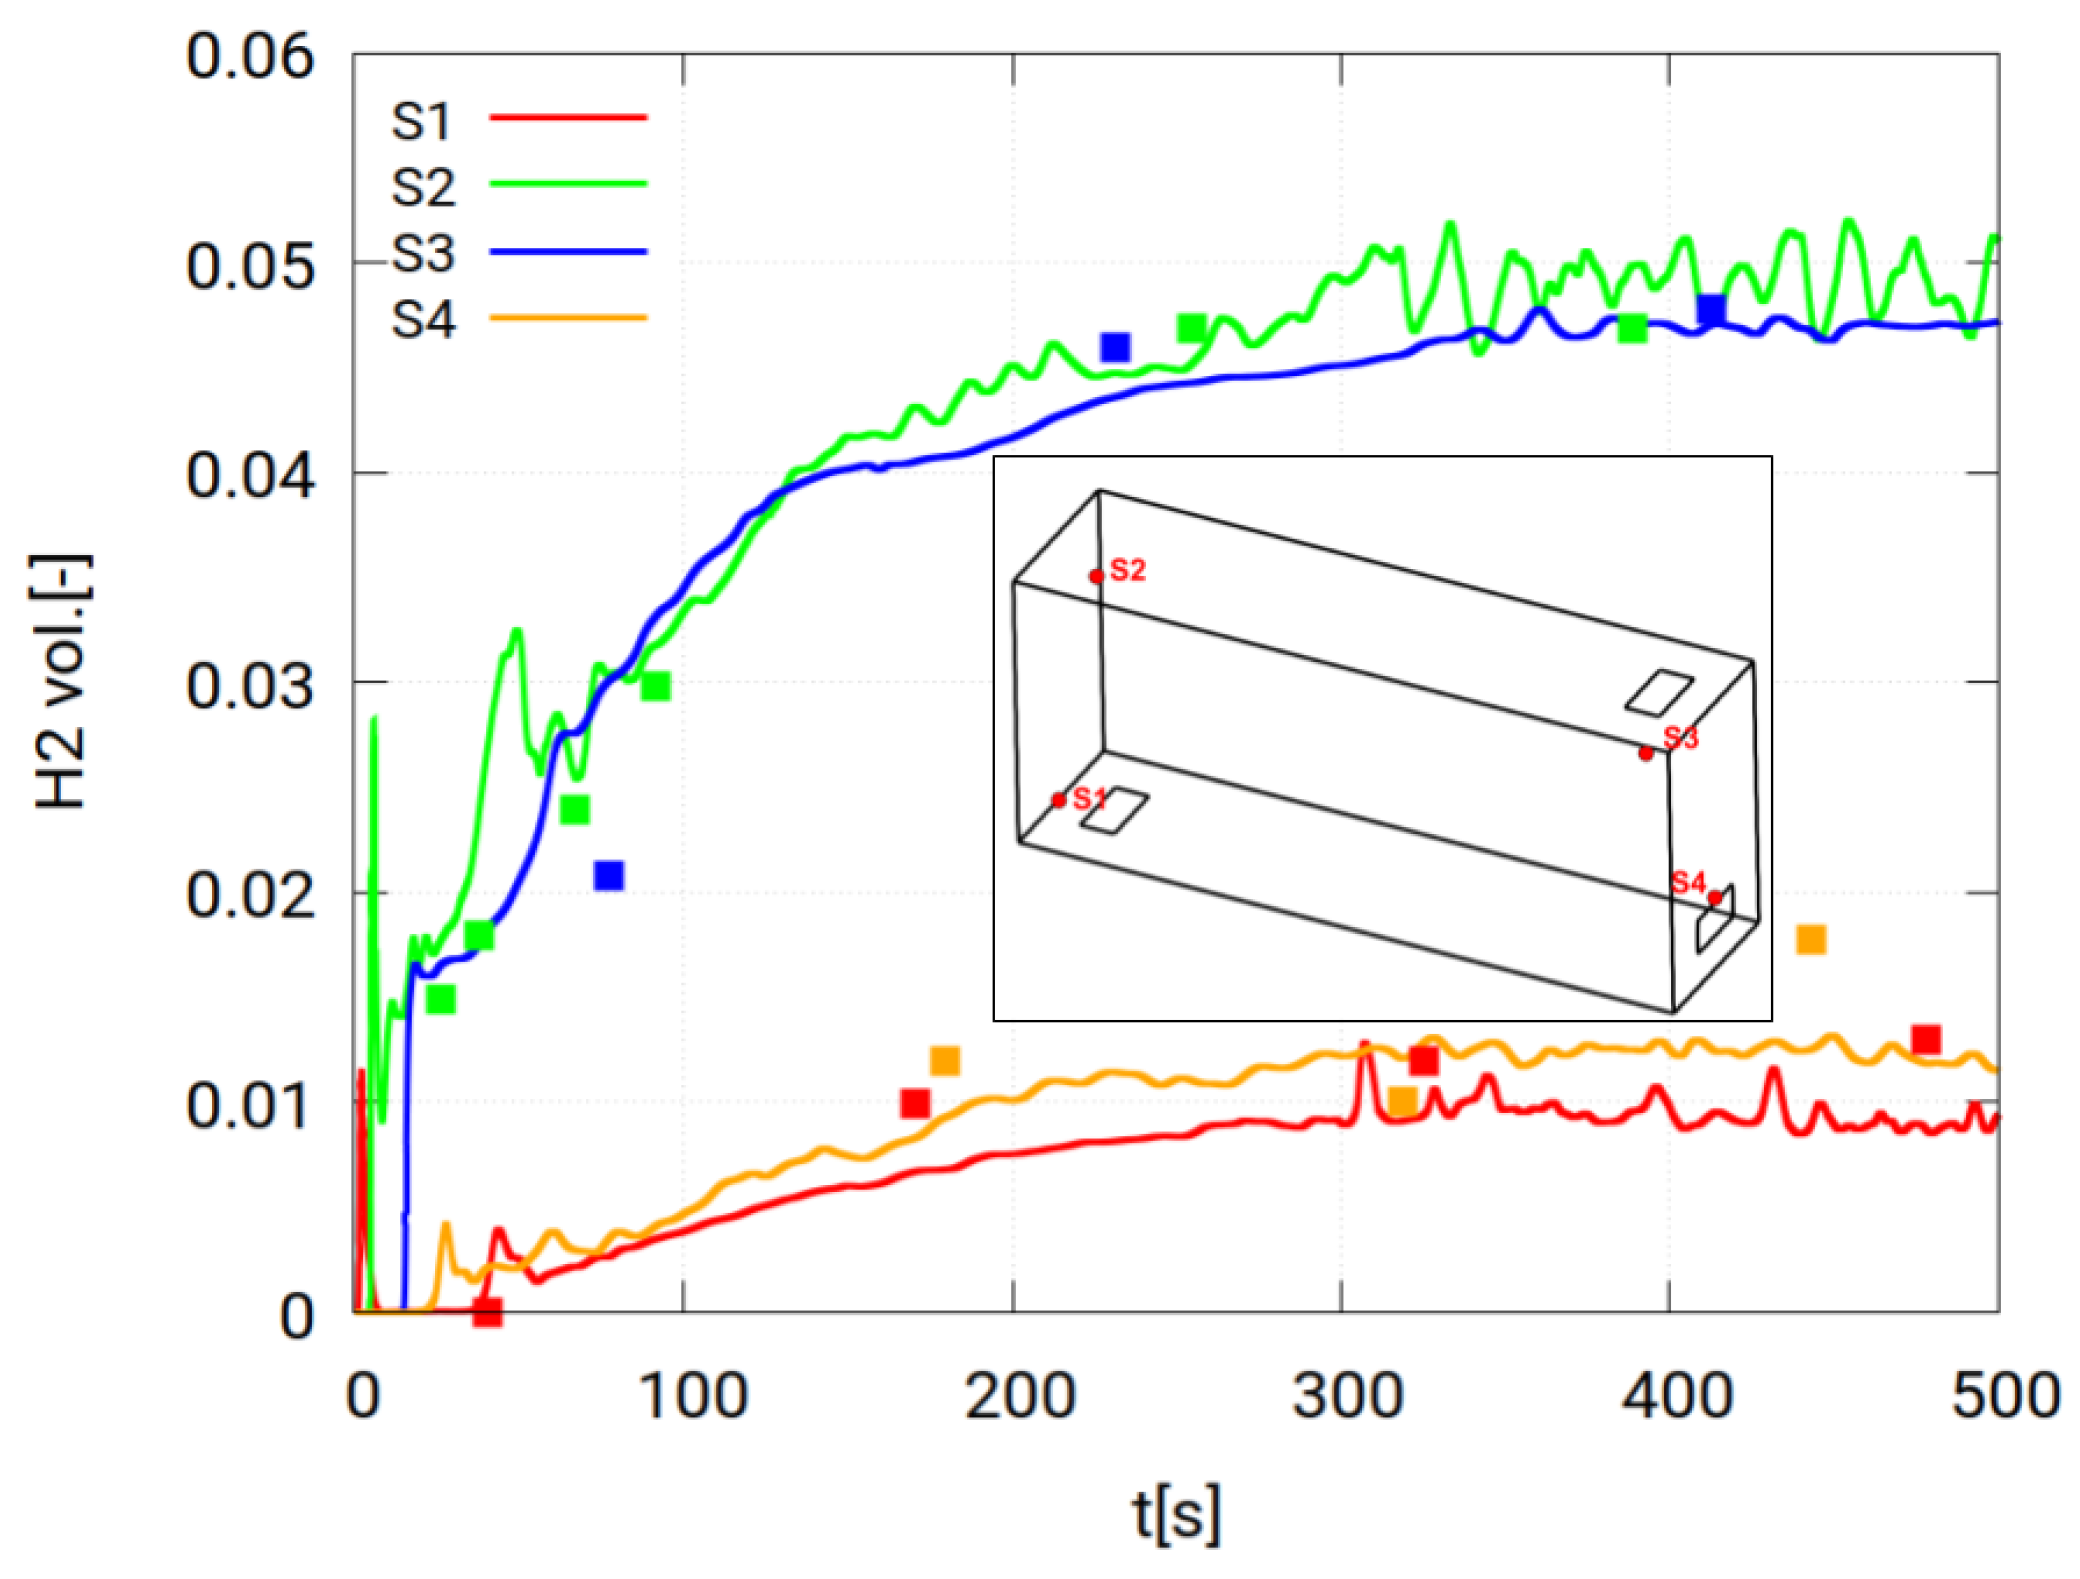
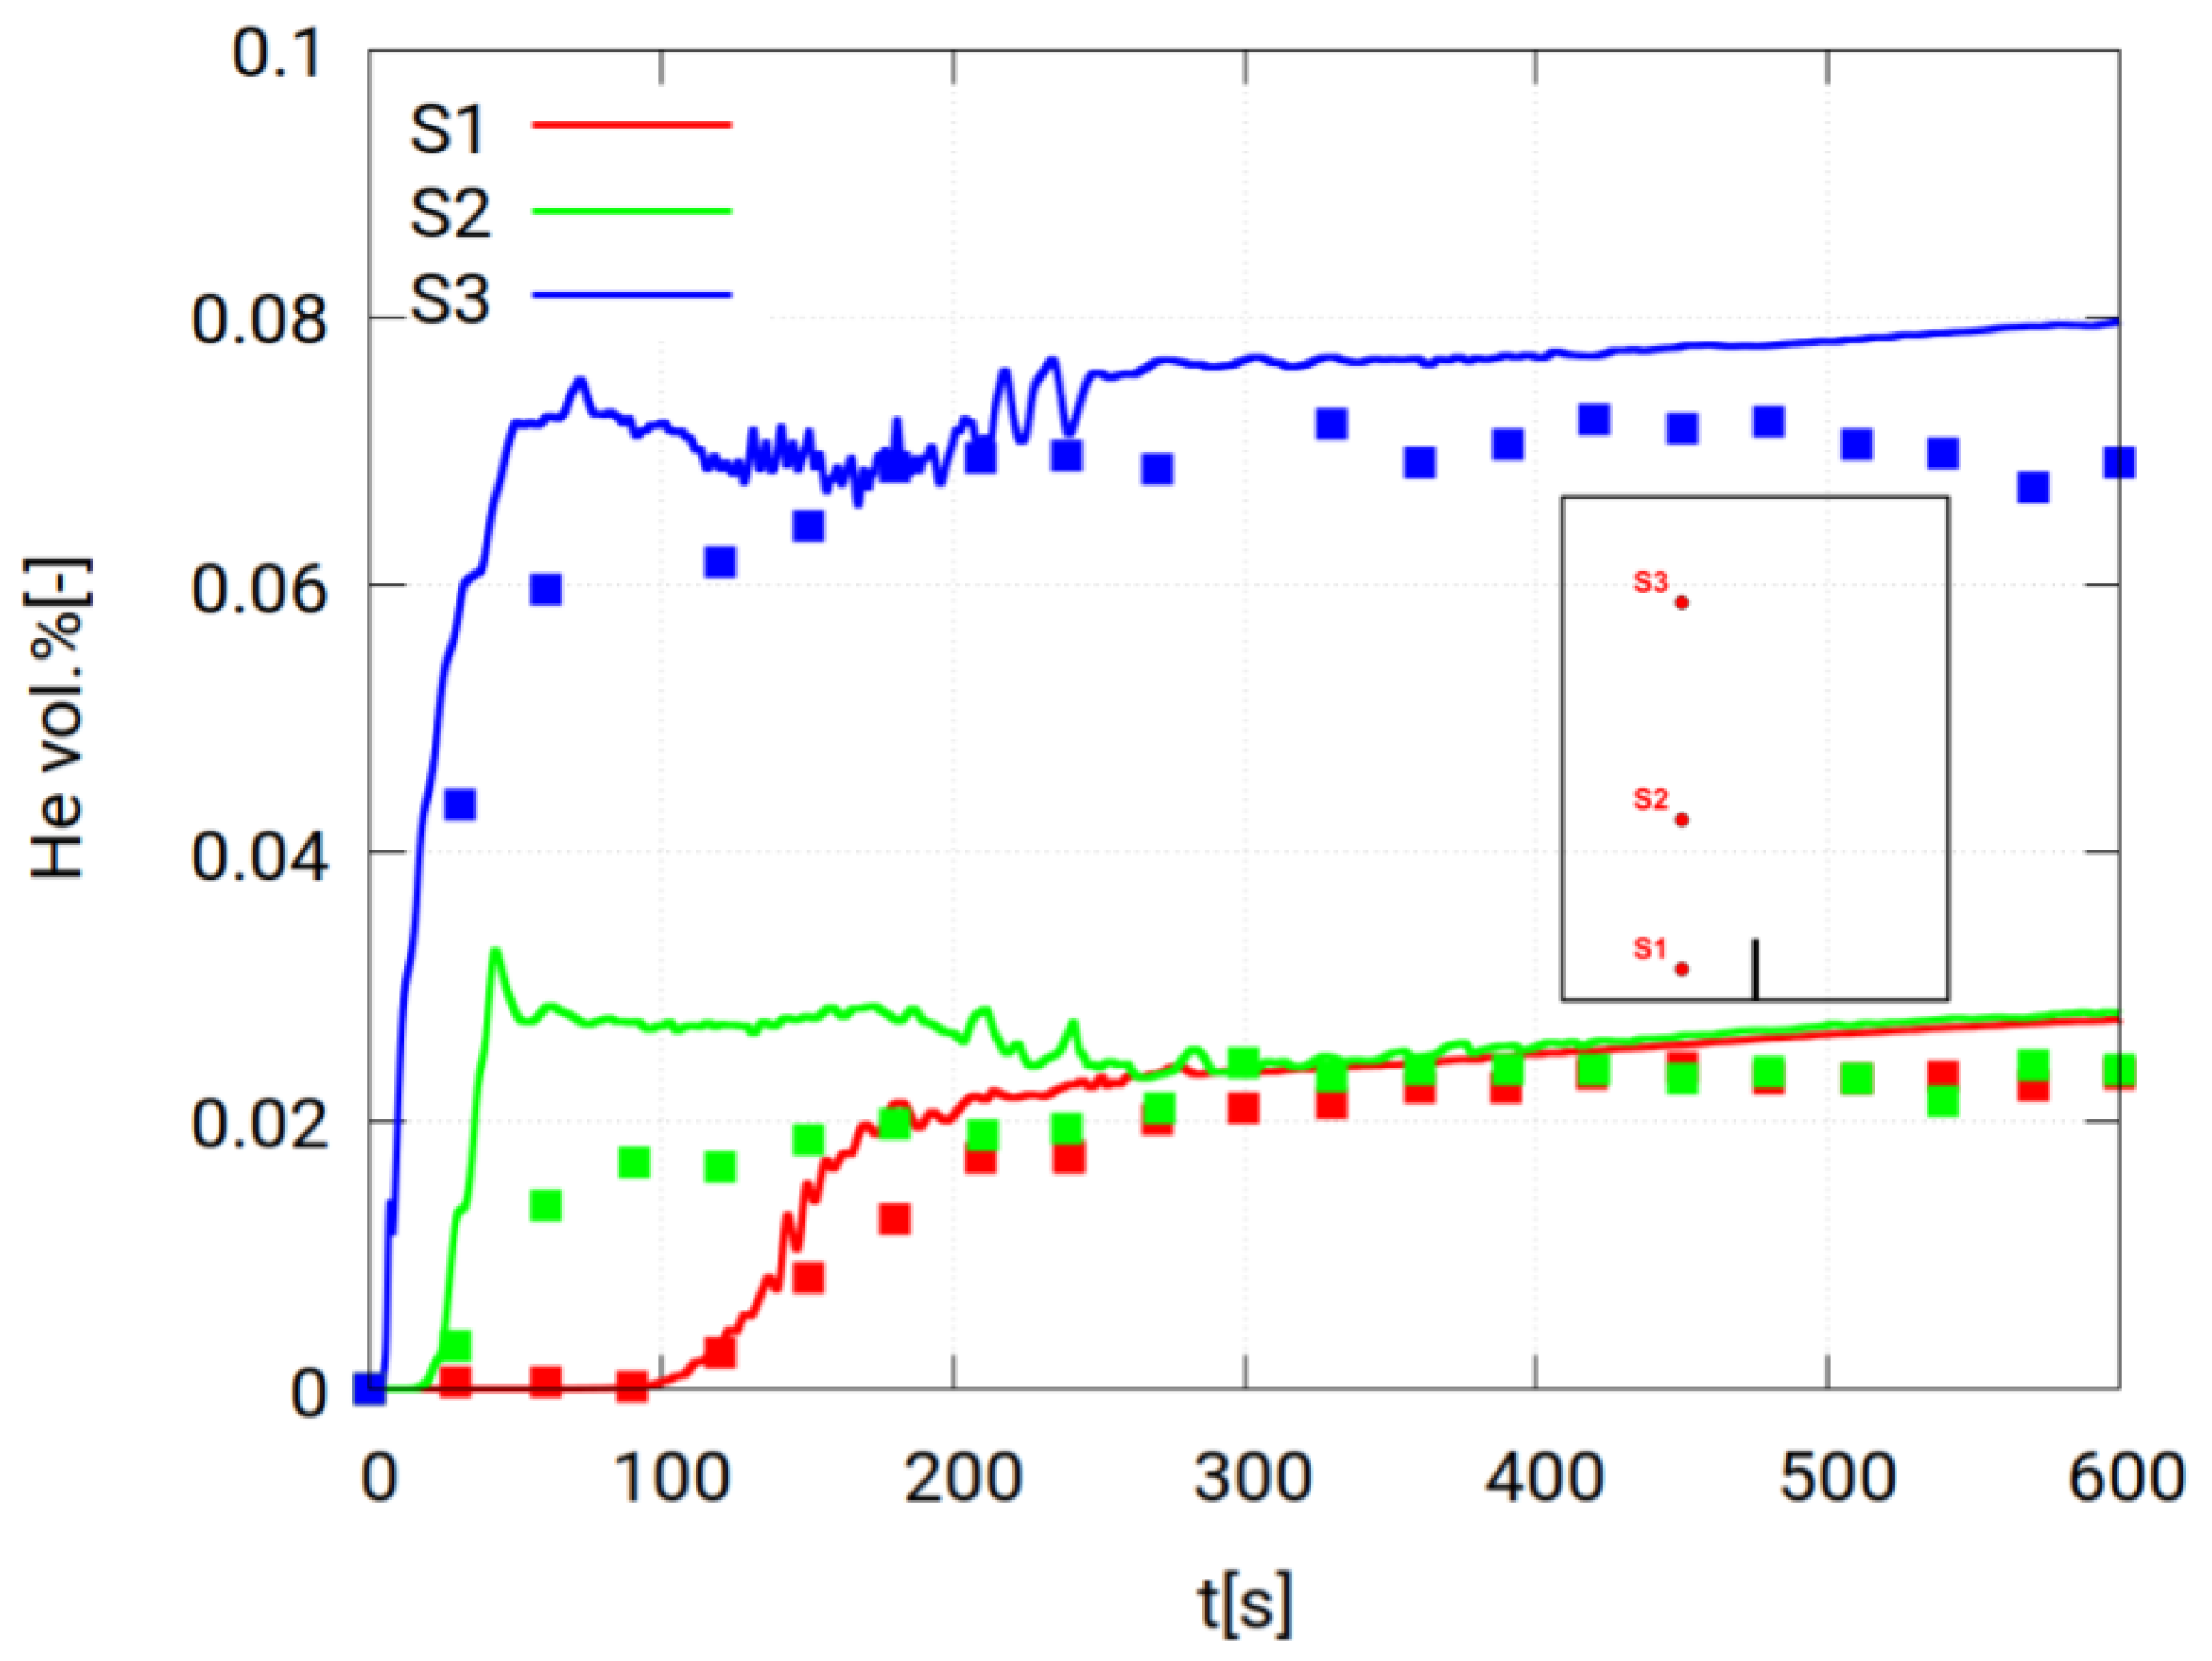
Figure 14 shows a comparison between the simulation results and the experimental measurements of helium concentration during the GAMELAN experiment [13]. This figure shows that for all sensors the simulation results were overestimated during the initial period that lasted about 250 s of the simulation time. However, after this initial period, the agreement of the simulation results with the experimental measurements varied.
For sensor S1, the results agreed reasonably well with the measurements over the remaining simulation period. For sensor S2, the agreement in the initial period showed an overshoot, after which, the concentrations decreased until they matched the experimental measurements around t = 250 s. Both the simulation results and the measurements showed the same concentration levels after the initial period until the end of the simulation time. This may have been the result of the thick helium cloud layer that accumulated in the chamber, which showed the same concentrations at different heights: namely, 0.1 m and 0.58 m above the floor. For the third and highest sensor, S3, the concentrations of helium inside the chamber were overestimated by the simulations, for the same reasons explained in Section 3.3.4, i.e., the high-density gradient that overestimated the buoyancy force on the helium cloud. In general, the simulated concentrations showed acceptable agreement with the measured values. Figure 15a shows the helium cloud accumulation in the test chamber, and Figure 15b shows an isosurface of the 4% helium volumetric concentration.

4. General Discussion

The three validation cases presented in this work have studied the different physical phenomena illustrated in Table 1. In these three cases, the best practice guidelines were considered, to ensure the best possible agreement between the experiment and the simulation results. Despite being in good agreement in most cases, there were still some differences, as can be seen. For the hallway experiment in Section 3.2, sensor 1 (the closest to the inlet), showed the worst agreement, as was the case for the GAMELAN experiment. These deviations may have been due to the underdevelopment of the buoyant plumes inside the domain and because the complex phenomena occurring during air entrainment into the gas flow could not be well captured. Additionally, in the case of a low-velocity inlet, the fluctuation of the buoyant gas at the inlet can lead to fluctuating readings of the sensor, as shown in Figure 5b after 300 s of the start of the helium inlet to the test rig.

5. Conclusions and Future Directions

In this work, the validation of the containmentFOAM package working within OpenFOAM CFD software v9 has been shown. It was necessary to carry out such validation before utilizing this package in any analysis. Different leakage-related phenomena were simulated in this work.
In general, the simulations showed good agreement with the experimental results, and this package should be considered reliable for simulating realistic cases. However, some cases with a fair agreement with the experiments should be considered for further analysis and development, if required. To achieve such good agreement, the computational domain should be extended beyond the test geometry, to represent an open atmosphere and to prevent any nonphysical effects of the boundary conditions. In this case, the external boundary conditions had a minor effect on the gas flow and, hence, correctly represented the open atmosphere. In addition, the simulations could not accurately simulate the gas concentrations in locations adjacent to the source of the buoyant gas. This means that for real case simulations, the concentrations near the leakage source should be interpreted by keeping in mind that these values have relatively higher uncertainty.
The approach that was used in the validation cases illustrated in this work will be used to simulate the leakage of gaseous hydrogen in industrial buildings, to assess the risks and to study the proper ventilation system for avoiding ignition. This approach will also be used to study the responses of hydrogen detectors at different locations, to ensure early detection of leakage and to take the proper action to avoid hydrogen accumulation.

Author Contributions

K.Y. wrote the manuscript; K.Y. and M.K. carried out the simulations; S.K. revised the manuscript; S.K. and E.-A.R. applied for funding and supervised the project. All authors have read and agreed to the published version of the manuscript.

Funding

The Living Lab Energy Campus (LLEC) Power to Gas (PtG++) project is funded by the German Federal Ministry of Education and Research (BMBF) project No.:03SF0573.

Acknowledgments

The simulations were carried out on the JURECA supercomputer at Jülich Supercomputer Center (JSC) under the project cfrun grant No. 26701.

Conflicts of Interest

The authors declare no conflict of interest.

Abbreviations

The following abbreviations are used in this manuscript:
CEAFrench Alternative Energies and Atomic Energy Commission
FLAMEFire Laboratory for Accreditation of Models by Experiments
LFLLower flammability limit
PDEsPartial differential equations
PIVParticle image velocimetry
PLIFPlanar laser-induced fluorescence
SGDHSimple gradient diffusion hypothesis
SSTShear stress tensor
Subscripts and superscripts
ispecies index
krelated to the turbulence kinetic energy
tturbulence value
ω related to the specific rate of turbulence dissipation

References

  1. Kotchourko, A.; Jordan, T. Hydrogen Safety for Energy Applications: Engineering Design, Risk Assessment, and Codes and Standards; Butterworth-Heinemann: Oxford, UK, 2022. [Google Scholar]
  2. Dunn, S. Hydrogen futures: Toward a sustainable energy system. Int. J. Hydrogen Energy 2002, 27, 235–264. [Google Scholar] [CrossRef]
  3. Ehret, O.; Bonhoff, K. Hydrogen as a fuel and energy storage: Success factors for the German Energiewende. Int. J. Hydrogen Energy 2015, 40, 5526–5533. [Google Scholar] [CrossRef]
  4. Swain, M.R.; Grilliot, E.S.; Swain, M.N. Risks Incurred by Hydrogen Escaping from Containers and Conduits; Technical Report; National Renewable Energy Lab. (NREL): Golden, CO, USA, 1998. [Google Scholar]
  5. Matsuura, K.; Kanayama, H.; Tsukikawa, H.; Inoue, M. Numerical simulation of leaking hydrogen dispersion behavior in a partially open space. Int. J. Hydrogen Energy 2008, 33, 240–247, IWHE 2006. [Google Scholar] [CrossRef]
  6. Matsuura, K. Effects of the geometrical configuration of a ventilation system on leaking hydrogen dispersion and accumulation. Int. J. Hydrogen Energy 2009, 34, 9869–9878. [Google Scholar] [CrossRef]
  7. Matsuura, K.; Nakano, M.; Ishimoto, J. Forced ventilation for sensing-based risk mitigation of leaking hydrogen in a partially open space. Int. J. Hydrogen Energy 2010, 35, 4776–4786. [Google Scholar] [CrossRef]
  8. Matsuura, K.; Nakano, M.; Ishimoto, J. Sensing-based risk mitigation control of hydrogen dispersion and accumulation in a partially open space with low-height openings by forced ventilation. Int. J. Hydrogen Energy 2012, 37, 1972–1984. [Google Scholar] [CrossRef]
  9. Hajji, Y.; Bouteraa, M.; Cafsi, A.E.; Belghith, A.; Bournot, P.; Kallel, F. Dispersion and behavior of hydrogen during a leak in a prismatic cavity. Int. J. Hydrogen Energy 2014, 39, 6111–6119. [Google Scholar] [CrossRef]
  10. Hajji, Y.; Jouini, B.; Bouteraa, M.; Elcafsi, A.; Belghith, A.; Bournot, P. Numerical study of hydrogen release accidents in a residential garage. Int. J. Hydrogen Energy 2015, 40, 9747–9759. [Google Scholar] [CrossRef]
  11. Cariteau, B.; Tkatschenko, I. Experimental study of the effects of vent geometry on the dispersion of a buoyant gas in a small enclosure. Int. J. Hydrogen Energy 2013, 38, 8030–8038. [Google Scholar] [CrossRef]
  12. Cariteau, B.; Brinster, J.; Tkatschenko, I. Experiments on the distribution of concentration due to buoyant gas low flow rate release in an enclosure. Int. J. Hydrogen Energy 2011, 36, 2505–2512. [Google Scholar] [CrossRef]
  13. Giannissi, S.; Shentsov, V.; Melideo, D.; Cariteau, B.; Baraldi, D.; Venetsanos, A.; Molkov, V. CFD benchmark on hydrogen release and dispersion in confined, naturally ventilated space with one vent. Int. J. Hydrogen Energy 2015, 40, 2415–2429. [Google Scholar] [CrossRef]
  14. Giannissi, S.; Hoyes, J.; Chernyavskiy, B.; Hooker, P.; Hall, J.; Venetsanos, A.; Molkov, V. CFD benchmark on hydrogen release and dispersion in a ventilated enclosure: Passive ventilation and the role of an external wind. Int. J. Hydrogen Energy 2015, 40, 6465–6477. [Google Scholar] [CrossRef]
  15. Hussein, H.; Brennan, S.; Molkov, V. Dispersion of hydrogen release in a naturally ventilated covered car park. Int. J. Hydrogen Energy 2020, 45, 23882–23897. [Google Scholar] [CrossRef]
  16. Cariteau, B.; Brinster, J.; Studer, E.; Tkatschenko, I.; Joncquet, G. Experimental results on the dispersion of buoyant gas in a full scale garage from a complex source. Int. J. Hydrogen Energy 2011, 36, 2489–2496. [Google Scholar] [CrossRef]
  17. Gupta, S.; Brinster, J.; Studer, E.; Tkatschenko, I. Hydrogen related risks within a private garage: Concentration measurements in a realistic full scale experimental facility. Int. J. Hydrogen Energy 2009, 34, 5902–5911. [Google Scholar] [CrossRef]
  18. Papanikolaou, E.; Venetsanos, A.; Heitsch, M.; Baraldi, D.; Huser, A.; Pujol, J.; Garcia, J.; Markatos, N. HySafe SBEP-V20: Numerical studies of release experiments inside a naturally ventilated residential garage. Int. J. Hydrogen Energy 2010, 35, 4747–4757. [Google Scholar] [CrossRef] [Green Version]
  19. Swain, M.; Grilliot, E.; MN, S. Phase 2: Risks in indoor vehicle storage. Add. Hydrog. Veh. Saf. Rep. 1998, 35–37. [Google Scholar]
  20. Hooker, P.; Hoyes, J.; Hall, J. Accumulation of Hydrogen Released into an Enclosure Fitted with Passive Vents–Experimental Results and Simple Models; Hazards XXIV: Edinburgh, UK, 2014; pp. 7–9. [Google Scholar]
  21. Liang, Z.; McKenna, A.; Clouthier, T.; David, R. Experimental study on accumulation of helium released into a semi-confined enclosure with distributed leaks. Int. J. Hydrogen Energy 2021, 46, 12522–12532. [Google Scholar] [CrossRef]
  22. Venetsanos, A.G.; Papanikolaou, E.; Delichatsios, M.; Garcia, J.; Hansen, O.; Heitsch, M.; Huser, A.; Jahn, W.; Jordan, T.; Lacome, J.M.; et al. An inter-comparison exercise on the capabilities of CFD models to predict the short and long term distribution and mixing of hydrogen in a garage. Int. J. Hydrogen Energy 2009, 34, 5912–5923. [Google Scholar] [CrossRef]
  23. Giannissi, S.G.; Tolias, I.C.; Melideo, D.; Baraldi, D.; Shentsov, V.; Makarov, D.; Molkov, V.; Venetsanos, A.G. On the CFD modelling of hydrogen dispersion at low-Reynolds number release in closed facility. Int. J. Hydrogen Energy 2021, 46, 29745–29761. [Google Scholar] [CrossRef]
  24. Kelm, S.; Kampili, M.; Liu, X.; George, A.; Schumacher, D.; Druska, C.; Struth, S.; Kuhr, A.; Ramacher, L.; Allelein, H.J.; et al. The Tailored CFD Package ‘containmentFOAM’ for Analysis of Containment Atmosphere Mixing, H2/CO Mitigation and Aerosol Transport. Fluids 2021, 6, 100. [Google Scholar] [CrossRef]
  25. Abe, S.; Ishigaki, M.; Sibamoto, Y.; Yonomoto, T. RANS analyses on erosion behavior of density stratification consisted of helium–air mixture gas by a low momentum vertical buoyant jet in the PANDA test facility, the third international benchmark exercise (IBE-3). Nucl. Eng. Des. 2015, 289, 231–239. [Google Scholar] [CrossRef]
  26. Kampili, M.; Kumar, G.V.; Kelm, S.; Prakash, K.A.; Allelein, H.J. Validation of Multicomponent Species Transport Solver-Impact of Buoyancy Turbulence in Erosion of a Stratified Light Gas Layer. 2019. Available online: https://juser.fz-juelich.de/record/865676 (accessed on 10 June 2023).
  27. Menter, F.; Esch, T. Elements of industrial heat transfer predictions. In Proceedings of the 16th Brazilian Congress of Mechanical Engineering (COBEM), Minas Gerais, Brazil, 26–30 November 2001; Volume 109, p. 650. [Google Scholar]
  28. Versteeg, H.K.; Malalasekera, W. An Introduction to Computational Fluid Dynamics: The Finite Volume Method; Pearson Education: London, UK, 2007. [Google Scholar]
  29. O’hern, T.; Weckman, E.; Gerhart, A.; Tieszen, S.; Schefer, R. Experimental study of a turbulent buoyant helium plume. J. Fluid Mech. 2005, 544, 143–171. [Google Scholar] [CrossRef]
  30. Qian, J.Y.; Li, X.J.; Gao, Z.X.; Jin, Z.J. A numerical study of hydrogen leakage and diffusion in a hydrogen refueling station. Int. J. Hydrogen Energy 2020, 45, 14428–14439. [Google Scholar] [CrossRef]
  31. Des Jardin, P.E.; O’Hern, T.J.; Tieszen, S.R. Large eddy simulation and experimental measurements of the near-field of a large turbulent helium plume. Phys. Fluids 2004, 16, 1866–1883. [Google Scholar] [CrossRef]
  32. Maragkos, G.; Rauwoens, P.; Wang, Y.; Merci, B. Large eddy simulations of the flow in the near-field region of a turbulent buoyant helium plume. Flow Turbul. Combust. 2013, 90, 511–543. [Google Scholar] [CrossRef]
  33. Maragkos, G.; Funk, E.; Merci, B. Analysis of adaptive mesh refinement in a turbulent buoyant helium plume. Int. J. Numer. Methods Fluids 2022, 94, 1398–1415. [Google Scholar] [CrossRef]
  34. Chung, W.; Devaud, C. Buoyancy-corrected k–ε models and large eddy simulation applied to a large axisymmetric helium plume. Int. J. Numer. Methods Fluids 2008, 58, 57–89. [Google Scholar] [CrossRef]
  35. Chung, W. A CFD Investigation of Turbulent Buoyant Helium Plumes. Master’s Thesis, University of Waterloo, Waterloo, ON, Canada, 2007. [Google Scholar]
  36. Juretić, F. cfMesh User Guide (v1.1); Creative Fields, Ltd.: Zagreb, Croatia, 2015. [Google Scholar]
  37. Giannissi, S.; Venetsanos, A.G. HyFOAM Tutorial, Hydrogen/Helium Dispersion in Vented Enclosures. e-Laboratory.
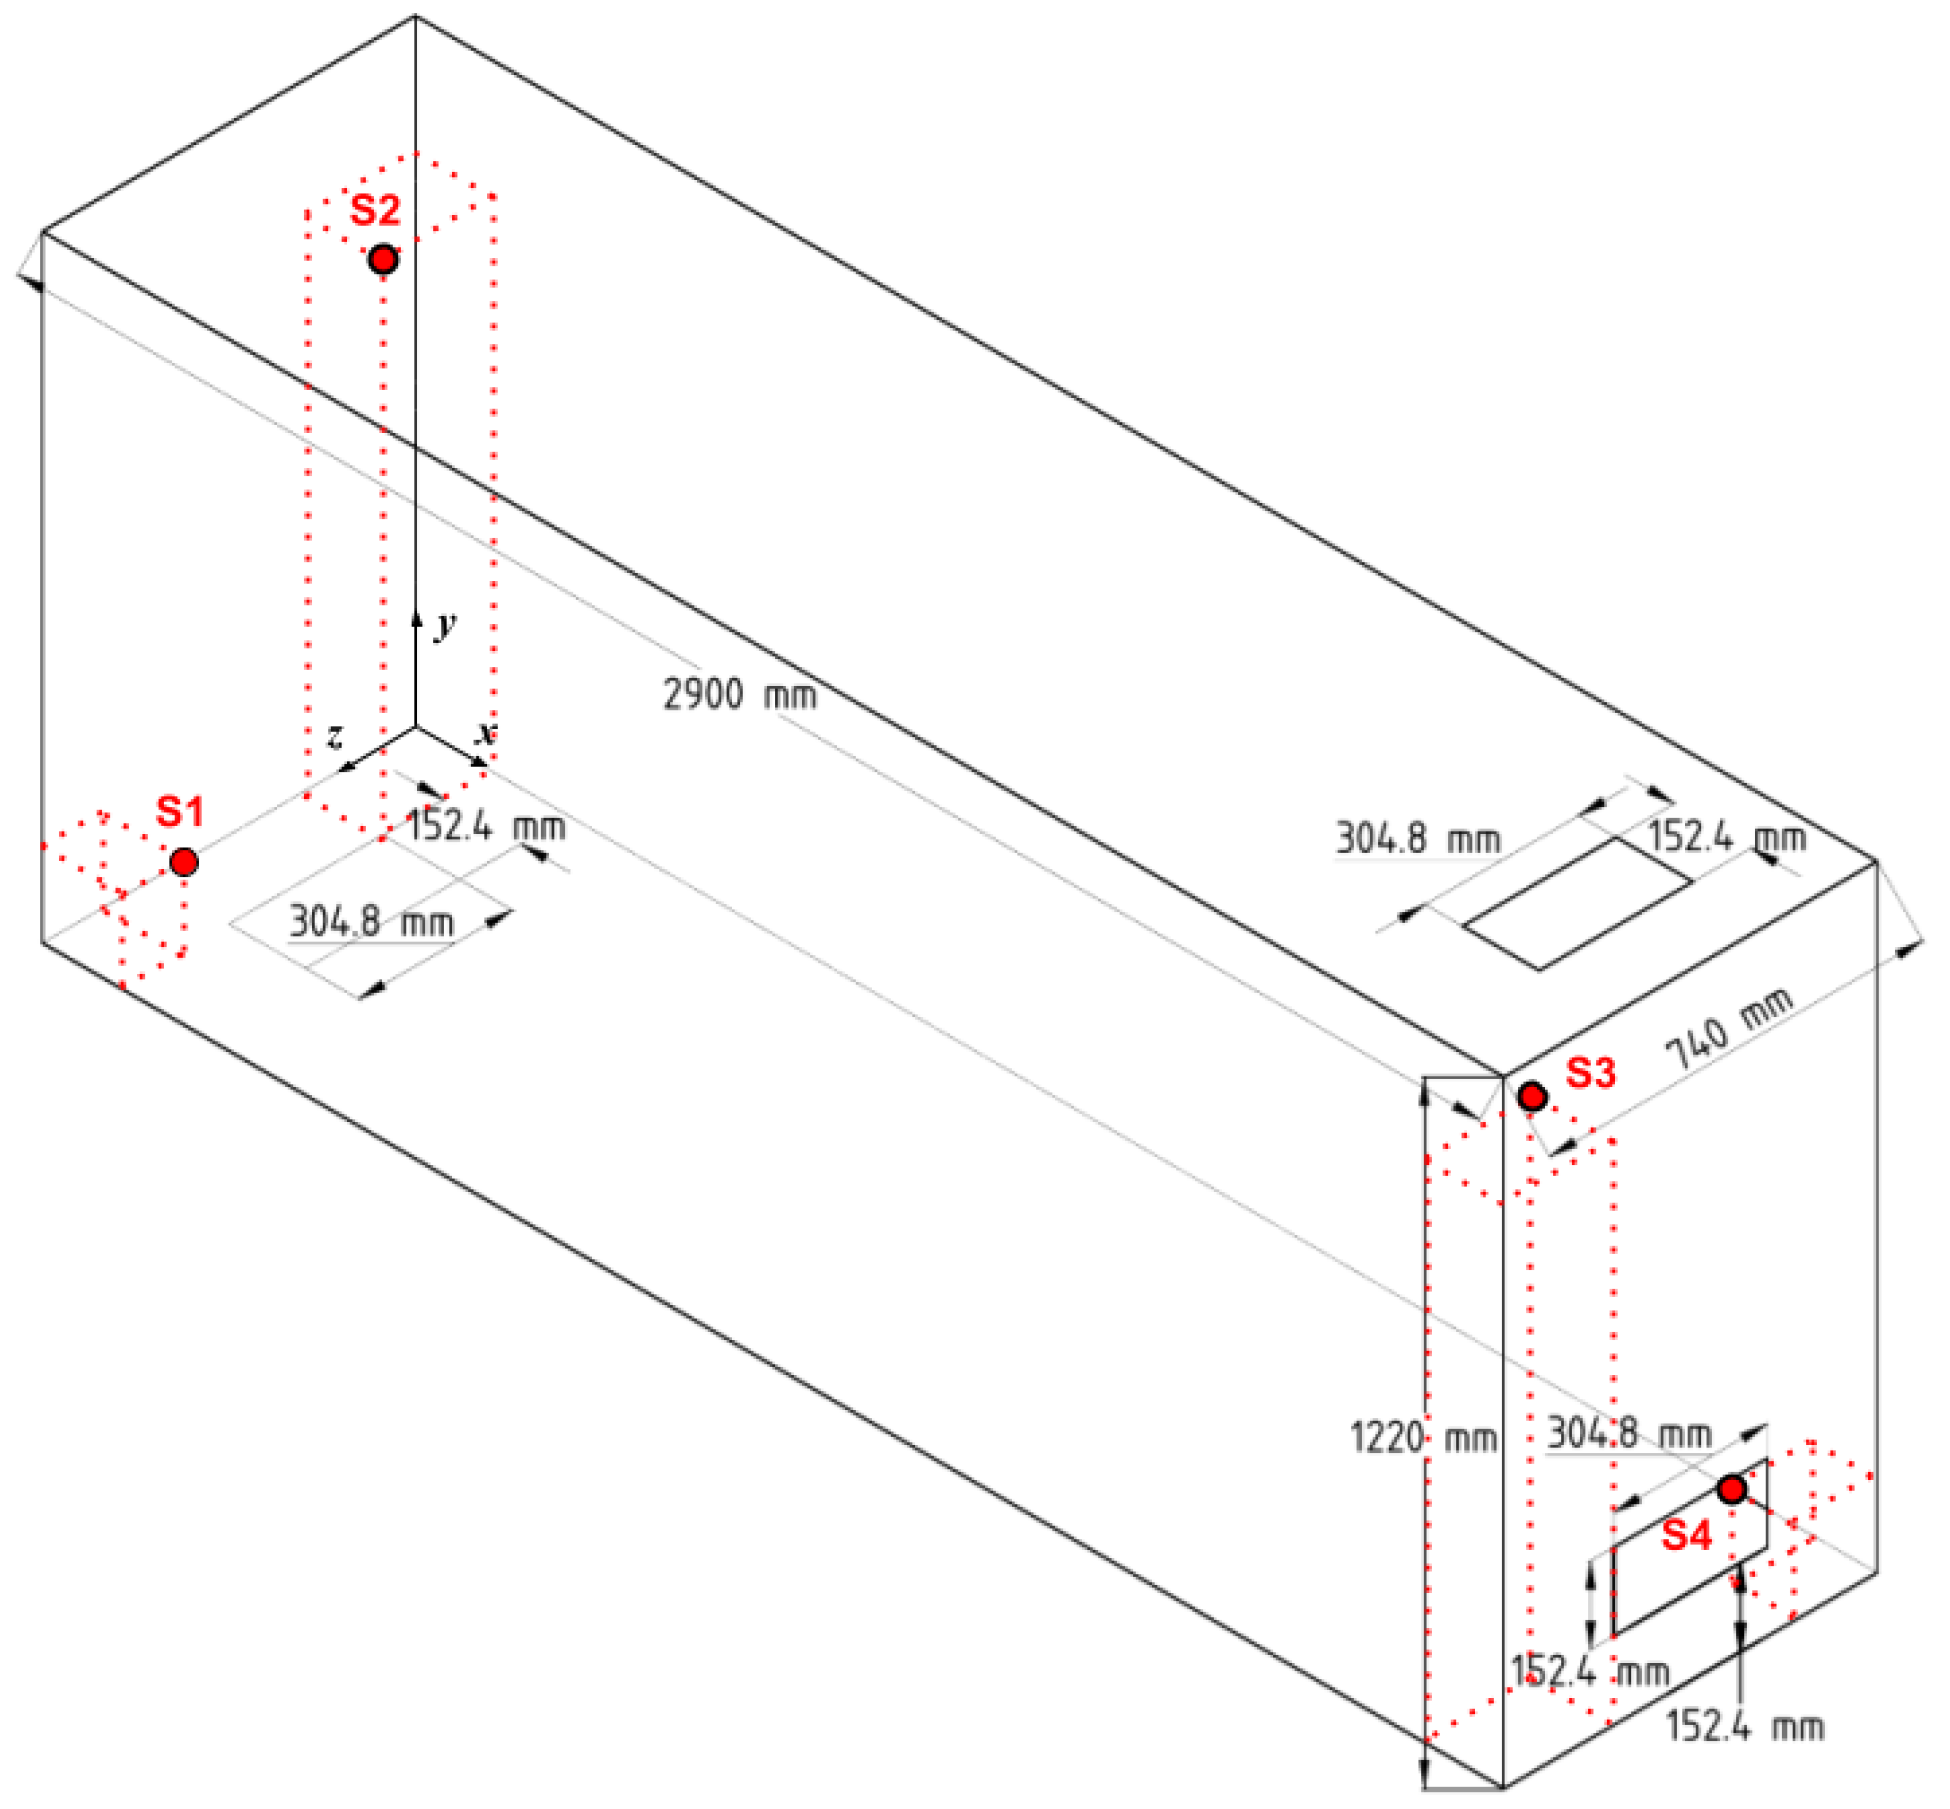
Figure 1. Experimental setup of the hallway experiment (Swain et al. [4]).
Energies 16 05993 g001
Figure 2. Outline of the numerical domain used in the validation.
Energies 16 05993 g002
Figure 3. Grid generated for the hallway and its refinement near the walls.
Energies 16 05993 g003
Figure 4. Hydrogen volumetric concentrations of the sensors (a) S1, (b) S2, (c) S3, and (d) S4 for the grids indicated in Table 3.
Energies 16 05993 g004
Figure 5. (a) Streamlines colored according to hydrogen concentration; (b) hydrogen concentration in the hallway.
Energies 16 05993 g005
Figure 6. Hydrogen volumetric concentration results. The contentious lines represent simulations, and the squares represent measurements from Swain et al. [4].
Energies 16 05993 g006
Figure 7. (a) Sectional front; (b) plan views of the FLAME experiment test chamber (Chung [35]).
Energies 16 05993 g007
Figure 8. Sectional view of the unstructured grid used for the analysis of the FLAME experiment.
Energies 16 05993 g008
Figure 9. Helium volume fraction of the sensors (a) S1, (b) S2, and (c) S3 for the grids indicated in Table 4.
Energies 16 05993 g009
Figure 10. Comparison of the experimental and simulation results of (a) helium volume fraction (He vol.), (b) the axial flow velocity (W), and (c) the radial flow velocity (U) over three lines at three different heights. Shaded areas with light colors represent the error areas of the measurements.
Energies 16 05993 g010
Figure 11. The GAMELAN experiment test chamber (Cariteau and Tkatschenko [11]), with the selected vent and inlet pipe sizes.
Energies 16 05993 g011
Figure 12. Outline of the numerical domain of the GAMELAN experiment (Giannissi and Venetsanos [37]).
Energies 16 05993 g012
Figure 13. Helium volumetric concentrations of the sensors (a) S1, (b) S2, and (c) S3 for the grids indicated in Table 5 [13].
Energies 16 05993 g013
Figure 14. Helium concentrations using the selected grid of the GAMELAN experiment with a schematic of locations of the sensors’ locations.
Energies 16 05993 g014
Figure 15. (a) Stratification and (b) 4% isosurface of helium volumetric concentration in the GAMELAN experiment.
Energies 16 05993 g015
Table 1. Validation matrix of the different physical phenomena (check marks indicate the occurance of the physical phenomenon).
PhenomenonHallway LeakageFLAMEGAMELAN
Buoyancy
Stratification
Buoyancy-driven
Momentum-driven
Jet-to-plume trans.
Data
Concentrationspointprofilepoint
Flowpointpointpoint
Table 2. Sensors locations in the hallway experiment. See Figure 1.
Sensorx [m]y [m]z [m]
S10.1520.1520.596
S20.1521.0090.219
S32.6761.0090.596
S42.6760.1520.219
Table 3. Grid resolution and the total number of cells for each grid in the hallway grid independence study.
Grid No.No. of Cells in the HallwayTotal No. of
Cells
Inlet Patch
Cells
xyz
1942224130,53280
21252832345,560120
31853645473,340180
41853645790,100288
521560451,134,500540
Table 4. Total number of cells for each grid in the hallway grid independence study.
Grid No.Number of CellsInlet Patch Cells
1709,316292
2973,212344
31,623,918608
42,080,594756
Table 5. Grid resolution and the total number of cells for each grid in the GAMELAN grid independence study.
Grid No.No. of Cells in the ChamberTotal Cells
in Domain
Inlet Patch
Cells
xyzTotal
1572462116,726324,03420
2803574193,116439,90032
31014791401,139703,24166
412859110773,2801,132,044112
5152711261,264,1601,692,660170
Disclaimer/Publisher’s Note: The statements, opinions and data contained in all publications are solely those of the individual author(s) and contributor(s) and not of MDPI and/or the editor(s). MDPI and/or the editor(s) disclaim responsibility for any injury to people or property resulting from any ideas, methods, instructions or products referred to in the content.