Article

Study on the Prediction of Low-Index Coal and Gas Outburst Based on PSO-SVM

1
State Key Laboratory of Coal Mine Disaster Dynamics and Control, Chongqing University, Chongqing 400044, China
2
School of Resources and Safety Engineering, Chongqing University, Chongqing 400044, China
*
Authors to whom correspondence should be addressed.
Energies 2023, 16(16), 5990; https://doi.org/10.3390/en16165990
Submission received: 17 July 2023 / Revised: 9 August 2023 / Accepted: 15 August 2023 / Published: 15 August 2023
(This article belongs to the Section B: Energy and Environment)

Abstract

:
Low-index coal and gas outburst (LI-CGO) is difficult to predict, which seriously threatens the efficient mining of coal. To predict the LI-CGO, the Support Vector Machine (SVM) algorithm was used in this study. The Particle Swarm Optimization (PSO) algorithm was used to optimize the parameters of the SVM algorithm. The results show that based on the training sets and test set in this study, the prediction accuracy of SVM is higher than that of Back Propagation Neural Network and Distance Discriminant Analysis. The prediction accuracy of the SVM model trained by the training set T2 with LI-CGO cases is higher than that of the SVM model trained by the training set T1 without LI-CGO cases. The prediction accuracy gets better when the SVM model is trained by the training set T3, made by adding the data of the other two coal mines (EH and SH) to the training set T2, that only contains the data of XP and PJ. Furthermore, the PSO-SVM model achieves a better predictive effect than the SVM model, with an accuracy rate of 90%. The research results can provide a method reference for the prediction of LI-CGO.

1. Introduction

Accurate prediction of coal and gas outburst (CGO) disasters can avoid casualties and property losses in coal mining [1,2,3,4]. In order to prevent the occurrence of CGO disasters, the 2019 version of the “Coal and Gas Outburst Prevention Rules” in China stipulates that when the coal seam gas pressure is ≥0.74 MPa, the coal firmness coefficient is ≤0.5, the initial gas emission speed is ≥10 mmHg, and the coal failure type is II, III or IV, it should be identified as a coal seam with a risk of CGO [5]. However, due to the complex geological conditions of the coal storage environment in China, CGO disasters sometimes also occur when the sizes of some indicators are lower than the prescribed risk thresholds. For example, a CGO disaster occurred when the gas pressure was lower than 0.74 MPa [6]. This kind of CGO disaster is generally referred to as the low-index coal and gas outburst (LI-CGO) [7,8]. Therefore, in order to obtain a more accurate critical size of the prediction index to predict LI-CGO, scholars have carried out research on sensitive indexes and critical values for LI-CGO prediction from different coal seams [7,9,10]. However, this is difficult not only because it needs a large number of field tests but also because different coal geological conditions have different sensitive indexes and critical values [11].
Predicting the CGO based on measurements of different prediction indexes is a study of categorizing targets based on feature parameters, in which different machine learning methods have been used in the existing studies [12]. Zhang et al. studied the prediction of the self-ignition tendency of coal by Multilayer Perceptron (MLP) and Random Forest (RF) [13]. In order to extract the signals of rock burst from the micro-seismic signals, Song et al. proposed a method to separate blasting signals from the micro-seismic signals based on the Convolutional Neural Network (CNN) [14]. Ruano et al. built a classifier based on the Support Vector Machine (SVM) to distinguish segments of seismic records containing signals caused by different situations [15].
In terms of the prediction of CGO, some scholars tried to use different machine learning algorithms to explore the complex nonlinear relationship between various influencing factors and CGO [16,17]. The purpose was to dig out the relationship between gas pressure, buried depth, and other parameters and CGO from previous cases, to find an optimal method to judge the category of new samples, and to efficiently predict CGO. For example, based on the Fisher Discriminant Model, Li et al. used the three indexes of gas pressure, initial gas emission velocity, and buried depth as discriminant factors to predict new CGO cases [18]. Wang studied the prediction of CGO by the method of Distance Discriminant Analysis (DDA) based on the five indexes of initial gas emission velocity, coal firmness coefficient, gas pressure, coal failure type, and buried depth [19]. Furthermore, some other algorithms, such as the Back Propagation Neural Network (BPNN) [20], Gray Relational Analysis [21], C-C chaotic time series [22], Adaptive Wavelet Networks [23], and Extreme Learning Machine [24], were also used in the prediction study of CGO.
In summary, it can be seen that previous researchers have applied different algorithms to predict CGO. However, existing research has the following two deficiencies. The first is that there are a few reports on the prediction of LI-CGO based on machine learning methods. The second is that the samples in most studies always come from only one coal mine, so the data were from a single source [25]. This is difficult to reflect the characteristics of CGO disasters caused by different dominant factors, which limits the prediction accuracy of CGO, especially LI-CGO.
To deeply explore the mapping relationship between gas, crustal stress, coal physical properties, and CGO disasters and realize the accurate prediction of LI-CGO, this study collected disaster data from four coal mines. According to the five indexes of gas pressure, initial gas emission velocity, buried depth, coal failure type, and coal firmness coefficient, the characteristics of CGO cases were learned by the SVM algorithm that is good at dealing with nonlinearity, non-stationarity, and high-dimensionality data. The prediction results of SVM, BPNN, and DDA models were compared. Then, the Particle Swarm Optimization (PSO) algorithm was used to optimize the parameters of SVM to build a PSO-SVM model with strong generalization to realize the accurate prediction of LI-CGO. The research results can provide a reference method for the prediction of LI-CGO.

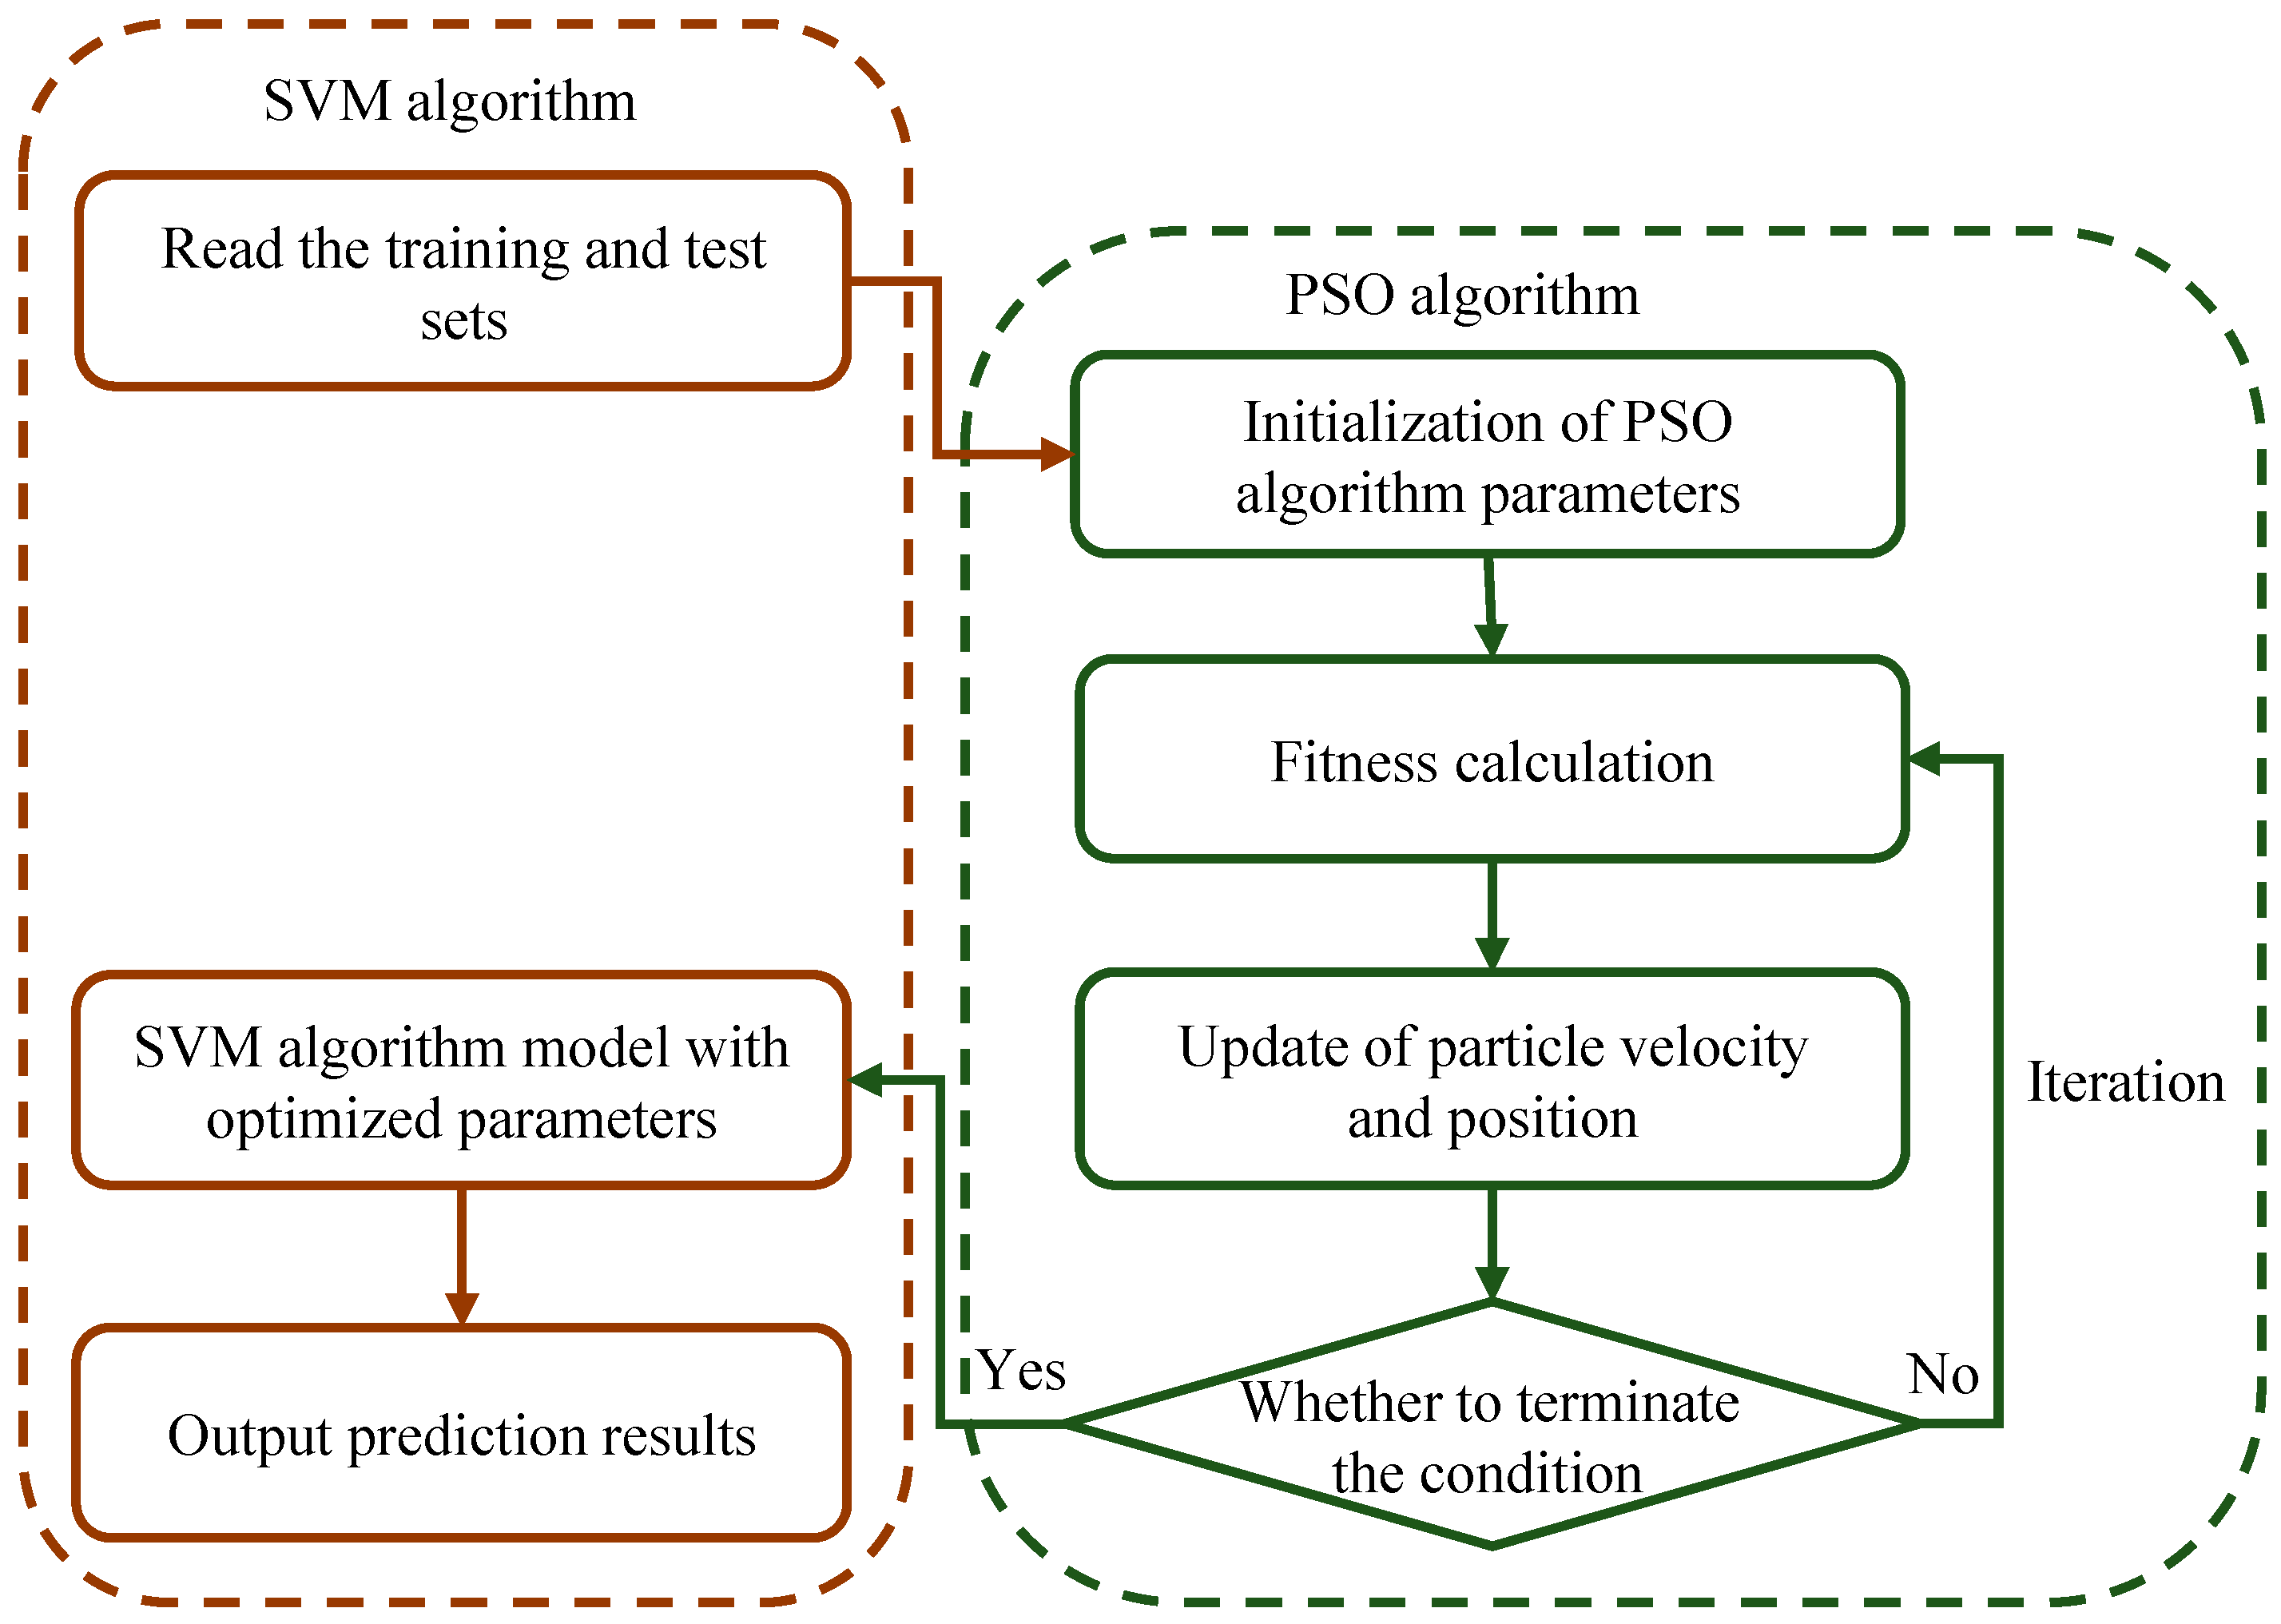
2. Establishment of PSO-SVM Model

2.1. Algorithm Theory

2.1.1. SVM Algorithm

SVM is a machine learning algorithm based on statistical learning theory and the principle of structural risk minimization. Its basic idea is to find out the nonlinear mapping relationship between input and output by using the nonlinear transformation defined by the kernel function to transform the input into a high-dimensional space. It shows strong theoretical performance, generalization ability, and advantages in analyzing data with few-shot, non-stationary, nonlinear, and high-dimensional characteristics [26,27]. It overcomes the shortcomings of neural networks that require large sample data, is easy to over-learn, and relies too much on experience [28].
SVM achieves optimal classification by solving the separation hyperplane that can correctly divide the training data and has the largest geometric interval. The basic principle of SVM is shown in Figure 1.
Assuming a linearly separable training set, T is as follows in Equation (1).
T = ( x 1 , y 1 ) , ( x 2 , y 2 ) , , ( x n , y n )
where xiRn, yi ∈ {+1, −1}, i = 1, 2, …, n. n is the number of samples. xi is the ith feature vector (input), and yi is the class label (output).
Then the separating hyperplane can be expressed by Equation (2).
w T x + b = 0
where wT and b, respectively, control the direction and position of the hyperplane.
The classification interval can be expressed by Equation (3).
d = w T x + b w
Therefore, maximizing the classification interval is equivalent to solving a convex quadratic programming with inequality constraints. Its mathematical expression is shown in Equation (4).
m i n 1 2 w 2 + C i n ξ i s . t .   y i w φ x i + b 1 ξ i ,   ξ i 0 ,   i = 1 ,   2 ,   ,   n
where C is the penalty coefficient, indicating the degree of punishment for errors. The larger the value of C, the greater the penalty. ξ i is the slack variable. ξ i = max (0, 1 − yi (wTxi + b)). s.t. is the constraint condition.
The dual problem of the Lagrange function of Equation (4) can be expressed by Equation (5).
m a x i = 1 n α i 1 2 i = 1 n j = 1 n α i α j y i y j K x i · x j s . t .   i = 1 n α i y i = 0 ; C α i 0 , i = 1 , 2 , , k
where αi and αj both are Lagrange multipliers. αi ≥ 0, αj ≥ 0. K(xi·xj) is calculated by Equation (6).
K ( x i · x j ) = e x p x i x j 2 2 g 2
where g is the kernel parameter.
The dual problem has only a unique solution, which is the optimal classification function, as shown in Equation (7).
f x = s g n i = 1 n α i * y i K ( x i · x ) + b *
where sgn [ ] is the sign function. α i * is the optimal solution. And b* is the classification threshold.
The quality of nonlinear SVM classification results is mainly affected by the two parameters of C and g. Therefore, in order to find out the optimal parameters, PSO was used to optimize the SVM model.

2.1.2. PSO Algorithm

The PSO algorithm is an intelligent optimization algorithm proposed by referring to the foraging behavior of birds. It has a simple structure and strong global search ability [29]. The PSO algorithm regards the possible solution as a particle in the search space. Each particle is characterized by three indicators of its speed, position, and fitness. Particles update their speed and position by dynamically tracking the individual optimal value and the global optimal value. The quality of the particle position after each update can be measured according to the fitness calculated by the objective function to find out the optimal solution to the problem as quickly as possible.
Supposing that there is a population X = (X1, X2, …, XN) composed of N particles in the D-dimensional space. The position, speed, and individual extremum of ith particle can be expressed as Xid = (xi1, xi2, …, xiD)T, Vid = (vi1, vi2, …, viD)T and Pid,pbest = (pi1, pi2, …, piD)T, separately. The population extremum of X is Pd,gbest = (p1,gbest, p2,gbest, …, pD,gbest)T. In each iteration, the updated formulas of particle position and speed are shown in Equation (8).
x i d k + 1 = x i d k + v i d k + 1 v i d k + 1 = w v i d k + c 1 r 1 ( p i d , p b e s t k x i d k ) + c 2 r 2 ( p d , g b e s t k x i d k )
where, x i d k and v i d k respectively represent the velocity vector and position vector of particle i in the dth dimension in the kth iteration. c1 and c2 are individual and group learning factors, respectively. The r1 and r2 are random numbers in the interval [0, 1].

2.2. PSO-SVM Model

Based on the above theory, it can be seen that the position vector of the particle in the PSO algorithm in this study represents the values of C and g of the SVM algorithm. The SVM is optimized by the PSO through the following steps. First, initialize the velocity and position of the particles. Second, calculate the fitness value of each particle. Third, update the velocity and position of the particles. Fourth, judge whether the termination condition is satisfied. Finally, output the optimal solution to form an SVM model with optimal parameters. The flowchart of the PSO-SVM model for LI-CGO prediction in this study is shown in Figure 2.

3. Explanation of Sample Data

3.1. Indexes for LI-CGO Prediction

CGO is caused by gas, crustal stress, and physical properties of coal. The comprehensive hypothesis holds that crustal stress breaks the coal and causes the expansion of fissure. The desorption and emission of gas become quicker due to the fresh surface generated by coal fracture expansion. The physical structure of coal determines the strength of coal, the resistance of coal to stress, the emission speed of gas, and the size of the energy of CGO [30,31]. Therefore, the indexes used to predict LI-CGO should include these indexes that can respectively represent the size of gas content, the size of crustal stress, and the physical properties of coal.
In this study, these five indexes of gas pressure, initial gas emission velocity, buried depth, coal failure type, and coal firmness coefficient were used as CGO features to predict LI-CGO. Among them, gas pressure is not only the driving force for CGO but also reduces the strength of coal. Free gas changes the mechanical properties of coals since it decreases the effective stress of coal mass, which can be explained by Terzaghi’s effective stress laws [32]. The initial velocity of gas emission indicates the amount of energy released by gas in coal. Stress is the power and energy source of coal failure in the outburst process. Stress participates in the preparation, triggering, and development stages of outbursts [33]. The crustal stress increases by about 1 MPa as the buried depth of coal increases by 100 m, so the buried depth of coal can reflect the crustal stress in the coal seam. The failure type of coal represents the development degree of the fissures and geological structure in the coal region. Studies have shown that the occurrence site of a large number of CGO disasters was distributed in the geological structural fracture zone. These zones alter the microstructures (e.g., matrix, pore, and fracture) of coal, thus changing the properties of coals [34]. The coal firmness coefficient suggests the strength of coal, that is, the ability of coal to resist CGO [35].

3.2. Data Sources

Due to the complex and changeable storage environments of different coal seams in different regions, the leading factors of CGO under different geological conditions are also different. Therefore, in order to improve the prediction accuracy and generalization of the trained model, this study collected data from historical CGO cases, which include LI-CGO cases, from different coal regions. They are Xipo Coal Mine (XP) and Sihe Coal Mine (SH) in Shanxi Province in China [36,37], Panjiang coal region (PJ) in Guizhou Province in China [38], and Enhong coal mine (EH) in Yunnan Province in China [39], respectively. Among them, Shanxi and Guizhou are the regions with more serious gas disasters, and the disaster data in these places are typical [40]. The geographical distribution of the data sources is shown in Figure 3.
In order to better present the data, the cases except for the LI-CGO in the collected CGO cases are referred to as high-index coal and gas outburst (HI-CGO) cases in this study. Similarly, the collected non-CGO cases are divided into LI-N-CGO cases and HI-N-CGO cases. Among the collected data from XP, there are 22 cases of HI-CGO, 15 cases of HI-N-CGO, and 7 cases of LI-N-CGO. A total of 14 cases are collected from SH, including 10 HI-CGO cases and 4 HI-N-CGO cases. There are 7 LI-CGO cases and 1 HI-CGO case in the data from PJ Coal Region. As for the data from EH, there are 6 HI-N-CGO cases and 19 HI-CGO cases.

3.3. Training and Test Sets

To study the best method to predict LI-CGO, three different training sets, named TI, T2, and T3 separately, were designed in this study. T1 without LI-CGO cases and T2 with LI-CGO cases were designed to explore the impact of the absence and presence of LI-CGO cases in the training set on the prediction results. T1 consisted of 15 HI-N-CGO cases from XP and 23 HI-CGO cases from XP and PJ. T2 was made by replacing 2 cases of HI-N-CGO and 2 cases of HI-CGO in T1 with 2 LI-N-CGO cases and 2 LI-CGO cases. Furthermore, in order to explore whether data from other coal mines is useful for the LI-CGO prediction of the test set, T3 was made by adding data from XH and EH to T2. Part of the data of T1 is shown in Table 1. The “0” and “1” in the column “CGO or not” in the tables mean “no” and “yes”, respectively.
The test set designed in this study consists of 5 LI-CGO cases from PJ and 5 LI-N-CGO cases from XP. The data of the test set are shown in Table 2.

4. Results and Analysis

4.1. Prediction Results of SVM, BPNN, and DDA Models Trained by T1

The algorithm models used in this study were written in Python language based on PyCharm. In order to illustrate the advantages of SVM in predicting data with the characteristics of nonlinear and high-dimensional in this research. The prediction accuracy of SVM, BPNN, and DDA models trained by T1 were compared. The confusion matrices and prediction accuracy of different models are shown in Figure 4.
As shown in Figure 4a, there are six cases predicted as “0” and four cases predicted as “1” by the SVM model trained by T1. Three of the predicted type “0” cases and two of the predicted type “1” cases are predicted incorrectly. Both the prediction accuracy for type “0” cases and type “1” cases are 50%. As for all cases of the test set, the prediction accuracy is also 50%. Figure 4b shows that there are six cases predicted as “0” and four cases predicted as “1” by the BPNN model trained by T1. Four of the predicted type “0” cases and three of the predicted type “1” cases are incorrect. The prediction accuracy for type “0” cases and type “1” cases are 33% and 25%, respectively. As for all cases of the test set, the prediction accuracy is 30%. As shown in Figure 4c, there are seven cases predicted as “0” and three cases predicted as “1” by the DDA model trained by T1. Four of the predicted type “0” cases and two of the predicted type “1” cases are predicted incorrectly. The prediction accuracy for type “0” cases and type “1” cases are 43% and 33%, respectively. As for all cases of the test set, the prediction accuracy is 40%. Therefore, the prediction accuracy of SVM is better than BPNN and DDA for the data in this study.
Further, the robustness of the SVM model was evaluated by adding ten, twenty, and thirty noisy cases to the training set T1, respectively, and analyzing the changes in the prediction accuracy of the SVM model under different test sets (Table 3). As shown in Table 3, the prediction accuracies of the SVM model trained by the training sets with a different number of noisy cases are 40%, 50%, and 50%, respectively, which are not significantly different from the accuracy of 50% of the model train by the training set without noisy cases.

4.2. Prediction Results of the SVM Model Trained by T2 and T3

The confusion matrices and prediction accuracy of the SVM model trained by T2 and T3, respectively, are shown in Figure 5.
As shown in Figure 5a, there are four cases predicted as “0” and six cases predicted as “1” by the SVM model trained by T2. One of the predicted type “0” cases and two of the predicted type “1” cases are incorrect. The prediction accuracy for type “0” cases and type “1” cases are 75% and 67%, respectively. The false positive and false negative rates are 33% and 25%, respectively. As for all cases of the test set, the prediction accuracy is 70%, which is higher than that of the SVM model trained by T1. Figure 5b shows that there are five cases predicted as “0” and five cases predicted as “1” by the SVM model trained by T3. One of the five predicted type “0” cases is incorrect, and so do the five predicted type “1” cases. Both the prediction accuracy for type “0” and type “1” cases are 80%. Both the false positive and false negative rates are 20%. Certainly, the prediction accuracy for all cases of the test set in this study is also 80%, which is higher than that of the SVM model trained by T2. This is because the increase in the number of cases in the training set allows the trained SVM model to learn more accurate features of LI-CGO and find the best support vectors and the optimal hyperplane to predict whether LI-CGO occurs.

4.3. Prediction Result of PSO-SVM Model

The confusion matrix of the prediction accuracy of each type of case by the PSO-SVM model trained by T3 is shown in Figure 6.
As shown in Figure 6, for the test set in this study, the PSO-SVM model trained by T3 predicted four type “0” cases and six type “1” cases. The predicted four type “0” cases are all correct. One of the six predicted type “1” cases is incorrect. The prediction accuracy for type “0” and type “1” cases are 100% and 83%, respectively. The false positive and false negative rates are 17% and 0%, respectively. The prediction accuracy for all cases of the test set in this study is 90%, which is higher than that of the SVM model (Figure 5b). This is because the parameters C and g of the SVM model were optimized by the PSO algorithm to make the penalty of the prediction model for misclassification reasonable and to make the distance between the selected optimal hyperplane and the support vectors appropriate. In this way, the occurrence of LI-CGO can be accurately predicted by judging the coupling effect of multiple factors when the measured values of multiple indexes do not exceed the critical values of danger.

5. Discussion

5.1. Influence of LI-CGO Cases in Training Set on Prediction Results

At present, the critical values of the indexes used to predict CGO are mostly determined according to the statistics of historical CGO data. With the increase of coal mining depth and the more complex coal geology, LI-CGO disasters occur unpredictably [11]. For example, an LI-CGO disaster occurred in 2018 in Didaoshenghe Coal Mine, Heilongjiang, China, when the gas pressure in the coal seam was 0.67 MPa, which is lower than the warning value of gas pressure according to the regulation [6]. Study shows that for anyone of the prediction indexes, it is difficult to make a unified critical value for the CGO prediction in different coal seams and to accurately make a CGO prediction when the measured values of the prediction indexes are lower than the critical values [8]. Therefore, instead of studying the precise critical value of one prediction index, exploring the mapping relationship between several prediction indexes and CGO has attracted the attention of scholars. Researchers used different machine learning algorithms to explore the nonlinear relationship between the three factors of gas, crustal stress, physical properties of coal, and CGO [37,41]. The disadvantage is that there is little attention paid to the prediction of LI-CGO in existing studies. There is no exploration of the different training sets for the prediction of LI-CGO. The results of this study made up for the deficiencies of the existing research on LI-CGO prediction. Test results prove that compared with the SVM model trained by the training set without LI-CGO cases, the prediction accuracy of the SVM model trained by the training set with LI-CGO cases is higher (Figure 7). It means that there will be a higher prediction accuracy for the LI-CGO prediction when the algorithm model is trained by the training set with LI-CGO cases.

5.2. Prediction Result of the Training Set Including Other Coal Mines

The number of sample data in the training set affects the prediction accuracy of the trained model. The samples in most existing studies on CGO prediction always come from only one coal mine, so the amount of data was too small to reflect the characteristics of CGO disasters caused by different dominant factors [8,25], which limits the prediction accuracy of CGO, especially of LI-CGO. Compared with the training sets with a small amount of data in previous studies, the data in this study were collected from 91 cases from four coal regions in different provinces in China, which improved the generalization of the trained predictive model. The results of this study show that the accuracy of LI-CGO prediction result gets higher when the training set add sample data from other coal mines (Figure 8). Therefore, in future research on LI-CGO prediction, the data volume in the training set can be increased by adding the data from other coal mines to improve the accuracy and generalization of the predictive algorithm model.

5.3. Sensitivity Analysis of Predictive Indexes

The sensitivity analysis of predictive indexes can evaluate the impact of individual indexes on prediction accuracy. For each predictive index, the values were changed sequentially by a factor of 0.50, 0.75, 1.00, 1.25, and 1.50, and the variances of the prediction accuracies were calculated for different variations. The results are shown in Table 4.
As can be seen from Table 4, when the values of the five predictive indexes of gas pressure, initial gas emission velocity, buried depth, coal failure type, and coal firmness coefficient are changed, the variances of the prediction accuracies at different coefficients of variation are 0.0096, 0.0040, 0.0064, 0.0184, and 0.0080, respectively. The sensitivities of the five predictive indexes, in descending order, are coal failure type, gas pressure, coal firmness coefficient, buried depth, and initial gas emission velocity. This can help mine workers to quickly check the risk factors that may cause LI-CGO when the measured value of the predictive index does not exceed the critical value.

6. Conclusions

To accurately predict the LI-CGO, this study collected disaster cases from XP, SH, EH, and PJ. Gas pressure, initial gas emission velocity, buried depth, coal failure type, and coal firmness coefficient were used as the five characteristic parameters of CGO. Three different training sets were made to explore the influence of data from different sources on prediction results. The trained SVM model was used to predict LI-CGO cases in the test set. Also, the prediction accuracy of SVM, BPNN, and DDA models was compared. Then the PSO algorithm was used to optimize two key parameters of C and g of SVM to improve the prediction accuracy. The research results are as follows.
(1) The prediction accuracy of the SVM model is better than BPNN and DDA models for the prediction of LI-CGO cases based on the training set and test set in this study.
(2) The prediction accuracy of the SVM model trained by T1 without LI-CGO cases is 50%, which is lower than the 70% that of the SVM model trained by T2, including LI-CGO cases.
(3) In comparison with the prediction result of the SVM model trained by T2 that only contain the data of XP and PJ, it gets better with the prediction accuracy of 80% when the predictive model trained by T3 that made by adding the data from EH and SH to the training set T2.
(4) The PSO-SVM model established in this study by optimizing the SVM with PSO achieves a better predictive effect in LI-CGO prediction with an accuracy of 90% based on the training set T3. The predicted accuracy rate of the PSO-SVM model for type “0” and type “1” cases are 90% and 87%, respectively. The research results can provide a method reference for the prediction of LI-CGO. It is important to note that the measurements of the predictive indexes used in the PSO-SVM model should be accurate. For example, the measurement of gas pressure may be low due to an unsealed borehole.
In further research, attention should be paid to how to accurately and quickly measure the value of the predictive indexes used in the prediction model and explore predictive indexes that can more accurately reflect the risk of LI-CGO.

Author Contributions

Conceptualization, Y.L. and S.M.; methodology, Y.L. and M.Z.; software, S.M. and M.Z.; validation, Y.L. and Q.L.; formal analysis, Y.L., M.Z. and Q.L.; investigation, S.M. and X.L.; resources, J.L. and J.Z.; data curation, X.L., J.L. and J.Z.; writing—original draft preparation, S.M. and M.Z.; writing—review and editing, Y.L. and S.M.; visualization, Q.L. and X.L.; supervision, Y.L.; project administration, M.Z. and Q.L.; funding acquisition, Y.L. All authors have read and agreed to the published version of the manuscript.

Funding

This work was financially supported by the National Key R&D Program of China (Grant No. 2022YFC3004704) and the National Natural Science Foundation of China (Grant No. 52174166), which are gratefully acknowledged.

Data Availability Statement

The raw/processed data can be provided by the corresponding author if required.

Conflicts of Interest

The authors declare that they have no known competing financial interest or personal relationship that could have appeared to influence the work reported in this paper.

References

  1. Ullah, B.; Cheng, Y.; Wang, L.; Hu, B.; Jiskani, I.M.; Hassan, F.U.; Shahani, N.M.; Ali, M. Experimental and theoretical analyses to predict coal and gas outburst using desorption indices of drill cuttings. Arab. J. Geosci. 2022, 15, 665. [Google Scholar] [CrossRef]
  2. Zhao, Y.; He, X.; Song, D.; Qiu, L.; Cheng, X.; Li, Z.; He, S. Identification of the relatively low permeability area in coal and gas outburst seams by seismic wave tomography technique: Field application and validation. J. Appl. Geophys. 2023, 210, 104951. [Google Scholar] [CrossRef]
  3. Soleimani, F.; Si, G.; Roshan, H.; Zhang, Z. Numerical modelling of coal and gas outburst initiation using energy balance principles. Fuel 2023, 334, 126687. [Google Scholar] [CrossRef]
  4. Shu, L.; Yuan, L.; Li, Q.; Xue, W.; Zhu, N.; Liu, Z. Response characteristics of gas pressure under simultaneous static and dynamic load: Implication for coal and gas outburst mechanism. Int. J. Miner. Sci. Technol. 2023, 33, 155–171. [Google Scholar] [CrossRef]
  5. Safety Administration National Coal Mine. Rules for Prevention and Control of Coal and Gas Outburst; China Coal Industry Publishing House: Beijing, China, 2019.
  6. Deng, Z. Study on critical value of regional prediction index for deep coal seam. China Energy Environ. Prot. 2020, 42, 34–37. [Google Scholar]
  7. Zhang, H.; Huo, Z.; Shu, L.; Yan, Z.; Wang, X.; Zhu, N. Cause analysis on coal and gas outburst in low index with K1 value of tectonic coal developed area. Coal Sci. Technol. 2019, 47, 82–87. [Google Scholar]
  8. Cheng, Y.; Zhou, H. Research progress of sensitive index and critical values for coal and gas outburst prediction. Coal Sci. Technol. 2021, 49, 146–154. [Google Scholar]
  9. Wang, F.; Liang, Y.; Sun, Z.; Li, L.; Li, X. Determination of the sensitivity index and its critical value for outburst risk prediction: A case study in Fuxiang mine, China. Adsorpt. Sci. Technol. 2020, 38, 502–527. [Google Scholar] [CrossRef]
  10. Qi, L.; Lu, Y.; Guan, L.; Qi, M. Exploration and application of determination method of sensitive index for prediction of coal and gas outburst. Min. Saf. Environ. Prot. 2021, 48, 85–89. [Google Scholar]
  11. Yang, D. Study on the Prediction Methods of Outburst Danger on Coal Roadway. Ph.D. Thesis, China University of Mining and Technology, Xuzhou, China, 2018. [Google Scholar]
  12. Wang, J.; Prabhat, B.; Shakil, M. Review of machine learning and deep learning application in mine micro-seismic event classification. Min. Miner. Depos. 2021, 15, 19–26. [Google Scholar]
  13. Zhang, L.; Song, Z.; Wu, D.; Luo, Z.; Zhao, S.; Wang, Y.; Deng, J. Prediction of coal self-ignition tendency using machine learning. Fuel 2022, 325, 124832. [Google Scholar] [CrossRef]
  14. Song, G.; Cheng, J.; Grattan, K.T.V. Recognition of micro-seismic and blasting signals in mines based on convolutional neural network and stock well transform. IEEE Access 2020, 8, 45523–45530. [Google Scholar] [CrossRef]
  15. Ruano, A.E.; Madureira, G.; Barros, O.; Khosravani, H.R.; Ruano, M.G.; Ferreira, P.M. Seismic detection using support vector machines. Neurocomputing 2014, 135, 273–283. [Google Scholar] [CrossRef]
  16. Qu, F.; Zhang, L.; Li, Y.; Li, Z. Development of coal and gas outburst prediction system based on BP Neural Network. China Saf. Sci. J. 2012, 22, 11–16. [Google Scholar]
  17. Liang, B.; Qin, B.; Sun, W.; Wang, Y.; Sun, Y. Prediction on dangerous level of coal and gas outburst based on comprehensive evaluation model. J. Saf. Sci. Technol. 2015, 11, 129–134. [Google Scholar]
  18. Li, C.; Xin, C.; Li, H.; Liu, Y. Prediction of coal and gas outburst based on Fisher-stepwise discriminant analysis method. China Min. Mag. 2020, 29, 106–111. [Google Scholar]
  19. Wang, C. Evaluation of coal and gas outburst risk based on GRA-DDA weighted coupling model. Min. Saf. Environ. Prot. 2018, 45, 98–101. [Google Scholar]
  20. Wu, Y.; Gao, R.; Yang, J. Prediction of coal and gas outburst: A method based on the BP neural network optimized by GASA. Process Saf. Environ. Prot. 2020, 133, 64–72. [Google Scholar] [CrossRef]
  21. Lu, J.; Chen, P.; Shen, J.; Liang, Z.; Yang, H. Study on the Prediction of Gas Content Based on Grey Relational Analysis and BP Neural Network; Yin, Z., Pan, L., Fang, X., Eds.; Springer: Berlin/Heidelberg, Germany, 2013; pp. 677–685. [Google Scholar]
  22. Ma, X. Coal Gas Predication Based on Improved C-C Chaotic Time Series Algorithm; Wan, X., Ed.; Springer: Berlin/Heidelberg, Germany, 2011; pp. 551–558. [Google Scholar]
  23. Li, X. An Adaptive Wavelet Networks Algorithm for Prediction of Gas Delay Outburst; He, H., Zhang, N., Eds.; Springer: Berlin/Heidelberg, Germany, 2009; pp. 1000–1006. [Google Scholar]
  24. Li, S.; Hu, H. Risk identification of coal and gas outburst based on KPCA and improved extreme learning machine model. Appl. Res. Comput. 2018, 35, 172–176. [Google Scholar]
  25. Han, Y.; Li, S.; Hu, H.; Luo, M. Prediction model of coal and gas outburst based on optimized GA-ELM. Chin. J. Undergr. Space Eng. 2019, 15, 1895–1902. [Google Scholar]
  26. Gaye, B.; Zhang, D.; Wulamu, A. Improvement of Support Vector Machine Algorithm in Big Data Background. Math. Probl. Eng. 2021, 2021, 5594899. [Google Scholar] [CrossRef]
  27. Tong, Y.; Yue, Y.; Li, Z.; Huang, H.; Zhang, W.; Cheng, J. Sensitivity analysis of rock burst prediction parameters based on PSO-SVM algorithm and sample data. Mod. Tunn. Technol. 2021, 58, 432–440. [Google Scholar]
  28. Zhang, L.; Zhou, J. Rolling bearing fault diagnosis method based on multi-model fusion. Noise Vib. Control 2022, 42, 132–137+149. [Google Scholar]
  29. Gad, A.G. Particle Swarm Optimization algorithm and its spplications: A systematic review. Arch. Comput. Method. E. 2022, 29, 2531–2561. [Google Scholar] [CrossRef]
  30. Skochinski, A.A. Modern concepts on the nature of sudden outbursts of gas and coal and control techniques. Ugol 1954, 7, 50–61. [Google Scholar]
  31. Khodot, B.B. Coal and Gas Outburst; Translated by Shizhao Song and Youan Wang; China Industry Press: Beijing, China, 1966. [Google Scholar]
  32. Terzaghi, K. Theoretical Soil Mechanics; John Wiley & Son, Inc.: New York, NY, USA, 1943. [Google Scholar]
  33. Tu, Q.; Cheng, Y.; Liu, Q.; Guo, P.; Wang, L.; Li, W.; Jiang, J. Investigation of the formation mechanism of coal spallation through the cross-coupling relations of multiple physical processes. Int. J. Rock Mech. Min. Sci. 2018, 105, 133–144. [Google Scholar] [CrossRef] [Green Version]
  34. Tu, Q.; Cheng, Y.; Xue, S.; Ren, T.; Cheng, X. Analysis of the coal and gas outburst mechanism from the perspective of tectonic movement. Geofluids 2021, 2021, 9988420. [Google Scholar] [CrossRef]
  35. Qiu, L.; Chen, X. Analysis on the influence of coal strength to risk of outburst. Procedia Eng. 2011, 26, 602–607. [Google Scholar]
  36. Wang, Y. Research of Surface and Domain Combined Coal and Gas Outburst Prediction on PCA-AKH-BP Neural Network model and Application. Master’s Thesis, Taiyuan University of Technology, Taiyuan, China, 2017. [Google Scholar]
  37. Wang, J. Prediction model and application of coal and gas outburst based on SVM. Shanxi Coal 2020, 39, 109–113. [Google Scholar]
  38. Long, N.; Yuan, M.; Ao, X.; Li, X.; Zhang, P. Prediction of coal and gas outburst intensity based on LLE-FOA-BP model. Ind. Mine Autom. 2019, 45, 68–73. [Google Scholar]
  39. Bi, J.; Jia, J.; Zhao, B.; Zhang, J. Forecasting coal and gas outburst based on Fisher discrimination analysis method and its application. J. Saf. Environ. 2014, 14, 57–60. [Google Scholar]
  40. Jing, G.; Liu, M. Statistics and analysis of coal mine gas accidents in China from 2015 to 2019. J. Saf. Environ. 2022, 22, 1680–1686. [Google Scholar]
  41. Shao, J.; Xue, H. Predicting model of coal and gas outburst based on the Particle Swarm Optimization-Support Vector Machine. J. Xihua Univ. Nat. Sci. Ed. 2012, 31, 63–66. [Google Scholar]
Figure 1. Schematic diagram of SVM.
Energies 16 05990 g001
Figure 2. Flowchart of PSO-SVM model for LI-CGO prediction.
Energies 16 05990 g002
Figure 3. Geographical distribution of data sources.
Energies 16 05990 g003
Figure 4. Confusion matrices and prediction accuracy of SVM, BPNN, and DDA models trained by T1.
Energies 16 05990 g004
Figure 5. Confusion matrices and prediction accuracy of the SVM model trained by T2 and T3, respectively.
Energies 16 05990 g005
Figure 6. Confusion matrix and prediction accuracy of PSO-SVM model.
Energies 16 05990 g006
Figure 7. Prediction accuracy of SVM model trained by training sets with and without LI-CGO cases.
Energies 16 05990 g007
Figure 8. Prediction accuracy of SVM model trained by training sets with different sources of data.
Energies 16 05990 g008
Table 1. Part of the data of T1.
Serial NumberGas Pressure/MPaInitial Gas Emission Velocity/mmHgBuried Depth/mCoal Failure TypeCoal Firmness CoefficientCGO or Not
10.867.749810.70
21.016.540520.70
31.2512.256520.60
41.387.154040.40
51.4412.450130.60
61.367.339330.81
71.836.947030.21
82.211854730.21
92.9119.858930.41
104.0720.254540.31
Table 2. Data in the test set.
Serial NumberGas Pressure/MPaInitial Gas Emission Velocity/mmHgBuried Depth/mCoal Failure TypeCoal Firmness CoefficientCGO or Not
10.5710.644630.30
20.657.750330.60
30.666.948220.60
40.679.739030.70
50.6710.157030.70
60.5612.6641830.561
70.619.5443930.531
80.6513.749230.331
90.7317.2262130.361
100.4817.6243640.431
Table 3. Predictive accuracies of the SVM model trained by the training set with noisy cases.
Training Set with Noisy CasesT1T1 with Ten Noisy CasesT1 with Twenty Noisy CasesT1 with Thirty Noisy Cases
Predictive accuracy/%50405050
Table 4. Predictive accuracies for different changes in predictive indexes.
Coefficient of VariationPredictive Accuracy/%
Gas PressureInitial Gas Emission VelocityBuried DepthCoal Failure TypeCoal Firmness Coefficient
0.507070705070
0.759080806070
1.009090909090
1.257080706090
1.507080706080
Variance0.00960.00400.00640.01840.0080
Disclaimer/Publisher’s Note: The statements, opinions and data contained in all publications are solely those of the individual author(s) and contributor(s) and not of MDPI and/or the editor(s). MDPI and/or the editor(s) disclaim responsibility for any injury to people or property resulting from any ideas, methods, instructions or products referred to in the content.

