Article

Heating Performance and Economic Analysis of Solar-Assisted Cold-Water Phase-Change-Energy Heat Pump System in Series and Parallel Connections

1
College of Mechanical and Electrical Engineering, Qingdao University, Qingdao 266000, China
2
Qingdao KC Blue New Energy Co., Ltd., Qingdao 266000, China
*
Author to whom correspondence should be addressed.
Energies 2023, 16(16), 5989; https://doi.org/10.3390/en16165989
Submission received: 11 July 2023 / Revised: 31 July 2023 / Accepted: 11 August 2023 / Published: 15 August 2023
(This article belongs to the Section C: Energy Economics and Policy)

Abstract

:
To study the heating performance of a solar-assisted cold-water phase-change-energy heat pump system, its heating performance under series and parallel connections is simulated for a community in Harbin, the influence of ice thickness on the different operation modes is analyzed, and the economy of the system is calculated for series and parallel connections in this paper. The results show that the water supply temperature is higher and more uniform in the parallel operation, and more terminal heat is supplied; the ice thickness has more of an influence on the series connection compared to the parallel connection; and the dynamic payback period is 6.72 years for the series connection and 7.28 years for the parallel connection. This case study can serve as a guide for practical engineering application projects and act as a reference for heating and economic data for the promotion of this heat pump system.

1. Introduction

Water-source heat pump systems are widely used for heating and cooling due to their high efficiency and significant energy savings [1]. Wu et al. proposed a sewage- source–air-source heat pump cogeneration hot-water system that recovers and recycles the wasted heat from bath wastewater for a university bath center hot-water system project. The results show that the system has a high operational energy efficiency. In the combined operation mode of the heat pump hot-water system, the operation of the sewage-source heat pump unit was slightly better than the sewage-source–air-source tandem operation [2]. The performance of water-source heat pump (WSHP) systems for the heating or cooling of buildings depends heavily on various conditions, such as heating and cooling demands, the water source used, and the distance to the water source. Energy efficiency and carbon emissions depend more on the source of water used. As far as economic feasibility is concerned, the most influential factor is the type of building. The distance to water abstraction, especially the vertical distance, has a significant impact on all the criteria in terms of energy and environmental and economic feasibility [3]. However, conventional water-source heat pumps extract sensible heat from low-grade energy sources, such as river water, seawater, and industrial wastewater, to heat buildings with low energy utilization [4]. The WPCHP was developed to extract the phase-change energy released from water icing, and the latent heat of this phase change is equivalent to the sensible heat at 80 °C, which substantially improves energy utilization [5]. Therefore, this heat pump system uses less water and is suitable for heating areas where water resources are scarce.
At present, research on WPCHPs has focused on system improvements, energy consumption characteristics, and the heat transfer performance of PCMs. The structure and experimental parameters of WPCHPs were elaborated [5] by Yue et al. Wu et al. calculated the primary energy utilization rate of WPCHPs using computational intelligence methods and studied the energy consumption characteristics of the heat pump system. The results show that the primary energy utilization was about 1.145 and the energy efficiency ratio of the system was between 2.8 and 3.2. Considering the energy consumption of ice melting, the effective energy efficiency ratio of the unit was between 2.42 and 2.76 [6]. Liu et al. used the enthalpy–porosity method to describe the water solidification process and illustrate the effect of changes in the intermediate inlet water temperature, intermediate water flow rate, and cold-water flow rate on heat exchange. The results show that a change in the intermediate inlet water temperature has a large effect on the heat transfer process of the PCM, and a change in the cold-water flow rate has a small effect on the heat transfer process of the PCM. Increasing the intermediate water flow rate can improve the average heat transfer coefficient of the PCM. However, an increase in the average heat transfer coefficient of the PCM slows down with an increase in the intermediate water flow rate [7]. Compared to conventional heating and cooling methods, WPCHPs have the advantages of low energy consumption, high energy efficiency, and significant economic benefits.
However, the study of WPCHPs also face challenges, such as high energy consumption for ice melting and severe ice jamming. Increasing the cold-water flow rate can alleviate the ice jamming problem. The energy consumption of this heat pump system can be effectively reduced by coupling cold-water phase-change energy with other energy sources. Cheng et al. simulated a coupled system of cold-water phase-change energy with an air source and analyzed the energy consumption of the coupled system when the outdoor temperature and water supply temperature were regulated simultaneously. The results show that the total energy consumption for the heating season and the total energy consumption for the coldest day were the lowest when the outdoor temperature was 1 °C and the user-side water supply temperature was 35.5 °C [8]. However, the coupled system of cold- water phase-change energy with an air source has a relatively poor heating effect and low operational stability in extremely cold weather. Therefore, this heat pump system is not suitable for large-scale heating projects. Yang et al. proposed SAPCHPs in order to further reduce the energy consumption of WPCHPs, and compared and analyzed the ice-melting performance under three ice-melting modes. The results show that the affected serial dual-source heat pump mode has the highest system performance factor and the pure serial dual-source heat pump mode has the lowest total annual cost [9]. The coupled heat pump system solves the challenge of ice melting for WPCHPs on the one hand, and compensates for the limitations of a single heat source on the other hand. However, the heating performance of SAPCHPs remains to be studied.
Among all solar technologies, solar-assisted heat pump technology is currently the most popular technology for low- and medium-temperature applications, and multiple heat pump coupling is a future research direction for solar-assisted heat pump technology [10]. Ran et al. proposed a solar–air hybrid-source heat pump. This hybrid-source heat pump system solves the problem that traditional solar collectors cannot effectively utilize solar energy of different intensities on the one hand, and solves the problem that air-source heat pumps cannot provide stable heating under defrost conditions on the other hand [11]. Yu et al. proposed a heat pump drying system using a solar-assisted flash-tank vapor injection cycle. This system allowed solar collectors to absorb solar energy at lower temperatures and achieved a significant increase in heating capacity and drying temperature [12]. Zhang et al. developed a solar-assisted wastewater-source heat pump hot-water system using TRNSYS and analyzed the sensitivity of different factors on the annual heating performance coefficient of the system. It was found that the system performance coefficient and the heat pump performance coefficient were strongly related to the flow rate of the pump and the storage capacity of the heat exchanger tank. The azimuth and tilt angle of the solar collector had little effect on the performance coefficient [13]. However, solar-coupled heat pump systems still have problems, such as large footprints, mismatches between the energy-supply system and the energy-using system, and optimization of the configuration of the coupling system. Whether in areas with urgent heating demands and abundant solar energy, or in areas where clean energy heating is urgently needed to improve the air environment, the stability and integration of the coupled system should be improved as much as possible to increase solar energy collection efficiency and bring into play the coupling of multiple energy sources [14].
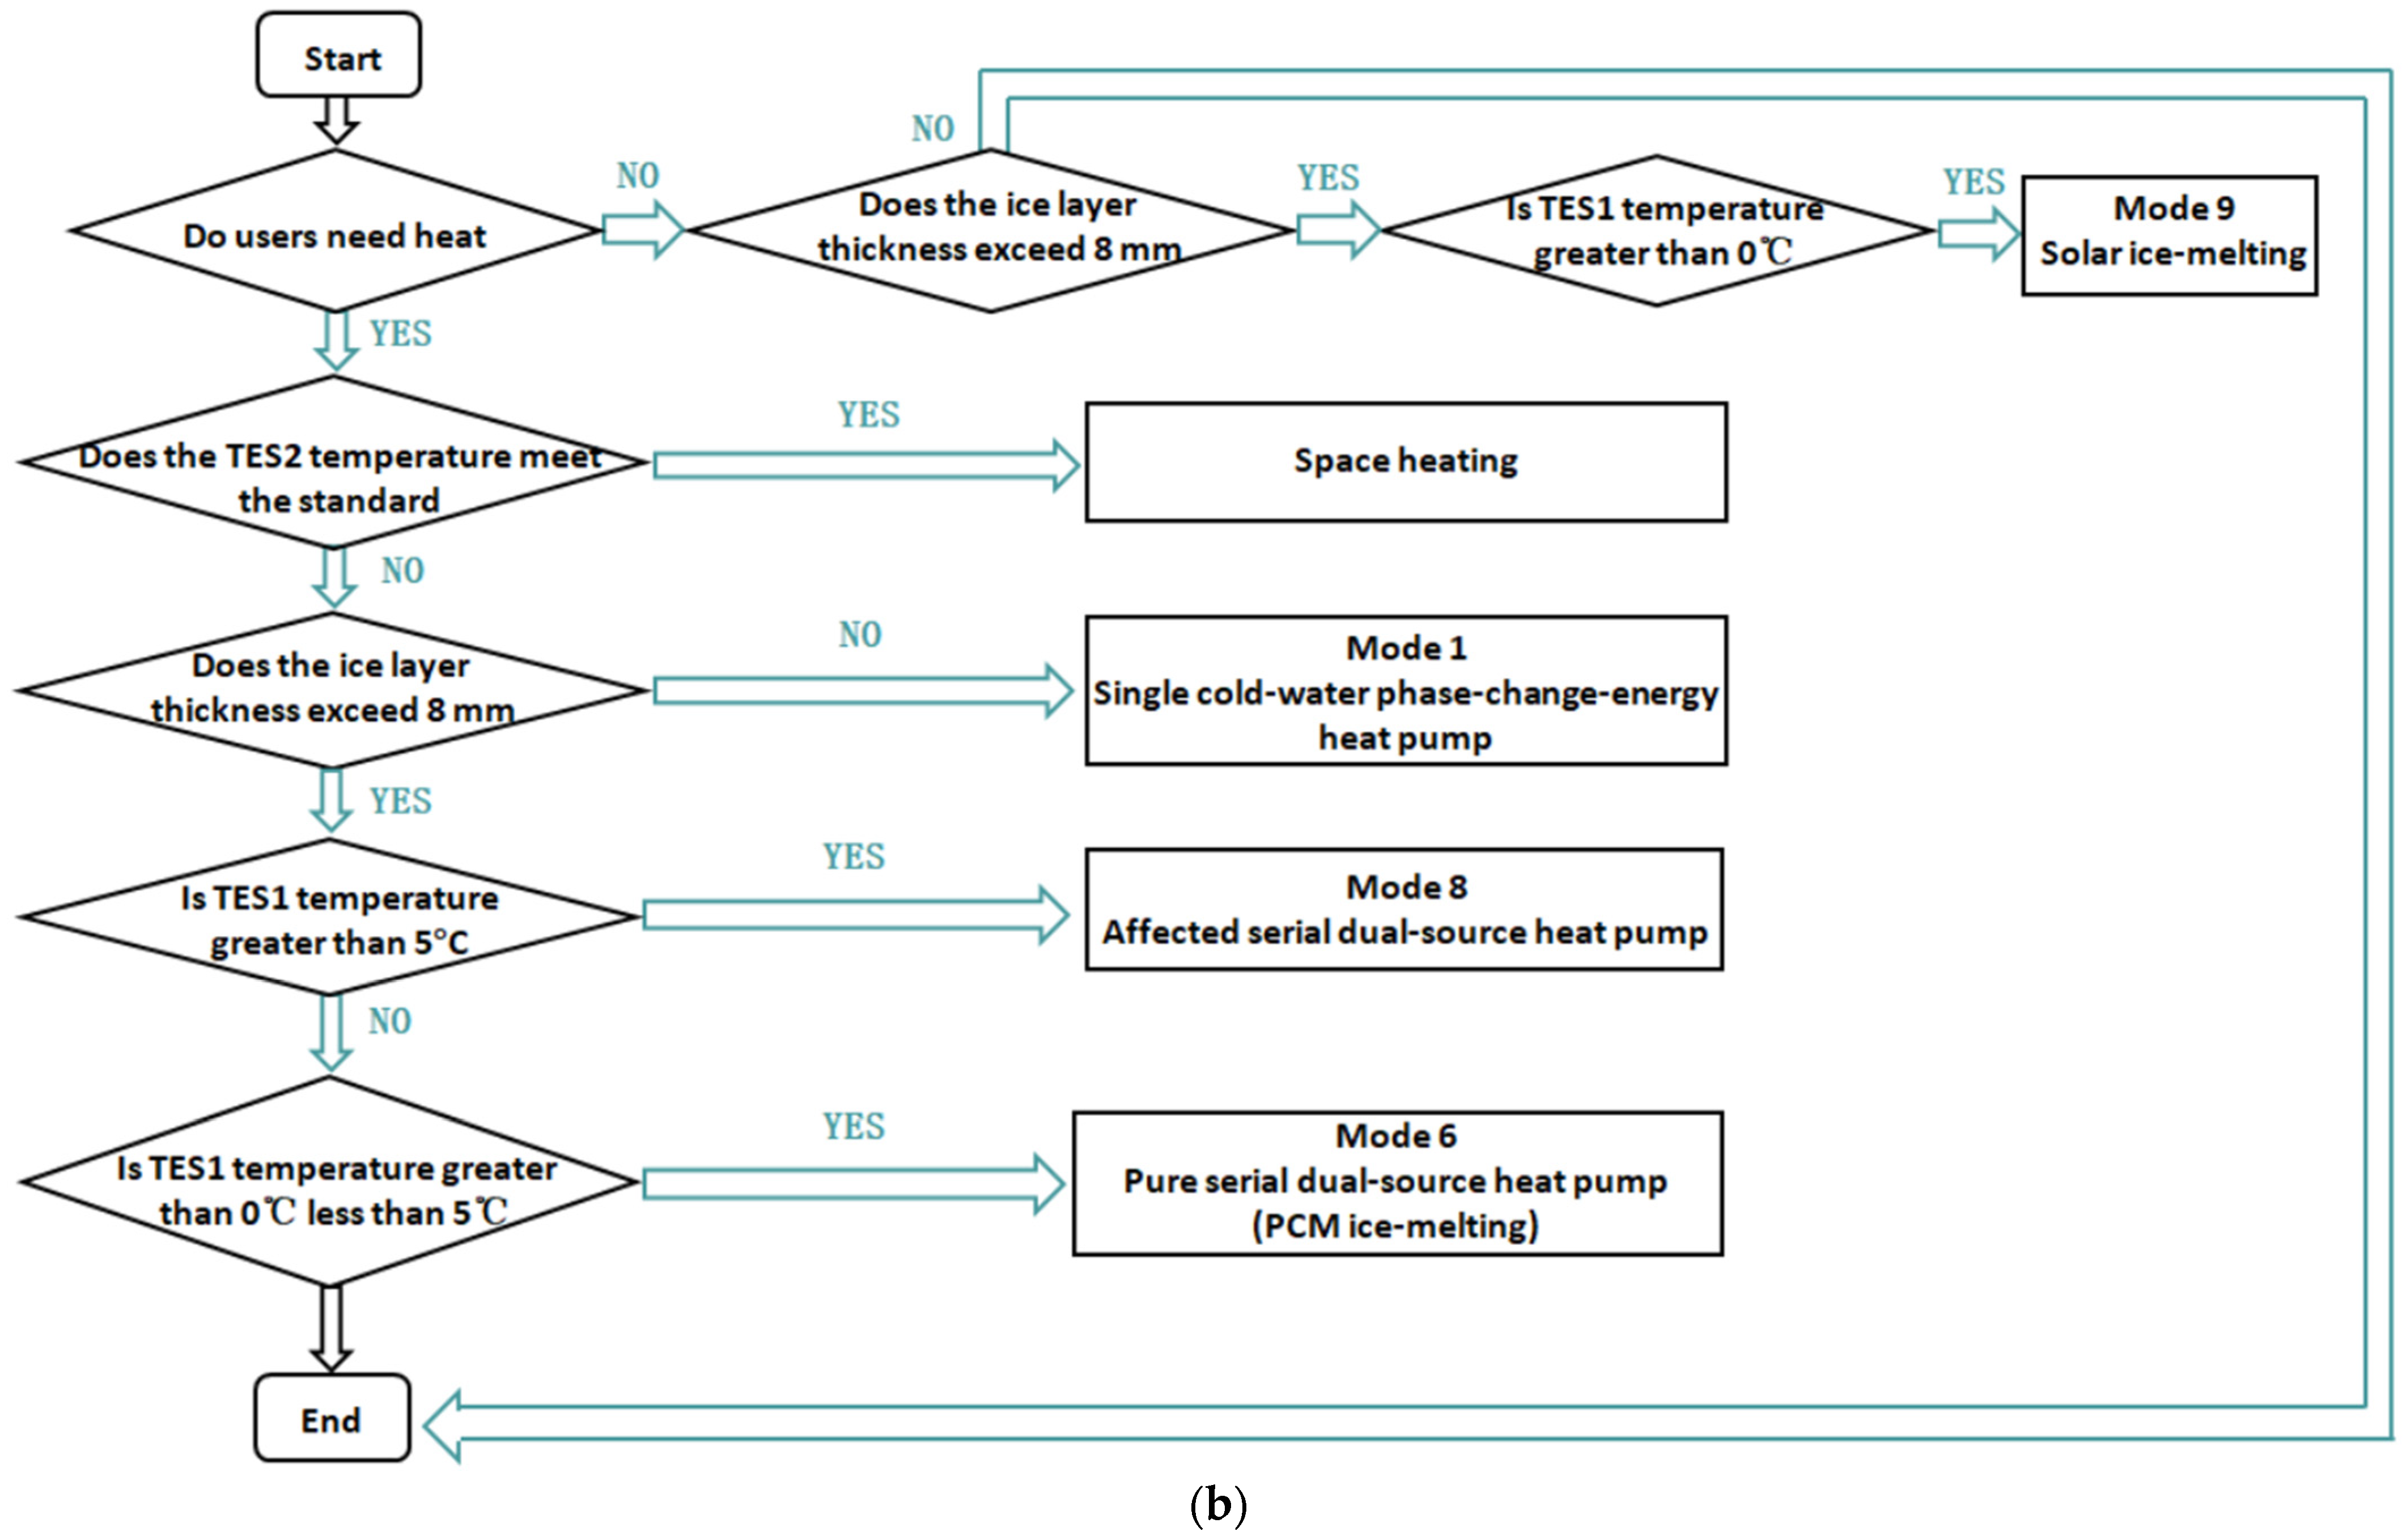
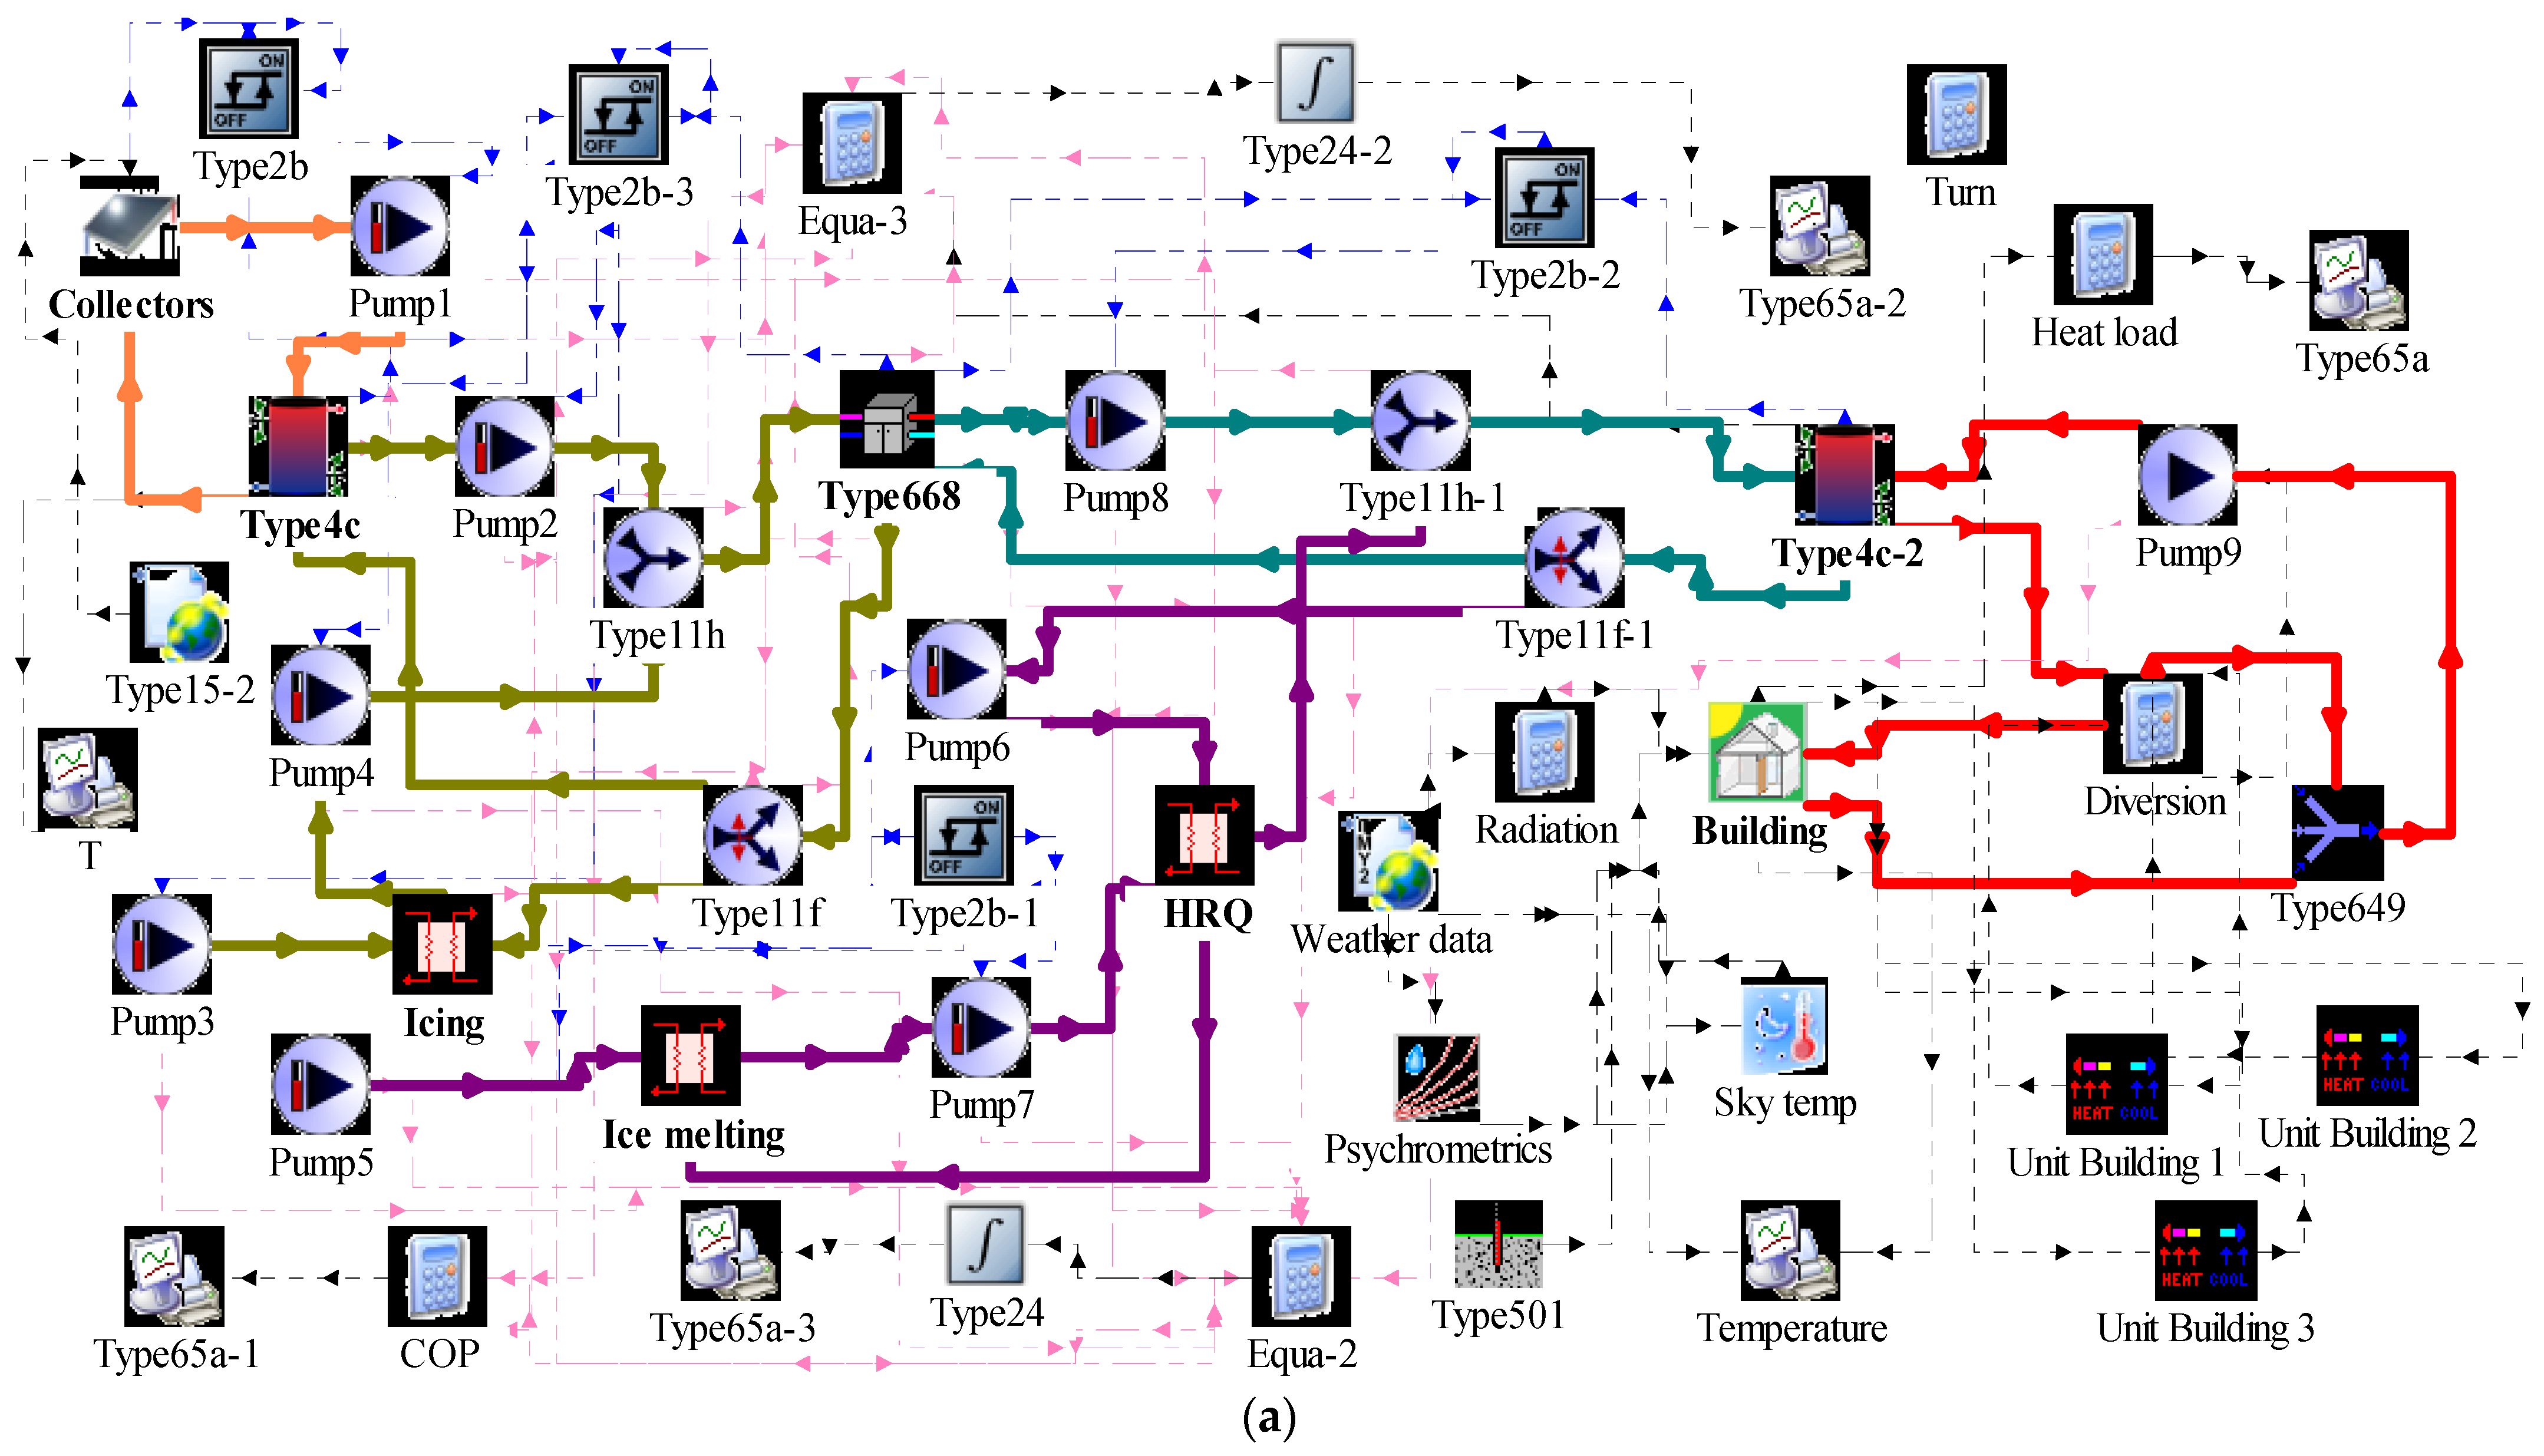
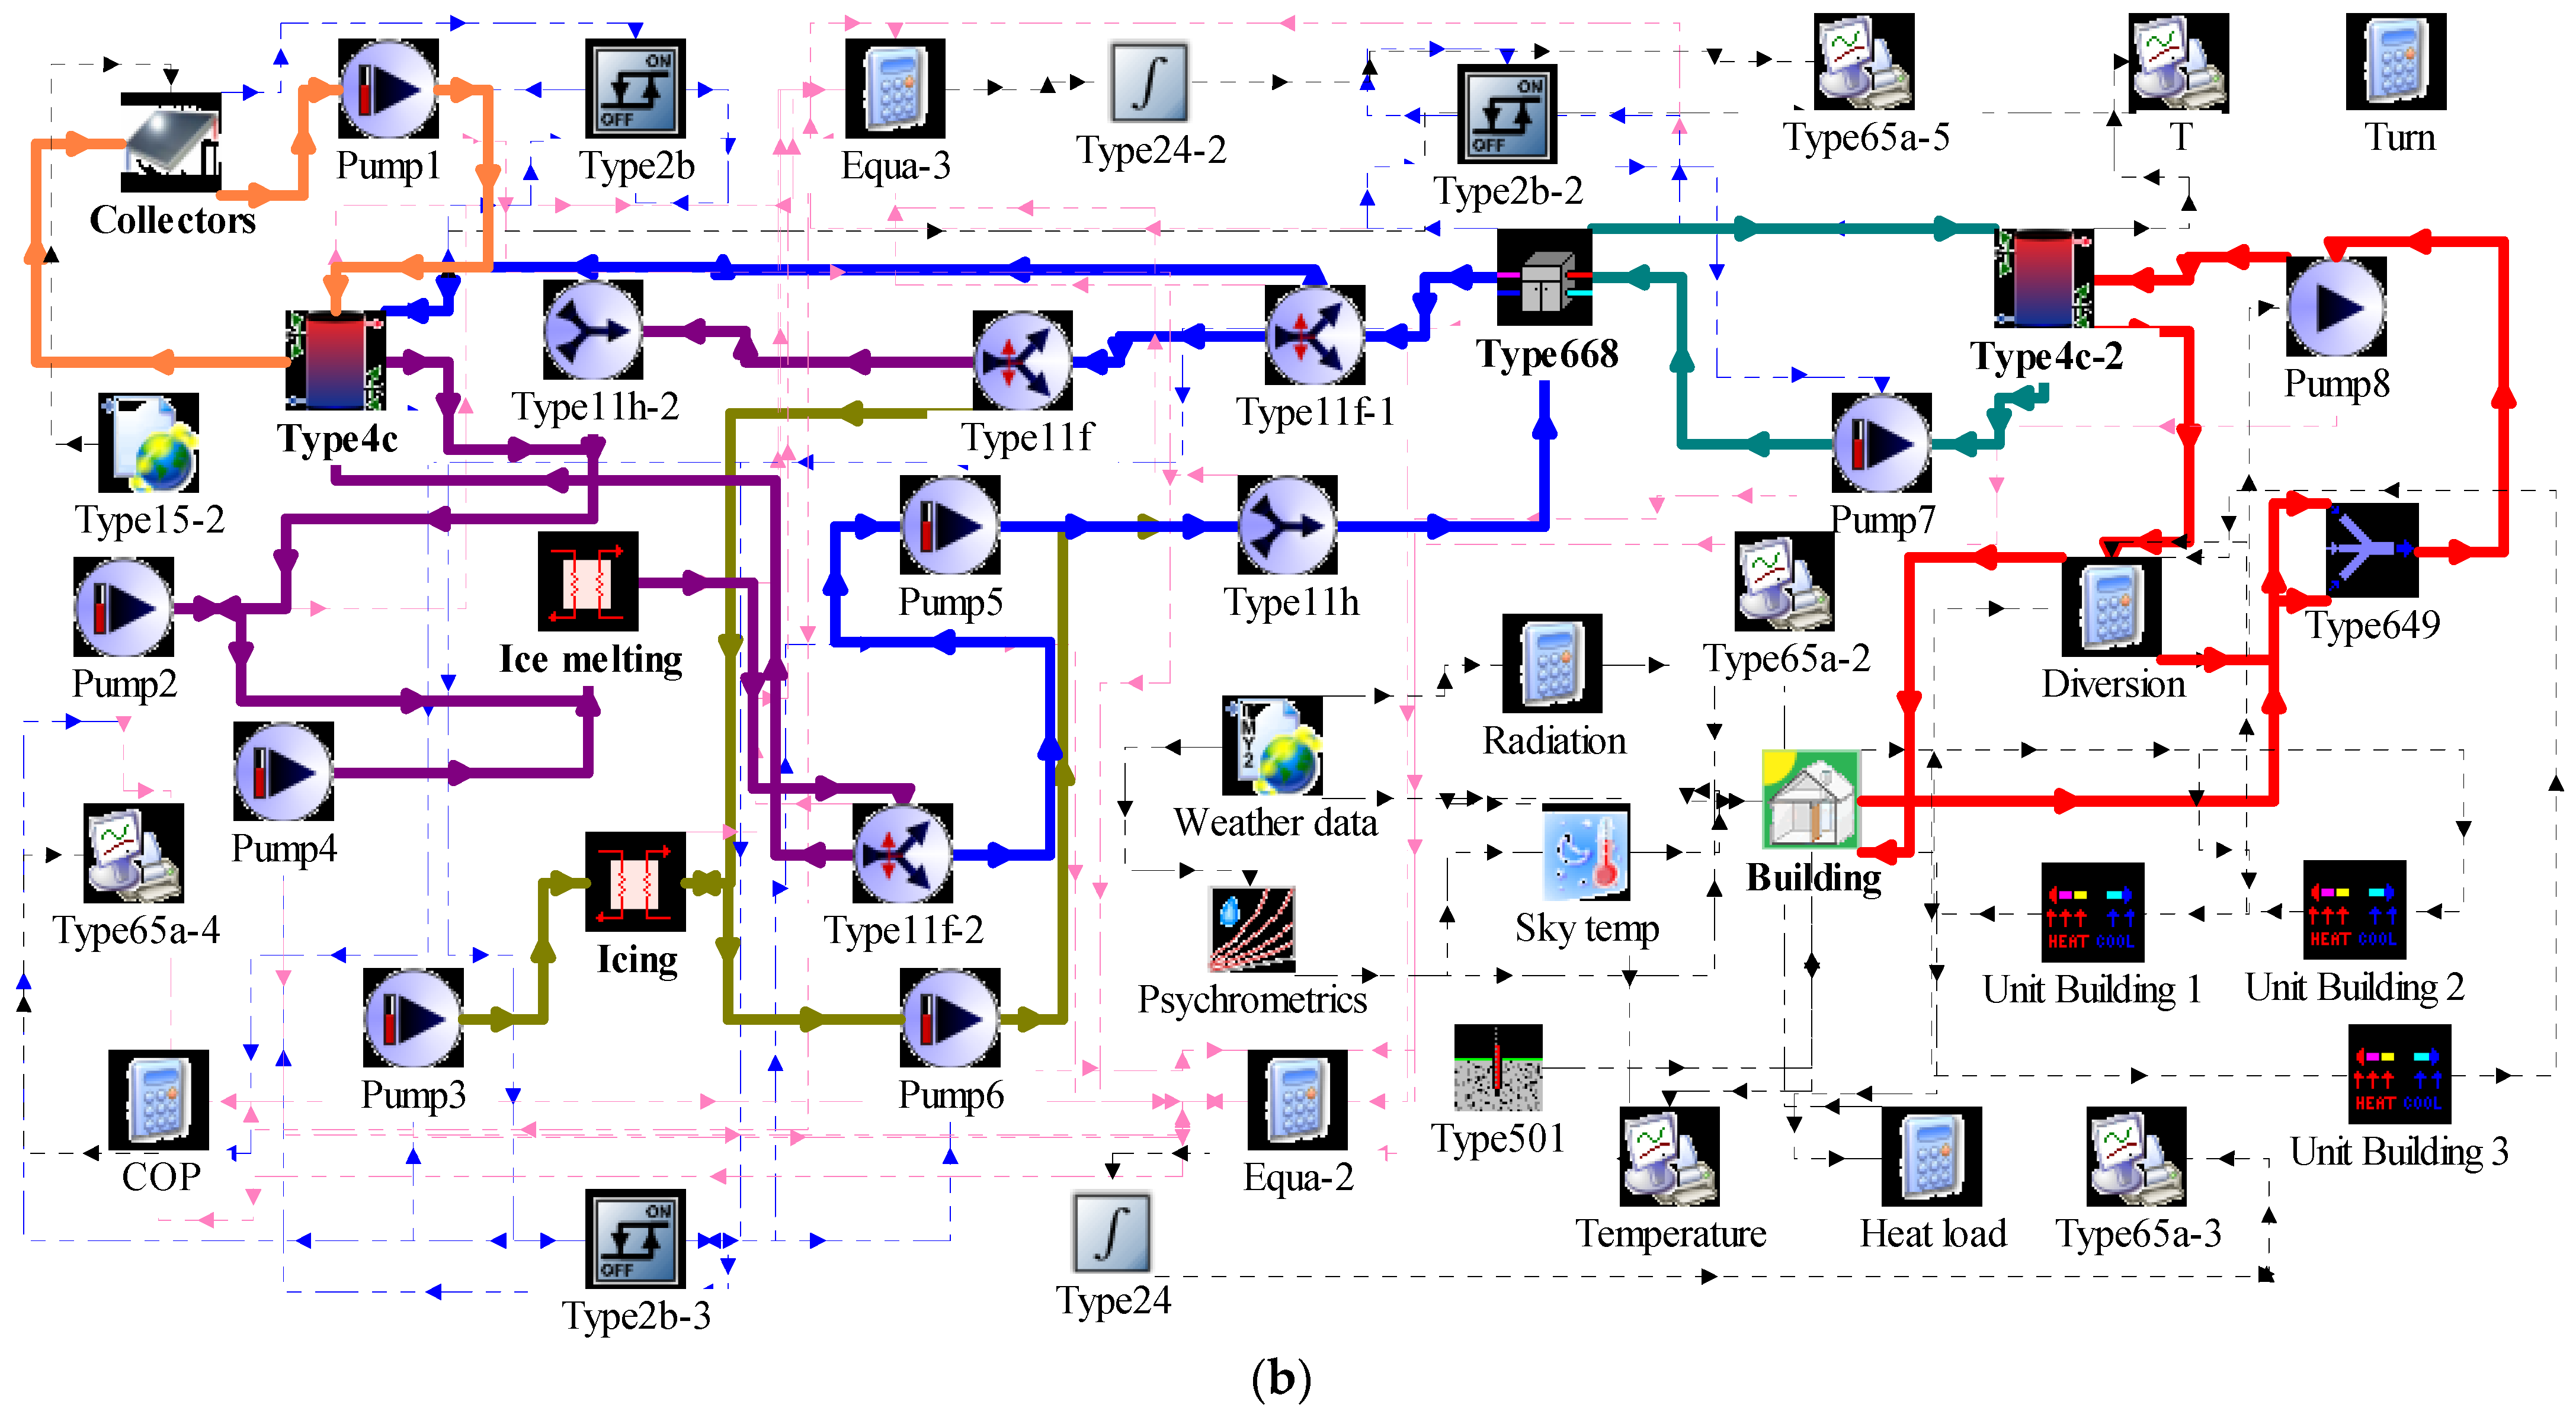
In this paper, SAPCHPs are classified into two types of connections, series and parallel. The control logic flow and operation control inquiry tables are given for the two models, respectively. A residential building in Harbin is used as the study object, and the series and parallel systems are used to supply heat to it, respectively. TRNSYS is used to simulate the series and parallel operations to obtain the relevant heating parameters, such as phase-change heat extraction, solar heat collection, ice-melting heat consumption, heat pump heat production, and terminal heat supply for the different operation modes under the two operation modes, and to obtain the relevant power parameters, such as the power consumption of the pumps, the power consumption of the unit, and the total power consumption. Finally, the payback periods for the series and parallel modes are calculated using economic parameters, such as initial investment, operating cost, and heating cost. By comparing the relevant heating parameters and economic parameters of the two connection methods, a reasonable and optimal system connection method for operation is selected. The research in this paper may enable SAPCHPs to save as much as possible on operating costs by adjusting the operation mode while guaranteeing the terminal heat supply. This case study can provide a reference for heating and economic data for engineering application of SAPCHPs.

2. Operation and Control of the System

Conventional WPCHPs consist of two PCMs connected in parallel. One PCM is in the icing–heating state while the other PCM is in the ice melting–heat consumption state. Hot water from the user-side is brought to the ice-melting heat exchanger to exchange heat with the refrigerant below 0 °C from the PCM. The source of heat for the PCM ice melting is the heat produced by the heat pump unit. This ice-melting method consumes a large amount of heat from the unit, resulting in the poor heating performance of the system.
SAPCHPs preferably use collected solar energy to melt ice for the PCM. When the solar energy supply is insufficient, the PCM ice melting still needs to use a smaller portion of the unit heat production. This measure ensures that PCM ice melting and system heating can proceed in an orderly manner in weather with an insufficient solar energy supply. Due to the addition of the solar collector system, SAPCHPs are connected in a more diverse way. The engineering choice of the best system connection method can significantly improve its economy and applicability.

2.1. SAPCHPs and Operation Control

The main components of SAPCHPs include a solar collector, TES, water tank, PCM, heat pump, and ice-melting heat exchanger. Compared to conventional WPCHPs, SAPCHPs have one less PCM and one more solar collector system. Figure 1 shows the total connection form of SAPCHPs. The blue cycle represents the solar collector cycle, the red cycle represents the PCM icing–heating cycle, the green cycle represents the intermediary cycle, the orange cycle represents the PCM ice melting–heat consumption cycle, and the terminal cycle is marked by fading from red to orange. The connection method contains nine operation modes, and the specific operation control methods are shown in Table 1. When designing the test stand, TES2 was not added. In order to monitor the supply and return the water temperature of the space-heating circuit in real time, a TES was added between the heat pump and the space heating during the simulation. In order to study the heating performance of the system, the system connection method can be divided into a series connection method and a parallel connection method. By comparing the relevant heating parameters of the two connection methods, the optimal system connection method with a reasonable operation can be selected to optimize the system heating performance.

2.2. SAPCHPs Series Connection Method and Operation Control

The SAPCHPs serial connection means that the PCM is connected in series with a TES1 that stores solar energy. The serial connection uses only solar energy for thermal ice melting without consuming the terminal heat supply. The SAPCHPs serial operation method includes mode 5, mode 6, mode 7, mode 8, and mode 9. There are three modes of serial ice-melting operation: a pure serial dual-source heat pump, an ice-melting serial dual-source heat pump, and an affected serial dual-source heat pump [9]. In mode 7, solar energy is used partly for ice melting and partly to provide heat for the heat pump. The required solar heat collection is high and this mode of operation is not easy to implement in areas with weak solar radiation. Considering its limitations, it is not explored in depth in this paper. Mode 5 is characterized by mixing solar energy with cold-water phase-change energy to provide heat for the heat pump. This mode of operation is similar to mode 3, and only mode 3 is explored in this paper.
Figure 2a shows a SAPCHPs series model. The numbering of the pumps and valves in the series model is rearranged and does not correspond to the numbering in Figure 1. The number of pumps and valves also does not correspond to Figure 1. This model has four modes of operation: mode 1, mode 6, mode 8, and mode 9. In mode 8, the intermediate water for PCM ice melting comes partly from the TES1 and partly from the evaporator. After the ice melting, the intermediate water enters the heat pump to release further heat. This mode of operation shows that the flow rate and temperature of the intermediate water in different pipelines interact with each other, which is not easy to control for in engineering applications. However, the data show that this operation mode has a better ice- melting performance [9]. The operational control of the SAPCHPs series model can be consulted in Table 2.
Figure 2b shows the control logic of the four operation modes of the series model. The system automatically switches the valve for ice melting when the ice thickness exceeds the set thickness value. In operation, the intermediary water temperature at the evaporator outlet is generally lower than 0 °C. Therefore, when the TES1 temperature exceeds 5 °C, the intermediary water at the TES1 outlet can be mixed with the intermediary water at the evaporator outlet to melt ice for PCM, and the operation mode of the series system is mode 8. When the TES1 temperature is less than 5 °C and more than 0 °C, the intermediary water at the TES1 outlet can melt ice for the PCM directly, and the operation mode of the series system is mode 6 or mode 9.

2.3. SAPCHPs Parallel Connection Method and Operation Control

The parallel connection of SAPCHPs means that the PCM is connected in parallel with a TES1 that stores solar energy. When the PCM is in the ice melting–heat consumption state, the solar energy can be used directly as a secondary heat source for the heat pump [15]. Compared with the series connection method, the parallel connection method adds an ice-melting heat exchanger. The SAPCHPs parallel operation method includes mode 3 and mode 4.
Figure 3a shows a SAPCHPs parallel connection model. The numbering of the pumps and valves in this parallel model is rearranged and does not correspond to the numbering in Figure 1. The number of pumps and valves in Figure 1 is also not the sum of the number of pumps and valves in Figure 2a and Figure 3a. The model has five modes of operation: mode 1, mode 2, mode 3, mode 4, and TES2 ice melting. In this model, mode 3 is equivalent to both mode 1 and mode 2 operating simultaneously. Mode 4 is equivalent to both mode 2 and TES2 ice melting operating simultaneously. It is worth noting that the TES2 ice-melting operation mode is performed on the following two premises, that the user-side temporarily stops heating and the PCM ice thickness exceeds the ice-thickness setting. This mode cannot be operated independently. Compared to the series operation method, the parallel operation method is easier to manipulate. The use of the parallel configuration can improve the operational reliability of the system to some extent [16]. However, the heat required for PCM ice melting in the parallel operation method comes entirely from TES2, which leads to an increase in the percentage of heat consumption used for ice melting. Therefore, with the same amount of heat consumption for ice melting, the series operation method has more terminal heat supply per unit of time. In addition, the parallel operation method adds an ice-melting heat exchanger, and the cost will increase accordingly. The operational control of the SAPCHPs parallel model can be consulted in Table 3.
Figure 3b shows the control logic of the five operation modes of the parallel model. When solar energy is sufficient, solar heat pumps can be used for heating. The system uses a “Fusheng” heat pump unit with R134a refrigerant, which has a minimum evaporation temperature of −20 °C according to the “Fusheng” refrigerant compressor-selection software. When the design heat exchange temperature difference is 5 °C, the minimum temperature of the intermediate water entering the evaporator is −15 °C. When the intermediary water temperature in TES1 is higher than the minimum temperature limit of the evaporator inlet, solar energy can provide heat for the heat pump. When the temperature of TES2 is greater than 50 °C, heat can be supplied directly to the users.

3. Simulation Process of the System

3.1. Simulation System and Scheme

The system performance was evaluated by using a large number of energy simulations with TRNSYS [17]. The SAPCHPs simulation system uses two types of connections, series and parallel, to supply heat to the users, respectively. The TRNSYS system for the two connection methods is shown in Figure 4. The user-side is a building in Harbin city. The building includes three unit buildings. The refrigerant in the simulation process is a glycol solution with a volume concentration of 40%. It is difficult to determine the ice thickness of the PCM during the simulation process. Therefore, the latent heat of phase change, Qq, released by the set value of ice thickness was used as the boundary between cold water freezing and melting. During system operation, the PCM is in the icing-heat extraction mode when the actual phase-change latent heat is lower than Qq; when the actual phase-change latent heat reaches Qq, the PCM switches to the ice melting–heat consumption mode. The values of Qq corresponding to different ice thicknesses and the values of heat consumption for ice melting were obtained from previous experimental data and input to the simulation system. The time step is set to 2 s. Table 4 describes the selected modules and the parameters set for the simulation using TRNSYS software.

3.2. Mathematical Models

3.2.1. Cold-Water Phase-Change Machine

The PCM operates with an alternating icing and de-icing operation. During the first thirty minutes of the heating cycle, the PCM is in the ice-extraction mode. When the ice thickness reaches a set value, the PCM switches to the ice-melting heat consumption mode. The ice-melting phase uses a combination of intermittent thermal ice melting and mechanical de-icing. Intermittent thermal ice melting means that the refrigerant in the PCM and the water from the users are heat exchanged in the ice-melting heat exchanger, and then the temperature rises in the PCM for ice melting. After the thermal ice melting, the system turns on the mechanical de-icing device for de-icing operation. After de-icing, the PCM enters the next icing and heat extraction cycle. The experimental data show that the power consumption of the motor on the PCM during mechanical de-icing is small compared to that of the water pump. Therefore, the power consumption of the motor is neglected during the simulation.
For the process of water solidification into ice occurring on the PCM wall, the phase interface temperature is always 0 °C. For statistical purposes, above 0 °C is called superheating and below 0 °C is called supercooling. Neglecting the sensible heat released by the ice, the convective heat exchange on the intermediary side is equal to the sum of the convective heat exchange and the latent heat of phase change on the cold-water side, calculated using Equation (1) [18]. The initial value condition for the fixed solution is δi = 0 for τ = 0. Here, the convective heat exchange on the intermediate side is defined as the phase-change heat extraction.
Δ t g 1 α g + δ PCM λ PCM + N λ i d τ     α w Δ t w d τ + L r ρ i d δ I

3.2.2. Solar Collector

The refrigerant used in the solar collector is an aqueous glycol solution with a concentration of 40% by volume. The heat absorbed by the aqueous glycol solution when it is heated by the solar collector is defined as the solar collector heat. The amount of solar collector heat is calculated using Equation (2). The outlet temperature of the solar collector is calculated using Equation (3) [15].
Q s = m g C p , g T s , out T s , in = A s η s R s
T s , out = A s η s R s m g C p , g + T s , in

3.2.3. Ice-Melting Heat Exchanger

The amount of heat consumed by the PCM to melt ice is defined as the ice-melting heat consumption. The amount of heat consumed by ice melting is inversely proportional to the system performance. Therefore, the more frequently the ice-melting heat exchanger is used, the worse the heating performance of the system. The heat exchange in the ice-melting heat exchanger is calculated using Equation (4) [15].
Q v = C p , u m u T u , in T u , out = C p , g m g ( T g , out T g , in )

3.2.4. Thermal Energy Storage Tank

The temperature of the tank has a significant impact on the overall performance of the system [19]. The thermal energy storage tank is used at two locations during the simulation. The working fluid in TES1 is an aqueous glycol solution with a volume concentration of 40%, which is used to store solar collector heat. The working fluid in TES2 is water, which is used to provide heat for the user-side and to provide ice-melting heat for the PCM. Type4c is used as the model for the TES. This model has two inlets and two outlets. The fluid flowing into and out of the TES is in direct contact with the fluid inside the TES [15]. There is no immersion heat exchanger in the tank. The tank temperature is calculated using Equation (5) considering the various heat losses and heat transfers during the mixing of the working fluid. The calculation of each heat is performed using Equations (6)–(9) [15].
C p , n d T f , n d τ = Q ah , n Q l , top , n Q l , bottom , n Q l , edges , n uQ cond , n Q mix , n Q flow , m , n
( Q l , n ) top , bottom , edges = AI top , bottom , edges ( T tan k , n T z ( top , bottom , edges ) )
Q cond , n = J n A n T n T n + 1 d n + J n 1 A n 1 T n T n 1 d n 1  
Q mix , n = m n C p , n T n T n + 1 + m n 1 C p , n 1 ( T n T n 1 )
Q flow , m , n = m in frac in , n C p T in + m in , n 1 C p T n 1 + m in , n + 1 C p T n + 1 m push C p T n

3.2.5. Heat Pump and Water Pump

The heat supplied by the heat pump unit when the system is supplying heat to the terminal users is defined as the heat pump heat production. The heat pump heat production is calculated using Equation (10). The terminal heat supply is the amount of heat provided by the system to meet the heating demand of the building by the users. When the ice-melting heat exchanger is used in parallel to melt ice for the PCM, the heat pump heat production is the sum of the terminal heat supply and ice-melting heat consumption. The COP of the heat pump unit, the total system power consumption, and the effective COP of the system are calculated using Equations (11)–(13), respectively.
Q k = Q b + η b P b = q ( h in h out )
The COP of the heat pump unit is the ratio of the heat production of the heat pump unit to the power consumption of the heat pump unit, calculated using Equation (11).
COP k = Q k W k
The total power consumption of the system includes the power consumption of the heat pump and the power consumption of all operating pumps, calculated using Equation (12).
W t =   W k + W p , t
The effective COP of the system is the ratio of the terminal heat supply to the total system power consumption, calculated using Equation (13).
COP e = Q k Q v W k + W p , t

3.2.6. Heating Seasonal Performance Factor

The concept of HSPF was introduced to further evaluate the seasonal performance of the system to compare the efficiency of series and parallel connection methods [20]. The HSPF is calculated using Equation (14).
HSPF = ( Q k Q v ) d τ W t d τ

4. Results and Discussion

4.1. Analysis of the Operation of Series and Parallel Connections during the Coldest Week

The temperature data vary according to the time of day and the month of the year, so its seasonality must be preserved [21]. Figure 5 shows the winter temperatures in a unit building and outdoors in Harbin under unheated conditions. The lowest temperatures in unit building 1, unit building 2, unit building 3, and outdoors occurred at 9104 h, 9152 h, 9104 h, and 9046 h, respectively. The time of 9046 h corresponds to 11 January, 9104 h corresponds to 13 January, and 9152 h corresponds to 16 January. Therefore, it is necessary to study the heating operation from 10 January to 17 January.
Figure 6 shows the hourly operating mode and TES2 temperature for the SAPCHPs in series and parallel connections for the period 11 January~17 January. In series operation, mode 1 was run for each hour that the system provided terminal heat supply. On top of this, mode 6, mode 8, and mode 9 were run alternately for ice melting. The heat supplied to the heat pump was mainly from the icing heat extraction of cold water, while the solar collector heat was only used for ice melting. Mode 6 was run mainly at night, and mode 9 was run mainly at noon. The TES2 temperature is roughly between 45 °C and 50 °C. When running in parallel, there are three modes of operation per hour. First, during the night, mode 1 and mode 4 run simultaneously. At this time, the heat supplied by the system to the heat pump is mainly phase-change heat extraction, and the solar collector heat is only used for ice melting. Second, at noon when the sunlight is strong, only mode 2 is run. At this time, the heat supplied by the system to the heat pump is mainly solar collector heat, and the PCM stops running. Finally, during the rest of the day, mode 3 and mode 4 run simultaneously. The PCM and TES1 provide heat to the heat pump at the same time. The TES2 temperature is roughly between 48 °C and 50 °C. In contrast, the TES2 temperature fluctuates relatively more in series operation, while the TES2 temperature is higher and more uniform in parallel operation. The temperature of TES2 is proportional to the temperature of the water supply when the system is supplied with space heating. Therefore, parallel operation provides more reliable heating compared to series operation.
Figure 7 shows the comparison of phase-change heat extraction, solar heat collection, heat pump heat production, terminal heat supply, and ice-melting heat consumption for the series and parallel operation methods, with the ice thickness set to 8 mm. Mode 1 operates without solar heat collection and the heat pump heat production is the sum of the terminal heat supply and ice-melting heat consumption. In mode 1, the cold-water phase-change icing-heat extraction process cannot occur continuously without the ice- melting process. Therefore, the experimental data were added to the system operation in mode 1 with the consideration of ice-melting heat extraction. Mode 2 operates without phase-change heat extraction and ice-melting heat consumption. The heat pump heat production is equal to the terminal heat supply. When mode 3 is running, PCM and TES1 provide heat to the heat pump at the same time. The solar collector heat and phase-change heat extraction are equally divided. Mode 4 uses solar energy to melt ice, and does not consume the terminal supply heat. Mode 6 and mode 8 have the same heat in each part. However, it is difficult to regulate the balance between the temperature and flow rate of mode 8 in practical engineering applications, so the better handling of mode 6 is preferred. Mode 9 is operated on the three premises that the solar energy is sufficient, the PCM needs to melt ice, and the terminal users can temporarily stop heating, which occurs less frequently in this mode of operation.
When the ice thickness is 8 mm, phase-change heat extraction exists in mode 1 and mode 3, and the phase-change heat extraction of mode 1 is higher than that of mode 3. Solar heat collection exists in all modes except mode 1. Among them, mode 2, mode 4, mode 6, mode 8, and mode 9 have equal solar heat extraction and have twice the solar heat extraction of mode 3. Mode 1 has the highest heat pump heat production. Mode 2 and mode 3 have equal heat pump heat production and are second only to mode 1. Mode 4, mode 6, and mode 8 have the lowest heat pump heat production.
Among all the modes, mode 2 and mode 3 supply the most heat to the users. Compared to mode 2 and mode 3, mode 1 supplies about 98.89% of their terminal heat, mode 4 supplies about 87.29% of their terminal heat, and mode 6 and mode 8 supply about 87.49% of their terminal heat. Therefore, the parallel operation provides more heat to the users than series operation. Mode 2 and mode 3 operate without ice-melting heat consumption. This means that the heat loss during parallel operation is less compared to series operation. Therefore, considering only the heating performance, the parallel system should be preferred for this heating project.

4.2. Effect of Ice Thickness on the Heating Performance of Different Operation Modes

When the icing thickness setting of the PCM is changed, the phase-change heat extraction and ice-melting heat consumption of the system change accordingly, and the heat pump heat production and the terminal heat supply may also change accordingly. Figure 8 illustrates the trend of heat change with ice thickness for each mode of operation. For mode 1, the change in ice thickness has no effect on the amount of solar collector heat. As the ice thickness increases, there is a microscopic increase in the amount of heat consumed by ice melting. For each 1 mm increase in ice thickness from 6 mm to 9 mm, the heat production of the heat pump increases by 16.67%, 14.29%, and 12.50%, respectively, and the terminal heat supply increases by 17.55%, 14.98%, and 13.10%, respectively. The change in ice thickness has no effect on the heat of each part of mode 2. This is because mode 2 is the solar heat pump operation mode. In this operation mode, the PCM stops operating. For mode 3, increasing the ice thickness increases the amount of phase-change heat extraction, but the increase in the phase-change heat extraction is smaller. For each 1 mm increase in ice thickness from 6 mm to 9 mm, the terminal heat supply increases by 7.14%, 6.67%, and 6.25%, respectively. The increase in ice thickness has no effect on the solar collector heat or the terminal heat supply of mode 4, but the ice-melting heat consumption shows a microscopic increase with an increase in ice thickness. Mode 6 and mode 8 show the same trend changes of the heat of each part with a change in ice thickness. The heat consumption of ice melting increases microscopically with the increase in ice thickness, but the terminal heat supply shows a microscopic decreasing trend. From 6 mm to 9 mm, the decrease in the terminal heat supply is 0.26%, 0.19%, and 0.22% for each 1 mm increase in ice thickness, respectively. Mode 9 does not have phase-change heat extraction, heat pump heat production, or terminal heat supply, and the effect of an ice- thickness change on the ice-melting heat consumption is small, so mode 9 is not explored in depth.
In terms of the degree of influence on the terminal heat supply, the ice thickness has the greatest influence on mode 1. Because mode 1 is the WPCHPs operation mode, the main influencing factor on its heating performance is the ice thickness. Therefore, the ice thickness affects the series connection using only cold-water phase-change energy to a greater extent than the parallel connection using both cold-water phase-change energy and solar energy.

4.3. Comparison of the Heating Performance of Series and Parallel Connection Methods

Figure 9 shows the effect of ice thickness on the heat of each component of the series and parallel connections. As the ice thickness increases, phase-change heat extraction, heat pump heat production, terminal heat supply, and ice-melting heat consumption increase for both the series and parallel connections, but the magnitude of the increase varies for each component. For the series connection, for each 1 mm increase in ice thickness from 6 mm to 9 mm, the phase-change heat extraction increases by 16.67%, 14.29%, and 12.50%, respectively. The heat pump heat production increases by 8.11%, 7.53%, and 6.99%, respectively. The terminal heat supply increases by 8.26%, 7.69%, and 7.12%, respectively. The ice-melting heat consumption increases by 3.50%, 2.49%, and 2.82%, respectively. For the parallel connection method, for each 1 mm increase in ice thickness from 6 mm to 9 mm, the phase-change heat extraction increases by 16.67%, 14.29%, and 12.50%, respectively. The heat pump heat production increases by 5.60%, 5.30%, and 5.04%, respectively. The terminal heat supply increases by 5.64%, 5.35%, and 5.08%, respectively. The ice-melting heat consumption increases by 3.50%, 2.49%, and 2.82%, respectively.
The ice thickness affects the phase-change heat extraction and ice-melting heat consumption of the series and parallel connections to the same extent. However, as the ice thickness increases, the heat pump heat production and terminal heat supply of the series connection method grows faster, indicating that the ice thickness has a greater effect on the series connection method. This is consistent with the findings of the previous section.
Figure 10 shows the effect of ice thickness on the power consumption of each part of the series and parallel connection methods. As the ice thickness increases, the water pumps power consumption, the heat pump power consumption, and the total power consumption increases for both the series and parallel connections, but the magnitude of the increase varies for each component. For the series connection, the power consumption of the water pumps increases by 14.97%, 10.51%, and 15.77%; the power consumption of the heat pump increases by 8.54%, 8.89%, and 13.17%; and the total power consumption increases by 9.07%, 9.03%, and 13.40%, respectively, for each 1 mm increase in the ice thickness from 6 mm to 9 mm. For the parallel connection method, the power consumption of the water pumps increases by 10.00%, 8.70%, and 12.10%; the power consumption of the heat pump increases by 4.17%, 3.13%, and 5.40%; and the total power consumption increases by 4.63%, 3.60%, and 5.99%, respectively, for each 1 mm increase in the ice thickness from 6 mm to 9 mm.
The increase in the power consumption of the water pumps decreases first and then increases. This is because from 6 mm to 8 mm, the heat exchange at the wall of the phase-change machine is strengthened continuously, and the increase in the power consumption of the water pump slows down at this time. From 8 mm to 9 mm, the thicker the ice layer, the more serious the ice-plugging phenomenon is, and the increase in the power consumption of the water pump is accelerated. The increase in the total power consumption is close to the increase in the power consumption of the heat pump, because the heat pump’s power consumption accounts for a relatively large amount of the total power consumption. In terms of the total power consumption, ice thickness has a greater effect on the series connection method.
Figure 11 shows the effect of ice thickness on HSPF for the various modes of series and parallel operations. From the figure, it can be seen that the HSPF of mode 1 and mode 3 increase and then decrease as the ice thickness increases, and the HSPF is the largest at 8 mm. The ice thickness has no effect on the HSPF of mode 2. The HSPF of mode 4 decreases with increasing ice thickness. The HSPF of mode 6 and mode 8 decrease with increasing ice thickness, and the decrease is the same. For each 1 mm increase in ice thickness from 6 mm to 9 mm, the HSPF increased by 3.75%, 5.26%, and −2.19% for mode 1; 1.65%, 2.52%, and −0.81% for mode 3; and 1.09%, 1.10%, and 1.11% for mode 4, respectively. The HSPF decreased by 5.12%, 8.29%, and 10.35% for mode 6 and mode 8, respectively.
Mode 4, mode 6, and mode 8 all require ice melting for the PCM. Therefore, the thicker the ice layer, the smaller the HSPF of mode 4, mode 6, and mode 8. Compared to mode 3 and mode 4, the ice thickness affects the HSPF of mode 6 and mode 8 to a greater extent. Therefore, the ice thickness has a greater effect on the HSPF of the series connection method.

4.4. Economic Comparison of Series and Parallel Connection Methods

The economics of SAPCHPs in series and parallel connections are compared in terms of initial investment, operating cost, and payback period. The initial investment mainly includes equipment and material purchase costs, design costs, installation costs, civil construction costs, management costs, and other unforeseen costs. The operating costs include water and electricity. The PCM uses less water, so the water costs in the operating costs are negligible. The savings in sustainable operating costs offset the higher initial costs over time [22]. When considering the time value of capital, a dynamic payback period is used to calculate and compare the economics of the two connection methods. With the introduction of the new billing tariff, there is added complexity in calculating the payback period of the system [23]. The dynamic payback period can be calculated using Equation (15).
t = 0 P t ( CI CO ) t ( 1   +   i r ) t = 0
Compared with the series connection method, the SAPCHPs in a parallel connection method have an additional set of ice-melting heat exchangers. Therefore, the initial investment under the parallel connection method is relatively high. The total electricity consumption during the heating season in parallel operation is relatively higher than in series operation; therefore, the operating cost of parallel connection is also higher than that of series connection. The current residential heating charge in Harbin City is 5.47 USD/m2 for the area used. The net cash flow can be calculated by using the initial investment, operating cost, and heating charge. The net cash flow is negative during the first year of system operation for both the series and parallel methods. From the second year onward, the net cash flow is positive. In the case of the series method, for example, the initial investment of the project is USD 51,257.14, the operating cost is 3.23 USD/m2, and the residential heating cost is 5.47 USD/m2, so the net cash flow in the first year is USD −42,515.57 USD, and from the second year onward, the net cash flow is USD 8741.57. According to the benchmark rate of return of 5% for the heating project, the present value of net cash flow and the present value of cumulative net cash flow can be calculated, as shown in Table 5.
As can be seen from Table 5, the year in which the present value of cumulative net cash flow for the series connection has a positive value is year 7, while the year in which the present value of cumulative net cash flow for parallel connection has a positive value is year 8. The dynamic payback period is calculated to be 6.72 years for the series connection and 7.28 years for the parallel connection. Compared to the parallel method, the series method has the lower initial investment, operating cost, and dynamic payback period. Therefore, the series connection is preferred for economic reasons. The PCM has a service life of 20 to 25 years, and the project is profitable for the second 10 to 15 years of operation, whether in series or parallel mode. Table 6 shows the comparison of the economics of SAPCHPs with series and parallel connections.

5. Conclusions

The heating performance of SAPCHPs in series and parallel modes is investigated. In order to select the optimal heating operation mode, the water supply temperature and terminal heat supply under both operation modes are simulated using TRNSYS, the effect of ice thickness on both operation modes is analyzed, and the economics of the series and parallel operation modes are compared.
(1) When comparing both the water supply temperature and the terminal heat supply, the water supply temperature fluctuates relatively more in series operation, and the water supply temperature is higher and more uniform in parallel operation. Compared with series operation, parallel operation provides more heat to the users. Therefore, under the premise of considering only the heating performance, the parallel connection method should be preferred for this heating project.
(2) Compared with a parallel connection using both cold-water phase-change energy and solar energy, the ice thickness has a greater impact on the series connection using only cold-water phase-change energy. Whether in terms of heat pump heat production, the terminal heat supply, total power consumption, or HSPF, the ice thickness has a greater impact on the series connection compared to the parallel connection method.
(3) The initial investment, operating costs, and dynamic payback period of the parallel method are higher than those of the series method. The dynamic payback period is 6.72 years for the series connection and 7.28 years for the parallel connection. Therefore, when comparing in terms of economics, the series connection method should be preferred. The service life of the PCM is 20~25 years, and the project is profitable during the latter 10~15 years of operation.

Author Contributions

Conceptualization, Y.Y. (Yujuan Yang); methodology, Y.Y. (Yujuan Yang); software, Y.Y. (Yujuan Yang) and Y.S.; validation, Y.Y. (Yuanbo Yue); formal analysis, S.L.; investigation, Y.Z.; resources, Y.Z.; data curation, S.L.; writing—original draft preparation, Y.Y. (Yujuan Yang); writing—review and editing, R.W.; visualization, Y.Y. (Yujuan Yang); supervision, Y.S.; funding acquisition, R.W. All authors have read and agreed to the published version of the manuscript.

Funding

This research was funded by [Shandong Province Natural Science foundation] grant number [ZR2022ME123].

Data Availability Statement

We don’t have permission to share the data.

Conflicts of Interest

The authors declare no conflict of interest.

Nomenclature

Symbols Subscripts
AArea (m2)ahAuxiliary heater
CICash inflow (USD)bCompressor
COCash outflow (USD)condConduction
CpSpecific heat capacity (J ·kg−1·°C−1)eEffective
dVertical distance between nodes (m)fFluid
fracThe frac score of the fluid entering the nodegIntermediary water
hSpecific enthalpy of refrigerant vapor entering or Leaving the condenser (J·kg−1)iIce layer
IThermal conductivity (W·m−2·°C−1)kHeat pump
irIndustry benchmark yieldlLoss
JHeat conductivity (W·°C−1)mThe m-th node (radial direction)
LrMass latent heat of solidification (J·kg−1)nThe n-th node (vertical direction)
mMass flow rate (kg·s−1)pWater pump
NIce thickness (m)sSolar collector
PShaft power (W)tTotal
PtDynamic payback period (Year)uUser-side
qRefrigerant mass flow rate (kg·s−1)vIce-melting consumption
QHeat (W)wCold water
QqThe latent heat of phase change released by the set Value of ice thickness (W)zOutdoor
RGlobal radiation incident on the solar collector (W·m−2)
TTemperature (°C)Greek symbols
tYear tαConvective heat transfer coefficient (W·m−2·°C−1)
uDimension conversion factor(s)δWall thickness (m)
WPower consumption (W)ηEfficiency
ΔtOverheating or overcooling temperature (°C)λCoefficient of thermal conductivity (W·m−1·°C−1)
ρDensity (kg·m−3)
Abbreviations τTime (s)
COPCoefficient of performance
HSPFHeating seasonal performance factor
WPCHPsCold-water phase-change-energy heat pump system
PCMCold-water phase-change machine
SAPCHPsSolar-assisted cold-water phase-change-energy heat pump system
TESThermal energy storage

References

  1. Zhang, Y.; Akkurt, N.; Yuan, J.; Xiao, Z.; Wang, Q.; Gang, W. Study on model uncertainty of water source heat pump and impact on decision making. Energy Build. 2020, 216, 109950. [Google Scholar] [CrossRef]
  2. Wu, W.J.; Ni, M.Q.; Zhang, Y.X.; Wu, W.; Lu, H.R. Analysis and research on operating characteristics of composite heat pump hot water system. Fluid Mach. 2020, 48, 78–82. [Google Scholar]
  3. Jung, Y.; Kim, J.; Kim, H.; Nam, Y.; Cho, H.; Lee, H. Comprehensive multi-criteria evaluation of water source heat pump systems in terms of building type, water source, and water intake distance. Energy Build. 2021, 236, 110765. [Google Scholar] [CrossRef]
  4. Ouyang, H.; Xiao, J.R.; Chen, Z.Y. Analysis of current situation and prospect of the application of Minjiang river water source heat pump system in Fuzhou. Build. Sci. 2020, 36, 80–85. [Google Scholar]
  5. Yue, Y.B.; Wu, R.H.; Zhu, H.W. Energy consumption characteristics of cold water phase change energy heat pump system. J. Therm. Eng. 2020, 35, 259–264, 274. [Google Scholar]
  6. Wu, R.; Yu, H.; Xu, Y. Computational Intelligence Powered Experimental Test on Energy Consumption Characteristics of Cold-Water Phase-Change Energy Heat Pump System. Comput. Intell. Neurosci. 2022, 2022, 1941855. [Google Scholar] [CrossRef]
  7. Liu, C.; Wu, R.; Yu, H.; Zhan, H.; Xu, L. Heat Transfer Characteristics of Cold Water Phase-Change Heat Exchangers under Active Icing Conditions. Energies 2022, 15, 7392. [Google Scholar] [CrossRef]
  8. Cheng, Y.F.; Wu, R.H.; Yu, H.; Yue, Y.B. Optimal operating point and energy consumption analysis of coupling system of cold water phase change machine and air source heat pump. J. Therm. Eng. 2022, 37, 168–175. [Google Scholar]
  9. Yang, Y.; Wu, R.; Yue, Y. Ice Melting Performance of Solar-Assisted Cold Water Phase-Change Energy Heat Pump System. Energies 2022, 15, 5905. [Google Scholar] [CrossRef]
  10. Fan, Y.; Zhao, X.; Han, Z.; Li, J.; Badiei, A.; Akhlaghi, Y.G.; Liu, Z. Scientific and technological progress and future perspectives of the solar assisted heat pump (SAHP) system. Energy 2021, 229, 120719. [Google Scholar] [CrossRef]
  11. Ran, S.; Li, X.; Xu, W.; Wang, B. A solar-air hybrid source heat pump for space heating and domestic hot water. Sol. Energy 2020, 199, 347–359. [Google Scholar] [CrossRef]
  12. Yu, J.; Yu, J. Simulation study of a heat pump drying system using a solar assisted flash tank vapor injection cycle. Sol. Energy 2023, 251, 223–239. [Google Scholar] [CrossRef]
  13. Zhang, D.; Gao, Z.; Fang, C.; Shen, C.; Li, H.; Qin, X. Simulation and analysis of hot water system with comprehensive utilization of solar energy and wastewater heat. Energy 2022, 253, 124181. [Google Scholar] [CrossRef]
  14. Wang, B.Y.; He, T.; Zhang, X.Y.; Yang, H.; Wang, C.H.; Zheng, Y. Development status and prospects of solar energy-based multi-energy complementary heating technology. Build. Sci. Technol. 2019, 2, 51–57. [Google Scholar]
  15. Lee, M.; Lee, D.; Park, M.H.; Kang, Y.T.; Kim, Y. Performance improvement of solar-assisted ground-source heat pumps with parallelly connected heat sources in heating-dominated areas. Energy 2022, 240, 122807. [Google Scholar] [CrossRef]
  16. Li, W.; Ling, X. An optimization framework development for organic rankine cycle driven by waste heat recovery: Based on the radial-inflow turbine. Case Stud. Therm. Eng. 2022, 34, 102054. [Google Scholar] [CrossRef]
  17. Pinamonti, M.; Beausoleil-Morrison, I.; Prada, A.; Baggio, P. Water-to-water heat pump integration in a solar seasonal storage system for space heating and domestic hot water production of a single-family house in a cold climate. Sol. Energy 2021, 213, 300–311. [Google Scholar] [CrossRef]
  18. Zhang, C.H.; Sun, D.X. Heat transfer analysis of plane freeze phase transition on double-convection condition. Acta Energ. Sin. 2009, 30, 75–80. [Google Scholar]
  19. Wang, Q.; Zhang, X.; Geng, X.; Chen, X.; Xing, M. Experiments on the characteristics of a sewage water source heat pump system for heat recovery from bath waste. Appl. Therm. Eng. 2022, 204, 117956. [Google Scholar] [CrossRef]
  20. Sun, Z.; Wang, Y. Comprehensive performance analysis of cascade refrigeration system with two-stage compression for industrial refrigeration. Case Stud. Therm. Eng. 2022, 39, 102400. [Google Scholar] [CrossRef]
  21. Pereira, L.D.; Yahyaoui, I.; Fiorotti, R.; de Menezes, L.S.; Fardin, J.F.; Rocha, H.R.; Tadeo, F. Optimal allocation of distributed generation and capacitor banks using probabilistic generation models with correlations. Appl. Energy 2022, 307, 118097. [Google Scholar] [CrossRef]
  22. Shehadi, M. Optimizing solar cooling systems. Case Stud. Therm. Eng. 2020, 21, 100663. [Google Scholar] [CrossRef]
  23. Sewchurran, S.; Davidson, I.E. Technical and financial analysis of large-scale solar-PV in eThekwini Municipality: Residential, business and bulk customers. Energy Rep. 2021, 7, 4961–4976. [Google Scholar] [CrossRef]
Figure 1. The total connection form of SAPCHPs. M: mixer; D: diverter; P: pump; EV: electric valve.
Energies 16 05989 g001
Figure 2. SAPCHPs series model and control flow. (a) SAPCHPs series model. (b) SAPCHPs series operation control logic flow chart (1: cold-water tank; 2: PCM; 3: solar collector; 4: TES1; 5: evaporator; 6: condenser; 7: TES2; T: temperature; P: pump; V: valve).
Energies 16 05989 g002aEnergies 16 05989 g002b
Figure 3. SAPCHPs parallel model and control flow. (a) SAPCHPs parallel model. (b) SAPCHPs parallel-operation control logic flow chart (1: cold-water tank; 2: PCM; 3: solar collector; 4: TES1; 5: evaporator; 6: condenser; 7: ice-melting heat exchanger; 8: TES2; T: temperature; p: pump; v: valve).
Energies 16 05989 g003aEnergies 16 05989 g003b
Figure 4. SAPCHPs series and parallel TRNSYS models. (a) Series TRNSYS model and (b) parallel TRNSYS model.
Energies 16 05989 g004aEnergies 16 05989 g004b
Figure 5. The winter temperatures in a unit building and outdoors in Harbin.
Energies 16 05989 g005
Figure 6. Hourly operating mode and TES2 temperatures during 11~17 January for series and parallel connections.
Energies 16 05989 g006
Figure 7. Heat comparison between series and parallel connection methods.
Energies 16 05989 g007
Figure 8. Effect of ice thickness on the heating of each operation mode.
Energies 16 05989 g008
Figure 9. Effect of ice thickness on the heat of each component of the series and parallel connections.
Energies 16 05989 g009
Figure 10. Effect of ice thickness on the power consumption of each part of the series and parallel connections.
Energies 16 05989 g010
Figure 11. Effect of ice thickness on HSPF for various modes of series and parallel operations.
Energies 16 05989 g011
Table 1. SAPCHPs operation method and control method inquiry form.
Operating MannerModePumpElectric ValvePCM Status
123456712345678910
  • Single cold-water phase-change-energy heat pump
1××××××××××Icing
  • Solar heat pump
2×××××××××Stop running
  • Parallel dual-source heat pump
3××××××Icing
  • Parallel dual-source heat pump
4××××××Ice melting
  • Pure serial dual-source heat pump
5×××××××Icing
  • Pure serial dual-source heat pump
6××××××××Ice melting
  • Ice-melting serial dual-source heat pump
7××××××Ice melting
  • Affected serial dual-source heat pump
8×××××××Ice melting
  • Solar ice melting
9××××××××××××Ice melting
Table 2. SAPCHPs series operation control inquiry form.
Equipment Operation ModeOperating ConditionsPumpElectric Valve
123451234567
1-2-5-6-7-Room1TTES2 < 50 °C, δice < 8 mm, T7 > −15 °C, Troom < 18 °C×××××
3-4-2-5-6-7-Room6TTES2 < 50 °C, δice > 8 mm, T7 > −15 °C, 0 °C < T6 < 5 °C, T3 > T4, Troom < 18 °C×××
4-2-5-6-7-Room6TTES2 < 50 °C, δice > 8 mm, T7 > −15 °C, 0 °C < T6 < 5 °C, Troom < 18 °C×××××
3-4-2-5-2-5-6-7-Room8TTES2 < 50 °C, δice > 8 mm, T7 > −15 °C, T6 > 5 °C, T3 > T4, Troom < 18 °C××
4-2-5-2-5-6-7-Room8TTES2 < 50 °C, δice > 8 mm, T7 > −15 °C, T6 > 5 °C, Troom < 18 °C××××
3-4-29TTES2 > 50 °C, δice > 8 mm, 0 °C < T6 < 5 °C, Troom > 18 °C×××××××
4-29TTES2 > 50 °C, δice > 8 mm, 0 °C < T6 < 5 °C, Troom > 18 °C×××××××××
7-RoomSpace heatingTTES2 > 50 °C, Troom < 18 °C×××××××××××
Table 3. SAPCHPs parallel-operation control inquiry form.
Equipment OperationModeOperating ConditionsPumpElectric Valve
1234561234567
1-2-5-6-8-Room1TTES2 < 50 °C, δice < 8 mm, T7 > −15 °C, T6 < T5, Troom < 18 °C××××××
3-4-5-6-8-Room2TTES2 < 50 °C, T7 > −15 °C, T6 > T5, T3 > T4, Troom < 18 °C××××××
4-5-6-8-Room2TTES2 < 50 °C, T7 > −15 °C, T6 > T5, T3 < T4, Troom < 18 °C××××××××
1-2-5-6-8-Room and 3-4-5-6-8-Room3TTES2 < 50 °C, δice < 8 mm, T7 > −15 °C, T6 > T5, T3 > T4, Troom < 18 °C××
1-2-5-6-8-Room and 4-5-6-8-Room3TTES2 < 50 °C, δice < 8 mm, T7 > −15 °C, T6 > T5, T3T4, Troom < 18 °C××××
3-4-5-6-8-Room and 2-74TTES2 < 50 °C, δice > 8 mm, T7 > −15 °C, T6 > T5, T3 > T4, Troom < 18 °C×××
4-5-6-8-Room and 2-74TTES2 < 50 °C, δice > 8 mm, T7 > −15 °C, T6 > T5, Troom < 18 °C×××××
8-RoomSpace heatingTTES2 > 50 °C, Troom < 18 °C××××××××××××
Table 4. Modules and the parameters of TRNSYS.
ModuleTypeParameters
Solar Collector1bNumber in series: 35
Collector area: 20 m2
Fluid specific heat: 3.401 kJ·kg−1·°C−1
Inlet temperature: variable
Inlet flowrate: variable
Water-to-water heat exchanger (Icing)5bSpecific heat of hot-side fluid: 4.18 kJ·kg−1·°C−1
Specific heat of cold-side fluid: 3.401 kJ·kg−1·°C−1
Hot- and cold-side inlet temperature: variable
Hot- and cold-side flow rate: variable
Water-to-water heat exchanger (Ice melting)5bSpecific heat of hot-side fluid: 3.401 kJ·kg−1·°C−1
Specific heat of cold-side fluid: 4.18 kJ·kg−1·°C−1
Hot- and cold-side inlet temperature: variable
Hot- and cold-side flow rate: variable
Ice-melting heat exchanger5bSpecific heat of hot-side fluid: 4.18 kJ·kg−1·°C−1
Specific heat of cold-side fluid: 3.401 kJ·kg−1·°C−1
Hot- and cold-side inlet temperature: variable
Hot- and cold-side flow rate: variable
Heat pump668Source specific heat: 3.401 kJ·kg−1·°C−1
Load specific heat: 4.18 kJ·kg−1·°C−1
Inlet source and load temperature: variable
Source and load flow rate: variable
TES14cTank volume: 25 m3
Fluid specific heat: 3.401 kJ·kg−1·°C−1
Fluid density: 1066.8 kg·m−3
Hot-side and cold-side temperature: variable
Hot-side and cold-side flowrate: variable
TES24cTank volume: 25 m3
Fluid specific heat: 4.18 kJ·kg−1·°C−1
Fluid density: 1000 kg·m−3
Hot-side and cold-side temperature: variable
Hot-side and cold-side flowrate: variable
Table 5. Main indicators of economic evaluation.
Time/YearSeries Net Cash Flows (USD)Present Value of Series Net Cash Flows (USD)Present Value of Series Cumulative Net Cash Flows (USD)Parallel Net Cash Flows (USD)Present Value of Parallel Net Cash Flows (USD)Present Value of Parallel Cumulative Net Cash Flows (USD)
1−42,515.57−40,474.82−40,474.82−44,284−42,158.37−42,158.37
28741.577928.60−32,546.228401.717620.35−34,538.02
38741.577543.97−25,002.258401.717250.68−27,287.34
48741.577185.57−17,816.688401.716906.21−20,381.13
58741.576844.65−10,972.038401.716578.54−13,802.59
68741.576521.21−4450.828401.716267.68−7534.91
78741.576206.511755.698401.715965.22−1569.69
88741.575909.307664.998401.715679.564109.87
Table 6. Economic comparison of SAPCHPs in series and parallel connections.
ConnectionInitial Investment (USD)Operating Cost (USD/m2/Year)Payback Period (Year)
Series51,257.143.236.72
Parallel52,685.713.327.28
Disclaimer/Publisher’s Note: The statements, opinions and data contained in all publications are solely those of the individual author(s) and contributor(s) and not of MDPI and/or the editor(s). MDPI and/or the editor(s) disclaim responsibility for any injury to people or property resulting from any ideas, methods, instructions or products referred to in the content.

