Article

Conventional and Advanced Exergy Analyses of Industrial Pneumatic Systems

Department of Mechanical Engineering, Dalian Maritime University, Dalian 116026, China
*
Author to whom correspondence should be addressed.
Energies 2023, 16(16), 5982; https://doi.org/10.3390/en16165982
Submission received: 29 June 2023 / Revised: 2 August 2023 / Accepted: 7 August 2023 / Published: 15 August 2023
(This article belongs to the Special Issue Application and Analysis in Fluid Power Systems II)

Abstract

:
Pneumatic systems are widely used in industrial manufacturing sectors. However, the energy efficiency of pneumatic systems is generally much lower than their hydraulic and electric counterparts. It is necessary to explore more elaborate theories and methods for achieving better energy performance in pneumatic systems. In this study, for investigating the interaction effects between pneumatic components and the accessible improvement potential of energy efficiency in a pre-existing pneumatic system, the advanced exergy analysis is conducted with a better understanding of exergy destruction. The conventional exergy analysis is also carried out for comparison. The results show that an exergy efficiency of 17.3% could be achieved under the real condition in the case of the investigated pneumatic system. However, under unavoidable conditions, the theoretical maximum exergy efficiency could reach 70.5%. This means there is a significant potential for improving the energy performance of the investigated system. Furthermore, both conventional and advanced exergy analyses indicate that the pneumatic cylinder has the greatest potential for improvement. The advanced exergy analysis reveals the complex and variable interactions between pneumatic components. It highlights that the exergy destruction of some components is caused by other components in the system, and thus, improving energy efficiency at the system level rather than at the component level is of great significance. Besides, a priority order of all pneumatic components is determined, thereby guiding the improvement of the energy efficiency of the pneumatic system.

1. Introduction

Compressed air is the most widely used energy carrier in pneumatic systems, with the advantages of low initial capital cost, cleanliness, ease of maintenance, etc. [1]. However, compressed air is one of the most expensive energy carriers and the energy efficiency of pneumatic systems is much lower than the hydraulic and electric counterparts [2]. For example, in the generating process of compressed air, about 50% to 85% of energy dissipates as heat, and only a fraction is converted into pressure energy of compressed air, thereby significantly increasing the energy cost in the life cycle [3]. In various countries, compressed air systems consume approximately 7% to 15% of total industrial electricity consumption [4]. The pneumatic system has become an important contributor to energy consumption worldwide [5,6]. With the increasing concern for green and sustainable manufacturing, the drawback of low energy efficiency of pneumatic systems has become more evident. Therefore, the demand for pneumatic energy saving has become increasingly urgent. In recent years, many efforts have been made in this field. Wang et al. [7] proposed an isobaric compressed air storage device by integrating compressed gas energy storage with a nonlinear cam transformation mechanism, thereby obtaining the desirable constant-pressure characteristics and energy-saving performance. Yu et al. [8] proposed a novel compressed air utilization system by recovering and reusing exhausted compressed air from pneumatic cylinders. Cummin et al. [9] developed an isobaric accumulator based on the high elasticity properties of rubber materials and applied it to pneumatic circuits for recovering and reusing exhausted compressed air. Dindorf et al. [10] examined compressed air receiver tanks for improving the energy efficiency of various pneumatic systems. Rufer [11] developed a new electrically driven gas booster to replace traditional air-driven gas boosters, thereby increasing the energy efficiency of gas boosters for hydrogen storage and refueling stations. Besides, there is significant progress in other directions for promoting the energy efficiency of pneumatic systems, such as the near isothermal air compression technology [12,13], expansion energy utilization energy-saving technology [14], piezoelectric energy capture technology for pneumatic system applications [15], and so on. There is no doubt that the research on energy saving of pneumatic technology is constantly developing and becoming more sophisticated.
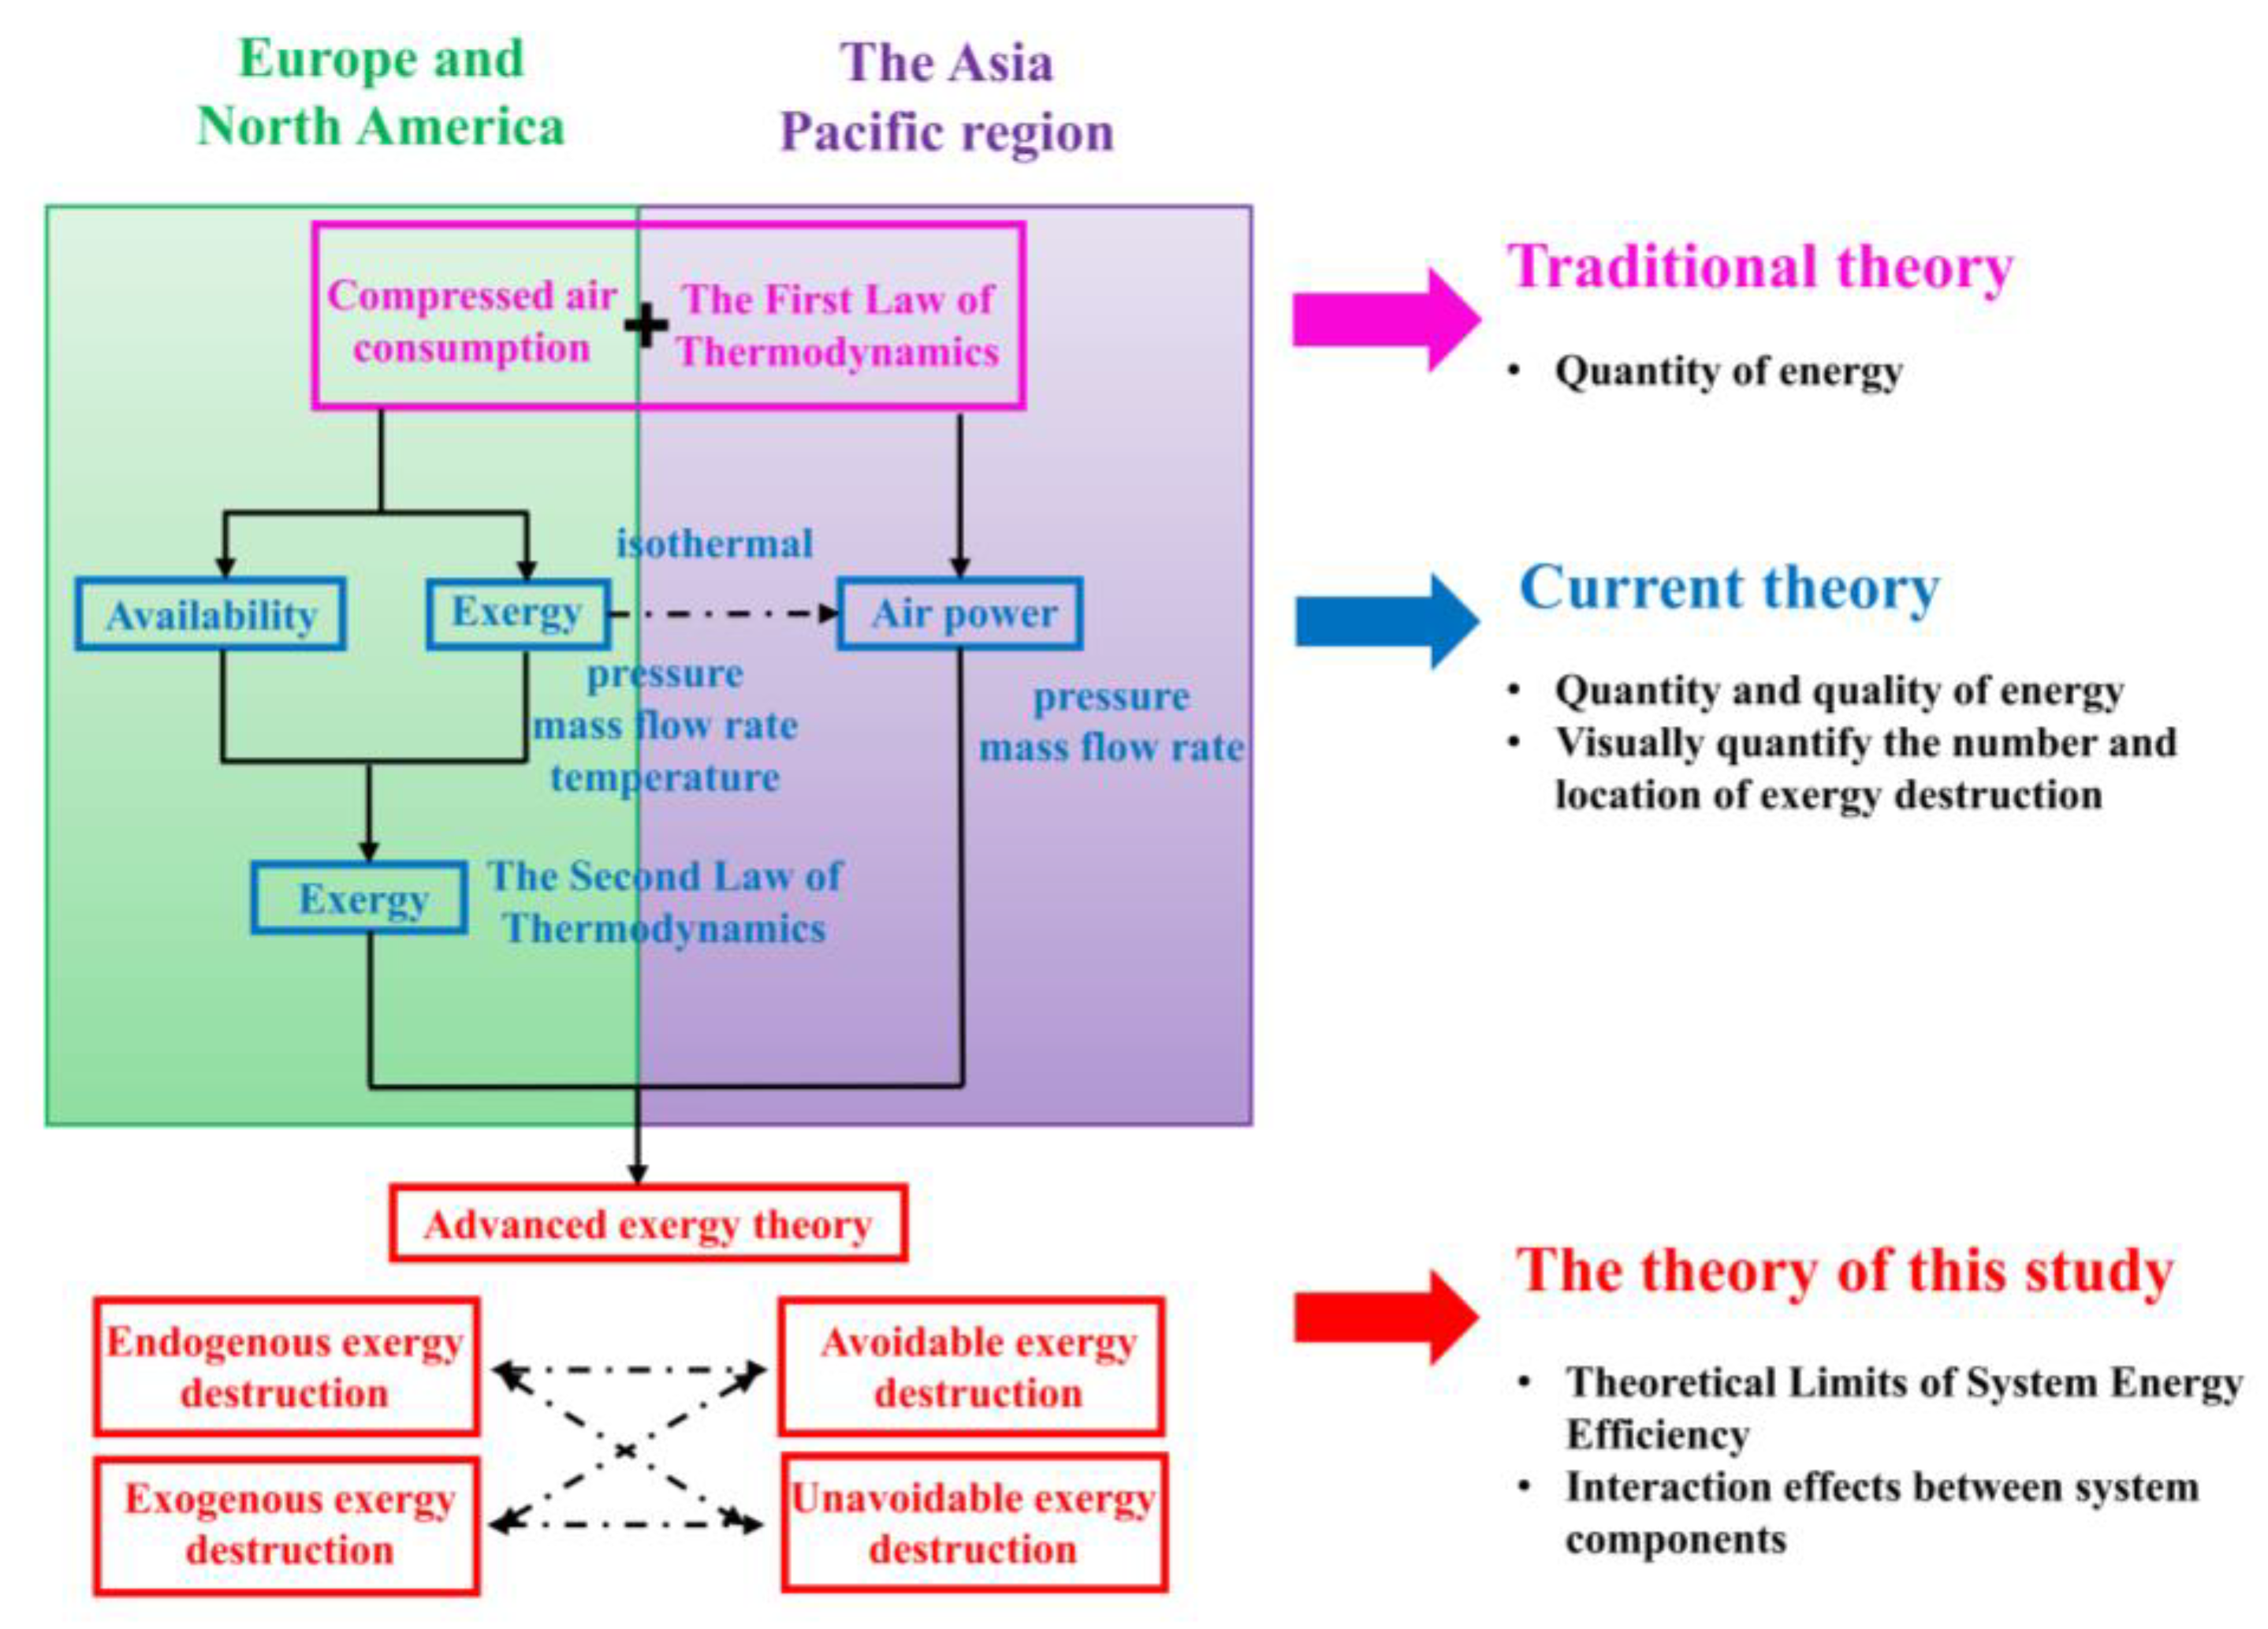
At present, although there are many studies on pneumatic energy saving, we think the fundamental theory and methods of evaluating and analyzing the energy efficiency of pneumatic systems and components are lagging and cannot satisfy the development of more elaborate energy-saving pneumatic technology. Figure 1 summarizes the development and main concepts of the basic theory for evaluating and analyzing energy efficiency in pneumatic systems. The most conventional theory and methods are established based on calculating and auditing compressed air consumption and applying the First Law of Thermodynamics, which emphasizes enthalpy and internal energy. However, as we all know, this approach can only provide a rough estimation of energy quantity and overlooks the quality differences among different forms of energy. Despite its limitations, this method is still extensively used in various industries due to its simplicity and effectiveness. As pneumatic energy-saving technology progressed, more precise theories are needed. In Europe and North America, the availability and exergy of compressed air based on the Second Law of Thermodynamics are widely accepted and investigated by giving more consideration to the quality of energy. In the Asian Pacific region, the concept of air power was proposed by Cai and Kagawa based on the exergy theory [16,17,18]. Air power is the mechanical/pressure exergy while neglecting the thermal exergy of compressed air. The exergy covers a broader scope with a comprehensive consideration of pressure, mass flow rate, and temperature of compressed air. However, the expression and calculation of air power are simpler and more convenient, primarily taking pressure and mass flow rate into account while ignoring temperature effects. Most recent studies on pneumatic energy-saving technologies accept exergy and air power [19,20,21,22]. Compared to the traditional methods based on compressed air consumption and the First Law of Thermodynamics, the current methods based on exergy and air power consider both quantity and quality of energy. This enables an intuitive quantification of energy loss and its location, thereby significantly promoting the development of energy-saving applications in pneumatic systems. Nevertheless, in pneumatic systems, the interaction effects between components and their impacts on system energy efficiency cannot be directly revealed by air power and exergy. Furthermore, the theoretical limits of pneumatic system energy efficiency and the relationship between local and global optima remain unquantified. The introduction of advanced exergy analysis could be an enabler to overcome these limitations. By conducting detailed calculations on the four sections of exergy destruction (unavoidable, avoidable, endogenous, and exogenous), advanced exergy analysis could facilitate the optimized design and operational potential for energy conversion systems.
Advanced exergy analysis is a powerful tool for revealing, quantifying, and improving the energy performance of energy systems. It has been widely used and investigated in various fields. Szablowski and Morosuk [23] applied advanced exergy analysis to evaluate a particular case of an adiabatic underwater energy storage system. It revealed the interaction effect between system components and the potential for improving the system performance from both the component level and the system level. The round-trip efficiency of this system was 64.1% and 87.9% for real and unavoidable operation conditions, respectively. Tian et al. [24] designed a recuperative organic Rankine cycle with a three-fluid condenser and conducted both conventional and advanced exergy analyses. The results indicated that the condenser, which accounted for 62.6% of total exergy destruction, should be the priority of optimization from the perspective of conventional exergy analysis, while the advanced exergy analysis prioritized the improvement of the expander, and the avoidable endogenous exergy destruction rate of the expander was up to 54.0%. Zhong et al. [25] analyzed the experimental thermodynamic performance of a novel 100 kW wind-to-heat system. Conventional exergy analysis attributed the wind turbine accounted for most of the system’s total exergy destruction at high wind speeds, whereas advanced exergy analysis suggested that an average of 87.32% of exergy destruction in the compressor was endogenous and avoidable. Exergy destruction could be decreased by optimizing the internal structure parameters. Anvari et al. [26] conducted conventional and advanced exergy analyses on a tri-generation cycle for heat, cold, and power production. The air pre-heater was given a higher improvement priority compared to the heat recovery steam generator in advanced exergy analysis, whereas this distinction was not evident in conventional exergy analysis. Currently, advanced exergy analysis has been developed into advanced exergy economic analysis and advanced exergy environmental analysis, making significant contributions to the advancement of various fields [27,28,29]. Overall, previous studies have demonstrated that advanced exergy analysis generally reveals more profound insights, such as the details of energy loss in energy systems and the interactions among system components. The advanced exergy analysis provides a more comprehensive explanation for certain one-sided and even incorrect conclusions that may be derived from conventional exergy analysis.
In summary, there have been numerous cases where exergy analysis has been applied to analyze and optimize the energy performance of various systems. The industrial pneumatic system is also a typical energy system that faces energy efficiency challenges. However, the application of advanced exergy analysis to pneumatic systems is still lacking. There is still a gap in understanding the real improvement potential, understanding the interaction effects between pneumatic components, and determining the theoretical limits of energy efficiency in pneumatic systems. The advanced exergy analysis is expected to be a promising solution. Therefore, this study aims to conduct advanced exergy analysis on a simple but typical industrial pneumatic system. Possible interactions between system components and their improvement potential are revealed. Furthermore, we explore the theoretical limits of energy efficiency of the pneumatic system. We hope this study could provide valuable ideas for future elaborate energy saving in pneumatic systems. The structure of this study is as follows. Section 2 establishes a mathematical model of a typical pneumatic system under different operating conditions. Section 3 provides an overview of the relevant theoretical concepts of conventional and advanced exergy. Section 4 conducts conventional and advanced exergy analyses by adjusting system parameters, and compares the results to obtain valuable and reliable insights for pneumatic system design and optimization. Finally, conclusions are drawn in Section 5.

2. System Description and Mathematical Model

2.1. System Description

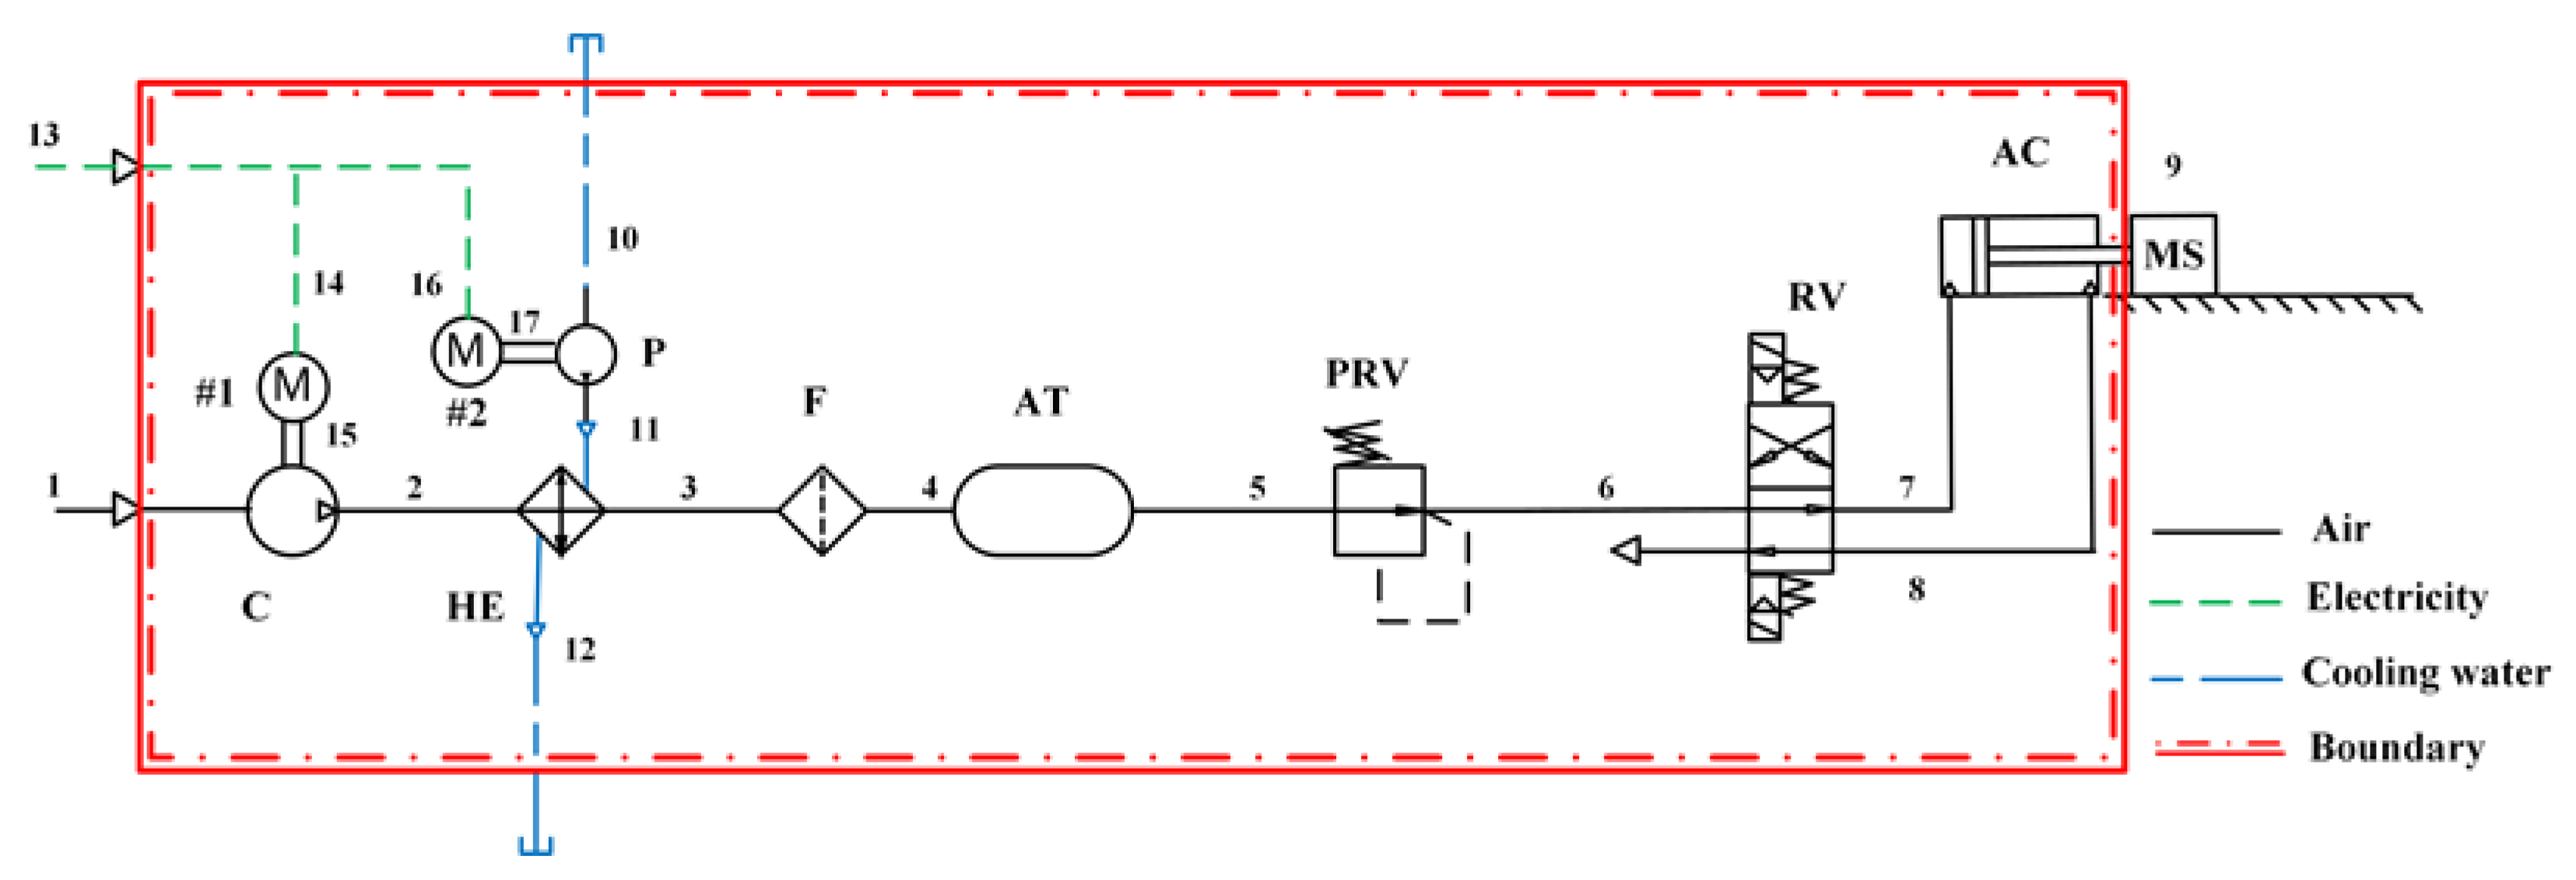
Figure 2 illustrates a typical industrial pneumatic system. The system includes an air compressor (C), water-cooled aftercooler (HE), filter (F), air storage tank (AT), pressure-reducing valve (PRV), directional control valve (DCV), pneumatic cylinder (AC), and mass load (MS). In this system, the energy input is the electric energy consumed by two electric motors (M#1 and M#2). The electric motor M#1 drives the compressor. Motor M#2 is used for pumping the cooling water in the water-cooled aftercooler. The air compressor converts mechanical energy into the energy of high-pressure and high-temperature compressed air. The water-cooled aftercooler is used for cooling the high-temperature compressed air. After the compressor and aftercooler, the compressed air passes through a filter to remove dust and impurities, thereby generating purified compressed air. The purified compressed air is stored in the air storage tank. When needed, the stored compressed air is released and regulated to the desired pressure via a pressure-reducing valve. The directional control valve controls the flow direction of the compressed air, thereby controlling the extension and retraction of the cylinder.
A mathematical model of the pneumatic system is developed for collecting detailed information at various state points. Different operating conditions, which are used in advanced exergy analysis, can be conveniently adjusted in the mathematical model. Under real operating conditions, the simple on–off control is adopted to control the electric motors (M#1 and M#2) according to the pressure of compressed air in the storage tank. When the pressure in the tank reaches the upper limit, the motors stop working. As the end-user, a pneumatic cylinder in this study consumes compressed air, the pressure in the tank decreases. The motors start to work when the pressure reaches the lower limit. Under unavoidable operating conditions, PID variable frequency control is applied to control motor M#1. The object of PID control is to keep the internal air pressure of the storage tank at a stable level. With the fluctuation of air consumption on the demand side, the deviation between the pressure of the gas storage tank and the set pressure value is calculated through the negative feedback adjustment mechanism and input into a PID controller. The PID controller outputs the control motor’s speed frequency value, which is then used to regulate the motor speed, thereby adjusting the pressure inside the gas storage tank. This control method adjusts the speed of the motor by setting the pressure value inside the air storage tank for achieving a dynamic balance between the generation and demand of compressed air. At the same time, the cylinder on the end demand side also adopts special control for achieving the best energy performance under unavoidable conditions [14,30]. The logic control algorithm is adopted to reverse the direction control valve. When a certain amount of compressed air enters the cylinder, the compressed air intake is stopped. The expansion energy of compressed air is fully utilized and the pressure of air at the end of strokes is almost near the environmental pressure instead of a traditional high pressure, that is, there is no exhaust gas discharge.

2.2. Mathematical Model

To simplify the mathematical model and facilitate advanced exergy analysis, the following basic assumptions are made:
  • Reference temperature T 0 is lower than or equal to the minimum temperature of fluids present in the system;
  • The kinetic energy and potential energy of the fluids are neglected;
  • Compressed air is regarded as the ideal gas.

2.2.1. Mass Flow Equation

The modeling of pneumatic components highly depends on understanding the physical and thermodynamic processes of compressed air. To study the flow characteristics of gases in pneumatic components, small holes and shrink nozzles are commonly used for representing throttle ports. The flow through these throttle ports can be treated as the one-dimensional isentropic flow of ideal gases. According to the Bernoulli equation, the flow velocity through throttle ports can be calculated by:
u   =   2 k k - 1 p up ρ up 1 p dn p up k   +   1 k
The mass flow rate can be determined from:
m ˙   =   A p dn 2 k k 1 1 R T up p dn p up 2 k p dn p up k   +   1 k
where A is the outlet area, k is the specific heat ratio of the ideal gas, ρ up is the density of upstream compressed gas, p up is the upstream pressure, p dn is downstream pressure, R is gas constant, and T up is the absolute temperature of the upstream compressed gas.
When the mass flow rate reaches the maximum, the critical pressure ratio can be obtained as:
p cr   =   p dn p up   =   ( 2 k   +   1 ) k k 1
With Equations (2) and (3), we can obtain the mass flow rate of gas flowing through the throttle, but the influence of flow loss is ignored. Therefore, the flow coefficient C q is introduced in the following mass flow calculation:
m ˙   =   C q A p dn ( 2 k   +   1 ) k k 1 2 k R ( k   +   1 ) T up           p cr ( 2 k   +   1 ) k k 1 C q A p dn 2 k R ( k   +   1 ) T up p dn p up 2 k p dn p up k   +   1 k     p cr > ( 2 k   +   1 ) k k 1

2.2.2. Temperature–Pressure Equation

Compressed air is the working medium in pneumatic systems, and it undergoes changes in pressure, specific volume, and temperature in the processes of energy transmission and conversion. When modeling pneumatic systems, it is crucial to consider these changes in state parameters. The first law of thermodynamics is used for deriving the change in the internal energy of compressed air:
dU dt   =   m i ˙ h i   +   dQ dt   +   dW dt
dQ dt   =   K A ex ( T 0 T )
dW dt   =   p dV dt
where U is the internal energy, h is the specific enthalpy, dQ dt is the heat change of the fluid flowing into the component from the environment, dW dt is the change in work done by the gas to the environment, dV dt is the change in volume of the control volume, K is the heat transfer coefficient, A ex is the heat exchange area, T 0 is the reference temperature, and T is the gas temperature of the gas.
For an ideal gas, the specific internal energy can also be calculated by:
u   =   c V T
where c V is the specific heat capacity at constant volume. According to Equations (5)–(8), the change in gas temperature can be obtained as:
m du dt   +   u dm dt   =   m ˙ i h i   +   dQ dt   +   dW dt
dT dt   =   1 m 1 c V m i ˙ h i dm dt T p m c V dV dt   +   1 m c V dQ dt
According to the state equation of the ideal gas, the time t is differentiated on both sides of the equation to obtain the general equation of the first-order differential equation about pressure:
V dp dt   =   p dV dt   +   mR dT dt   +   RT dm dt
For a variable volume hot pneumatic chamber, due to the constantly changing temperature of the gas itself, the internal energy per unit gas is also constantly changing, which can be expressed as:
du dt   =   c V dT dt
u   =   c V dT
In summary, the general equation of the first-order differential equation for temperature changes in variable-volume pneumatic chambers can be obtained:
dT dt   =   1 m c V m i ˙ h i dm dt × c V dT p m c V dV dt   +   1 m c V dQ dt
It is important to note that, in Equation (14), m i ˙ h i represents the sum of the enthalpy of the gas entering the component and the enthalpy of the gas exiting the component. The inflow is considered positive, while the outflow is considered negative. The flow rate, temperature, and pressure equations derived are generally applicable for modeling pneumatic components in pneumatic systems. Below, we provide a detailed introduction to mathematical models of several critical pneumatic components and devices. The main parameters are determined from the actual pneumatic components and devices in the corresponding experiment system in the laboratory.

2.2.3. Air Compressor

In the study, an ideal, commonly used small fixed displacement air compressor is modeled. It is supposed that there are no mechanical losses and the compression is a polytropic process. The isentropic efficiency is adopted to evaluate the energy performance of compressors. Only pressure and temperature changes at the inlet and outlet are considered.
Since air is considered an ideal gas with constant specific heat capacity, the final outlet temperature of compression can be determined using the polytropic process equation and the ideal gas state equation. The corresponding final outlet temperature during isentropic compression is:
T isen , out   =   T in ( p out p in ) γ 1 γ
The actual power of the air compressor is calculated by:
W ˙ actual , C   =   m ˙ R g T in ( γ 1 ) η isen p out p in γ 1 γ 1
The actual output temperature of the air compressor is:
T actual , out   =   T in 1   +   1 η isen ( p out p in γ 1 γ 1 )
The actual output mass flow rate of the air compressor is:
m ˙ actual , out   =   ρ ω V displ η isen
where γ is adiabatic index, ρ is the density of the gas, ω is the speed of the compressor shaft, and V displ is the displacement of the compressor. An isentropic efficiency of 90% is used in this study [31].

2.2.4. Water-Cooled Aftercooler

In the water-cooled aftercooler, the high temperature compressed air discharged from the compressor is cooled by cooling water. Only the pressure drop and temperature change of compressed air are considered here. The energy efficiency of the component is defined during modeling, which provides a basis for the operation of different working conditions in the advanced exergy analysis.
Effectiveness is used for evaluating the energy performance of the heat exchanger and is defined as the ratio of the actual heat transfer rate to the theoretical maximum heat transfer rate [32]:
Ω   =   Q ˙ actual Q ˙ max   =   ( m ˙ c p T ) cold   or   hot ( m ˙ c p ) min ( T hot , in T cold , in )
where m ˙ c p min refers to the smaller heat capacity between the hot fluid and the cold fluid. When ignoring the heat loss to the environment in the heat exchanger, the heat transfer rate can be calculated as follows:
Q ˙ H   =   m ˙ hot c p , hot T hot , in T hot , out   =   m ˙ cold c p , cold T cold , in T cold , out
Following Equations (19) and (20), the outlet temperatures of hot and cold fluids can be determined. The pressure drop in a heat exchanger under real conditions can be calculated. It is usually expressed by the pressure loss rate:
p loss   =   p in p out
In order to facilitate the advanced exergy analysis, the pressure loss ratio is defined as:
ξ   =   p loss p in
In the water-cooled aftercooler, a hydraulic pump is required to drive the cooling water. The power of the hydraulic pump is calculated by:
E ˙ pump   =   m ˙ water ρ water p out p in 1 η M
where η M is the mechanical efficiency of the pump.

2.2.5. Filter, Pressure-Reducing Valve, Directional Control Valve, and Air Storage Tank

Several pneumatic components mentioned in this section are simplified in mathematical modeling, similar to throttle valves, without detailed modeling of their internal structures. Mathematical models of these components are based on flow, temperature, and pressure equations. Only the changes in temperature and pressure at the inlet and outlet and the energy loss generated by the components during operation are considered to prepare for exergy analysis under different conditions.
Energy losses in the filter, pressure-reducing valve, and directional control valve are mainly caused by pressure loss. The pressure loss can be represented by the coefficient of restitution of total pressure [33]:
p loss   =   ( 1 a ) p in
where a is the total pressure recovery coefficient. Due to the working characteristics of the pressure-reducing valve, the outlet pressure fluctuates with the fluctuating air demands. Here, a new parameter called the pressure stabilizing rate is introduced and is calculated with:
λ   =   p set p min p set
where p set is the set pressure of the pressure-reducing valve and p min is the minimum pressure caused by fluctuations.
An air storage tank is a gas storage container with a fixed volume and plays the role of buffering and stabilizing. Although the air storage tank appears to have almost no energy loss, it plays an important role in energy consumption in the entire pneumatic system. This is due to their different working properties in different systems. The exergy analysis section of the study provides clear explanations and proves to support this assertion. In addition, the energy loss of the tank resulting from the heat exchange is calculated using the temperature–pressure equations in this study.

2.2.6. Pneumatic Cylinder

A single-rod, double-acting cylinder is selected as the actuator in this system, and a mass block is a load. The pressure and temperature changes of rod chamber and rodless chamber are only considered in this study, as well as some simple dynamic characteristics of the cylinder.
When modeling the pneumatic cylinder, it is very important to consider its motion characteristics. The equation of motion of the cylinder model is:
m d 2 x dt   =   ( p 1 A 1 p 2 A 2 ) mg sin α F m
where p 1 and p 2 are the pressure of compressed air in the rodless chamber and the rod chamber, respectively, A 1 and A 2 represent the effective areas of two sides of the piston, m represents the load mass, α is the angle with the horizontal direction, and F m is the friction force (including the frictions overcome by the cylinder and the mass load). In this study, the cylinder is positioned horizontally, resulting in an angle α of 0. Furthermore, for the mass load, only the friction work is considered. To maximize the utilization of energy output from the cylinder, the mass of mass block is directly adjusted in the model. The heat transfer is not considered when modeling the pneumatic cylinder. The pressure calculations for both the rodless and rod chambers of the cylinder are shown in the following equations. The detailed derivation can be found in [34].
Pressure of compressed air in the rodless chamber:
d p 1 dt   =   kR T s m ˙ 1 V 1 k p 1 V 1 dV 1 dt
V 1   =   A 1 x   +   V 0 , rodless
Pressure of compressed air in the rod chamber:
d p 2 dt   =   kR T 2 m ˙ 2 V 2 k p 2 V 2 dV 2 dt
V 2   =   A 2 ( L x )   +   V 0 , rod
where V 1 and V 2 represent the volume of the rodless cavity and the volume of the rod cavity, respectively, x represents the piston displacement, V 0 , rodless and V 0 , rod represent the initial volume of the rodless chamber and the initial volume of the rod chamber, respectively, and L represents the stroke of the cylinder.
The cylinder has an initial pressure difference. The initial pressure of the rod cavity is p 0 and the initial temperature is T 0 . According to the state parameter relationship of the isentropic process, the following equation must be met:
T 2   =   T 0 ( p 2 p 0 ) k 1 k
where T 2 is the temperature of the rod cavity and T s is the temperature of the gas source. Table 1 presents the assumed parameters of the pneumatic system under real, unavoidable, and ideal conditions used in the following exergy analyses, while Table A1 shows the reference values of the pneumatic system.

3. Exergy Analysis

Exergy is the work potential of a system in a specified environment and represents the maximum amount of useful work that can be obtained as the system is brought to equilibrium with the environment [40]. The total exergy of compressed air can be calculated by:
E ˙ x   =   E ˙ x PH   +   E ˙ x KN   +   E ˙ x PT   +   E ˙ x CH
where E ˙ x PH , E ˙ x KN , E ˙ x PT , and E ˙ x CH are the physical exergy, kinetic exergy, potential exergy, and chemical exergy, respectively.
Generally, there are no significant changes in the height of compressed air and no chemical reactions. The kinetic energy of compressed air is not evident for most pneumatic components. Therefore, the potential exergy, chemical exergy, and kinetic exergy could be ignored in this study. Thus, the Equation (32) can be simplified as:
E ˙ x   =   E ˙ x PH = m ˙ e x
The specific exergy of compressed air can be calculated by:
e x   =   h h 0 T 0 s s 0
When compressed air is regarded as an ideal gas, the sum of its temperature and pressure exergy can be calculated by:
E ˙ x , T   =   m ˙ c p T T 0 T 0 ln T T 0
E ˙ x , P   =   m ˙ T 0 R g ln P P 0
E ˙ x   =   E ˙ x , T   +   E ˙ x , P   =   m ˙ e x   =   m ˙ c p T T 0 T 0 ln T T 0   +   T 0 R g ln P P 0
where m ˙ is the mass flow rate of compressed air, e x is the specific exergy, c p represents the constant pressure specific heat capacity of the compressed air, and E ˙ x , T and E ˙ x , P represent the temperature exergy and pressure exergy, respectively. In this study, the total exergy of an ideal gas is the sum of temperature exergy and pressure exergy. From Equations (35) and (36), it can be seen that the temperature exergy and pressure exergy are determined by the temperature and pressure of the state point, respectively.

3.1. Conventional Exergy Analysis

Typically, there are two distinct approaches to define exergy efficiency, i.e., the “input–output” approach and the “fuel-product” approach. In this study, exergy efficiency is defined using the “fuel-product” approach, as it offers a better understanding of the potential for improving exergy efficiency [41].
In a system, the establishment of the exergy equilibrium equation is the foundation of analysis. For the K-th component, the exergy equilibrium equation is:
E ˙ x F , K   =   E ˙ x P , K   +   E ˙ x D , K
The exergy efficiency of the K-th component is:
ε K   =   E ˙ x P , K E ˙ x F , K × 100 %   =   1 E ˙ x D , K E ˙ x F , K × 100 %
The exergy destruction ratio of the K-th component is:
y D , K   =   E ˙ x D , K E ˙ x F , K
The relative exergy destruction of the K-th component is:
x K   =   E ˙ x D , K E ˙ D
For better understanding the improvement potential of a component, a new variable is defined as [42]:
E ˙ x D , K RU   =   E ˙ x D , K Real E ˙ x D , K Unavoidable
For this variable, the larger it is, the greater the potential for improvement of the component. Table 2 shows the definitions of fuel exergy and product exergy of various pneumatic components.

3.2. Advanced Exergy Analysis

Through conventional exergy analysis of the system, it is possible to determine the exergy destruction incurred by each component. To reveal the interactions between various components and identify potential approaches for improving the energy efficiency of the whole system, advanced exergy analysis is conducted. The exergy destruction is decomposed and analyzed in detail. Consequently, two decomposition methods are employed for analyzing the exergy destruction rate of the K-th component:
E ˙ x D , K   =   E ˙ x D , K EN   +   E ˙ x D , K EX
E ˙ x D , K   =   E ˙ x D , K AV   +   E ˙ x D , K UN
where E ˙ x D , K EN represents the endogenous exergy destruction rate of the K-th component. The endogenous exergy destruction is the destruction caused by the internal irreversible process of the K-th component when all other components operate under ideal conditions and the K-th component operates under the actual/real condition. E ˙ x D , K EX is the exogenous exergy destruction rate of the K-th component. The exogenous exergy destruction is caused by the irreversible process of other components in the system except for the K-th component. E ˙ x D , K AV refers to the avoidable exergy destruction rate that can be avoided through optimization. E ˙ x D , K UN is the unavoidable exergy destruction rate of the K-th component. The unavoidable exergy destruction refers to the part of the exergy destruction that cannot be avoided due to material, technology, manufacturing methods, or cost limitations. As long as the component is used in the system, unavoidable exergy destruction will always exist. In a system, by comparing endogenous and exogenous exergy destruction, the degree of interaction between the K-th component and other components can be obtained. By comparing avoidable and unavoidable parts, the real potential for improving system and component performance can be obtained.
Based on the above decomposition of exergy destruction, advanced exergy theory combines avoidable/unavoidable concepts with endogenous/exogenous concepts to obtain a more detailed classification [43]:
E ˙ x D , K EN   =   E ˙ x D , K EN , AV   +   E ˙ x D , K EN , UN
E ˙ x D , K EX   =   E ˙ x D , K EX , AV   +   E ˙ x D , K EX , UN
E ˙ x D , K AV   =   E ˙ x D , K EX , AV   +   E ˙ x D , K EN , AV
E ˙ x D , K UN   =   E ˙ x D , K EX , UN   +   E ˙ x D , K EN , UN
By using the above Equations (45)–(48), it can be deduced that:
E ˙ x D , K   =   E ˙ x D , K EN , AV   +   E ˙ x D , K EN , UN   +   E ˙ x D , K EX , AV   +   E ˙ x D , K EX , UN
where E ˙ x D , K EN , AV is the endogenous avoidable exergy destruction rate, which can be avoided by improving the performance of the K-th component itself, E ˙ x D , K EN , UN is the endogenous unavoidable exergy destruction rate, which cannot be reduced even if the K-th component operates at its maximal attainable efficiency while all other components operate in an ideal way, E ˙ x D , K EX , AV is the exogenous avoidable exergy destruction rate, which can be reduced by improving the performance of other components in the system, and E ˙ x D , K EX , UN is the exogenous unavoidable exergy destruction rate, which cannot be avoided even if other components of the system are working in their optimal state.
In advanced exergy analysis, it is essential to determine the endogenous avoidable, endogenous unavoidable, exogenous avoidable, and exogenous unavoidable exergy destruction rate. Various methods have been developed with the development of advanced exergy analysis, including the thermodynamic cycle method, engineering method, exergy balance method, equivalent component method, and structural theory method [44,45,46]. By comparing these methods, it can be found that the engineering method is suitable for practical engineering situations and a significant amount of data are required. The exergy balance method is more suitable for complex systems. The energy and mass of each ideal component may not reach equilibrium by idealizing the system, so it is necessary to fabricate a mass flow rate to achieve equilibrium. The principle of the equivalent component method involves approximating the studied component with another component that is easier to analyze. The structural theory method is only applicable to theoretical systems. Each component is analyzed independently of the system, resulting in a significant discrepancy in energy conversion compared to actual scenarios. Among these methods, the thermodynamic cycle method is the simplest and yields the best system results achievable through the definition of different thermodynamic cycles. Thus, the thermodynamic cycle method is adopted in this study. Within the thermodynamic cycle method, it is necessary to define three types of thermodynamic cycles: the real thermodynamic cycle, the unavoidable thermodynamic cycle, and the hybrid thermodynamic cycle. The real thermodynamic cycle represents all components under real irreversible working conditions. The unavoidable thermodynamic cycle indicates that all components operate under unavoidable operating conditions, which correspond to the possible optimal operating condition. The hybrid cycle involves some components operating under real conditions, while others operate under ideal working conditions. Component assumptions for the real, unavoidable, and ideal conditions corresponding to these three cycles are presented in Table 1. By comparing the results of the real thermodynamic cycle with those of the unavoidable thermodynamic cycle, both avoidable and unavoidable exergy destruction can be obtained. Similarly, by comparing the real thermodynamic cycle with the hybrid cycle, endogenous and exogenous exergy destruction can be determined.
The unavoidable, avoidable, and endogenous unavoidable exergy destruction rate of the K-th component can be calculated by:
E ˙ x D , K UN   =   E ˙ x P , K Real ( E ˙ x D , K E ˙ x P , K ) UN
E ˙ x D , K EN   =   E ˙ x P , K Real ( E ˙ x D , K E ˙ x P , K ) EN
E ˙ x D , K EN , UN   =   E ˙ x P , K EN ( E ˙ x D , K E ˙ x P , K ) UN
where ( E ˙ x D , K E ˙ x P , K ) UN is the unavoidable index, which is the ratio of exergy destruction rate to product exergy in the unavoidable thermodynamic cycle, and ( E ˙ x D , K E ˙ x P , K ) EN is the ratio of exergy destruction rate to product exergy in a hybrid thermodynamic cycle.
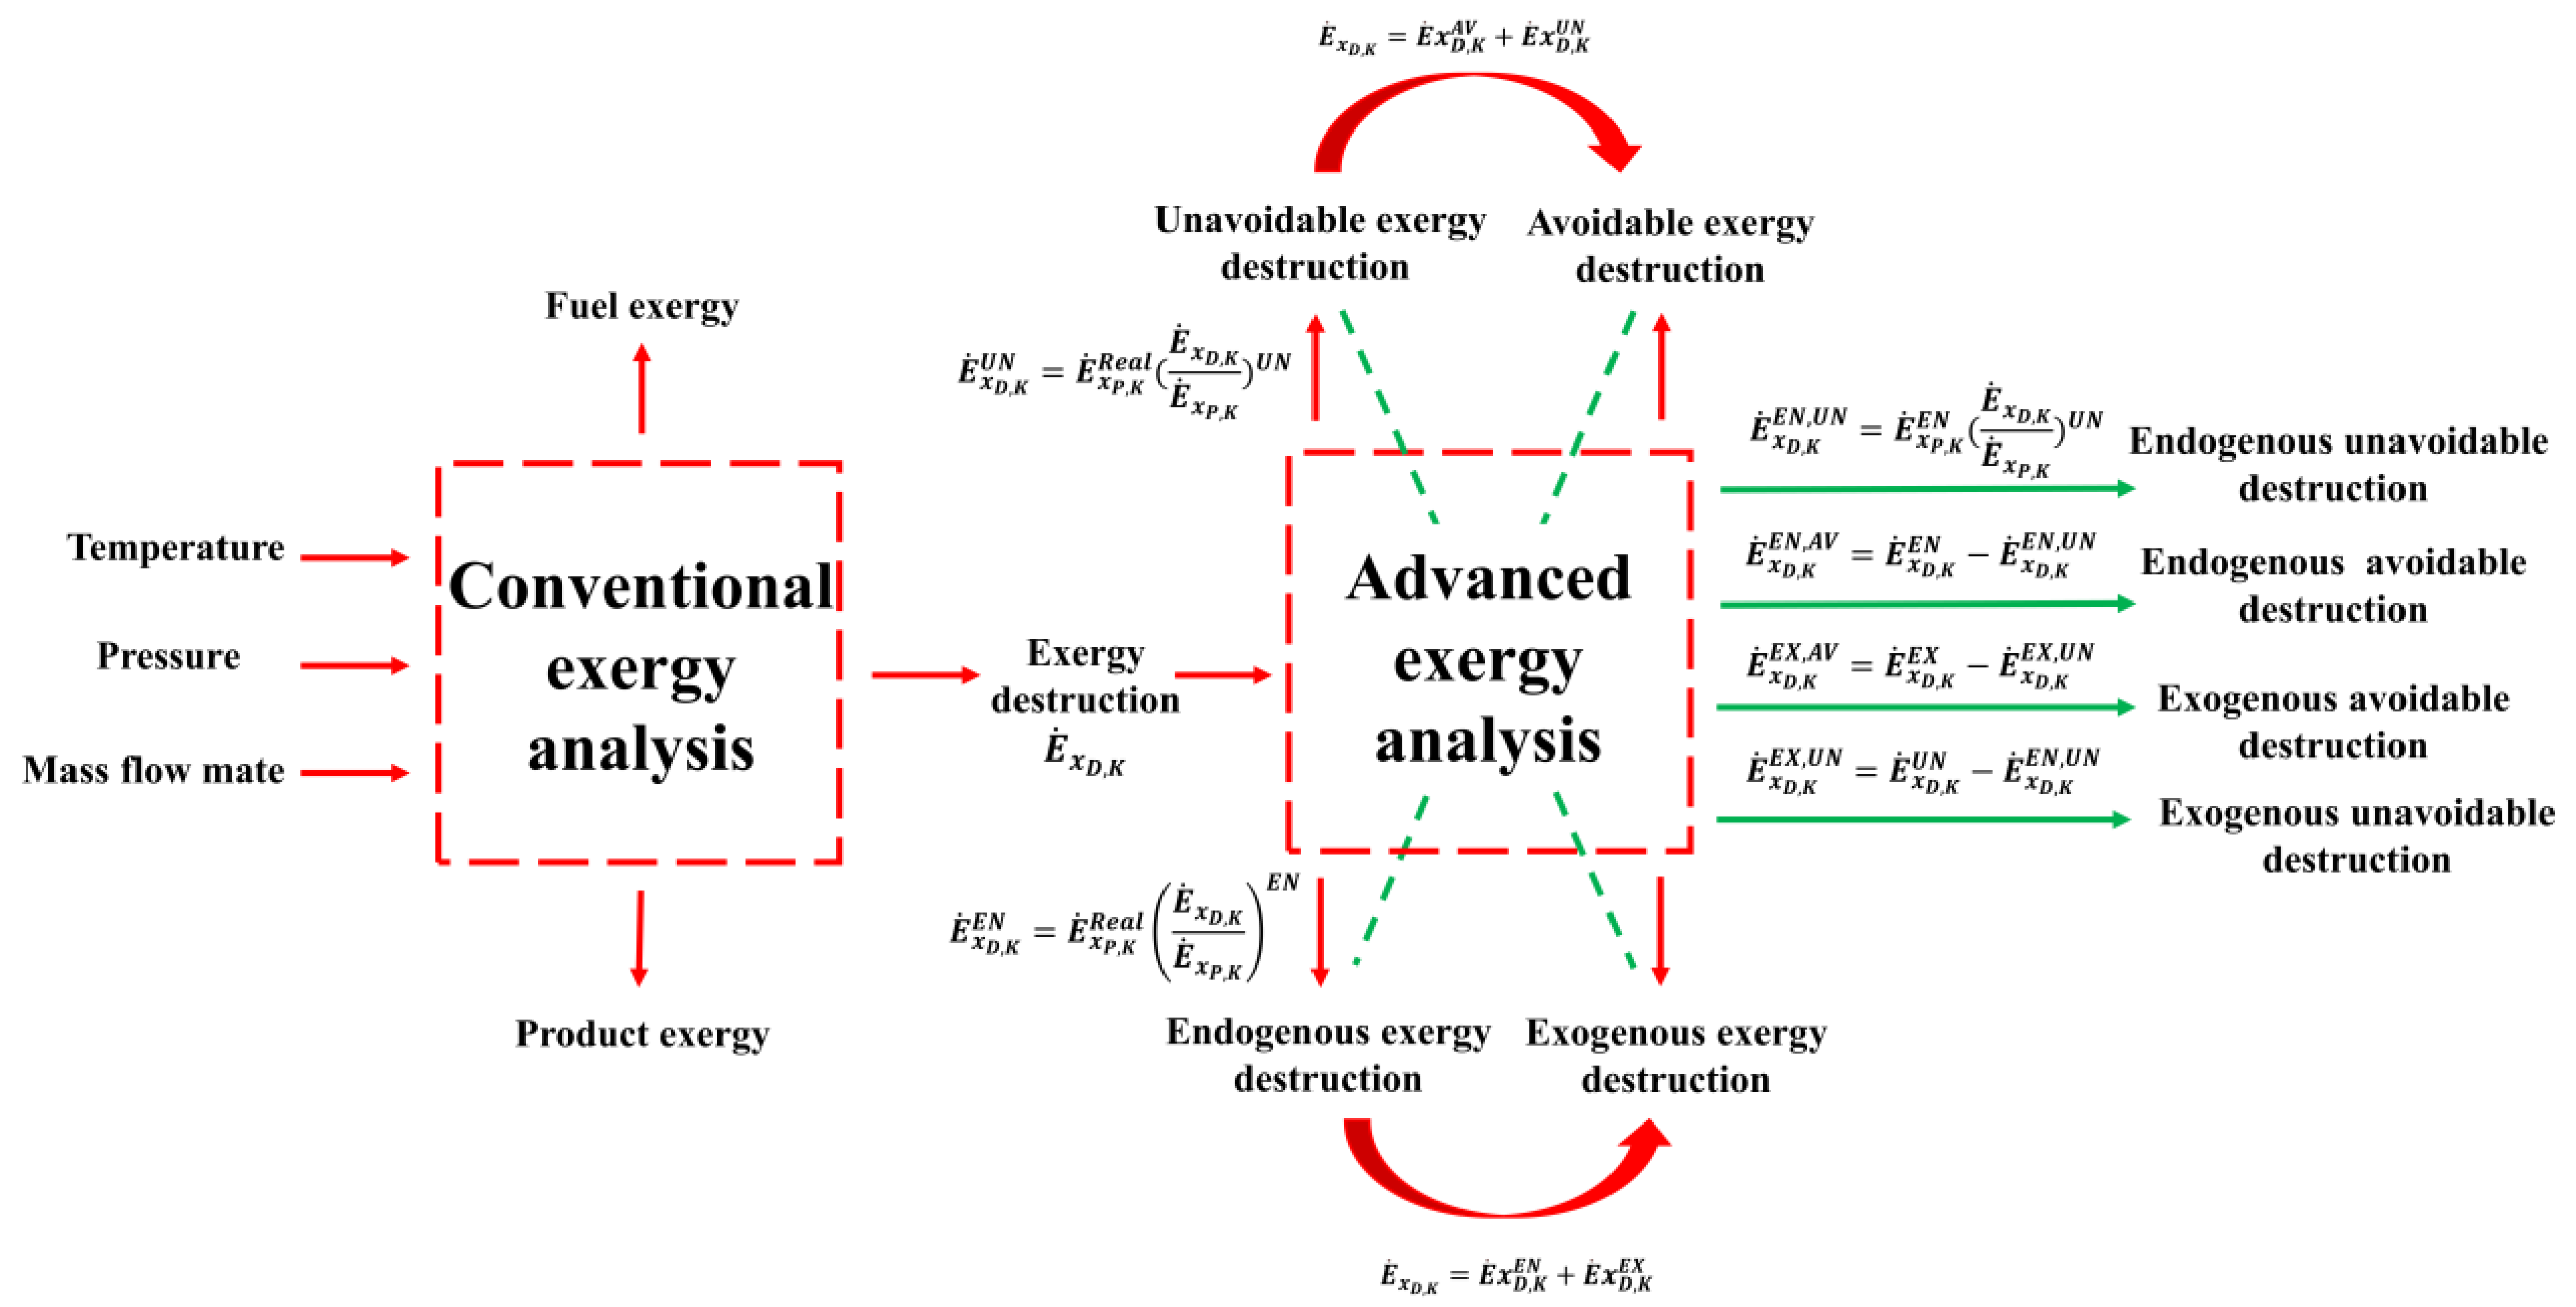
After conducting the conventional and advanced exergy analyses, it can be observed that assuming a constant input energy flow rate E ˙ x F , tot   =   constant or a constant output energy flow rate E ˙ x P , tot   =   constant results in the same results when analyzing the unavoidable/avoidable parts. This is because each component is considered separately. However, this assumption is important for endogenous/exogenous parts analysis. This is because a component’s assumption is changed, and the energy conversion of the system needs to be carried out again. At the same time, the choice of assumption also affects the endogenous exergy destruction. Keeping E ˙ x F , tot   =   constant or E ˙ x P , tot   =   constant can yield different results [43]. Considering the dynamic characteristics of the pneumatic system, this study chooses to maintain E ˙ x F , tot   =   constant while simulating for 600 s. In simulations, all components reach a stable working condition, and the product and fuel exergy of each component are integrated. It should be mentioned that, while analyzing the air storage tank, only accumulative exergy analysis for the period from the 250 s to 600 s after achieving stability was conducted. This is due to the unique working nature of the air storage tank within this system. The relationships between the different exergy destruction rates mentioned above are organized and illustrated in Figure 3.
4. Results and Discussion

The established mathematical models are simulated with the assumed parameters shown in Table 1. Temperature, pressure, and mass flow data are collected at the state points shown in Figure 2. The fuel exergy, product exergy, and exergy efficiency of different components are calculated simultaneously. In advanced exergy analysis, the data under different working conditions are visualized by the thermodynamic cycle method and analyzed in detail in this section. It is worth noting that the following analysis is based on the accumulated exergy of each state point, and it is obtained by integrating the transient exergy:
E x   =   E ˙ x dt

4.1. Results of Conventional Exergy Analysis

Through simulation and analysis of the real and unavoidable conditions, the accumulated exergy at different state points under these two conditions are obtained, as presented in Table A2 and Table A3. By calculating the total exergy efficiency of the pneumatic system under two conditions, it is determined that the proposed system achieves an exergy efficiency of 17.3% under the real condition. However, under the unavoidable condition, the theoretical maximum exergy efficiency could reach 70.5%. These results indicate that there is a significant improvement potential in the energy performance of the investigated pneumatic system.
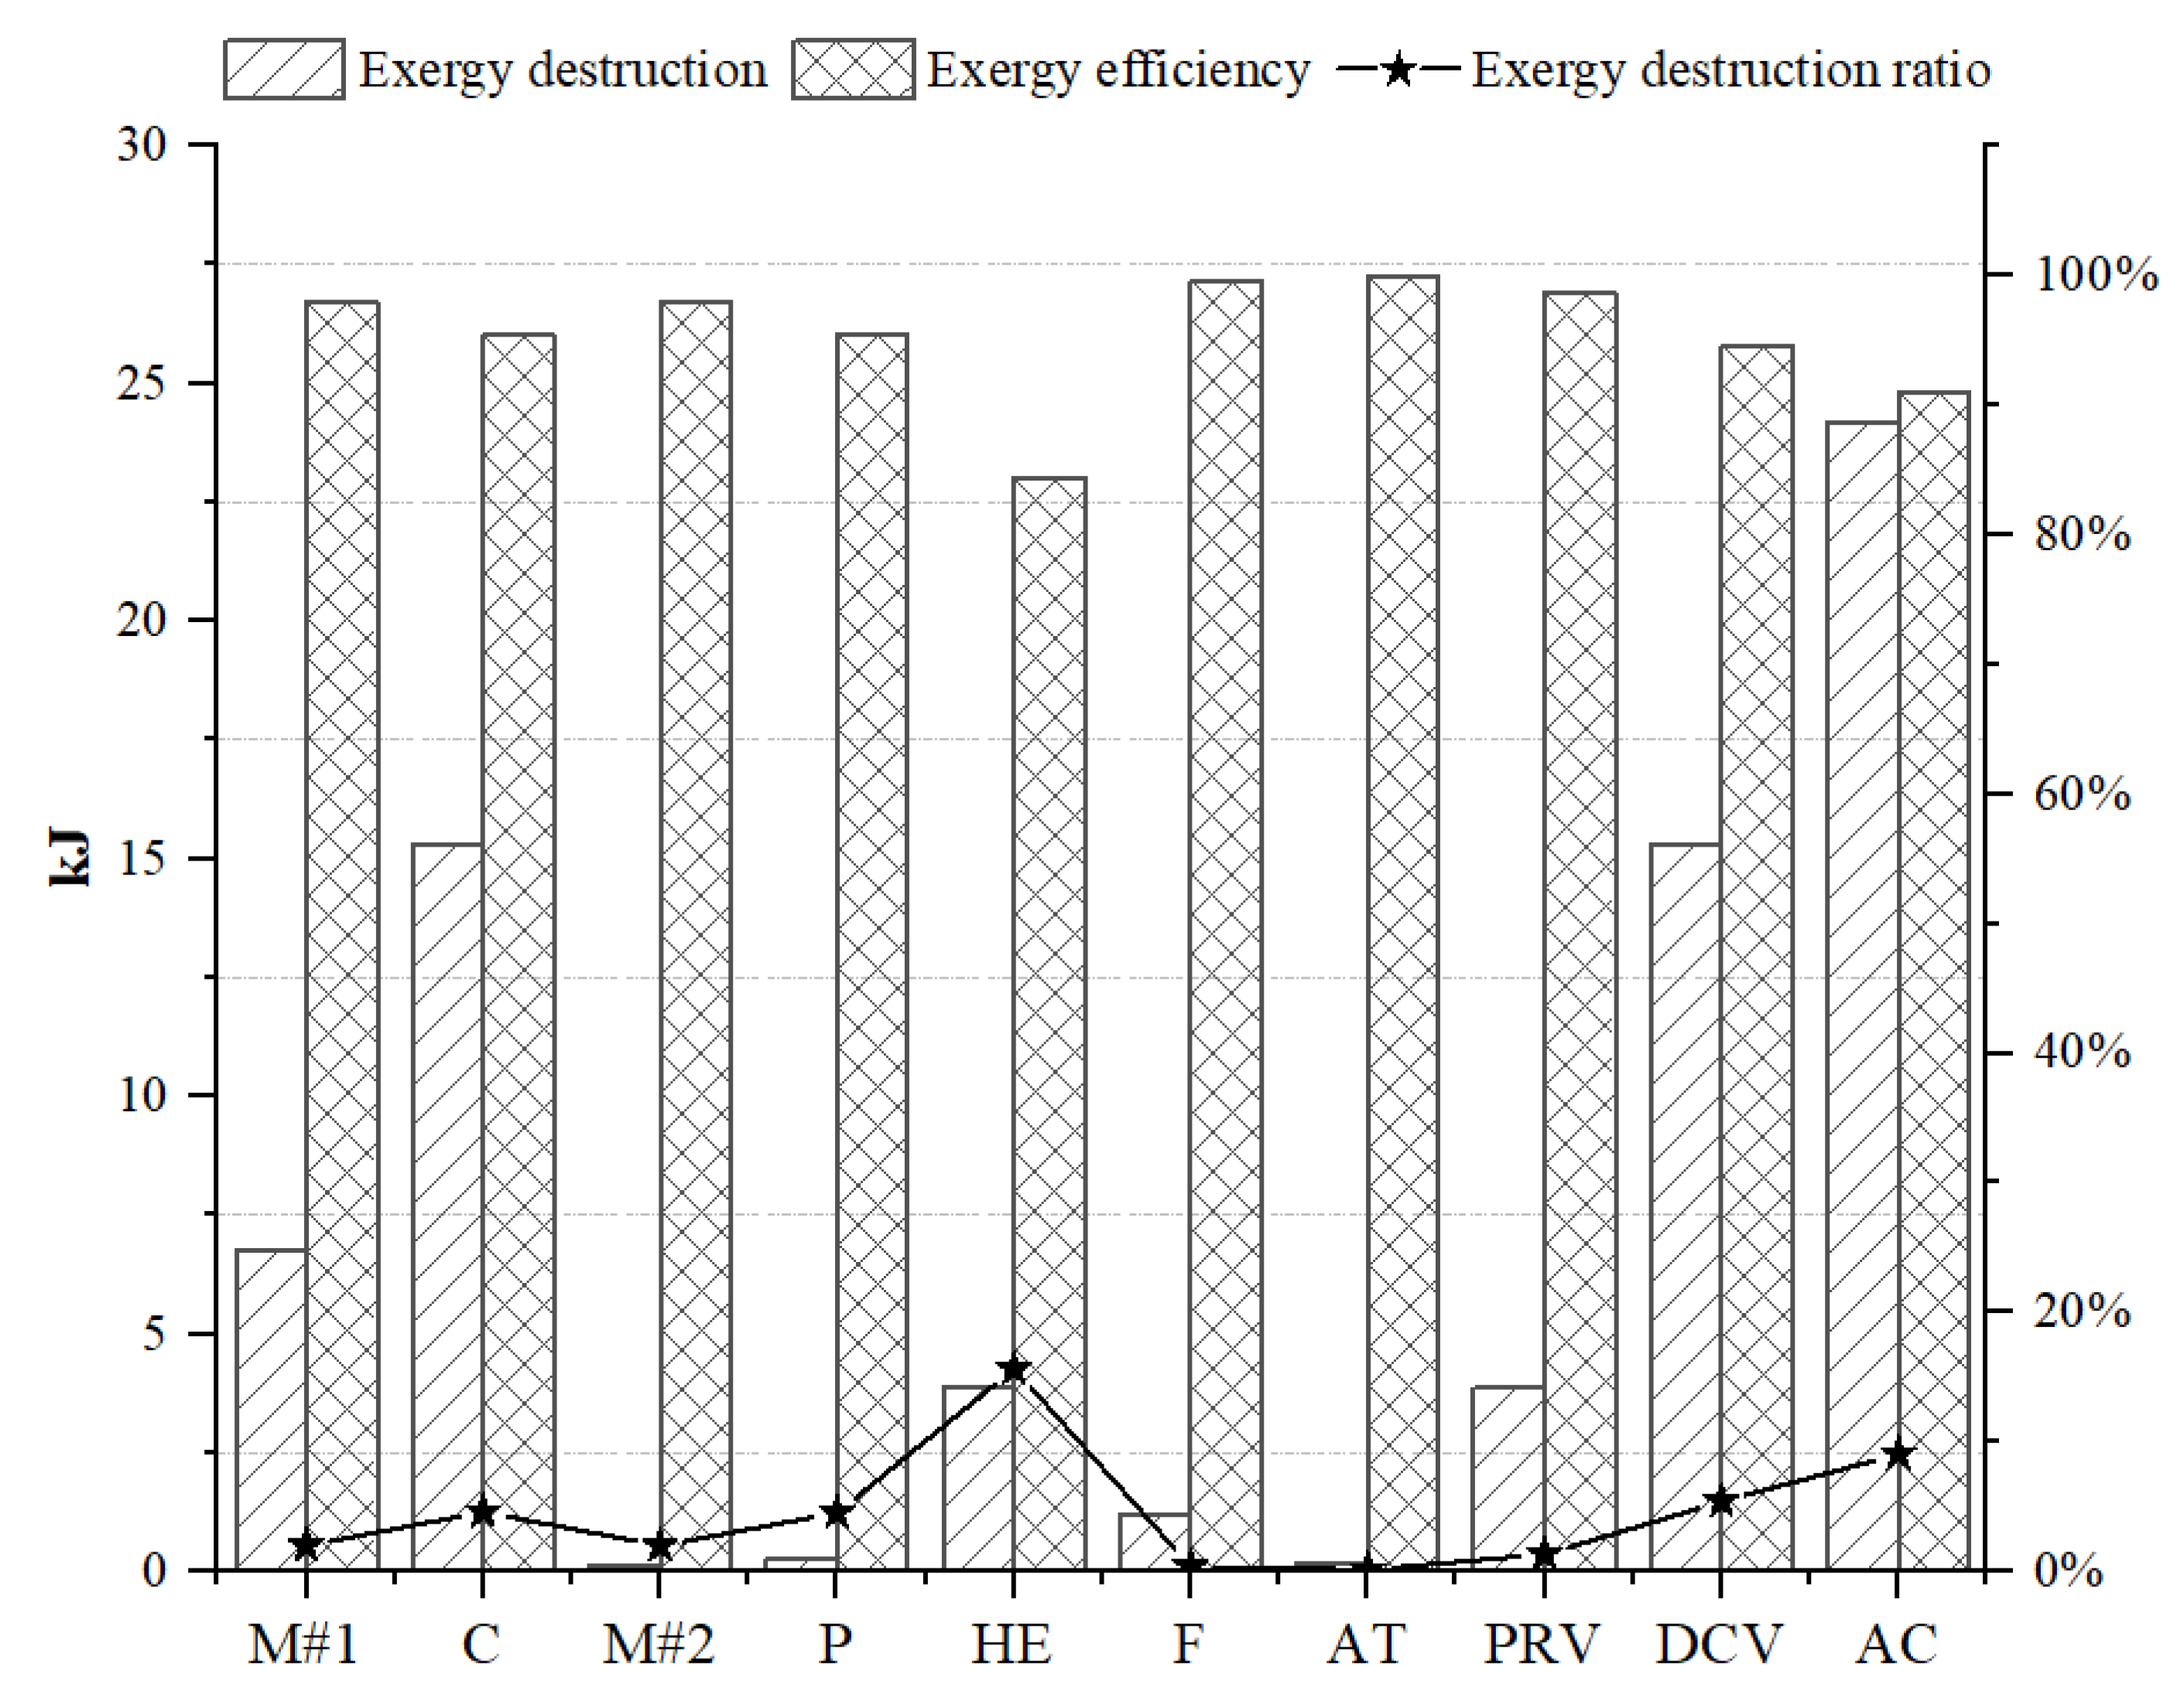
Figure 4 illustrates the accumulated exergy destruction, exergy efficiency, and exergy destruction ratio of different components/processes in the proposed pneumatic system under real conditions. Notably, the cylinder (AC) presents the highest accumulated exergy destruction with a value of 136.92 kJ, followed by the pressure-reducing valve (PRV) with 67.80 kJ. The cylinder, as an actuator, experiences the most significant exergy destruction in this pneumatic system due to the inefficient utilization of incoming exergy of compressed air. A considerable amount of exergy is discharged into the atmospheric environment with the exhaust air. Consequently, there is a growing focus on exhaust gas recovery and reuse, or maximizing exergy utilization in terms of energy saving of pneumatic cylinders. The high exergy destruction of the pressure-reducing valve is attributed to its inherent working characteristics. It is responsible for reducing the pressure of the upstream air to meet the required pressure of downstream components. Therefore, it is essential to establish a reasonable pressure distribution across various system parts in advance to minimize such losses. Furthermore, it is evident from Figure 4 that components such as the electric motors (M#1 and M#2), compressor (C), pump (P), filter (F), and directional valve (DCV) present a high exergy efficiency, i.e., higher than 85%. However, except for the filter, these components also exhibit relatively high exergy destruction ratios surpassing 5%. The cylinder (AC) possesses the lowest exergy efficiency with a value of 43.18%, followed by the water-cooled aftercooler (HE) with a value of 59.85%. The cylinder, unsurprisingly, also continues to show the highest exergy destruction ratio at 56.83%, followed by the water-cooled aftercooler at 40.15%. The high-temperature and high-pressure compressed air, as the fuel exergy carrier, experiences significant temperature and pressure, decreases after passing through the water-cooled aftercooler. On the other hand, the cooling water, as the product exergy carrier, does not experience significant pressure changes and presents small temperature fluctuations. Therefore, lower exergy efficiency and higher exergy destruction ratios are obtained in the water-cooled aftercooler. Figure 5 presents the accumulated exergy destruction, exergy efficiency, and exergy destruction ratio of different components/processes in the investigated pneumatic system under unavoidable conditions. When compared with Figure 4, it can be found that the exergy destruction and exergy destruction ratio of each component are notably lower than those under unavoidable conditions, while the exergy efficiency is higher. Therefore, we can identify the components that could significantly contribute to improving the energy performance of the pneumatic system. Specifically, the pneumatic cylinder (AC) and water-cooled aftercooler (HE) exhibit substantial exergy efficiency improvements with increases of 47.75% and 24.50%, respectively. However, the exergy destruction ratio of the water-cooled aftercooler becomes the highest under the unavoidable condition. The exergy destruction of the cylinder (AC) and pressure-reducing valve (PRV) decreases by 112.73 kJ and 63.94 kJ, respectively. Nonetheless, the cylinder remains the most significant exergy destruction component in the system, followed by the directional control valve (DCV) and compressor (C). It is worth noting that the unexpected significant exergy destruction is caused by the directional control valve. This is caused by the temperature change at the inlet and outlet of the directional control valve. When the system reaches stability, the temperature changes very little before the compressed air enters the directional control valve. However, at the outlet of the directional control valve, the compressed air exchanges heat with the environment due to the valve reversing, and it changes periodically with the valve reversing frequency, resulting in exergy loss. In summary, whether under real or unavoidable conditions, the quantitative data clearly indicate that the cylinder plays a crucial role in the improvement of energy performance. Improving its exergy efficiency and reducing exergy destruction should be a priority in enhancing the overall system performance if without significantly changing the layout and configuration of the investigated pneumatic system.
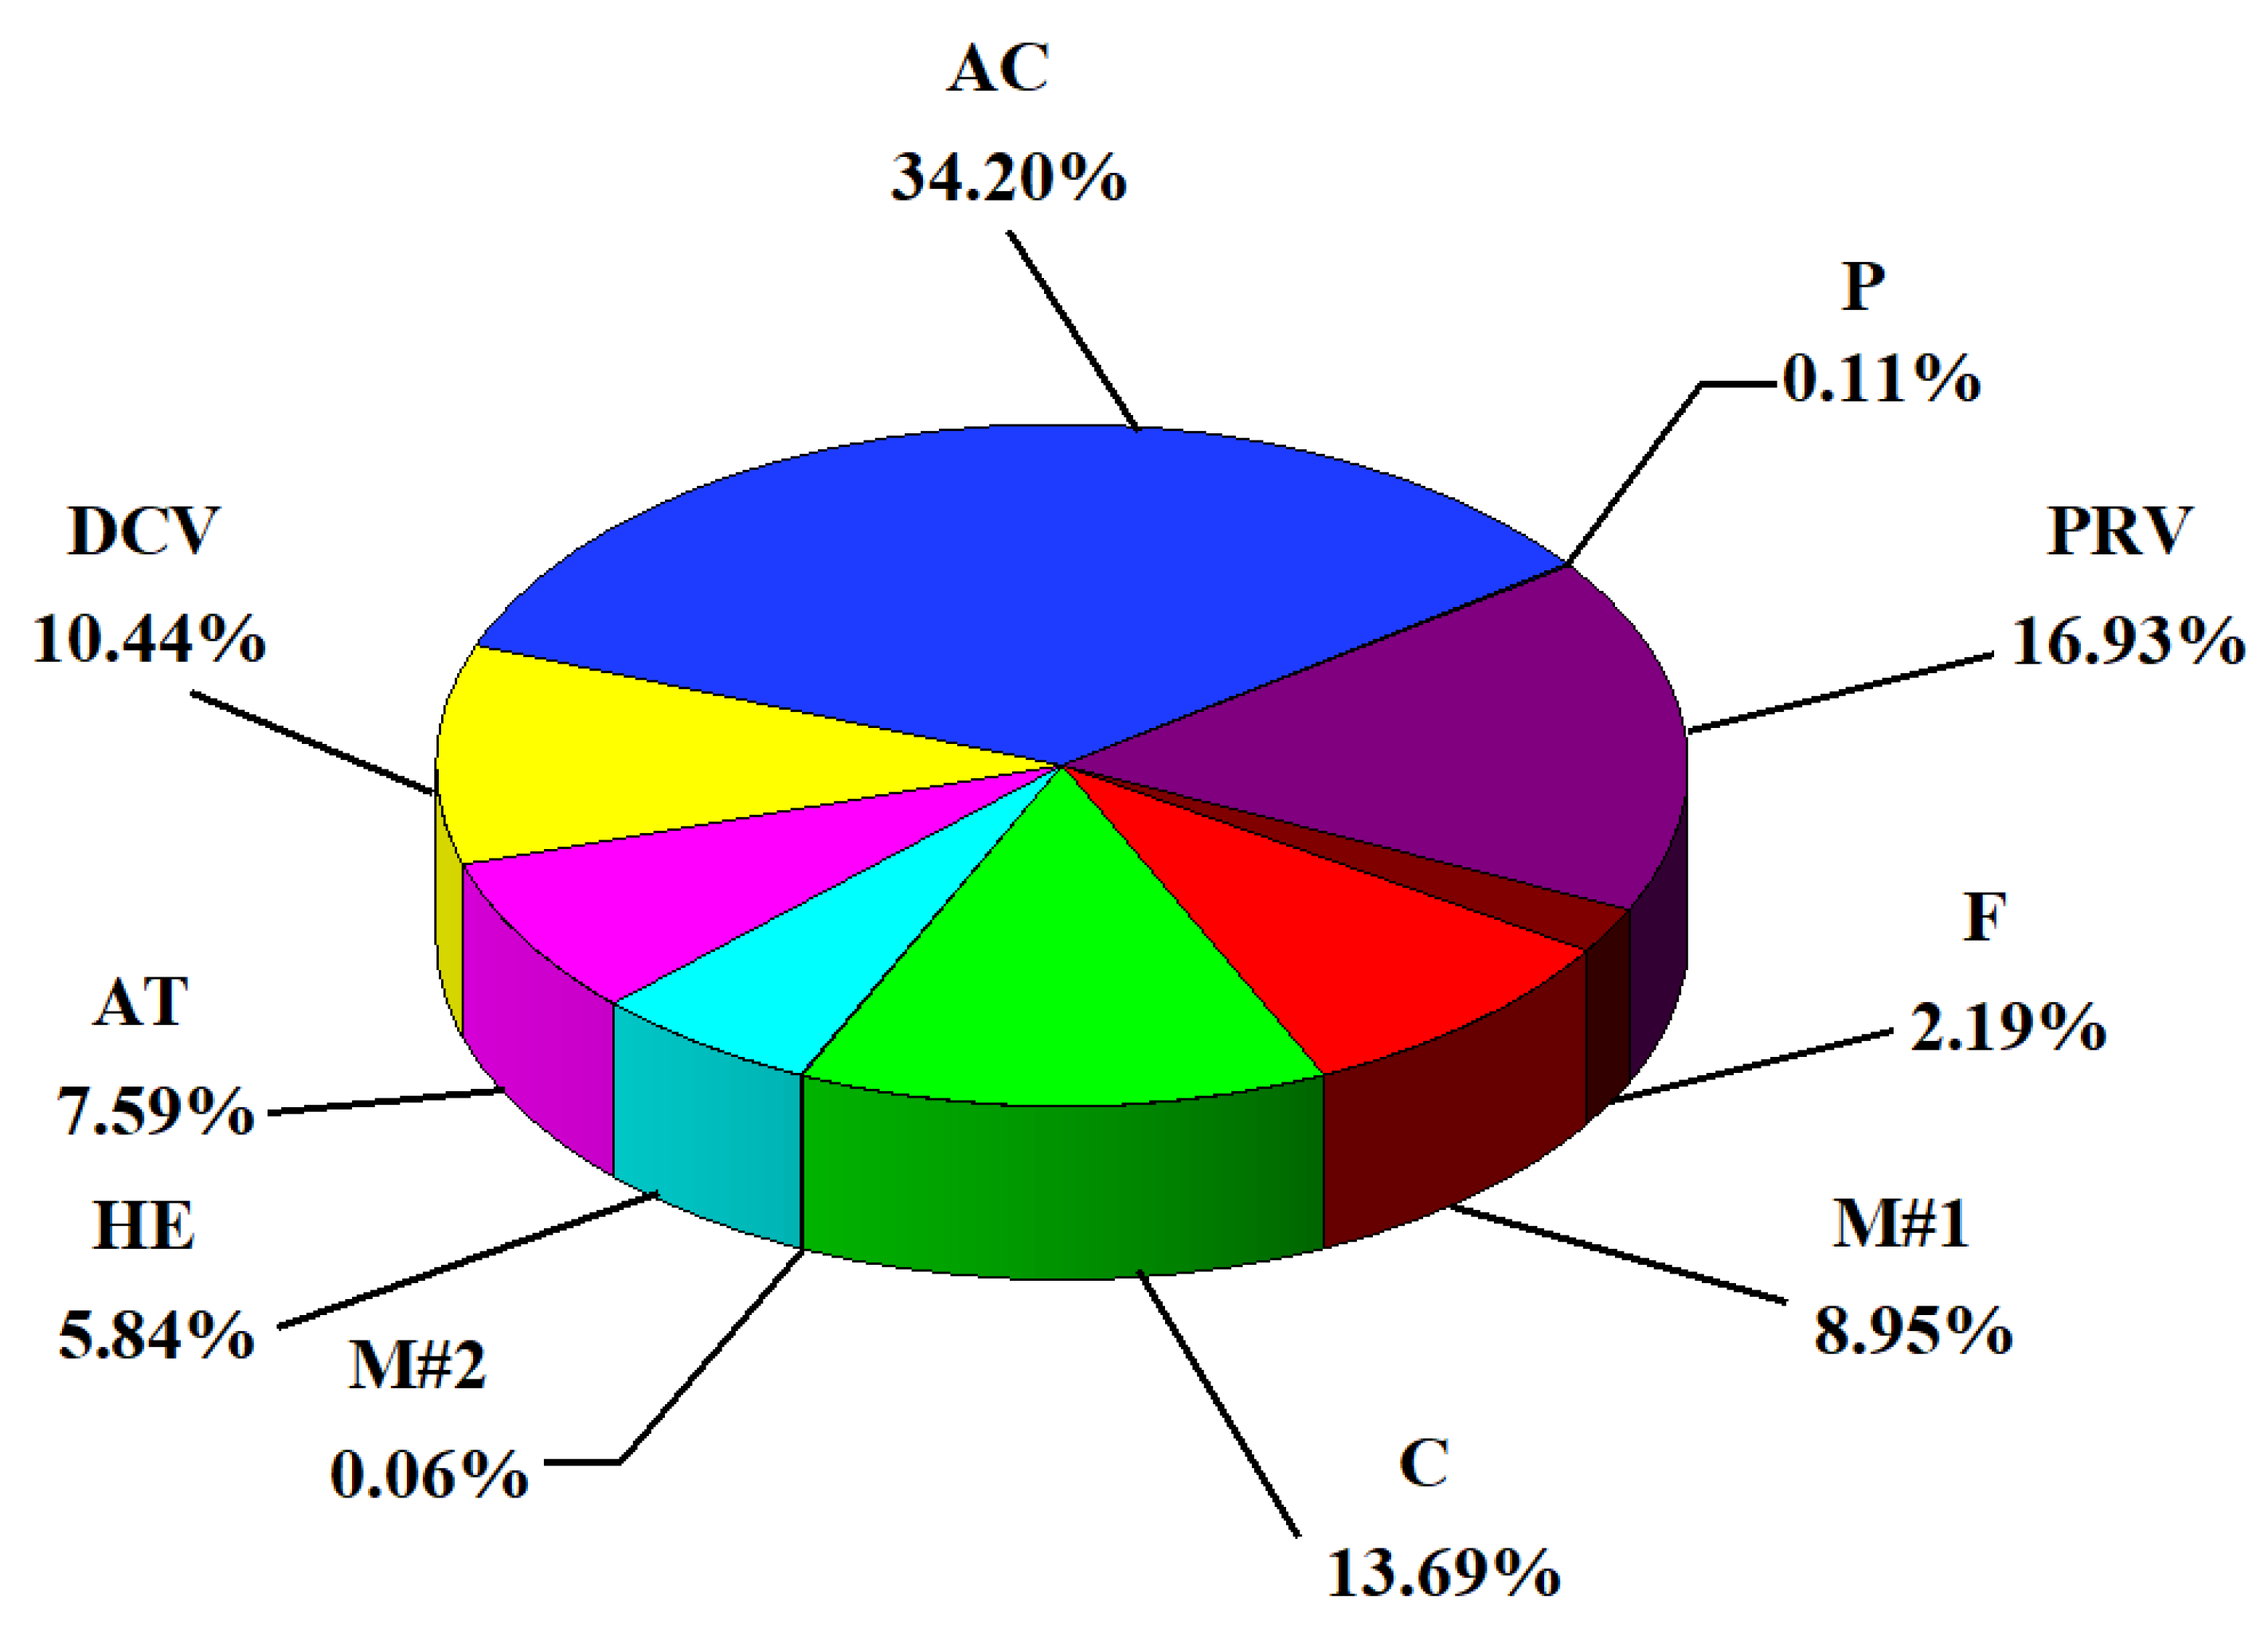
Figure 6 and Figure 7 show the relative exergy destruction of different components in the pneumatic system under real and unavoidable conditions, respectively. By comparing these two figures, we can identify several remarkable contributors of the relative exergy destruction, including the air storage tank (AT), pressure-reducing valve (PRV), and directional control valve (DCV). Regarding the directional control valve, the reason for the larger exergy destruction has been mentioned earlier. In these two working conditions, the temperature exergy loss of the directional control valve is not reduced, which is the main reason for its relatively large exergy destruction. This also provides a new direction for the improvement of the directional control valve. Under the real condition, the relative exergy destruction of the air storage tank and pressure-reducing valve is relatively high with values of 7.59% and 16.93%, respectively. However, under the unavoidable condition, the sum of their relative exergy destruction decreases to approximately 1/5th of that under the real condition with values of 0.27% and 5.43%, respectively. This phenomenon can be attributed to the different control methods employed in the two conditions. In terms of the air storage tank, under the real condition, the compressor stops working once the pressure of compressed air in the tank reaches the set pressure. The temperature rise in the charging process dissipates heat to the environment, causing exergy loss. During the discharging process, the temperature in the air tank gradually decreases, resulting in temperature exergy destruction. This is also a significant factor contributing to the relatively low exergy efficiency of the air storage tank under the real condition. However, under the unavoidable condition, variable frequency control is adopted. The inlet and outlet of compressed air in the air storage tank are almost balanced. The exergy losses in the pressure-reducing valve are also minimized. Consequently, it significantly reduces the relative exergy destruction when compared with that under the real condition. This discrepancy reflects the significance of pressure in the air storage tank as a control signal for regulating the operation of the compressor. By optimizing the control strategy, the working state of the entire system can be effectively modified. It offers great potential for improvement in the pneumatic system.
Finally, a new variable E ˙ x D , K RU is introduced instead of comparing the real condition with the ideal condition. It represents the improvement potential of the component, and the relevant data are shown in Table 3.

4.2. Results of Advanced Exergy Analysis

Based on the conventional exergy analysis, some data that can more intuitively quantify and locate the energy losses in the pneumatic system are obtained. Furthermore, advanced exergy analysis reveals the interactions between pneumatic components, thereby providing a more profound understanding of the energy performance of the investigated pneumatic system.
Table 3 presents the detailed first-order advanced exergy analysis results of the investigated pneumatic system. A comparison of avoidable and unavoidable exergy destruction reveals that avoidable exergy destruction is greater than unavoidable exergy destruction for all components in the pneumatic system. This indicates that there is significant potential to improve the energy efficiency of the system, because more exergy destruction is avoidable. Among all these components, the cylinder (AC) has the highest avoidable exergy destruction with a value of 126.54 kJ, which accounts for 92.4% of the real exergy destruction of the component. This indicates that the cylinder has the most prominent potential for improvement. Following the cylinder, the pressure-reducing valve (PRV), compressor (C), and air storage tank (AT) also exhibit considerable improvement potential. The avoidable exergy destruction for these components is 63.93 kJ (94.3%), 30.27 kJ (55.2%), and 30.17 kJ (99.3%), respectively. Considering the ratio of avoidable exergy destruction to real exergy destruction, the air storage tank shows the highest potential for improvement. By comparing endogenous and exogenous exergy destruction, we can assess the impact of interactions between components. Particularly, when studying the energy efficiency of a specific component, we can determine whether its exergy destruction is caused by its internal irreversibility or by other components in the system. By analyzing the data in Table 3, it is apparent that endogenous exergy destruction exceeds exogenous exergy destruction for all components. However, it should be noted that the exogenous exergy destruction for the motors (M#1 and M#2) is zero, indicating that their exergy destruction is a result of their internal irreversibility. On the other hand, the exogenous exergy destruction for other components, except for the motors, is negative. This implies that the other components are significant for the influence degree of the investigated component. That is to say, the investigated components with smaller exogenous exergy destruction are more greatly impacted by the other components. Several components display strong interactions with others, including the water-cooled aftercooler (HE), air storage tank (AT), directional control valve (DCV), and cylinders (AC). In this study, the interactions between these components are related to the working conditions of different systems. The working conditions mainly affect the performance of these components through different control methods. For example, as the air storage tank reduces the peak and fluctuation of the pressure in the system by variable frequency control and the corresponding temperature of compressed air decreases, the water-cooled aftercooler, consequently, lowers its exergy destruction. This finding is verified through advanced exergy analysis, thereby emphasizing the complex and variable nature of the interactions among pneumatic components.
Moreover, detailed endogenous avoidable exergy destruction, endogenous unavoidable exergy destruction, exogenous avoidable exergy destruction, and exogenous unavoidable exergy destruction are presented in Table 3. The analysis procedure is similar to the aforementioned analysis of avoidable exergy destruction, unavoidable exergy destruction, endogenous exergy destruction, and exogenous exergy destruction. By comparing endogenous avoidable exergy destruction and endogenous unavoidable exergy destruction, it is found that the ratio of endogenous avoidable exergy destruction to endogenous exergy destruction is larger in the air storage tank, pressure-reducing valve, and cylinder, and is 99.3%, 94.3%, and 92.4%, respectively. It is indicated that these components can be optimized to improve system efficiency. Similarly, by optimizing these three components, it is possible to reduce the influence of other components on them in the analysis of exogenous avoidable exergy destruction and exogenous unavoidable exergy destruction. This detailed combination of exergy destruction provides a more refined understanding of system energy loss and the interaction between system components, thereby providing a better understanding of the energy-saving mechanism of pneumatic systems.

4.3. Comparison between the Conventional and Advanced Exergy Analyses Results

Conventional and advanced exergy analyses are both powerful tools for analyzing and optimizing energy efficiency. Although conventional and advanced exergy analyses may yield similar results, advanced exergy analysis provides more valuable and detailed information, making it a more reliable and elaborate approach. In general, conventional exergy analysis focuses on quantifying exergy destruction and identifying the location of exergy destruction of components. This provides a basic understanding of the system’s energy performance. On the other hand, advanced exergy analysis not only quantifies the exergy destruction, but also reveals the interactions between different components. This comprehensive analysis helps to reveal the potential for system improvement and allows for targeted optimizations. A comparative analysis of conventional and advanced exergy analysis is presented as follows.
Table 4 presents the improvement priorities for various components in pneumatic systems from different perspectives. It is evident that there are differences in the improvement priorities between conventional and advanced exergy analysis. In the conventional exergy analysis, the improvement criteria are based on the E x D , K Real . By comparing E x D , K Real with the advanced exergy analysis results E x D , K AV and E x D , K RU , it is found that the top three improvement priorities are the same, namely the cylinder (AC), pressure-reducing valve (PRV), and compressor (C). However, for all components, the assessment results based on the E x D , K RU is closer to the results of advanced exergy analysis. In advanced exergy analysis, the air storage tank (AT), directional control valve (DCV), and electric motor (M#1) are sequentially ranked as a higher priority. Comparatively, the results of advanced exergy analysis are considered more reliable because they account for both the technical limitations of the components themselves and the impact of interactions between components. The conventional exergy analysis and E x D , K RU indicator fail to fully encompass. In the case of the investigated pneumatic system, the air storage tank and directional control valve are not significant energy-consuming components on their own from the perspective of the component level. However, through different control and improvements applied to them, they can significantly affect the electric motor, pressure-reducing valve, and even the entire system from the perspective of the system level. The control of the directional control valve plays a crucial role in managing cylinder energy consumption. It is worth noting that these conclusions are specific to the pneumatic system in this study. More complex and dynamic pneumatic systems may provide further valuable insights.

5. Conclusions

Energy saving is an urgent issue for pneumatic technology with the increasingly accepted green and sustainable manufacturing. A solid and elaborate methodology for evaluating energy-saving pneumatic technology is necessary. Exergy analysis is a promising solution. In this study, we conduct a detailed study of conventional and advanced exergy analysis on a typical pneumatic system. To our best knowledge, this is the first attempt to apply advanced exergy analysis to industrial pneumatic systems. The following conclusions are obtained.
  • Under the real condition, the exergy efficiency of the investigated pneumatic system is 17.3%, while under the unavoidable condition, the theoretical maximum exergy efficiency is 70.5%. This indicates that the performance of the investigated pneumatic system has great potential for improvement.
  • In conventional exergy analysis, the cylinder shows the highest exergy destruction and exergy destruction ratio, reaching 136.92 kJ and 56.83%. The second largest exergy destruction is attributed to the pressure-reducing valve with a value of 67.80 kJ, and the second largest exergy destruction ratio is presented by the water-cooled aftercooler with a value of 40.15%. The pneumatic cylinder shows the largest potential for exergy efficiency improvement, which could increase by 47.75%. It is worth noting that the relative exergy destruction of the air storage tank and pressure-reducing valve varies significantly between the real and the unavoidable conditions.
  • In advanced exergy analysis, the simulation results obtained based on the data hypothesized in this study indicate that the system has great potential for improvement. The priority order of improvement is the cylinder, pressure-reducing valve, compressor, and air storage tank. By comparing endogenous and exogenous exergy destruction, it is found that there are strong interactions between components in the pneumatic system. Among all the components, the interactions between the water-cooled aftercooler, air storage tank, directional control valve, and cylinder are more obvious.
  • By comparing the results of conventional and advanced exergy analyses, it can be seen that advanced exergy analysis has obvious advantages. It can reveal more detailed and reliable information about the energy performance of the system, as it not only starts from the components, but also focuses on the interaction effects between components and systems.
  • Overall, it is feasible to conduct advanced exergy analysis on industrial pneumatic systems. Although only a simple but typical case system is investigated in this study, it provides a feasible methodology for more profound and practical studies on more complex industrial pneumatic systems.

Author Contributions

Conceptualization, Z.W. and W.X.; methodology, Z.Z., Z.W. and W.X.; software, Z.Z.; validation, Z.Z.; formal analysis, Z.Z. and Z.W.; investigation, Z.Z., Z.W., H.W. and H.Z.; writing—original draft preparation, Z.Z. and Z.W.; writing—review and editing, Z.W. and W.X.; visualization, Z.Z.; project administration, Z.W.; funding acquisition, Z.W. and W.X. All authors have read and agreed to the published version of the manuscript.

Funding

This research was funded by the National Natural Science Foundation of China, grant numbers 51905066 and 52075065.

Data Availability Statement

The data presented in this study are available on request from the corresponding author.

Conflicts of Interest

The authors declare no conflict of interest.

Appendix A

Table A1. Some basic parameters of the pneumatic system.
ParameterUnitValue
Atmosphere pressureMPa0.103
Reference temperatureK293.15/273.15
Temperature of the inlet water of the after-coolerK283.15
Relative humidity of compressed air%0
Table A2. Accumulated exergy at different state points of the pneumatic system under real and unavoidable conditions.
State PointWorking FluidReal ConditionUnavoidable Condition
Accumulated Exergy (kJ)
1Air00
2Air506.607315.494
2 *Air497.585309.995
3Air454.977296.469
3 *Air439.367285.245
4Air446.197295.263
5Air350.553285.804
6Air282.755281.942
7inAir119.635131.696
7outAir00
8inAir121.310134.958
8outAir00
10Water00
11Water28.46267.406
12Water63.30246.530
* Due to the exergy theory definition of the water-cooled aftercooler with a reference temperature of 273.15 K, the exergy calculation of the water-cooled aftercooler is performed at state points 2 and 3 with a reference temperature of 273.15 K. in/out: The inlet and outlet of the cylinder at a certain state point.
Table A3. Energy consumption and generation of the main state points under real and unavoidable conditions.
State PointEnergy FormEnergy (kJ)
Real ConditionUnavoidable Condition
9Mechanical104.028242.461
13Electrical601.982343.783
14Electrical597.254337.530
15Mechanical561.419330.779
16Electrical4.7286.253
17Mechanical4.0236.128

References

  1. Shi, Y.; Cai, M.; Xu, W.; Wang, Y. Methods to Evaluate and Measure Power of Pneumatic System and Their Applications. Chin. J. Mech. Eng. 2019, 32, 42. [Google Scholar] [CrossRef] [Green Version]
  2. Krytikov, G.; Strizhak, M.; Strizhak, V. The synthesis of structure and parameters of energy efficient pneumatic actuator. East.-Eur. J. Enterp. Technol. 2017, 1, 38–44. [Google Scholar] [CrossRef] [Green Version]
  3. Merkelbach, S.; Reinertz, O.; Murrenhoff, H. Development of a rotary pneumatic transformer. In Proceedings of the 11th International Fluid Power Conference, Aachen, Germany, 19–21 March 2018. [Google Scholar]
  4. Benedetti, M.; Bonfà, F.; Bertini, I.; Introna, V.; Ubertini, S. Explorative study on Compressed Air Systems’ energy efficiency in production and use: First steps towards the creation of a benchmarking system for large and energy-intensive industrial firms. Appl. Energy 2018, 227, 436–448. [Google Scholar] [CrossRef]
  5. Shi, Y.; Cai, M. Dimensionless Study on Output Flow Characteristics of Expansion Energy Used Pneumatic Pressure Booster. J. Dyn. Syst. Meas. Control 2012, 135, 21007. [Google Scholar] [CrossRef]
  6. Wolf, D.; Budt, M. LTA-CAES—A low-temperature approach to Adiabatic Compressed Air Energy Storage. Appl. Energy 2014, 125, 158–164. [Google Scholar] [CrossRef]
  7. Wang, H.; Tong, Z.; Dong, X.; Xiong, W.; Ting, D.S.K.; Carriveau, R.; Wang, Z. Design and energy saving analysis of a novel isobaric compressed air storage device in pneumatic systems. J. Energy Storage 2021, 38, 102614. [Google Scholar] [CrossRef]
  8. Yu, Q.; Li, F.; Tan, X. Influence Analysis and Performance Optimization of a Pneumatic Actuator Exhaust Utilization System. Stroj. Vestn.—J. Mech. Eng. 2023, 69, 119–134. [Google Scholar] [CrossRef]
  9. Cummins, J.J.; Nash, C.J.; Thomas, S.; Justice, A.; Mahadevan, S.; Adams, D.E.; Barth, E.J. Energy conservation in industrial pneumatics: A state model for predicting energetic savings using a novel pneumatic strain energy accumulator. Appl. Energy 2017, 198, 239–249. [Google Scholar] [CrossRef]
  10. Dindorf, R.; Takosoglu, J.; Wos, P. Review of Compressed Air Receiver Tanks for Improved Energy Efficiency of Various Pneumatic Systems. Energies 2023, 16, 4153. [Google Scholar] [CrossRef]
  11. Rufer, A. Increasing the Energy Efficiency of Gas Boosters for Hydrogen Storage and for Refueling Stations. Energies 2023, 16, 1763. [Google Scholar] [CrossRef]
  12. Kim, T.; Lee, C.; Hwang, Y.; Radermacher, R. A review on nearly isothermal compression technology. Int. J. Refrig. 2022, 144, 145–162. [Google Scholar] [CrossRef]
  13. Wieberdink, J.; Li, P.Y.; Simon, T.W.; Van de Ven, J.D. Effects of porous media insert on the efficiency and power density of a high pressure (210 bar) liquid piston air compressor/expander—An experimental study. Appl. Energy 2018, 212, 1025–1037. [Google Scholar] [CrossRef]
  14. Harris, P.; Nolan, S.; O’Donnell, G.E. Energy optimisation of pneumatic actuator systems in manufacturing. J. Clean. Prod. 2014, 72, 35–45. [Google Scholar] [CrossRef]
  15. Wang, Y.; Fu, X.; Cheng, T.; Lu, X.; Gao, H.; Bao, G.; Zhao, X. Development of a Nonlinear Piezoelectric Energy Harvester for Alternating Air Load. Appl. Sci. 2016, 6, 325. [Google Scholar] [CrossRef] [Green Version]
  16. Fritz, F.; Grabe, C.; Kuolt, H.; Murrenhoff, H. Benchmark of Existing Energy Conversion Efficiency Definitions for Pneumatic Vacuum Generators. In Proceedings of the 20th CIRP International Conference on Life Cycle Engineering, Singapore, 17–19 April 2013; pp. 135–140. [Google Scholar]
  17. Krichel, S.; Hülsmann, S.; Hirzel, S.; Elsland, R.; Sawodny, O. Industrial pneumatics: More clarity in the compressed air. Exergy flow charts as new basis for efficiency considerations in compressed air systems. O+P 1-2/2012 2012, 56, 28–32. [Google Scholar]
  18. Cai, M. Energy consumption assessment and energy loss analysis in pneumatic system. Chin. J. Mech. Eng. 2007, 43, 69. [Google Scholar] [CrossRef]
  19. Mozayeni, H.; Wang, X.; Negnevitsky, M. Exergy analysis of a one-stage adiabatic compressed air energy storage system. Energy Procedia 2019, 160, 260–267. [Google Scholar] [CrossRef]
  20. Wang, Z.; Xiong, W.; Wang, H.; Wang, Z. Exergy analysis of the pneumatic line throwing system. Int. J. Exergy 2016, 19, 364. [Google Scholar] [CrossRef]
  21. Wołosz, K. Exergy destruction in the pneumatic pulsator system during one working cycle. Energy 2018, 146, 124. [Google Scholar] [CrossRef]
  22. Nazarov, F.; Weber, J.; Vardini, A.R.; Rakova, E. A Novel Approach for Pneumatic Pressure Booster. In Proceedings of the 11th International Fluid Power Conference, Aachen, Germany, 19–21 March 2018. [Google Scholar]
  23. Szablowski, L.; Morosuk, T. Advanced Exergy Analysis of Adiabatic Underwater Compressed Air Energy Storage System. Entropy 2023, 25, 77. [Google Scholar] [CrossRef] [PubMed]
  24. Tian, Z.; Chen, X.; Zhang, Y.; Gao, W.; Chen, W.; Peng, H. Energy, conventional exergy and advanced exergy analysis of cryogenic recuperative organic rankine cycle. Energy 2023, 268, 126648. [Google Scholar] [CrossRef]
  25. Zhong, X.; Chen, T.; Sun, X.; Song, J.; Zeng, J. Conventional and advanced exergy analysis of a novel wind-to-heat system. Energy 2022, 261, 125267. [Google Scholar] [CrossRef]
  26. Anvari, S.; Khoshbakhti Saray, R.; Bahlouli, K. Conventional and advanced exergetic and exergoeconomic analyses applied to a tri-generation cycle for heat, cold and power production. Energy 2015, 91, 925–939. [Google Scholar] [CrossRef]
  27. Boyano, A.; Morosuk, T.; Blanco-Marigorta, A.M.; Tsatsaronis, G. Conventional and advanced exergoenvironmental analysis of a steam methane reforming reactor for hydrogen production. J. Clean. Prod. 2012, 20, 152–160. [Google Scholar] [CrossRef]
  28. Palizdar, A.; Ramezani, T.; Nargessi, Z.; AmirAfshar, S.; Abbasi, M.; Vatani, A. Advanced exergoeconomic evaluation of a mini-scale nitrogen dual expander process for liquefaction of natural gas. Energy 2019, 168, 542–557. [Google Scholar] [CrossRef]
  29. Mehrpooya, M.; Mousavi, S.A. Advanced exergoeconomic assessment of a solar-driven Kalina cycle. Energy Convers. Manag. 2018, 178, 78–91. [Google Scholar] [CrossRef]
  30. Doll, M.; Neumann, R.; Sawodny, O. Energy efficient use of compressed air in pneumatic drive systems for motion tasks. In Proceedings of the 2011 International Conference on Fluid. Power and Mechatronics, FPM 2011, Beijing, China, 17–20 August 2011. [Google Scholar]
  31. Li, Y.; Wang, X.; Li, D.; Ding, Y. A trigeneration system based on compressed air and thermal energy storage. Appl. Energy 2012, 99, 316–323. [Google Scholar] [CrossRef]
  32. Yang, K.; Zhang, Y.; Li, X.; Xu, J. Theoretical evaluation on the impact of heat exchanger in Advanced Adiabatic Compressed Air Energy Storage system. Energy Convers. Manag. 2014, 86, 1031–1044. [Google Scholar] [CrossRef]
  33. Zhao, P.; Dai, Y.; Wang, J. Design and thermodynamic analysis of a hybrid energy storage system based on A-CAES (adiabatic compressed air energy storage) and FESS (flywheel energy storage system) for wind power application. Energy 2014, 70, 674–684. [Google Scholar] [CrossRef]
  34. Song, C.; He, M. Research on Cylinder Buffer Control Based on AMESim. In Proceedings of the 21st International Conference on Industrial Engineering and Engineering Management 2014, Selangor Darul Ehsan, Malaysia, 9–12 December 2014; Atlantis Press: Paris, France, 2015; pp. 331–333. [Google Scholar]
  35. Wang, Z.; Ting, D.; Carriveau, R.; Xiong, W.; Wang, Z. Design and thermodynamic analysis of a multi-level underwater compressed air energy storage system. J. Energy Storage 2016, 5, 203–211. [Google Scholar] [CrossRef]
  36. Hartmann, N.; VÃhringer, O.; Kruck, C.; Eltrop, L. Simulation and analysis of different adiabatic Compressed Air Energy Storage plant configurations. Appl. Energy 2011, 93, 541–548. [Google Scholar] [CrossRef]
  37. Vučković, G.D.; Ilić, G.S.; Vukić, M.; Stojiljkovic, M.; Stefanović, G.; Dedeić, E. Advanced exergy analysis and exergoeconomics performance evaluation of the thermal processes in existing industrial plant. Energy Convers. Manag. 2013, 85, 655–662. [Google Scholar] [CrossRef]
  38. Ramesh, K.; Shah, D.P.S. Fundamentals of Heat Exchanger Design; John Wiley & Sons, Inc.: Hoboken, NJ, USA, 2003. [Google Scholar]
  39. Jubeh, N.; Najjar, Y. Green solution for power generation by adoption of adiabatic CAES system. Appl. Therm. Eng. 2012, 44, 85–89. [Google Scholar] [CrossRef]
  40. Dincer, I.; Rosen, M.A. Exergy: Energy, Environment and Sustainable Development; Elsevier: Amsterdam, The Netherlands, 2007. [Google Scholar]
  41. Nguyen, T.; Voldsund, M.; Elmegaard, B.; Ertesvåg, I.S.; Kjelstrup, S. On the definition of exergy efficiencies for petroleum systems: Application to offshore oil and gas processing. Energy 2014, 73, 264–281. [Google Scholar] [CrossRef] [Green Version]
  42. Wang, Z.; Xiong, W.; Ting, D.S.K.; Carriveau, R.; Wang, Z. Conventional and advanced exergy analyses of an underwater compressed air energy storage system. Appl. Energy 2016, 180, 810–822. [Google Scholar] [CrossRef]
  43. Morosuk, T. Advanced thermodynamic (exergetic) analysis. J. Phys. Conf. Ser. 2012, 395, 2160. [Google Scholar]
  44. Kelly, S. Energy Systems Improvement based on Endogenous and Exogenous Exergy Destruction. Ph.D. Thesis, Technical University of Berlin, Berlin, Germany, 2008. [Google Scholar]
  45. Fallah, M.; Mahmoudi, S.M.S.; Yari, M.; Ghiasi, R. Advanced exergy analysis of the Kalina cycle applied for low temperature enhanced geothermal system. Energy Convers. Manag. 2016, 108, 190–201. [Google Scholar] [CrossRef]
  46. Kelly, S.; Morosuk, T. Advanced exergetic analysis: Approaches for splitting the exergy destruction into endogenous and exogenous parts. Energy 2009, 34, 384–391. [Google Scholar] [CrossRef]
Figure 1. Theory of energy efficiency evaluation and analysis for pneumatic systems.
Energies 16 05982 g001
Figure 2. Schematic diagram of a typical industrial pneumatic system. C: air compressor, HE: water-cooled aftercooler, F: filter, AT: air storage tank, PRV: pressure-reducing valve, DCV: directional control valve, AC: pneumatic cylinder, MS: mass block, M(#1, #2): electric motor, P: pump, 1–17: different state points.
Energies 16 05982 g002
Figure 3. Flowchart of advanced exergy analysis.
Energies 16 05982 g003
Figure 4. Accumulated exergy destruction, exergy efficiency, and exergy destruction ratio of components/processes under the real condition.
Energies 16 05982 g004
Figure 5. Accumulated exergy destruction, exergy efficiency, and exergy destruction ratio of components/processes under the unavoidable condition.
Energies 16 05982 g005
Figure 6. The relative exergy destruction of different components under the real condition.
Energies 16 05982 g006
Figure 7. The relative exergy destruction of different components under the unavoidable condition.
Energies 16 05982 g007
Table 1. The main assumptions for the pneumatic system under real, unavoidable, and ideal conditions.
ComponentsParametersRealUnavoidableIdea
M#1Efficiency94% [35]98% [36]100%
CIsentropic efficiency90% [31,32]95% [32]100%
M#2Efficiency94% [35]98% [36]100%
PMechanical efficiency88% [37]95% [37]100%
HEEffectiveness0.9 [38]0.95 [38]1
Pressure loss ratio7.47% [39]2% [38]0%
FTotal pressure recovery0.98 [33]0.9951
ATMaximum storage pressure0.7 MPa0.402 MPa0.4 MPa
PRVSetting pressure0.4 MPa0.402 MPa0.4 MPa
pressure stability rate89%98%100%
DCVTotal pressure recovery0.850.980
ACEfficiency43%91%100%
Table 2. Fuel exergy and product exergy of various components in the pneumatic system.
Component/ProcessExergy of FuelExergy of Product
M#1 E ˙ x 14 E ˙ x 15
C E ˙ x 15 E ˙ x 2 E ˙ x 1
M#2 E ˙ x 16 E ˙ x 17
P E ˙ x 17 E ˙ x 11 E ˙ x 10
HE E ˙ x 2 E ˙ x 3 E ˙ x 12 E ˙ x 11
F E ˙ x 3 E ˙ x 4
AT E ˙ x 4 E ˙ x 5
PRV E ˙ x 5 E ˙ x 6
DCV E ˙ x 6 E ˙ x 7 , DCV , out   +   E ˙ x 8 , DCV , out
AC ( E ˙ x 7 , AC , in   +   E ˙ x 8 , AC , in ) ( E ˙ x 7 , AC , out   +   E ˙ x 8 , AC , out ) E ˙ x 9
Table 3. Advanced exergy analysis of the investigated pneumatic system.
Component E x P , K Real E x D , K Real E x D , K Unavoidable E x D , K RU E x D , K AV E x D , K UN E x D , K EN E x D , K EX E x D , K EN , AV E x D , K EN , UN E x D , K EX , AV E x D , K EX , UN
M#1561.41935.8356.75129.08424.37811.45835.835024.37711.45800
M#23.7820.2410.1250.1160.1640.0770.24100.1640.07700
C506.60754.81215.28539.52730.26824.54458.311−3.49932.20026.111−1.932−1.567
P3.3530.4290.2780.1510.2700.1590.456−0.0270.2870.169−0.017−0.010
HE34.84023.3773.87419.50316.9126.465239.827−216.450173.49966.328−156.589−59.863
F446.1978.7801.2067.5746.9581.82211.526−2.7469.1332.392−2.176−0.570
AT149.14530.3920.19130.20130.1710.221101.103−70.711100.3670.736−70.197−0.515
PRV282.75567.7983.86263.93663.9253.873115.511−47.713108.9126.599−44.987−2.726
DCV240.94541.81015.28826.52227.99613.81488.314−46.50459.13529.179−31.139−15.365
AC104.028136.91724.193112.724126.53710.380339.390−202.473313.66025.730−187.123−15.350
Table 4. Improvement priority of components in the pneumatic system.
PriorityConventionalAdvanced
E x D , K Real E x D , K RU E x D , K AV
1ACACAC
2PRVPRVPRV
3CCC
4DCVATAT
5M#1M#1DCV
6ATDCVM#1
7HEHEHE
8FFF
9PPP
10M#2M#2M#2
Disclaimer/Publisher’s Note: The statements, opinions and data contained in all publications are solely those of the individual author(s) and contributor(s) and not of MDPI and/or the editor(s). MDPI and/or the editor(s) disclaim responsibility for any injury to people or property resulting from any ideas, methods, instructions or products referred to in the content.