1. Introduction
There is the problem of relatively high short-circuit currents (200–300 kA) in high-current circuits or autonomous energy systems [
1,
2,
3,
4,
5,
6]. Such a short-circuit current can lead to equipment failure due to high electrodynamic forces and excessive heating temperatures. Also, the prolonged short-circuit current flow can cause chemical contamination of the premises with metal vapors. This requires the protection equipment to have a fast response time and a high fault current interruption speed.
There exist switches capable of fast fault current interruption via artificial zero-crossing. Power semiconductor switches have an ultra-fast fault tripping speed [
2,
7,
8,
9,
10,
11,
12] and can turn off the fault current in several hundred μs. However, a fast fault current interruption can cause a violation of the selectivity of the switching equipment, as well as a temporary shutdown of the power supply, since the transition of the power system to back-up power circuits can take some time [
13]. To avoid these problems, it is necessary to consider using devices capable of limiting the short-circuit current for a certain period of time, during which the system should switch to the back-up power circuits without disrupting the power supply.
The simplest solution would be to use a current-limiting reactor. Such a reactor must be able to transmit high rated current and short-circuit current for a relatively long time, which will lead to large weight and size parameters of the device [
14]. Also, the reactor can cause an issue with switching inductive DC circuits. Similar problems will be observed with superconducting current-limiting devices. A different solution may be switching the fault current to a circuit with high active resistance. However, in this paper we will also face the problem of large weight and size parameters.
This paper proposes a solution to the problem: a semiconductor current-limiting device based on a DC chopper, a DC-to-DC converter. A prospective current-limiting device should have an advantage of small weight and dimensions, low losses, and relatively low production costs.
The most defining feature of such a device is the ability of semiconductor devices to operate for a relatively long time during significant current overloads without exceeding the permissible temperature of the semiconductor structure. Based on this, the following goal of the study is formed: the development of a thermal model of a semiconductor device heating, adapted taking into account the experimental data, in this case, for a diode and a thyristor, as part of a current-limiting device.
The rest of the paper presents: a circuit diagram of a current-limiting device and a description of the principle of its operation; mathematical model of current-voltage characteristics with temperature behavior for semiconductor devices and a description of the method for determining its parameters; thermal model of a semiconductor devices with a mathematical algorithm for determining its parameters; results of experiments on measuring the dynamic current-voltage characteristics of a semiconductor device when a powerful current pulse is passed through it.
2. Current-Limiting Device
Figure 1 contains a diagram of the DC-to-DC converter under consideration with a general current waveform, describing the transients in the device.
Let us briefly describe the operation of the circuit shown in
Figure 1a. In the nominal operation mode of the power system, the key K is closed. In the event of a short circuit in the power system, the key K enters the high-frequency switching mode, maintaining a limited short-circuit current (
Figure 1b) in the short-circuit–diode-reactor circuit.
The role of the key K of a prospective current-limiting device is played by a semiconductor thyristor T, which is switched off using an artificial zero current circuit. The expediency of such a solution lies in the high-rated currents of the protected power systems, since the thyristor is the most powerful semiconductor switch with the lowest losses in the nominal operation mode.
As will be demonstrated later, the duty cycle of the key will be less than one percent, due to which the greatest thermal load from the short-circuit current will be borne by the semiconductor diode D.
Since the current-limiting device operates in the mode of chopper interruption of the current, when the pulses follow one another with a given duty cycle, the heating of semiconductor devices will accumulate in their structure depending on the parameters of the generated pulses.
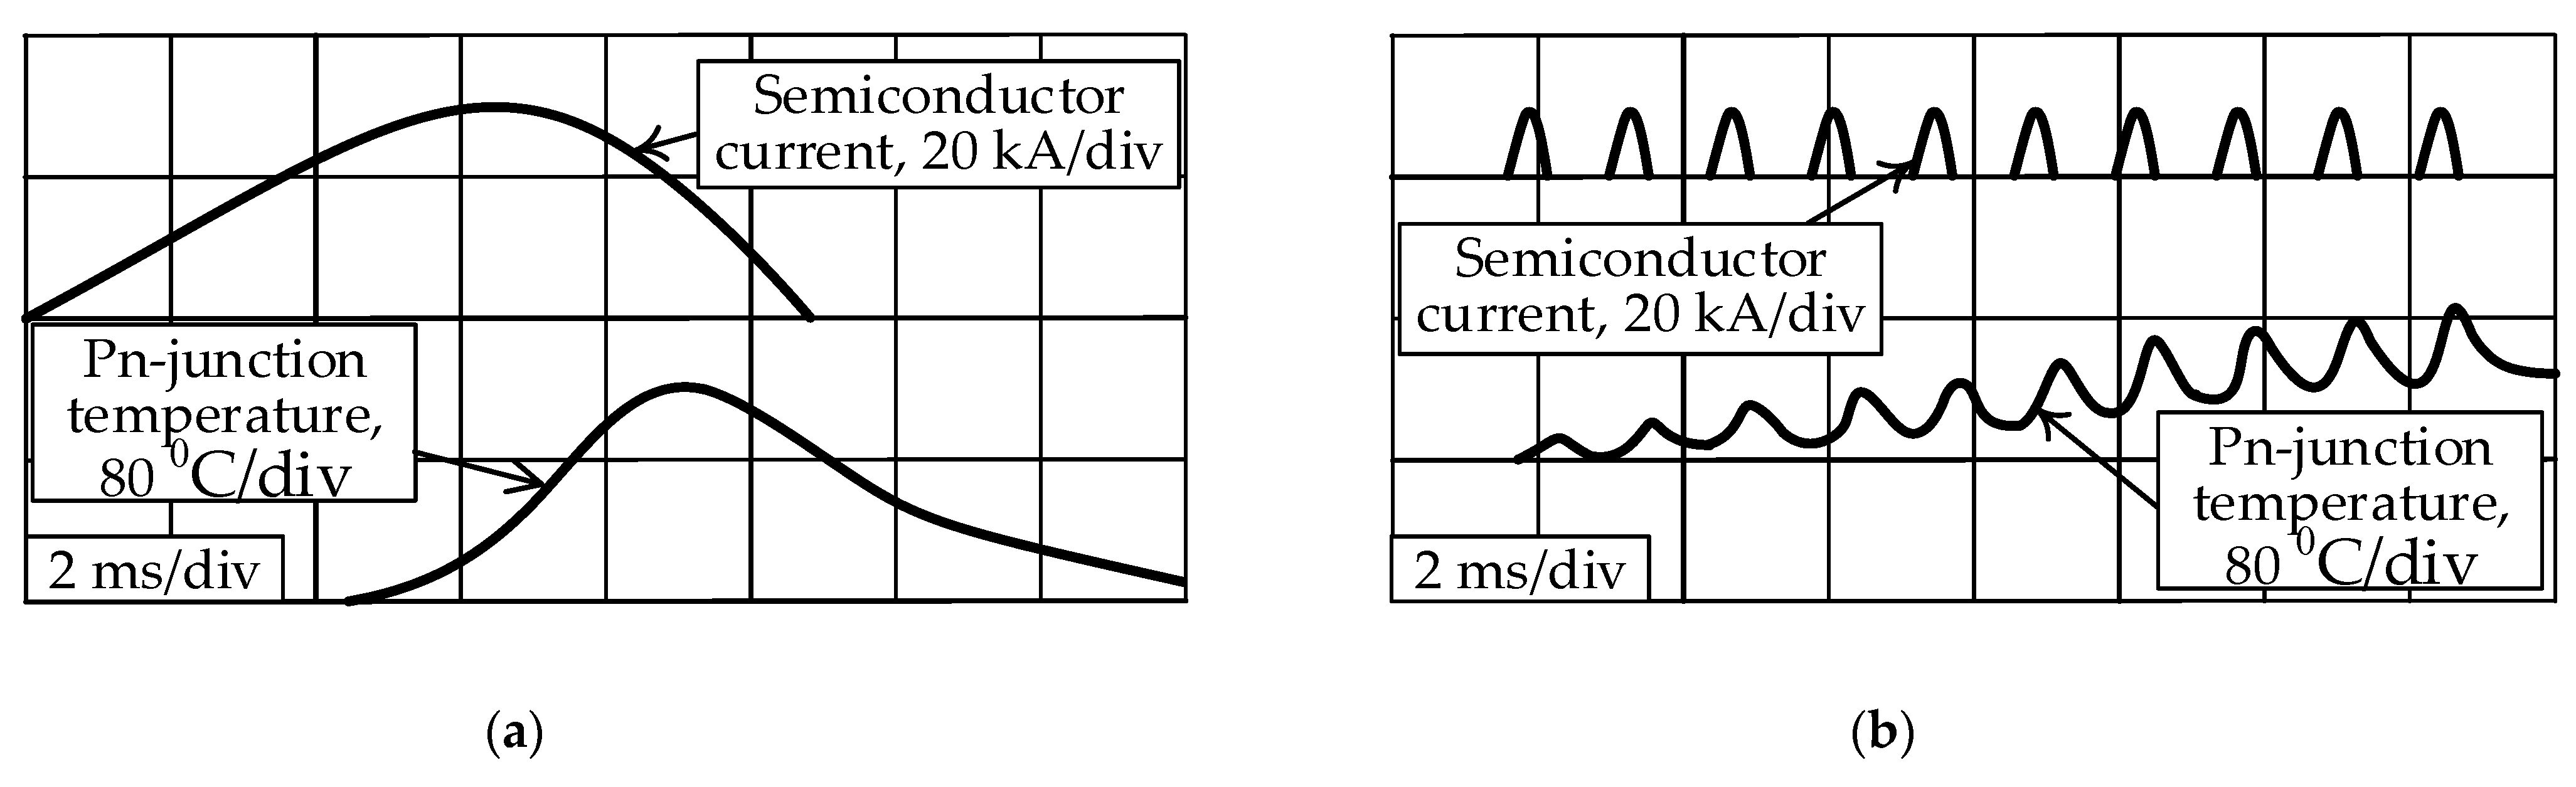
Figure 2 shows the typical pulsed (a) and chopper (b) operation modes of the current limiter with the temperature of the structure of the semiconductor device measured through IR radiation with a temperature-calibrated receiver [
15]. From the presented results it is clear that the temperature of the structure of the semiconductor device does not exceed its permissible values.
3. I-V Model of the Semiconductor Device
A model of the semiconductor device that can adequately describe the behavior of its current–voltage characteristic depending on changes in the temperature of the semiconductor crystal will be given in this section. The simplest model of the I-V curve of the p-n junction is the Schottky model, which is described by the following expression [
16]:
where
Is is the saturation current of the diode;
e is the elementary charge;
V is the voltage applied to the diode;
k is the Boltzmann constant; and
T is the temperature of the diode (in degrees Kelvin).
This expression does not take into account the generation-recombination current of electrons and holes in the semiconductor itself, as well as the active resistance of the silicon crystal. Taking into account these factors, expression (1) will become [
17]:
where
n1 and
n2 are non-ideality coefficients for the diffusion part of the expression and for the part responsible for the generation-recombination processes, respectively. They can be estimated as
n1 = 1 and
n2 = 2.
In this expression,
Is and
Rs are also dependent on temperature. The resistance of the silicon crystal in the temperature range under study (from 25 °C to
Tj = max) is close to linear and can be described by the following expression:
where α is the proportionality coefficient and
Rs is the basic resistivity corresponding to the temperature
T0. The saturation current depends on the temperature as [
18]
where
Eg is the band gap. Based on this, expression (2) takes the following form:
where
γ =
T3∙exp(−
Eg/
k ·
T), and
γ0 −
γ for a temperature of 25 °C.
For model (5), it is necessary to determine the parameters
Isn=1 and
Isn=2. The
α coefficient for silicon is known and is approximately equal to 0.0030–0.0035.
Eg is calculated according to the formula and is also dependent on temperature [
19]:
Next, we will propose an algorithm for determining the remaining parameters through the values of a particular semiconductor element specified by the manufacturer.
3.1. Determining Model Parameters
The saturation currents will be calculated at two points of the known I-V curve (
I1,
U1 and
I2,
U2). For the most accurate interpretation of the current–voltage characteristic of the device, it is recommended to select the first point on the characteristic curve near the initial zone of greatest bending corresponding to the current
IL and the voltage of the device switching into its conductive state. The second point should be selected in the zone of linear dependence, when the current of the device is several times higher than its nominal value. Current
IL is the smallest value of the current (from the datasheet) at which the thyristor begins to conduct after removing the control pulse. It is necessary to solve the following system, the parameters of which correspond to a temperature of 25 °C:
The parameters of saturation currents were calculated for two semiconductor devices—for the D173-6300 diode and for the T243-400 thyristor (Proton-Electrotex, Orel, Russia). They are shown in
Table 1. The first will be used in the calculation for the current-limiting device circuit under consideration, and the second will be used in the experiment to verify the thermal model.
Figure 3 shows the I-V curves of the studied devices.
3.2. Modeling a Semiconductor Device in Matlab Simulink
Since function (2) is implicit, an iterative approach to its solution will be used. Newton’s method is the most suitable for the I-V curve under study, since this method has a good convergence rate and all its limitations are satisfied.
Newton’s method is described by the following expression:
where
n is the step of the cycle,
f(
xn) and
f′(
xn) are the function of the current of the semiconductor device from its voltage drop (expression (2) and its derivative, respectively.
The derivative (2) (
f′(xn)) will be as follows:
Ultimately, function (8) is implemented in Matlab Simulink using the MATLAB function block, the output value of which is the current of the device that controls the current source. The input ports of this block are the voltage applied to the current source and the temperature of the semiconductor crystal of the device. Also, the value of the current source of the previous simulation step xn is supplied to the input of the block, which allowed us to reduce the number of iterations necessary for obtaining the next value (5).
4. Thermal Model of the Semiconductor Device
The operation of the current limiter circuit under study is limited to a relatively short time interval (several hundred ms). It is important to select the number of diodes in a parallel assembly not for the operation mode with the rated current, but for the operation mode when the current significantly exceeds the rated one, i.e., when the diode is in the mode of operating overloads. This will reduce the number of semiconductor devices, which will decrease the cost of the device.
The permissible overcurrent of a semiconductor device is primarily determined by the critical temperature of the p-n junction. The critical temperature for the thyristor is heating it up to 150–170 °C. If a direct voltage is applied to the device at this temperature, it can involuntarily switch on due to the thermal dependence of the dU/dt effect. For diodes, this temperature has a slightly higher value (200–300 °C) and is conversely associated with the application of the reverse voltage: the saturation currents of the diode at such temperatures reach sufficiently high values to cause a positive feedback and lead to a thermal breakdown of the device [
20].
However, until the breakdown voltage is applied (when the semiconductor device is in a non-conductive state in one direction or another), the temperature of the semiconductor structure—without detrimental consequences—can be several times higher than previously indicated, which is associated with the efficiency of heat transfer within the structure of the device. Here, the critical temperature values lead to the emergence of current filaments (a sharp decrease in resistance in the heated zone and pinching of the current), that is, 400–600 °C [
20]. The critical temperature is the melting point of silicon: 1412 °C.
4.1. Known Methods for Calculating Thermal Regimes of a Semiconductor Device
A well-known method for calculating the thermal state of a semiconductor device is the calculation through transient thermal resistance, whose value depends on the duration of the pulsed heating current. The advantage of this method is its simplicity: it is necessary to know only the power and pulse time, and using the data provided by the manufacturer, the transient thermal resistance can be selected. At the same time, a significant drawback of the calculation is the lack of versatility: pulses of complex shape must be divided into simpler components, and increments of thermal energy in the structure layer have to be calculated for each one. Also, this method does not take into account the transfer and removal of thermal energy in the structural elements of the device. All this indicates the impossibility of using this calculation method in the dynamic Matlab Simulink model.
Another method for calculating the thermal state of the semiconductor device is the method of electrothermal analogy, where the layered structure of the device is represented in the form of electrical RC circuits (
Figure 4), where the electric current is equivalent to the heat flux, and the voltage is equivalent to the thermal gradient. The elements of this circuit themselves are the following equivalents: the current source is the heat source of the semiconductor device (semiconductor structure), the active resistance is the thermal resistance, and the electrical capacitance is the heat capacity. An example (
Figure 4) shows a detailed electrothermal diagram of the semiconductor device:
The use of this scheme makes it possible to calculate the heat of the different layers of a semiconductor device for any shape and duration of the pulse. It is also convenient to implement this scheme in the Matlab Simulink software environment. The disadvantage of this technique is the complexity of calculating the parameters of the circuit elements in
Figure 4, which is especially true of semiconductor crystal and thermally compensating wafers.
4.2. Methodology for Determining the Parameters of the Electrothermal Analogy Circuit
It is known that the transient thermal resistance
ZT in the operator form is a fractionally rational function of the ratio of polynomials, all the coefficients of which are real functions of the thermal parameters of the elements of its structure, thermal resistances
Rp and heat capacities
Cp, as shown in expression (10) [
21,
22].
This circumstance indicates a direct relationship between the electrothermal analogy and transient thermal resistance. In turn, this means that the characteristics of the transient thermal resistance known from the datasheets of semiconductor devices can be used to calculate the parameters of the thermal circuit for replacing a semiconductor device. Below we will propose a methodology for this calculation.
Further, the paper proposes the following functional diagram (
Figure 5) for determining the parameters of the equivalent circuit shown in
Figure 4. The basis of this diagram are two approaches to calculating the temperature of a semiconductor crystal. The first method is to use expression (5) to determine the voltage drop across the semiconductor device, and, accordingly, its instantaneous power. This instantaneous power determines the heat flux in the electrothermal analogy circuit, which, in turn, determines the heating of the semiconductor structure. The second method is based on the fact that with a known pulse width and the characteristics of the transient thermal resistance, the thermal resistance of the semiconductor structure can be determined. Further, for a known radiated power, the gradient
θ of the temperature change of the structure (
θ =
P/
ZT) is determined. The initial source of energy is a sinusoidal single current pulse, with a width of 100 μs to 1 s and an amplitude equal to the maximum shock current of the device I
FSM.
With the help of a special algorithm (
Figure 6), the parameters for the thermal model (
Figure 4) are selected in such a way that this thermal model carries out an equivalent—with respect to the second method—heating of the structure.
The core of the algorithm performs the following sequence. The condition when it is necessary to carry out the selection of parameters of the next layer (here and, further, the bisection iterative method is used to select the parameters of the circuit) is the difference of 5% between the simulated temperature of the p-n junction and the temperature obtained through the thermal transition resistance. First, a full cycle of iterations is carried out to select the thermal resistance of the layer, followed by one iteration of the choice of heat capacity, and so on until the condition for both parameters is met at the same time. The exception here is the first cycle of the algorithm, when the heat capacity of the p-n junction is determined. In the first calculation of the algorithm (for the thermal pulse duration of 100 μs), it can be assumed that all the energy of the thermal pulse is completely absorbed by the silicon crystal and, due to the presence of thermal resistance (in other words, due to the thermal inertia of the structure), it is not effectively transferred to the rest of the layers of the structure. Further, in the simulation, it was established that the temperature change of the crystal by 5% relative to the structures adjacent to the crystal begins to occur at a thermal pulse duration of 700 μs or more.
Initially, the scheme assumes an infinitely large number of RC layers. The thermal resistances R and heat capacities C are initially assumed to be much larger than they can be. This ensures that the temperature of the structure increases as the equivalent of the thermal pulse increases, which allowed us to adjust the model for the reduction of thermal resistance and heat capacity. If, however, the temperature decreases in the model with the increase in pulse duration, then the algorithm selects the smallest previously calculated thermal resistance and increases it until the temperature of the structure begins to rise as the pulse duration increases.
Table 2 shows the results of the calculation of the demonstrated algorithms for the studied semiconductor devices, diode D173-6300 and thyristor T243-400.
The parameters of the thermal analogy circuit presented in
Table 2 are valid for the duration of transient processes not exceeding 1 s.
5. Simulation of the Operation of a Current-Limiting Device
Further, this section will demonstrate the operation of the previously described current-limiting device (
Figure 1a), where the diode (D173-6300) will be modeled using the expression (5) with the parameters from
Table 1 and the thermal model (
Figure 4) with the parameters from
Table 2. In general, the simulation scheme of the current-limiting device in the Matlab Simulink software package is shown in
Figure 7.
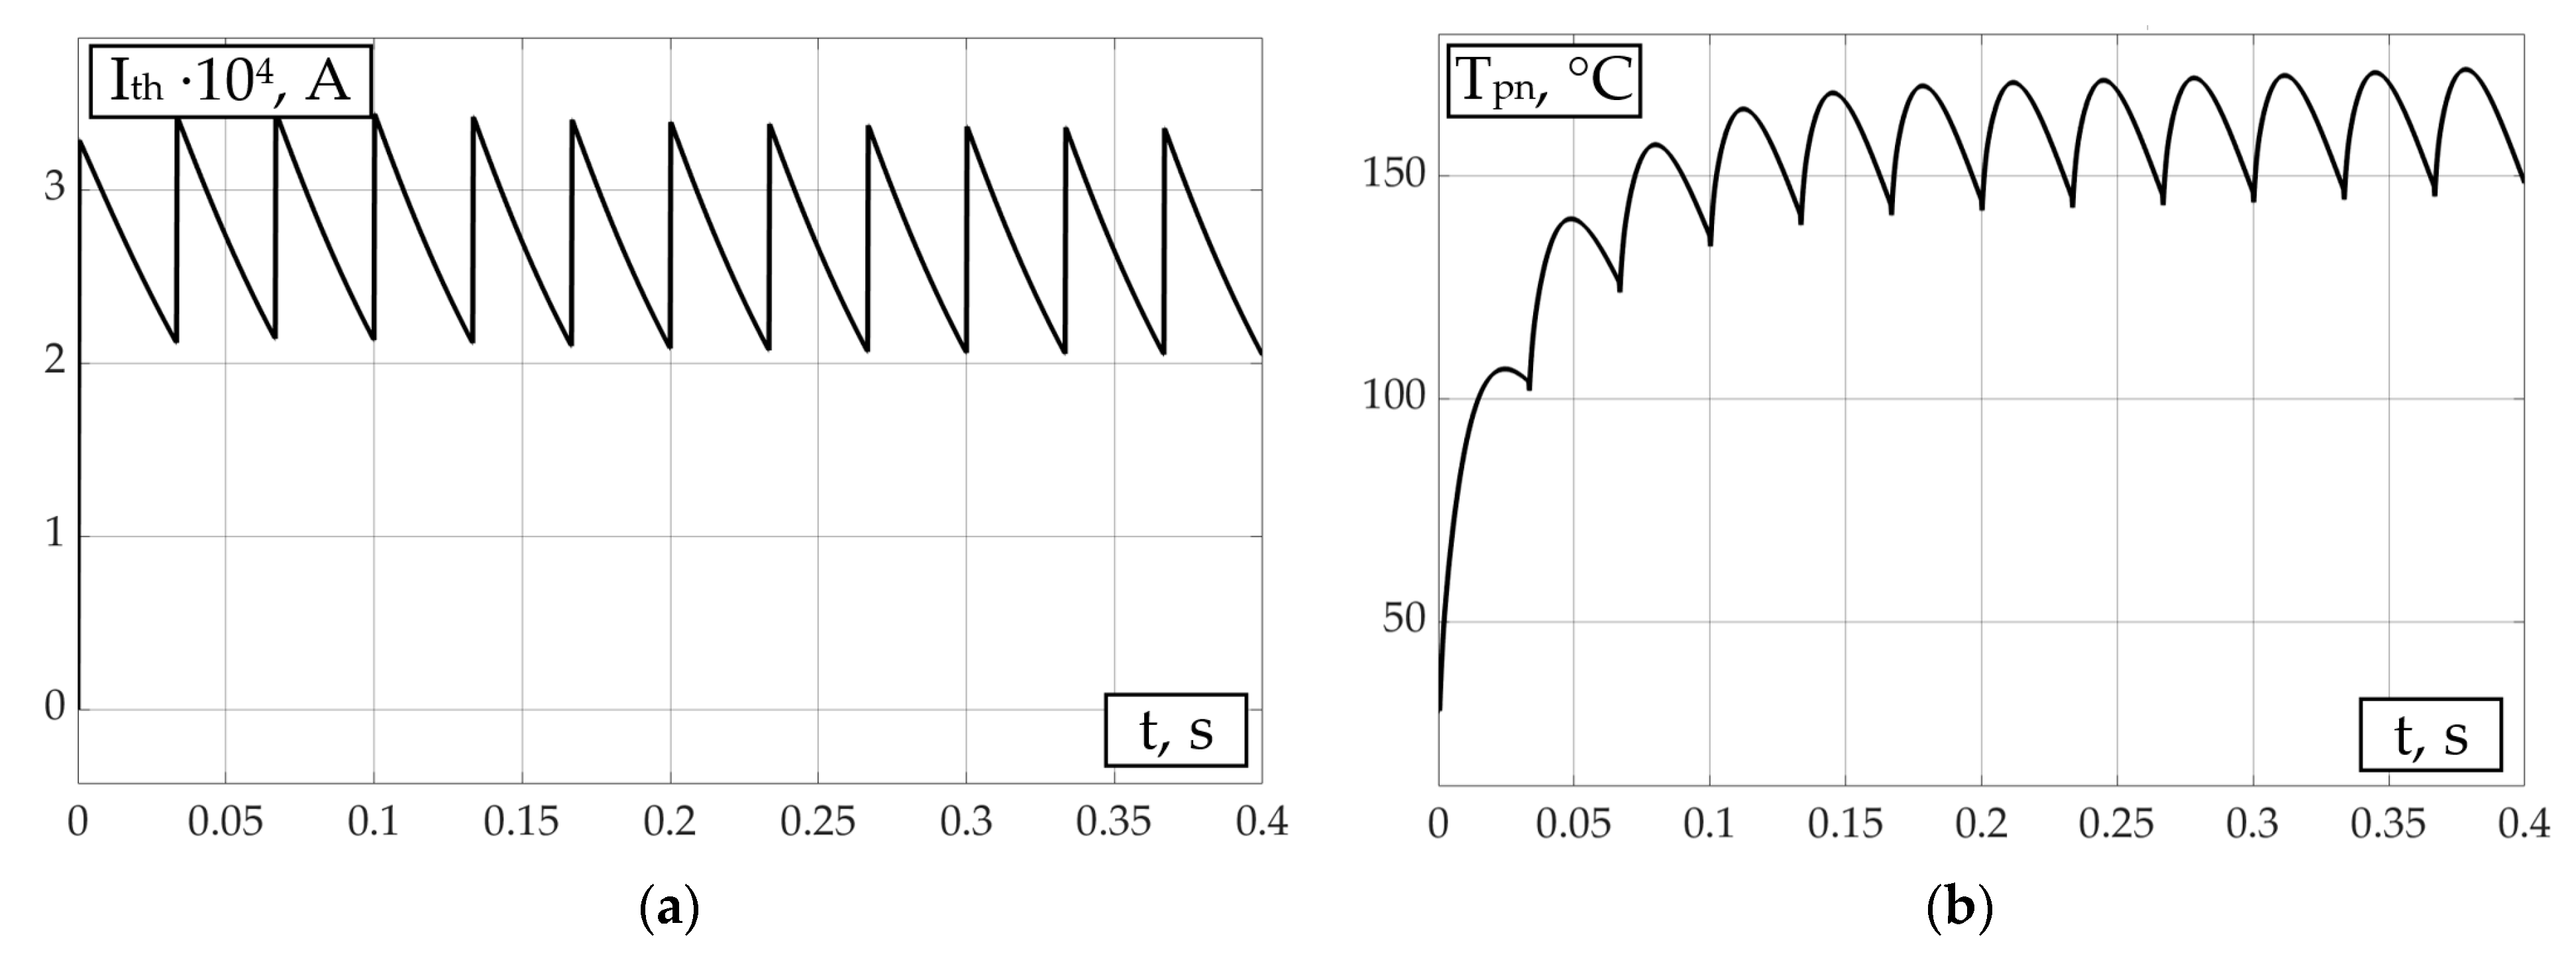
The following simulation parameters were adopted for the circuit in the
Figure 7: the operating time of the current-limiting device is 400 ms; the frequency of operation of the key K is 30 Hz; the duty cycle of the key K is 0.6%; the short-circuit power supply voltage is 660 V; the inductance of the short-circuit circuit is 10 μH; the initial temperature of the diode is 25 °C; the number of diodes in a parallel assembly is 3; the maximum temperature of the semiconductor crystal of the diode is 175 °C.
After 150 ms from the triggering of the current-limiting device for one cycle of operation, the maximum temperature of the crystal of a single diode rises by about 1 °C. Such temperature stabilization is provided by the relatively high heat capacity of the copper body of the diode.
6. Verification of the Method for Calculating the Thermal Model of the Semiconductor Device
To verify the method of calculating the thermal model of the semiconductor device, the thyristor T243-400 was heated up using a powerful current pulse with an amplitude of ≈10,000 A, formed by discharging a pre-charged capacitor bank, as shown in
Figure 9.
The results of the experiment and their comparison with the calculated model are shown in
Figure 10,
Figure 11 and
Figure 12.
Figure 10 shows the results of the comparison of the current pulse (experiment and calculation) through the thyristor T243-400. Based on these data, the heat energy dissipated in the device was calculated (
Figure 11). The process of dissipation of the experimental and calculated curves on a semiconductor device demonstrates the high accuracy of the calculated electrical and thermal parameters of the device. Also, according to the result in
Figure 10, the dynamics of temperature change of a semiconductor device was calculated (
Figure 12).
Figure 13 shows the dynamic current–voltage characteristics of the T243-400 obtained as a result of the calculation and experiment. The maximum modelled temperature of the thyristor was 108.6 °C.
7. Conclusions
In this paper, a semiconductor current-limiting device based on a DC chopper designed to protect autonomous power systems from short circuits was proposed.
A detailed model of current–voltage characteristics with temperature behavior for semiconductor devices has been developed. A method for determining the parameters of this model is proposed. The paper also proposes a method for calculating the parameters of thermal analogy circuits of semiconductor devices. These developments allowed us to optimize the assembly of semiconductor devices designed to operate during long-term current overloads. An example of the application of the demonstrated models for the proposed current-limiting device in Matlab Simulink is shown.
Using the proposed methods, the electrical and thermal circuits for replacing the power thyristor T243-400 were calculated, which was subsequently verified through an experimental study.
Author Contributions
Conceptualization, V.F.; Data curation, E.S. and R.Z.; Formal analysis, V.F.; Investigation, E.S.; Methodology, E.S. and R.Z.; Project administration, Y.P.; Resources, R.Z.; Software, E.S. and R.Z.; Supervision, V.F. and Y.P.; Writing—original draft, E.S.; Writing—review & editing, V.F. All authors have read and agreed to the published version of the manuscript.
Funding
The work was carried out within the research topic of the FSEG-2023-0012 state assignment.
Data Availability Statement
Conflicts of Interest
The authors declare no conflict of interest.
References
- Vostrov, K.; Frolov, V.; Safonov, E. Development of Current Limiting Device for Short and Autonomous Networks. Plasma Phys. Technol. 2017, 4, 182–185. [Google Scholar] [CrossRef]
- Ouaida, R.; Berthou, M.; Tournier, D.; Depalma, J.F. State of art of current and future technologies in current limiting devices. In Proceedings of the 2015 IEEE First International Conference on DC Microgrids (ICDCM), Atlanta, GA, USA, 7–10 June 2015; pp. 175–180. [Google Scholar] [CrossRef]
- Morton, J.S. Circuit breaker and protection requirements for DC switchgear used in rapid transit systems. IEEE Trans. Ind. Appl. 1985, IA-21, 1268–1273. [Google Scholar] [CrossRef]
- McEwan, P.M.; Tennakoon, S.B. A two-stage DC thyristor circuit breaker. IEEE Trans. Power Electron. 1997, 12, 597–607. [Google Scholar] [CrossRef]
- Cairoli, P.; Rodrigues, R.; Raheja, U.; Zhang, Y.; Raciti, L.; Antoniazzi, A. High Current Solid-State Circuit Breaker for safe, high efficiency DC systems in marine applications. In Proceedings of the 2020 IEEE Transportation Electrification Conference & Expo (ITEC), Chicago, IL, USA, 23–26 June 2020; pp. 936–941. [Google Scholar] [CrossRef]
- Peng, J.; Zhang, H.; Wang, J.; Xiang, B.; Li, H.; Gao, L.; Wang, D.; Wang, X.; Liu, Z. A DC combined apparatus for DC 1.5 kV rail transit traction systems. In Proceedings of the 2021 International Conference on Electrical Materials and Power Equipment (ICEMPE), Chongqing, China, 11–15 April 2021; IEEE: New York, NY, USA, 2021. [Google Scholar] [CrossRef]
- Gu, C.; Wheeler, P.; Castellazzi, A.; Watson, A.J.; Effah, F. Semiconductor devices in solid-state/hybrid circuit breakers: Current status and future trends. Energies 2017, 10, 495. [Google Scholar] [CrossRef]
- Kapoor, R.; Shukla, A.; Demetriades, G. State of art of power electronics in circuit breaker technology. In Proceedings of the 2012 IEEE Energy Conversion Congress and Exposition (ECCE), Raleigh, NC, USA, 15–20 September 2012; IEEE: New York, NY, USA, 2012. [Google Scholar] [CrossRef]
- Shukla, A.; Demetriades, G.D. A survey on hybrid circuit-breaker topologies. IEEE Trans. Power Deliv. 2014, 30, 627–641. [Google Scholar] [CrossRef]
- Luo, F.; Chen, J.; Lin, X.; Kang, Y.; Duan, S. A novel solid state fault current limiter for DC power distribution network. In Proceedings of the 2008 Twenty-Third Annual IEEE Applied Power Electronics Conference and Exposition, Austin, TX, USA, 24–28 February 2008; pp. 1284–1289. [Google Scholar] [CrossRef]
- Yi, L.; Moon, J. Bidirectional QZ-source DC circuit breaker. IEEE Trans. Power Electron. 2022, 37, 9524–9538. [Google Scholar] [CrossRef]
- Lv, Z.; Wang, X.; Zhuang, J.; Liu, L.; Yuan, Z.; Li, S.; Wu, J. Analysis and Design of the High Current Rising Rate Hybrid DC Current Limiting Circuit Breaker. Electronics 2023, 12, 2657. [Google Scholar] [CrossRef]
- Rozine, V.; Adams, M.H. Protective device problems and solutions. In Proceedings of the 2010 Conference Proceedings IPEC, Singapore, 27–29 October 2010; IEEE: New York, NY, USA, 2010. [Google Scholar]
- Varetsky, Y.; Gajdzica, M. Study of Short Circuit and Inrush Current Impact on the Current-Limiting Reactor Operation in an Industrial Grid. Energies 2023, 16, 811. [Google Scholar] [CrossRef]
- Vaserina, K.N.; Surma, A.M.; Chernikov, A.A.; Frolov, V.Y. Semiconductor Element Base of Electrical Apparatus: A Tutorial; Peter the Great St. Petersburg Polytechnic University St. Petersburg: Saint Petersburg, Russia, 2017. [Google Scholar]
- Sah, C.-T.; Noyce, R.N.; Shockley, W. Carrier generation and recombination in pn junctions and pn junction characteristics. Proc. IRE 1957, 45, 1228–1243. [Google Scholar] [CrossRef]
- Grundmann, M. Physics of Semiconductors; Springer: Berlin/Heidelberg, Germany, 2010; Volume 11. [Google Scholar]
- Rideout, V. A review of the theory, technology and applications of metal-semiconductor rectifiers. Thin Solid Film. 1978, 48, 261–291. [Google Scholar] [CrossRef]
- Levinshtein, M. Handbook Series on Semiconductor Parameters; World Scientific: Singapore, 1997; Volume 1. [Google Scholar]
- Abramovich, M.; Babaylov, V.; Lober, V. Diodes and Thyristors in Converter Installations; Energoatomizdat: Moscow, Russia, 1992. [Google Scholar]
- Diebold, E.; Luft, W. Transient thermal impedance of semiconductor devices. Trans. Am. Inst. Electr. Eng. Part I Commun. Electron. 1961, 79, 719–726. [Google Scholar]
- Taylor, P.D. Thyristor Design and Realization; John Wiley & Sons, Inc.: Hoboken, NJ, USA, 1987. [Google Scholar]
Figure 1.
The DC-to-DC converter (DC chopper): (a) A diagram of the converter; (b) A general waveform diagram of the DC-to-DC converter operation.
Figure 1.
The DC-to-DC converter (DC chopper): (a) A diagram of the converter; (b) A general waveform diagram of the DC-to-DC converter operation.
Figure 2.
Oscillograms of the currents of the semiconductor device and the temperature of its semiconductor structure: (a) for a single current pulse; (b) for a multitude of sequential pulses.
Figure 2.
Oscillograms of the currents of the semiconductor device and the temperature of its semiconductor structure: (a) for a single current pulse; (b) for a multitude of sequential pulses.
Figure 3.
Current–voltage characteristics of semiconductor devices obtained using the expression (5): (a) D173-6300 (diode); (b) T243-400 (thyristor).
Figure 3.
Current–voltage characteristics of semiconductor devices obtained using the expression (5): (a) D173-6300 (diode); (b) T243-400 (thyristor).
Figure 4.
An example of application of the electrothermal analogy principle to the structure of a semiconductor diode or thyristor. Here, C and R are the heat capacity of the layer and the thermal resistance between the layers, respectively (the following designations are used: j is the p-n junction, g is the gasket, tc is the thermal compensator, c is the casing, h is the radiator, a is the environment).
Figure 5.
Functional diagram of the implementation of the algorithm for optimizing the parameters of the equivalent thermal model of a semiconductor device in the Matlab Simulink environment.
Figure 5.
Functional diagram of the implementation of the algorithm for optimizing the parameters of the equivalent thermal model of a semiconductor device in the Matlab Simulink environment.
Figure 6.
Algorithm for calculating the parameters of the electrothermal analogy circuit of a semiconductor diode or thyristor.
Figure 6.
Algorithm for calculating the parameters of the electrothermal analogy circuit of a semiconductor diode or thyristor.
Figure 7.
Diagram demonstrating the operation of a current-limiting device with a thermal model of the current–voltage characteristic of the diode. Schematic for modeling in Matlab Simulink.
Figure 7.
Diagram demonstrating the operation of a current-limiting device with a thermal model of the current–voltage characteristic of the diode. Schematic for modeling in Matlab Simulink.
Figure 8.
The results of the simulation of the circuit pictured in
Figure 7. Simulation time is 0.4 s: (
a) limited short-circuit current; (
b) temperature of the semiconductor crystal of the diode.
Figure 8.
The results of the simulation of the circuit pictured in
Figure 7. Simulation time is 0.4 s: (
a) limited short-circuit current; (
b) temperature of the semiconductor crystal of the diode.
Figure 9.
Experiment design.
Figure 9.
Experiment design.
Figure 10.
The results of the experiment and the calculation carried out according to the scheme in
Figure 9. Dashed curve denotes experimental data. Solid curve denotes calculation results. (
a) Voltage waveform of an open semiconductor thyristor T243-400; (
b) Current waveform of an open semiconductor thyristor T243-400.
Figure 11.
Oscillogram of energy dissipated in the thyristor. The dashed curve denotes results calculated based on the results of the experiment. The solid line denotes results calculated using the proposed model.
Figure 11.
Oscillogram of energy dissipated in the thyristor. The dashed curve denotes results calculated based on the results of the experiment. The solid line denotes results calculated using the proposed model.
Figure 12.
Calculation of temperature of the T243-400 based on the results of measuring the parameters of the thyristor.
Figure 12.
Calculation of temperature of the T243-400 based on the results of measuring the parameters of the thyristor.
Figure 13.
Dynamic current–voltage characteristic of the T243-400. Solid curve denotes calculation results. Dashed curve denotes results of the experiment.
Figure 13.
Dynamic current–voltage characteristic of the T243-400. Solid curve denotes calculation results. Dashed curve denotes results of the experiment.
Table 1.
Calculated values of saturation currents of the semiconductor devices.
Table 1.
Calculated values of saturation currents of the semiconductor devices.
| Semiconductor Device | Isn=1 | Isn=2 |
|---|
| D173-6300 (diode) | 1.305 × 10⁻¹³ | 3.517 × 10⁻⁸ |
| T243-400 (thyristor) | 7.539 × 10⁻²¹ | 8.453 × 10⁻⁹ |
Table 2.
Calculated parameters of the thermal analogy circuit of semiconductor devices.
Table 2.
Calculated parameters of the thermal analogy circuit of semiconductor devices.
| Layer | D173-6300 | T243-400 |
|---|
| C | R | C | R |
|---|
| 1 | 2.150 | 4.1888 × 10⁻⁴ | 0.510 | 14.937 × 10⁻⁴ |
| 2 | 3.646 | 18.953 × 10⁻⁴ | 0.430 | 5.627 × 10⁻⁴ |
| 3 | 33.442 | 9.648 × 10⁻⁴ | 2.881 | 36.717 × 10⁻⁴ |
| 4 | 150.243 | - | 839.411 | - |
| Disclaimer/Publisher’s Note: The statements, opinions and data contained in all publications are solely those of the individual author(s) and contributor(s) and not of MDPI and/or the editor(s). MDPI and/or the editor(s) disclaim responsibility for any injury to people or property resulting from any ideas, methods, instructions or products referred to in the content. |
© 2023 by the authors. Licensee MDPI, Basel, Switzerland. This article is an open access article distributed under the terms and conditions of the Creative Commons Attribution (CC BY) license (https://creativecommons.org/licenses/by/4.0/).


