Article

Optimizing Hybrid Microgrid Power Systems for Local Power Distribution: A Study on Combined Photovoltaic and Fuel Cell Systems in the Philippines

by
Godfrey Anthony T. Rivadulla
1,
Gerard Francesco D. G. Apolinario
1,* and
Michael C. Pacis
2
1
Electrical Engineering Department, Technological Institute of the Philippines, Manila 1001, Philippines
2
School of EECE, Mapua University, Manila 1002, Philippines
*
Author to whom correspondence should be addressed.
Energies 2023, 16(16), 5906; https://doi.org/10.3390/en16165906
Submission received: 19 June 2023 / Revised: 16 July 2023 / Accepted: 28 July 2023 / Published: 10 August 2023
(This article belongs to the Section A5: Hydrogen Energy)

Abstract

:
In pursuit of energy self-sufficiency and meeting the growing energy demand, the Philippine government has formulated its Energy Road Map for the year 2040, aiming to strengthen, continue, and accelerate the adoption of renewable energy (RE) across the archipelago. This paper presents a proposed multiple microgrid system integrated into an existing distribution system, utilizing renewable energy sources. The proposed model involves the conversion of a section of the distribution system into a microgrid setup, comprising photovoltaic (PV) energy and fuel cell (FC) technologies connected to a 13.2 kV distribution grid. A modified three-phase three-level voltage-sourced converter (VSC) is employed to control the inverter. The proposed modifications result in improved operational efficiency compared to conventional approaches. Various operating cases are considered, each with a designated power source operating according to a predefined schedule. A unified controller is employed across all operating cases, ensuring system stability. Simulation and experimental results conducted through MATLAB/Simulink demonstrate the impact of VSC in terms of voltage regulation, frequency stability, and accumulated power losses. They revealed that voltage regulation for understudy cases ranged from 0.1 to 4.5%, microgrid frequencies were between 59.1 and 60.08 Hz, and power distribution losses were at 1.2–3.3% of the generated power.

1. Introduction

Renewable energy (RE) is widely considered to reduce total energy consumption through clean energy generation. Renewable energy sources (RESs) play a crucial role in the transition to sustainable development due to their superiorities over conventional energy sources (CESs). Being inexhaustible, environmentally friendly and usable in district areas are some of the advantages of RESs over CESs [1]. RESs have been steadily growing and supported due to the increased demand for electric energy throughout the world for the past years. In the Philippines, a total of 20.4 percent of total power energy demand is projected to be supplied from renewable energy, with an average annual growth of 2.0 percent in the year 2040 [2].
This development in modern power systems put the microgrid (MG) at the center of attention in the power industry. An MG is defined as a group of interconnected loads and distributed energy resources within clearly defined electrical boundaries that acts as a single controllable entity with respect to the grid [3] forming a self-sufficient energy system. Figure 1 shows an example of an integrated microgrid structure from IEEE Std 2030.9 [4]. It can be operated in three possible modes: grid-connected, islanded, or isolated. During grid-connected operation, the MG is connected to the public grid through a common point with active interaction in the distribution system, and when the MG disconnects from the grid, whether due to a planned action or a fault/disturbance in the main grid, it changes into an islanded operation, while the isolated operation is when the MG is designed such that it is never connected to the grid.
MGs offer a viable solution in the integration of RESs in the power system. However, various considerations such as electrical load variation and the unpredictable nature of renewable energy resources impose challenges in achieving stability, effectiveness, security, and optimal operation in the power system. In references [5,6,7], maintaining the balance between supplied power and power demand have been a challenge by imposing few adverse effects on the traditional main power grid due to effects of variation in the wind speed. For solar-based generation systems, solar irradiance and temperature are very important variables that directly impact the output. Due to its nature, solar power changes significantly with the time of day, time of year, and geographic location. In references [8,9,10], a cloud enhancement effect influenced the PV system when it generated over-irradiance during the event. Similar to solar and wind, other RESs deal with other issues as well; for geothermal and biomass energy sources, the main concern lies in environmental issues [11,12], sizing of energy storage issue for tidal energy [13], and regulation issues with other RES concerns in hydro energy [14]. Generally, solar and wind energy systems are thought to be the most promising of all RESs because of being environmental friendly, simple in nature, and readily available.
As mentioned, reliance on weather, climatic change, and their unpredictable nature are typical issues for RES-based energy systems. This problem is said to be reduced by combining more than one source as a hybrid energy system to improve reliability and performance [15]. In a successful hybrid, energy sources complement each other [16], which means that the strength of one source can help in reducing the other’s weakness, which improves the system efficiency and reliability. In reference [17], combined heat and power (CHP), wind power, ESS, and local distributed power generation are combined for improved power supply reliability and response during emergencies. A proposed hybrid energy system in [18] which combined PV array, wind power, ESS, fuel cell (FC), and a diesel generator was developed for standalone MG in Batanes, Philippines to satisfy the load demand in the area. An integration in the main grid of a wind, solar, and hydro energy system in [19] provided a reliable power system in Ethiopia which reduces power interruption. Lastly, Ref. [20] models a hybrid renewable power system for Calayan Island, Cagayan, considering PV, wind turbines, diesel generators, a micro-hydro plant, and batteries.
In the above-mentioned studies where combined energy systems were maximized for power reliability, Refs. [17,19] failed to consider load demand forecasting for predicting future consumption for operation in a certain area; also, Ref. [17] failed to consider available meteorological forecasted data factors in power production such as wind speed, irradiance, and temperature. In addition, Refs. [17,18,19] failed to evaluate grid frequency performance as the penetration of a RES in a grid will create negative impact which affects the safeness, stability, and reliability of the operation; they also failed to operate the system in either grid-connected, islanded, or isolated operations.
This study focuses on studying the local power distribution in the Philippines, where the existing limitations have been surpassed. A proposed hybrid microgrid system, combining photovoltaic (PV) and fuel cell (FC) technologies without a storage facility, is designed. The objective is to optimize load forecasting and upgrade the distribution system by 2030. This is achieved by utilizing previous historical load demand data through an interpolation method to predict future load demand values.
In order to determine the feasibility of producing sufficient energy to support the local power distribution system, careful consideration is given to available meteorological data. Additionally, an embedded algorithm for maximum power point tracking (MPPT) control is implemented to address uncertainties associated with energy harnessing.
The hybrid microgrid system operates in two modes: on-grid mode, where both PV-FC and the local grid alternately supply the system, and islanded mode, where the system is solely supplied by PV-FC using a modified voltage source converter (VSC).
To enhance the design process, a robust design approach incorporating various factors is developed. Furthermore, the effectiveness of the proposed modified VSC is evaluated using the IEEE-14 Bus Test System configuration.
The major contributions of this paper can be summarized as follows.
  • A proposed hybrid microgrid in a local power distribution system that can operate in grid-connected, islanded, or isolated mode.
  • A proposed system algorithm for local power distribution system load forecasting and RES generation sizing based on available meteorological data.
  • Performance evaluation and analysis of the proposed system using Matlab/Simulink.
  • Generation of a test case system with application of the Taguchi design method for optimizing the design parameters of the proposed distribution system.
  • Evaluation of the effectiveness of a modified voltage frequency control strategy to operate in on-grid and off-grid modes based on the IEEE 14 Bus Test System.
Successful results and implementation of the system innovate the deployment of a hybrid microgrid system in a local power distribution system.
The remainder of this work is organized as follows: Section 2 provides an overview of the QUEZELCO 1 Distribution System. The design systems for PV, FC, and modified VSC are explained and defined in Section 3. Section 4 presents different case studies, evaluation processes, simulations, results, and discussions. Lastly, Section 5 discusses the conclusion of the study and its implications.

2. Problem Description

This section presents the various system designs and methodologies that will be implemented in this study. The focus will be on remodeling the Quezon Electric Cooperative 1 (QUEZELCO 1) Distribution System into an MG system, incorporating PV and FC technologies. The mathematical models of each component will be discussed in the following subsection. To validate the proposed model, a case study analysis will be conducted, considering different utility, PV, and FC system schedules. The Taguchi Method will be employed to further validate the proposed design through a series of test experiments. The optimized configuration resulting from this analysis will be implemented using the IEEE-14 Bus Test System.

2.1. System Designs

2.1.1. QUEZELCO 1 Distribution System

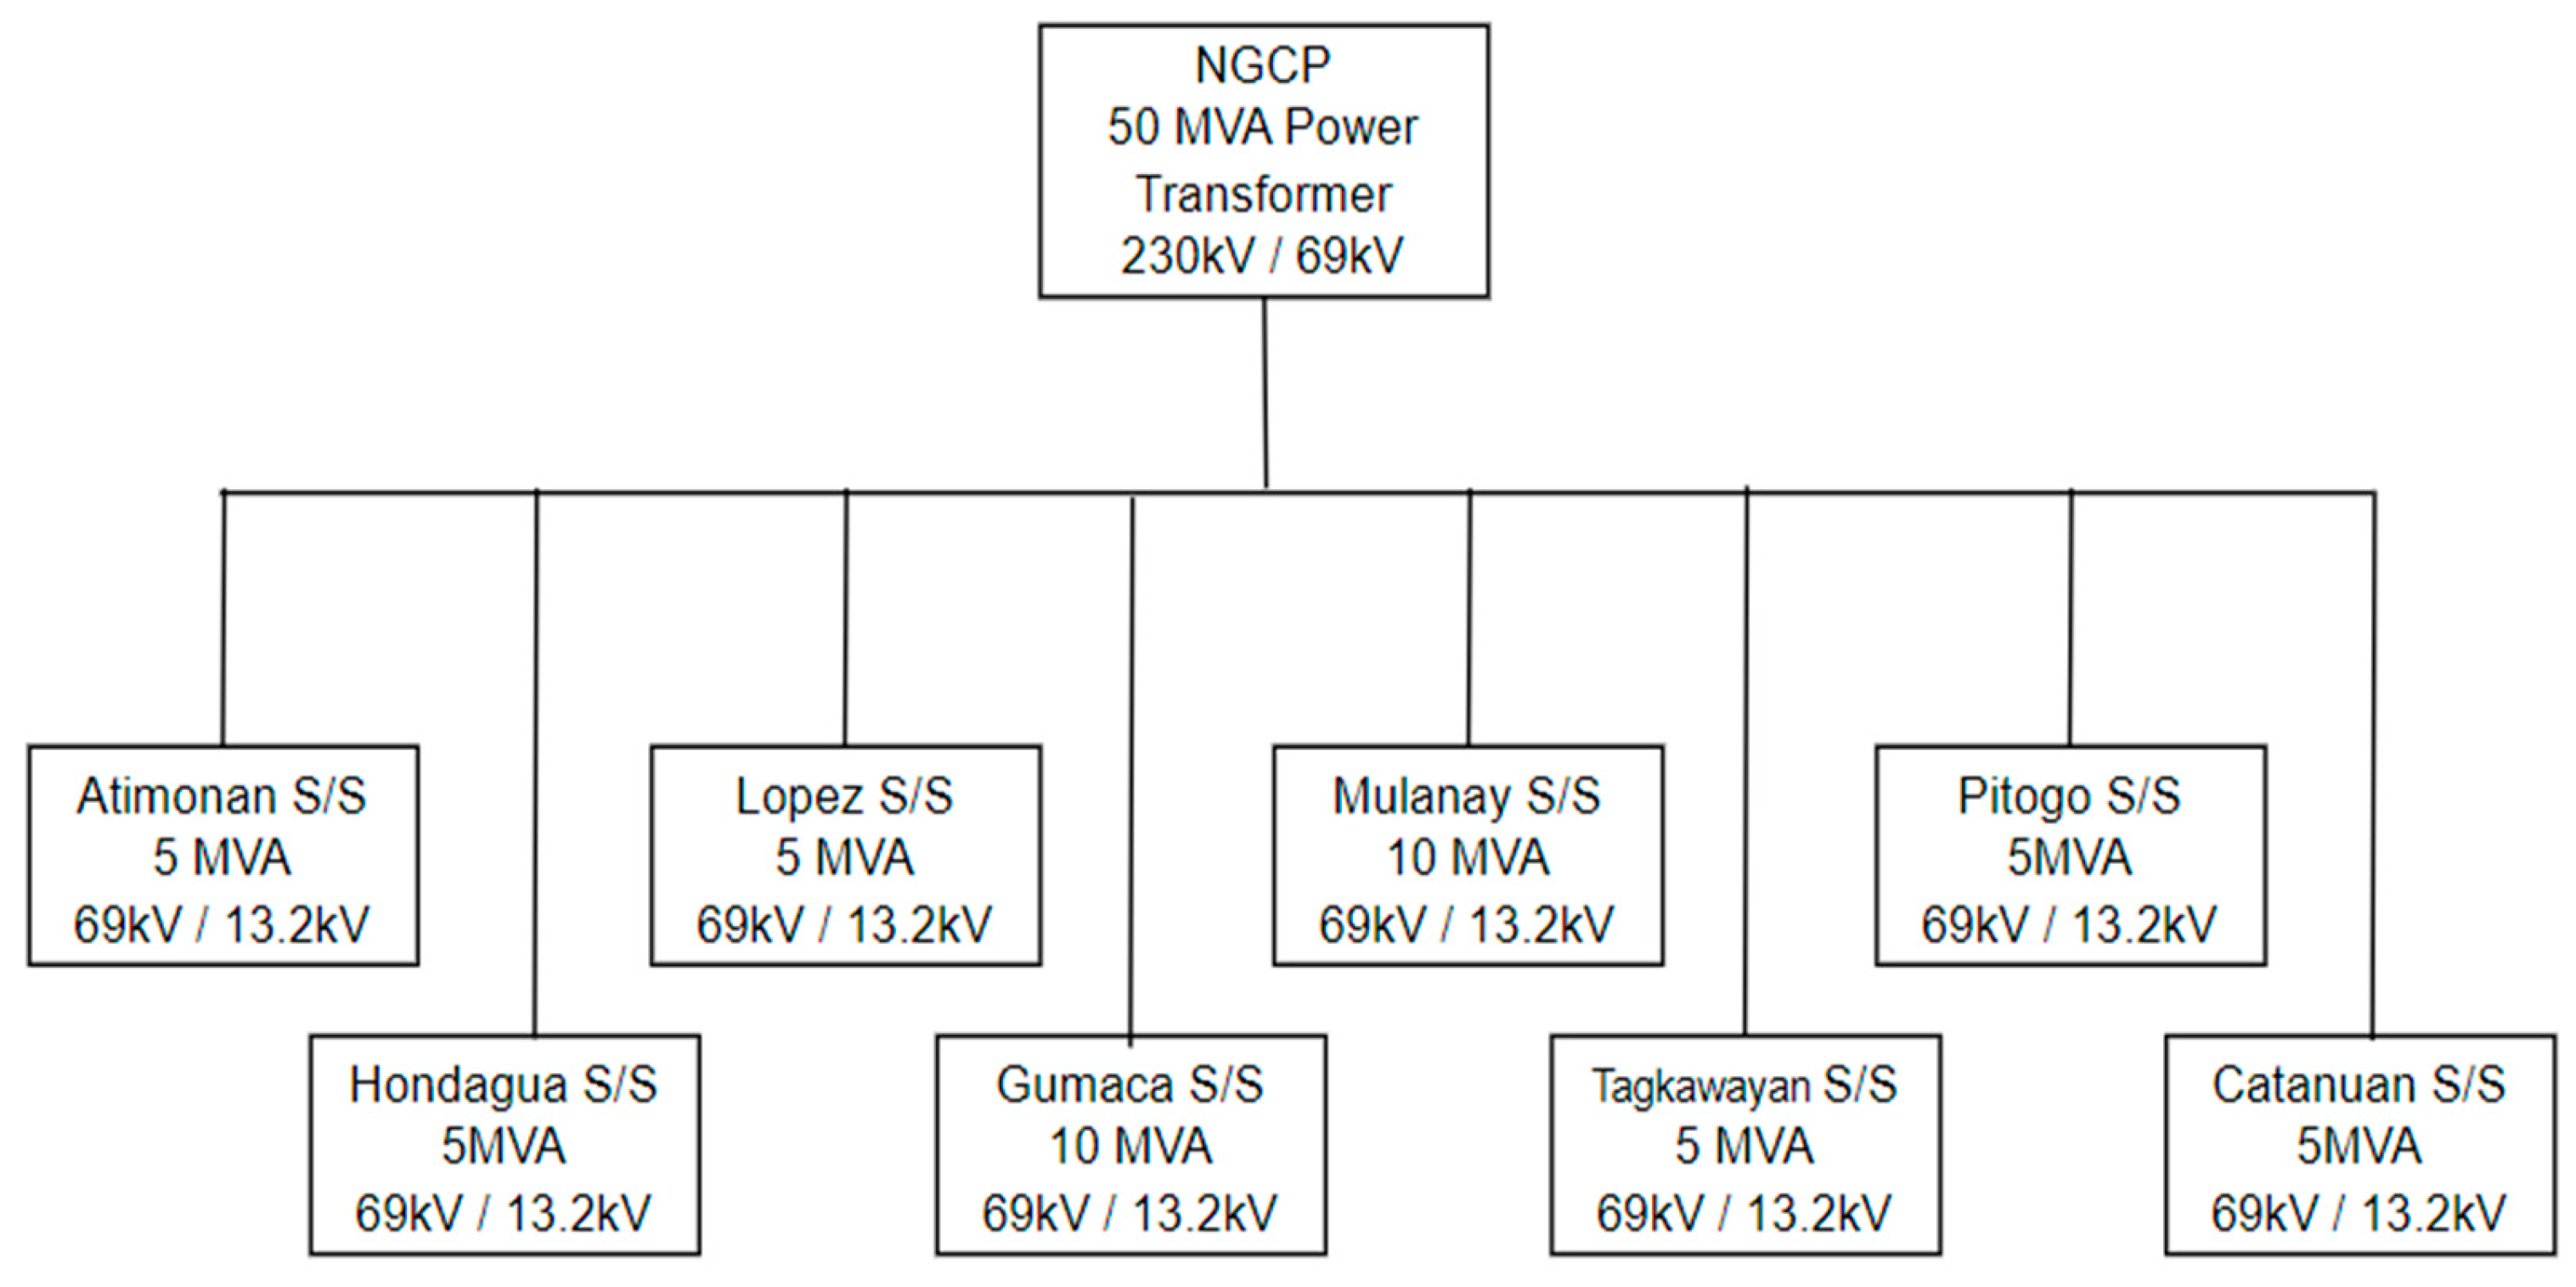
QUEZELCO 1, a prominent electric cooperative in Southern Philippines, serves as the primary electricity provider for the majority of Quezon Province. The distribution system of QUEZELCO 1 is outlined in Figure 2. It consists of eight substations, namely Gumaca, Pitogo, Lopez, Atimonan, Catanuan, Mulanay, Tagkawayan, and Hondagua, each equipped with Y-▲ configuration transformers and operating at a voltage level of 69/13.2 kV. The overall capacity of the distribution system is 50 MVA, and it receives power supply from NGCP.
Table 1 presents the projected energy demand for each substation by the year 2030. Based on the 2016 power factor and the current transformer sizes, it is evident that a significant number of substations will exceed the loading capacity of their transformers. Consequently, upgrading the transformer capacity becomes imperative. The exponential smoothing model [21,22] is employed to forecast the peak demand, and this data is incorporated into the project to assess the necessity of upgrading or increasing the capacity of the substations.
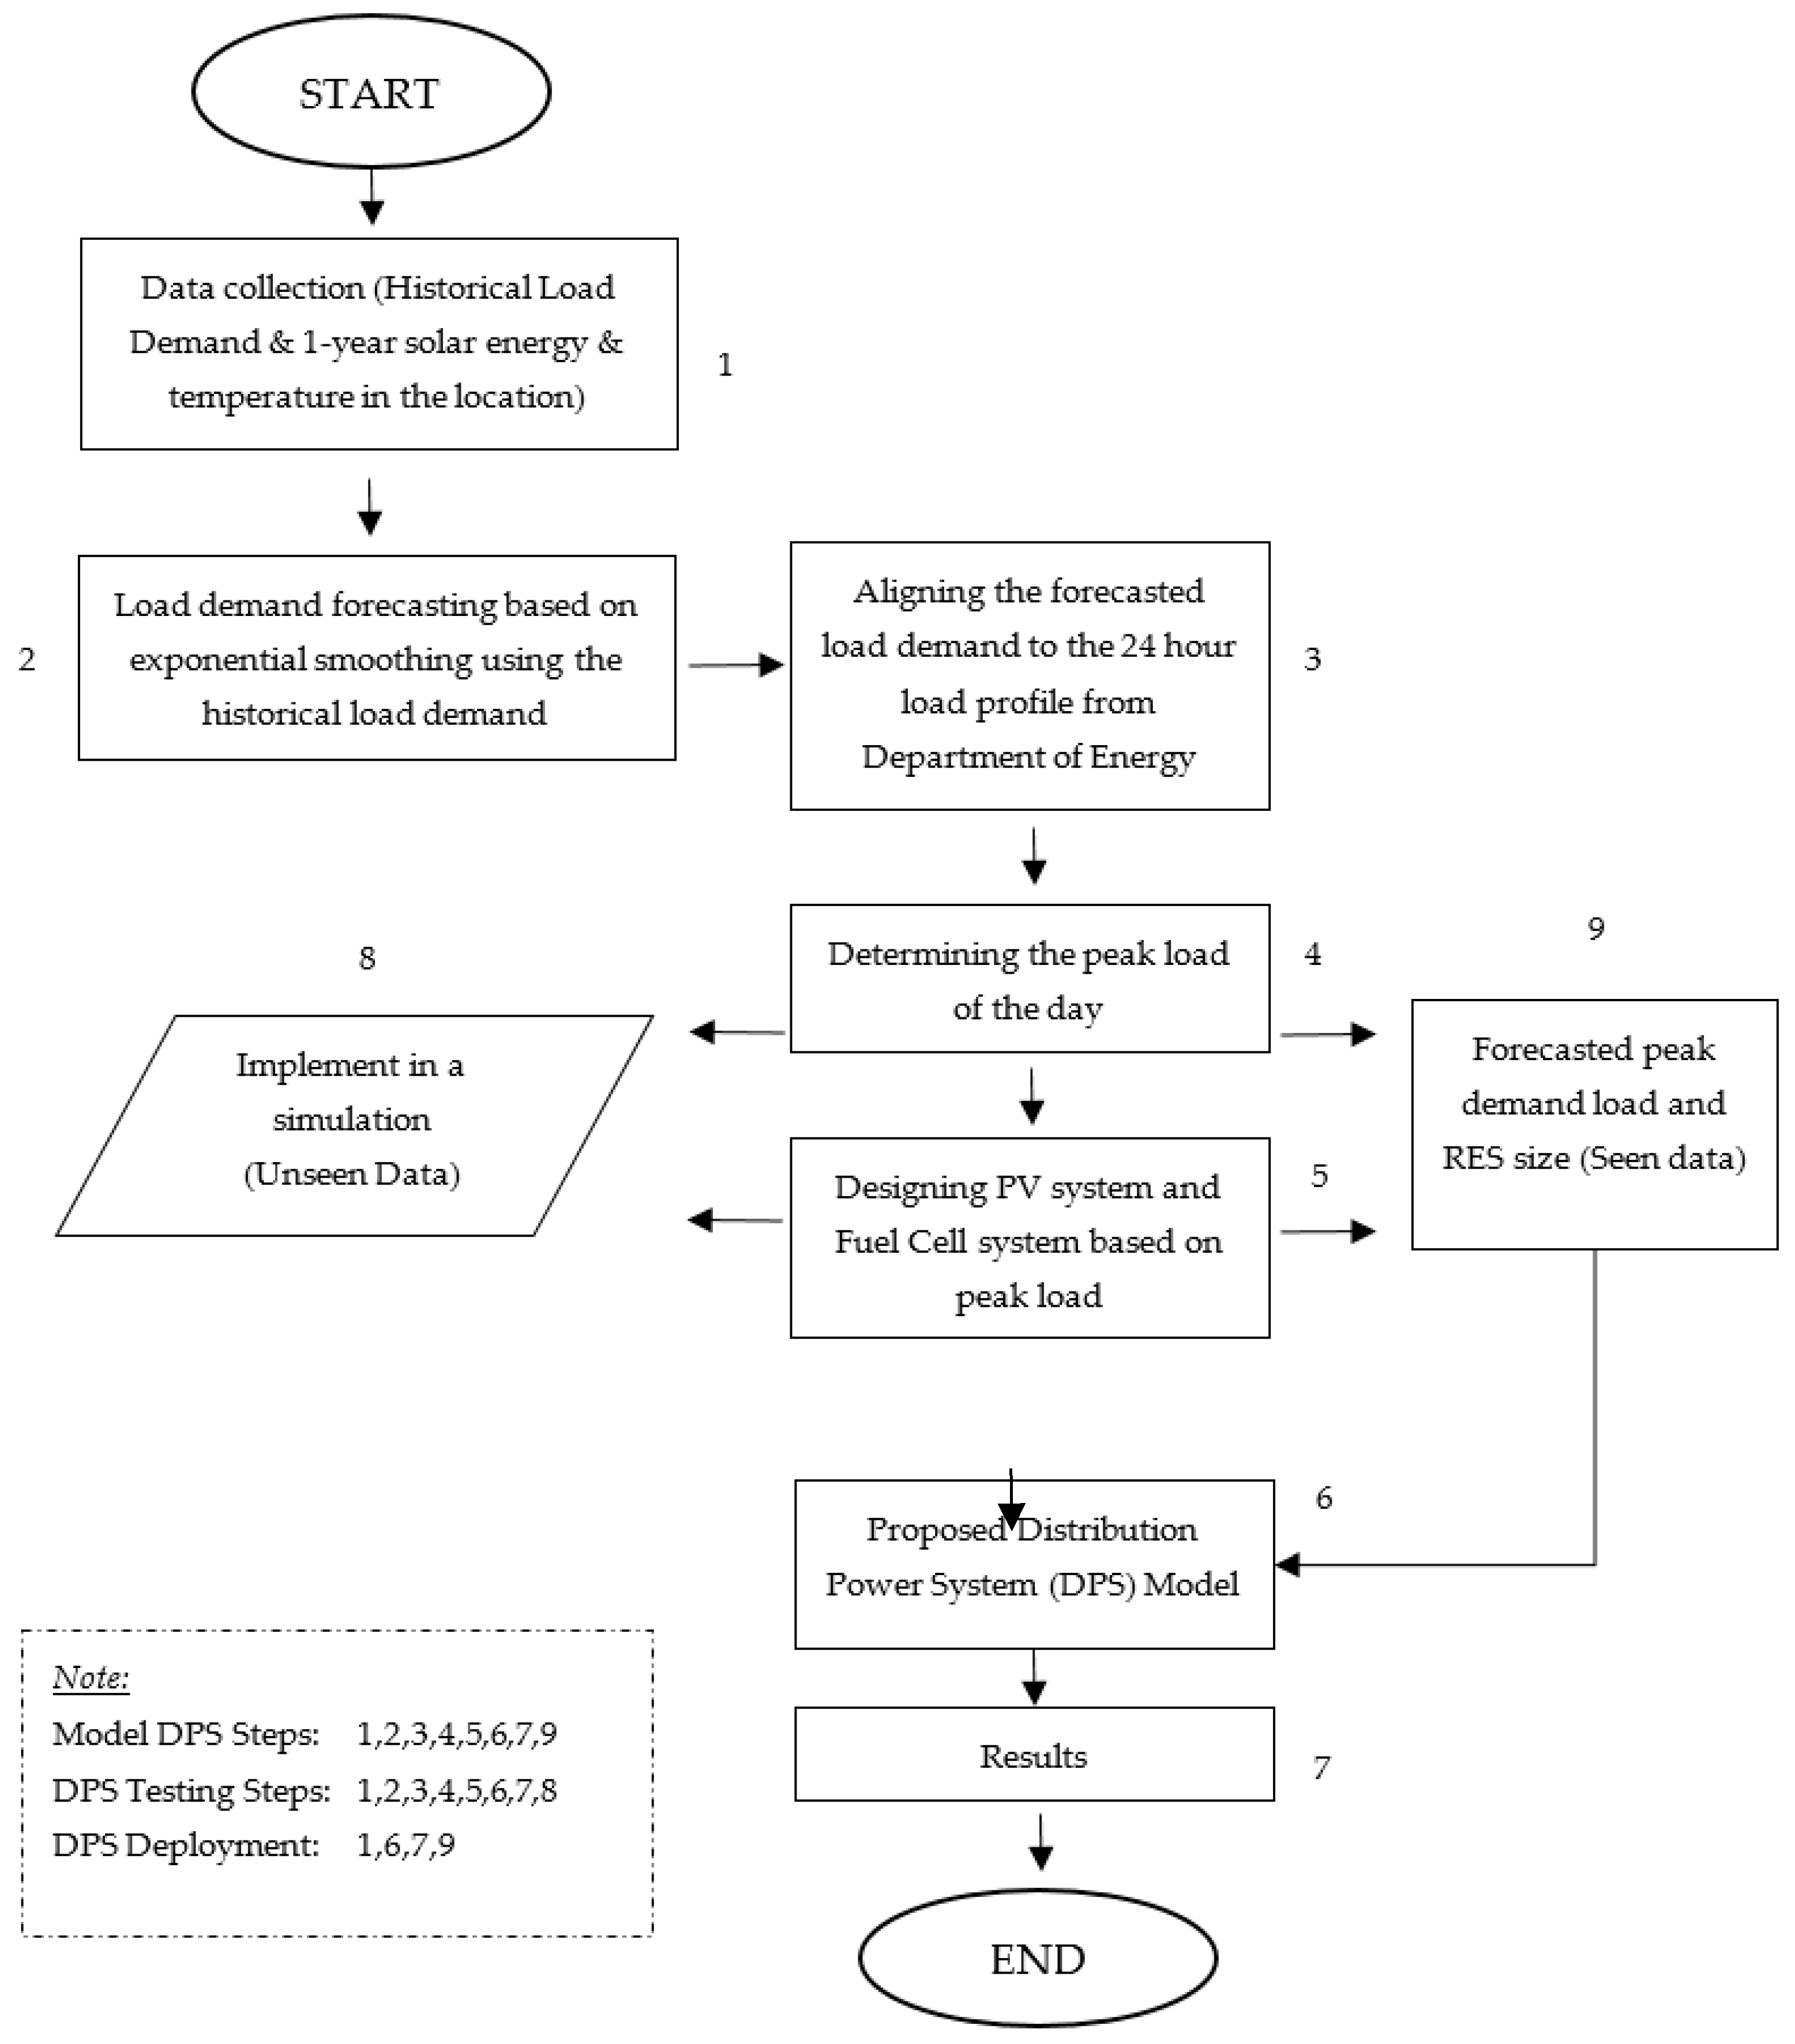
Figure 3 shows the system algorithm for load demand forecasting and RES generation sizing. Historical energy demand from previous years and 1-year series of meteorological data from the location are the foundation of the proposed system algorithm. From the data acquired, the load demand forecasting shall process using exponential smoothing. Sizing of RES generation shall be taken after forecasting the load demand. From the forecasted load demand, RES size shall be determined with careful consideration of meteorological data. After completing the design for the PV and FC system, a simulation will be implemented with the forecasted load demand to determine if the PV and FC system works.
The Department of Energy (DOE) average hourly data and the QUEZELCO 1 2014–2016 energy data are the references in the forecasting for hourly-power demand (HPD). Forecasted HPD is the product of forecasted peak demand (FPD) and the ratio between the DOE average hourly-power demand ( HPD DOE ) and the DOE average peak demand ( PD DOE ). Its concept can be traced in [23] and can be expressed by
HPD Forecasted = FPD Forecasted   ×   HPD DOE PD DOE
After forecasting the peak demand by 2030 using Excel with a 95% confidence interval rating of transformer sizes, forecasted demand shall be designed with consideration of the concept in [24], where the minimum sizes for transformers can be obtained by applying a 0.96 power factor and can be expressed as
KVA Minimum = FPD   pf  

2.1.2. Proposed Microgrid System

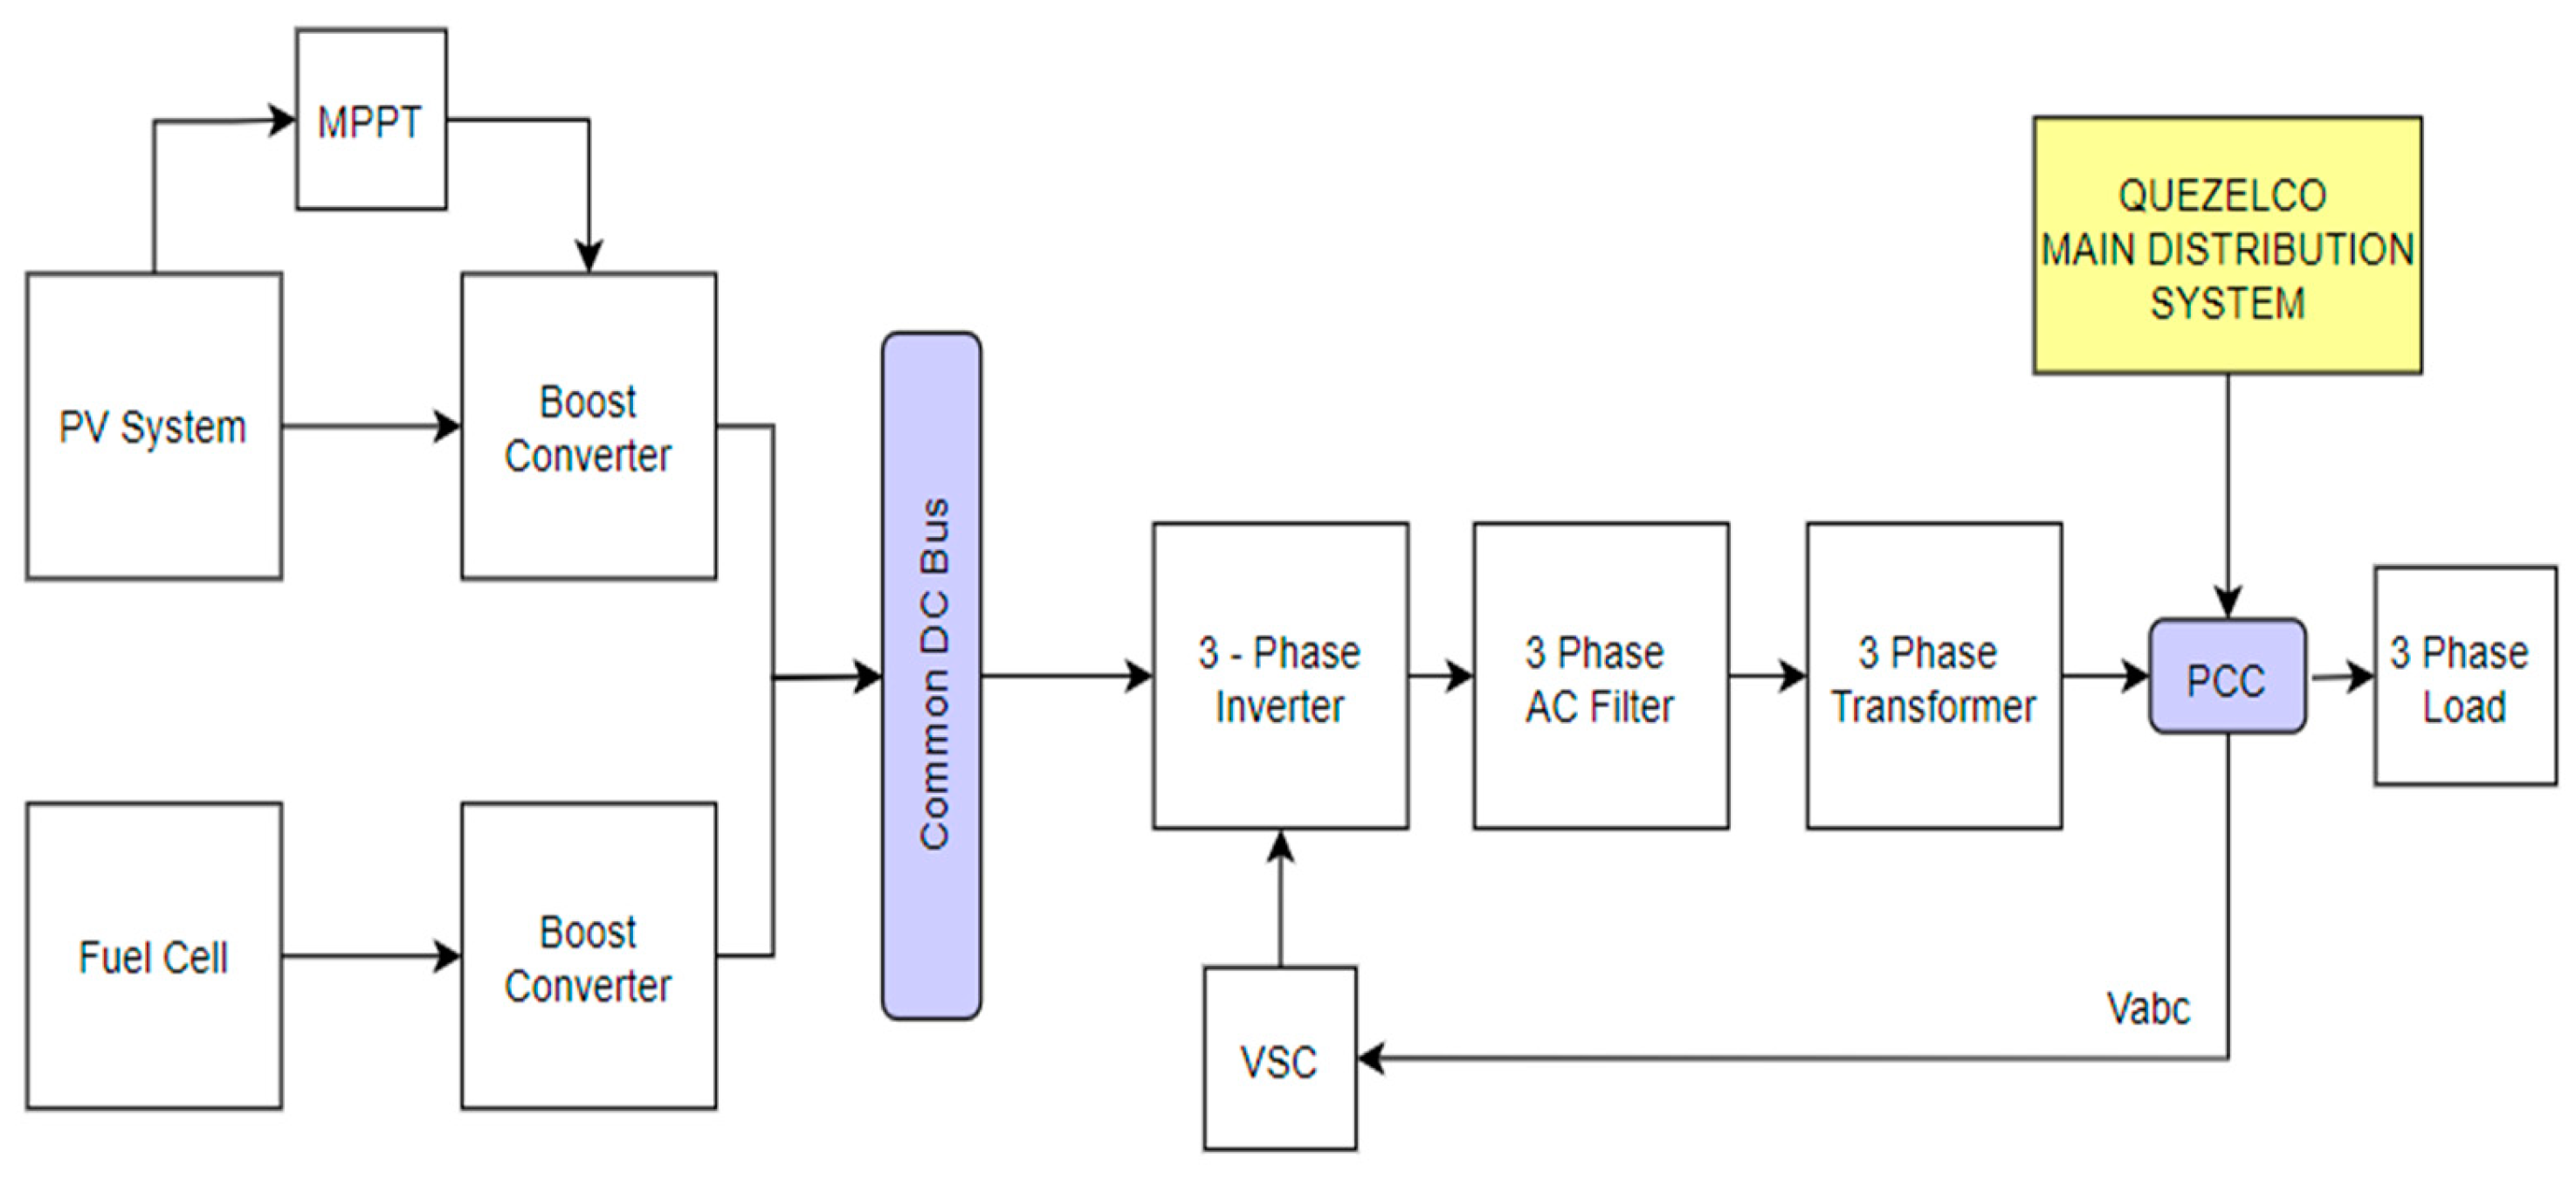
Figure 4 presents the general diagram of the simulated proposed microgrid system, which includes renewable energy sources (RESs), the QUEZELCO 1 distribution grid, an AC filter, and a voltage source converter (VSC). An ideal power source is used to represent the fuel cell (FC) and photovoltaic (PV) systems within the microgrid. The concept of a microgrid system without an energy storage system (ESS), as discussed in [24,25,26,27,28], has demonstrated promising results, indicating the potential of the proposed microgrid system in this paper to also achieve satisfactory outcomes.
In [25], a comparison was made between a PV–FC system operating in a DC bus and an AC bus system, with the results showing that the AC bus system is more efficient. Moreover, Ref. [26] presented a combined wind–FC model, evaluated the controllability of the system using two control strategies, and found satisfactory results under varying wind speeds and loads. In addition, Ref. [27] modeled a combined PV–solid oxide fuel cell (SOFC) system to supply a local distribution system, resulting in improved reliability according to their simulations. Similarly, Ref. [24] designed a combined PV–power electronic fuel cell model to supply electric boats, successfully implementing Fuzzy Energy Management. Ref. [28] studied and met the energy supply demands of a region in Lebanon using a hybrid system combining thermal solar, wind, and fuel cell technologies, driven by renewable energy sources.
The proposed hybrid microgrid system is connected to the grid via the point of common coupling (PCC). The 69 kV grid, operating at a frequency of 60 Hz, is stepped down to 13.2 kV using a step-down transformer. In the third case of the study, all energy sources are combined to supply the system based on predefined conditions. Furthermore, the proposed MG system incorporates the proposed controller to ensure effective operation and control.

2.1.3. Photovoltaic (PV) System

The proposed MG system combines a PV system and FC system. The PV system is generally consisting of a series-connected set of cells in a combiner box and then connected to PV inverters interfaced to the ac bus. The proposed PV system utilized the design in [23]. The application of a boost converter circuit boosted the voltage from the PV panels while the voltage regulator regulates, and the relation is shown in Figure 5. MPPT with the perturb and observe (P and O) algorithm in [29] was utilized in the proposed design; this algorithm depends on the voltage and power values over time for the duty cycle switching.
The PV system’s main basic component is the solar cell. It is a semiconductor junction p–n type of cell where the current and voltage relations are characterized and can be expressed by
I PV = n p I SC   n p I o   exp q ( V PV + R S I PV ) AkTn s   1 n p V PV + R S I PV n s R sh
The VPV corresponds to the solar cell’s voltage output, IPV to the solar cell’s current output, Rs to the series resistance of the cell, and Rsh to the shunt resistance of the cell. In addition, q is the charge of electrons, ISC is light-generated current, Io is the reverse saturation current, A is a dimensionless junction material factor, k is the Boltzmann constant, T is the temperature, and nP and nS are the number of parallel and series connected cells, respectively.
In obtaining the maximum power, the duty cycle of the switch is controlled by MPPT in the proposed work. The design of MPPT requires input voltage (Vin) and control input current (Iin) to determine the slope of the control. Hence, obtained Power (Pin) and slope can be expressed by
P in n = V in n   ×   I in ( n )
Slope = P in n   P in n     1 V in n   V in n     1

2.1.4. Fuel Cell (FC) System

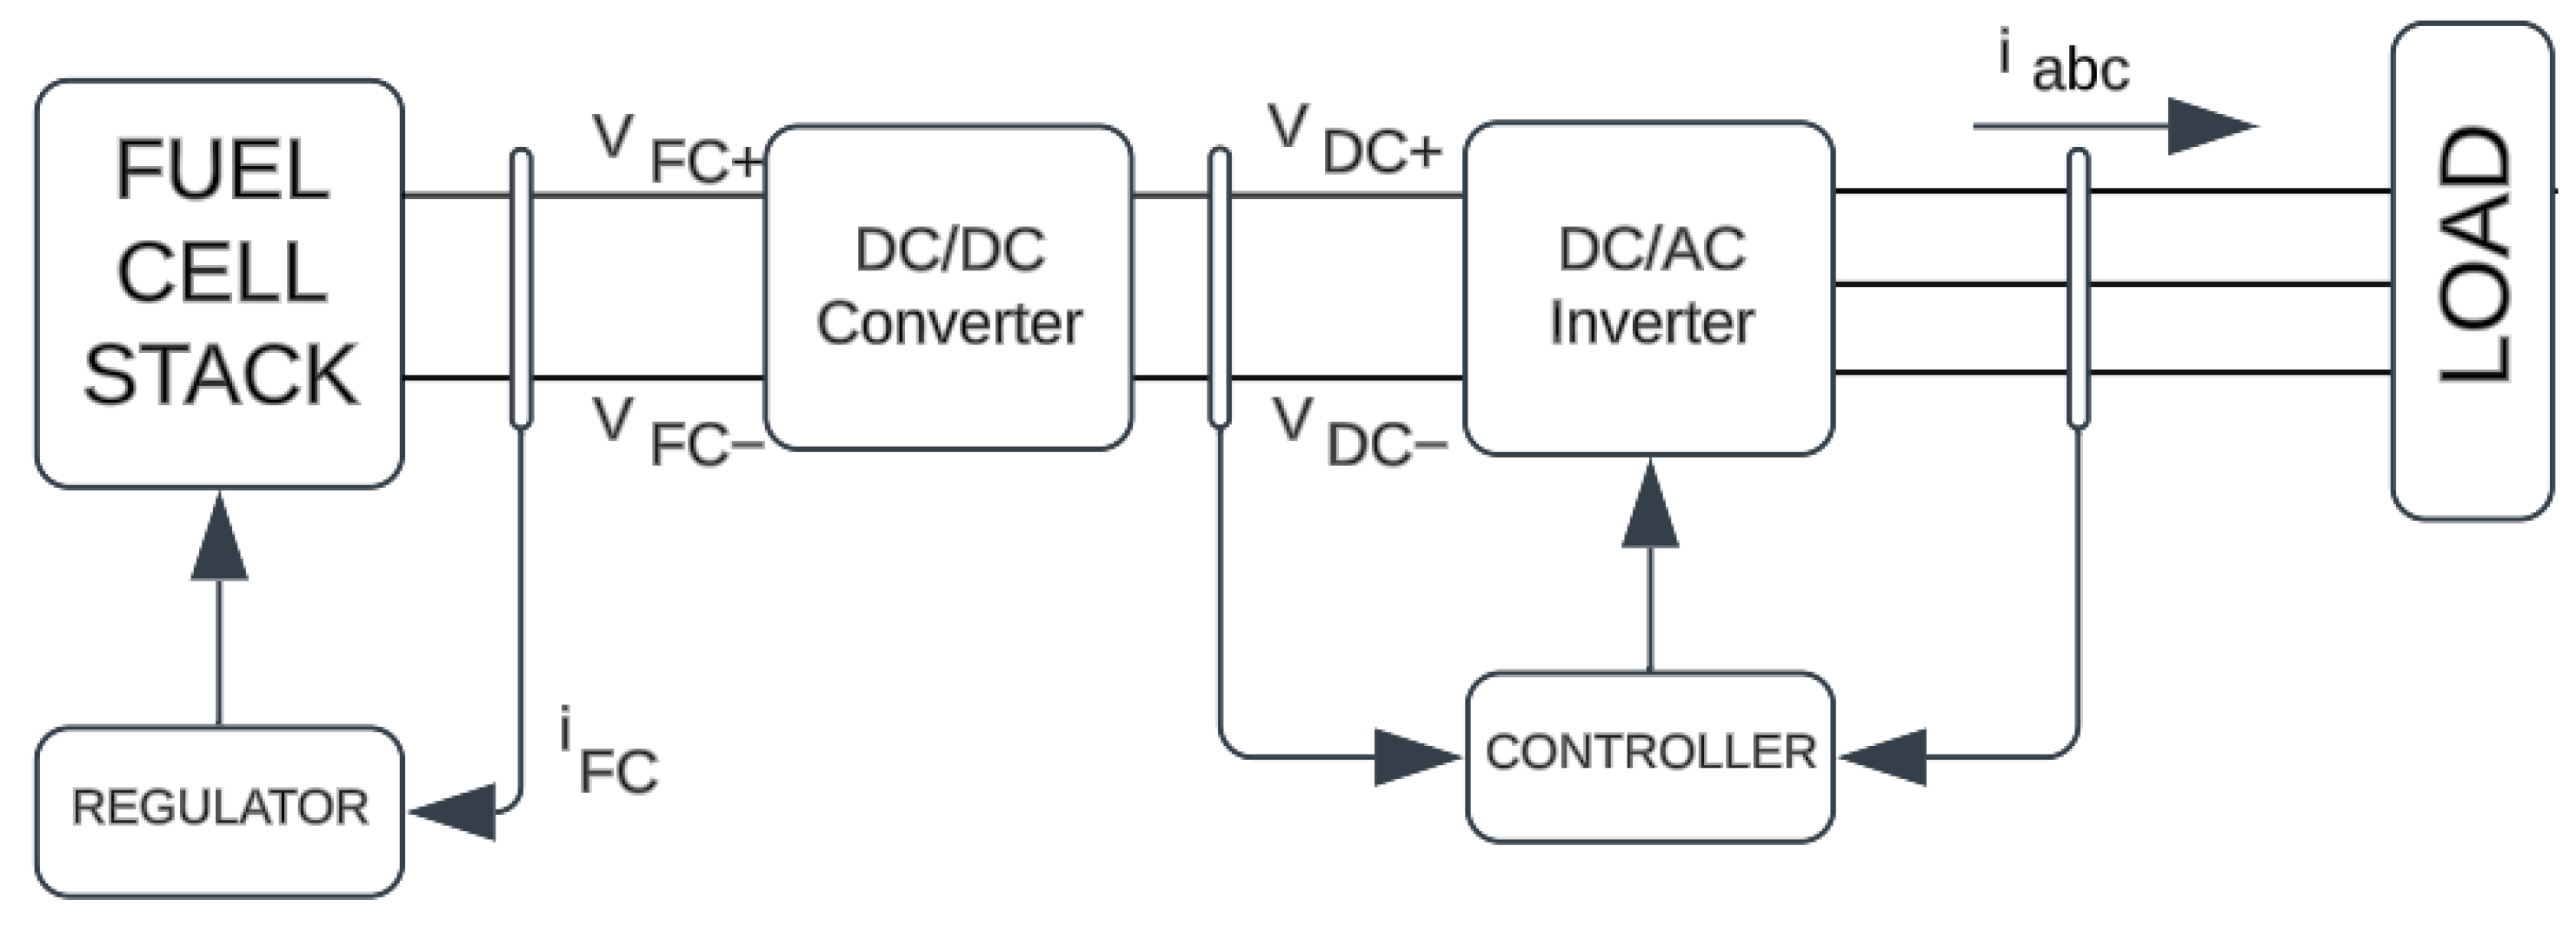
The model used for the proton exchange membrane fuel cell (PEMFC) is shown in Figure 6 and is further discussed in [30]. The PEFMC is fueled by hydrogen from hydrogen storage and oxygen (air) for DC air pump. This model is based on a relationship between the Nernst voltage and the average magnitude of the fuel cell stack voltage.
V FC = N o E     V Loss
where  V FC  is the voltage generated from fuel cell,  N o  is the number of series-connected fuel cells, E is the Nernst voltage, and  V Loss  is the voltage losses that are irreversible. Nernst voltage (E) developed in the (7) can be defined as
E = E o + E RT 2 F ln p H 2 p O 2 p H 2 O
where  E o    is the associated voltage in the response of free energies, R is the ideal gas constant, F is the Faraday’s constant, T is the absolute fuel cell temperature,  p H 2  is the partial pressure of hydrogen in the anode,  p O 2    is the partial pressure of oxygen, and  p H 2 O  is the water available in the cathode.
q H 2 = 2 K r I FC
Hence, the output power of a fuel cell is expressed as
P FC = V FC I FC
The difference in the useful cell voltage ( E cell )  in a fuel cell system can be attributed to the overpotentials at the anode and cathode ( η a / c ) as well as the ohmic losses ( E Ω ) . The useful cell voltage can be expressed as follows:
E cell = E     ( η a + η c )     E Ω
The overpotentials ( η a / c ) can be expressed using the Tafel approximation.
η a / c = b a / c   ×   ln   ( i i o ( a / c ) )
where  b a / c  is the Tafel slope,  i o ( a / c )  is the exchange current density for anode/cathode where it ranges between 0.8 × 10⁻⁹ and 8.7 × 10⁻⁹ A cm−2, and i is the current density which is described using the Butler–Erdey–Gruz–Volmer equation:
i = i o   ( exp   ( α a F R g T   ×   η a )   exp   ( α c F R g T )   ×   η c )  
where  i o  is the reference current density,  α a / c  is the anodic/cathodic transfer coefficients, F is the Faraday’s constant value of 96,485 C mol−1, R is resistance, and T is temperature. The ohmic losses ( E Ω )  are the product of the effective current density ( i ) and the total resistances (R), including electronic resistance such as contact and bulk components. It can be expressed as
E Ω = i R = i ( R anode + R cathode + R membrane   R electronic )  
where resistance can be obtained by
R x = η x i

2.1.5. Voltage Source Controller

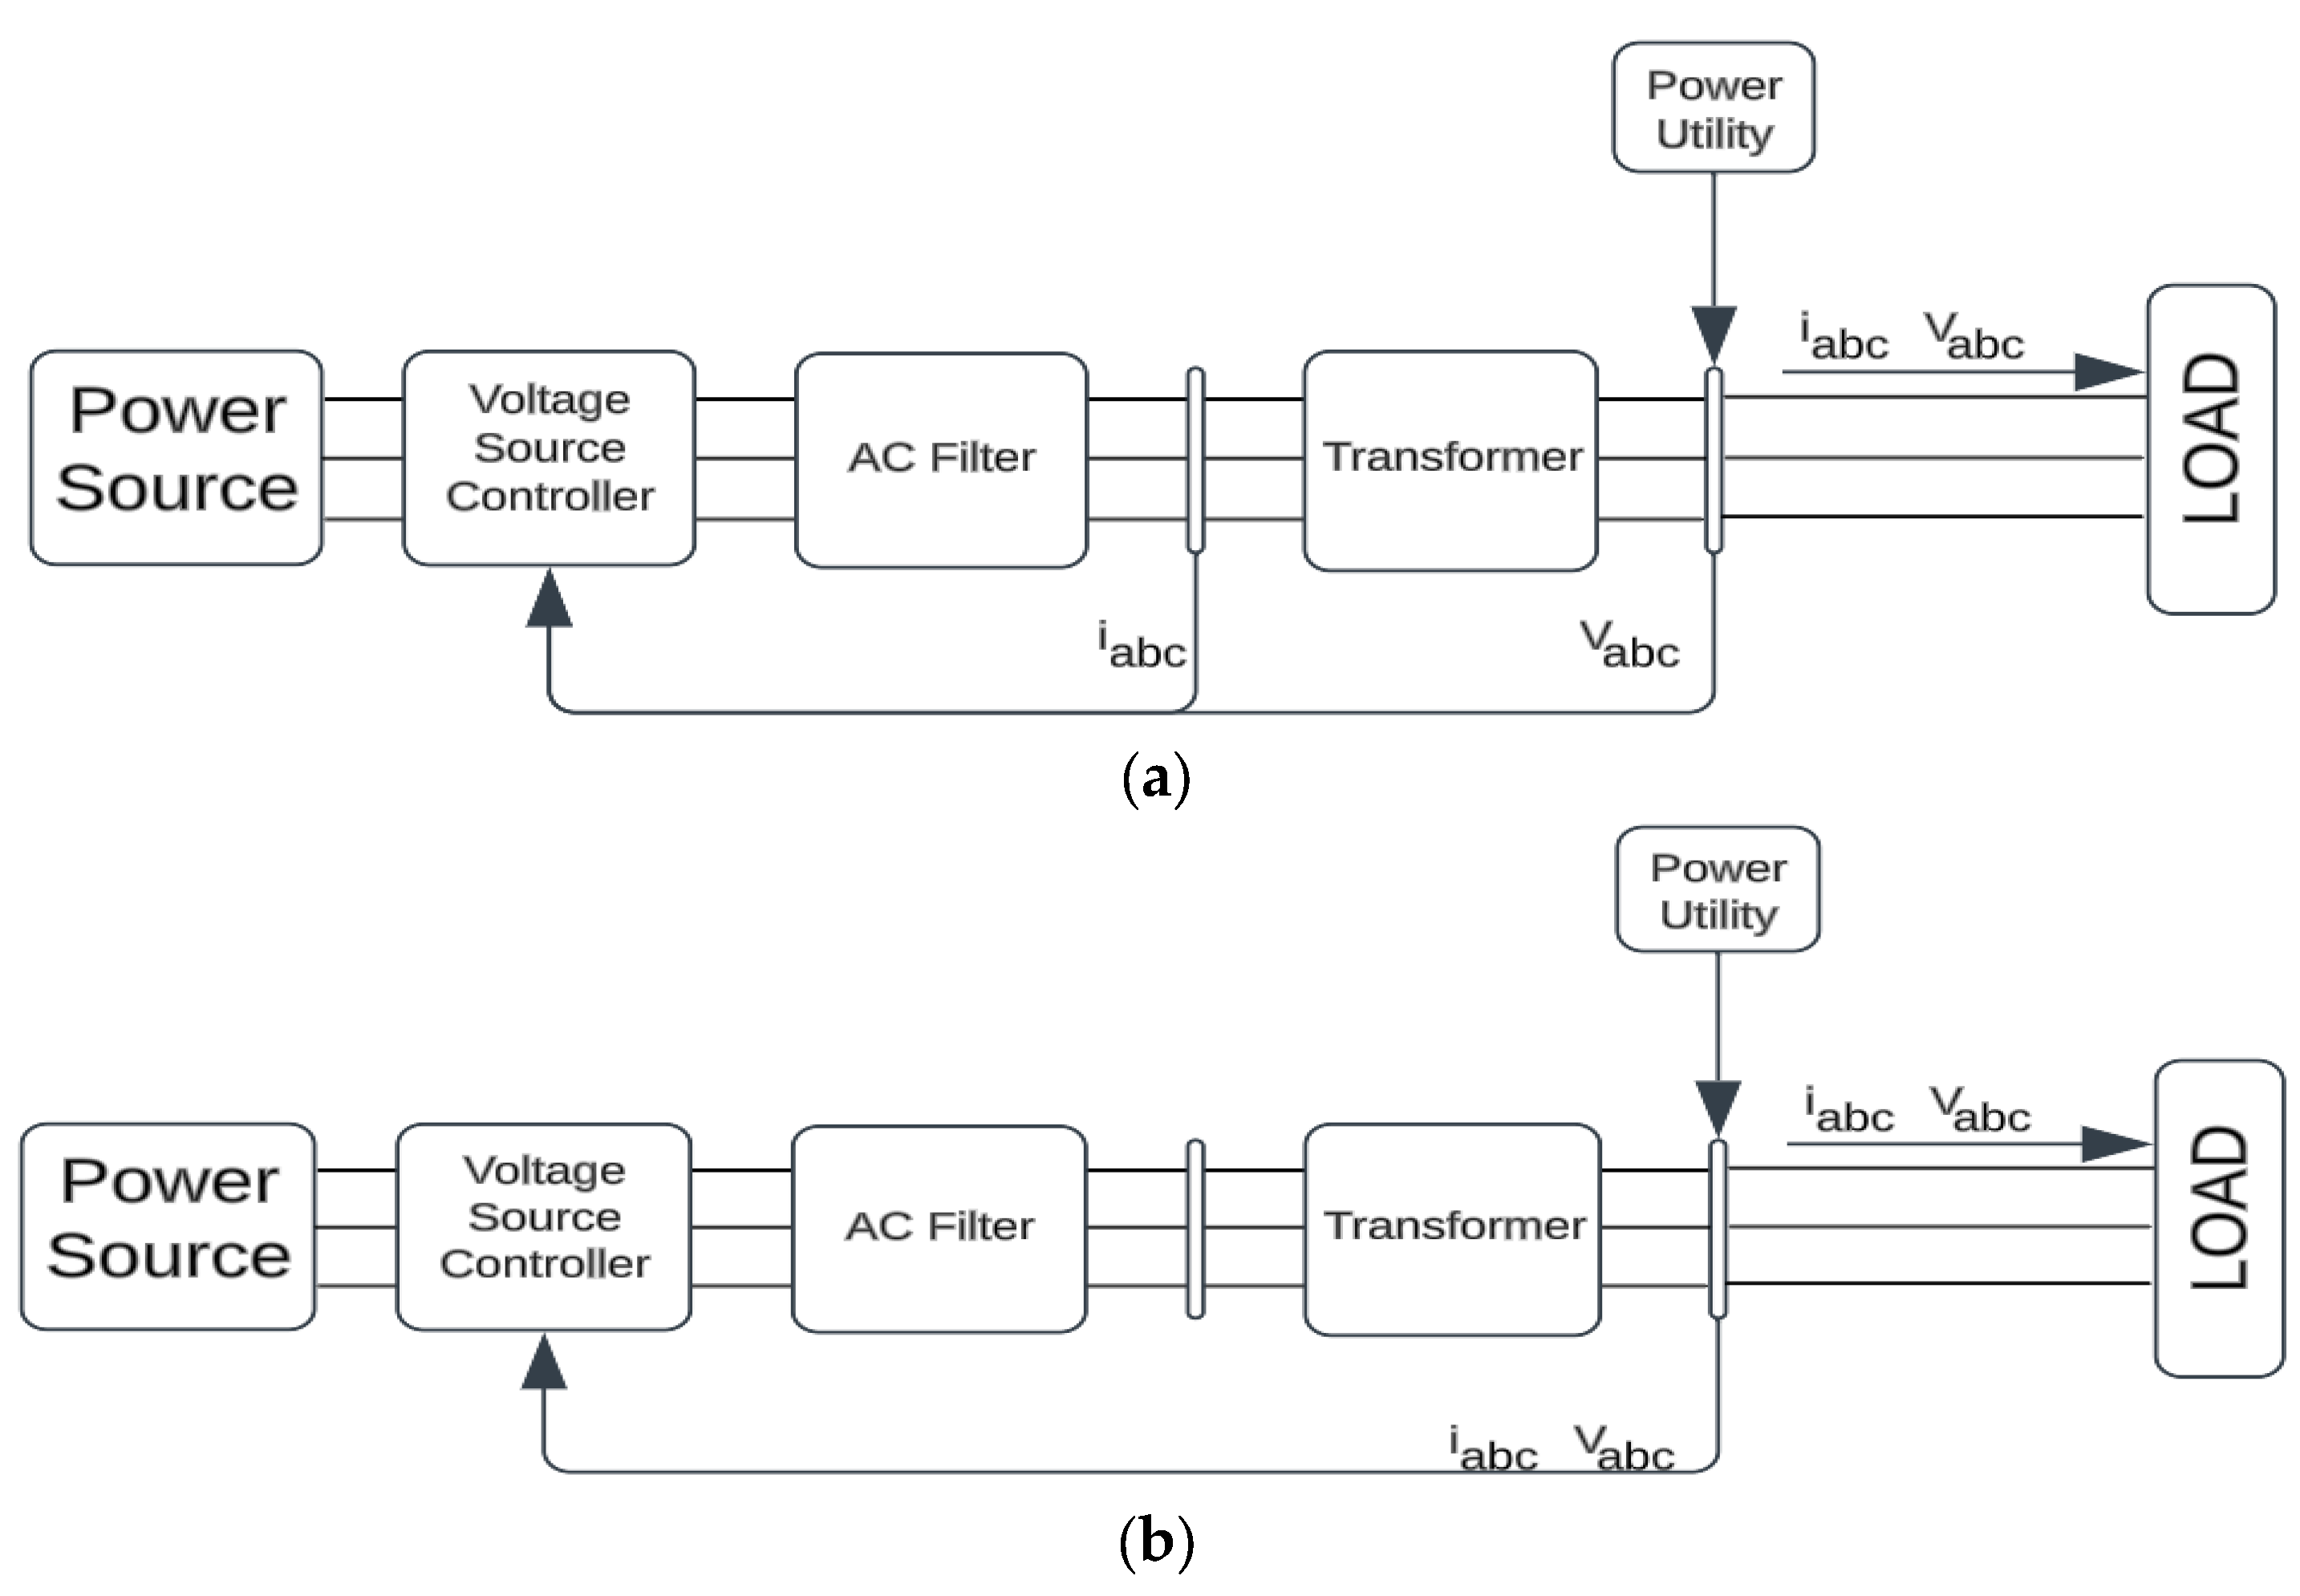
The equivalent model for the conventional VSC and the modified VSC connected to the three-phase grid is shown in Figure 7. Figure 7a shows the control system for conventional VSC, consisting of two loops: the inner control loop for load current obtained from the AC filter and the other loop for the grid voltage from the PCC which is under a phase-locked loop to provide the angle transformation [31].
To simplify the structure and enable direct control capability of power, the modified VSC eliminates the inner control loop to regulate the active and reactive power directly. The mathematical model can be transformed into a synchronous reference frame. The voltage and current relationship are defined as
V d 1 = R id + L d id dt + w s L id + V d
V q 1 = R iq + L d iq dt + w s L iq + V q
where  W s , is the AC system angular frequency,  V d ,   V q ,   V d 1 ,  and  V q 1  represent both d and q components of the point of common coupling (PCC) voltage    ( V a ,   V b   , V c ) and VSC output voltage  V a 1 ,   V b 1   , V c 1 , respectively. The d and q components of the current flowing between the AC system and the VSC is represented by  i d  and  i q .
The transformation and the control signals are used to generate pulses for the inverter. Equation (13) represents the voltage balance across the filter., where the Vgrid (Va, Vb, Vc) includes three phase load voltages and the Igrid (Ia, Ib, Ic) includes the three phase load currents.
V a V b V c = R I a I b I c + L d dt I a I b I c + V a V b V c

2.2. Methodology

2.2.1. Case Study

Three cases will be implemented to see the performance of the proposed model. In Case 1, the utility is responsible for providing power to the system continuously throughout the 24 h period. This case does not involve any RES. In Case 2, the system relies on both the FC and PV for the power supply. Table 2 and Table 3 illustrates the switching schedule for the FC, which is expected to supply power from 0100H to 0600H and from 1800H to 2400H. The FC acts as a backup power source in the absence of PV power. On the other hand, the PV system generates power during daylight hours, specifically from 0600H to 1800H when there is sufficient sunlight available. In Case 3, the utility takes over the power supply from 0100H to 0700H and from 2000H to 2400H. The utility supplies power during off-peak hours, taking advantage of lower energy rates during this time. The PV generation, on the other hand, supplies power to the system during peak hours, from 0800H to 1700H, when there is ample sunlight for harvesting. The FC provides support to the PV system by supplying power from 0700H to 0900H and from 1700H to 2000H, ensuring a continuous power supply even if the PV generation is insufficient.
Table 2 and Table 3 present the conditions and power schedules for the three different cases involving the utility, FC, and PV generation as power sources supplying the system. As indicated, in Case 1, the utility is the sole supplier of power to the system. In Case 2, the FC and PV system take turns supplying the system. Finally, Case 3 demonstrates that all energy sources alternate in supplying the system.

2.2.2. Evaluation and Verification Process

Taguchi Method

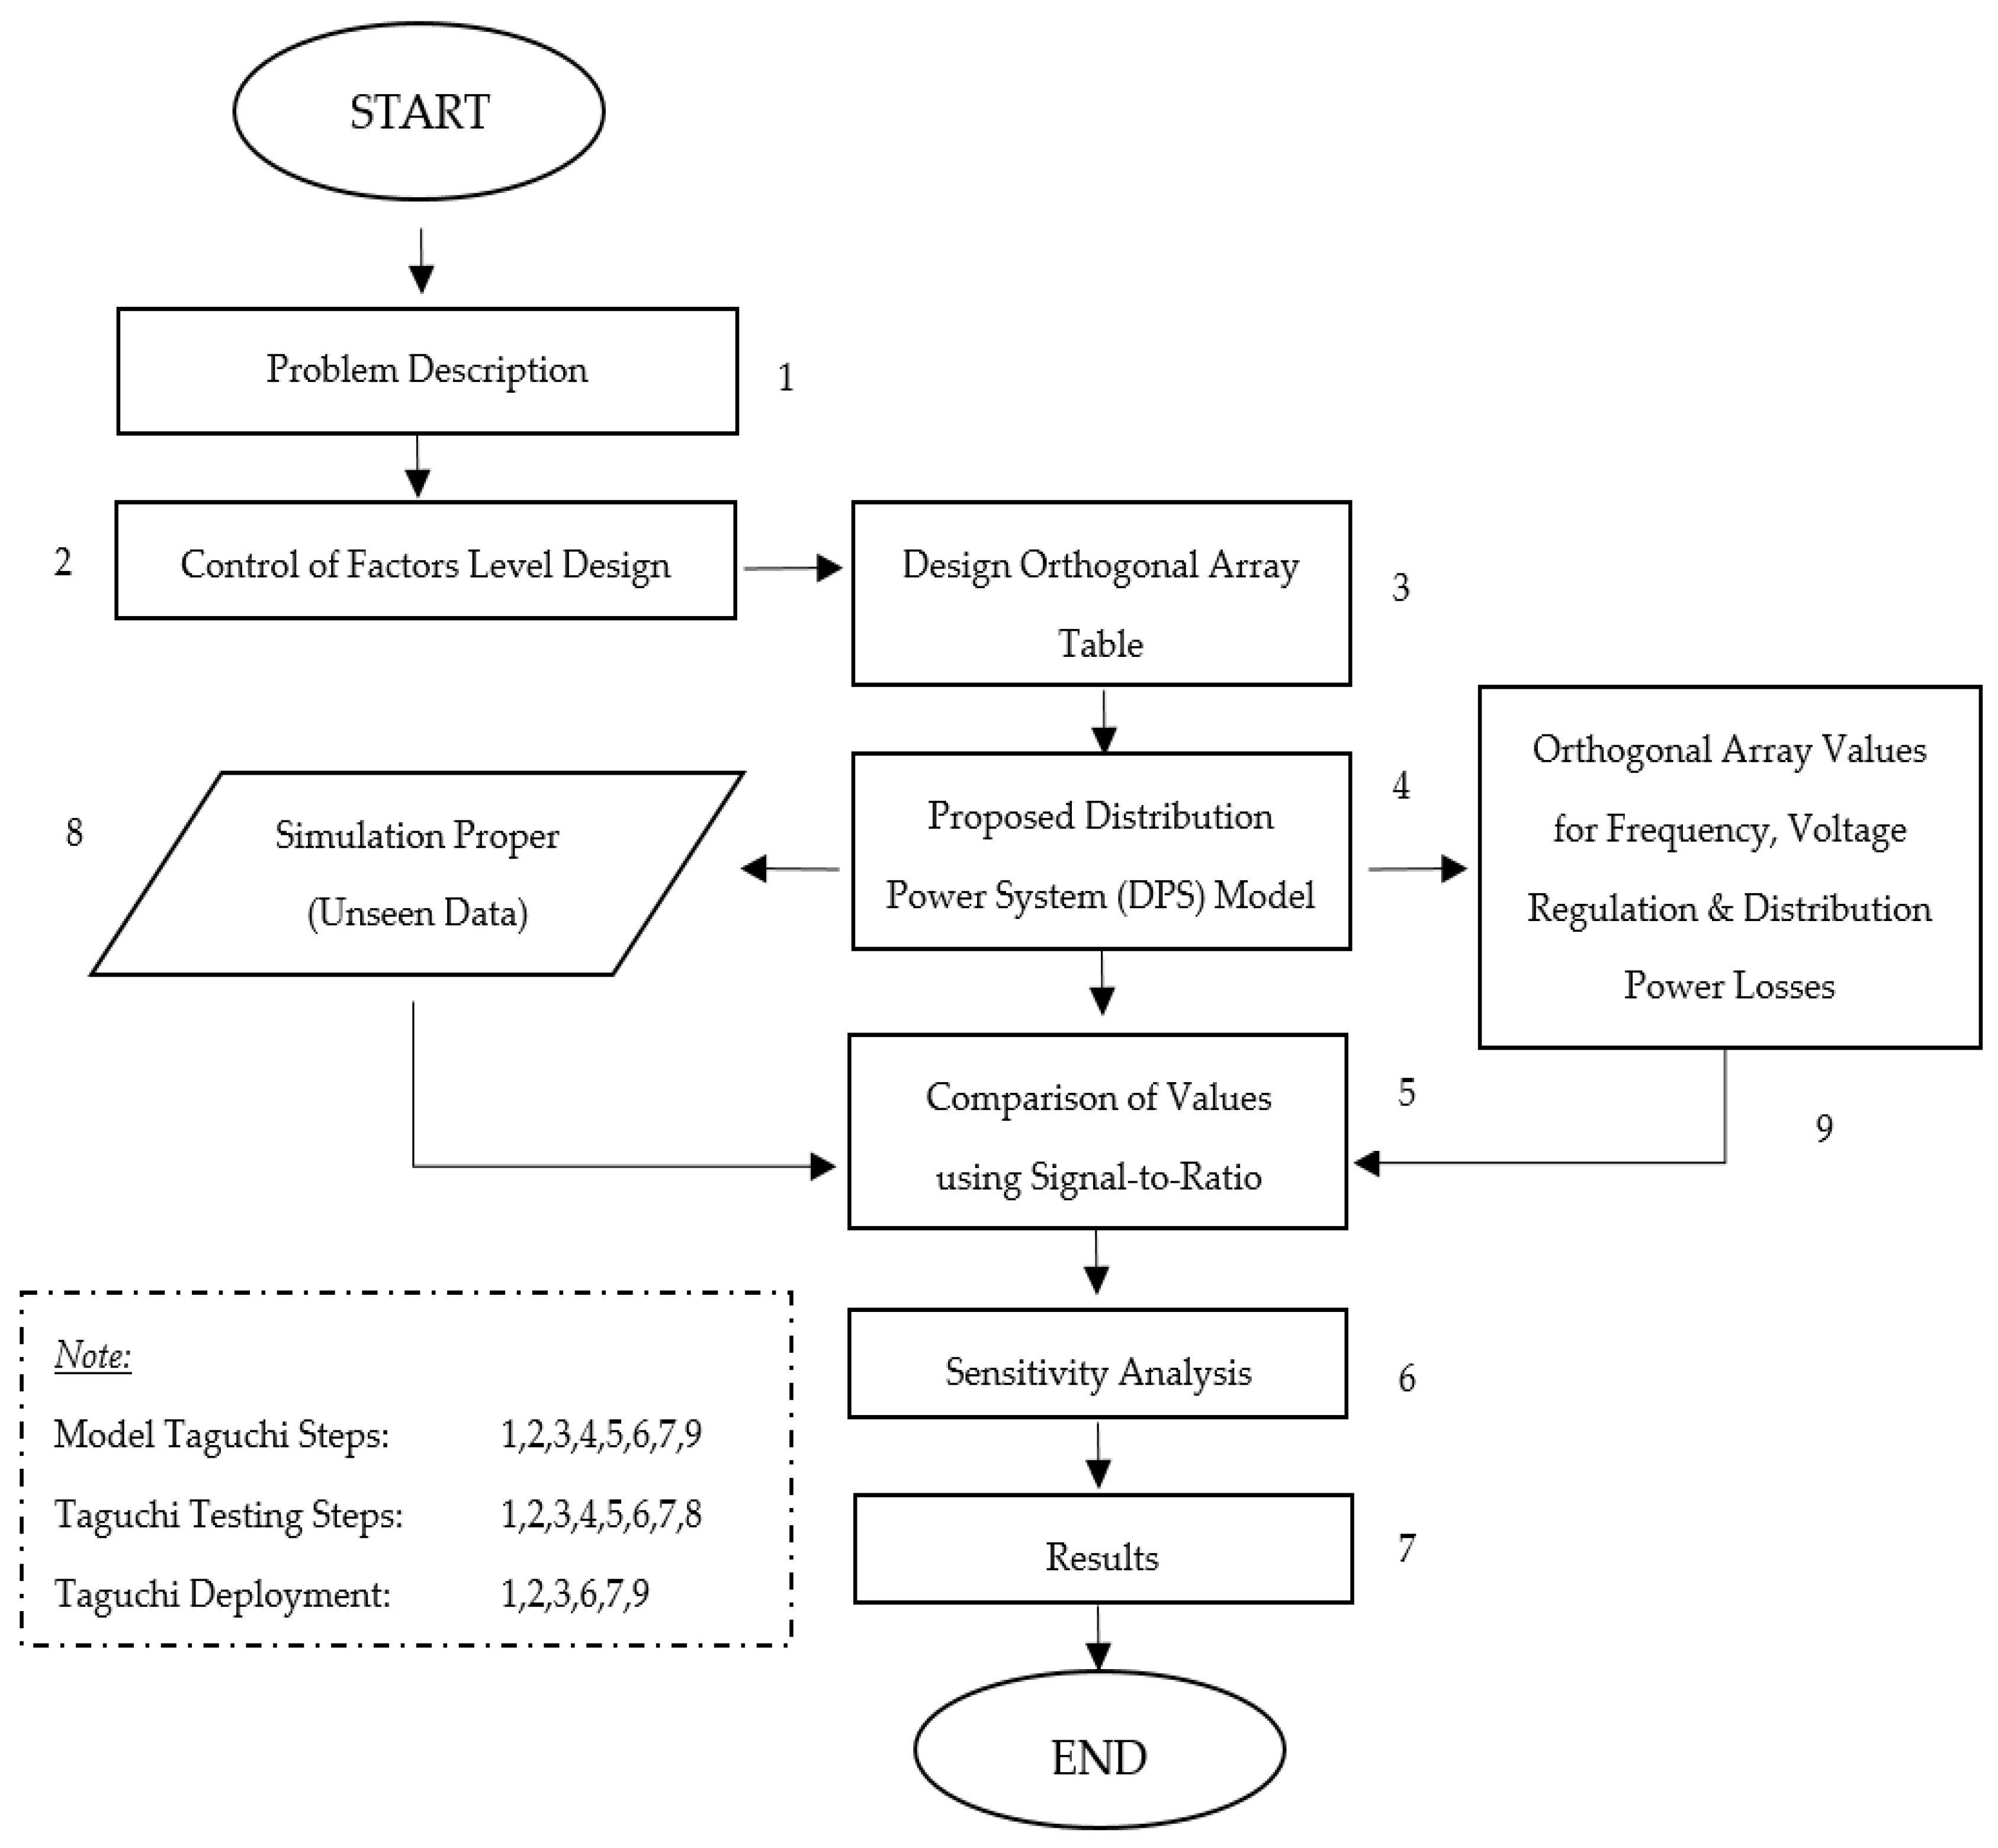
The evaluation process for this paper follows the renowned Taguchi Method. Figure 8 illustrates the six-step process of the Taguchi Method, which can be summarized as select, plan, design, experiment, analyze, and confirm.
In this study, the first stage of the method, select, involved defining the project based on the function intended to be improved. The second stage, plan, encompassed conducting a feasibility study for solar energy and forecasting the system’s demand. The third step, design, involved properly designing a controller, distribution system, and experiments for the different cases considered. The fourth step consisted of conducting experiments, as described in the previous section, for the three cases. Analyzing the results allowed for the determination and identification of significant factors influencing the system. This stage also involved determining the optimum performance conditions.
Lastly, the confirm stage aimed to adapt the proposed model to different systems and compare their performance with the proposed system.
A better way of comparing the behavior of experiments is to use the signal-to-noise ratio (SNR), which combines the effects of both average and standard deviation of the results. For convenience of linearity and to accommodate wide-ranging data, SNR is recommended for analysis. The SNR performance attributes can be analyzed using equations of larger-the-better (LTB), nominal-the-best (NTB) and smaller-is-better (STB) given by Equations (11)–(13), respectively [32].
SNR = 10   log 1 n i = 1 n ( 1 y i 2 )
SNR = 10   log s 2 y 2
SNR = 10   log 1 n i = 1 n ( y i 2 )
Table 4, Table 5 and Table 6 present the levels of factors, their orthogonal values, and the L9  ( 3 3 )    orthogonal array, respectively, used in this study. The factors considered for the experiments are grid setup, application of capacitor, and application of additional feeders. The corresponding levels for each factor, which represent the proposed microgrid substations, are also included in the table.

IEEE-14 Bus Test System

To further validate the results in the previous test system, the proposed configuration applied to the IEEE-14 Test System taken from [33] can be seen in Figure 9 with predetermined of the values from [34]. The test system consists of 14 buses, with 3 buses allocated for power sources and 11 buses for loads. The power source schedule for the test system is detailed in Table 7.

2.2.3. Simulation

The dynamic model of the PEMFC, PV, and controller is simulated in MATLAB/Simulink environments MATLAB R2016a using a i3 processor and 8 GB RAM workstation. The simulation was conducted in MATLAB/Simulink using the phasor mode and sample time of 10 μs for a one-day schedule as seen in Table 3 and Table 6. Additional parameters of the system components are presented in Table 8.

3. Results

3.1. Case Study

3.1.1. Case 1

Case 1 examines the system performance when the utility supplies power to the entire system throughout the day. The system is constructed based on the 2030 load forecast with upgraded transformers.
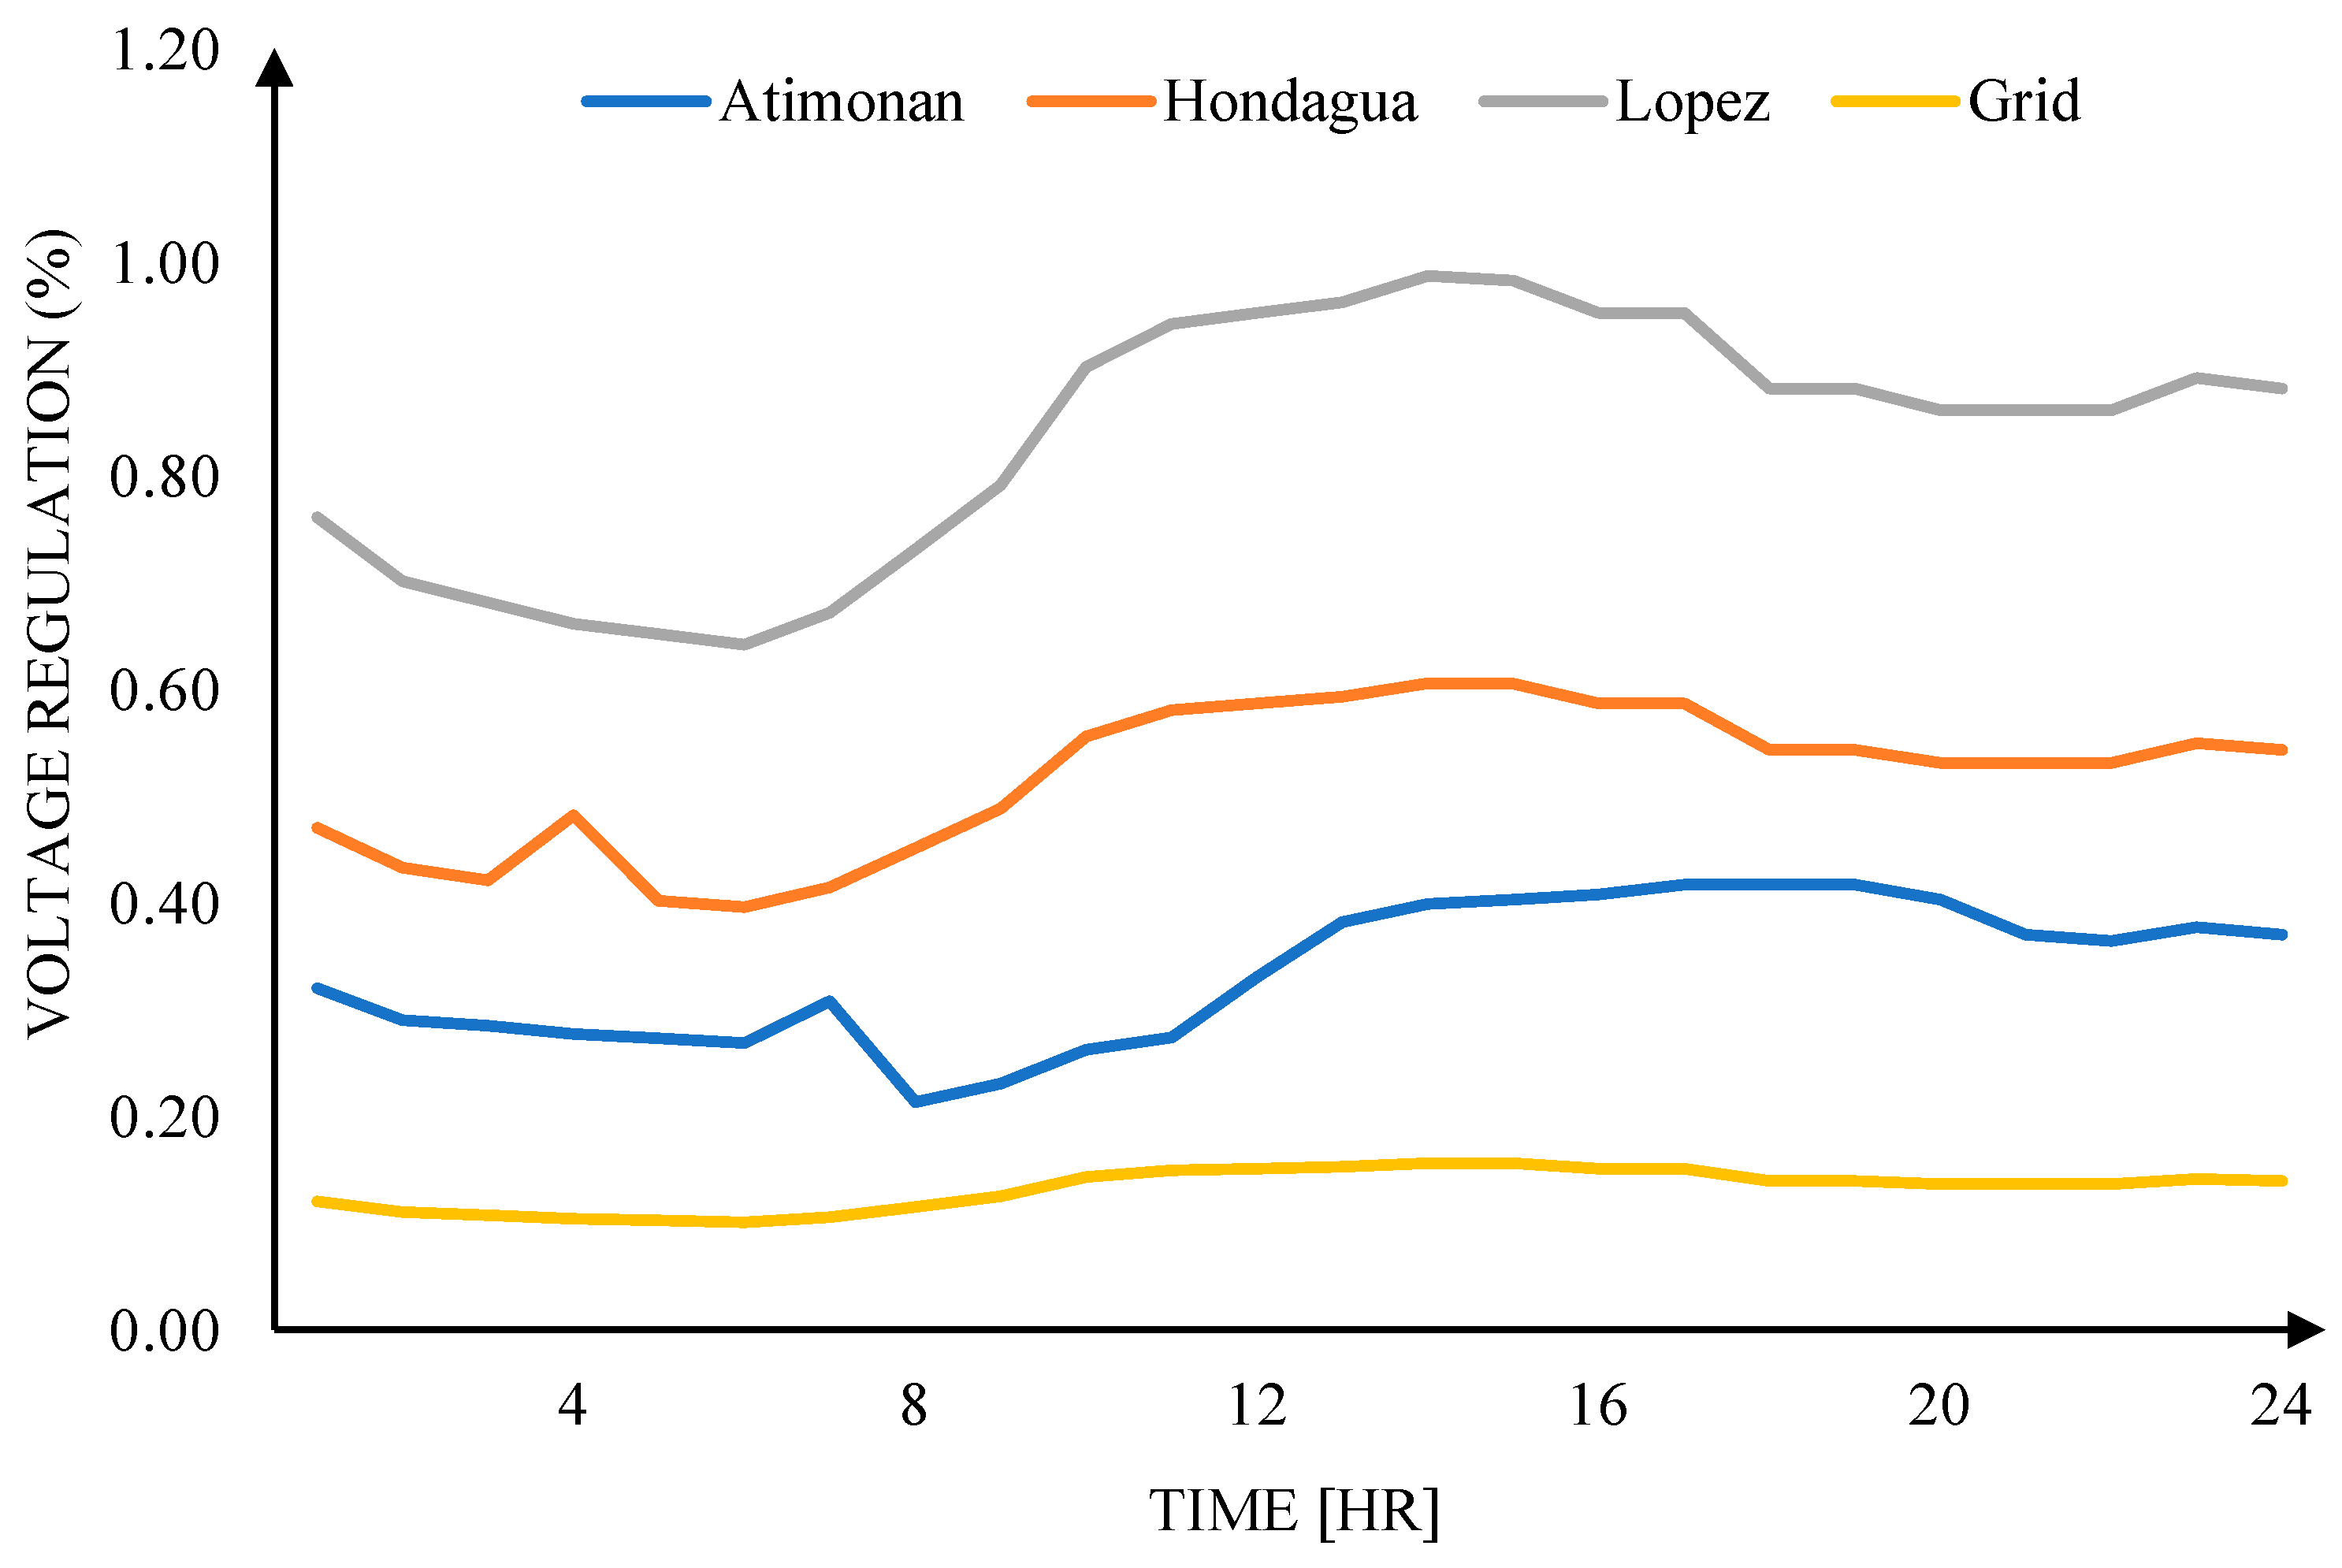
Figure 10 provides a visual representation of the voltage regulation for both the grid and the substations designated for MG application. The data depicted in the figure clearly indicates that the Lopez Substation exhibits the highest level of voltage regulation among all the substations, while the QUEZELCO grid demonstrates the lowest voltage regulation.
A closer examination of the voltage regulation for the substations under Case 1 reveals that they fall within the standard range of 0.1–1.0% regulation. This finding is highly significant as it demonstrates that the voltage stability and regulation achieved in Case 1 are not only satisfactory but also meet the desired standards established for the system.
Meeting the desired standards for voltage regulation is an important achievement, as it ensures the overall reliability and quality of the power supply to end users. This finding further validates the effectiveness and suitability of the proposed MG system, as it demonstrates its capability to maintain optimal voltage stability and regulation under Case 1 conditions.
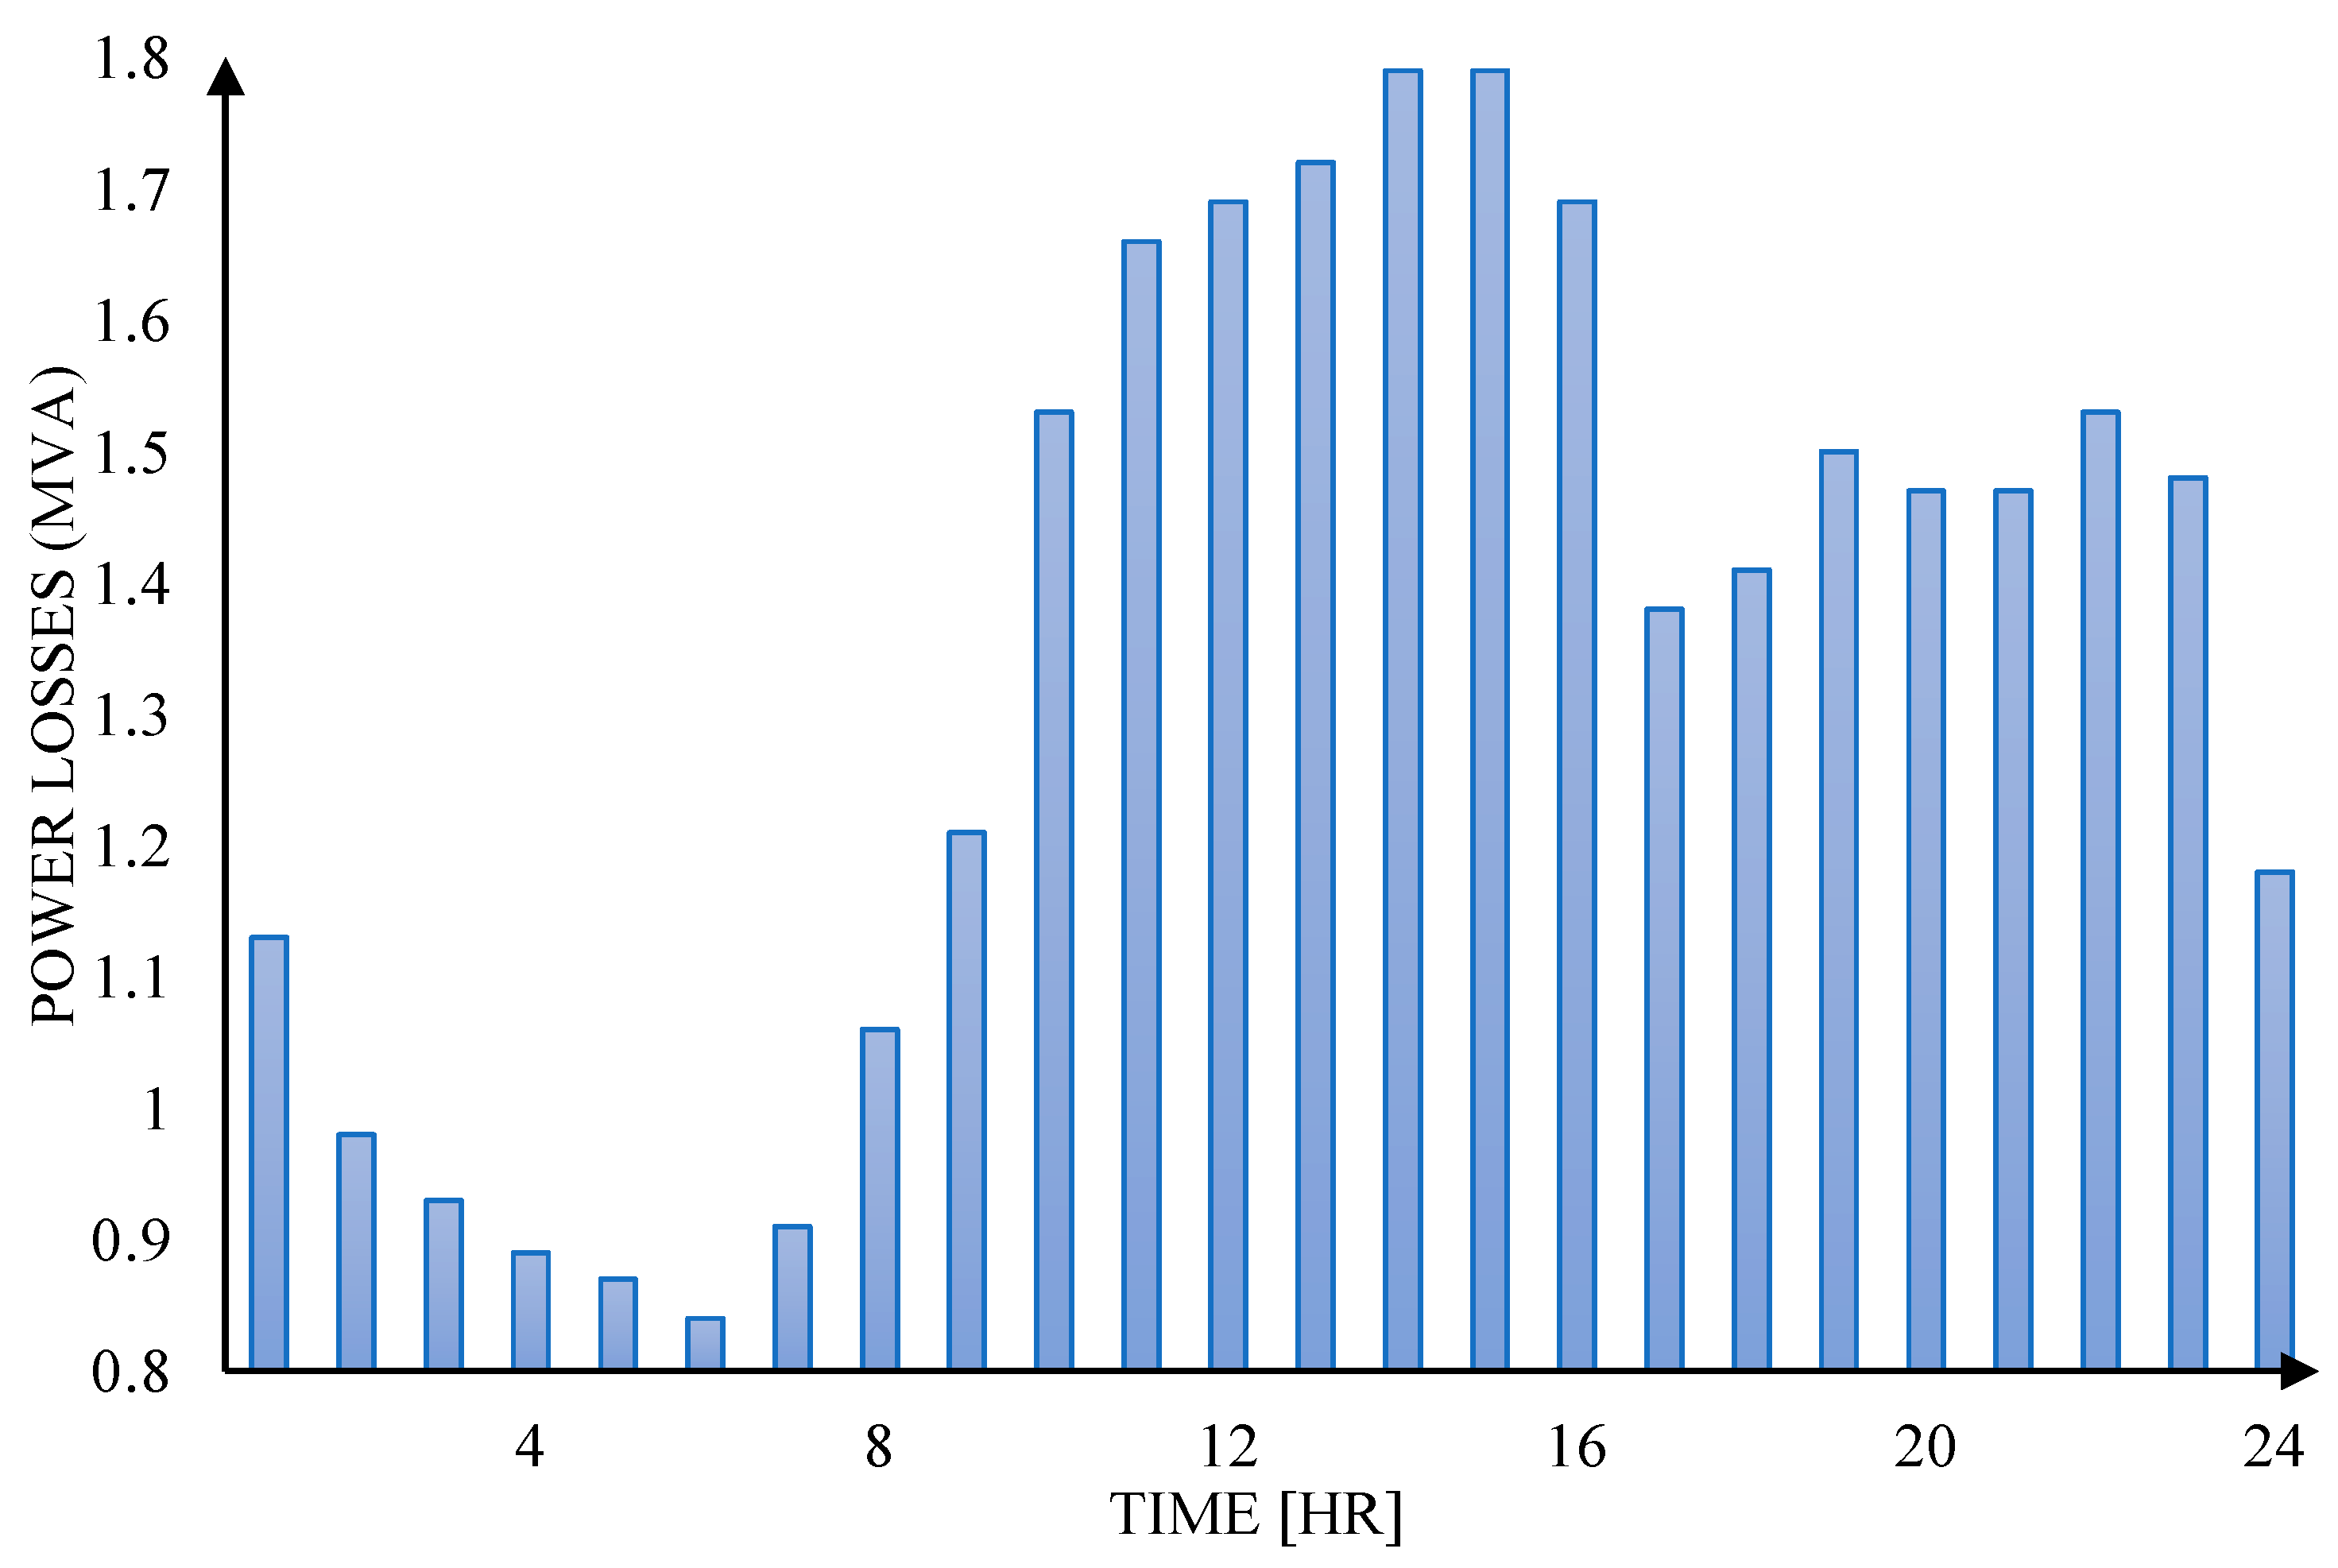
The power distribution losses obtained for Case 1 are presented in Figure 11. It is evident from the figure that the apparent power loss falls within the standard range of 1.25–2.5 MVA. This range is equivalent to 1.6–3.3% of the delivered apparent power from the grid.
Maintaining losses within this acceptable range is crucial for efficient power distribution. It indicates that the system is operating effectively, with a relatively small proportion of power being dissipated as losses during transmission and distribution. This is important in ensuring the overall energy efficiency of the system and minimizing losses.
By keeping the apparent power loss within the specified limits, the system demonstrates good performance in terms of minimizing energy loss and optimizing power distribution efficiency.
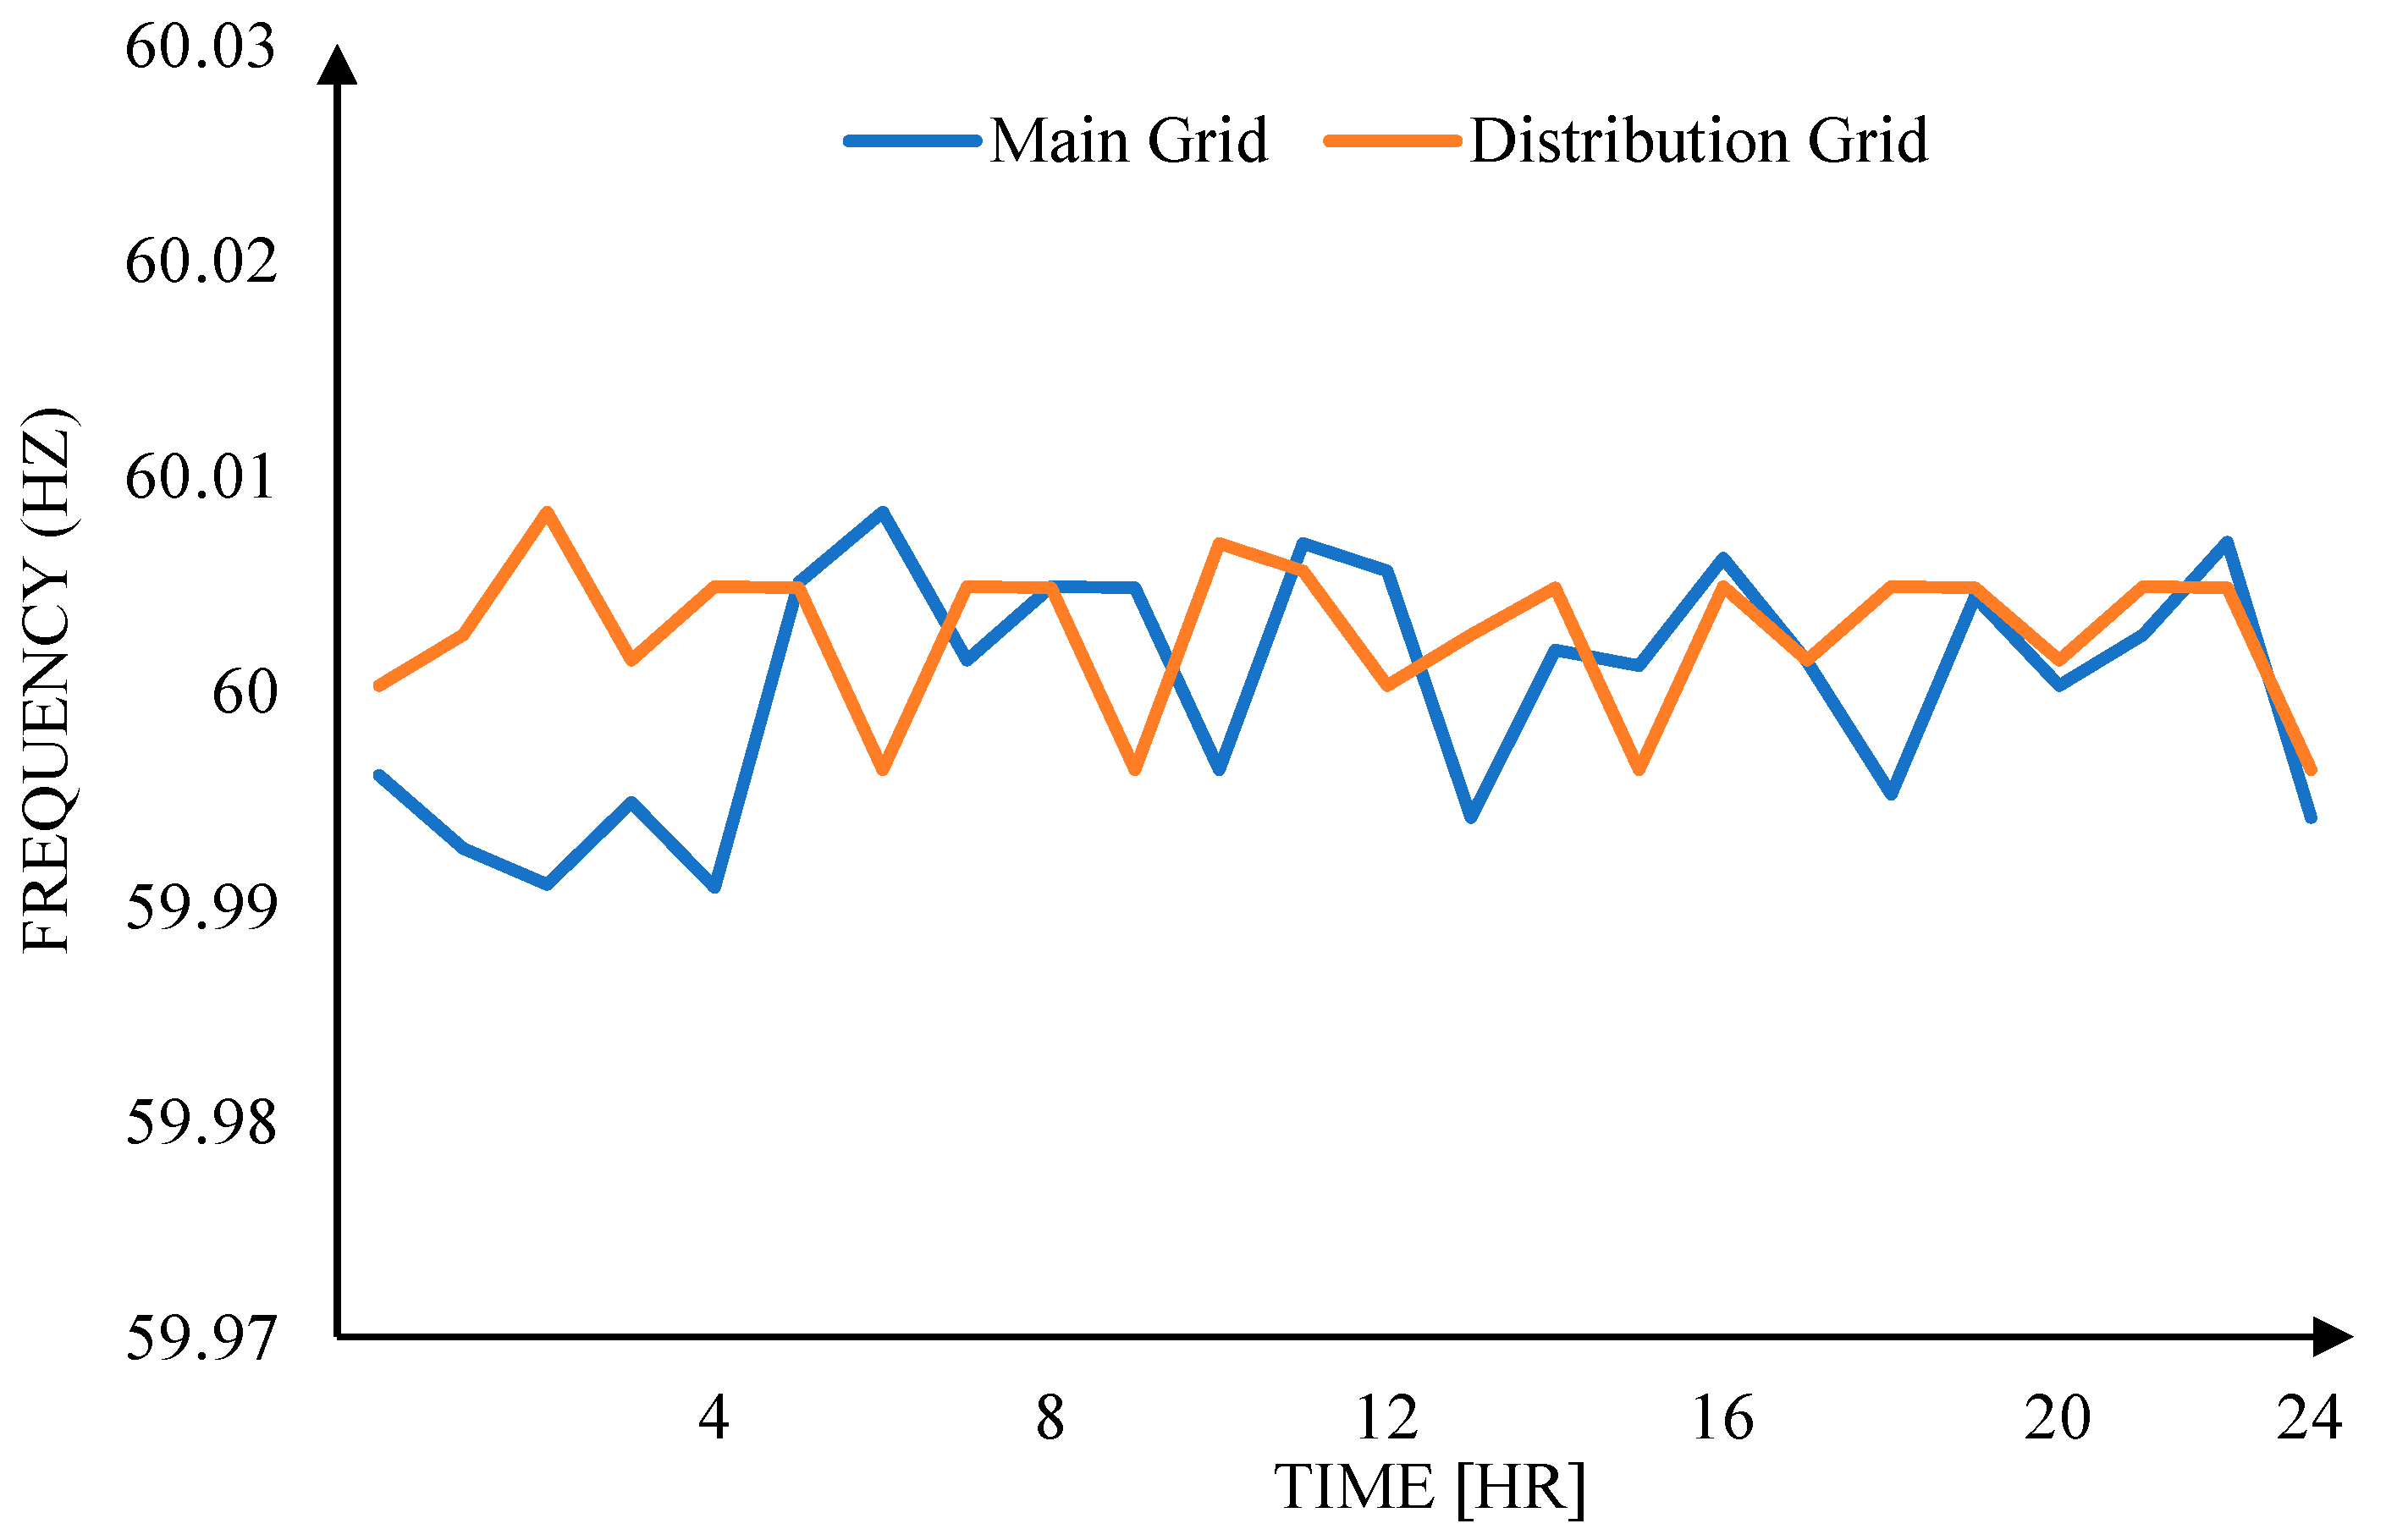
The obtained frequencies for the system are displayed in Figure 12. As depicted in the figure, both the grid and MG frequencies are consistently maintained at 60 Hz. This observation demonstrates that the system operates under normal conditions, successfully supplying the required energy to meet the load demands.
The frequency stability within the specified range is a critical parameter for the reliable operation of the power distribution system. The fact that both the grid and MG frequencies remain at 60 Hz indicates that the upgraded conventional system for QUEZELCO 1 is functioning within the standard range and does not exhibit any frequency-related issues.
The stability of the frequency in this case signifies the successful implementation of the proposed MG system, as well as the effectiveness of the upgraded conventional system. The absence of frequency variations or irregularities confirms that the system is operating within the expected parameters, delivering reliable and consistent power supply to the loads.

3.1.2. Case 2

The voltage regulation for both the grid and the proposed microgrid substations is presented in Figure 13. Similar to Case 1, the Hondagua Substation exhibits the highest voltage regulation, while the Atimonan Substation demonstrates the lowest voltage regulation. This variation in voltage regulation among the substations is an essential aspect to consider in the analysis of the system’s performance.
In Case 2, the voltage regulation of the proposed microgrid substations falls within the standard range of 0.03–0.25%. This indicates that the voltage stability and regulation in this case are satisfactory and meet the desired standards. The voltage regulation values within this range signify that the system operates efficiently and can provide a consistent and reliable supply of electricity to the connected loads.
The improved voltage regulation achieved in Case 2 is a testament to the effectiveness of the proposed MG system. The regulated voltages contribute to the overall stability and reliability of the system, ensuring that the connected loads receive the required voltage for their optimal operation.
Furthermore, the better voltage regulation observed in Case 2 compared to Case 1 indicates the positive impact of integrating RESs into the MG system. The inclusion of these sources allows for better control and regulation of voltage levels, resulting in improved system performance.
Overall, the results obtained in Case 2 demonstrate the successful implementation of the proposed MG system, which effectively regulates and maintains stable voltage levels across the substations. This achievement underscores the system’s capability to provide a reliable and efficient power supply to meet the demands of the connected loads.
The power distribution losses for Case 2 are presented in Figure 14. The figure provides an overview of the apparent power losses within the system, which fall within the standard range. These losses are measured in terms of megavolt-amperes (MVA) and are expressed as a percentage of the delivered apparent power from the grid.
As depicted in the figure, the apparent power loss for Case 2 ranges from 0.8 to 2.1 MVA, corresponding to approximately 1.2% to 2.7% of the delivered apparent power from the grid. These values indicate the proportion of power that is lost during transmission and distribution within the system.
By optimizing the design and operation of the proposed MG system, the apparent power losses have been successfully controlled and maintained at a reasonable level. This achievement is significant as it contributes to the overall efficiency and sustainability of the system, ensuring that a substantial portion of the generated power is effectively utilized by the connected loads.
By minimizing these losses, the overall energy consumption can be optimized, leading to a more sustainable energy system. The results obtained in Case 2 demonstrate the effectiveness of the proposed MG system in achieving efficient power distribution with acceptable levels of apparent power losses.
In conclusion, the results presented in Figure 14 confirm that the apparent power losses in Case 2 are well within the standard range. This outcome demonstrates the successful implementation of the proposed MG system, which effectively manages and minimizes power losses during transmission and distribution. The findings highlight the system’s ability to ensure efficient utilization of electrical power and its contribution to the overall sustainability of the energy system.
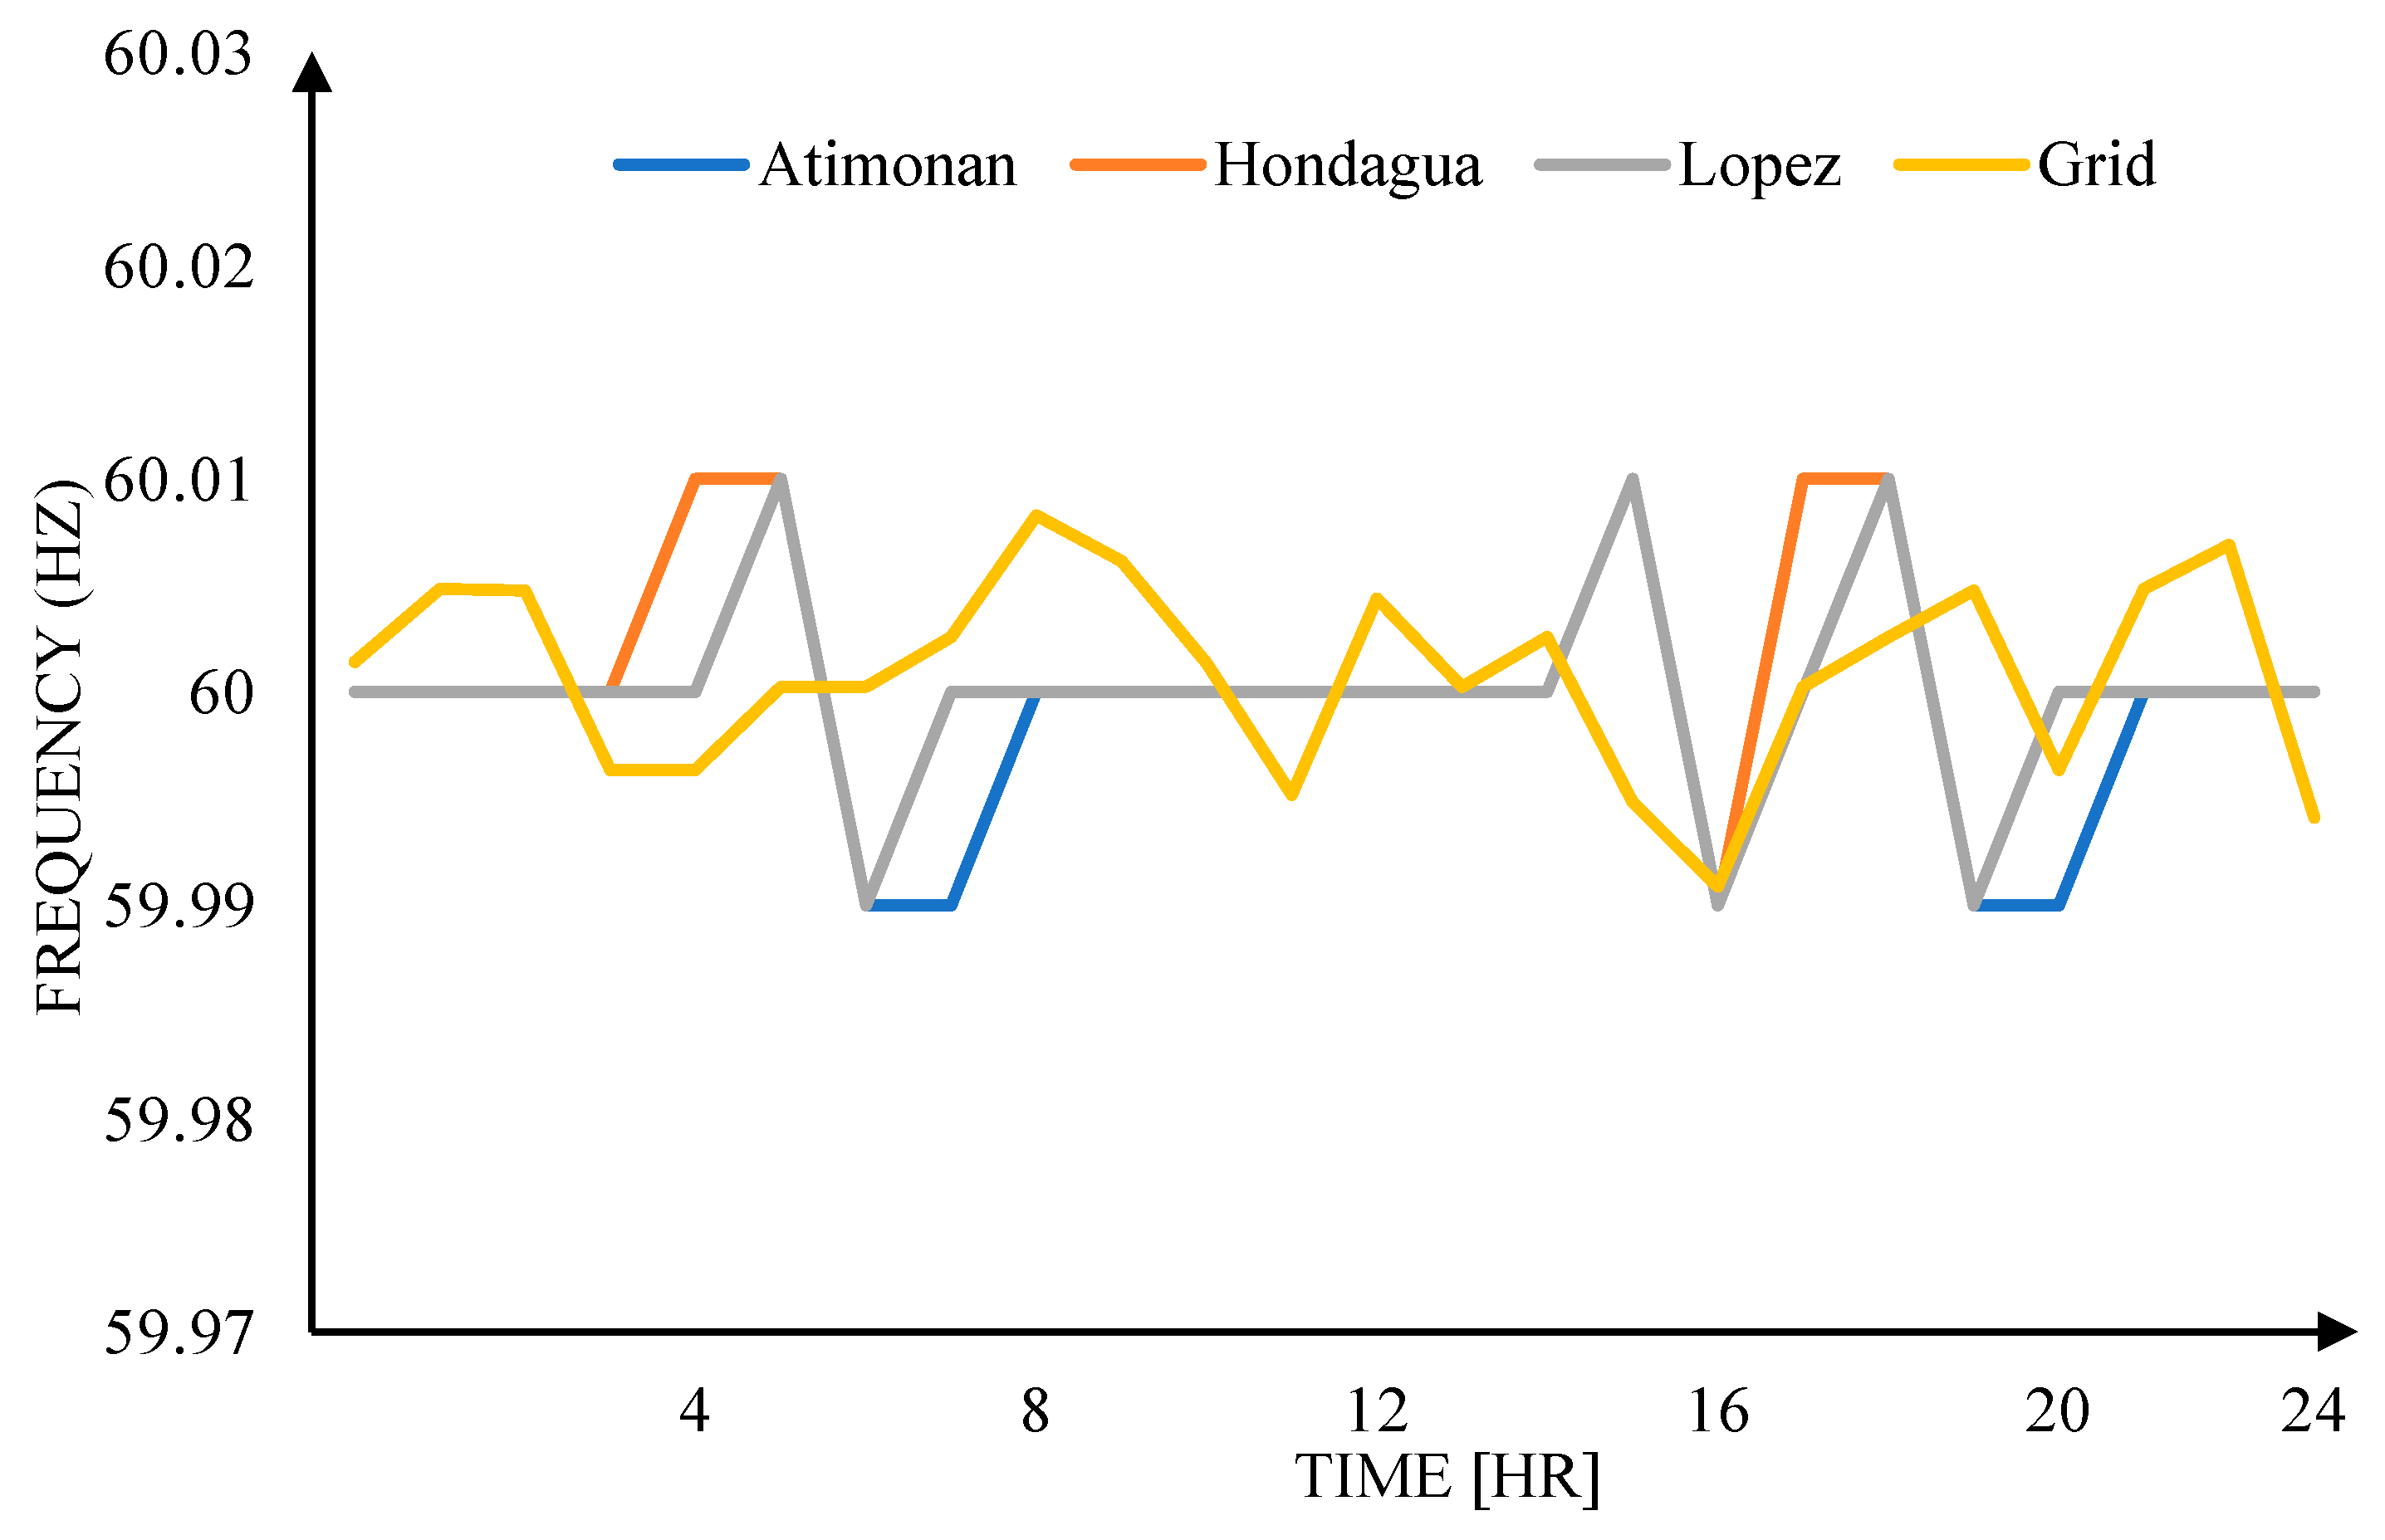
The obtained frequencies are presented in Figure 15. The figure provides an overview of the frequencies observed in the distribution grid and the islanded MGs throughout the simulation.
As depicted in Figure 15, the frequency of the distribution grid is consistently maintained at 60 Hz, indicating that the grid operates within the standard frequency range. This steady frequency level ensures the smooth operation of the grid and facilitates the reliable supply of electricity to the connected loads.
In the case of the islanded MGs, slight frequency spikes are observed at 0700H, 1600H, and 1800H. These spikes occur during the transition periods when the power supply shifts from the PV system to the FC system. The temporary fluctuations in frequency are a result of the switching process and the adjustment of power sources to meet the load demand. Despite these spikes, the frequencies quickly stabilize and remain within the acceptable range.
Similar to the previous case, the frequency performance in Case 2 indicates that the MG system operates under normal conditions and effectively supplies the required energy to the connected loads. The frequencies observed in both the distribution grid and the islanded MGs demonstrate the system’s ability to maintain stability and ensure a reliable power supply.
The findings from this analysis confirm that the proposed MG system effectively manages frequency control and ensures stable operation throughout the simulation. The observed frequency spikes during the transition periods are considered normal and do not significantly impact the overall system performance.
The results obtained in Case 2 reinforce the viability and effectiveness of the proposed MG system, as it successfully maintains the frequency within the standard range for both the distribution grid and the islanded MGs. This outcome further supports the system’s reliability, stability, and capability to meet the energy demands of the connected loads.
In summary, the frequency analysis presented in Figure 15 demonstrates that the MG system operates within the standard frequency range, ensuring stable and reliable power supply to the loads. The observed frequency spikes during the transition periods are temporary and do not affect the overall performance of the system. These findings validate the efficiency and effectiveness of the proposed MG system in maintaining frequency control and facilitating the smooth operation of the electrical grid.

3.1.3. Case 3

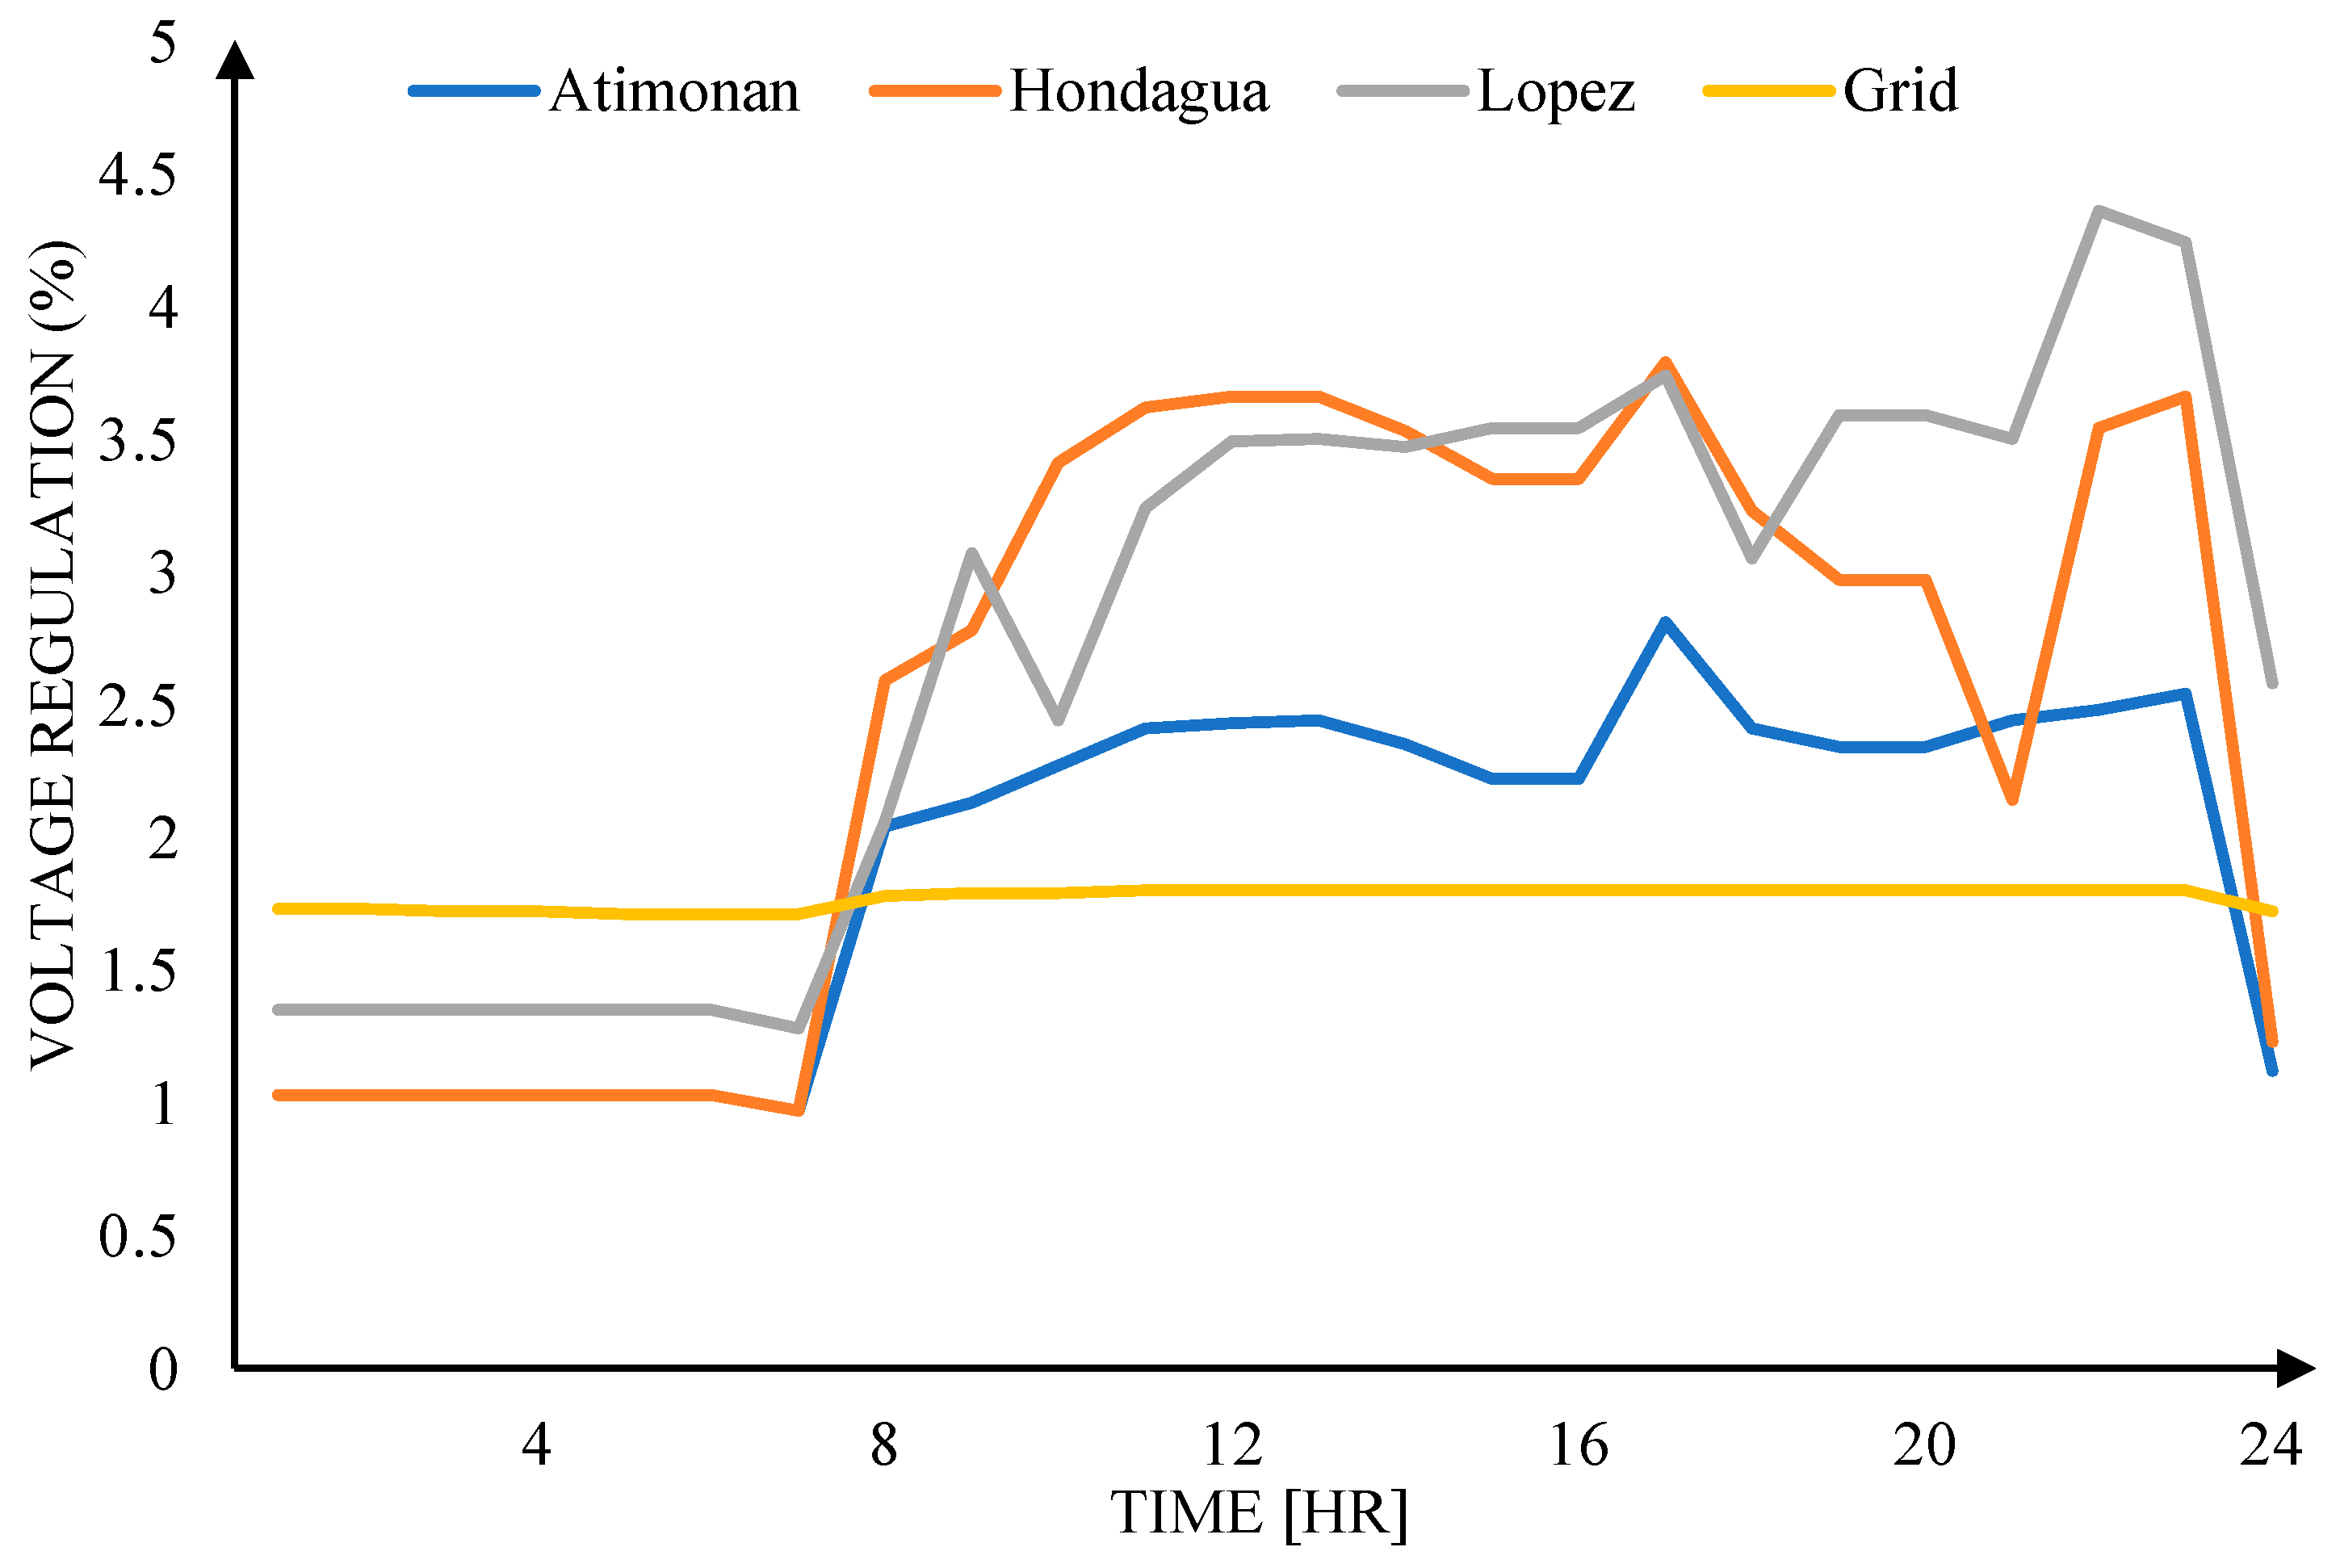
The voltage regulation for the grid and the proposed MG substations in Case 3 is presented in Figure 16. As depicted in the figure, the Lopez Substation exhibits the highest voltage regulation, while the Hondagua Substation demonstrates the lowest voltage regulation among the MG substations.
In Case 3, the voltage regulation for the substations falls within the standard range of 0.9–4.5%. This indicates that the voltage regulation in this case is slightly higher compared to the previous cases, but it remains within the acceptable ranges defined by the standards. The voltage regulation is a crucial aspect of the electrical system as it ensures that the voltage levels are maintained within a specified range, providing a stable and reliable power supply to the connected loads.
Having higher voltage regulation in Case 3 could be attributed to the specific operating conditions and configurations of the MG system during this scenario. Despite the relatively higher voltage regulation, it is important to note that the results are still within the acceptable limits, indicating that the voltage regulation remains effective and meets the required standards.
The results obtained in Case 3 demonstrate the effectiveness and reliability of the proposed MG system in maintaining voltage regulation within acceptable limits. While some variations in voltage regulation are observed among the substations, all values remain within the defined standard range.
The voltage regulation analysis presented in Figure 16 further confirms the suitability and performance of the proposed MG system. Despite the slightly higher voltage regulation observed in Case 3 compared to the previous cases, the system is still able to maintain stable voltage levels and provide a consistent power supply to the connected loads.
In summary, the voltage regulation results for Case 3 indicate that the proposed MG system successfully maintains voltage levels within the acceptable range. The slightly higher voltage regulation observed in this case does not pose a significant concern as it remains within the specified limits. These findings support the effectiveness and reliability of the proposed MG system in ensuring stable and regulated voltage supply to the substations and the connected loads.
The power distribution losses for Case 3 are presented in Figure 17. The figure illustrates that the apparent power losses are within the standard range of 0.9–2.5 MVA, which corresponds to approximately 1.2–3.3% of the delivered apparent power from the grid.
In Case 3, the apparent power losses remain within the acceptable range defined by the standards. This indicates that the proposed MG system effectively minimizes power losses during the distribution process. By keeping the losses within the standard limits, the system ensures efficient power delivery to the loads, reducing losses and maximizing the utilization of available energy resources.
The results shown in Figure 17 provide valuable insights into the performance of the microgrid system under Case 3 conditions. The observed apparent power losses demonstrate that the system operates efficiently and effectively in delivering power to the loads, while minimizing losses along the distribution network.
Efficient power distribution is crucial for the overall sustainability and economic viability of the MG system. By keeping the apparent power losses within the acceptable range, the proposed system optimizes the utilization of the generated power and enhances the overall system efficiency. This leads to reduced energy waste, lower operational costs, and improved reliability of the MG.
The findings presented in Figure 17 highlight the successful implementation of the proposed MG system in minimizing apparent power losses during distribution. These results validate the effectiveness and efficiency of the system design, as it ensures reliable and sustainable power delivery to the connected loads.
In summary, the apparent power losses observed in Case 3 of the proposed MG system are within the standard range, indicating the system’s ability to effectively manage power distribution and minimize losses. By keeping the losses at an acceptable level, the system optimizes energy utilization and enhances the overall efficiency of the MG. These findings further support the feasibility and performance of the proposed MG system in delivering reliable and efficient power distribution.
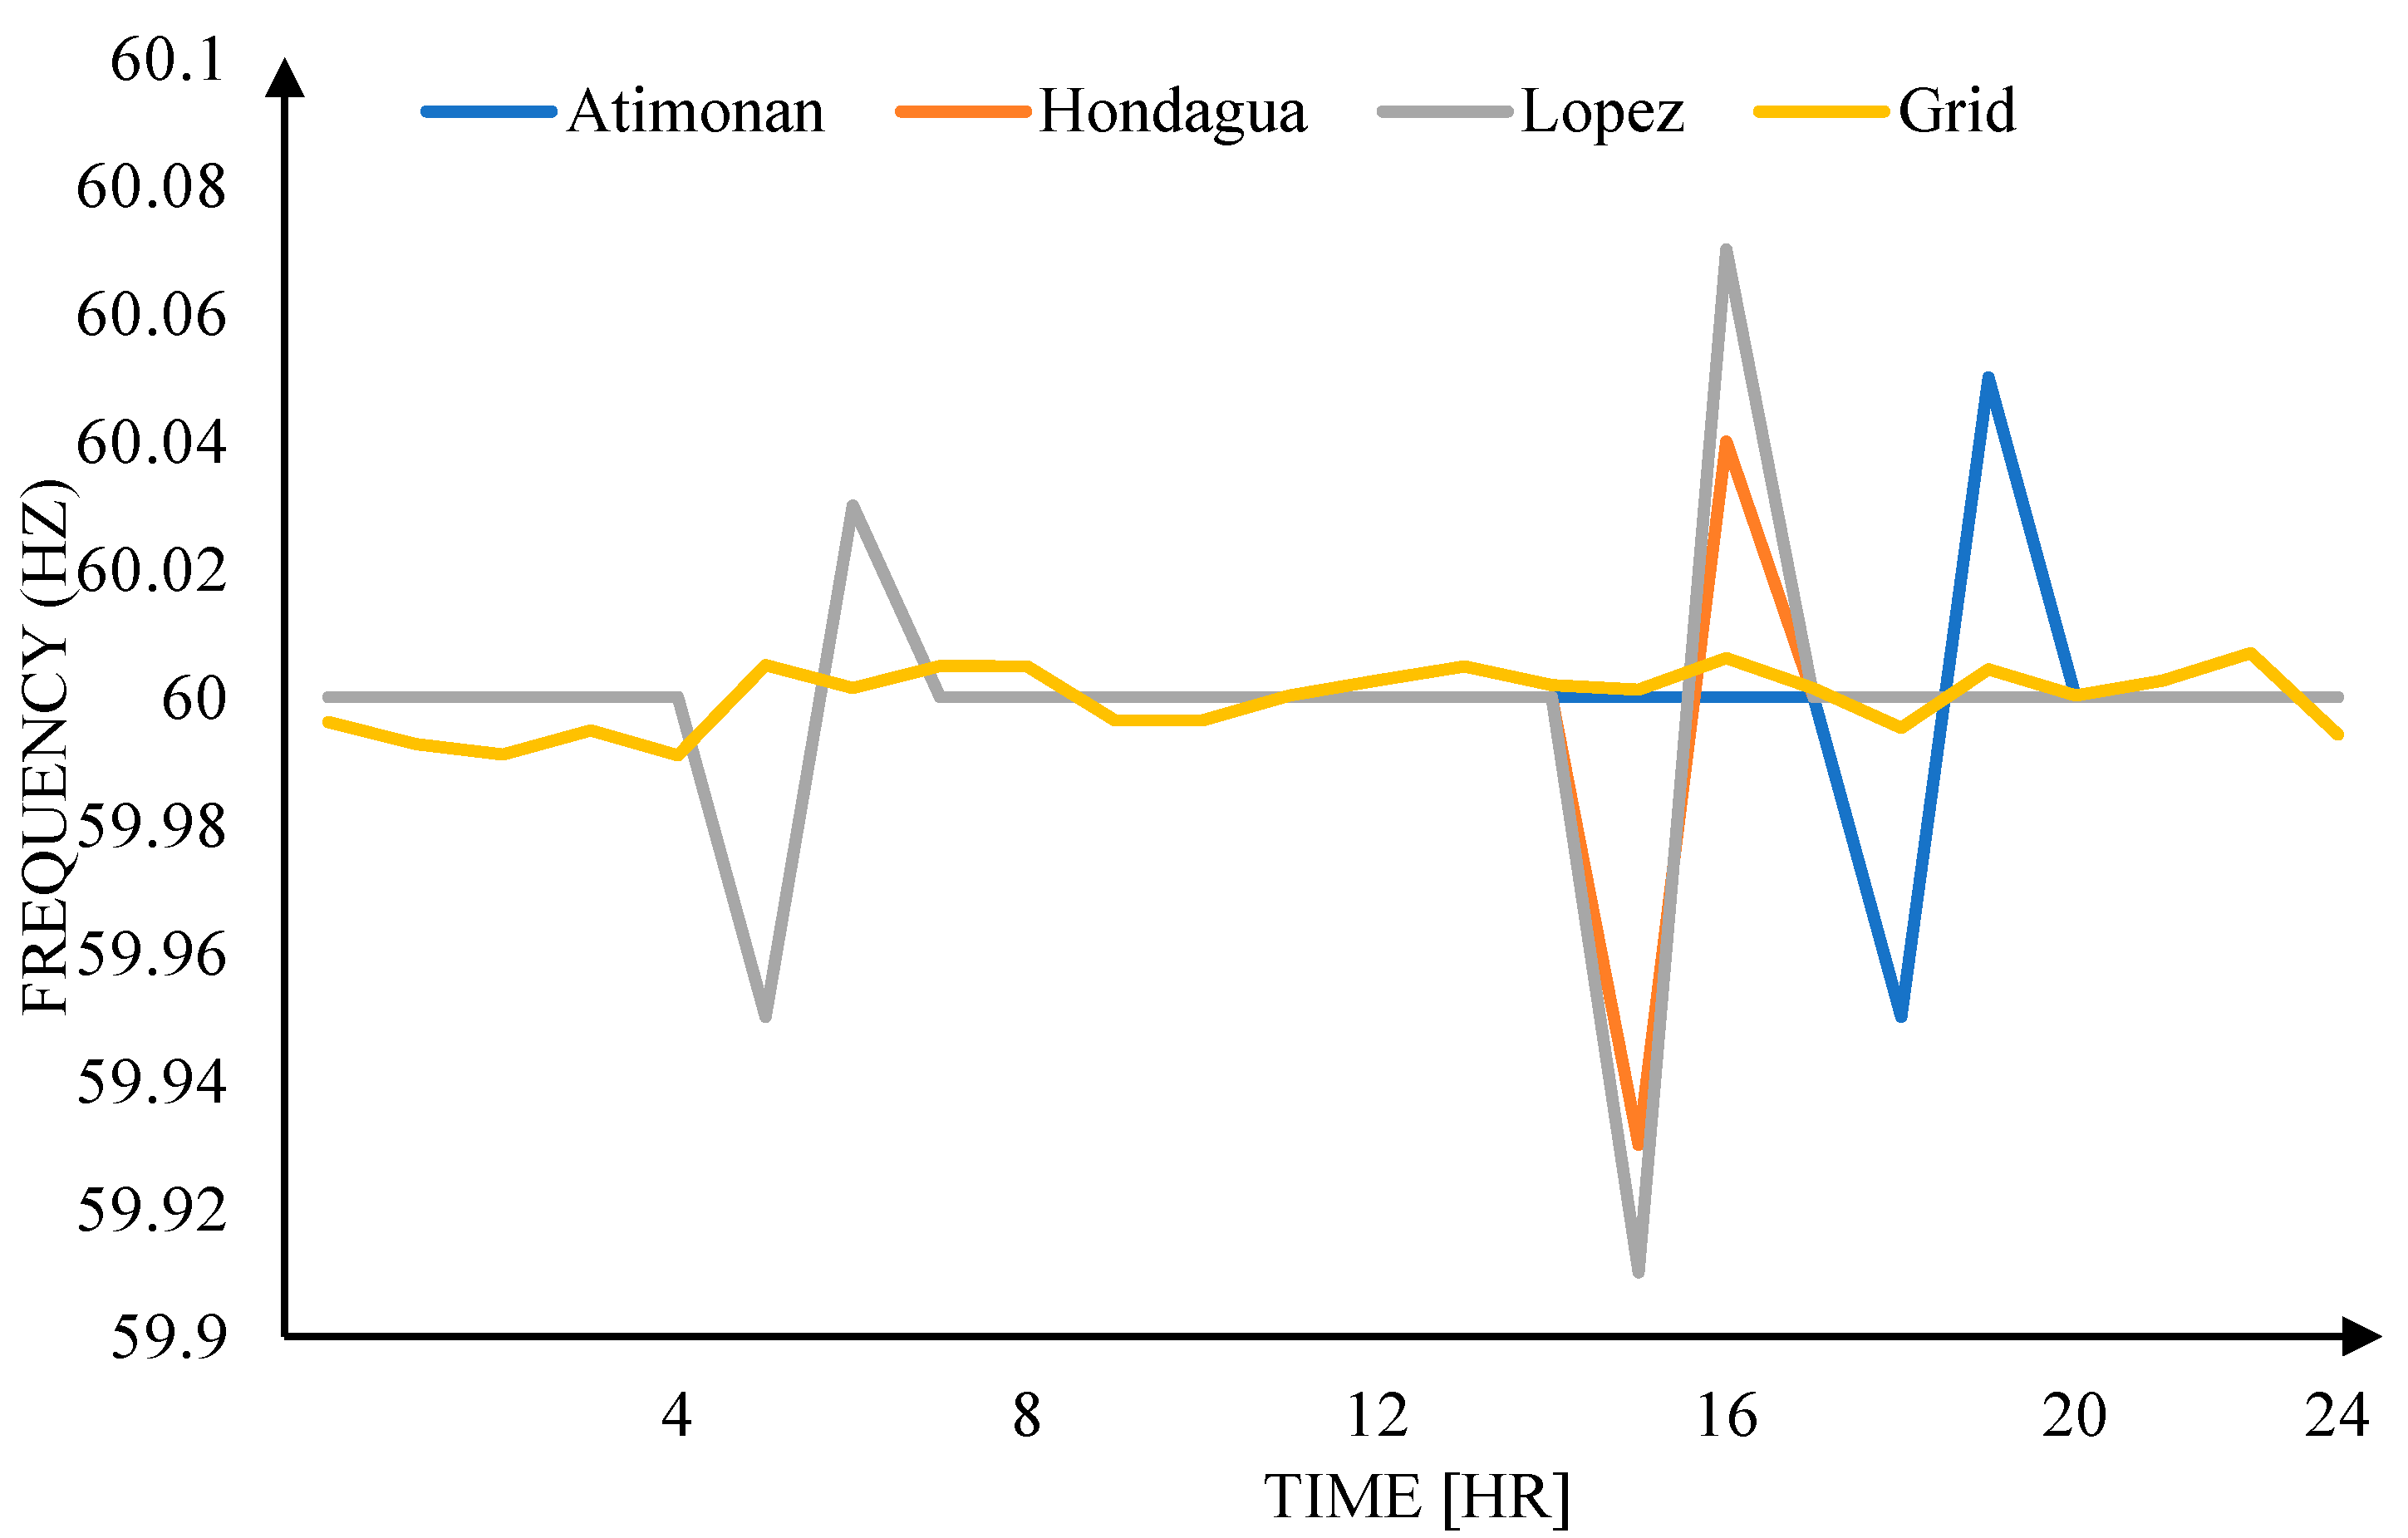
The obtained frequency results are presented in Figure 18. Similar to the previous cases, the distribution grid frequency is maintained at 60 Hz throughout the simulation. However, for the grid-connected MGs, the frequency exhibits spikes at 0700H, 1600H, and 1800H. These spikes occur due to the switching of power supply sources, transitioning from the utility to the PV System and then to the FC system, and back to the utility.
In Case 3, the observed frequency variations during the switching periods indicate that the system operates within acceptable limits. The spikes in frequency during the switching intervals are expected due to the dynamic changes in power sources. Despite these temporary variations, the frequency quickly stabilizes back to the standard 60 Hz, ensuring that the system operates in a normal condition.
The ability of the system to maintain a stable frequency within the standard range is a testament to its robustness and effective control mechanisms. It signifies that the proposed MG system can supply the required energy to the connected loads, while also adapting to changes in power sources seamlessly.
The frequency results obtained in Case 3 provide valuable insights into the performance of the proposed MG system. By demonstrating stable frequency levels, the system ensures reliable and continuous power supply to the loads, meeting the energy demands without compromising the overall system stability.
The findings presented in Figure 18 reinforce the effectiveness and feasibility of the proposed MG system in maintaining frequency stability. Despite the temporary frequency spikes during the switching intervals, the system quickly restores the nominal frequency, indicating its ability to adapt to different operating conditions and seamless transition between power sources.
In summary, the frequency analysis conducted in Case 3 reveals that the proposed MG system operates within standard frequency ranges. The observed frequency spikes during switching intervals are temporary and quickly stabilize, ensuring uninterrupted power supply to the loads. These results validate the system’s capability to maintain stable frequency levels, enabling reliable and efficient operation of the MG.
Overall, the frequency performance of the proposed MG system supports its suitability for practical implementation and highlights its potential to contribute to sustainable and resilient power distribution in various applications.

3.2. Evaluation and Verification

3.2.1. Taguchi Method

The following tables present the results obtained from the evaluation process. Table 8 displays the orthogonal array at frequency (Hz) level, showcasing the outcomes of the 9 experimental runs. Table 9 showcases the orthogonal array at power loss (kVA), providing insights into the power loss values obtained for each experimental combination. Additionally, Table 10 presents the orthogonal array at voltage regulation (%), displaying the voltage regulation results for different experimental settings. Lastly, Table 11 presents the sensitivity analysis, which ranks all the design factors based on their influence and importance in the study.
These tables serve as valuable references for analyzing and interpreting the evaluation results. They provide a comprehensive overview of the obtained data, allowing for a deeper understanding of the impact of various factors on frequency, power loss, and voltage regulation.
Table 9 specifically focuses on frequency levels and presents the results of the experimental runs. It enables the assessment of how different combinations of factors influenced the frequency of the system. By analyzing the data in this table, insights can be gained regarding the effects of specific variables on the system’s frequency performance.
Table 10 shows an analysis of power loss in terms of kilovolt-amperes (kVA). This table allows for a comparison of power loss values across different experimental setups, helping to identify patterns and trends. By examining the results in Table 10, the impact of different factors on power loss can be understood, aiding in the identification of strategies to mitigate power losses and improve overall system efficiency.
Table 11 provides an overview of voltage regulation results expressed as a percentage. It allows for an assessment of how the experimental combinations influenced voltage regulation within the system. By examining the data in Table 11, one can gain insights into the effectiveness of different design factors in maintaining stable and regulated voltages across the MG.
Lastly, Table 12 presents a sensitivity analysis that ranks the design factors based on their importance and influence. This analysis helps identify which factors have the greatest impact on the performance of the system. By considering the rankings in Table 12, stakeholders can prioritize their efforts and resources towards the factors that have the most significant influence on the system’s overall performance.
In summary, the presented tables serve as valuable references for analyzing and interpreting the evaluation results. They provide a comprehensive overview of the obtained data, allowing for a deeper understanding of the system’s performance in terms of frequency, power loss, voltage regulation, and the relative importance of different design factors.

3.2.2. Implementation with IEEE-14 Bus Test System

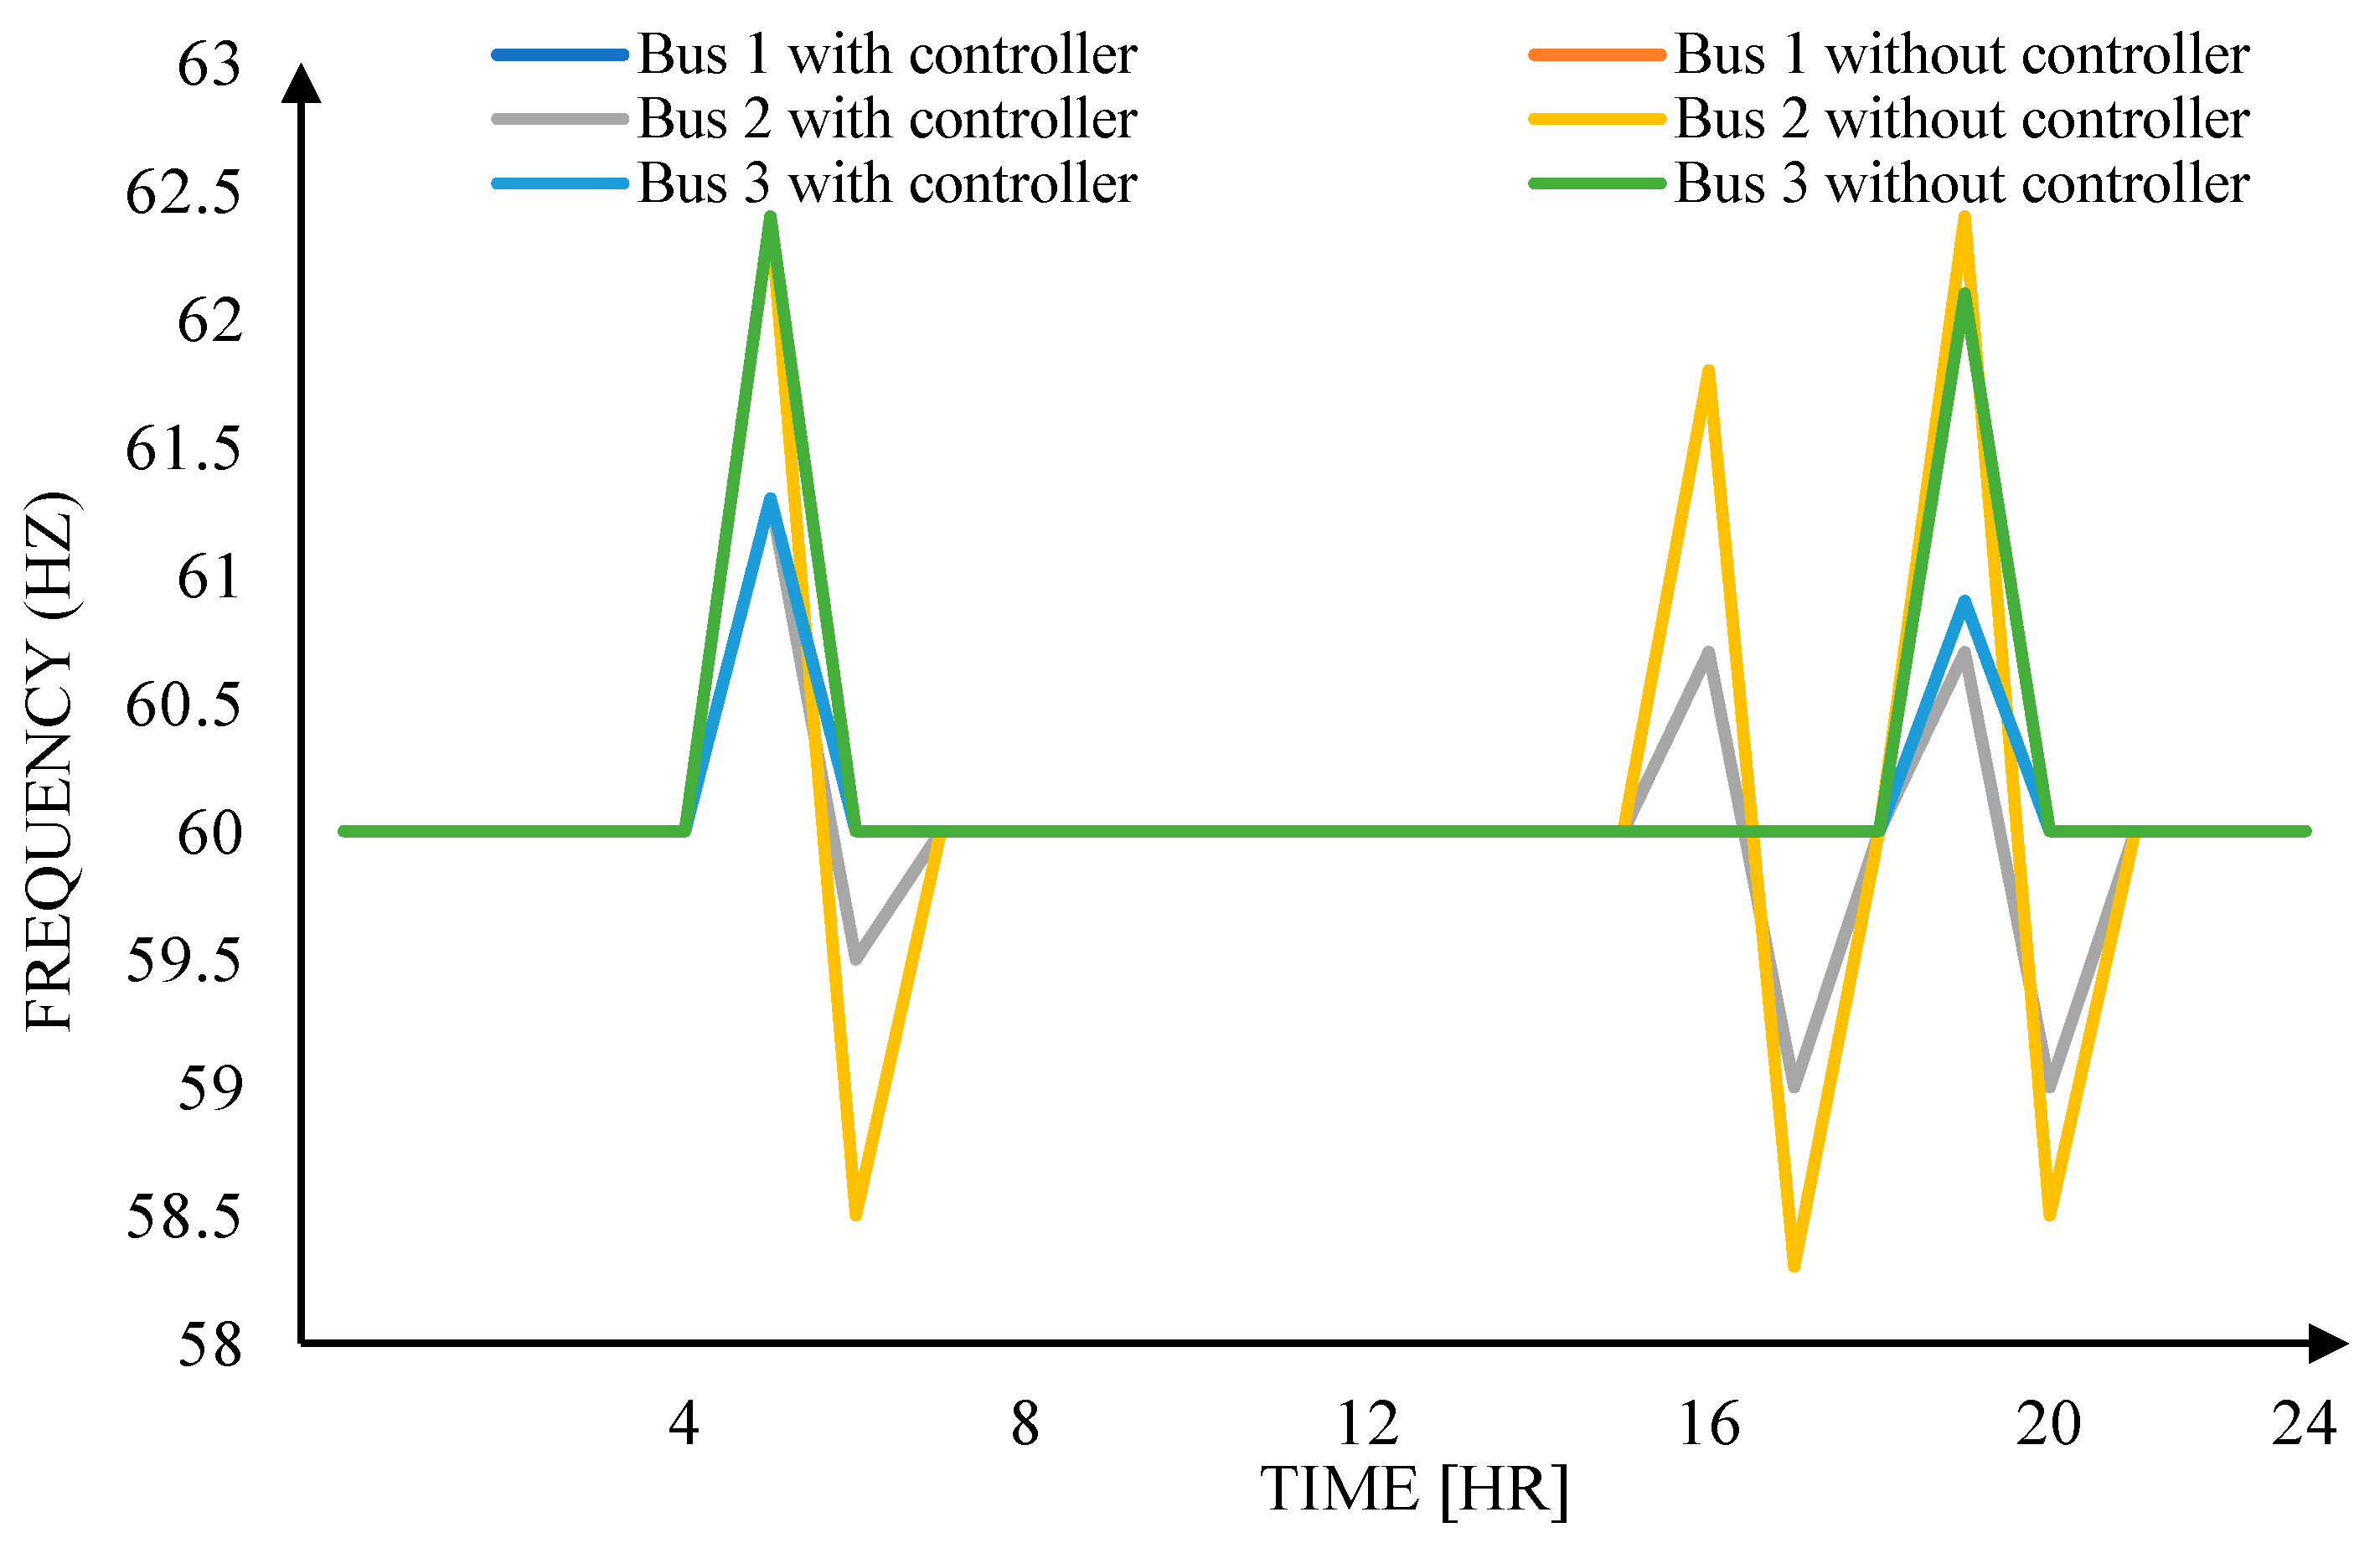
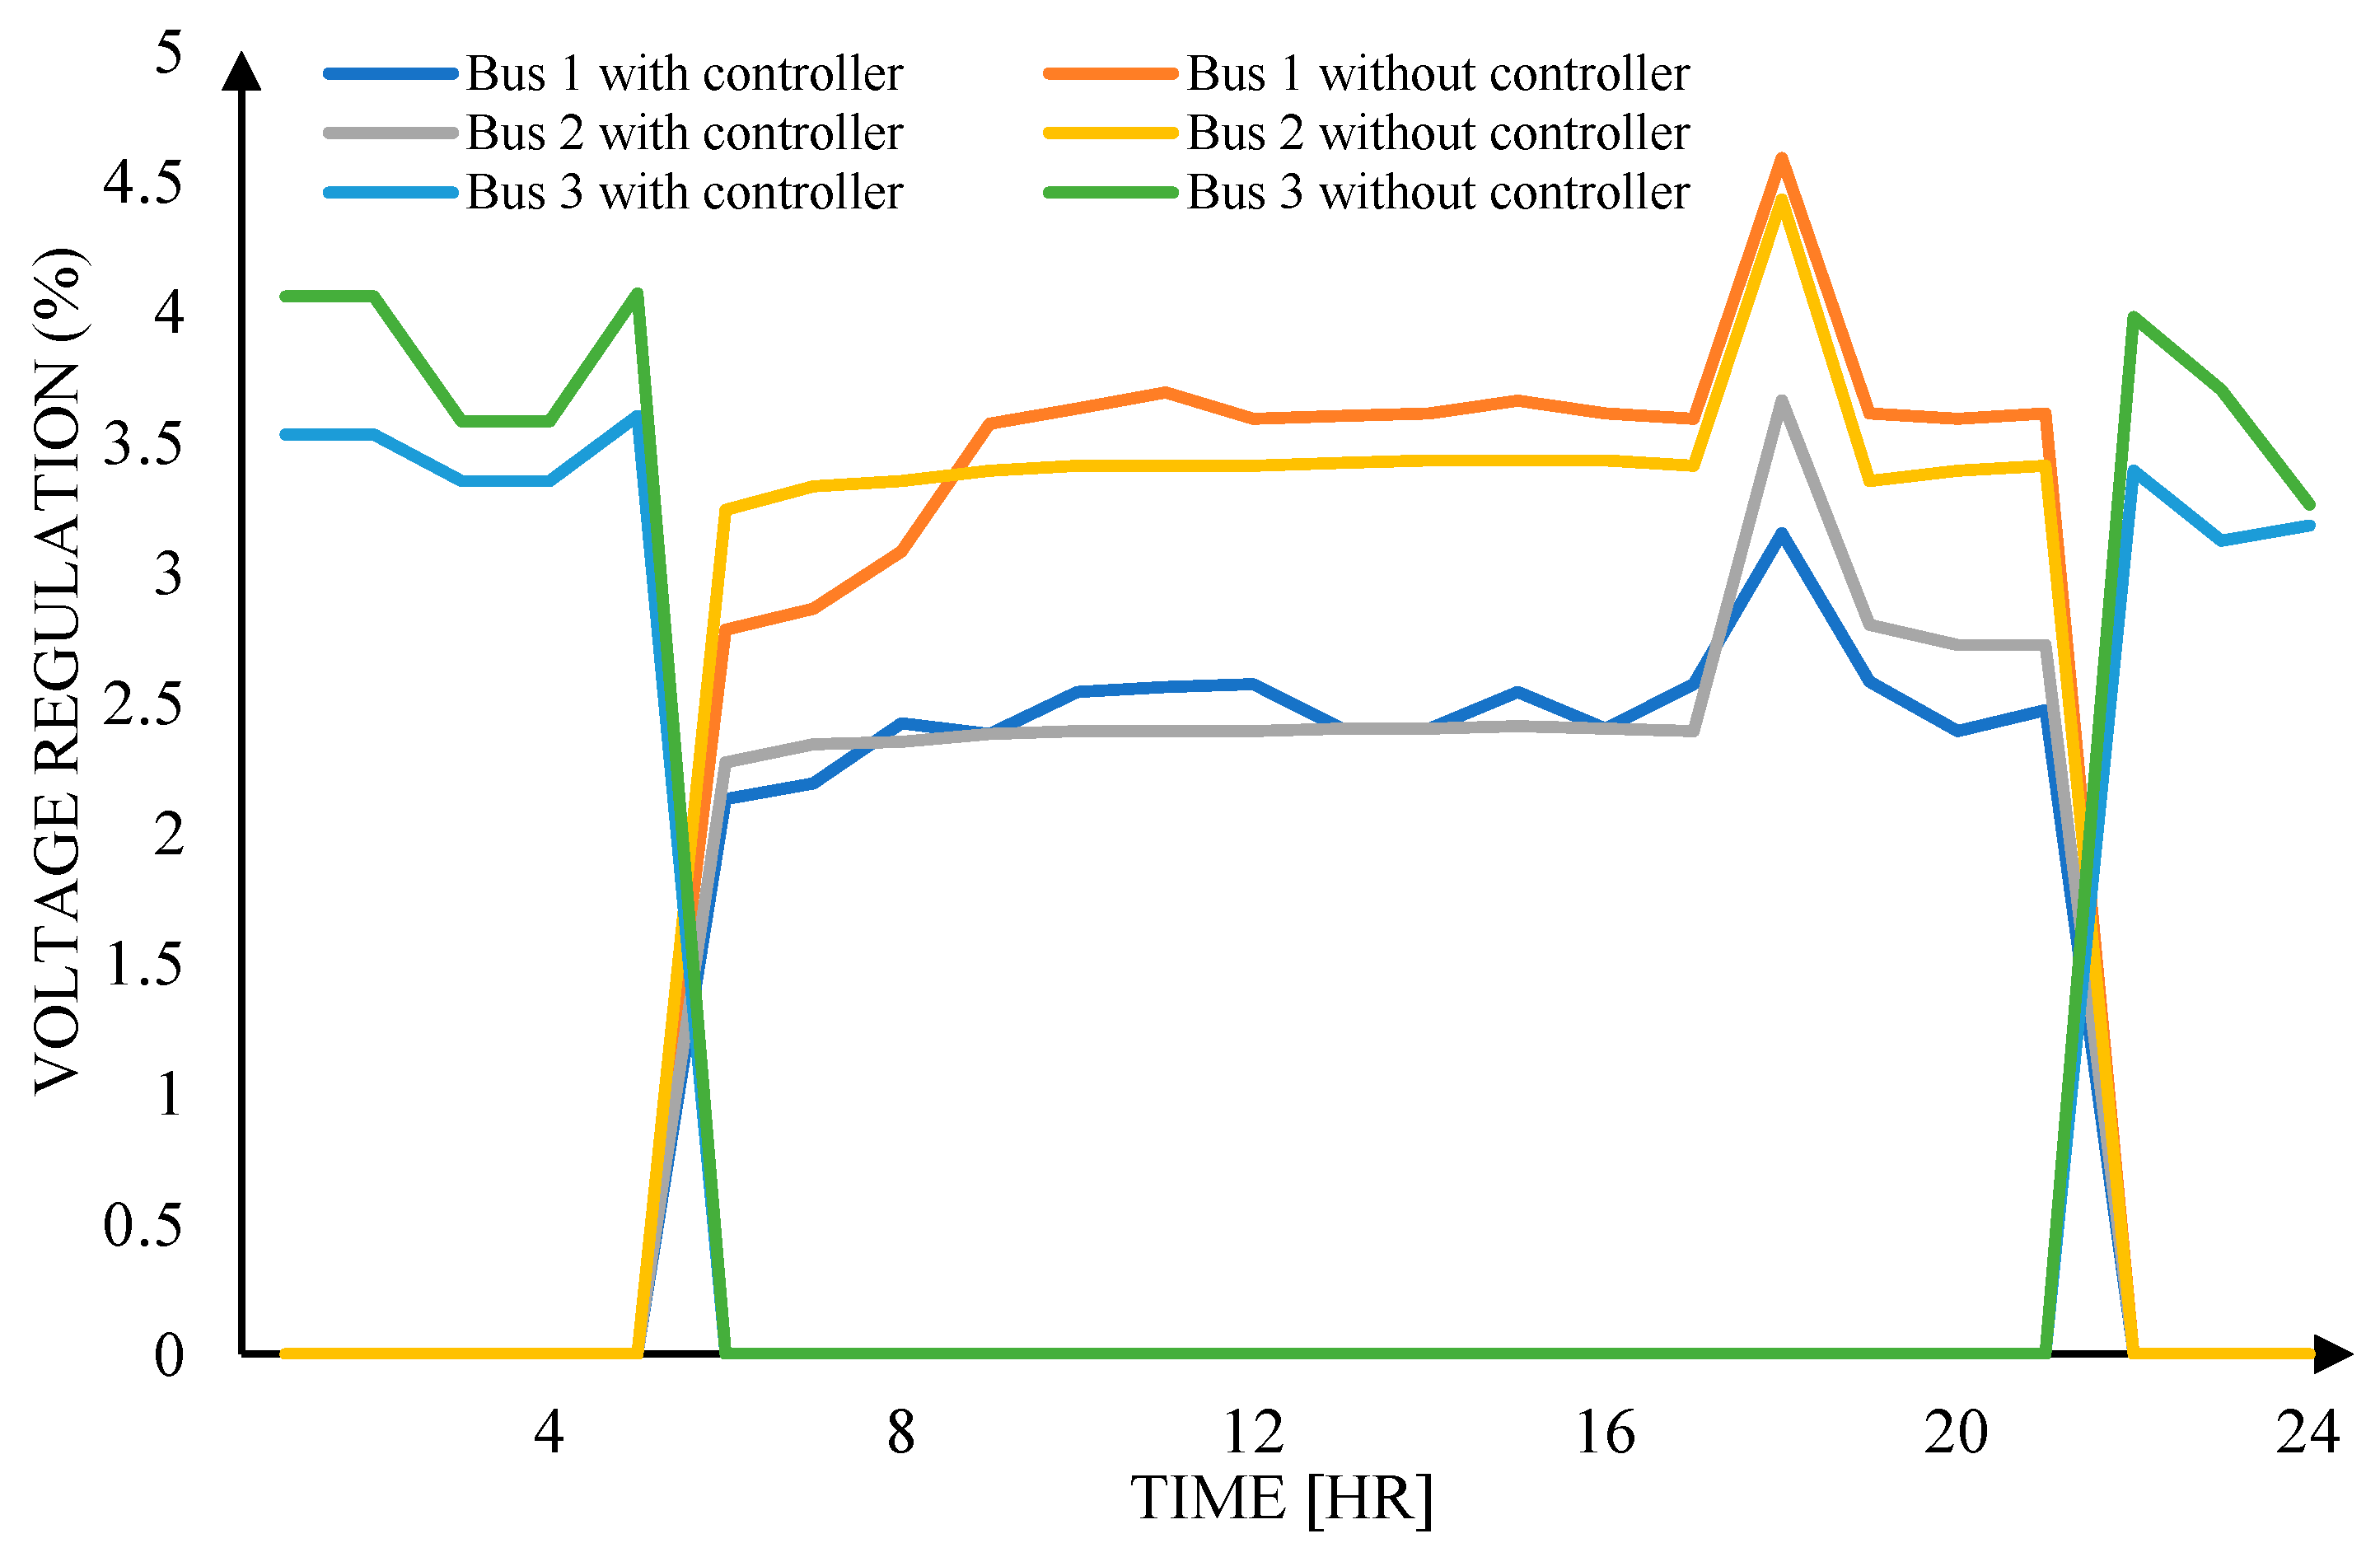
Figure 19 and Figure 20 depict the results of the IEEE-14 Bus Test System simulation. Figure 19 illustrates the frequencies of the 3 power source buses, showcasing a comparison between the system with the modified VSC controller and the system without the controller. It is evident from the figure that the frequencies of the system are significantly more regulated when the modified VSC controller is applied. This indicates the effectiveness of the controller in maintaining stable and consistent frequencies within the system.
Figure 20 highlights the impact of the modified VSC controller on voltage regulation. The figure clearly shows that the voltages are considerably more regulated when the modified VSC controller is employed compared to the system without the controller. This demonstrates the controller’s ability to effectively regulate and stabilize the voltages within the system.
The results presented in Figure 19 and Figure 20 provide valuable insights into the performance of the system with and without the modified VSC controller. They highlight the improved regulation and stability achieved through the application of the controller, emphasizing its significance in enhancing frequency and voltage control.
Overall, these findings affirm the positive impact of the modified VSC controller on the IEEE-14 Bus Test System simulation, emphasizing its effectiveness in ensuring reliable and well-regulated frequencies and voltages within the system.

4. Discussion

In this paper, the effectiveness of an MG system is observed by implementing the PV-FC microgrid in three out of the eight available subsystems, namely Atimonan, Hondagua, and Lopez. The PV–FC MG system, along with the proposed modified VSC controller, was applied in three different cases to determine its effects on the local power distribution system.

4.1. Case 1, 2 and 3 Simulation Results

The voltage regulation for Case 1 ranges from 0.1% to 1.0%, for Case 2 it ranges from 1.2% to 2.7%, and for Case 3 it ranges from 0.9% to 4.5%. Ideally, Case 1 exhibits the best voltage regulation due to the ideal conditions of the power utility [35] in the simulation, where no disturbances are considered. In contrast, Case 2 and Case 3 have higher voltage regulation compared to Case 1 due to the variance in the load-supply relation. However, the voltage regulation for all three cases falls within the standard range.
The distribution power losses for Case 1 range from 1.25 MVA to 2.5 MVA, for Case 2 it ranges from 0.8 MVA to 2.1 MVA, and for Case 3 it ranges from 0.9 MVA to 2.5 MVA. Distribution power losses are primarily accumulated in power transmission lines [36], which is one of the reasons why Case 1 and Case 3 accumulate more losses due to power transmission from the substation to end-users, compared to Case 2. Nonetheless, the distribution power losses for all three cases are within the standard range.
In the system, two frequencies are measured for all cases: the main distribution frequency and the MG frequency. The main distribution frequency represents the frequency of the main distribution system and, similar to voltage regulation, it is measured at the nominal value of 60 Hz under ideal conditions. On the other hand, the MG frequency is the measured power frequency at the microgrid level. In Case 1, the frequency is maintained at the nominal value of 60 Hz as the power supply is directly connected to the main distribution. In Case 2, the frequency fluctuates by ±0.5 Hz due to switching between PV and FC supply. In Case 3, the frequency fluctuates by ±0.1 Hz due to switching between PV, FC, and power utility supply. The distribution and MG frequencies for all three cases fall within the standard range.

4.2. Evaluation and Verification Results

Having only one scenario can result in shortcomings in the study. Therefore, the Taguchi method is adopted to consider different scenarios and explore the overall effect on the distribution system when multiple factors such as grid setup, the application of capacitors, or additional feeders are involved. The evaluation runs 9 experiments with different scenarios, as shown in Table 6. Table 11 displays the optimal levels for each factor: (A) conventional for grid setup, (B) with application of shunt capacitor, and (C) with application of series feeder.
In power systems with RES and load disturbances, the conventional power system setup performs better in terms of frequency response and voltage regulation compared to the DGs (distributed generations). However, the conventional power system accumulates power losses that are twice as much as the losses in the DGs due to the complex and long-distance transmission lines in the conventional setup. The application of capacitors and parallel feeders enhances the performance of both conventional and DGs power systems. With the application of capacitors and parallel feeders, power losses decrease, and both frequency and voltage are regulated to the standard level. On the other hand, the series feeder does not provide better response in any aspect and generates more power losses due to additional resistance in conductors, which may eventually lead to power disturbances.
The proposed modified VSC controller is applied and simulated on the IEEE 14-Bus Test System [25] for comparison purposes. The simulation results are presented and discussed. Figure 8 shows the test system, which consists of 14 buses, with 3 buses allocated for power sources and 11 buses for loads. Unlike the conventional IEEE-14 Bus System, the system in this study utilizes 2 buses for hybrid RES such as PV and FC, where the proposed modified VSC controller is applied, and 1 bus for the grid source instead of having 3 buses of power sources coming from the utility.
As observed, there are spikes in Figure 19 and Figure 20, representing frequency and voltage regulation, respectively. These spikes signify the switching of power sources from one bus to another. Figure 19 and Figure 20 record 3 spikes during the simulation: the first spike signifies the switching of power source from the utility to the PV source, the second spike represents the switching from the PV source to the FC source, and the last spike denotes the switching from the FC source back to the utility source.
It is evident from the simulation results that the IEEE-14 Bus System with the proposed modified VSC controller exhibits better frequency and voltage regulation compared to the IEEE-14 Bus System without the proposed controller. The spikes in both frequency and voltage regulation are reduced with the modified VSC controller, highlighting its advantage.

5. Conclusions

In conclusion, this study presents a comprehensive study on the implementation of a combined PV system and FC system as a hybrid power source for local power distribution in the Philippines. The analysis considers the forecasted load and meteorological limitations of the location to optimize the system’s performance. By applying the historical load demand and considering the meteorological constraints, the uncertainties in the power system are minimized.
The use of the Taguchi method and the application of the proposed system to the IEEE-14 Bus Test System provide valuable insights into designing the hybrid MG. These approaches allow for the evaluation of key areas and parameters to achieve optimal performance. The successful validation of the proposed system on a larger scale using the IEEE-14 Bus Test System adds credibility to the study.
The results demonstrate that both on-grid and islanded operations respond effectively to the modified VSC controller, ensuring compliance with international standards. The application of the hybrid MG significantly reduces power losses within the system. The selection of an appropriate control design enables the successful implementation of an MG system.
Overall, the performance of the proposed modified VSC controller is found to be satisfactory, showcasing the potential of the hybrid MG power system for local power distribution. This research contributes to advancing the field of renewable energy integration and lays the foundation for future studies in optimizing MG systems.
For future study, identification of supply sources of materials for the system, type of material, and cost shall be declared for the feasibility of the proposed system.

Author Contributions

Conceptualization, G.F.D.G.A.; methodology, G.F.D.G.A.; software G.A.T.R.; validation G.F.D.G.A. and M.C.P.; formal analysis, G.A.T.R.; investigation, G.A.T.R.; resources, G.A.T.R.; data curation, G.A.T.R.; writing—original draft preparation, G.A.T.R.; writing—review and editing, G.F.D.G.A. and M.C.P. All authors have read and agreed to the published version of the manuscript.

Funding

This research received no external funding.

Data Availability Statement

The data presented in this study are available on request from the corresponding author. The data are not publicly available due to privacy issues.

Acknowledgments

The authors would like to thank God, the Almighty, for granting countless blessing and opportunity to accomplish this study. The authors would also like to thank the editors and reviewers for their valuable insight and suggestions on this paper.

Conflicts of Interest

The authors declare no conflict of interest.

References

  1. Ozturk, M.; Yuksel, Y.E. Energy structure of Turkey for sustainable development. Renew. Sustain. Energy Rev. 2016, 53, 1259–1272. [Google Scholar] [CrossRef]
  2. Department of Energy. Policy Initiatives Energy Planning Process Energy Plan Outline. Philippine Energy Plan. Available online: https://www.doe.gov.ph/e-power-mo-towards-energy-resilient-philippines (accessed on 26 June 2018).
  3. Akula, S.K.; Salehfar, H. Frequency Control in Microgrid Communities Using Neural Networks. In Proceedings of the 2019 North American Power Symposium (NAPS), Wichita, KS, USA, 13–15 October 2019; pp. 1–6. [Google Scholar] [CrossRef]
  4. IEEE Std 2030.9-2019; IEEE Recommended Practices for the Planning and Design of the Microgrid. IEEE Standards Association: New York, NY, USA, 2019.
  5. Takano, H.; Goto, R.; Soe, T.Z.; Asano, H. Coordinated operation schedule of microgrids in consideration of penetration of variable renewable energy sources. Energy Rep. 2020, 6, 330–336. [Google Scholar] [CrossRef]
  6. Zhang, S.; Liu, J.; An, Z.; Ma, L.; Che, Q.; Peng, Y. Research on Optimal Scheduling of Power System with High-penetration Renewable Energy Considering Flexibility of Power Supply Side and Load Side. In Proceedings of the 2019 IEEE 3rd International Electrical and Energy Conference (CIEEC), Beijing, China, 7–9 September 2019; pp. 494–499. [Google Scholar] [CrossRef]
  7. Giri, A.K.; Arya, S.R.; Maurya, R. Compensation of Power Quality Problems in Wind-Based Renewable Energy System for Small Consumer as Isolated Loads. IEEE Trans. Ind. Electron. 2018, 66, 9023–9031. [Google Scholar] [CrossRef]
  8. Larico, E.R.A. Comparative analysis of extreme solar irradiance between a fixed photovoltaic system and a solar tracker in the Peruvian highlands. In Proceedings of the 2021 IEEE Engineering International Research Conference (EIRCON), Lima, Peru, 27–29 October 2021; pp. 1–4. [Google Scholar] [CrossRef]
  9. Inman, R.H.; Chu, Y.; Coimbra, C.F. Cloud enhancement of global horizontal irradiance in California and Hawaii. Sol. Energy 2016, 130, 128–138. [Google Scholar] [CrossRef]
  10. Nascimento, L.R.D.; Viana, T.D.S.; Campos, R.A.; Rüther, R. Extreme solar overirradiance events: Occurrence and impacts on utility-scale photovoltaic power plants in Brazil. Sol. Energy 2019, 186, 370–381. [Google Scholar] [CrossRef]
  11. Soltani, M.; Kashkooli, F.M.; Souri, M.; Rafiei, B.; Jabarifar, M.; Gharali, K.; Nathwani, J.S. Environmental, economic, and social impacts of geothermal energy systems. Renew. Sustain. Energy Rev. 2021, 140, 110750. [Google Scholar] [CrossRef]
  12. Dalimunthe, Y.K.; Anugrahadi, A.; Sugiarti, L. The Effect of Renewable Energy Socialization, Especially Biomass for Residents in Tambora Flat, West Jakarta. In Proceedings of the 2019 IEEE 3rd International Conference on Green Energy and Applications (ICGEA), Taiyuan, China, 16–18 March 2019; pp. 199–203. [Google Scholar] [CrossRef]
  13. Todeschini, G.; Coles, D.; Lewis, M.; Popov, I.; Angeloudis, A.; Fairley, I.; Johnson, F.; Williams, A.; Robins, P.; Masters, I. Medium-term variability of the UK’s combined tidal energy resource for a net-zero carbon grid. Energy 2021, 238, 121990. [Google Scholar] [CrossRef]
  14. Qu, J.; Shi, W.; Luo, K.; Feng, C.; Mou, J. Day-ahead Generation Scheduling Method for New Energy and Hydro Power System. In Proceedings of the 2018 International Conference on Power System Technology (POWERCON), Guangzhou, China, 6–8 November 2018; pp. 1899–1902. [Google Scholar] [CrossRef]
  15. Anoune, K.; Bouya, M.; Astito, A.; Ben Abdellah, A. Sizing methods and optimization techniques for PV-wind based hybrid renewable energy system: A review. Renew. Sustain. Energy Rev. 2018, 93, 652–673. [Google Scholar] [CrossRef]
  16. Barik, A.K.; Jaiswal, S.; Das, D.C. Recent trends and development in hybrid microgrid: A review on energy resource planning and control. Int. J. Sustain. Energy 2021, 41, 308–322. [Google Scholar] [CrossRef]
  17. Quashie, M.; Marnay, C.; Bouffard, F.; Joós, G. Optimal planning of microgrid power and operating reserve capacity. Appl. Energy 2018, 210, 1229–1236. [Google Scholar] [CrossRef]
  18. Phan, B.C.; Lai, Y.-C. Control Strategy of a Hybrid Renewable Energy System Based on Reinforcement Learning Approach for an Isolated Microgrid. Appl. Sci. 2019, 9, 4001. [Google Scholar] [CrossRef] [Green Version]
  19. Nebey, A.H. Design of optimal hybrid power system to provide reliable supply to rural areas of Ethiopia using MATLAB and Homer. Renew. Wind. Water Sol. 2021, 8, 4. [Google Scholar] [CrossRef]
  20. Rey, A.L.; Santiago, R.V.M.; Pacis, M.C. Modeling of a hybrid renewable power system for Calayan Island, Cagayan using the HOMER software. In Proceedings of the 2017 IEEE 9th International Conference on Humanoid, Nanotechnology, Information Technology, Communication and Control, Environment and Management (HNICEM), Manila, Philippines, 1–3 December 2017; pp. 1–6. [Google Scholar] [CrossRef]
  21. Ji, P.; Xiong, D.; Wang, P.; Chen, J. A Study on Exponential Smoothing Model for Load Forecasting. In Proceedings of the 2012 Asia-Pacific Power and Energy Engineering Conference, Shanghai, China, 27–29 March 2012; pp. 1–4. [Google Scholar] [CrossRef]
  22. Dudek, G.; Pelka, P.; Smyl, S. A Hybrid Residual Dilated LSTM and Exponential Smoothing Model for Midterm Electric Load Forecasting. IEEE Trans. Neural Networks Learn. Syst. 2021, 33, 2879–2891. [Google Scholar] [CrossRef] [PubMed]
  23. Ahmad, T.; Zhang, H.; Yan, B. A review on renewable energy and electricity requirement forecasting models for smart grid and buildings. Sustain. Cities Soc. 2020, 55, 102052. [Google Scholar] [CrossRef]
  24. Obaid, W.; Hamid, A.-K.; Ghenai, C. Hybrid PEM Fuel-Cell-Solar Power System Design for Electric Boat with MPPT System and Fuzzy Energy Management. In Proceedings of the 2019 International Conference on Communications, Signal Processing, and their Applications (ICCSPA), Sharjah, United Arab Emirates, 19–21 March 2019; pp. 1–7. [Google Scholar] [CrossRef]
  25. Sabaripandiyan, D.; Daniel, S.A. A comparative review on small scale integration of hybrid fuel cell and PV generating system to utility network. In Proceedings of the 2010 5th International Conference on Industrial and Information Systems, Mangalore, India, 29 July–1 August 2010; pp. 590–595. [Google Scholar] [CrossRef]
  26. Iqbal, M.T. Modeling and control of a wind fuel cell hybrid energy system. Renew. Energy 2003, 28, 223–237. [Google Scholar] [CrossRef]
  27. Sharma, K.; Agrawal, S.; Somani, R.; Kumar, P. Performance analysis of three phase integrated generation of SOFC (solid oxide fuel cell), PV (photovoltaic), with IC MPPT (maximum power point tracking) Controller. In Proceedings of the 2019 International Conference on Communication and Electronics Systems (ICCES), Coimbatore, India, 17–19 July 2019. [Google Scholar] [CrossRef]
  28. Haddad, A.; Ramadan, M.; Khaled, M.; Ramadan, H.S.; Becherif, M. Triple hybrid system coupling fuel cell with wind turbine and thermal solar system. Int. J. Hydrogen Energy 2019, 45, 11484–11491. [Google Scholar] [CrossRef]
  29. Septya, M.L.; Sudiharto, I.; Dwitya, N.S.; Qudsi, O.A.; Sunarno, E. Design and Implementation Soft-switching MPPT SEPIC Converter Using P&O Algorithm. E3S Web Conf. 2018, 43, 01010. [Google Scholar] [CrossRef] [Green Version]
  30. Hajizadeh, A.; Golkar, M.A.; Feliachi, A. Voltage Control and Active Power Management of Hybrid Fuel-Cell/Energy-Storage Power Conversion System Under Unbalanced Voltage Sag Conditions. IEEE Trans. Energy Convers. 2010, 25, 1195–1208. [Google Scholar] [CrossRef]
  31. Xu, L. Modeling, Analysis and Control of Voltage-Source Converter in Microgrids and HVDC. Ph.D. Thesis, University of South Florida, Tampa, FL, USA, 2013. [Google Scholar]
  32. Hong, Y.-Y.; Beltran, A.A.; Paglinawan, A.C. A robust design of maximum power point tracking using Taguchi method for stand-alone PV system. Appl. Energy 2018, 211, 50–63. [Google Scholar] [CrossRef]
  33. Azadani, E.N.; Hosseinian, S.H.; Divshali, P.H.; Vahidi, B. Stability Constrained Optimal Power Flow in Deregulated Power Systems. Electr. Power Compon. Syst. 2011, 39, 713–732. [Google Scholar] [CrossRef]
  34. Kamel, S.; Kodsi, M.; Canizares, C.A. Modeling and simulation of IEEE 14 bus system with facts controllers. Tech. Rep. 2003, 3. [Google Scholar]
  35. Kim, J.-B.; Lee, M.-G.; Lee, J.-H.; Ryu, J.-C.; Choi, T.-S.; Park, M.-S.; Kim, J.-E. Control Method of Step Voltage Regulator on Distribution Lines with Distributed Generation. Energies 2022, 15, 9579. [Google Scholar] [CrossRef]
  36. Bamigbola, O.M.; Ali, M.M.; Awodele, K.O. Predictive Models of Current, Voltage, and Power Losses on Electric Transmission Lines. J. Appl. Math. 2014, 2014, 146937. [Google Scholar] [CrossRef] [Green Version]
Figure 1. Interconnected microgrid structure based on IEEE Std 2030.9.
Energies 16 05906 g001
Figure 2. QUEZELCO 1 Distribution System.
Energies 16 05906 g002
Figure 3. Load Forecasting and RES Generation Sizing System Algorithm.
Energies 16 05906 g003
Figure 4. Proposed QUEZELCO 1 Microgrid System.
Energies 16 05906 g004
Figure 5. Photovoltaic System.
Energies 16 05906 g005
Figure 6. Fuel Cell System.
Energies 16 05906 g006
Figure 7. Equivalent model of (a) Conventional VSC and (b) Modified VSC connected to three-phase grid.
Energies 16 05906 g007
Figure 8. Evaluation Process.
Energies 16 05906 g008
Figure 9. IEEE-14 Bus Test System.
Energies 16 05906 g009
Figure 10. Case 1 Voltage Regulation.
Energies 16 05906 g010
Figure 11. Case 1 Distribution Power Losses.
Energies 16 05906 g011
Figure 12. Case 1 Frequency.
Energies 16 05906 g012
Figure 13. Case 2 Voltage Regulation.
Energies 16 05906 g013
Figure 14. Case 2 Distribution Power Losses.
Energies 16 05906 g014
Figure 15. Case 2 Frequencies.
Energies 16 05906 g015
Figure 16. Case 3 Voltage Regulation.
Energies 16 05906 g016
Figure 17. Case 3 Distribution Power Losses.
Energies 16 05906 g017
Figure 18. Case 3 Frequencies.
Energies 16 05906 g018
Figure 19. IEEE-14 Bus System Test Frequencies.
Energies 16 05906 g019
Figure 20. IEEE-14 Bus System Test Voltage Regulation.
Energies 16 05906 g020
Table 1. Demand Forecast for 2030.
SubstationForecasted Peak Demand (MW)Power FactorTransformer Loading (%)
Atimonan4.890.96101.87
Mulanay8.550.9689.06
Gumaca11.510.97118.66
Tagkawayan10.270.97211.75
Hondagua6.770.96141.04
Lopez7.940.97163.71
Pitogo8.950.95188.42
Catanuan8.690.97179.18
TOTAL67.57
Table 2. Case Study.
Energy SourceCases
123
UtilityOnOffSwitching
Fuel CellOffSwitching
SolarOff
Table 3. Case Study Power Schedule.
Case123
Utility Supply0100H–2400H1800H–2400H0100H–0600H
2000H–2400H
PV SystemNone0700H–1700H0700H–1700H
FC SystemNone0100H–0600H0800H–1900H
Table 4. Level of factors.
FactorsLevels
123
A. Network ConfigurationConventionalIsolatedCombination
B. Application of CapacitorNo ApplicationShunt CapacitorSeries Capacitor
C. Application of Additional FeedersNo ApplicationParallel FeederSeries Feeder
Table 5. Taguchi L9 (33) Orthogonal Array Values.
ExperimentsFactors
A. Grid SetupB. Application of CapacitorC. Application of Additional Feeders
L1Conventional No ApplicationNo Application
L2Conventional Shunt CapacitorParallel
L3Conventional Series CapacitorSeries
L4Isolated No ApplicationParallel
L5IsolatedShunt CapacitorSeries
L6IsolatedSeries CapacitorNo Application
L7CombinationNo ApplicationSeries
L8CombinationShunt CapacitorNo Application
L9CombinationSeries CapacitorParallel
Table 6. Taguchi L9 (33) Orthogonal Array.
ExperimentsABC
L1111
L2122
L3133
L4212
L5223
L6231
L7313
L8321
L9332
Table 7. IEEE-14 Bus Test System Power Schedule.
Bus123
Utility SupplyNoneNone0100H–0430H
2000H–2400H
PV System0430H–1500H0430H–1500HNone
FC System1600H–2000H1600H–2000HNone
Table 8. Simulation Parameters.
ItemParametersValue
GridNGCP Voltage69 kV (L-L RMS)
QUEZELCO Voltage13.2 kV (L-L RMS)
NGCP Supply2500 MVAsc
NGCP Transmission line10 km, (0.0224 + 0.0719j) ohm
Fuel Cell (PEFMC)Fuel Cell Stack (User Defined)216 kW, 420 Vdc
No. of cell65
No. of parallel31 a, 43 b, 51 c
Proportional gain (Kp)0.0005
Integral gain (Ki)0.15
PV
PV
ModuleSunPower SPR-315E-WHT-D
Cell per module96
Maximum Power per module157.5 W
No. of string series7
No. of string parallel70
Maximum Power per array77.175 kW
No. of array80 a, 111 b, 130 c
MPPT initial duty cycle0.485
MPPT Upper limit duty cycle0.6
MPPT Lower limit duty cycle0.4
a Atimonan b Lopez c Hondagua.
Table 9. Taguchi L9 (33) Orthogonal Array Values at Frequency Level.
ExperimentsFactorsLevels
A. Grid SetupB. Application of CapacitorC. Application of Additional Feeders123
L1Conventional No ApplicationNo Application60.000060.000060.0000
L2Conventional Shunt CapacitorParallel60.000060.000060.0000
L3Conventional Series CapacitorSeries60.000060.000060.0000
L4Isolated No ApplicationParallel59.997559.995759.9954
L5IsolatedShunt CapacitorSeries60.002159.997960.0004
L6IsolatedSeries CapacitorNo Application60.001759.994259.9958
L7CombinationNo ApplicationSeries59.999959.999959.9999
L8CombinationShunt CapacitorNo Application59.999959.999959.9999
L9CombinationSeries CapacitorParallel59.999959.999959.9999
Table 10. Taguchi L9 (33) Orthogonal Array Values at Power Loss (kVA) Level.
ExperimentsFactorsLevels
A. Grid SetupB. Application of CapacitorC. Application of Additional Feeders123
L1ConventionalNo ApplicationNo Application71.9376120.7397118.3158
L2ConventionalShunt CapacitorParallel71.788119.771117.4715
L3ConventionalSeries CapacitorSeries71.915120.7352118.275
L4IsolatedNo ApplicationParallel38.344642.08597.0529
L5IsolatedShunt CapacitorSeries38.253641.999398.032
L6IsolatedSeries CapacitorNo Application38.453642.779498.5673
L7CombinationNo ApplicationSeries69.0491104.6211140.8835
L8CombinationShunt CapacitorNo Application69.3228105.036141.4422
L9CombinationSeries CapacitorParallel69.4801105.2739141.7622
Table 11. Taguchi L9 (33) Orthogonal Array Values at Voltage Regulation (%) Level.
ExperimentsFactorsLevels
A. Grid SetupB. Application of CapacitorC. Application of Additional Feeders123
L1Conventional No ApplicationNo Application0.90680.90680.6602
L2Conventional Shunt CapacitorParallel0.35220.77870.5308
L3Conventional Series CapacitorSeries0.66020.77920.5315
L4Isolated No ApplicationParallel2.15922.50812.3473
L5IsolatedShunt CapacitorSeries1.83281.05701.1659
L6IsolatedSeries CapacitorNo Application1.90322.35432.0921
L7CombinationNo ApplicationSeries0.35420.91200.6639
L8CombinationShunt CapacitorNo Application0.33500.86250.6279
L9CombinationSeries CapacitorParallel0.34250.88190.6420
Table 12. Sensitivity Analysis.
LevelsFactors
A. Grid SetupB. Application of CapacitorC. Application of Feeders
150.691249.535550.6912
248.370549.851448.3705
350.034849.709650.0348
Sensitivity1.66430.31591.6643
Rank123
Disclaimer/Publisher’s Note: The statements, opinions and data contained in all publications are solely those of the individual author(s) and contributor(s) and not of MDPI and/or the editor(s). MDPI and/or the editor(s) disclaim responsibility for any injury to people or property resulting from any ideas, methods, instructions or products referred to in the content.