Abstract
In this work, the thermodynamics and kinetics of hydrate formation in 9.01 wt% tetra butyl ammonium bromide (TBAB) mixed with water-soluble hydroxylated multi-wall carbon nanotube (MWCNTol) systems were characterized by measuring hydrate formation conditions, induction time, and final gas consumption. The results showed that MWCNTols had little effect on the phase equilibrium of CO2 hydrate formation. Nanoparticles (graphene nanoribbons (GNs) and MWCNTols) could significantly shorten the induction time. When the concentration was ≤0.06 wt%, MWCNTols had a better effect on the induction time than the GN system, and the maximum reduction in induction time reached 44.22%. The large surface area of MWCNTols could provide sites for heterogeneous nucleation, thus shortening the induction time of hydrate formation. Furthermore, adding different concentrations of nanoparticles to the 9.01 wt% TBAB solution effectively increased the final gas consumption, and the maximum increase was 10.44% of the 9.01 wt% TBAB + 0.08 wt% GN system. Meanwhile, the suitable initial pressure and experimental temperature could also promote the hydrate formation and increase the motivation in hydrate formation. The 9.01 wt% TBAB + 0.02 wt% MWCNTol system had the best effect at 3.5 MPa and 277.15 K. The induction time was reduced by 66.67% and the final gas consumption was increased by 284.11% compared to those of the same system but at a different initial pressure and experimental temperature. This work helps to promote the industrial application of hydrate technology in CO2 capture and storage.
1. Introduction
With the gradual increase in carbon emissions from human activities and the intensification of global warming, there is an urgent need to make efforts to reduce the concentration of greenhouse gases in the atmosphere, both in terms of reducing greenhouse gas emissions and sequestering greenhouse gases [1]. Gas hydrate has the advantage of high energy storage density: 1 m3 hydrate can store 160~180 m3 of gas [2], with high energy density and strong gas storage capacity. It is undoubtedly an optional way to reduce greenhouse gas emissions and realize carbon neutrality. Currently, based on an in-depth understanding of the physical and chemical properties of hydrates, many hydrate-based techniques have been developed, including natural gas storage and transportation [3,4], seawater desalination [5,6,7], cold energy transportation [8], and carbon dioxide storage and sequestration [9,10,11]. However, two main factors limit the commercial application of these technologies, namely, high hydrate formation conditions and slow hydrate formation kinetics [12]. Therefore, measures need to be taken to enhance the hydrate generation process to improve the hydrate formation conditions [13,14], increase the chances of hydrate formation, accelerate the rate of hydrate formation, and increase the gas consumption [15].
Over the past several decades, considerable research efforts have been devoted to solving these two problems. For high hydrate formation conditions, the addition of thermodynamic promoters is the only effective method that has been proven to significantly promote the hydrate formation. To date, some common thermodynamic promoters have been systematically investigated for improving hydrate formation conditions, including analytic-grade tetra butyl ammonium bromide (TBAB) [16], tetrahydrofuran (THF) [17], propane [18,19], and cyclopentane (CP) [20]. The most economical way to address the problem of slow kinetics is to use additives that can greatly improve the heat and mass transfer of the hydrate formation system. Surfactant is one of the feasible materials that can enhance mass transfer by reducing the surface tension between the gas and liquid. Several experiments have been conducted to investigate the hydrate formation kinetics in the presence of surfactants including sodium dodecyl sulfate (SDS) [21], sodium dodecyl benzene sulfonate (SDBS) [22], and Polysorbate 80 (Tween 80) [23,24,25,26]. Hawkins et al. [27] first found that THF was a good promoter of CO2 hydrate formation. It could significantly reduce the formation pressure and induction time of CO2 hydrate formation. Lee et al. [28] further improved the experiment of the previous study, and found the thermodynamic conditions required for the CO2 hydrate formation could be greatly improved. However, if the concentration was greater than 19.08%, it would inhibit the CO2 hydrate formation. Yang et al. [29] investigated the effects of THF, TBAB, and the compound system of THF and TBAB at different concentrations on CO2 hydrate formation. It was proven that the effect on CO2 hydrate formation of THF with a 5% mass fraction was superior to that of TBAB with a 5% mass fraction. These studies showed that the addition of surfactants could greatly promote the hydrate formation kinetics. The above-mentioned thermodynamic accelerators could produce hydrates themselves, and the conditions required for their production of hydrates were often easier than those of gas hydrates. However, the thermodynamic accelerators also had many disadvantages, such as being volatile and toxic, and requiring large dosages. Furthermore, it should be noted that the use of surfactants would usually cause the creation of foam during the formation and dissociation of hydrates, which would prevent the removal of heat from the system, especially in large-scale hydrate production [30,31,32,33,34].
In recent years, since nanoparticles have good thermal conductivity and a very high surface area to volume ratio, they had been considered and proven to be a breakthrough in promoting hydrate formation. Park et al. [35] first reported the kinetics promotion effect of MWCNTs and OMWCNTs on CO2 hydrate formation in 2010. The experimental results showed that they could increase the rate and gas consumption of hydrate formation. Then, Renault et al. [36] studied the promotion effect of OMWCNTs on CO2 hydrate formation. The results showed that the addition of OMWCNTs increased the rate of CO2 dissolution and gas consumption in the growth process in less than 1 h of induction time. Aliabadi et al. [37] studied the effect of CuO nanoparticles on the induction time of methane hydrate formation. They proved that at 5.5 MPa and 275.65 K, relative to methane hydrate formation in 500 ppm SDS solution, the induction time obtained after adding 0.01 wt% CuO was decreased significantly, by up to 79.4%. Nesterov et al. [38] studied the formation process of natural gas hydrate in the presence of Al2O3. The results showed that in comparison with hydrate formation in pure water, Al2O3 could greatly reduce the hydrate formation induction time. Meanwhile, they pointed out that the Al2O3 size had no significant effect on hydrate formation induction time. Mohammadi et al. [39] used silver nanoparticles as additives to promote CO2 hydrate formation, and the results showed that the addition of silver nanoparticles led to decrease in CO2 consumption by 93.9% and 60.3%, respectively, compared to those of the pure water system and 500 ppm SDS solution system. Lee et al. [40] also found that titanium dioxide-silver-silica nanoparticles could greatly increase gas consumption by up to 56% compared to those obtained from pure water. Said et al. [41] studied the effects of Al2O3, SiO2, Ag, and Cu nanoparticles on the kinetics of CO2-CH4 hydrate formation. Their results showed that SiO2 was the most efficient nanoparticle in promoting hydrate formation kinetics. It is worth mentioning that our group confirmed that graphite nanoparticles (GNs) could also significantly promote CO2 hydrate formation [42,43,44]. Based on these studies and our previous studies [16,43], we found that nanoparticles can greatly promote the formation kinetics. MWCNTols and GNs have a high specific surface area and could provide more nucleation sites for hydrate formation. They have great potential in promoting hydrate formation.
To address the problems of the long hydrate induction time of the TBAB single system and the easy formation of foam during the dissociation process, this experiment studied the combination of TBAB as a thermodynamic promoter and nanoparticles (GNs and MWCNTols) to promote CO2 hydrate formation in the compound system. This was the first time that TBAB was combined with nanoparticles to study the kinetics of CO2 hydrate formation. The thermodynamics and kinetics of hydrate formation were characterized by measuring hydrate formation conditions, induction time, and final gas consumption. These results could help us systematically understand the synergistic effect of nanoparticles and TBAB on CO2 hydrate formation.
2. Materials and Methods
2.1. Experimental Materials
The MWCNTols (purity 98%) used for the experiments had an average diameter of 50 nm and an average length of 10 µm. They were purchased from Shenzhen Turing Evolutionary Technology Co., Ltd. in Shenzhen, China. The GNs (purity 99.9%) had an average fineness of 50 nm, and were supplied by Jiexin Innovative Materials Technology Co. in Xuzhou, China. TBAB (purity 99%) was provided by Shanghai Shengzhong Fine Chemical Co., Ltd., in Shanghai, China. A hydrate-forming carbon dioxide (CO2) gas with a purity of 99.8% was purchased from Changzhou Jinghua Industrial Gases Co., Ltd., in Changzhou, China. The deionized water (resistivity 18.25 mΩ·cm−1) produced in the laboratory was used for all experiments in this work.
2.2. Experimental Apparatus
The schematic diagram of the experimental apparatus was consistent with that of the previous study [16]. As shown in Figure 1, the experimental apparatus included an air intake system, a liquid intake system, a data acquisition system, a cooling system, and a hydrate reactor. The CO2 gas was supplied by opening the needle valve of the gas cylinder, which could withstand being placed in the reactor up to 30 MPa. A viewing window was equipped to observe the morphology of hydrate formation. A thermocouple (Pt100) and a BD pressure transducer were used to measure the temperature and pressure in the reactor. The reactor (500 mL) was placed in the water bath, for which the temperature was controlled by a chiller provided by Ningbo Tianyu Instrument Factory, in Ningbo, China. A magnetic stirrer was opened to better mix the gas–liquid. The pressure and temperature during the hydrate formation were recorded in real time.
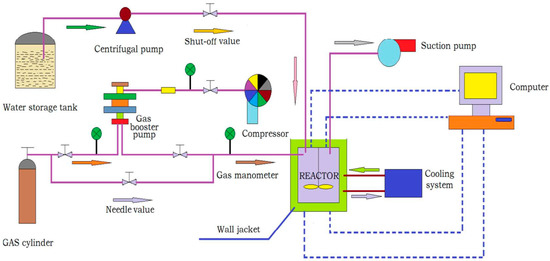
Figure 1.
Schematic diagram of the experimental apparatus.
2.3. Experimental Procedures
The liquid was prepared before the experiment. A quantity of 20 g of TBAB, weighed by an electronic balance, was first added to 200 mL of deionized water. Then, a certain amount of MWCNTols was added to the TBAB solution. After that, the mixture was dispersed with ultrasound for 30 min to obtain uniform MWCNTols suspension. The solution in TBAB mixed with GNs was prepared in the same way. A certain amount of TBAB weighed by an electronic analytical balance was added to the measured deionized water, and the measured GN nanoparticles were added to the uniformly dispersed TBAB solution. It was then placed in an ultrasonic dispersion instrument for ultrasonic treatment for 30 min.
In this work, a stepwise method was used to determine the hydrate formation conditions, which were the same as those of our previous report [16,42,43]. For kinetics studies, the experiment was carried out under isometric conditions. Before the experiment, the hydrate reactor was washed with deionized water at least three times. Then, the air in the reactor was removed using a vacuum pump. After that, the liquids and CO2 were loaded into the reactor. Subsequently, the cooling system was turned on to maintain the temperature at a set value for 3 h, and the data acquisition system was opened to record the changes in temperature and pressure. Simultaneously, the magnetic stirrer was started with a speed of 600 r/min to accelerate the gas dissolution. When the temperature and pressure in the system were stable for more than 2 h, the temperature was reduced gradually to form hydrates. It was noted that after the pressure of the reactor was maintained at a certain value for 2 h after hydrate formation, the hydrate formation was considered to have reached equilibrium.
3. Results and Discussions
Table 1 presents the effect of 9.01 wt% TBAB and different concentrations of MWCNTols and GNs on the induction time and moles of gas finally consumed.

Table 1.
The experimental results for the 9.01 wt% TBAB mixed with different MWCNTol and GN concentrations.
3.1. Phase Equilibrium of Hydrate Formation
It is noted that the CO2 hydrate formation conditions in the presence of GNs had been reported in the literature [16,42]. Therefore, in this work, the determination of the CO2 hydrate formation conditions was focused on the system containing MWCNTols. Figure 2 shows the phase equilibrium curves of CO2 hydrate formation in the suspension with different concentrations of MWCNTols, and the specific data are displayed in Table 1. As seen in Figure 2, it can be found that the addition of MWCNTols slightly decreased the CO2 hydrate formation phase equilibrium conditions compared to those of the 9.01% TBAB single system. The results were different from those obtained by Zhou et al. [16]. In the system containing TBAB and GNs, they declared that the addition of GNs had a negative effect on reducing CO2 hydrate formation phase equilibrium conditions. This difference may be determined by the structure of GNs and MWCNTols. It is well known that, for graphite, only three of the four valence electrons of a carbon atom are bonded, which indicates that each carbon atom has an unpaired electron. The unpaired electron can enhance graphite’s adsorption of polar molecules and H2O molecules [45]. It should be noted that water molecules are more likely to be adsorbed on the surface of GNs, relative to combination with other water molecules through hydrogen bonds, thereby presenting a negative effect on CO2 hydrate formation [46]. However, the tube structure of MWCNTols eliminated a large number of edge bonds and the total energy of the system was lower than that of the GN system. Meanwhile, the intermolecular potential energy on the inner wall of MWCNTols exerted an equivalent pressure on the fluid, thereby increasing the freezing point of water, which eventually affected the phase equilibrium of hydrate formation [46]. Therefore, in this work, a slight decrease in hydrate formation phase equilibrium conditions was observed after adding MWCNTols. Figure 2 shows that the concentration of MWCNTols could not significantly affect the phase equilibrium of hydrate formation in the 9.01 wt% TBAB + MWCNTols system. This was consistent with the results of Sheng et al. [47].
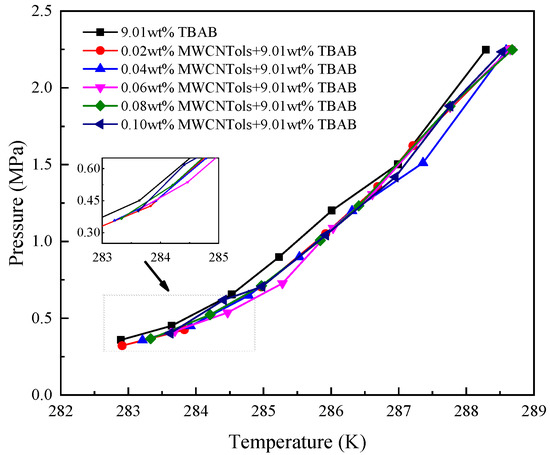
Figure 2.
Phase equilibrium curves for TBAB + MWCNTols varying with different MWCNTols concentrations.
3.2. Hydrate Formation Kinetics
In this work, the hydrate formation experiment was conducted at 277.15 K, 2.5 MPa, and at a speed of 600 r/min. It could be confirmed that no phase transition occurred for CO2 gas in these conditions.
3.2.1. Induction Time
The definition and determination method of the induction time was described in our previous studies [48]. Figure 3 shows the induction time in the 9.01 wt% TBAB + MWCNTol and 9.01 wt% TBAB + GN systems. As can be seen in Figure 3, the addition of nanoparticles significantly decreased the induction time of hydrate formation compared to that of the pure TBAB solution. This was because the nanoparticles could provide a large number of nucleation sites and lead to heterogeneous nucleation. Furthermore, their addition could also significantly improve the system’s heat and mass transfer, thereby greatly promoting the hydrate formation. Taking the 9.01 wt% TBAB + GN system as an example, Table 1 shows that the induction time in Run 10 and Run 11 was decreased by 36.99% and 34.97% respectively, compared to that of the pure TBAB solution system. Furthermore, the induction time of hydrate formation in the 9.01 wt% TBAB + GN system was decreased with the increase in GN concentration, as shown in Figure 3. However, the results were different in the 9.01 wt% TBAB + MWCNTols system. Table 1 shows that the induction time for 9.01 wt% TBAB + various MWCNTols decreased obviously relative to that of the pure TBAB solution system. Specifically, after adding the MWCNTols (0.02 wt%), the induction time of hydrate formation was decreased significantly from 34.6 ± 0.6 min (the pure TBAB solution) to 19.3 ± 1.5 min. However, as the MWCNTol concentration further increased to 0.04 wt%, the induction time of hydrate formation was increased slightly to 23.1 ± 0.5 min. After that, the induction time of hydrate formation was almost maintained at the same level and it was not affected clearly by MWCNTol concentrations. In addition, as seen in Figure 3, at the concentration less than or equal to 0.06 wt%, MWCNTol was a more efficient nanoparticle at reducing the induction time of hydrate formation compared to GN. However, as the concentration further increased, the opposite result could be observed. This was because large-scale nanoparticle agglomeration occurred when the MWCNTol concertation was larger than 0.06 wt%. As a result, the viscosity of the solution increased and the effective surface area was limited, which affected mass and heat transfer, thereby inhibiting the hydrate formation.
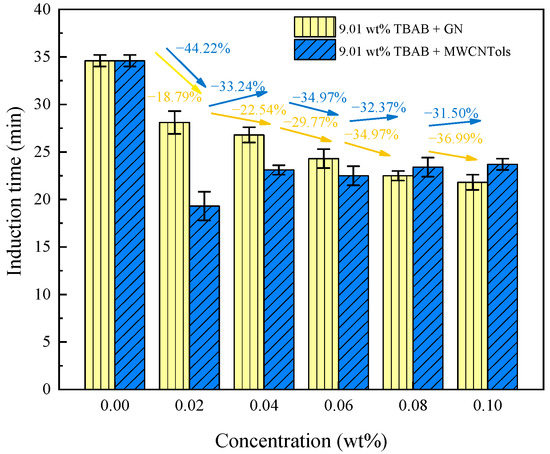
Figure 3.
The induction time of hydrate formation in the 9.01 wt% TBAB solution with different concentrations of MWCNTol and GN systems.
This may be because the nanofluid was a kind of solid–liquid mixture, and its thermal conductivity was not only related to the matrix fluid, but it also had a close relationship with the thermal conductivity of the added nanoparticles. According to the theory of effective thermal conductivity of mixtures, the whole thermal conductivity of nanofluids would be improved by adding nanoparticles with a large diameter ratio, a columnar shape, and high thermal conductivity [49]. Meanwhile, MWCNTols had strong hydrophilicity, which also enhanced the mass transfer of gas to the empty hydrate cage. In addition, the larger specific surface area of MWCNTols could fully adsorb gas molecules, providing a more effective carrier for the hydrate formation. Therefore, compared with nanofluids containing GNs, nanofluids containing MWCNTols had stronger mass and heat transfer properties. However, when the concentration of MWCNTols exceeded 0.02 wt%, the induction time was increased. The reason for this may be that when the concentration of MWCNTols exceeded the optimal concentration, they would agglomerate, thus reducing the gas–liquid contact area and the collisions between the hydrate particles, and thereby reducing the possibility of cross-nucleation and inhibiting the process of hydrate nucleation. Finally, the induction time of hydrate formation was increased with the increase in concentration.
3.2.2. Gas Consumption
Gas consumption is an important parameter for the kinetics of hydrate formation, and is calculated using the following equation [50]:
where V is the volume of the gas phase in the reactor. T and P are the temperature and pressure in the reactor, respectively. R is 8.314 J/(mol·K). Z is calculated by the Peng–Robinson equation [51]. Subscripts 0 and t represent time 0 and time t, respectively. Although it is well known that the volume of the gas phase in the reactor decreases as the hydrate forms, no significant effects were observed in the previous analysis of gas consumption [52]. Therefore, in this work, the volume of the gas phase in the reactor during hydrate formation was considered to be a constant.
Figure 4 shows the gas (CO2) consumption of hydrate formation in 9.01 wt% TBAB mixed with different concentrations of MWCNTol and GN systems, and their final gas consumptions are displayed in Table 1. From Figure 4a,b, it can be seen that for all cases, two stages of hydrate formation were observed. This result was consistent with the result reported in the previous literature [53]. In the literature, it can be found that there were two stages for hydrate formation in the presence of TBAB: (1) pure TBAB hydrate formation; and (2) gas molecules entered the empty cages of TBAB hydrate to form TBAB-CO2 binary hydrate. This may raise the question of why the pure TBAB hydrate formation did not result in a large amount of gas consumption, while more than 0.1 mol of gas consumption was observed in the first stage, as shown in Figure 4a,b. It should be noted that these two stages could not be strictly distinguished in practice. Simultaneously, in the initial stage of the experiment, a large amount of CO2 gas could also be dissolved in water. Therefore, a considerable amount of CO2 gas consumption was found in the initial stage of these experiments. Furthermore, Figure 4 shows that the gas consumption in the 9.01 wt% TBAB + GN and 9.01 wt% TBAB + MWCNTol systems was almost maintained at the same level. It is clearly shown in Table 1 that the final gas consumption in 9.01 wt% TBAB + MWCNTol and 9.01 wt% TBAB + GN systems was similar, although some slight differences were found for different nanoparticle concentrations.
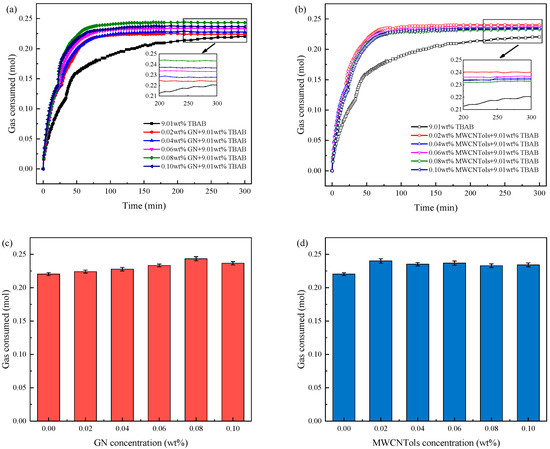
Figure 4.
Effect of TBAB + MWCNTol and GN systems with different concentrations on the amount of CO2 consumed: (a) the curves of CO2 consumed in 9.01 wt% TBAB + different concentration GN systems; (b) the curves of CO2 consumed in 9.01 wt% TBAB + different concentration MWCNTol systems; (c) the bar graph of CO2 consumed in 9.01 wt% TBAB + different concentration GN systems; (d) the bar graph of CO2 consumed in 9.01 wt% TBAB + different concentration MWCNTol systems.
According to the analysis, this phenomenon occurred because, in the continuous process of hydrate formation, the hydrate formed earlier would increase the mass transfer resistance across the gas–liquid interface, and reduce the mass transfer efficiency, resulting in the decrease in the rate of hydrate formation. Furthermore, when nanoparticles were added to the system, it could be seen that there was no obvious two-stage gas consumption increase during the reaction process. This indicated that the gas dissolution process was not completed, but a large number of hydrates began to be generated. Furthermore, the addition of nanoparticles promoted hydrate nucleation and shortened the induction time of hydrate formation. The presence of both GNs and MWCNTols could increase the gas consumption of hydrate formation to some extent. As seen in Figure 4c, when 0.08 wt% GN was added to 9.01 wt% TBAB solution, the final gas consumption of the hydrate formation reached the maximum. This was mainly because, when the content of nanoparticles in the fluid exceeded a certain value, the viscosity of the fluids increased with the increase in concentration, resulting in the decline of the mass transfer capacity. As a result, the final gas consumption increased first and then decreased. The data in Table 1 show that the molar amount of gas consumed by adding 0.08 wt% GN was increased by 10.44% compared to that of the pure TBAB system. For MWCNTols, as shown in Figure 4d, the final gas consumption of hydrate formation was the highest when the concentration was 0.02 wt%. The molar amount of gas consumed was increased by 8.94% compared to that of the pure TBAB system, as shown in Table 1.
In addition, it can be seen from the slope of curves in Figure 4a,b that the rate of gas consumption of the TBAB + nanoparticle (GN and MWCNTol) systems was also significantly higher than that of the TBAB single system. This was because the addition of nanoparticles reduced the surface tension of the fluid and they had excellent mass and heat transfer performance. According to the theory obtained by Song et al. [52], the solubility of the gas in the fluid was not affected by the presence of nanoparticles. However, the presence of GNs and MWCNTols strengthened the mass transfer across the gas–liquid interface, thereby increasing the rate of gas dissolution, and resulting in a rapid decline in the initial gas phase pressure. Furthermore, they could provide more nucleation sites for hydrate nucleation, and because of the large specific surface area of the nanoparticles, they could promote the hydrate nucleation and shorten the induction time of hydrate formation. In the stage of mass hydrate formation, a large number of gas molecules in the liquid phase could continuously participate in the hydrate formation due to the excellent mass transfer ability of GNs and MWCNTols. This could improve the rate of hydrate formation. Furthermore, the excellent heat transfer performance of GNs and MWCNTols enabled the heat generated by hydrate formation to be quickly conducted out of the reactor, which provided good environmental conditions for the rapid formation of hydrate.
By taking the induction time and gas consumption in hydrate formation as the indicator, we concluded that under the same experimental conditions (2.5 MPa, 277.15 K), the induction time of Run 2 was the shortest, and was 44.22% shorter than that of Run 1. However, Run 10 had the highest gas consumption, and was 10.44% higher than that of Run 1. Therefore, the selection of the optimal nanoparticle concentration required specific problem analysis. If a shorter induction time in hydrate formation was needed, then 0.02% MWCNTols was the best choice, and if higher gas consumption was required, 0.08% GN was the optimal choice.
3.3. Pressure and Temperature Conditions
The difference between the experimental initial conditions and the equilibrium conditions is the driving force of hydrate formation according to Englezos et al. [54]. Therefore, the initial pressure and experimental temperature are two important parameters that affect the hydrate formation. Figure 5 shows the pressure changes of the three additive systems in the reactor during the CO2 hydrate formation at different initial pressures when the initial temperature was 277.15 K. The hydrate formation process was exothermic. When the temperature in the reactor suddenly jumped, it could be considered that a large amount of hydrate began to form, and the pressure in the reactor decreased rapidly. As can be seen in Figure 5, the drop in pressure for the hydrate formation in the three additive systems to reach the equilibrium state was increased with the increase in the initial pressure. When the initial pressure was increased from 1.5 MPa to 3.5 MPa, the drop in pressure in 9.01 wt% TBAB, 9.01 wt% TBAB + 0.02 wt% GN, and 9.01 wt% TBAB + 0.02 wt% MWCNTol systems was 0.45–1.49 MPa, 0.48–1.56 MPa, and 0.56–1.68 MPa, respectively. It can be seen that the higher the initial pressure, the faster the pressure drop rate.
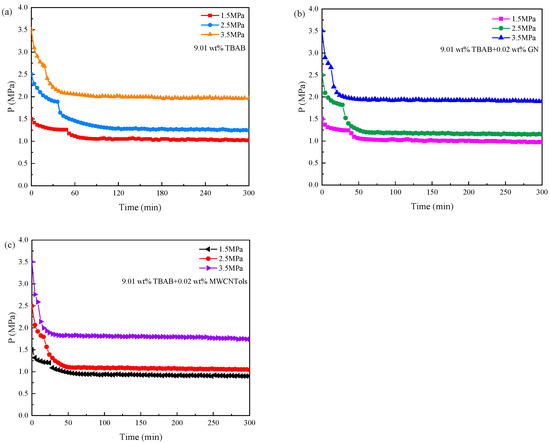
Figure 5.
Pressure changes during the CO2 hydrate formation in three additive systems at 277.15 K and different initial pressures: (a) 9.01 wt% TBAB; (b) 9.01 wt% TBAB + 0.02 wt% GN; (c) 9.01 wt% TBAB + 0.02 wt% MWCNTols.
The changes in induction time and final gas consumption in the three additive systems are shown in Figure 6a,b, and the experimental data are shown in Table 2. It can be seen that with the increase in initial pressure, the hydration driving force was increased, the induction time was shortened, and the final gas consumption was increased. As the initial pressure increased from 1.5 MPa to 3.5 MPa, the induction time of the TBAB single system was decreased by 65.20% and the final gas consumption was increased by 326.68%. The induction time of TBAB + MWCNTol and TBAB + GN systems was reduced by 69.08% and 67.70%, respectively, and the final gas consumption of their systems was increased by 284.11% and 317.45%, respectively. Different initial pressures would provide different driving forces. At higher initial pressures, the dissolution rate of CO2 increased significantly, thereby promoting the hydrate nucleation and shortening the induction time in hydrate formation. However, the higher the pressure, the more the hydrate formation. In the experiment conducted by Zhou et al. [16], when the pressure was 4.5 MPa, the temperature was 277.15 K and the stirring rate was 300 rpm. Although the induction time was significantly shortened, the gas consumption was not increased. This may be because a large number of hydrates had already been formed in the early stage, and the gas–liquid contact area would rapidly form the hydrate films, thereby obstructing the further mass transfer of the gas, resulting in an insignificant increase in gas consumption, which may be also caused by the stirring rate. At the same time, increasing the pressure to speed up the hydrate formation had a limit, because carbon dioxide may be liquefied with the increasing pressure, and the phase transition of gas would affect the process of hydrate formation in the system.
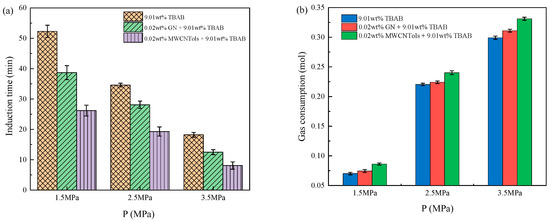
Figure 6.
Effect of initial pressure on (a) induction time and (b) gas consumption for the CO2 hydrate formation in three additive systems.
Table 2.
Induction time and gas consumption of CO2 hydrate formation in three additive systems at different initial pressures and experimental temperatures.
Figure 7 shows the pressure changes in the reactor of the three additive systems during the CO2 hydrate formation at different experimental temperatures when the initial pressure was 2.5 MPa. It can be seen that when the hydrate formation of the three additive systems reached the equilibrium state, the pressure drop increased with the decrease in the experimental temperature. The experimental temperature dropped from 278.15 K to 276.15 K, and the drop in pressure in the TBAB single system was 1.19 MPa, 1.27 MPa, and 1.36 MPa, respectively. The drop in pressure in TBAB + GN was 1.23 MPa, 1.31 MPa, and 1.42 MPa, respectively, and in the TBAB + MWCNTols system, the drop in pressure was 1.33 MPa, 1.41 MPa, and 1.52 MPa, respectively. In the same experimental temperature condition, the lower the experimental temperature, the faster the pressure drop rate.
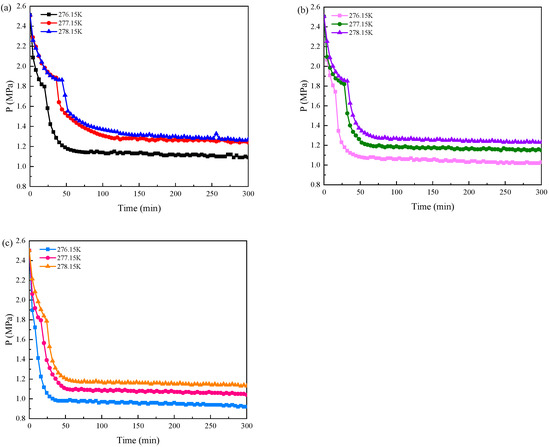
Figure 7.
Pressure changes during the CO2 hydrate formation in three additive systems at 2.5 MPa and different experimental temperatures. (a) 9.01 wt% TBAB; (b) 9.01 wt% TBAB + 0.02 wt% GN; (c) 9.01 wt% TBAB + 0.02 wt% MWCNTols.
The changes in induction time and final gas consumption in the three additive systems are shown in Figure 8a,b. The experimental data are shown in Table 2. It can be seen that the induction time of different additive systems was decreased and the final gas consumption was increased with the decreased experimental temperature. This was mainly because the lower the ambient temperature, the smaller the hydrate phase equilibrium pressure. When the initial pressure was constant, the lower the experimental temperature, the greater the driving force of hydrate formation, which is more conducive to the hydrate formation. With the experimental temperature dropping from 278.15 K to 276.15 K, the induction time of the TBAB single system was decreased by 49.25% and the final gas consumption was increased by 13.78%. The induction time of the TBAB + MWCNTol system was decreased by 58.44% and the final gas consumption was increased by 13.68%, and the induction time of the TBAB + GN system was reduced by 55.03% and the final gas consumption was increased by 14.81%. When the initial pressure and the additive concentration were the same, the lower the experimental temperature, the lower the hydrate formation pressure, and the more it could promote the hydrate formation. Meanwhile, the process of hydrate formation was a constant heat release, and the continuous accumulation of heat would cause the temperature to increase and then inhibit the hydrate formation process. A lower experimental temperature is more conducive to the timely removal of heat, thereby promoting hydrate formation [55]. At lower temperatures, the dissolved amount of CO2 would also increase, and the heat transfer was a key factor affecting the CO2 hydrate formation. The effect of experimental temperature on induction time was more obvious than that on the final gas consumption during hydrate formation. It also could be seen that by taking induction time and final gas consumption as evaluation criteria, the influence of initial pressure on the CO2 hydrate formation was greater than that of the experimental temperature. The induction time of 9.01 wt% TBAB + 0.02 wt% MWCNTols at 3.5 MPa and 277.15 K was the shortest compared to that of different pressures (1.5 and 2.5 MPa), i.e., 8.1 ± 1.2 min. The gas consumption was also the highest among them, i.e., 0.3311 ± 0.0026 mol. Similarly, reducing the experimental temperature could also improve the kinetics of CO2 hydrate formation at 2.5 MPa. The induction time of 9.01 wt% TBAB + 0.02 wt% MWCNTols at 2.5 MPa and 276.15 K was shorter than that at different temperatures (277.15 and 278.15 K), i.e., 0.2543 ± 0.0026 mol. Therefore, to better shorten the induction time and increase the gas consumption in hydrate formation in practical applications, we could reduce the experimental temperature or increase the pressure to achieve the target requirements.
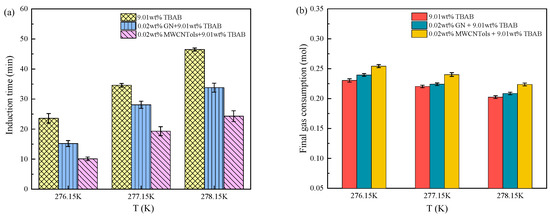
Figure 8.
Effect of experimental temperature on (a) induction time and (b) gas consumption for the CO2 hydrate formation in three additive systems.
4. Conclusions
In this work, the phase equilibrium of hydrate formation in the 9.01 wt% TBAB + MWCNTol system was determined. The results showed that relative to the CO2 hydrate formation conditions obtained from the pure TBAB solution, the addition of MWCNTols slightly decreased the phase equilibrium condition of CO2 hydrate formation. Furthermore, the concentrations of MWCNTols could not significantly affect the kinetics of hydrate formation conditions. In addition, the kinetics studies of hydrate formation in 9.01 wt% TBAB + MWCNTol systems were characterized by measuring induction time and final gas consumption. The results confirmed that the addition of nanoparticles (GNs and MWCNTols) significantly decreased the induction time of hydrate formation and, at a concentration of less than or equal to 0.06 wt%, MWCNTol was a more efficient nanoparticle in reducing the induction time of hydrate formation. For gas consumption, it was found that the final gas consumption was similar in 9.01 wt% TBAB mixed with different concentration MWCNTol and GN systems, but was higher than that of the 9.01 wt% pure TBAB solutions. Additionally, reducing the experimental temperature and increasing the initial pressure could also promote hydrate formation. As the initial pressure increased from 1.5 MPa to 3.5 MPa, the induction time in the TBAB + MWCNTols system decreased by 69.08% and the final gas consumption increased by 284.11%, which had the best effect on hydrate promotion. With the experimental temperature dropping from 278.15 K to 276.15 K, the induction time of the TBAB + MWCNTol system decreased by 58.44% and the final gas consumption increased by 13.68%.
Author Contributions
Conceptualization, S.-L.W.; Writing—Original draft preparation, Software, Y.-Y.X.; Supervision, S.-D.Z.; Methodology and Data curation, K.J.; Supervision, Writing—Reviewing and Editing, Y.-S.Y.; Formal analysis, Y.-C.R. All authors have read and agreed to the published version of the manuscript.
Funding
This research was funded by Open Project of Collaborative Innovation Center for Clean Energy Application Technology (Quanzhou Vocational and Technical University) (No. QJNY22-04), Postgraduate Research & Practice Innovation Program of Jiangsu Province (KYCX23_3143), the National Natural Science Foundation of China (22008237), the Key Research Program of Frontier Sciences, Chinese Academy of Sciences(CAS) (ZD BS-LY-SLH041), Youth Innovation Promotion Association CAS(2023366), which are gratefully acknowledged.
Data Availability Statement
The data that support the findings of this study are available from the corresponding author upon reasonable request.
Conflicts of Interest
The authors declare no conflict of interest.
References
- Kazemifar, F. A review of technologies for carbon capture, sequestration, and utilization: Cost, capacity, and technology readiness. Greenh. Gases Sci. Technol. 2023, 12, 200–230. [Google Scholar] [CrossRef]
- Lang, X.; Fan, S.; Wang, Y. Intensification of methane and hydrogen storage in clathrate hydrate and future prospect. J. Nat. Gas Chem. 2010, 19, 203–209. [Google Scholar] [CrossRef]
- Ge, B.-B.; Li, X.-Y.; Zhong, D.-L.; Lu, Y.-Y. Investigation of natural gas storage and transportation by gas hydrate formation in the presence of bio-surfactant sulfonated lignin. Energy 2022, 244, 122665. [Google Scholar] [CrossRef]
- Chi, Y.; Sarica, C.; Daraboina, N. Experimental investigation of two-phase gas-oil stratified flow wax deposition in pipeline. Fuel 2019, 247, 113–125. [Google Scholar] [CrossRef]
- Ayaz, M.; Namazi, M.A.; Din, M.A.; Ershath, M.I.M.; Mansour, A.; Aggoune, e.-H.M. Sustainable seawater desalination: Current status, environmental implications and future expectations. Desalination 2022, 540, 116022. [Google Scholar] [CrossRef]
- Zhou, S.; Yan, H.; Su, D.; Navaneethakannan, S.; Chi, Y. Investigation on the kinetics of carbon dioxide hydrate formation using flow loop testing. J. Nat. Gas Ence Eng. 2017, 49, 385–392. [Google Scholar] [CrossRef]
- Kang, K.C.; Linga, P.; Park, K.N.; Choi, S.J.; Ju, D.L. Seawater desalination by gas hydrate process and removal characteristics of dissolved ions (Na+, K+, Mg2+, Ca2+, B3+, Cl−, SO42−). Desalination 2014, 353, 84–90. [Google Scholar] [CrossRef]
- Choi, S.; Park, J.; Park, J.H.; Kim, S.-C.; Won, S.O.; Kang, Y.T. Study on CO2 hydrate formation characteristics with promoters for CO2 capture and cold thermal energy transportation. J. Clean. Prod. 2021, 295, 126392. [Google Scholar] [CrossRef]
- Chi, Y.D.; Daraboina, N.; Sarica, C. Investigation of inhibitors efficacy in wax deposition mitigation using a laboratory scale flow loop. Aiche J. 2016, 62, 4131–4139. [Google Scholar] [CrossRef]
- Chi, Y.D.; Daraboina, N.; Sarica, C. Effect of the Flow Field on the Wax Deposition and Performance of Wax Inhibitors: Cold Finger and Flow Loop Testing. Energy Fuels 2017, 31, 4915–4924. [Google Scholar] [CrossRef]
- Herzog, H.; Dan, G. Carbon Capture and Storage from Fossil Fuel Use. Encycl. Energy 2004, 51, 277–287. [Google Scholar]
- Dubey, A.; Chi, Y.; Daraboina, N. Investigating the Performance of Paraffin Inhibitors under Different Operating Conditions. In Proceedings of the Spe Technical Conference & Exhibition, San Antonio, TX, USA, 9–11 October 2017. [Google Scholar]
- Koh, D.-Y.; Kang, H.; Kim, D.-O.; Park, J.; Cha, M.; Lee, H. Recovery of Methane from Gas Hydrates Intercalated within Natural Sediments Using CO2 and a CO2/N2 Gas Mixture. Chemsuschem 2012, 5, 1443–1448. [Google Scholar] [CrossRef]
- Lee, H.; Lee, J.W.; Kim, D.Y.; Park, J.; Seo, Y.T.; Zeng, H.; Moudrakovski, I.L.; Ratcliffe, C.I.; Ripmeester, J.A. Tuning clathrate hydrates for hydrogen storage. Nature 2005, 434, 743–746. [Google Scholar] [CrossRef]
- Nogami, T.; Oya, N.; Ishida, H.; Matsumoto, H. Development of natural gas ocean transportation chain by means of natural gas hydrate (NGH). Drug Metab. Pharmacokinet. 2008, 9, 184–187. [Google Scholar]
- Zhou, S.; Jiang, K.; Zhao, Y.; Chi, Y.; Wang, S.; Zhang, G. Experimental Investigation of CO2 Hydrate Formation in the Water Containing Graphite Nanoparticles and Tetra-n-butyl Ammonium Bromide. J. Chem. Eng. Data ACS J. Data 2018, 2, 63. [Google Scholar] [CrossRef]
- Qin, Y.; Bao, R.; Zhou, L.; Yang, X.; Liu, C.; Wan, W.; Chen, Y.; Guo, Y. Enhanced formation kinetics of hydrates using 1,3-dioxolane, l-leucine, and β-cyclodextrin. Fuel 2023, 332, 126165. [Google Scholar] [CrossRef]
- Du, S.; Han, X.; Cai, W.; Zhu, J.; Ma, X.; Han, S.; Chen, D.; Zhao, Y.; Li, H.; Lu, H.; et al. Formation of the structure-II gas hydrate from low-concentration propane mixed with methane. Chin. J. Chem. Eng. 2023, 58, 306–314. [Google Scholar] [CrossRef]
- Shirota, H.; Aya, I.; Namie, S. Measurement of methane hydrate dissociation for application to natural gas storage and transportation. In Proceedings of the Fourth International Conference on Gas Hydrates, Yokohama, Japan, 19–23 May 2002. [Google Scholar]
- Sun, X.; Liu, D. Advances in carbon dioxide hydrate kinetic additives. Chem. Ind. Eng. Prog. 2018, 37, 517–524. [Google Scholar]
- Liu, X.; Ren, J.; Chen, D.; Yin, Z. Comparison of SDS and L-Methionine in promoting CO2 hydrate kinetics: Implication for hydrate-based CO2 storage. Chem. Eng. J. 2022, 438, 135504. [Google Scholar] [CrossRef]
- Meshram, S.B.; Sardar, H.; Kushwaha, O.S.; Sangwai, J.; Kumar, R. A systematic molecular investigation on Sodium Dodecyl Benzene Sulphonate (SDBS) as a Low Dosage Hydrate Inhibitor (LDHI) and the role of Benzene Ring in the structure. J. Mol. Liq. 2021, 337, 116374. [Google Scholar] [CrossRef]
- Sun, D.; Englezos, P. Storage of CO2 in a partially water saturated porous medium at gas hydrate formation conditions. Int. J. Greenh. Gas Control. 2014, 25, 1–8. [Google Scholar] [CrossRef]
- Kalogerakis, N.; Jamaluddin, A.; Dholabhai, P.D.; Bishnoi, P.R. Effect of Surfactants on Hydrate Formation Kinetics. In Proceedings of the SPE International Conference on Oilfield Chemistry, New Orleans, LA, USA, 2–5 March 1993. [Google Scholar]
- Okutani, K.; Kuwabara, Y.; Mori, Y.H. Surfactant effects on hydrate formation in an unstirred gas/liquid system: An experimental study using methane and sodium alkyl sulfates. Chem. Eng. Sci. 2008, 63, 183–194. [Google Scholar] [CrossRef]
- Liu, N.; Lai, X.; Bai, F. CO2 Separation From Gas Mixtures by Clathrate Crystallization. Proc. Csee 2017, 37, 2312–2318. [Google Scholar]
- Hawkins, R.E.; Davidson, D.W. Dielectric relaxation in the clathrate hydrates of some cyclic ethers. Phys. Chem 1966, 70, 1889–1894. [Google Scholar] [CrossRef]
- Lee, Y.-J.; Kawamura, T.; Yamamoto, Y.; Yoon, J.-H. Phase Equilibrium Studies of Tetrahydrofuran (THF) + CH4, THF + CO2, CH4 + CO2, and THF + CO2 + CH4 Hydrates. J. Chem. Eng. Data 2012, 57, 3543–3548. [Google Scholar] [CrossRef]
- Yang, M.; Jing, W.; Wang, P.; Jiang, L.; Song, Y. Effects of an additive mixture (THF+TBAB) on CO2 hydrate phase equilibrium. Fluid Phase Equilibria 2015, 401, 27–33. [Google Scholar] [CrossRef]
- Seo, Y.T.; Moudrakovski, I.L.; Ripmeester, J.A.; Lee, J.W.; Lee, H. Efficient recovery of CO2 from flue gas by clathrate hydrate formation in porous silica gels. Environ. Sci. Technol. 2005, 39, 2315–2319. [Google Scholar] [CrossRef]
- Zhang, X.; Li, J.; Wu, Q.; Wang, C.; Nan, J. Experimental Study on the Formation Process of Carbon Dioxide Hydrate in Porous Media. J. Basic Ence Eng. 2016. [Google Scholar]
- Wang, J.; Wang, R.; Yoon, R.H.; Seol, Y. Use of Hydrophobic Particles as Kinetic Promoters for Gas Hydrate Formation. J. Chem. Eng. Data 2015, 60, 383–388. [Google Scholar] [CrossRef]
- Shi, B.H.; Fan, S.S.; Lou, X. Application of the shrinking-core model to the kinetics of repeated formation of methane hydrates in a system of mixed dry-water and porous hydrogel particulates. Chem. Eng. Sci. 2014, 109, 315–325. [Google Scholar] [CrossRef]
- Xuan, Y.M. An overview on nanofluids and applications. Sci. Sin. Technol. 2014, 44, 269–279. [Google Scholar] [CrossRef]
- Park, S.S.; Lee, S.B.; Kim, N.J. Effect of multi-walled carbon nanotubes on methane hydrate formation. J. Ind. Eng. Chem. 2010, 16, 551–555. [Google Scholar] [CrossRef]
- Renault-Crispo, J.S.; Coulombe, S.; Servio, P. Kinetics of carbon dioxide gas hydrates with tetrabutylammonium bromide and functionalized multi-walled carbon nanotubes. Energy 2017, 128, 414–420. [Google Scholar] [CrossRef]
- Aliabadi, M.; Rasoolzadeh, A.; Esmaeilzadeh, F.; Alamdari, A.M. Experimental study of using CuO nanoparticles as a methane hydrate promoter. J. Nat. Gas Sci. Eng. 2015, 27, 1518–1522. [Google Scholar] [CrossRef]
- Nesterov, A.N.; Reshetnikov, A.M.; Manakov, A.Y.; Rodionova, T.V.; Paukshtis, E.A.; Asanov, I.P.; Bardakhanov, S.P.; Bulavchenko, A.I. Promotion and inhibition of gas hydrate formation by oxide powders. J. Mol. Liq. 2015, 204, 118–125. [Google Scholar] [CrossRef]
- Mohammadi, A.; Manteghian, M.; Haghtalab, A.; Mohammadi, A.H.; Rahmati-Abkenar, M. Kinetic study of carbon dioxide hydrate formation in presence of silver nanoparticles and SDS. Chem. Eng. J. 2014, 237, 387–395. [Google Scholar] [CrossRef]
- Lee, J.D.; Kim, H.C.; Kim, Y.S.; Kim, Y.D.; Lee, M.S. Synthesis of Nanosized TiO2-Ag-SiO2 Sols by Modified Sol-Gel Method and their Application for Methane Hydrate Formation. Solid State Phenom. 2007, 124–126, 1059–1062. [Google Scholar] [CrossRef]
- Said, S.; Govindaraj, V.; Herri, J.M.; Ouabbas, Y.; Khodja, M.; Belloum, M.; Sangwai, J.S.; Nagarajan, R. A study on the influence of nanofluids on gas hydrate formation kinetics and their potential: Application to the CO2 capture process. J. Nat. Gas Sci. Eng. 2016, 32, 95–108. [Google Scholar] [CrossRef]
- Yu, Y.; Zhou, S.; Li, X.; Wang, S. Effect of graphite nanoparticles on CO2 hydrate phase equilibrium. Fluid Phase Equilibria 2016, 414, 23–28. [Google Scholar] [CrossRef]
- Zhou, S.D.; Yu, Y.S.; Zhao, M.M.; Wang, S.L.; Zhang, G.Z. Effect of Graphite Nanoparticles on Promoting CO2 Hydrate Formation. Energy Fuels 2014, 28, 4694–4698. [Google Scholar] [CrossRef]
- Mohammadi, A.H.; Eslamimanesh, A.; Richon, D. Semi-clathrate hydrate phase equilibrium measurements for the CO2+H2/CH4+tetra-n-butylammonium bromide aqueous solution system. Chem. Eng. Sci. 2013, 94, 284–290. [Google Scholar] [CrossRef]
- Holloway, S.; Darling, G. The structure of water on the (0001) surface of graphite. Surf. Sci. 2003, 532, 166–172. [Google Scholar]
- Agrawal, K.V.; Shimizu, S.; Drahushuk, L.W.; Kilcoyne, D.; Strano, M.S. Observation of extreme phase transition temperatures of water confined inside isolated carbon nanotubes. Nat. Nanotechnol. 2016, 12, 267–273. [Google Scholar] [CrossRef]
- Shu-Mei, S.; Ye, Z.; Dong-Liang, L.I.; De-Qing, L.; Xiao-Ping, W.U. Promotion effect of multi-walled carbon nanotubes on CH4-CO2-TBAB hydrates formation. Nat. Gas Chem. Ind. 2019. [Google Scholar]
- Kashchiev, D.; Firoozabadi, A. Induction time in crystallization of gas hydrates. J. Cryst. Growth 2003, 250, 499–515. [Google Scholar] [CrossRef]
- Tao, J.; Rui-Xiang, W. Model for predicting thermal conductivity of CNT water-based nanofluids. J. Therm. Sci. Technol. 2014, 1, 381–390. [Google Scholar]
- Smith, J.M. Introduction to chemical engineering thermodynamics. J. Chem. Educ. 1950, 27, 584. [Google Scholar] [CrossRef]
- Peng, D.Y.; Robinson, D.B. New Two-Constant Equation of State. Ind. Eng. Chem. Fundam. 1976, 15, 3069–3078. [Google Scholar] [CrossRef]
- Song, Y.; Wang, F.; Liu, G.; Luo, S.; Guo, R. Promotion Effect of Carbon Nanotubes-Doped SDS on Methane Hydrate Formation. Energy Fuels 2017, 31, 1850–1857. [Google Scholar] [CrossRef]
- Xia, Z.; Li, Z.; Chen, Z.; Li, X.; Zhang, Y.; Yan, K.; Lv, Q. CO2/H2/H2O Hydrate Formation with TBAB and Nanoporous Materials. Energy Procedia 2019, 158, 5866–5871. [Google Scholar] [CrossRef]
- Englezos, P.; Kalogerakis, N.; Dholabhai, P.D.; Bishnoi, P.R. Kinetics of formation of methane and ethane gas hydrates. Chem. Eng. Sci. 1987, 42, 2647–2658. [Google Scholar] [CrossRef]
- Li, X.G. Studies on the Formation Affecting Factor and Stability of Natural Gas Hydrates; China University of Petroleum (East China): Qingdao, China, 2008. [Google Scholar]
Disclaimer/Publisher’s Note: The statements, opinions and data contained in all publications are solely those of the individual author(s) and contributor(s) and not of MDPI and/or the editor(s). MDPI and/or the editor(s) disclaim responsibility for any injury to people or property resulting from any ideas, methods, instructions or products referred to in the content. |
© 2023 by the authors. Licensee MDPI, Basel, Switzerland. This article is an open access article distributed under the terms and conditions of the Creative Commons Attribution (CC BY) license (https://creativecommons.org/licenses/by/4.0/).