Abstract
This research paper presents a comprehensive study on the optimal planning and design of hybrid renewable energy systems for microgrid (MG) applications at Oakland University. The HOMER Pro platform analyzes the technical, economic, and environmental aspects of integrating renewable energy technologies. The research also focuses on the importance of addressing unmet load in the MG system design to ensure the university’s electricity demand is always met. By optimizing the integration of various renewable energy technologies, such as solar photovoltaic (PV), energy storage system (ESS), combined heat and power (CHP), and wind turbine energy (WT), the study aims to fulfill the energy requirements while reducing reliance on traditional grid sources and achieving significant reductions in greenhouse gas emissions. The proposed MG configurations are designed to be scalable and flexible, accommodating future expansions, load demands changes, and technological advancements without costly modifications or disruptions. By conducting a comprehensive analysis of technical, economic, and environmental factors and addressing unmet load, this research contributes to advancing renewable energy integration within MG systems. It offers a complete guide for Oakland University and other institutions to effectively plan, design, and implement hybrid renewable energy solutions, fostering a greener and more resilient campus environment. The findings demonstrate the potential for cost-effective and sustainable energy solutions, providing valuable guidance for Oakland University’s search for energy resilience and environmental surveillance, which has a total peak load of 9.958 MW. The HOMER simulation results indicate that utilizing all renewable resources, the estimated net present cost (NPC) is a minimum of USD 30 M, with a levelized energy cost (LCOE) of 0.00274 USD/kWh. In addition, the minimum desired load will be unmetered on some days in September.
1. Introduction
With the rapid growth of globalization, the demand for power has significantly increased. Consequently, there is a growing dependence on various power sources, leading to environmental impacts, such as carbon dioxide (CO2) emissions reduction and associated costs, emphasizing the sustainable nature of the microgrid (MG) [1]. This has prompted many countries to prioritize investment in alternative energy sources. Renewable energy solutions, such as solar and wind power, have gained significant attention as fossil fuel reserves diminish and their consumption continues contributing to environmental pollution. The attractiveness of renewable energy lies in its potential to provide sustainable and clean power generation while mitigating the harmful effects of traditional energy sources. The load frequency control associated with renewable energy integration was addressed, and employed stochastic and robust control to handle the uncertainties associated with renewable energy generation and demand [2,3]. M. F. Ishraque et al. [4] enhance and explore the techno-economic and power system aspects of such microgrids, offering optimization models, algorithms, and comparative evaluations of dispatch strategies. The authors suggest that the load following dispatch strategy is the option for the microgrids, as it achieves a stable power system response while minimizing the NPC, LOCE, operating cost, and CO2 emission rate.
The optimization techniques are utilized for obtaining the optimal hybrid renewable energy generation resources, storage capacity, and power conversion systems [5,6,7]. It focuses on optimizing the operation of CHP systems to achieve improved energy efficiency and cost-effectiveness. However, the optimal scheduling of electricity and heat production from the CHP system is based on real-time energy demand and system conditions [8]. Conducting a comprehensive techno-economic analysis of lithium-ion and lead-acid batteries in MG systems provided valuable performance, cost, sustainability, and operational considerations for each battery technology [9,10]. A developed approach based on the equilibrium optimizer (EO) for the optimal design of a hybrid PV/WT/diesel generator/battery microgrid in Morocco [11].
The stochastic nature of renewable energy resources was addressed, particularly PV and wind, by incorporating their variability and uncertainty [12]. It considers the fluctuating availability of solar radiation and wind speed, which affect the power generation potential of the hybrid system. Y. Sahri et al. [13] present a cost-optimal alternative for district power supply through an integrated system that combines various energy generation technologies, storage systems, and intelligent grid management strategies. By optimizing the system’s configuration and operation, it examines recent developments in control algorithms, communication technologies, and smart grid infrastructure that enhance the performance and flexibility of microgrids [14]. They guide decision-making processes for the optimal selection and integration of battery systems in MG applications, contributing to the advancement and optimization of MG technologies [15,16,17,18]. At the same time, it was proposed to meet the demand for energy while reducing environmental impact [19].
HOMER (Hybrid Optimization Model for Electric Renewables) assists the researchers and contributes to identifying the optimal configuration of generation resources and storage systems, maximizing renewable energy utilization, and minimizing costs and environmental impacts [20]. İ. Çetinbaş, B. Tamyürek, and M. Dermitas [21] utilize HOMER software to design and optimize a hybrid microgrid system at Eskişehir Osmangazi University, considering techno-economic analysis and the practical application of the microgrid system, as well as the optimization of microgrid operation at the University of Abdelmalek Essaâdi, addressed by [22]. It utilizes optimization algorithms and techniques to determine the optimal dispatch and scheduling of the distributed generation resources within the microgrid. Optimization considers load demand, renewable energy availability, energy storage capacity, and cost minimization. The potential of standalone microgrids with hybrid renewable energy sources in remote areas was studied by [23]. Through various case studies and optimization analyses using the HOMER software, the study determines the optimal capacity, energy dispatching, and techno-economic benefits of microgrids in Tamilnadu, India. The studies featured in Table 1 demonstrate the diverse approaches employed by researchers to address the MG component sizing and requirements of microgrid design. Recently, MGs have gained significant attention as a sustainable and resilient solution for meeting the energy necessities of communities, institutions, and remote areas [15,19,24,25].
T. Cai et al. [26] discuss bidding strategies as non-conventional sources of flexibility in electricity markets, where bids consist of price and quantity quotations. It investigates the implementation of renewable energy systems in smart grids, which results in distributed load resources. In addition, it introduces the Distributed Adjustable Load Resources and Settlement (DALRS) model for improving spot market tendering systems. A strategic market proposal evaluation and resource bid allocation method are introduced to maximize benefits, allowing adjustable price bids and improved market access for structural providers Integration with DALRS improves schemes and creates a comprehensive strategy for renewable energy systems in the electricity market. Electric vehicles (EVs) are experiencing a surge in popularity as a result of their environmentally sustainable characteristics, operation, and extended mileage [24]. Charging multiple EVs from the grid during peak hours can lead to high costs, prompting the preference for EV charging stations integrated with hybrid renewable energy resources (HREs) to produce electricity. Standalone EV charging stations, which operate independently without grid connection, necessitate efficient energy storage systems (ESSs) for reliable operation and review different ESS configurations for multi-energy standalone EV charging stations, including single, multi, and storage systems. The integration of HREs in EV charging stations needs to address the high costs of grid charging during peak hours. Standalone EV charging stations, without grid connection, necessitate efficient energy storage systems (ESSs) for reliable operation.
This research aims to develop an optimized hybrid renewable energy system for the Oakland University (OU) campus, incorporating solar PV, WT, CHP, and battery storage. The existing CHP substation, with a capacity of 4.5 MW, is integrated into the proposed microgrid MG systems. Additionally, Michigan’s abundant wind and solar energy resources are utilized. The MG design is optimized using HOMER Pro software to achieve this objective. Sensitivity analysis evaluates the impact of parameters such as load demand variations, renewable energy availability, and cost fluctuations. Designing an MG, whether integrated or islanded, for the OU campus requires careful consideration of renewable resource availability, load demand profiles, system reliability, and cost-effectiveness. The selection of energy sources and storage systems should align with the university’s energy requirements, renewable resource potential, and sustainability goals. Notably, the existing CHP station at OU covers less than 50% of the peak load (10 MW), indicating that a significant portion of the electrical demand still needs to be met. This is attributed to CHP capacity limitations and load demand variations. The monthly electric generation from the CHP station also varies based on operational hours, efficiency, and maintenance schedules, but for simulation purposes, the output power remains constant. Reliance on the grid occurs when the load exceeds the peak value, indicating a desire to minimize costs associated with grid electricity purchases and reduce dependency on external energy sources. However, this necessitates sufficient capacity from other sources to meet most load demands. The hybrid MG for the OU campus is designed by integrating solar PV, WTs, CHP, and energy storage, with different configuration systems considered. A cost-effective NPC, LCOE, and unmet load evaluation are conducted. Determining the optimal size for each configuration within the MG involves considering the capacity of the available CHP and the potential contribution of each generating resource. The facility management department provided the load demand profile for the OU campus in 2019. The system’s reliability and resilience are improved. By comparing the operational performance of the proposed MG system configurations, including grid connection and islanded MG, the analysis considers the mitigation of unmet electrical load to determine the configuration that minimizes the NPC. Through comprehensive analysis and optimization using the HOMER Pro platform, the study optimizes the integration of various renewable energy technologies to achieve a stable power system response while minimizing the NPC and LCOE. The suggested microgrid configurations have been developed with scalability and flexibility in mind, allowing for future expansions, changes in load demands, and technological developments without the need for expensive upgrades or disruptions. The research offers help for institutions such as Oakland University in efficiently strategizing, conceptualizing, and executing hybrid renewable energy solutions. This support contributes to the seamless incorporation of renewable energy sources into microgrid systems, thereby promoting environmental sustainability and enhancing the resilience of the university campus. Furthermore, the research focuses on addressing the critical issue of unmet load in MG system design. Ensuring that the university’s electricity demand is consistently met is the research. It restates the research objectives and discusses how they have been achieved through the study.

Table 1.
Survey of previous works.
Table 1.
Survey of previous works.
| Reference | Microgrid | Resources | Solver/Methodology | Contribution |
|---|---|---|---|---|
| [27] | On-grid | WT, PV, hydrogen storage, diesel generator, battery storage, tidal current farm | HOMER/noncooperative game-based planning | Effectiveness of the MG interconnection and the annual net cost |
| [28] | WT/diesel generator/PV/battery storage | Arithmetic optimization algorithm, Harris hawks optimizer, hybrid algorithm, Friedman ranking test, microgrid, off-grid, optimal capacity planning, sizing optimization, Wilcoxon signed-rank test | Sensitivity analysis | |
| [29] | WT, PV, micro-turbines, diesel/biogas generators, fuel cells, battery storage | HOMER | Economic feasibility, different load profiles, performances of the batteries | |
| [30] | Different configurations (WT, PV, battery storage, biomass, microhydro) | HOMER | Sensitivity analysis | |
| [31] | PV, microturbine | MATLAB | Economical costs | |
| [32] | PV, WT | HOMER | Technical and economic performance | |
| [33] | PV, battery storage, biomass, diesel generator | Mixed integer linear programming | Generation expansion planning, economic analysis for ascertaining viability | |
| [14] | Off-grid (islanded) | WT/diesel generator/PV/battery storage | HOMER/MATLAB Simulink | Utilize different load dispatch strategies (combined dispatch, load following, generator order, HOMER Predictive Dispatch strategy, and cycle charging) |
| [34] | WT, PV, hydroelectric turbine, fuel cells, hydrogen electrolysis | HOMER | Combined both distributed and centralized generation and solar thermal system | |
| [29] | WT, PV, micro-turbines, diesel/biogas generators, fuel cells, battery storage | HOMER | Economic feasibility, different load profiles, performances of the batteries | |
| [7] | PV, battery | Complex optimization techniques | Resilience, climatic conditions | |
| [35] | PV, WT, diesel generator | Multi-objective design, multi-objective evolutionary algorithm (MOEA), and a genetic algorithm (GA) | Costs and unmet load | |
| [36] | PV, WT, battery storage, microhydro system, biomass gasifier | Discrete harmony search (DHS) algorithm | Unmet load |
2. Material and Methods
2.1. Microgrid Design
2.1.1. CHP
CHP systems simultaneously generate electricity and useful heat, maximizing energy efficiency. Mathematical equations are vital in modeling and optimizing the performance of CHP systems. J. Cao et al. [37] illustrated the mathematical equations of CHP systems. The energy balance equations represent the conservation of energy within the CHP system. These equations ensure that the input energy equals the output energy, accounting for losses and efficiencies. The energy balance equations can be expressed as follows:
Electricity and heat generation equations are given as
where is the electricity generated, is the heat generated, is the electrical efficiency, is the heat efficiency, is the fuel input rate, and is the higher heating value of the fuel.
The efficiency equations calculate the efficiency of individual components within the CHP system. These equations relate the input energy to the useful output energy for each component. The load equations represent the energy demands of the electricity and heat loads supplied by the CHP system. These equations provide a framework for modeling and optimizing CHP systems to meet specific energy demands and operational requirements. The authors of [38] introduce and explain the concept of meta-heuristic algorithms in the context of CHP system optimization. Z li et al. [39] introduces a heat-power station (HPS) system, which harnesses renewable energy sources to utilize surplus energy and fulfill heating requirements effectively. The HPS system offers a sustainable solution by generating heat using surplus renewable energy. The CHP incorporates the system on the OU campus, which simultaneously generates electricity and useful heat. The CHP uses natural gas to drive a turbine, producing electricity and thermal energy. The generated electricity meets MG’s electrical demand, while the waste heat from the generation process is captured and utilized for various heating and cooling applications.
2.1.2. Solar PV, Energy Storage Battery, and Inverter
A solar PV system involves determining components’ optimal configuration and sizing to meet the desired energy output, performance assessment, and techno-economic analysis [40]. Solar irradiance is a crucial parameter for sizing and estimating the energy output of a solar PV system [41,42]. The solar irradiance calculation equation can be expressed as follows:
where is the solar irradiance at the PV panel location, is the extraterrestrial solar irradiance, is the atmospheric loss coefficient, is the solar zenith angle, is the temperature coefficient, and is the panel temperature.
The calculation of the PV panel output power can be expressed as follows:
where is the electrical power output of the PV panel, is the panel area, is the solar irradiance, is the panel efficiency, and is the performance ratio (accounts for losses due to shading, dirt, and other factors). Hence, the output of a PV panel is determined by its electrical characteristics and the incident solar irradiance.
The energy generation of a solar PV system over a given period is determined by the total power output and the duration of that period [35]. The energy generation calculation equation can be expressed as follows:
where is the energy generated by the PV system, and is the period. System sizing involves determining the number of PV panels and their configuration to meet the desired energy demand. The system sizing calculation equation can be expressed as follows:
where is the number of PV panels required, is the desired energy demand, is the power output of a single PV panel.
As well as the total power generated by a PV array can be calculated from
If energy storage is incorporated into the solar PV system, the battery sizing calculation equation can be expressed as follows [33]:
where is the battery capacity required, is the depth of discharge, is the battery voltage, and is the battery efficiency.
Afterward, the inverter converts the DC power generated by the PV panels into AC power for use in the electrical system. The inverter sizing calculation equation can be expressed as follows:
where is the inverter power rating required, is the total power output of the PV system, and is the inverter efficiency.
These equations enable the optimization of system configuration, component sizing, and energy generation, ensuring the system meets the desired energy demand and operational requirements. However, the rapid growth in solar PV installations is a challenge, and it needs to manage voltage rise effectively [29].
2.1.3. Wind Turbine (WT)
A WT involves determining the optimal turbine size, rotor diameter, and generator capacity to efficiently harness the available wind energy. The wind speed and air density determine the power available in the wind [43]. The wind power calculation equation can be expressed as follows:
where is the power available in the wind, is the air density, is the effective swept area of the rotor, and is the wind speed. The Betz limit represents the maximum power that can be extracted from the wind. It is based on the conservation of mass and momentum. The Betz limit calculation equation can be expressed as follows:
where is the maximum power that can be extracted.
The turbine power coefficient represents the efficiency of the WT in extracting power from the wind [36]. The turbine power coefficient calculation equation can be expressed as follows:
where is the turbine power coefficient, is the power available in the wind, and is the maximum power that can be extracted.
The tip speed ratio is the ratio of the tangential speed of the rotor blade tip to the wind speed [43]. It determines the optimal rotational speed of the rotor for maximum power extraction [44]. The tip speed ratio calculation equation can be expressed as follows:
where is the tip speed ratio, is the rotational speed of the rotor, and is the radius of the rotor.
The desired power output and the turbine power coefficient determine the wind turbine capacity. The generator capacity calculation equation can be expressed as follows:
where gen is the wind turbine capacity.
Turbine sizing involves determining the appropriate rotor diameter and hub height based on the desired power output and wind characteristics. In this paper, the hub height is taken as 30 m.
2.1.4. Cost Parameters
- Net Present Cost (NPC)
The NPC is calculated as follows:
where represents discount rate, and represent capital cost, replacement cost, fuel cost, and sellback cost, respectively [34,44].
The is calculated as:
where represents number of years and represents
where and represent, respectively,
The annual cost (is calculated as:
where is obtained from Equation (19):
Configure the system in HOMER Pro by inputting each MG component’s technical and economic details. Specify the size and capacity, efficiency, cost, and other relevant parameters for the renewable energy sources, energy storage, and other components included in the system design. Then, optimization analysis is employed in HOMER software to determine the optimal system configuration and operation strategy that minimizes the NPC based on the defined system parameters. The present value of NPC is the current value of a future cost or benefit, considering the discount rate and system lifetime. HOMER will provide the NPC value directly as part of the optimization analysis results.
- B.
- Levelized Cost Of Energy (LCOE)
The LCOE equation calculates the average cost of generating electricity (KWh) over the system’s lifetime, considering the initial investment, fuel costs, operational and maintenance expenses, and discounting future costs to their present value [4].
The mathematical equation for calculating the LCOE is as follows:
where is the total capital investment cost, including the initial investment in equipment and infrastructure, is the total fuel cost incurred over the system’s lifetime (), is the total operational and maintenance cost over the system’s lifetime, and is the total energy generated by the system over its lifetime. ( is the discount rate, representing the time value of money and the opportunity cost of capital.
Finally, the equation assumes a constant energy generation throughout the system’s lifetime.
3. Results and Discussion
3.1. Microgrid Setting Up
Step 1: The relevant data for the MG design simulation are inserted. This includes monthly average data for solar global horizontal irradiance (GHI) resource for Michigan State, and the daily radiation and clearness index is shown in Figure 1, and the wind speed is shown in Figure 2. Additionally, the OU data for the annual AC primary load served (in kW) are depicted in Figure 3, and the total electrical load served daily profile is illustrated in Figure 4.
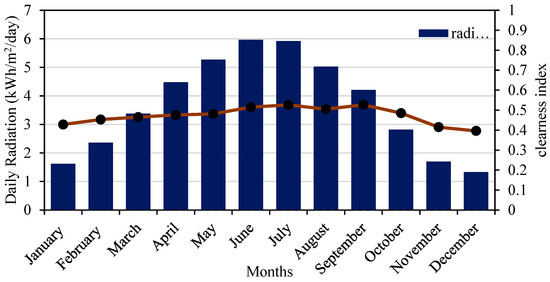
Figure 1.
Monthly average solar GHI data for Michigan State.
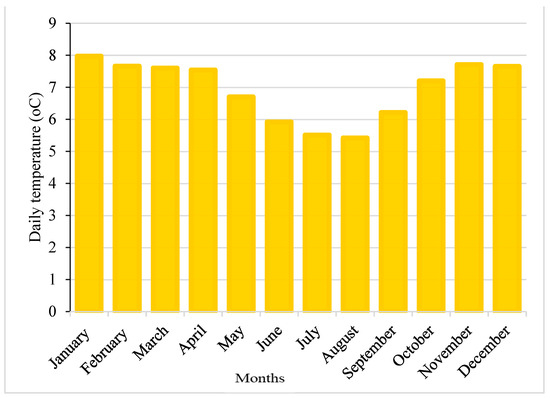
Figure 2.
Monthly average wind speed data (NASA Prediction of Worldwide Energy Resource).
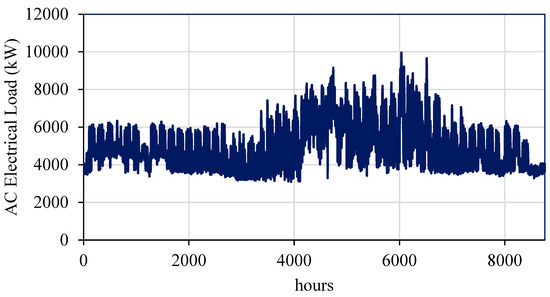
Figure 3.
Load profile for OU “from facility management department”.
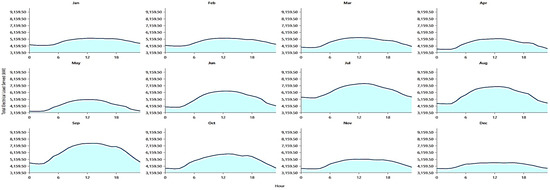
Figure 4.
Selected electrical load served daily profile (HOMER Pro software).
The x-axis in Figure 1 represents the time (months), while the y-axis represents the GHI values in kWh/m2/day. The daily radiation values indicate the amount of solar energy that reaches the Earth’s surface daily. Additionally, it includes the clearness index, which is the ratio of the measured GHI to the extraterrestrial solar radiation that would be received under clear-sky conditions. The clearness index indicates how much atmospheric attenuation or cloud cover affects the solar radiation reaching the surface. In Michigan State, it can be observed that the maximum radiation occurs in June, indicating that this month receives the highest amount of solar energy throughout the year. This is likely due to longer daylight hours and clearer skies. Other months may show lower radiation values due to cloud cover, shorter daylight hours, or seasonal variations in solar angles. This information is crucial for designing and optimizing solar energy systems and evaluating their economic viability in the region.
Based on the NASA Prediction of Worldwide Energy Resources (POWER) database within HOMER Pro, as shown in Figure 2, the average wind speed for Michigan State can be analyzed. The dataset provides valuable information on long-term historical wind speed patterns, allowing for accurate assessments of wind energy resources.
In Michigan State, the average wind speed is typically measured at a specific height, known as the anemometer height (10 m has been selected in this paper). The chosen height is essential, as wind speed increases with height due to reduced surface friction and fewer obstructions.
Regarding the wind speed pattern, it is noted that the minimum wind speed will occur in June. This means that June typically experiences the lowest wind speeds throughout the year. This information enables optimizing wind energy systems, such as WT placement, sizing, and overall project feasibility. Understanding the average wind speed and its annual variations is crucial for making informed decisions regarding wind energy projects and maximizing their performance and economic viability.
Step 2: Insert the project details into the HOMER Pro platform, such as location, system parameters, and simulation settings.
Step 3: The MG components are configured and selected, and the available areas for PV and wind turbines within the Oakland University campus are shown in Figure 5.
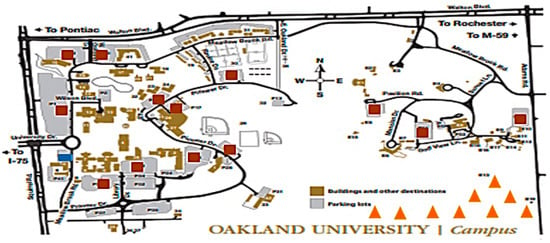
Figure 5.
Available areas for PV and wind turbines within the university campus (CHP  , PV
, PV  , and WT
  ).
).
 , PV
, PV  , and WT
  ).
).
In this paper, six configuration systems were proposed. This includes specifying each renewable energy source (CHP, solar PV, WTs, ESS) and other necessary components. The technical and economic details, such as capacity, efficiency, cost, and lifetime (n) for each component (in this project for solar PV , WT = 2,260,000 h while ESS is 60,000 h. The component specifications are tabulated in Table 2.

Table 2.
Microgrid components configuration.
Step 4: A certain percentage of renewable energy penetration is adjusted, optimizing the system’s economic performance.
Step 5: The simulation results provided by HOMER are reviewed and analyzed, such as energy generation, economic feasibility, unmet load, and system reliability.
Step 6: Various MG configuration systems are proposed to improve performance, reliability, and cost-effectiveness. Then, rerun the modified systems and evaluate their performance.
3.2. System Configurations Simulation Results
- System 1: Grid and CHP
The proposed system combines a grid and CHP, as shown in Figure 6. Figure 7 provides the output power from the main grid and the CHP system. Figure 8 shows (a) generator power output and (b) energy purchased from the grid, respectively.
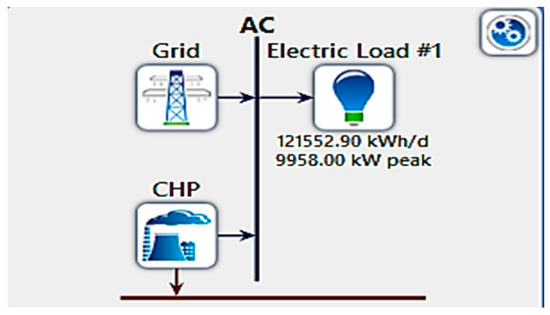
Figure 6.
System 1: grid and CHP design.
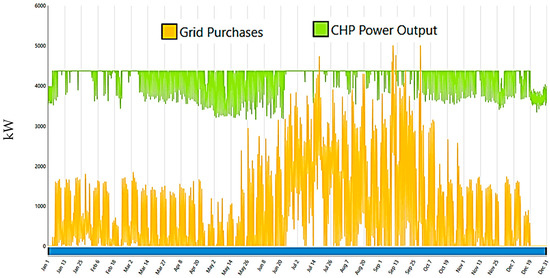
Figure 7.
Output power (System 1: grid and CHP).

Figure 8.
System 1: grid and CHP (a) generator power output and (b) energy purchased from grid.
- System 2: Grid, CHP, PV
It combines a CHP system, grid connection, and solar PV resources to meet the energy demand, as shown in Figure 9. Figure 10 shows the output power from each resource to meet the overall energy demand. This proposed system involves purchasing energy from the grid when the CHP and PV systems are unable to meet the load demand, selling excess energy back to the grid when the CHP and PV systems generate more power than required, utilizing the electrical power generated by the CHP system, and harnessing the electrical power generated by the PV system. These parameters help define the operation and energy flow within the integrated grid, the energy purchased from the grid, the energy sold to the grid, CHP power, and PV power, as illustrated in Figure 11a–d, respectively.
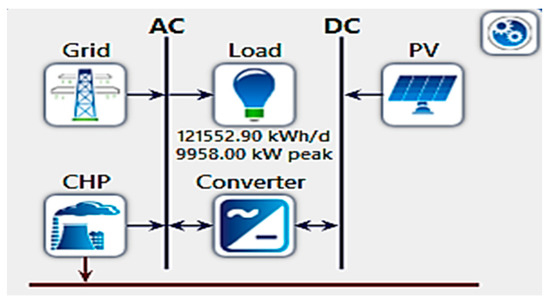
Figure 9.
System 2: grid, CHP, and PV design.
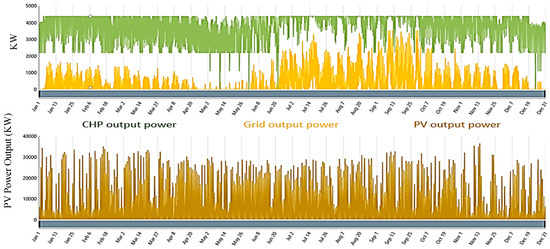
Figure 10.
Output power (System 2: grid, CHP, and PV).
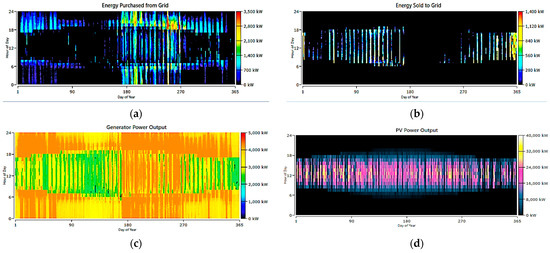
Figure 11.
System 2: grid, CHP, and PV (a) energy purchased from grid, (b) energy sold to grid, (c) CHP output power, and (d) PV power output.
- System 3: Grid, CHP, PV, ESS
This system integrates multiple energy resources, including the grid, a CHP system, solar PV panels, and an ESS, as shown in Figure 12. This combination allows for a more robust and flexible power generation and management approach. Figure 13 shows the output power from each resource to meet the overall energy demand. Figure 14 shows the grid, CHP, PV, and ESS (a) energy purchased from the grid, (b) energy sold to the grid, (c) CHP output power, (d) PV power output, and (e) state of charge. It involves purchasing energy from the grid when the generation from the CHP and PV systems is insufficient, there is no selling energy back to the grid, utilizing the electrical power output from the CHP and PV systems, and storing excess energy in the ESS for later use. The state of charge of the ESS provides valuable information for managing energy supply and demand.
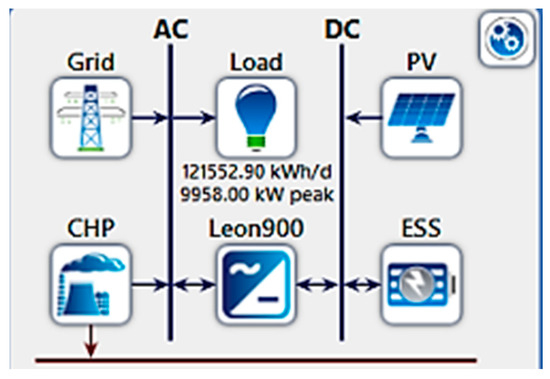
Figure 12.
System 3: grid, CHP PV, and ESS design.
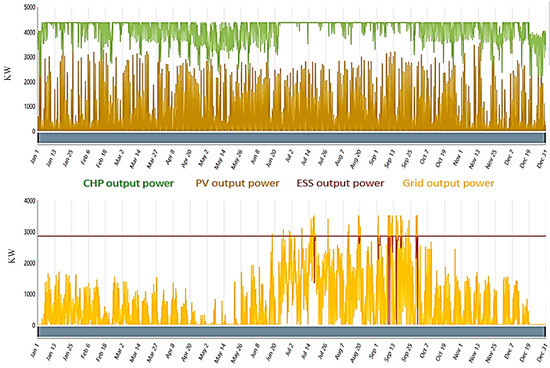
Figure 13.
Output power (System 3: grid, CHP, PV, and ESS).
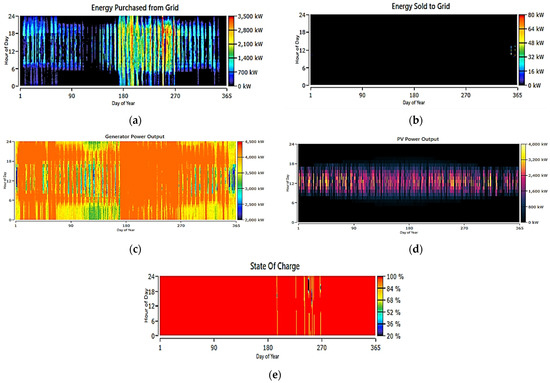
Figure 14.
System 3: grid, CHP, PV, and ESS (a) energy purchased from grid, (b) energy sold to grid, (c) CHP output power, (d) PV power output, and (e) state of charge.
- System 4 Grid, CHP, and WT
The WT is integrated with a grid and a CHP system in this system, as shown in Figure 15. Figure 16 shows the output power from the grid, a CHP, and a WT. Figure 17 shows (a) energy purchased from the grid, (b) energy sold to the grid, (c) CHP output power, and (d) wind power output.
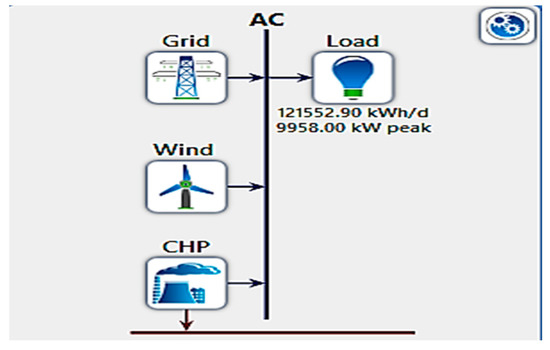
Figure 15.
System 4: grid, CHP, and wind design.
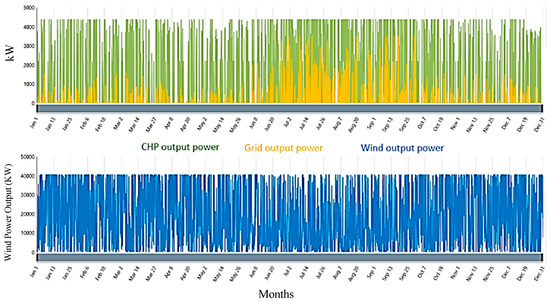
Figure 16.
Output power (System 4: grid, CHP, and wind).
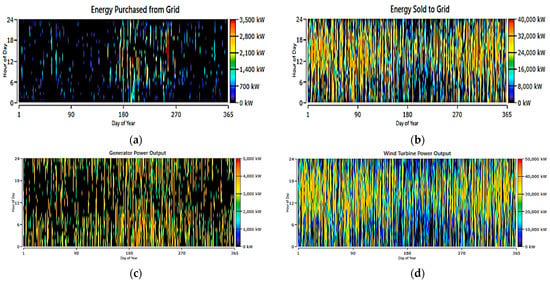
Figure 17.
System 4: grid, CHP, and wind, (a) energy purchased from grid, (b) energy sold to grid, (c) CHP output power, and (d) wind power output.
- System 5: Grid, CHP, WT, PV, and ESS
The output power from each source in System 5 varied according to the renewable energy resources harnessed, as shown in Figure 18. Figure 19 depicts the output power from each source in the system and provides the contribution of each energy source to the overall power generation. Upon analysis, it is obvious that the WT generates the highest amount of power annually compared to other sources. Figure 20 shows (a) energy purchased from the grid, (b) energy sold to the grid, (c) CHP output power, (d) PV output power, (e) wind power output, and (f) state of charge. The annual power output from each source is shown in Figure 19, allowing for a visual comparison of the contributions. WT indicates that it has a dominant role in power generation. This observation highlights the ample availability of wind resources in the system’s location and the efficiency of the WT in harnessing this renewable energy source. On the other hand, the power output from other sources, such as solar PV, the grid, ESS, and CHP, is relatively lower. The grid serves as a backup power source when PV generation is insufficient. In addition, the ESS is incorporated to store excess PV energy and supply electricity during periods of low or no generation.
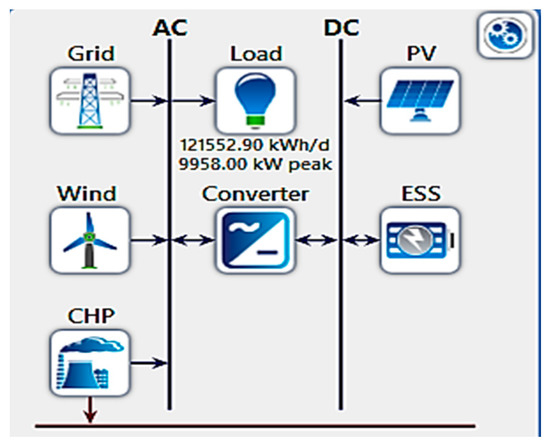
Figure 18.
System 5: grid, CHP, wind, PV, and ESS design.
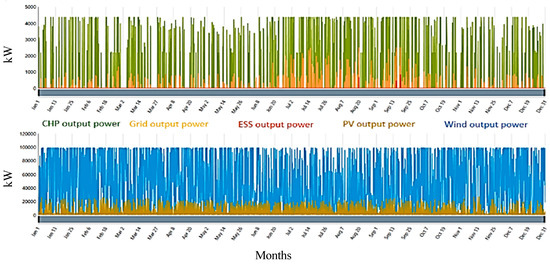
Figure 19.
Output power (System 5: grid, CHP, PV, ESS, and wind).
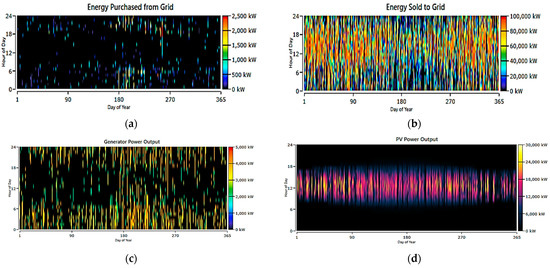

Figure 20.
System 5: grid, CHP, PV, ESS, and wind (a) energy purchased from grid, (b) energy sold to grid, (c) CHP output power, (d) PV output power, (e) wind power output, and (f) state of charge.
- System 6: CHP, Wind, PV, and ESS (Islanded Grid)
In this system, an islanded grid is proposed. Figure 21 illustrates the system components. It includes the CHP, wind, PV, and ESS. The output power from each resource provides a visual representation of the contributions made by different sources in meeting the load power demand. Figure 22 shows that the WT resource covers much of the load power. The other resources, although less prominent, still play a role in meeting the load power demand. Their contributions may be comparatively less but are nonetheless valuable in ensuring a reliable and balanced power supply. Figure 23 shows (a) CHP output power, (d) PV power output, (c) wind output power, and (d) state of charge.
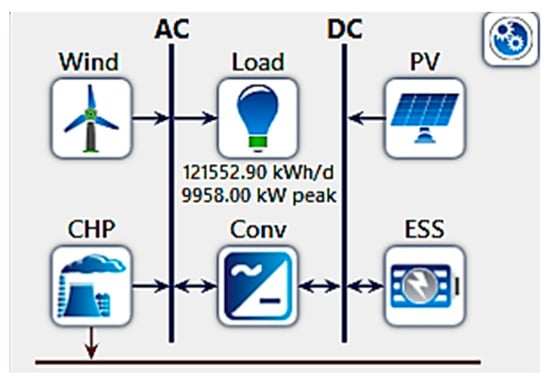
Figure 21.
System 6: CHP, WT, PV, and ESS design.
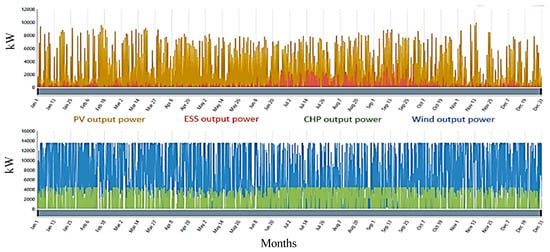
Figure 22.
Output power (System 6: CHP, PV, ESS, and WT).
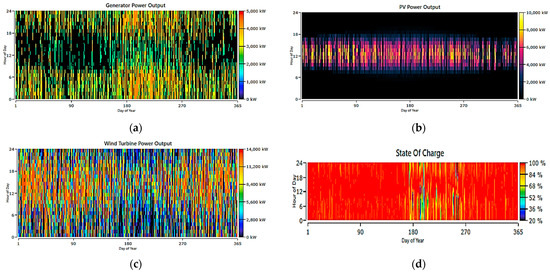
Figure 23.
System 6: CHP, PV, ESS, and wind (a) CHP output power, (d) PV power output, (c) wind output power, and (d) state of charge.
3.3. Determination of Oakland University System
Whether integrated or islanded for the OU campus, the design of an MG requires consideration of renewable resource availability, load demand profiles, system reliability, and cost-effectiveness. The specific combination of energy sources and storage systems should be selected based on the university’s energy requirements, renewable resource potential, and sustainability goals. More specifically, the available rated CHP station at OU covers less than 50% of the peak load (10 MW), which indicates that the CHP station needs to meet a significant portion of the electrical demand. This is due to the limitations in the capacity of the CHP and variations in load demand throughout the months. Moreover, the monthly electric generation from the CHP station would vary depending on the system’s operational hours, efficiency, and maintenance schedule. However, in this work, the simulation maintains the output power constant. Recently, the grid covered the other portion of the demand load, which is more than 50% when the load exceeds the peak value.
Table 3 summarizes the HOMER Pro results for all proposed system configurations, and Figure 24 illustrates the determination of the renewable output power penetration in meeting the OU electricity requirements. Based on the fact that the monthly power generated from the PV could be influenced by solar irradiation, seasonal variations in solar availability and weather conditions can impact the PV production levels throughout the year. However, it suggests emphasizing renewable energy integration, reducing greenhouse gas emissions, and achieving sustainability goals. The monthly electric production from each source must be carefully managed and optimized to ensure that the total load demand is met consistently. It requires accurate forecasting of the load demand and balancing the generation from different sources. This could involve load scheduling and energy storage utilization to manage the variations in supply and demand. Certain months may exhibit higher electric production, while others may show lower output.

Table 3.
Summaries of the Homer results for all proposed system configurations.
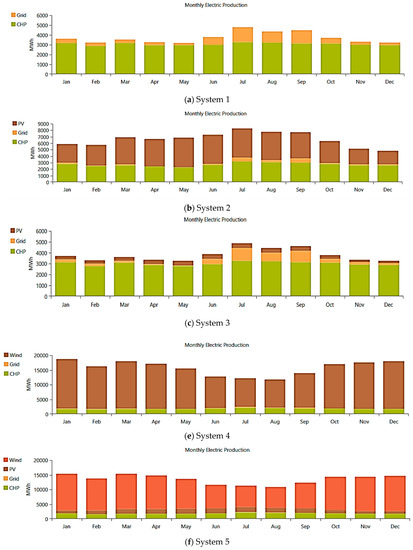

Figure 24.
Monthly electric production for all proposed systems.
This variation can be attributed to the fact that solar PV production might peak during the summer months in Michigan when sunlight is abundant, while wind power generation could be higher in the OU campus area. This paper provides an opportunity to assess the system’s overall performance in meeting the electricity demand for OU throughout the year. By examining the monthly trends, we can identify any periods of surplus in electric production. This information can guide system sizing, resource allocation, and optimization decisions to ensure a reliable and efficient electricity supply. Furthermore, it can help identify areas for improvement or potential challenges. For example, if there are significant variations or dips in electric production during certain months, additional system components or adjustments to system parameters are needed. It is important to note that the paper represents a specific scenario based on assumptions and modeling inputs. The actual power generation may vary depending on various factors, particularly the system design and resource availability. In the future, proper MG design and energy management will ensure consistent and reliable electric power throughout the year by utilizing optimization algorithms. The simulation results for each configuration are discussed and addressed as follows:
System 1: The maximum CHP output power of 4369 kW represents the highest electrical power generated by the CHP system integrated into the MG. The system draws a maximum capacity of 5000 kW from the grid, suggesting the highest load requirement that the MG’s generation sources cannot meet. In addition, the NPC is USD 45.6 M, with an LCOE of 0.0795 USD/kWh. These values demonstrate a relatively moderate NPC and LCOE.
System 2: The solar PV resource contributes a maximum output power of 32,288 kW. The grid connection provides a maximum output power of 3500 kW. The converter provides a maximum output power of 2567 kW. In addition, the NPC is USD 94.1 M, and the LCOE is 0.163 USD/kWh. The higher NPC and LCOE values in System 2 can be attributed to the addition of PV, which incurs higher upfront costs than in System 1. However, the LCOE is still within an acceptable range, indicating a competitive cost per unit of electricity generated.
System 3: PV (3146 kW), CHP (4369 kW), ESS (1 MW), and the grid (3500 kW). The simulation results for the proposed system reveal an NPC of USD 52.2 M and an LCOE of USD 0.0911/kWh. Including an ESS in System 3 contributes to the higher NPC than in System 1. However, the LCOE remains relatively competitive, suggesting efficient utilization of energy resources and storage.
System 4: The wind power resource provides a substantial output of 40.5 MW, the system’s capacity to harness renewable energy from the wind. The CHP system contributes a maximum power output of 4.369 MW. The grid connection supplies a maximum power output of 3500 kW, acting as a backup power source and ensuring a reliable electricity supply. The NPC of USD 59.4 M has an LCOE of USD 0.028/kWh. The low NPC and LCOE values signify the economic viability and cost-effectiveness of the system.
System 5: The solar PV system generates an output power of 12.155 MW. The wind power resource substantially contributes, providing an impressive output power of 30 MW. The utility grid is a backup power source with an output power of 2500 kW. With a capacity of 15 MW, the ESS provides flexibility in managing power demand and supply fluctuations. The CHP system contributes a maximum power output of 4369 kW. The converter, rated at 1494 kW, enables efficient power flow management within the system. It demonstrates an NPC of USD 30 M and an LCOE of 0.0274 USD/kWh. Including multiple energy sources and storage systems contributes to a higher NPC than System 4. However, the LCOE remains significantly low, indicating an economically viable and efficient system. This relatively low NPC tells a financially feasible and cost-effective system design. Integrating multiple renewable energy sources, along with the efficient operation of the CHP system and utilization of the ESS, contribute to the lower NPC. Furthermore, the simulation results emphasize the importance of accurate resource assessment and optimal sizing of the system components. The substantial output powers from wind and solar PV demonstrate the potential for harnessing significant amounts of renewable energy. Utilizing an energy storage system and the efficient operation of the CHP system contribute to load balancing and improved system performance.
System 6: Exhibits an NPC of USD 88 M and an LCOE of 0.175 USD/kWh. The higher NPC and LCOE in System 6 can be attributed to including multiple energy sources and storage systems, which incur higher upfront costs. However, the LCOE remains competitive, considering the enhanced reliability and resilience of the system.
In conclusion, each the monthly electric production (MEP) for all proposed system configurations employs various sources to meet the electricity demand, as follows:
In System 1, the primary source of electricity is the combined heat and power (CHP) system, which covers 43% of the total load. If the electrical demand exceeds the capacity of the CHP, the additional power required is obtained from the grid. System 2 adopts a diversified approach, with photovoltaic (PV) solar panels contributing 22% of the total load demand. The CHP system covers 43% of the load, while the remaining portion is procured from the grid. In System 3, energy production is diversified using multiple sources. PV solar panels contribute 9% of the load, and the CHP system covers 43%. Around 35% of the load demand is sourced from the grid, with the remaining portion fulfilled by a battery system. In System 4, a WT generates 35% of the load, with the CHP system covering 43%. In System 5, the CHP system supplies 43% of the load, the grid provides 25%, and a combination of WT, PV, and ESS delivers the remaining portion. In System 6, the energy production is diversified using WT, contributing 40% of the total load demand. The battery and PV systems combine to make up the remaining 35%.
These different system configurations demonstrate the integration of various energy sources to meet the load demand. By diversifying the energy mix, these systems enhance reliability, optimize resource utilization, and reduce dependency on the grid. The specific combination of energy sources in each system configuration allows for flexibility and potential cost savings while considering the unique characteristics of each source in terms of generation capacity and availability.
Figure 25 presents the annual renewable energy production for all proposed systems (System 1 to System 6). Each system exhibits different capacities for grid connection, PV solar, WT, CHP, and ESS. System 1 solely relies on a grid connection with no integration of PV, WT, or ESS. On the other hand, Systems 2, 5, and 6 demonstrate the significance of renewable sources with varying capacities of PV solar and WT. System 6 stands out as an off-grid system with no grid connection but a substantial WT capacity. The diverse energy source capacities highlight the importance of careful planning and optimization to ensure cost-effectiveness, sustainability, and resilience in microgrid operations.
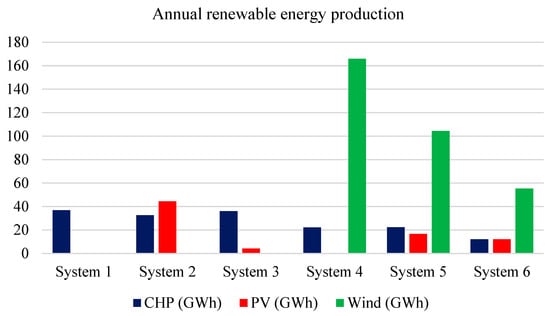
Figure 25.
Annual renewable electric production for all proposed systems.
3.4. Unmet Electrical Load
The unmet load within the proposed system refers to the electricity demand needing more than the available energy sources and storage systems. The HOMER simulation results for unmet load are illustrated in Figure 26; by analyzing the results, it becomes evident that the system includes renewable energy resources and exhibits a high unmet electrical load.
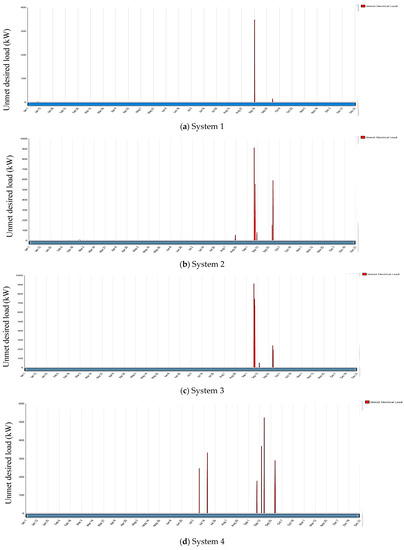
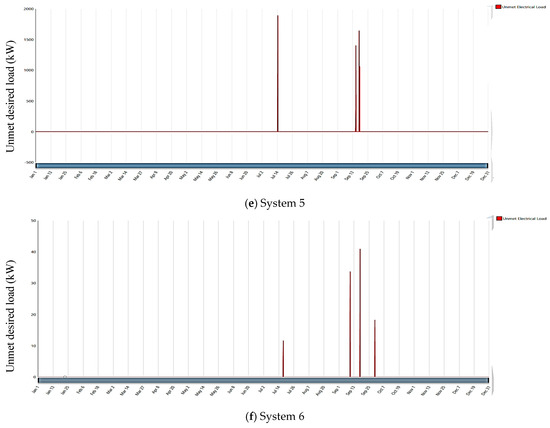
Figure 26.
Unmet load for the proposed systems.
The higher unmet load can be attributed to seasonal variations during September compared to other months, which may decrease energy generation during that specific month. Additionally, the fluctuations in the demand profile could contribute to the unmet load.
To address the mitigation of the unmet load, it suggests incorporating the forced operation of CHP in subsequent HOMER configurations, particularly during lower renewable energy generation periods. This adjustment aims to optimize the utilization of available resources at the OU campus and enhance the system’s ability to meet the load demand. In addition, it contributes to a more balanced and reliable MG.
4. Conclusions
This paper designs an MG for Oakland University using the HOMER Pro platform. Different system configurations have been considered, evaluating the inclusion of CHP, PV solar, WT, ESS, and the option of grid connected. It aims to fulfill the university’s energy requirements while reducing reliance on the traditional grid and minimizing greenhouse gas emissions. In addition, the unmet electrical load is analyzed and evaluated for each proposed system. The findings provide valuable guidance for Oakland University to implement sustainable and resilient energy solutions. The HOMER simulation results demonstrate the output power and cost-effectiveness of integrating renewable system configurations with NPC and LCOE. Based on the total peak load of 9.958 MW, the HOMER simulation reveals that the hybrid renewable system has an estimated NPC of USD 30 M and a LOCE of 0.0274 USD/kWh. However, it should be noted that there may be instances in September where the minimum desired load still needs to be fully met. These findings emphasize the economic viability of utilizing wind energy and CHP in the off-grid system but also accentuate the need for further analysis and improvements to ensure consistent power supply during periods of lower demand. The system’s scalability and flexibility allowed for future expansions and adaptations to changing energy demands and technological advancements without costly modifications. It is robust and applicable to diverse regions or systems. Future research could explore additional energy storage capacity or demand-side management strategies to overcome this constraint and further enhance the microgrid’s robustness and performance.
Author Contributions
Conceptualization, E.Y.A. and M.A.Z.; methodology, E.Y.A. and H.M.D.H.; software, E.Y.A.; validation, H.M.D.H. and M.H.; formal analysis, H.M.D.H. and E.Y.A. investigation, M.A.Z.; resources, E.Y.A.; data curation, E.Y.A. and M.H.; writing—original draft preparation, E.Y.A., M.A.Z., and H.M.D.H.; writing—review and editing, H.M.D.H. and M.A.Z.; visualization, H.M.D.H. and M.H.; supervision, M.A.Z. project administration, E.Y.A. All authors have read and agreed to the published version of the manuscript.
Funding
This research received no external funding.
Data Availability Statement
Not applicable.
Acknowledgments
The authors acknowledge the facilities management department at Oakland University for providing the data used in this research.
Conflicts of Interest
The authors declare no conflict of interest. The funders had no role in the design of the study; in the collection, analyses, and/or interpretation of data; in the writing of the manuscript; or in the decision to publish the results.
References
- Uyar, T.S.; Javani, N. Renewable Energy Based Solutions; Lecture Notes in Energy; Springer International Publishing AG: Cham, Switzerland, 2022; Volume 87, ISBN 978-3-031-05124-1. [Google Scholar]
- Kantola, M.; Saari, A. Renewable vs. traditional energy management solutions—A Finnish hospital facility case. Renew. Energy 2013, 57, 539–545. [Google Scholar] [CrossRef]
- Habbi, H.M.; Alhamadani, A. Power System Stabilizer PSS4B Model for Iraqi National Grid using PSS/E Software. J. Eng. 2018, 24, 29–45. [Google Scholar] [CrossRef]
- Ishraque, F.; Shezan, S.A.; Rashid, M.M.; Bhadra, A.B.; Hossain, A.; Chakrabortty, R.K.; Ryan, M.J.; Fahim, S.R.; Sarker, S.K.; Das, S.K. Techno-Economic and Power System Optimization of a Renewable Rich Islanded Microgrid Considering Different Dispatch Strategies. IEEE Access 2021, 9, 77325–77340. [Google Scholar] [CrossRef]
- Sallam, M.E.; Attia, M.A.; Abdelaziz, A.Y.; Sameh, M.A.; Yakout, A.H. Optimal Sizing of Different Energy Sources in an Isolated Hybrid Microgrid Using Turbulent Flow Water-Based Optimization Algorithm. IEEE Access 2022, 10, 61922–61936. [Google Scholar] [CrossRef]
- Pandey, S.; Han, J.; Gurung, N.; Chen, H.; Paaso, E.A.; Li, Z.; Khodaei, A. Multi-Criteria Decision-Making and Robust Optimization Methodology for Generator Sizing of a Microgrid. IEEE Access 2021, 9, 142264–142275. [Google Scholar] [CrossRef]
- Anglani, N.; Oriti, G.; Fish, R.; Van Bossuyt, D.L. Design and Optimization Strategy to Size Resilient Stand-Alone Hybrid Microgrids in Various Climatic Conditions. IEEE Open J. Ind. Appl. 2022, 3, 237–246. [Google Scholar] [CrossRef]
- Moradi, M.H.; Hajinazari, M.; Jamasb, S.; Paripour, M. An energy management system (EMS) strategy for combined heat and power (CHP) systems based on a hybrid optimization method employing fuzzy programming. Energy 2013, 49, 86–101. [Google Scholar] [CrossRef]
- Zaki Diab, A.A.; Sultan, H.M.; Mohamed, I.S.; Kuznetsov Oleg, N.; Do, T.D. Application of different optimization algorithms for optimal sizing of pv/wind/diesel/battery storage stand-alone hybrid microgrid. IEEE Access 2019, 7, 119223–119245. [Google Scholar] [CrossRef]
- Conde, G.; Perez, G.; Gutierrez-Alcaraz, G.; Leonowicz, Z. Frequency Improvement in Microgrids Through Battery Management System Control Supported by a Remedial Action Scheme. IEEE Access 2022, 10, 8081–8091. [Google Scholar] [CrossRef]
- Kharrich, M.; Kamel, S.; Abdeen, M.; Mohammed, O.H.; Akherraz, M.; Khurshaid, T.; Rhee, S.-B. Developed Approach Based on Equilibrium Optimizer for Optimal Design of Hybrid PV/Wind/Diesel/Battery Microgrid in Dakhla, Morocco. IEEE Access 2021, 9, 13655–13670. [Google Scholar] [CrossRef]
- Nakiganda, A.M.; Dehghan, S.; Markovic, U.; Hug, G.; Aristidou, P. A Stochastic-Robust Approach for Resilient Microgrid Investment Planning Under Static and Transient Islanding Security Constraints. IEEE Trans. Smart Grid 2022, 13, 1774–1788. [Google Scholar] [CrossRef]
- Sahri, Y.; Tamalouzt, S.; Belaid, S.L.; Bajaj, M.; Ghoneim, S.S.M.; Zawbaa, H.M.; Kamel, S. Performance improvement of Hybrid System based DFIG-Wind/PV/Batteries connected to DC and AC grid by applying Intelligent Control. Energy Rep. 2023, 9, 2027–2043. [Google Scholar] [CrossRef]
- Bihari, S.P.; Sadhu, P.K.; Sarita, K.; Khan, B.; Arya, L.D.; Saket, R.K.; Kothari, D.P. A Comprehensive Review of Microgrid Control Mechanism and Impact Assessment for Hybrid Renewable Energy Integration. IEEE Access 2021, 9, 88942–88958. [Google Scholar] [CrossRef]
- Nurunnabi, M.; Roy, N.K.; Hossain, E.; Pota, H.R. Size Optimization and Sensitivity Analysis of Hybrid Wind/PV Micro-Grids- A Case Study for Bangladesh. IEEE Access 2019, 7, 150120–150140. [Google Scholar] [CrossRef]
- Gao, J.T.; Shih, C.H.; Lee, C.W.; Lo, K.Y. An Active and Reactive Power Controller for Battery Energy Storage System in Microgrids. IEEE Access 2022, 10, 10490–10499. [Google Scholar] [CrossRef]
- Xie, C.; Wang, D.; Lai, C.S.; Wu, R.; Wu, X.; Lai, L.L. Optimal sizing of battery energy storage system in smart microgrid considering virtual energy storage system and high photovoltaic penetration. J. Clean. Prod. 2021, 281, 125308. [Google Scholar] [CrossRef]
- Datta, A.; Atoche, A.C.; Koley, I.; Sarker, R.; Castillo, J.V.; Datta, K.; Saha, D. Coordinated AC frequency vs DC voltage control in a photovoltaic-wind-battery-based hybrid AC/DC microgrid. Int. Trans. Electr. Energy Syst. 2021, 31, e13041. [Google Scholar] [CrossRef]
- Rehman, S.; Habib, H.U.R.; Wang, S.; Buker, M.S.; Alhems, L.M.; Al Garni, H.Z. Optimal Design and Model Predictive Control of Standalone HRES: A Real Case Study for Residential Demand Side Management. IEEE Access 2020, 8, 29767–29814. [Google Scholar] [CrossRef]
- Santos, L.H.S.; Silva, J.A.A.; López, J.C.; Arias, N.B.; Rider, M.J.; Da Silva, L.C.P. Integrated Optimal Sizing and Dispatch Strategy for Microgrids Using HOMER Pro. In Proceedings of the 2021 IEEE PES Innovative Smart Grid Technologies Conference—Latin America (ISGT Latin America), Lima, Peru, 15–17 September 2021; pp. 1–5. [Google Scholar]
- Çetinbaş, I.; Tamyürek, B.; Demirtaş, M. Design, Analysis and Optimization of a Hybrid Microgrid System Using HOMER Software: Eskişehir Osmangazi University Example. Int. J. Renew. Energy Dev. 2019, 8, 65–79. [Google Scholar] [CrossRef]
- Belmahdi, B.; El Bouardi, A. Simulation and Optimization of Microgrid Distributed Generation: A Case Study of University Abdelmalek Essaâdi in Morocco. Procedia Manuf. 2020, 46, 746–753. [Google Scholar] [CrossRef]
- Murty, V.V.V.S.N.; Kumar, A. Optimal Energy Management and Techno-economic Analysis in Microgrid with Hybrid Renewable Energy Sources. J. Mod. Power Syst. Clean Energy 2020, 8, 929–940. [Google Scholar] [CrossRef]
- Ali, A.; Shakoor, R.; Raheem, A.; Muqeet, H.A.U.; Awais, Q.; Khan, A.A.; Jamil, M. Latest Energy Storage Trends in Multi-Energy Standalone Electric Vehicle Charging Stations: A Comprehensive Study. Energies 2022, 15, 4727. [Google Scholar] [CrossRef]
- Yang, Y.; Jia, Q.-S.; Deconinck, G.; Guan, X.; Qiu, Z.; Hu, Z. Distributed Coordination of EV Charging With Renewable Energy in a Microgrid of Buildings. IEEE Trans. Smart Grid 2018, 9, 6253–6264. [Google Scholar] [CrossRef]
- Cai, T.; Dong, M.; Chen, K.; Gong, T. Methods of participating power spot market bidding and settlement for renewable energy systems. Energy Rep. 2022, 8, 7764–7772. [Google Scholar] [CrossRef]
- Li, H.; Ren, Z.; Trivedi, A.; Verma, P.P.; Srinivasan, D.; Li, W. A Noncooperative Game-Based Approach for Microgrid Planning Considering Existing Interconnected and Clustered Microgrids on an Island. IEEE Trans. Sustain. Energy 2022, 13, 2064–2078. [Google Scholar] [CrossRef]
- Cetinbas, I.; Tamyurek, B.; Demirtas, M. The Hybrid Harris Hawks Optimizer-Arithmetic Optimization Algorithm: A New Hybrid Algorithm for Sizing Optimization and Design of Microgrids. IEEE Access 2022, 10, 19254–19283. [Google Scholar] [CrossRef]
- Dhundhara, S.; Verma, Y.P.; Williams, A. Techno-economic analysis of the lithium-ion and lead-acid battery in microgrid systems. Energy Convers. Manag. 2018, 177, 122–142. [Google Scholar] [CrossRef]
- Sawle, Y.; Jain, S.; Babu, S.; Nair, A.R.; Khan, B. Prefeasibility Economic and Sensitivity Assessment of Hybrid Renewable Energy System. IEEE Access 2021, 9, 28260–28271. [Google Scholar] [CrossRef]
- Alshakhs, R.; Arefifar, S.A. Oakland University as A Microgrid—Feasibility Studies of Planning and Operation. In Proceedings of the 2020 IEEE International Conference on Electro Information Technology (EIT), Naperville, IL, USA, 28–30 May 2020; pp. 394–401. [Google Scholar]
- AlKassem, A.; Draou, A.; Alamri, A.; Alharbi, H. Design Analysis of an Optimal Microgrid System for the Integration of Renewable Energy Sources at a University Campus. Sustainability 2022, 14, 4175. [Google Scholar] [CrossRef]
- Kumar, A.; Verma, A.; Talwar, R. Optimal techno-economic sizing of a multi-generation microgrid system with reduced dependency on grid for critical health-care, educational and industrial facilities. Energy 2020, 208, 118248. [Google Scholar] [CrossRef]
- Elsaraf, H.; Jamil, M.; Pandey, B. Techno-Economic Design of a Combined Heat and Power Microgrid for a Remote Community in Newfoundland Canada. IEEE Access 2021, 9, 91548–91563. [Google Scholar] [CrossRef]
- Bernal-Agustín, J.L.; Dufo-López, R. Multi-objective design and control of hybrid systems minimizing costs and unmet load. Electr. Power Syst. Res. 2009, 79, 170–180. [Google Scholar] [CrossRef]
- Chauhan, A.; Saini, R.P. Size optimization and demand response of a stand-alone integrated renewable energy system. Energy 2017, 124, 59–73. [Google Scholar] [CrossRef]
- Cao, J.; Crozier, C.; McCulloch, M.; Fan, Z. Optimal Design and Operation of a Low Carbon Community Based Multi-Energy Systems Considering EV Integration. IEEE Trans. Sustain. Energy 2019, 10, 1217–1226. [Google Scholar] [CrossRef]
- Alsagri, A.S.; Alrobaian, A.A. Optimization of Combined Heat and Power Systems by Meta-Heuristic Algorithms: An Overview. Energies 2022, 15, 5977. [Google Scholar] [CrossRef]
- Li, Z.; Zhou, J.; Wen, J.; Chen, X. Dynamic Modeling and Operations of a Heat-power Station System Based on Renewable Energy. CSEE J. Power Energy Syst. 2022, 8, 1110–1121. [Google Scholar] [CrossRef]
- Pearson, J.; Wagner, T.; Delorit, J.; Schuldt, S. Meeting Temporary Facility Energy Demand With Climate-Optimized Off-Grid Energy Systems. IEEE Open Access J. Power Energy 2020, 7, 203–211. [Google Scholar] [CrossRef]
- Abdul Hussain, A.M.; Habbi, H.M.D. Maximum Power Point Tracking Photovoltaic Fed Pumping System Based on PI Con-troller. In Proceedings of the 2018 Third Scientific Conference of Electrical Engineering (SCEE), Baghdad, Iraq, 19–20 December 2018; pp. 78–83. [Google Scholar]
- Zečević, Ž.; Rolevski, M. Neural Network Approach to MPPT Control and Irradiance Estimation. Appl. Sci. 2020, 10, 5051. [Google Scholar] [CrossRef]
- Bhattacharyya, S.; Singh, B. Wind-Driven DFIG–Battery–PV-Based System With Advance DSOSF-FLL Control. IEEE Trans. Ind. Appl. 2022, 58, 4370–4380. [Google Scholar] [CrossRef]
- Chakraborty, S.; Modi, G.; Singh, B. A Cost Optimized-Reliable-Resilient-Realtime-Rule-Based Energy Management Scheme for a SPV-BES-Based Microgrid for Smart Building Applications. IEEE Trans. Smart Grid 2023, 14, 2572–2581. [Google Scholar] [CrossRef]
Disclaimer/Publisher’s Note: The statements, opinions and data contained in all publications are solely those of the individual author(s) and contributor(s) and not of MDPI and/or the editor(s). MDPI and/or the editor(s) disclaim responsibility for any injury to people or property resulting from any ideas, methods, instructions or products referred to in the content. |
© 2023 by the authors. Licensee MDPI, Basel, Switzerland. This article is an open access article distributed under the terms and conditions of the Creative Commons Attribution (CC BY) license (https://creativecommons.org/licenses/by/4.0/).