Article

Weightless Neural Network-Based Detection and Diagnosis of Visual Faults in Photovoltaic Modules

by
Naveen Venkatesh Sridharan
1,
Jerome Vasanth Joseph
1,
Sugumaran Vaithiyanathan
1 and
Mohammadreza Aghaei
2,3,*
1
School of Mechanical Engineering (SMEC), Vellore Institute of Technology, Chennai 600127, India
2
Department of Ocean Operations and Civil Engineering, Norwegian University of Science and Technology (NTNU), 6009 Ålesund, Norway
3
Department of Sustainable Systems Engineering (INATECH), University of Freiburg, 79110 Freiburg, Germany
*
Author to whom correspondence should be addressed.
Energies 2023, 16(15), 5824; https://doi.org/10.3390/en16155824
Submission received: 19 July 2023 / Revised: 26 July 2023 / Accepted: 3 August 2023 / Published: 5 August 2023

Abstract

:
The present study introduces a novel approach employing weightless neural networks (WNN) for the detection and diagnosis of visual faults in photovoltaic (PV) modules. WNN leverages random access memory (RAM) devices to simulate the functionality of neurons. The network is trained using a flexible and efficient algorithm designed to produce consistent and precise outputs. The primary advantage of adopting WNN lies in its capacity to obviate the need for network retraining and residual generation, making it highly promising in classification and pattern recognition domains. In this study, visible faults in PV modules were captured using an unmanned aerial vehicle (UAV) equipped with a digital camera capable of capturing RGB images. The collected images underwent preprocessing and resizing before being fed as input into a pre-trained deep learning network, specifically, DenseNet-201, which performed feature extraction. Subsequently, a decision tree algorithm (J48) was employed to select the most significant features for classification. The selected features were divided into training and testing datasets that were further utilized to determine the training, test and validation accuracies of the WNN (WiSARD classifier). Hyperparameter tuning enhances WNN’s performance by achieving optimal values, maximizing classification accuracy while minimizing computational time. The obtained results indicate that the WiSARD classifier achieved a classification accuracy of 100.00% within a testing time of 1.44 s, utilizing the optimal hyperparameter settings. This study underscores the potential of WNN in efficiently and accurately diagnosing visual faults in PV modules, with implications for enhancing the reliability and performance of photovoltaic systems.

1. Introduction

Conventional energy sources like coal, oil, nuclear energy and natural gas have been frontrunners in the energy market despite their drawbacks and limitations [1]. The energy demand across the globe has been continually climbing due to the rising global population, with an estimated population of 9 billion by 2050. The corresponding rise in the use of petroleum equivalents is projected to range from 12 billion to 16 billion tons [2]. However, the traditional form of energy sources is non-renewable and existing reserves are depleting rapidly, resulting in an increase in energy costs [3]. On the other hand, the excessive usage of conventional energy sources has created a severe impact on the environment that is claimed to be responsible for the occurrence of global warming, ozone layer depletion, acid rain and the greenhouse effect [4]. Such scenarios have highlighted the need to look for alternative sources of energy that are clean, available in abundance and eco-friendly. To counter environmental impacts and the rising demand for electricity, the scientific community has proposed renewable energy sources as the primary solution [5]. Various sources of renewable energies such as wind energy and solar photovoltaics (PV) have proven to be promising alternatives. Additionally, renewable energy sources offer several advantages like enhanced reliability, eco-friendly power generation, reduced manufacturing costs, large-scale installations, yearlong availability and noise-free operation. Recent reports introduced by the International Energy Agency (IEA) state that global annual installations reached 280 GW in 2020, constituting a 45% increase from past figures. This achievement is coupled with an expansion of global electrical capacity (90%) [6].
The effectiveness of renewable energy sources has not yet been fully exploited due to certain constraints like high maintenance costs, rigorous planning needs and initial capital requirements [7]. Additionally, setting up large PV or wind farms requires large geographical regions for installation to produce a competitive supply of energy. Moreover, the efficiency and reliability of renewable energy sources can further be affected by dynamic environmental and climatic conditions. Solar PV energy generation, the second most popular alternative source of energy, faces off annual energy losses due to the occurrence of faults and degradation over time [8]. The occurrence of various faults in PV modules can create an irreversible deterioration or drop in output performance [9,10]. To eliminate the PV module power loss, the timely monitoring, classification, localization and diagnosis of faults in PV modules is essential [11,12,13]. For instance, the presence of certain faults like aging [14], cracks [15], delamination [16] and corrosion [17] can degrade the lifespan of PV modules, thereby elevating the energy costs involved [18]. PV module faults can be broadly classified into visual and electrical faults; visual faults pave the way for the occurrence of electrical faults [19]. Fault diagnosis and detection in PV modules were initially performed through manual inspections. However, in the case of large PV farms, such manual inspections can be challenging and unprofitable. Thus, there is a need to adopt an automated technique that can detect, diagnose and localize fault occurrences in PV modules. Fault diagnosis and detection techniques for PV modules can be broadly categorized into two methods: (i) vision- or image-based methods (photoluminescence imaging [20], electroluminescence imaging [21,22], RGB imaging [23], fluorescence imaging [24] and infrared thermography [25,26,27]) and (ii) electrical measurement methods (IV curves [28,29], power spectral analysis, signal processing and reflectometry).
Automated fault diagnosis methods have in recent times become effective with the advent of unmanned aerial vehicles (UAVs). UAVs are aircraft that fly remotely or autonomously without the presence of a human pilot. UAVs are generally mounted with cameras, sensors and other payloads that enable them to perform a variety of activities including aerial photography, mapping, surveillance and delivery. Lower costs, less risk to human pilots and better deployment and operating flexibility are certain advantages of UAVs over manned aircraft. Additionally, UAVs are capable of entering regions that human pilots would find difficult or dangerous including disaster zones, building sites or military war zones. Over the years, thermal imaging cameras were widely equipped in UAVs to detect faults in PV modules. However, thermal image cameras have been replaced with high-resolution digital cameras due to the following reasons: (i) minor faults may be precisely spotted by high-resolution digital cameras, (ii) thermal cameras have bad image resolution and (iii) thermal cameras are unable to detect hotspots such as micro-cracks, solid bond failure, partial shading, etc., at higher temperatures [30]. High-resolution images of PV module arrays acquired from UAVs are then analyzed using image analysis and machine learning techniques to find and identify defects [31]. Various researchers have proposed several types of image processing techniques to find defects in PV modules by utilizing UAVs, such as aerial triangulation [32], image mosaicking [33], object detection [34] and extraction of correlated textural features [35]. Additionally, histogram feature analysis was applied by Dashtdar et al. for the localization and detection of faults [36]. However, the quality of the images captured by a UAV has a major role in the efficiency of all of the methods listed above. The image resolution can also be negatively influenced by various factors such as (i) vibration due to flight, (ii) atmospheric haze, (iii) high wind speeds and (iv) reflection from sun/light.
Of late, researchers have begun to apply artificial intelligence (AI)-based techniques for fault diagnosis tasks. Deep learning and machine learning in particular have been claimed to be the most promising methods due to their accurate and instantaneous result generation along with their pattern learning capabilities [37]. Numerous studies have focused on diagnosing PV module faults using convolutional neural networks (CNNs). Broadly, CNNs can be applied to any problem at hand in two different ways, namely, (i) building a model from scratch and (ii) adopting a pre-trained version. Pre-trained versions (GoogLeNet [38], ResNet-50 [39], DenseNet201, AlexNet [40], VGG16 [41] and much more) have been preferred due to their ease of availability, prior domain knowledge and wide adaptability. Additionally, renowned machine learning algorithms like support vector machines (SVM) [42], Naïve Bayes [43], k-nearest neighbor [44], decision trees [23] and much more have been applied in the field of PV module fault diagnosis. The aforementioned techniques work on the weights assigned to neurons to form a pattern and classify the input data into the respective classes. However, the introduction of WNN has created a significant impact due to the absence of a mathematical model or residual weights to determine faults in a system with minimal false rate alarms. WNNs, also termed wavelet neural networks, were introduced by Aleksander [45], who used a digital model built using random access memory (RAM) devices [46]. The learning process in WNNs is carried out through the memory inserts at neurons that take the shape of truth tables. Unlike weighted models, WNNs possess various advantages due to their diverse use of memory units through the elimination of network retraining, non-requirements for residual generation, the generation of accurate and precise results, swift and flexible algorithms with adaptive learning, a similar working principle to that of traditional digital systems, and effectiveness in classification and pattern recognition.
WNNs for classification and pattern recognition tasks have been minimally used in several applications like time series forecasting [47], clustering of data streams [48], navigation in robots [49], face feature identification [50] and fingerprint recognition [51]. However, the usage of WNNs in the field of fault diagnosis and detection is still in the nascent stages of application. The context of WNNs was approached in several articles by De Gregorio; nevertheless, the works do not deal with fault diagnosis tasks [52,53]. The following points were derived based on the abovementioned literature and studies performed.
  • Weightless neural networks have not been applied in the diagnosis of PV module faults.
  • Most of the published works utilized electroluminescence or thermal images in the detection of PV module faults, specifically, cracks and hotspots.
  • To minimize the consumption of inspection duration, manpower and capital costs, unmanned aerial vehicles have been widely adopted.
  • The lack of a public repository and acquisition of a PV module fault dataset is a challenge.
  • Researchers have applied artificial intelligence-based techniques, namely, machine learning and deep learning, to fault diagnosis in PV modules.
  • Over the years, deep learning or machine learning has been individually applied in the detection and diagnosis of PV module faults. However, a combined approach is still in the initial stages.
Based on the literature summary provided above, there were some motivational factors that are listed below:
  • First, there have been minimal attempts to use true color or RGB images for diagnosing faults in PV modules, guiding the direction of research. Since numerous works have studied the adoption of thermal or electroluminescence images.
  • Secondly, UAVs for the acquisition of PV module images have been considered another driving force in reducing monitoring time and manpower.
  • Further, a combined approach of machine and deep learning in the process of fault detection can be considered a prime innovation.
  • Finally, to the best of the authors’ modest knowledge, this is the first study where a WNN is applied to diagnose and classify visual faults in PV modules.
The prime objective of the present study was to develop a fault diagnosis model for PV module visual faults with the aid of deep learning features (DenseNet201) and a WNN (WiSARD classifier). This study aims to develop a simple model that is accurate and precise that can be further implemented into a low-cost device like a microcontroller or microprocessor.
The major contributions of this study are listed as follows:
  • A PV module dataset was created with six different conditions like good panel, delamination, snail trail, burn marks, discoloration and glass breakage. The dataset was acquired using an unmanned aerial vehicle and pre-processed for further usage.
  • The obtained dataset was augmented artificially through application image transforms to enhance the learning capability of the pre-trained network adopted. The augmented dataset was split into training and testing datasets (with a ratio of 0.8:0.2) resized to a size of 224 × 224 to be fed as input to DenseNet-201.
  • The features from the final fully connected layer (fc1000) of DenseNet-201 were extracted and saved as a data file. These extracted features were passed onto a J48 decision tree to select the impactful and contributing features.
  • The selected features were used to train the WNN (WiSARD classifier). The trained model was used to classify the PV module conditions with the supplied test dataset.
  • To improve the classification accuracy of the adopted WNN, several hyperparameters like tic number, bleach configuration, bit number, bleach flag, map type and bleach step were configured.
The novelty of the present study:
The prime novelty of the study revolves around the usage of a WNN (WiSARD classifier) in the detection and diagnosis of six different PV module conditions, namely, good panel, delamination, snail trail, burn marks, discoloration and glass breakage, through the use of an unmanned aerial vehicle (UAV). To improve the learning capability of the adopted model, the dataset was artificially augmented using image transforms. A hybrid approach involving the fusion of deep learning and machine learning techniques was adopted in this study. The features from the final fully connected layer (fc1000) of DenseNet-201 were extracted and a J48 decision tree was employed to select the most impactful and contributing features. These selected features were then utilized to train the WiSARD classifier (WNN), a novel approach for PV module condition classification. This study further optimized the WNN’s accuracy by configuring various hyperparameters, such as tic number, bleach configuration, bit number, bleach flag, map type and bleach step. The results demonstrated the effectiveness of the proposed methodology and the potential of the WiSARD classifier to accurately classify PV module conditions for various applications in the renewable energy domain.

2. Experimental Studies

The present study involves the usage of a UAV in acquiring the images of six different PV conditions considered. The overall data acquisition process was carried out under laboratory conditions with PV modules placed at certain locations inside the laboratory. The image data were acquired by operating the UAV over every PV module with the help of a handheld remote controller handled by a professional drone pilot. Initially, 100 images for every condition were acquired and stored in the storage device in the remote controller through a wireless medium. Further, the images were transferred to the local storage device at the ground station for the next stages of processing. Two sessions of flight travel were performed that lasted for 14 min each to acquire the images of the PV module conditions. The overall monitoring platform is represented in Figure 1. The PV modules used in the present study were manufactured by Udhaya Semiconductors Limited (Coimbatore, India), which has been in operation for 8 years. A detailed specification of the PV module is presented in Table 1.
Good panel, delamination, snail trail, burn marks, discoloration and glass breakage were the six PV module conditions considered in this study. For the application of AI-based techniques, the collected data can be minimal (in terms of volume). Thus, to enhance and expand the dataset artificially, data augmentation involving various image transforms was applied. With the application of data augmentation, 100 images of every PV module condition were expanded to 525 images per condition, accounting for a total of 3150 images. The basic transforms applied are presented in Table 2. The augmented data were further pre-processed and resized to a size of 224 × 224 to be fed as input to DenseNet201. The features from the final fully connected layer (fc1000) were extracted and passed onto a J48 algorithm for the selection of the most contributing and impactful features regarding classification. Furthermore, the WNN (WiSARD) classifier coupled with hyperparameter finetuning helped classify the selected features into the respective classes. A description of PV module faults is provided in Table 3. Limited range, short battery life, small screen size, physical fatigue, minimal features, connectivity issues and compatibility are certain constraints that occur while using handheld remote controllers. Additionally, knowledge of UAV operation and data acquisition is necessary.

3. Methodology

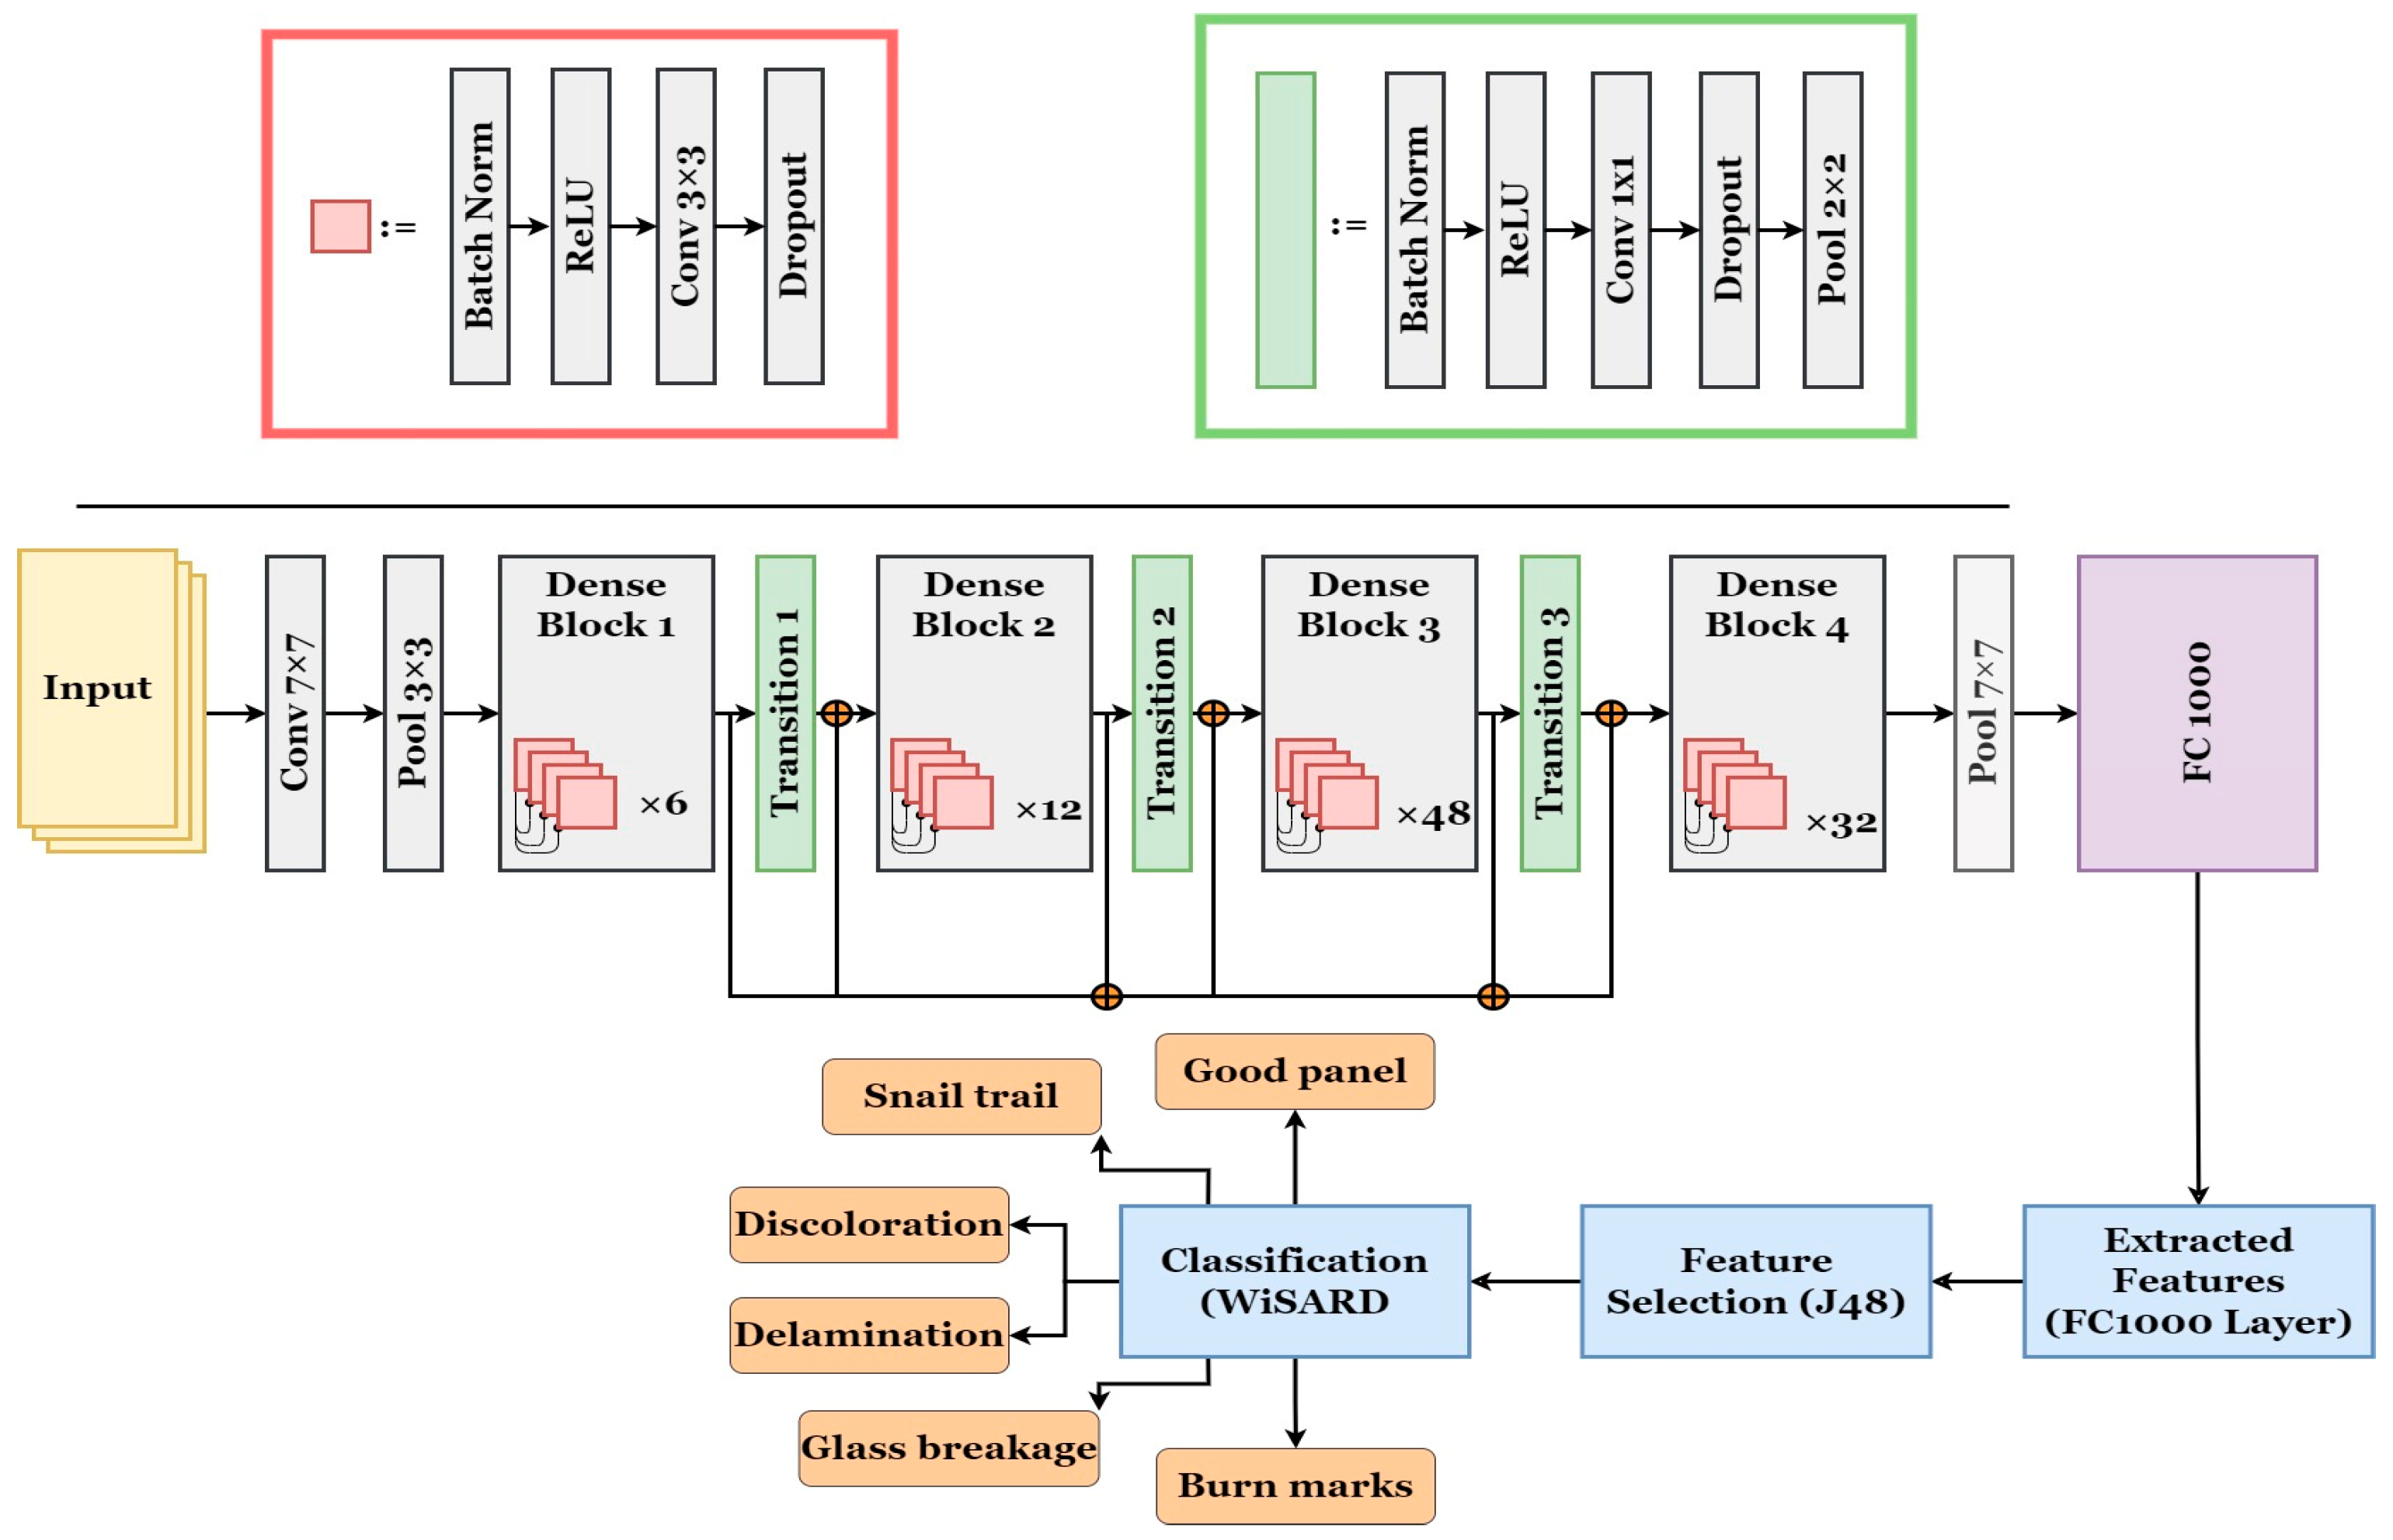
The fault diagnosis methodology for diagnosing PV module visual faults included three stages, namely, the extraction of DenseNet201 features, the selection of contributing features using J48 and classification with the WiSARD classifier. The overall workflow of the PV module fault diagnosis methodology is presented in Figure 2.

3.1. DenseNet-201-Based Feature Extraction

The feature extraction process reduces the number of variables required to analyze and explain a significantly larger quantity of data. A CNN creates features that automatically discriminate between each class based on the dataset labels to improve classification. By making only a few modifications to the last few layers, transfer learning has evolved into an effective method for extracting and categorizing unique image collections. In the present study, the pre-trained network DenseNet-201 was used to extract features from PVM. The network characteristics were obtained from the last fully connected layer (fc1000), which had 1000 features. The obtained features were saved as a “.csv” data file and utilized for further processing. The pre-trained network DenseNet-201 is a densely connected CNN with efficient memory usage. It has a total of 201 layers and 20 million learnable parameters. The size of the network is 80 MB and accepts an image input size of 224 × 224. The DenseNet architecture is primarily composed of dense blocks and transition layers. The dense block contains different numbers of filters with uniform dimensions within the block, while the transition layer performs the down-sampling process through batch normalization.

3.2. Selection of Features

Feature selection comprises identifying and selecting the most relevant features that can successfully help in class predictions. The addition of irrelevant information may reduce classifier performance and significantly increase processing complexity. As a consequence, the feature selection technique eliminates less relevant features to improve the classification algorithm performance. Decision tree (DT) algorithms are often used in feature selection due to their effective information retrieval capabilities and reliable rule generation. DT is a tree-like graphical representation that is used to build classification rules. Roots, nodes, leaves and branches comprise the decision tree. Classification criteria are shown as nodes connected by branches from root to leaf. The selection of features in decision trees begins at the root and progresses via the nodes until a pure leaf is found. Highly relevant and contributory features that impact classification are detected at the decision node using suitable estimate criteria. J48 is a well-known DT method that is widely used for feature selection. In the current study, the J48 DT algorithm was used on DenseNet-201 for the purpose of feature selection. The decision tree features were collected and a review was conducted to identify the best number of features required for feature classification. To identify the appropriate number of features, the experiment consisted of deleting the least significant characteristics and measuring the classification accuracy. Figure 3 represents the complete feature selection process for DenseNet201 features to determine the optimal number of features. In the feature selection process, 33 features were selected. The selected features are portrayed below in order of significance, i.e., high to low (295, 439, 627, 365, 66, 605, 663, 456, 223, 86, 2, 132, 222, 11, 437, 12, 317, 76, 252, 399, 568, 7, 473, 508, 608, 74, 260, 154, 394, 982, 10, 299, 467). The feature representation in the J48 decision tree algorithm is presented as a Supplementary File as the size of the tree is large.

3.3. WNN-Based Classification (WiSARD Classifier)

A novel digital neuron was developed by Aleksander using RAM devices that worked on Boolean logic. The neural networks that adopted such RAM-based neurons were termed as weightless neural networks (WNN).
The learning processes of such networks were performed by transferring data in the form of truth tables present inside the RAM. The WNN node recognizes or learns only a specific part of the input pattern. Such patterns are provided with an address inside the RAM that formulates a mapping criterion that can be fed in a binarized form to the network. Figure 4a represents the basic difference between the weighted and weightless neural networks. In general, weightless neural networks are supported with RAM devices that store the significant image features as addresses (binary initialization). However, weighted neural networks assign weights for a complete set of features. The key advantage of using a weightless neural network over a weighted neural network relates to the representation and computation of the neural network. WNNs use memory locations and hashing, whereas weighted neural networks use weighted synapses to adjust the signal strength between neurons. WNNs are preferred over weighted neural networks in scenarios where memory resources are limited, i.e., resource-constrained environments. This advantage makes WNNs an attractive choice for certain real-world scenarios, especially in situations where minimizing memory overheads is crucial for optimal performance and scalability. WNNs were utilized in the present study due to the low computational resources required and to achieve a potential implementation for real-time application. Figure 4b represents a simplified view of a RAM network and neuron.
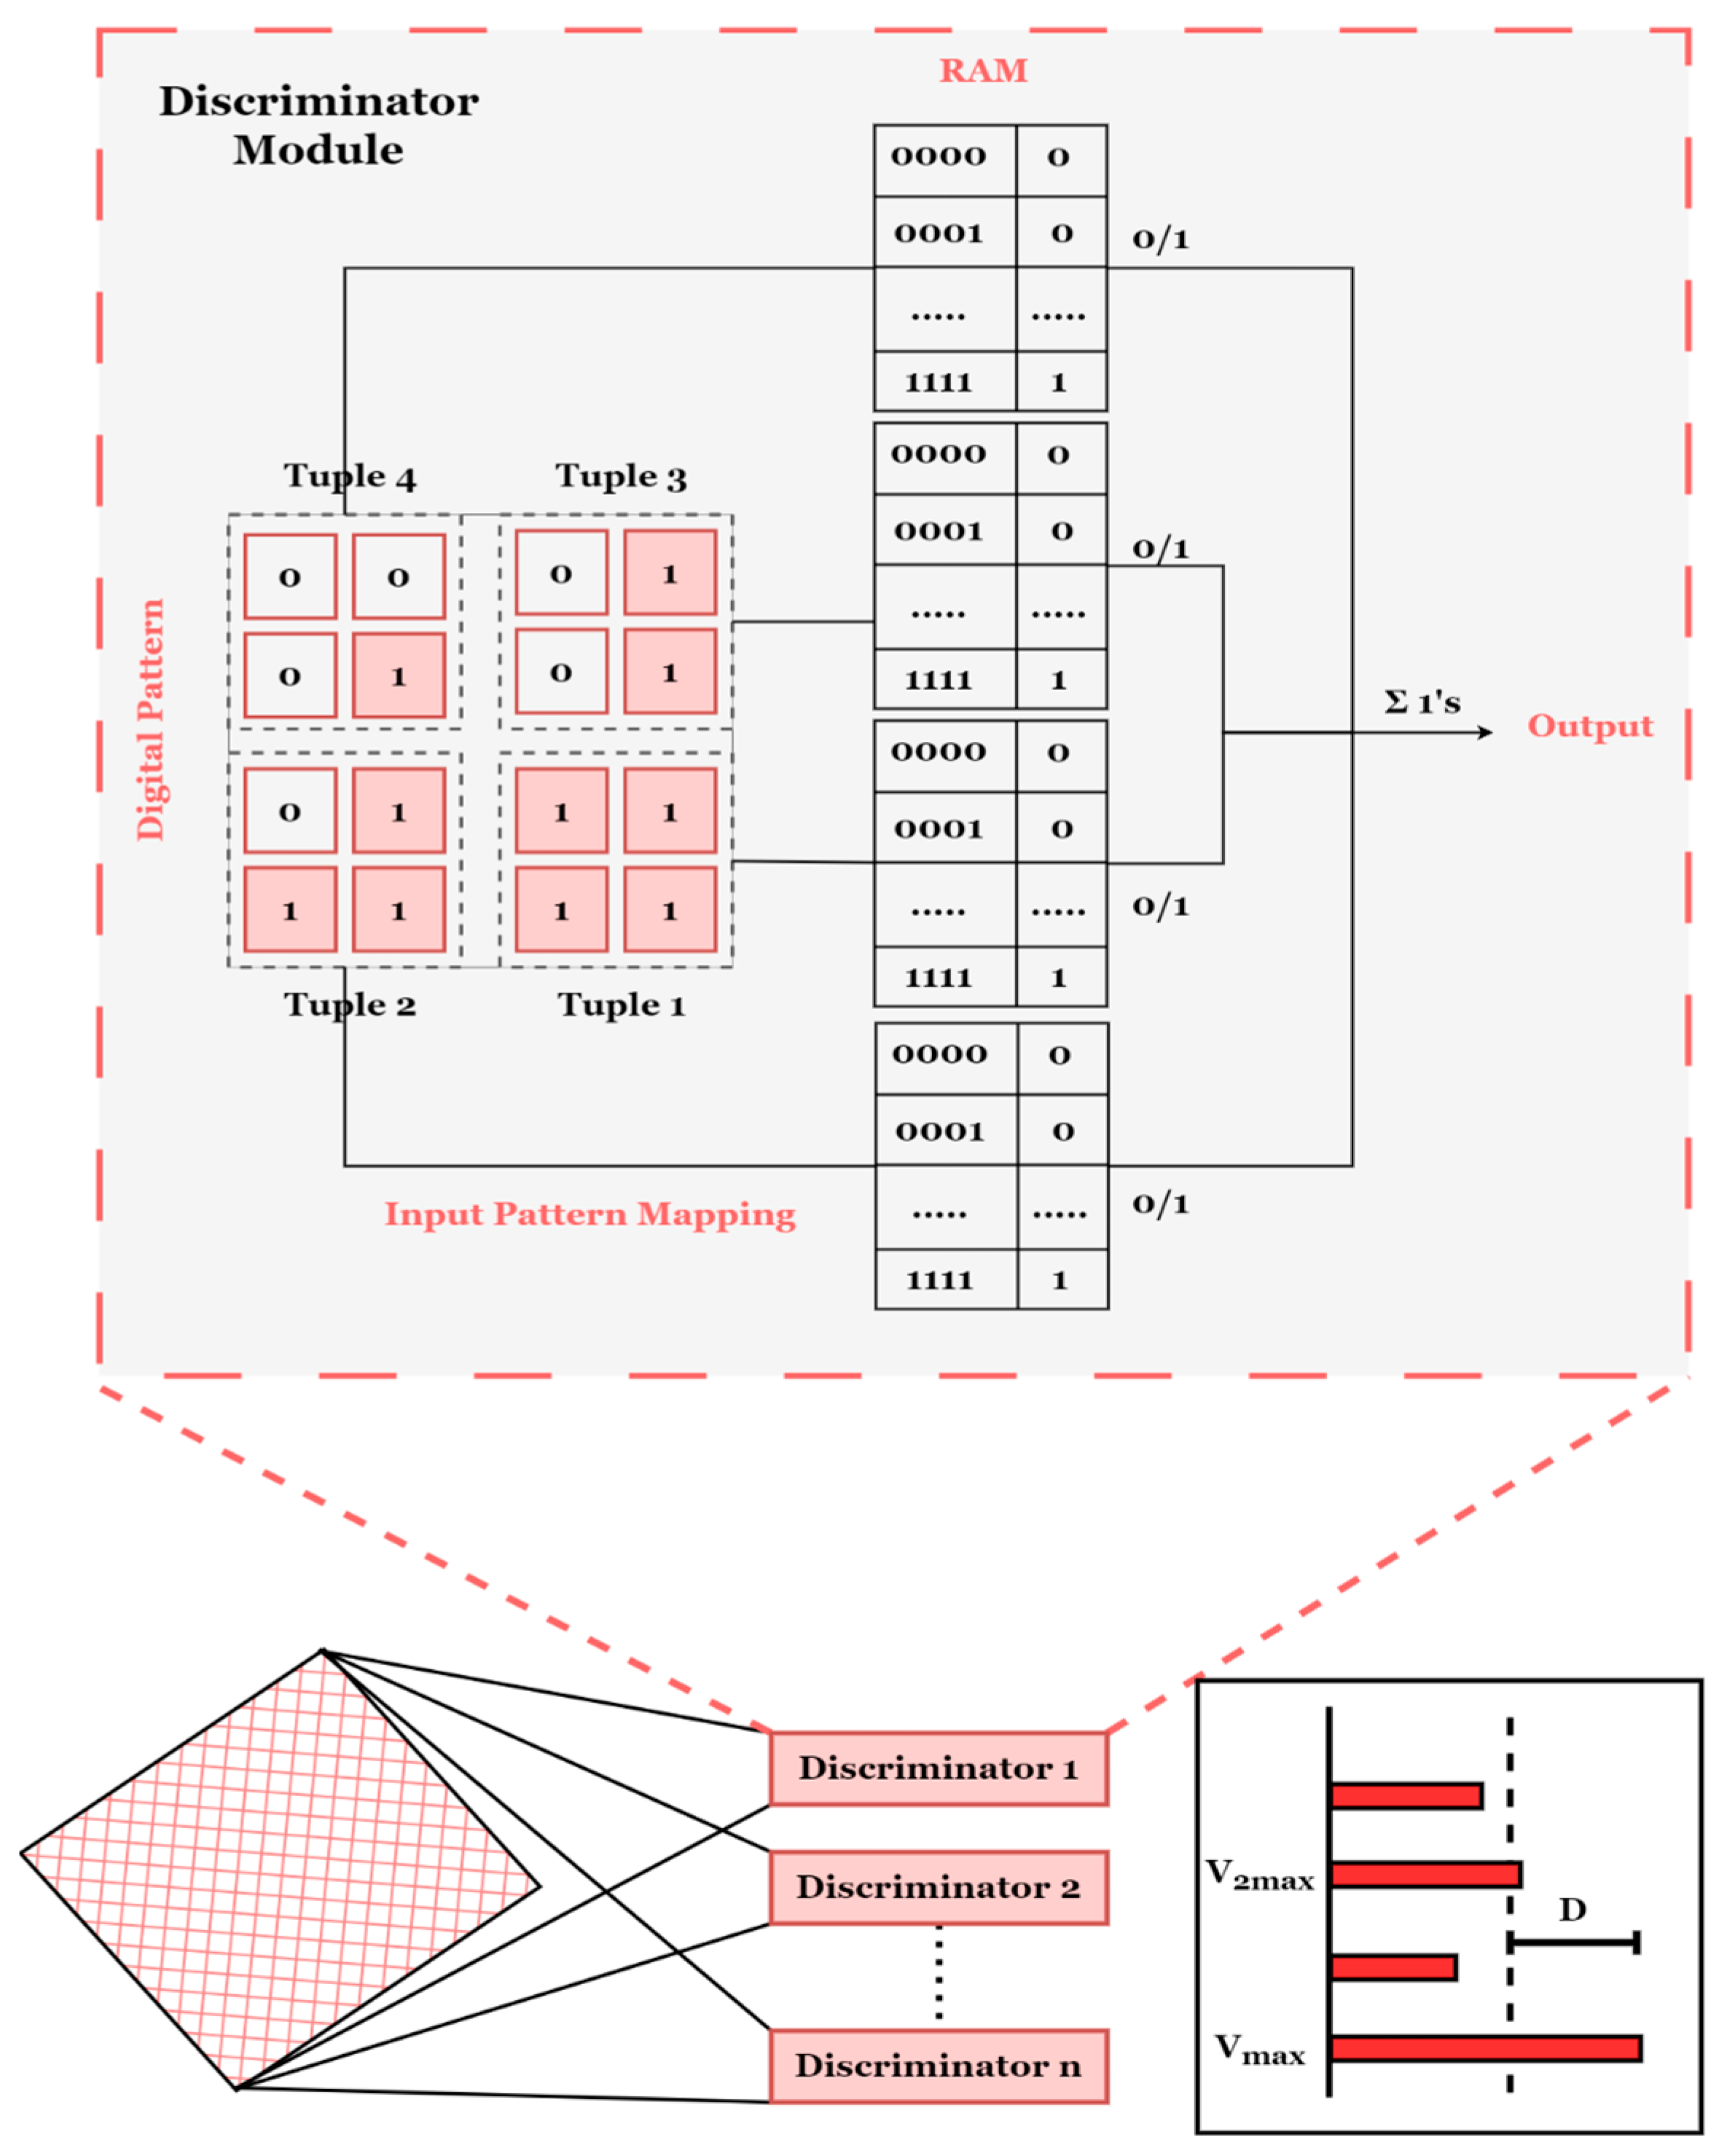
The output from a RAM network is designated with a value of either 0 or 1. WNNs composed of RAM devices can be applied with various architectures, among which, WiSARD is widely preferred. The complete structure of WiSARD consists of two or more discriminators corresponding to the number of user-defined classes. Each discriminator is assigned a particular class that is trained individually to learn the patterns of the assigned class. Figure 5 represents the outline of the WiSARD classifier with a discriminator module. The discriminator module consists of RAM devices that map the input patterns. The number of RAM devices in the discriminator module is determined by the mapped model generated from the input patterns. The RAM devices learn sub-patterns from the input pattern of the mapped model, which can be represented as a tuple. During the testing cycle, the memory address of every corresponding tuple is identified by the RAM device, which delivers the stored output value (0 or 1). The pattern of a particular class is determined by the highest sum delivered from the discriminator module. Additionally, the WiSARD classifier (apart from the calculated sum) determines a confidence factor C f calculated from Equation (1), which helps in delivering the classification.
C f = V m a x V 2 m a x V m a x  
In Equation (1), V m a x represents the highest sum obtained from the discriminator value, while V 2 m a x represents the second-highest value. In some scenarios, the highest value of the sum can be produced by two or more discriminators, leading to a zero-confidence factor. In such cases, a randomness criterion can be introduced to determine the winner. However, usage of the randomness criterion can have a negative impact on the performance of the WiSARD classifier. Additionally, the WiSARD classifier encounters another issue of RAM saturation, wherein all of the RAM addresses have been used. However, such problems are eliminated with the usage of the bleaching technique. The overall working of the WiSARD classifier can be performed in four individual steps, represented as follows:
  • Step 1—Selection of attributes
  • Step 2—Input pattern mapping through simple mapping, weighted moving average by hamming distance, weighted moving average by degree of membership, weighted moving average by simple exponential smoothing
  • Step 3—Structural determination of neural networks in the WiSARD classifier
  • Step 4—Combining or clustering of filters
  • Step 5—Training and testing of the WiSARD classifier

4. Results and Discussion

The present study aimed to evaluate the performance of a WNN (WiSARD classifier) in detecting visible faults in PV modules. The performance of the classifier was evaluated for six PV module conditions considered. Various hyperparameters of the WiSARD classifier such as bit number, bleach confidence, bleach flag, map type and tic number were tested to determine the optimal values that achieve the highest classification accuracy. The obtained results demonstrate the feasibility of the proposed method and its potential for real-time application. The dataset was primarily split into a train test ratio of 0.8:0.2, while validation was carried out using ten-fold cross-validation. The obtained results are presented in the following subsections. The image resizing and feature extraction processes were carried out in the desktop version of MATLAB 2019b using the deep learning toolbox. Feature selection and classification were performed with Weka, a data mining tool.

4.1. Impact of Changing the ‘Bit Number’

The bit number in the WiSARD classifier determines the number of bits in the input data’s sparse distributed representation (SDR). The number of bits used can impact the classifier capacity and resolution. The term ‘bits’ refers to the individual binary units that are utilized to represent information. WiSARD is a pattern recognition method that employs a set of randomly initialized binary bit cells to identify input patterns. Table 4 represents the impact of changing the bit number on various accuracies. The value with the highest accuracies achieved was selected as the optimal value that was fixed while passing onto the next hyperparameter change. To perform a fair experimentation, all other parameters except bit number were kept constant (default values). Based on the results obtained in Table 4, it can be inferred that for a bit number value of 32, all the accuracies displayed higher values. Hence, bit number 32 was selected as the optimal value.

4.2. Impact of Changing Bleach Confidence

The bleach confidence parameter in the WiSARD classifier modifies the prediction confidence based on the similarity between the incoming and stored patterns. If the input pattern matches one of the stored patterns, confidence is enhanced; otherwise, confidence is lowered. This change improves the prediction accuracy of the classifier. The bleach confidence values that were tuned for this study are presented in Table 5. The results obtained as shown in Table 5 infer that the validation accuracies changed, while training and testing accuracies remained constant. Based on the displayed results, one can conclude that for a bleach value of 1.00, the WiSARD classifier displayed higher accuracies than for other values of bleach confidence.

4.3. Impact of Changing the ‘Bleach Flag’

The bleach flag of the WiSARD classifier acts as a Boolean indication that decides whether the prediction confidence should be changed or not. If the flag is set to true, the bleach confidence procedure is used to alter the confidence value. If the flag is set to false, no confidence modification is applied. Control over when and how confidence modifications are performed in the decision-making process of the classifier is provided by the bleach flag. Since the bleach flag is a Boolean indication, there are only two parameters, namely, true or false. Table 6 represents the obtained values for bleach flag variation.

4.4. Impact of Changing the ‘Bleach Step’

In neural networks, the bleaching process is used in order to combat overfitting, which happens when a model gets overly specialized on training input. Regularization, dropout, early stopping and modifying the model architecture are all frequent techniques. The bleach step hyperparameter controls the pace of bleaching. A lower bleach step value results in slower bleaching, whereas a higher value speeds up the bleaching process. Table 7 provides a clear insight into the impact of the bleach step over classification accuracies. Based on the results obtained in Table 7, a bleach step value of 1 was assigned as the optimal value.

4.5. Impact of the ‘Map Type’ Hyperparameter

The term ‘map types’ refers to various methods for mapping input patterns to the classifier bit cells. Map types govern how the input characteristics are distributed and related to bits in bit cells, which can have an impact on classification performance. The WiSARD classifier employs two map types: linear and random.
  • Linear map: The input characteristics are spread and sequentially related to the bits in the linear map type. Each feature is assigned to a different bit, resulting in a linear mapping from the input pattern to the bit cells. This means that the first feature is linked to the first bit, the second to the second bit and so on. The linear map offers a simple and predictable mapping pattern.
  • Random map: The input characteristics are dispersed and linked to the bits at random in the random map type. The mapping from the input pattern to the bit cells is non-sequential, i.e., random. Irrespective of the order, any feature can link to any of the bits in the bit cells. The random map adds more variety and randomization to the mapping process.
The WiSARD classifier’s performance and behavior can be influenced by the map type used. The linear map provides a systematic and predictable mapping pattern that may be useful in particular situations. The random map, on the other hand, provides unpredictability and can increase the classifier's capacity to handle diverse types of input and generalization. The impact of map type is presented in Table 8.

4.6. Impact of the ‘Tic Number’ Hyperparameter

The tic number in the WiSARD classifier refers to the number of bits in each bit cell. It determines bit cell memory capacity and resolution. Higher tic numbers provide finer-grained memory representation; however, this can be at the expense of increased memory utilization and computational complexity. Tic numbers represent a trade-off between memory capacity and computing efficiency. To optimize classifier performance, they are often determined through trial and error. Table 9 provides a clear insight into the impact of tic numbers on the performance of the WiSARD classifier. One can clearly observe from Table 9 that for a value of 256, the highest possible accuracies were obtained.

4.7. Optimal Hyperparameter Selection

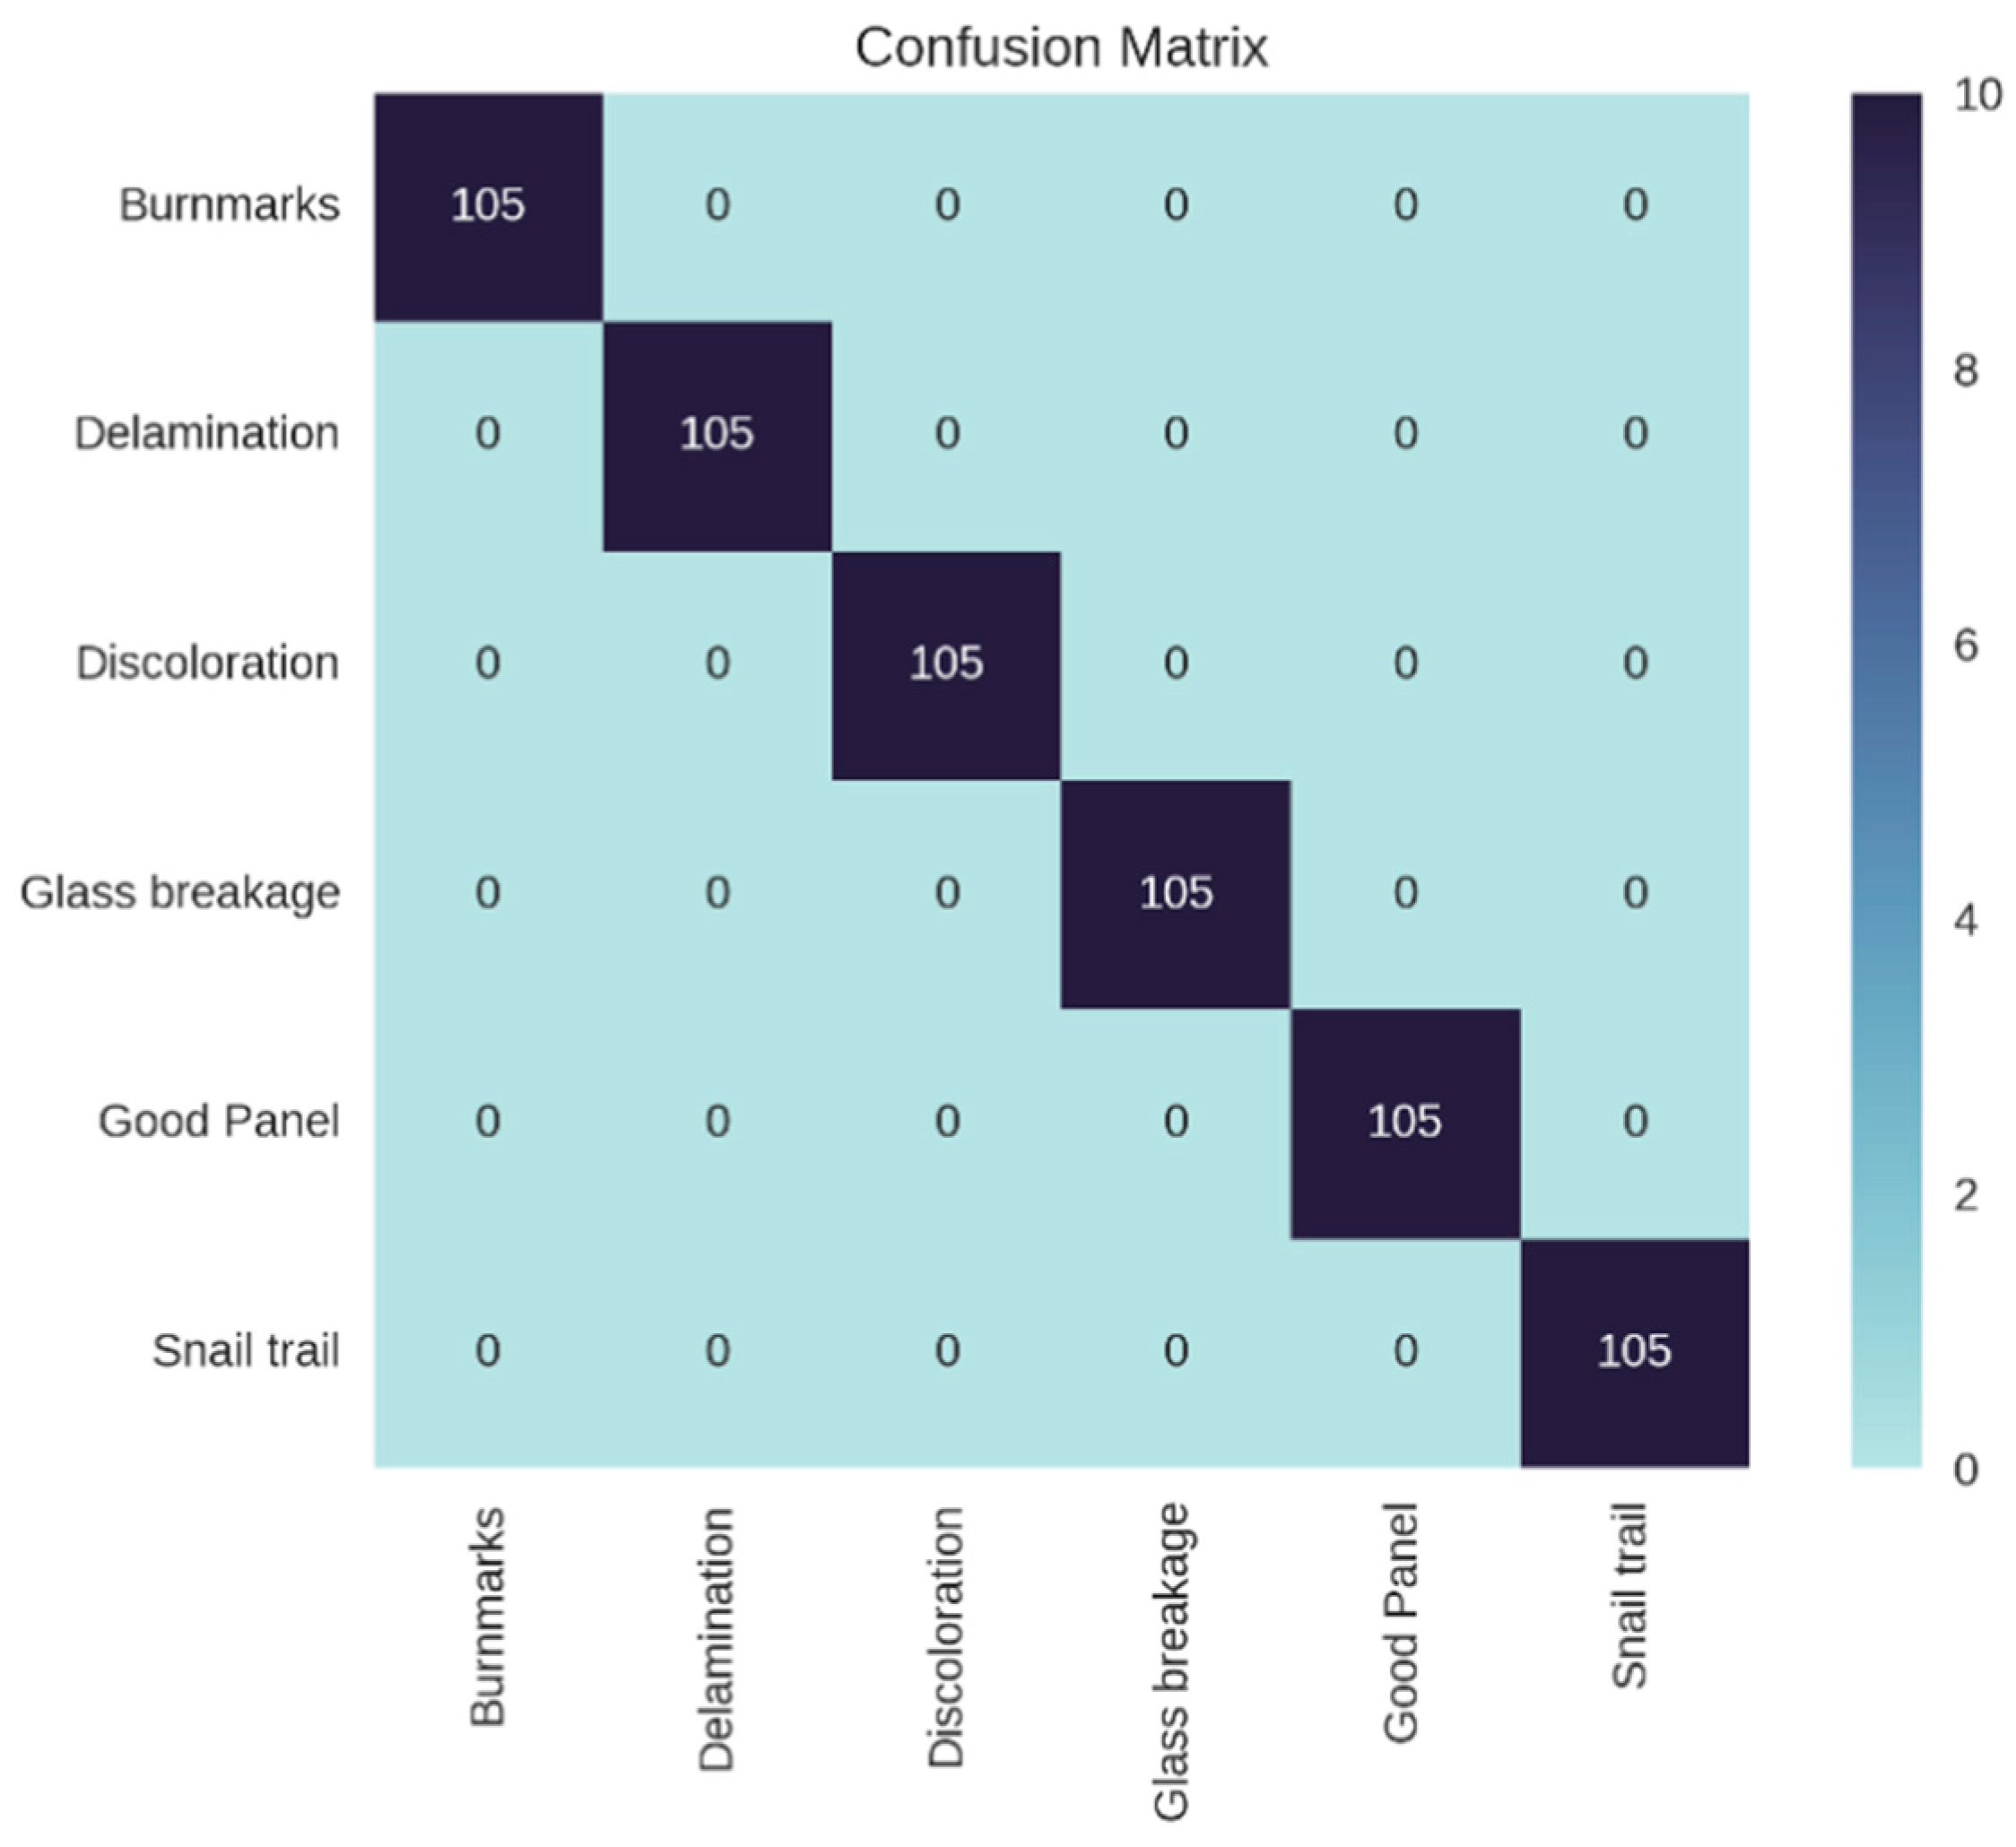
Table 10 presents the optimal hyperparameter selection based on the experiments carried out in the aforementioned sections. The model performance with the optimal hyperparameter settings was evaluated with the aid of the confusion matrix represented in Figure 6. A confusion matrix is a table used to evaluate the performance of a classification algorithm. The matrix summarizes the predictions made by the algorithm on a set of test data, comparing the predicted labels with the true labels. The matrix represents a multiclass classification that separates faulty and non-faulty suspension systems, respectively. According to the matrix in Figure 6, the model demonstrated a high level of accuracy in classifying instances by correctly identifying all 630 instances accurately. Notably, the model exhibited a remarkably short testing time of just 1.44 s, representing potential applicability in real-time fault diagnosis systems. This study emphasizes the significance of employing the WiSARD classifier with 32 bits and 256 tics as this configuration led to accurate classification. Moreover, the study successfully demonstrated the effectiveness of the proposed fault diagnosis method that utilizes the WiSARD classifier.

4.8. Comparison with Other Studies

The performance of the proposed WiSARD classifier was compared and evaluated with various state-of-the-art techniques. Table 11 represents the performance comparison that details the classification accuracy achieved over the years. Based on the observations, one can suggest that the proposed WiSARD classifier outclasses the state-of-the-art works.

5. Conclusions

The present study used a WNN to categorize several PV module conditions using RGB images acquired from a UAV. A hybrid approach involving features extracted from DenseNet 201 (deep learning) followed by selection (J48 decision tree) and classification (WiSARD) was performed to determine the effectiveness of deep learning and machine learning algorithms for fault diagnosis problems. The impact of using the WNN over weighted neural networks was evaluated with several state-of-the-art comparisons. Additionally, to derive the maximum output from the WiSARD classifier, several hyperparameters were tested to determine the optimal hyperparameter setting. The obtained results show that the WiSARD classifier with DenseNet 201 features can achieve 100.00% accuracy with optimal hyperparameter settings, as mentioned in Table 10. Furthermore, the test results were derived in a minimum computational time of 1.44 s, emphasizing the method’s feasibility to be applied to real-time scenarios. The proposed work can help in accurate and instantaneous fault diagnosis that can help enhance the lifespan, reliability and safety of PV modules. The presented methodology can be deployed for real-time monitoring systems for instantaneous results. In the future, the computational effective solutions can be developed to provide cost benefits for investors.

Supplementary Materials

The following supporting information can be downloaded at https://www.mdpi.com/article/10.3390/en16155824/s1, File S1: J48 representation of DenseNet 201 features selected.

Author Contributions

Conceptualization, N.V.S. and S.V.; methodology, N.V.S., S.V. and J.V.J.; software, M.A. and N.V.S.; validation, J.V.J., N.V.S. and S.V.; formal analysis, M.A.; investigation, J.V.J. and N.V.S.; resources, S.V.; data curation, N.V.S.; writing—original draft preparation, N.V.S.; writing—review and editing, M.A. and S.V.; visualization, M.A.; supervision, S.V. and M.A.; project administration, S.V. and M.A. All authors have read and agreed to the published version of the manuscript.

Funding

This research received no external funding.

Data Availability Statement

Data will be made available upon request to the corresponding author.

Acknowledgments

The authors would like to thank the management teams of VIT Chennai and NTNU, Norway, for their moral and technical support.

Conflicts of Interest

The authors declare no conflict of interest.

References

  1. IRENA. World Energy Transitions Outlook: 1.5 °C Pathway; IRENA: Masdar City, United Arab Emirates, 2022. [Google Scholar]
  2. Bahar, N.H.A.; Lo, M.; Sanjaya, M.; Van Vianen, J.; Alexander, P.; Ickowitz, A.; Sunderland, T. Meeting the food security challenge for nine billion people in 2050: What impact on forests? Glob. Environ. Chang. 2020, 62, 102056. [Google Scholar]
  3. Li, Z.; Luan, R.; Lin, B. The trend and factors affecting renewable energy distribution and disparity across countries. Energy 2022, 254, 124265. [Google Scholar] [CrossRef]
  4. Yoro, K.O.; Daramola, M.O. CO2 emission sources, greenhouse gases, and the global warming effect. In Advances in Carbon Capture: Methods, Technologies and Applications; Elsevier: Amsterdam, The Netherlands, 2020. [Google Scholar]
  5. Hassan, R.; Das, B.K.; Hasan, M. Integrated off-grid hybrid renewable energy system optimization based on economic, environmental, and social indicators for sustainable development. Energy 2022, 250, 123823. [Google Scholar] [CrossRef]
  6. Kellil, N.; Aissat, A.; Mellit, A. Fault diagnosis of photovoltaic modules using deep neural networks and infrared images under Algerian climatic conditions. Energy 2023, 263, 125902. [Google Scholar] [CrossRef]
  7. Mellit, A.; Tina, G.M.; Kalogirou, S.A. Fault detection and diagnosis methods for photovoltaic systems: A review. Renew. Sustain. Energy Rev. 2018, 91, 1–17. [Google Scholar] [CrossRef]
  8. Wang, H.; Zhao, J.; Sun, Q.; Zhu, H. Probability modeling for PV array output interval and its application in fault diagnosis. Energy 2019, 189, 116248. [Google Scholar] [CrossRef]
  9. Aboagye, B.; Gyamfi, S.; Ofosu, E.A.; Djordjevic, S. Degradation analysis of installed solar photovoltaic (PV) modules under outdoor conditions in Ghana. Energy Rep. 2021, 7, 6921–6931. [Google Scholar] [CrossRef]
  10. Chouder, A.; Silvestre, S. Automatic supervision and fault detection of PV systems based on power losses analysis. Energy Convers. Manag. 2010, 51, 1929–1937. [Google Scholar] [CrossRef]
  11. Gallardo-Saavedra, S.; Hernández-Callejo, L.; Alonso-García, M.d.C.; Santos, J.D.; Morales-Aragonés, J.I.; Alonso-Gómez, V.; Moreton, A.; Gonzalez, M.A.; Martinez-Sacristan, O. Nondestructive characterization of solar PV cells defects by means of electroluminescence, infrared thermography, I–V curves and visual tests: Experimental study and comparison. Energy 2020, 205, 117930. [Google Scholar] [CrossRef]
  12. Dhimish, M.; Holmes, V.; Mehrdadi, B.; Dales, M. The impact of cracks on photovoltaic power performance. J. Sci. Adv. Mater. Devices 2017, 2, 199–209. [Google Scholar] [CrossRef]
  13. Hu, Y.; Zhang, J.; Wu, J.; Cao, W.; Tian, G.Y.; Kirtley, J.L. Efficiency Improvement of Nonuniformly Aged PV Arrays. IEEE Trans. Power Electron. 2016, 32, 1124–1137. [Google Scholar] [CrossRef] [Green Version]
  14. Akram, M.W.; Li, G.; Jin, Y.; Chen, X.; Zhu, C.; Zhao, X.; Khaliq, A.; Faheem, M.; Ahmad, A. CNN based automatic detection of photovoltaic cell defects in electroluminescence images. Energy 2019, 189, 116319. [Google Scholar] [CrossRef]
  15. Chen, H.; Zhao, H.; Han, D.; Liu, K. Accurate and robust crack detection using steerable evidence filtering in electroluminescence images of solar cells. Opt. Lasers Eng. 2019, 118, 22–33. [Google Scholar] [CrossRef]
  16. Sridharan, N.V.; Sugumaran, V. Convolutional Neural Network based Automatic Detection of Visible Faults in a Photovoltaic Module. Energy Sources Part A Recovery Util. Environ. Eff. 2021, 1–16. [Google Scholar] [CrossRef]
  17. S, N.V.; Sugumaran, V. Fault diagnosis of visual faults in photovoltaic modules: A Review. Int. J. Green Energy 2020, 18, 37–50. [Google Scholar] [CrossRef]
  18. Lindahl, J.; Lingfors, D.; Elmqvist, Å.; Mignon, I. Economic analysis of the early market of centralized photovoltaic parks in Sweden. Renew. Energy 2022, 185, 1192–1208. [Google Scholar] [CrossRef]
  19. Ullah, N.; Sami, I.; Jamal Babqi, A.; Alkhammash, I.H.; Belkhier, Y.; Althobaiti, A. Processor in the Loop Verification of Fault Tolerant Control for a Three Phase Inverter in Grid Connected PV System. Energy Sources Part A Recovery Util. Environ. Eff. 2023, 45, 3760–3776. [Google Scholar] [CrossRef]
  20. Fonseca Alves, R.H.; Deus Júnior, G.A.d.; Marra, E.G.; Lemos, R.P. Automatic fault classification in photovoltaic modules using Convolutional Neural Networks. Renew. Energy 2021, 179, 502–516. [Google Scholar] [CrossRef]
  21. Otamendi, U.; Martinez, I.; Quartulli, M.; Olaizola, I.G.; Viles, E.; Cambarau, W. Segmentation of cell-level anomalies in electroluminescence images of photovoltaic modules. Sol. Energy 2021, 220, 914–926. [Google Scholar] [CrossRef]
  22. Mellit, A.; Kalogirou, S. Artificial intelligence and internet of things to improve efficacy of diagnosis and remote sensing of solar photovoltaic systems: Challenges, recommendations and future directions. Renew. Sustain. Energy Rev. 2021, 143, 110889. [Google Scholar]
  23. Sridharan, N.V.; Sugumaran, V. Visual fault detection in photovoltaic modules using decision tree algorithms with deep learning features. Energy Sources Part A Recovery Util. Environ. Eff. 2021, 1–17. [Google Scholar] [CrossRef]
  24. Sizkouhi, A.M.; Aghaei, M.; Esmailifar, S.M. A deep convolutional encoder-decoder architecture for autonomous fault detection of PV plants using multi-copters. Sol. Energy 2021, 223, 217–228. [Google Scholar] [CrossRef]
  25. Tsanakas, J.A.; Botsaris, P.N. Passive and Active Thermographic Assessment as a Tool for Condition-Based Performance Monitoring of Photovoltaic Modules. J. Sol. Energy Eng. 2011, 133, 021012. [Google Scholar] [CrossRef]
  26. Tsanakas, J.A.; Botsaris, P.N. An infrared thermographic approach as a hot-spot detection tool for photovoltaic modules using image histogram and line profile analysis. Int. J. Cond. Monit. 2012, 2, 22–30. [Google Scholar] [CrossRef]
  27. Tsanakas, J.A.; Ha, L.; Buerhop, C. Faults and infrared thermographic diagnosis in operating c-Si photovoltaic modules: A review of research and future challenges. Renew. Sustain. Energy Rev. 2016, 62, 695–709. [Google Scholar] [CrossRef]
  28. Baig, H.; Jani, R.; Markam, B.K.; Maiti, S.; Mallick, T.K. Modelling and experimental analysis of a seasonally tracked V-trough PV/T system in India. Sol. Energy 2018, 170, 618–632. [Google Scholar] [CrossRef]
  29. Eskandari, A.; Milimonfared, J.; Aghaei, M. Line-line fault detection and classification for photovoltaic systems using ensemble learning model based on I-V characteristics. Sol. Energy 2020, 211, 354–365. [Google Scholar] [CrossRef]
  30. Grimaccia, F.; Leva, S.; Dolara, A.; Aghaei, M. Survey on PV Modules’ Common Faults After an O&M Flight Extensive Campaign Over Different Plants in Italy. IEEE J. Photovolt. 2017, 7, 810–816. [Google Scholar] [CrossRef] [Green Version]
  31. Grimaccia, F.; Leva, S.; Niccolai, A.; Cantoro, G. Assessment of PV Plant Monitoring System by Means of Unmanned Aerial Vehicles. In Proceedings of the 2018 IEEE International Conference on Environment and Electrical Engineering and 2018 IEEE Industrial and Commercial Power Systems Europe, EEEIC/I and CPS Europe 2018, Palermo, Italy, 12–15 June 2018. [Google Scholar]
  32. Tsanakas, J.A.; Ha, L.D.; Al Shakarchi, F. Advanced inspection of photovoltaic installations by aerial triangulation and terrestrial georeferencing of thermal/visual imagery. Renew. Energy 2017, 102, 224–233. [Google Scholar] [CrossRef]
  33. Leva, S.; Aghaei, M.; Grimaccia, F. PV power plant inspection by UAS: Correlation between altitude and detection of defects on PV modules. In Proceedings of the 2015 IEEE 15th International Conference on Environment and Electrical Engineering, EEEIC 2015—Conference Proceedings, Rome, Italy, 10–13 June 2015. [Google Scholar]
  34. Tsanakas, J.; Chrysostomou, D.; Botsaris, P.; Gasteratos, A. Fault diagnosis of photovoltaic modules through image processing and Canny edge detection on field thermographic measurements. Int. J. Sustain. Energy 2013, 34, 351–372. [Google Scholar] [CrossRef]
  35. Li, X.; Yang, Q.; Chen, Z.; Luo, X.; Yan, W. Visible defects detection based on UAV-based inspection in large-scale photovoltaic systems. IET Renew. Power Gener. 2017, 11, 1234–1244. [Google Scholar] [CrossRef]
  36. Dashtdar, M.; Sarada, K.; Hosseinimoghadam, S.M.S.; Kalyan, C.H.N.S.; Venkateswarlu, A.N.; Goud, B.S.; Reddy, C.H.R.; Belkhier, Y.; Bajaj, M.; Reddy, B.N. Faulted Section Identification and Fault Location in Power Network Based on Histogram Analysis of Three-phase Current and Voltage Modulated. J. Electr. Eng. Technol. 2022, 17, 2631–2647. [Google Scholar] [CrossRef]
  37. Venkatesh, S.N.; Sugumaran, V. A combined approach of convolutional neural networks and machine learning for visual fault classification in photovoltaic modules. Proc. Inst. Mech. Eng. Part O J. Risk Reliab. 2021, 236, 148–159. [Google Scholar] [CrossRef]
  38. Muturatnam, A.B.; Sridharan, N.V.; Sreelatha, A.P.; Vaithiyanathan, S. Enhanced Tyre Pressure Monitoring System for Nitrogen Filled Tyres Using Deep Learning. Machines 2023, 11, 434. [Google Scholar] [CrossRef]
  39. Venkatesh, S.N.; Balaji, P.A.; Elangovan, M.; Annamalai, K.; Indira, V.; Sugumaran, V.; Mahamuni, V.S. Transfer Learning-Based Condition Monitoring of Single Point Cutting Tool. Comput. Intell. Neurosci. 2022, 2022, 3205960. [Google Scholar] [CrossRef]
  40. Venkatesh, S.N.; Chakrapani, G.; Senapti, S.B.; Annamalai, K.; Elangovan, M.; Indira, V.; Sugumaran, V.; Mahamuni, V.S. Misfire Detection in Spark Ignition Engine Using Transfer Learning. Comput. Intell. Neurosci. 2022, 2022, 7606896. [Google Scholar] [CrossRef]
  41. Venkatesh, S.N.; Sugumaran, V. Fault Detection in aerial images of photovoltaic modules based on Deep learning. IOP Conf. Ser. Mater. Sci. Eng. 2021, 1012, 012030. [Google Scholar] [CrossRef]
  42. Chouay, Y.; Ouassaid, M. A Multi-stage SVM Based Diagnosis Technique for Photovoltaic PV Systems. In Advances in Intelligent Systems and Computing, 1350 AISC; Springer: Berlin/Heidelberg, Germany, 2021; pp. 183–193. [Google Scholar]
  43. Niazi, K.A.K.; Akhtar, W.; Khan, H.A.; Yang, Y.; Athar, S. Hotspot diagnosis for solar photovoltaic modules using a Naive Bayes classifier. Sol. Energy 2019, 190, 34–43. [Google Scholar] [CrossRef]
  44. Naveen Venkatesh, S.; Sugumaran, V. Machine vision based fault diagnosis of photovoltaic modules using lazy learning approach. Meas. J. Int. Meas. Confed. 2022, 191, 110786. [Google Scholar] [CrossRef]
  45. Aleksander, I. Adaptive systems of logic networks and binary memories. In Proceedings of the AFIPS Conference Proceedings—1967 Spring Joint Computer Conference, AFIPS 1967, Atlantic, NJ, USA, 18–20 April 1967. [Google Scholar]
  46. Lei, Y.; He, Z.; Zi, Y. EEMD method and WNN for fault diagnosis of locomotive roller bearings. Expert Syst. Appl. 2011, 38, 7334–7341. [Google Scholar] [CrossRef]
  47. De Souza, A.F.; Freitas, F.D.; De Almeida, A.G.C. High performance prediction of stock returns with VG-RAM weightless neural networks. In Proceedings of the 3rd Workshop on High Performance Computational Finance, WHPCF 2010, New Orleans, LA, USA, 14 November 2010. [Google Scholar]
  48. Cardoso, D.O.; Lima, P.M.V.; de Gregorio, M.; Gama, J.; França, F.M.G. Clustering data streams with weightless neural networks. In Proceedings of the ESANN 2011—19th European Symposium on Artificial Neural Networks, Bruges, Belgium, 27–29 April 2011. [Google Scholar]
  49. McElroy, B.; Howells, G. Automated adaptation of input and output data for a weightless artificial neural network. Int. J. Database Theory Appl. 2011, 4, 37–46. [Google Scholar]
  50. Subhashini, R.; Nagarajan, E.; Niveditha, P.R. Detection of an incognitos intruder in industries and semantic mapping of emotions. Int. J. Appl. Eng. Res. 2014, 9, 6727–6734. [Google Scholar]
  51. Grieco, B.P.A.; Lima, P.M.V.; De Gregorio, M.; França, F.M.G. Producing pattern examples from “mental” images. Neurocomputing 2010, 73, 1057–1064. [Google Scholar] [CrossRef]
  52. De Gregorio, M.; Giordano, M. Change detection with weightless neural networks. In Proceedings of the IEEE Computer Society Conference on Computer Vision and Pattern Recognition Workshops, Columbus, OH, USA, 23–28 June 2014. [Google Scholar]
  53. Cardoso, D.; De Gregorio, M.; Lima, P.; Gama, J.; França, F. A weightless neural network-based approach for stream data clustering. In Lecture Notes in Computer Science (Including Subseries Lecture Notes in Artificial Intelligence and Lecture Notes in Bioinformatics); Springer: Berlin/Heidelberg, Germany, 2012. [Google Scholar]
  54. Köntges, M.; Kurtz, S.; Packard, C.E.; Jahn, U.; Berger, K.; Kato, K.; Friesen, T.; Liu, H.; Van Iseghem, M. Review of Failures of Photovoltaic Modules; IEA-PVPS T13-01:2014; IEA: Paris, France, 2014. [Google Scholar]
  55. Chandel, S.; Naik, M.N.; Sharma, V.; Chandel, R. Degradation analysis of 28 year field exposed mono-c-Si photovoltaic modules of a direct coupled solar water pumping system in western Himalayan region of India. Renew. Energy 2015, 78, 193–202. [Google Scholar] [CrossRef]
  56. Dolara, A.; Lazaroiu, G.C.; Leva, S.; Manzolini, G.; Votta, L. Snail Trails and Cell Microcrack Impact on PV Module Maximum Power and Energy Production. IEEE J. Photovolt. 2016, 6, 1269–1277. [Google Scholar] [CrossRef] [Green Version]
  57. Sánchez-Friera, P.; Piliougine, M.; Peláez, J.; Carretero, J.; De Cardona, M.S. Analysis of degradation mechanisms of crystalline silicon PV modules after 12 years of operation in Southern Europe. Prog. Photovolt. Res. Appl. 2011, 19, 658–666. [Google Scholar] [CrossRef]
  58. Jeong, J. Microelectronics Reliability Effect of EVA discoloration in 25-year-old single crystalline silicon photovoltaic modules operated under moderate climate. Microelectron. Reliab. 2022, 138, 114721. [Google Scholar] [CrossRef]
  59. Mehta, S.; Azad, A.P.; Chemmengath, S.A.; Raykar, V.; Kalyanaraman, S. DeepSolarEye: Power Loss Prediction and Weakly Supervised Soiling Localization via Fully Convolutional Networks for Solar Panels. In Proceedings of the 2018 IEEE Winter Conference on Applications of Computer Vision, WACV 2018, Lake Tahoe, NV, USA, 12–15 March 2018; pp. 333–342. [Google Scholar]
  60. Wang, J.; Zhao, B.; Yao, X. PV Abnormal Shading Detection Based on Convolutional Neural Network. In Proceedings of the 32nd Chinese Control and Decision Conference, Hefei, China, 22–24 August 2020; pp. 1580–1583. [Google Scholar] [CrossRef]
  61. Li, X.; Yang, Q.; Wang, J.; Chen, Z.; Yan, W. Intelligent fault pattern recognition of aerial photovoltaic module images based on deep learning technique. In Proceedings of the IMCIC 2018—9th International Multi-Conference on Complexity, Informatics and Cybernetics, Proceedings 2018, Orlando, FL, USA, 13–16 March 2018; Volume 1, pp. 22–27. [Google Scholar]
  62. Chen, H.; Pang, Y.; Hu, Q.; Liu, K. Solar cell surface defect inspection based on multispectral convolutional neural network. J. Intell. Manuf. 2018, 31, 453–468. [Google Scholar] [CrossRef] [Green Version]
  63. Li, X.; Yang, Q.; Lou, Z.; Yan, W. Deep Learning Based Module Defect Analysis for Large-Scale Photovoltaic Farms. IEEE Trans. Energy Convers. 2018, 34, 520–529. [Google Scholar] [CrossRef]
  64. Sridharan, N.V.; Sugumaran, V. Deep learning-based ensemble model for classification of photovoltaic module visual faults. Energy Sources Part A Recovery Util. Environ. Eff. 2022, 44, 5287–5302. [Google Scholar] [CrossRef]
Figure 1. An overview of the proposed PV module data acquisition process.
Energies 16 05824 g001
Figure 2. The complete methodology of the proposed WiSARD classifier.
Energies 16 05824 g002
Figure 3. Feature selection process using DenseNet-201.
Energies 16 05824 g003
Figure 4. (a) Simple difference among weightless and weighted neural networks. (b) A simplified view of RAM network and neuron (RAM devices).
Energies 16 05824 g004
Figure 5. WiSARD classifier with discriminator module.
Energies 16 05824 g005
Figure 6. Confusion matrix of WiSARD classifier with optimal hyperparameters.
Energies 16 05824 g006
Table 1. Specifications of the PV module manufactured by Udhaya Semiconductors Limited.
Model NameEfficiencyNumber of CellsTypeWeightCurrentMaximum PowerMaximum Power Point Current
(Impp)
Dimensions
USP-369–10%36Monocrystalline3.5 kg2.25 A36 W2.1(1011 × 435 × 36) mm
Table 2. Image transforms applied to the acquired dataset.
Transformation OperationNoiseAngle of
Rotation
BlurFlip AngleWarp
ValueRandom0–180°Gaussian90°40
Table 3. A detailed description of PV module faults.
S. No.Visual Faults in PVMReason for Occurrence of FaultEffect on ModulesImages
1Burn marks [54]Solder bond failure, ribbon ripping, localized heating.Safety risks and a drop in performance.Energies 16 05824 i001
2Glass breakage [55]Thermal stresses, physical injury induced during installation and travel.Lower radiance, corrosion and moisture invasion.Energies 16 05824 i002
3Snail trail [56]Microcracks around borders caused by stress.Quicker degradation.Energies 16 05824 i003
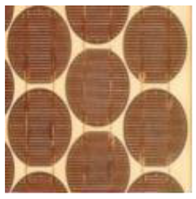
4Delamination [57]Adhesion failure between the glass, encapsulant and back cover.Moisture ingresses caused by corrosion.Energies 16 05824 i004
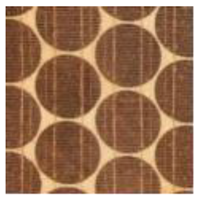
5Discoloration [58]Increased heat, humidity and UV radiation exposure.Power loss, physical color changes in modules (yellowing or browning).Energies 16 05824 i005
Table 4. Performance of WiSARD classifier by varying bit number.
Bit NumberTraining Set Accuracy (%)Cross Validation Accuracy (%)Test Set Accuracy
(%)
4100.0099.2899.68
8100.0099.48100.00
16100.0099.80100.00
32100.0099.92100.00
Table 5. Performance of WiSARD classifier by varying bleach confidence.
Bleach ConfidenceTraining Set Accuracy (%)Cross Validation Accuracy (%)Test Set Accuracy (%)
0.60100.0099.74100.00
0.70100.0099.7099.84
0.80100.0099.76100.00
0.90100.0099.80100.00
1.00100.0099.84100.00
Table 6. Performance of WiSARD classifier by varying bleach flag.
Bleach FlagTraining Set Accuracy (%)Cross Validation Accuracy (%)Test Set Accuracy (%)
TRUE58.3346.5440.47
FALSE100.0099.84100.00
Table 7. Performance of WiSARD classifier by varying bleach step.
Bleach StepTraining Set Accuracy (%)Cross Validation Accuracy (%)Test Set Accuracy (%)
1100.0099.88100.00
2100.0099.76100.00
5100.0099.76100.00
10100.0099.84100.00
Table 8. Performance of WiSARD classifier by varying map type.
Map TypeTraining Set Accuracy (%)Cross Validation Accuracy (%)Test Set Accuracy (%)
RANDOM100.0099.88100.00
LINEAR100.0090.9191.58
Table 9. Performance of WiSARD classifier by varying tic number.
Tic NumberTraining Set Accuracy (%)Cross Validation Accuracy (%)Test Set Accuracy (%)
120.2320.0020.30
10100.0098.2197.46
20100.0098.8499.68
50100.0099.2899.84
100100.0099.7299.84
256100.0099.88100.00
Table 10. Optimal hyperparameters of the WiSARD classifier.
HyperparameterConfiguration
bits32
bleach confidence1.00
bleach flagFALSE
bleach step1
map typeRANDOM
tic number256
Table 11. Performance comparison with various state-of-the-art methods.
ReferenceMethodology UsedClassification Accuracy (%)Test Time (s)
[59]DeepSolarEye (ResNet-Based)97.80-
[60]Yolo V396.30-
[61]Custom CNN79.06-
[62]Custom CNN94.303.66
[63]Custom CNN97.900.55
[16]Custom CNN95.07-
[23]Pretrained CNN + Random Forest98.250.89
[44]Pretrained CNN + K-Nearest Neighbor98.950.04
[64]Ensemble Model99.042.50
ProposedDenseNet-201+ WiSARD100.001.44
Disclaimer/Publisher’s Note: The statements, opinions and data contained in all publications are solely those of the individual author(s) and contributor(s) and not of MDPI and/or the editor(s). MDPI and/or the editor(s) disclaim responsibility for any injury to people or property resulting from any ideas, methods, instructions or products referred to in the content.