


Energy Efficiency Indicator of Pumping Equipment Usage

 ,
,  ,
,  , ,
, ,  ,
, 
Abstract
1. Introduction
- −
- The energy efficiency of equipment usage for pumping water [4];
- −
- Requirements for energy-related products (Directive 2009/125/EC of the European Parliament and of the Council establishing a framework for the setting of ecodesign requirements for energy-related products) in terms of implementing ecodesign requirements for water pumps [5];
- −
- The (EC) 641/2009 Regulation, on implementing Directive 2005/32/EC of the European Parliament and of the Council on circulation pumps [6].
2. Materials and Methods
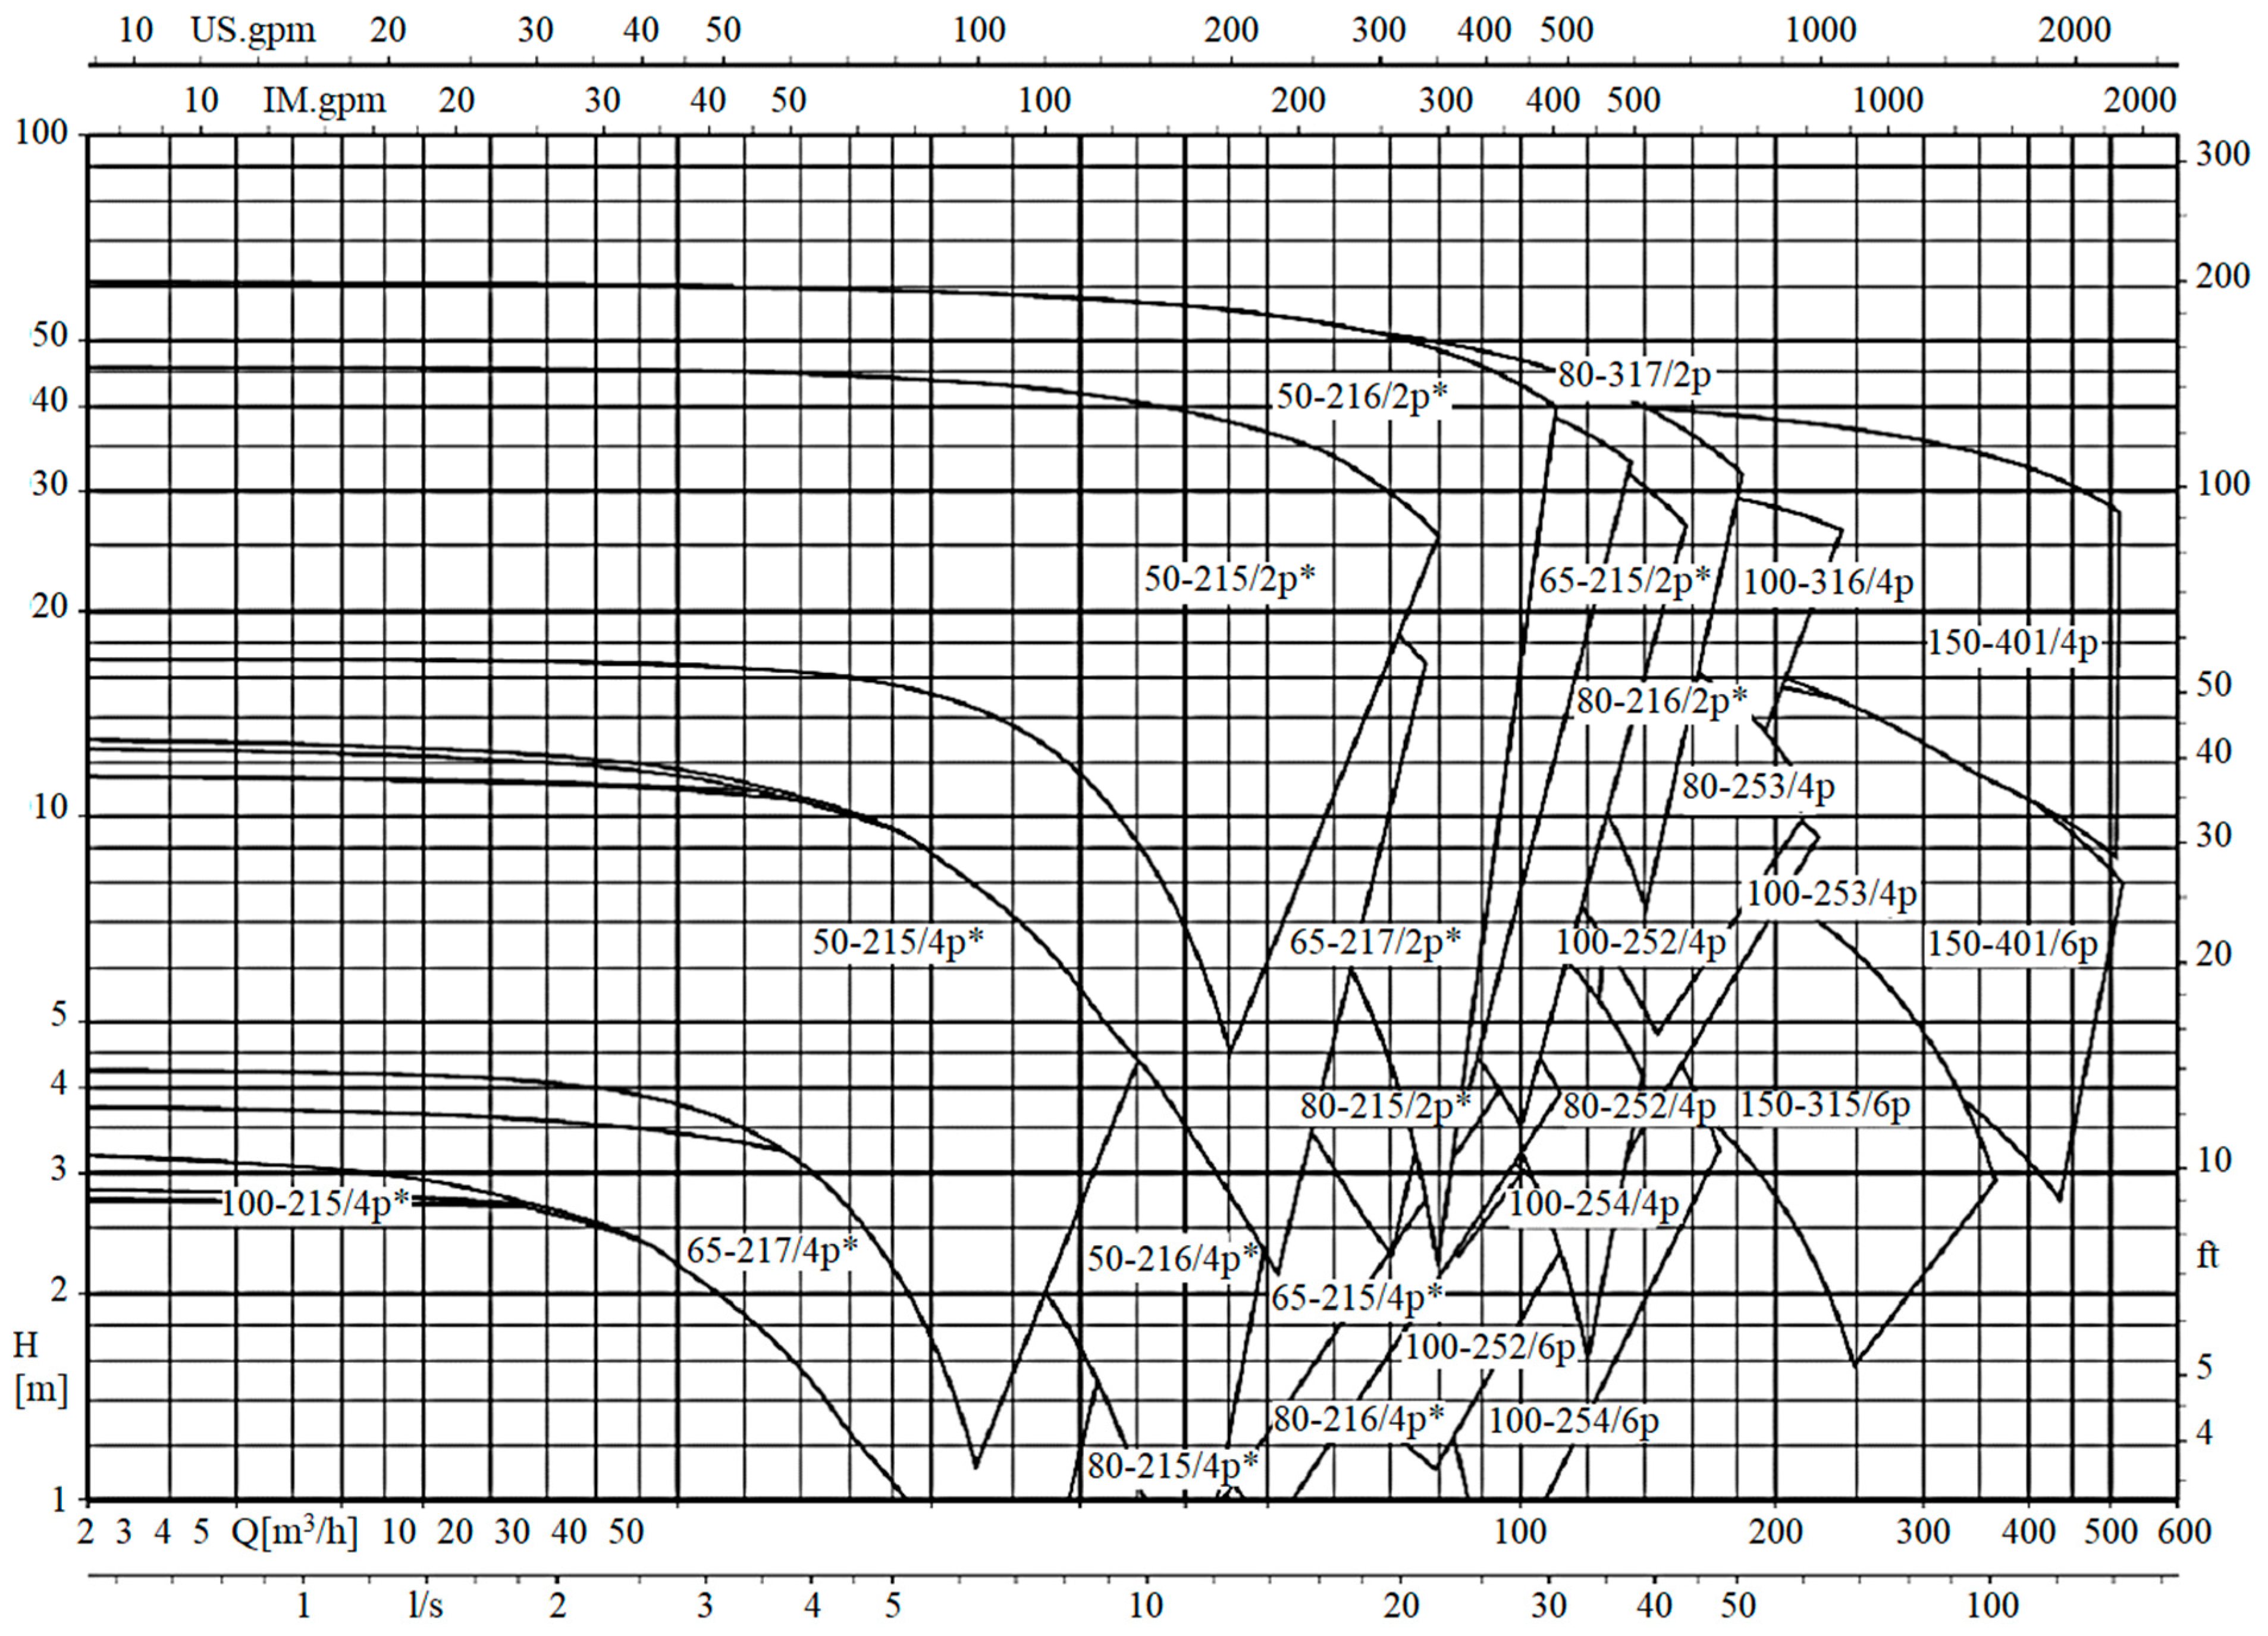
- (a)
- If the pump has more than one head and flow characteristic, then the calculation is performed on the maximum of them;
- (b)
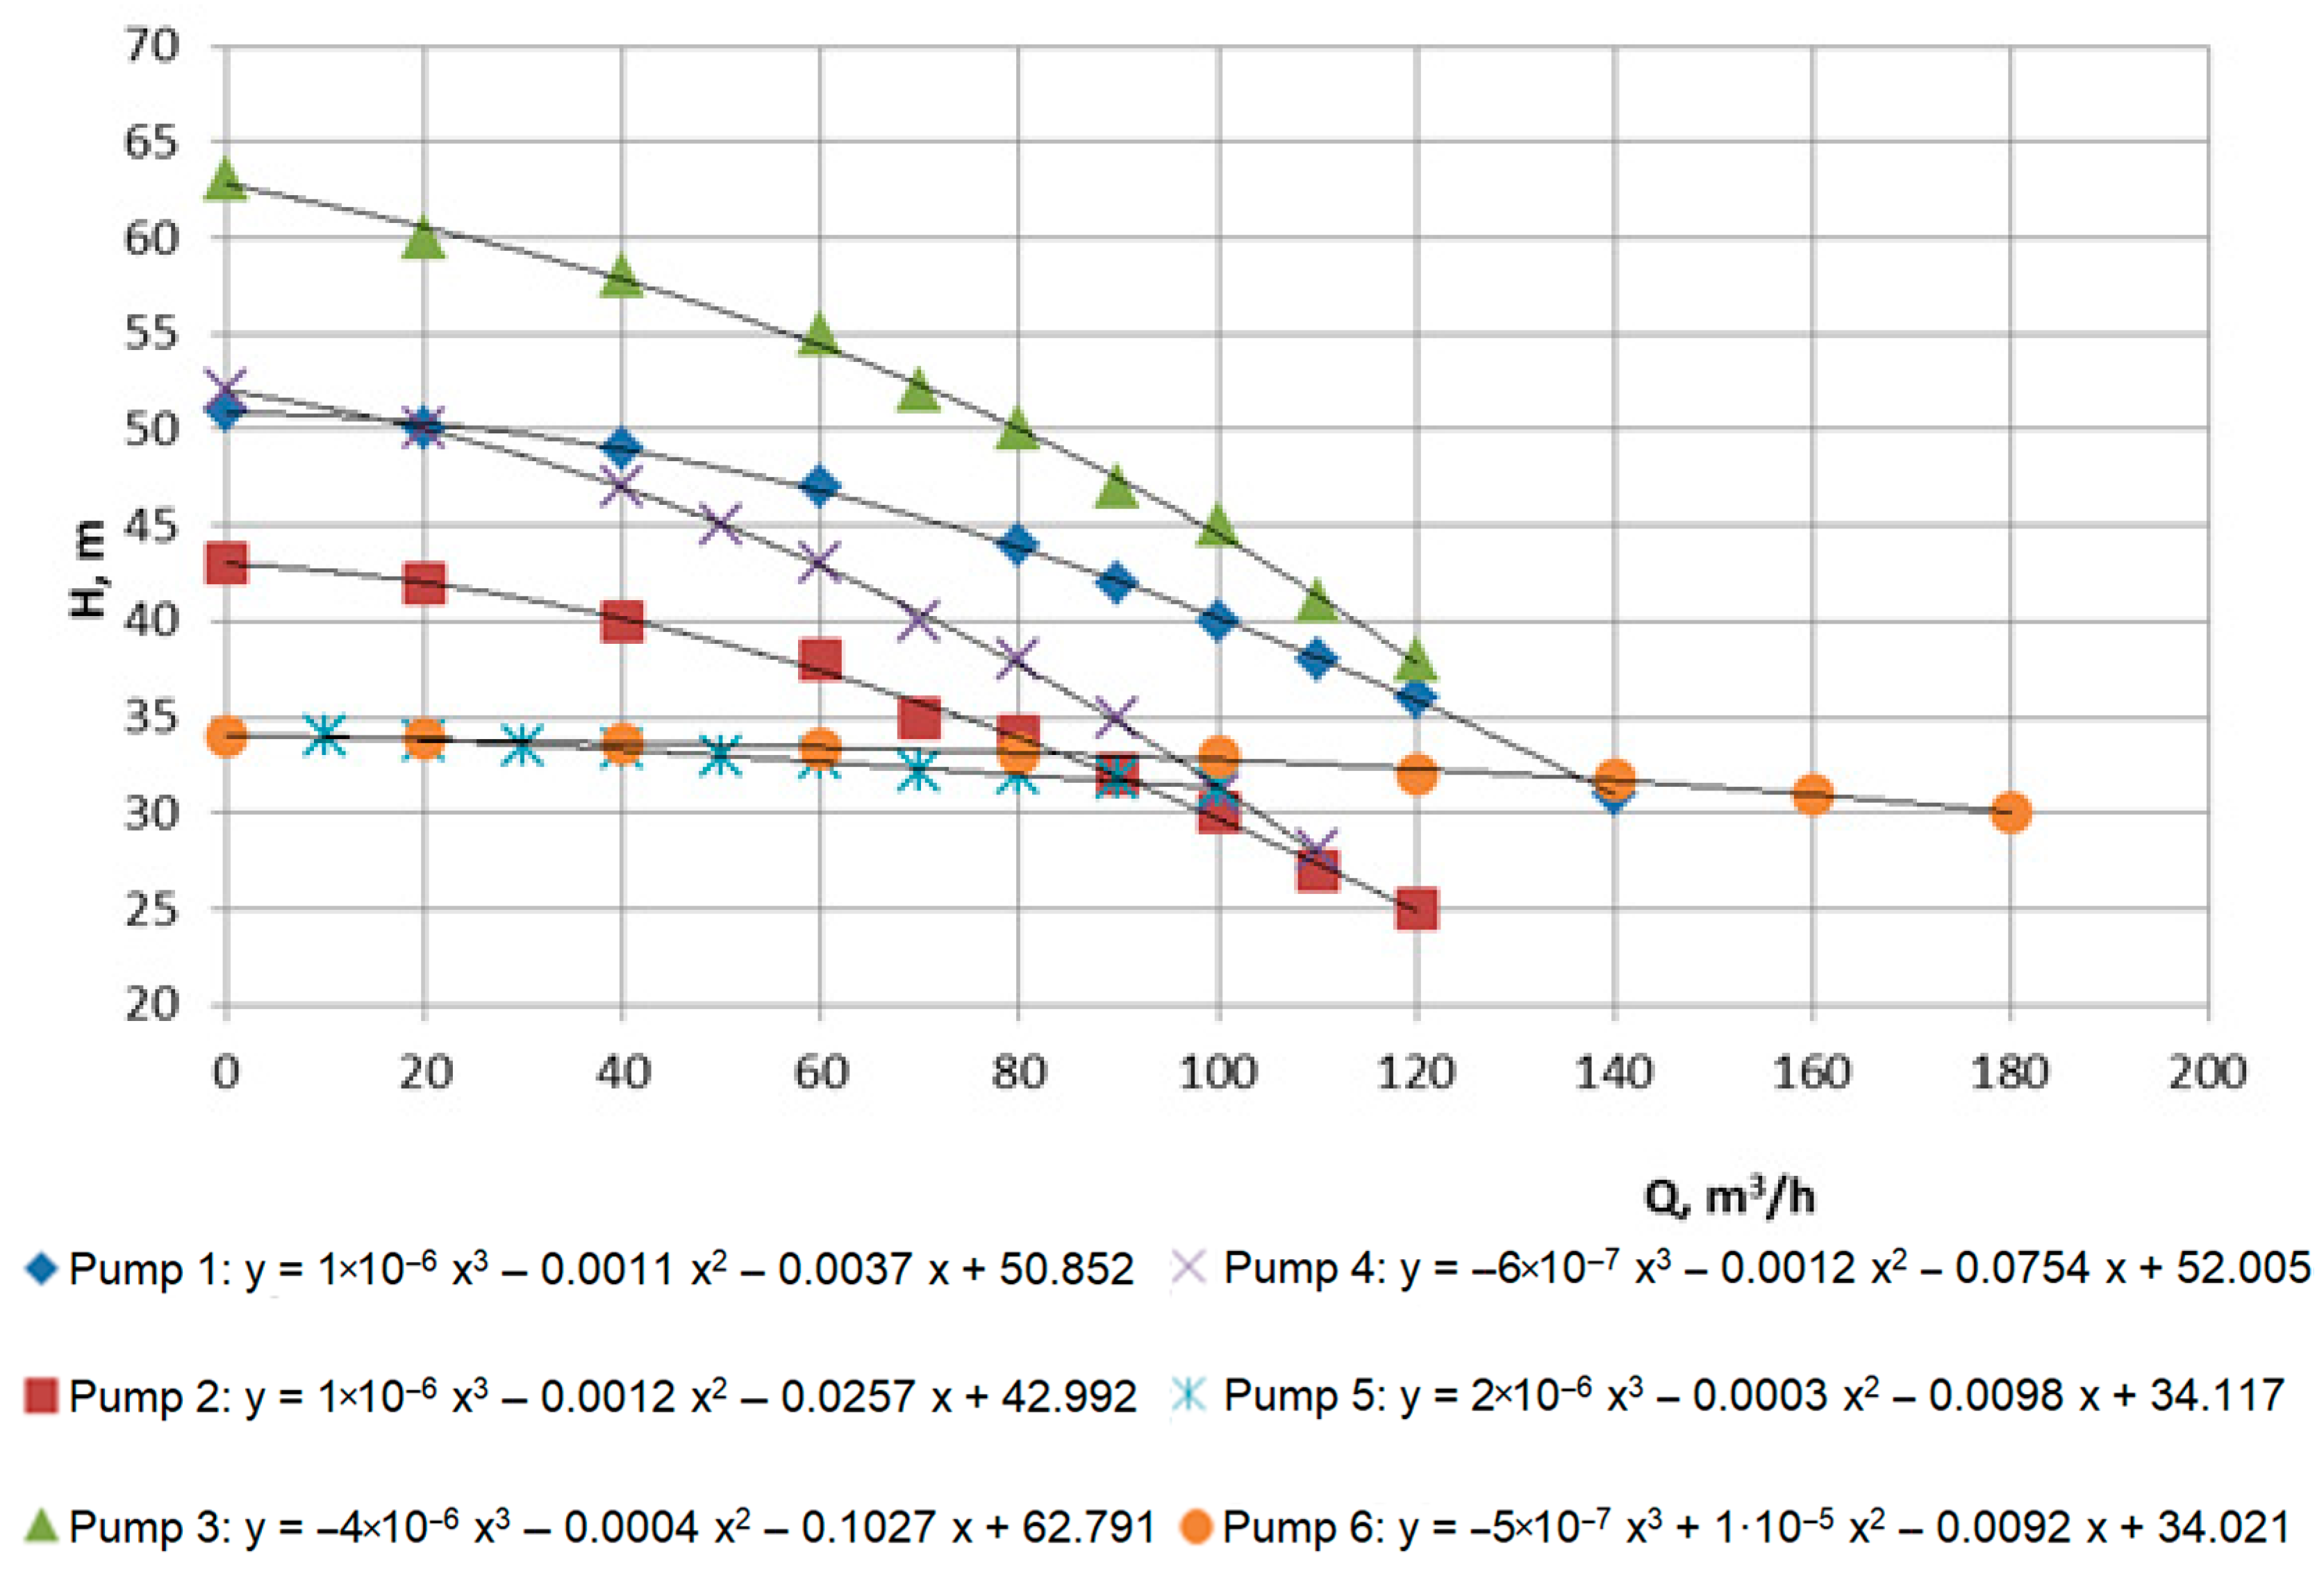
- At least 10 points are used, evenly distributed to fit the curve “Q-H”;
- (c)
- The function Hfit(Q) for the corresponding pump is selected using the least squares method.
- (1)
- (2)
3. Results
3.1. General Provisions for the Study
3.2. Calculation Results of Energy Efficiency Indicators for the Use of Pumping Equipment When Applying the Efficiency Indicator at the Point of Optimal Pump Efficiency ηBEP
3.3. Calculation Results of Energy Efficiency Indicators for the Use of Pumping Equipment at the Maximum Value of the Function Phyd(QEEI)
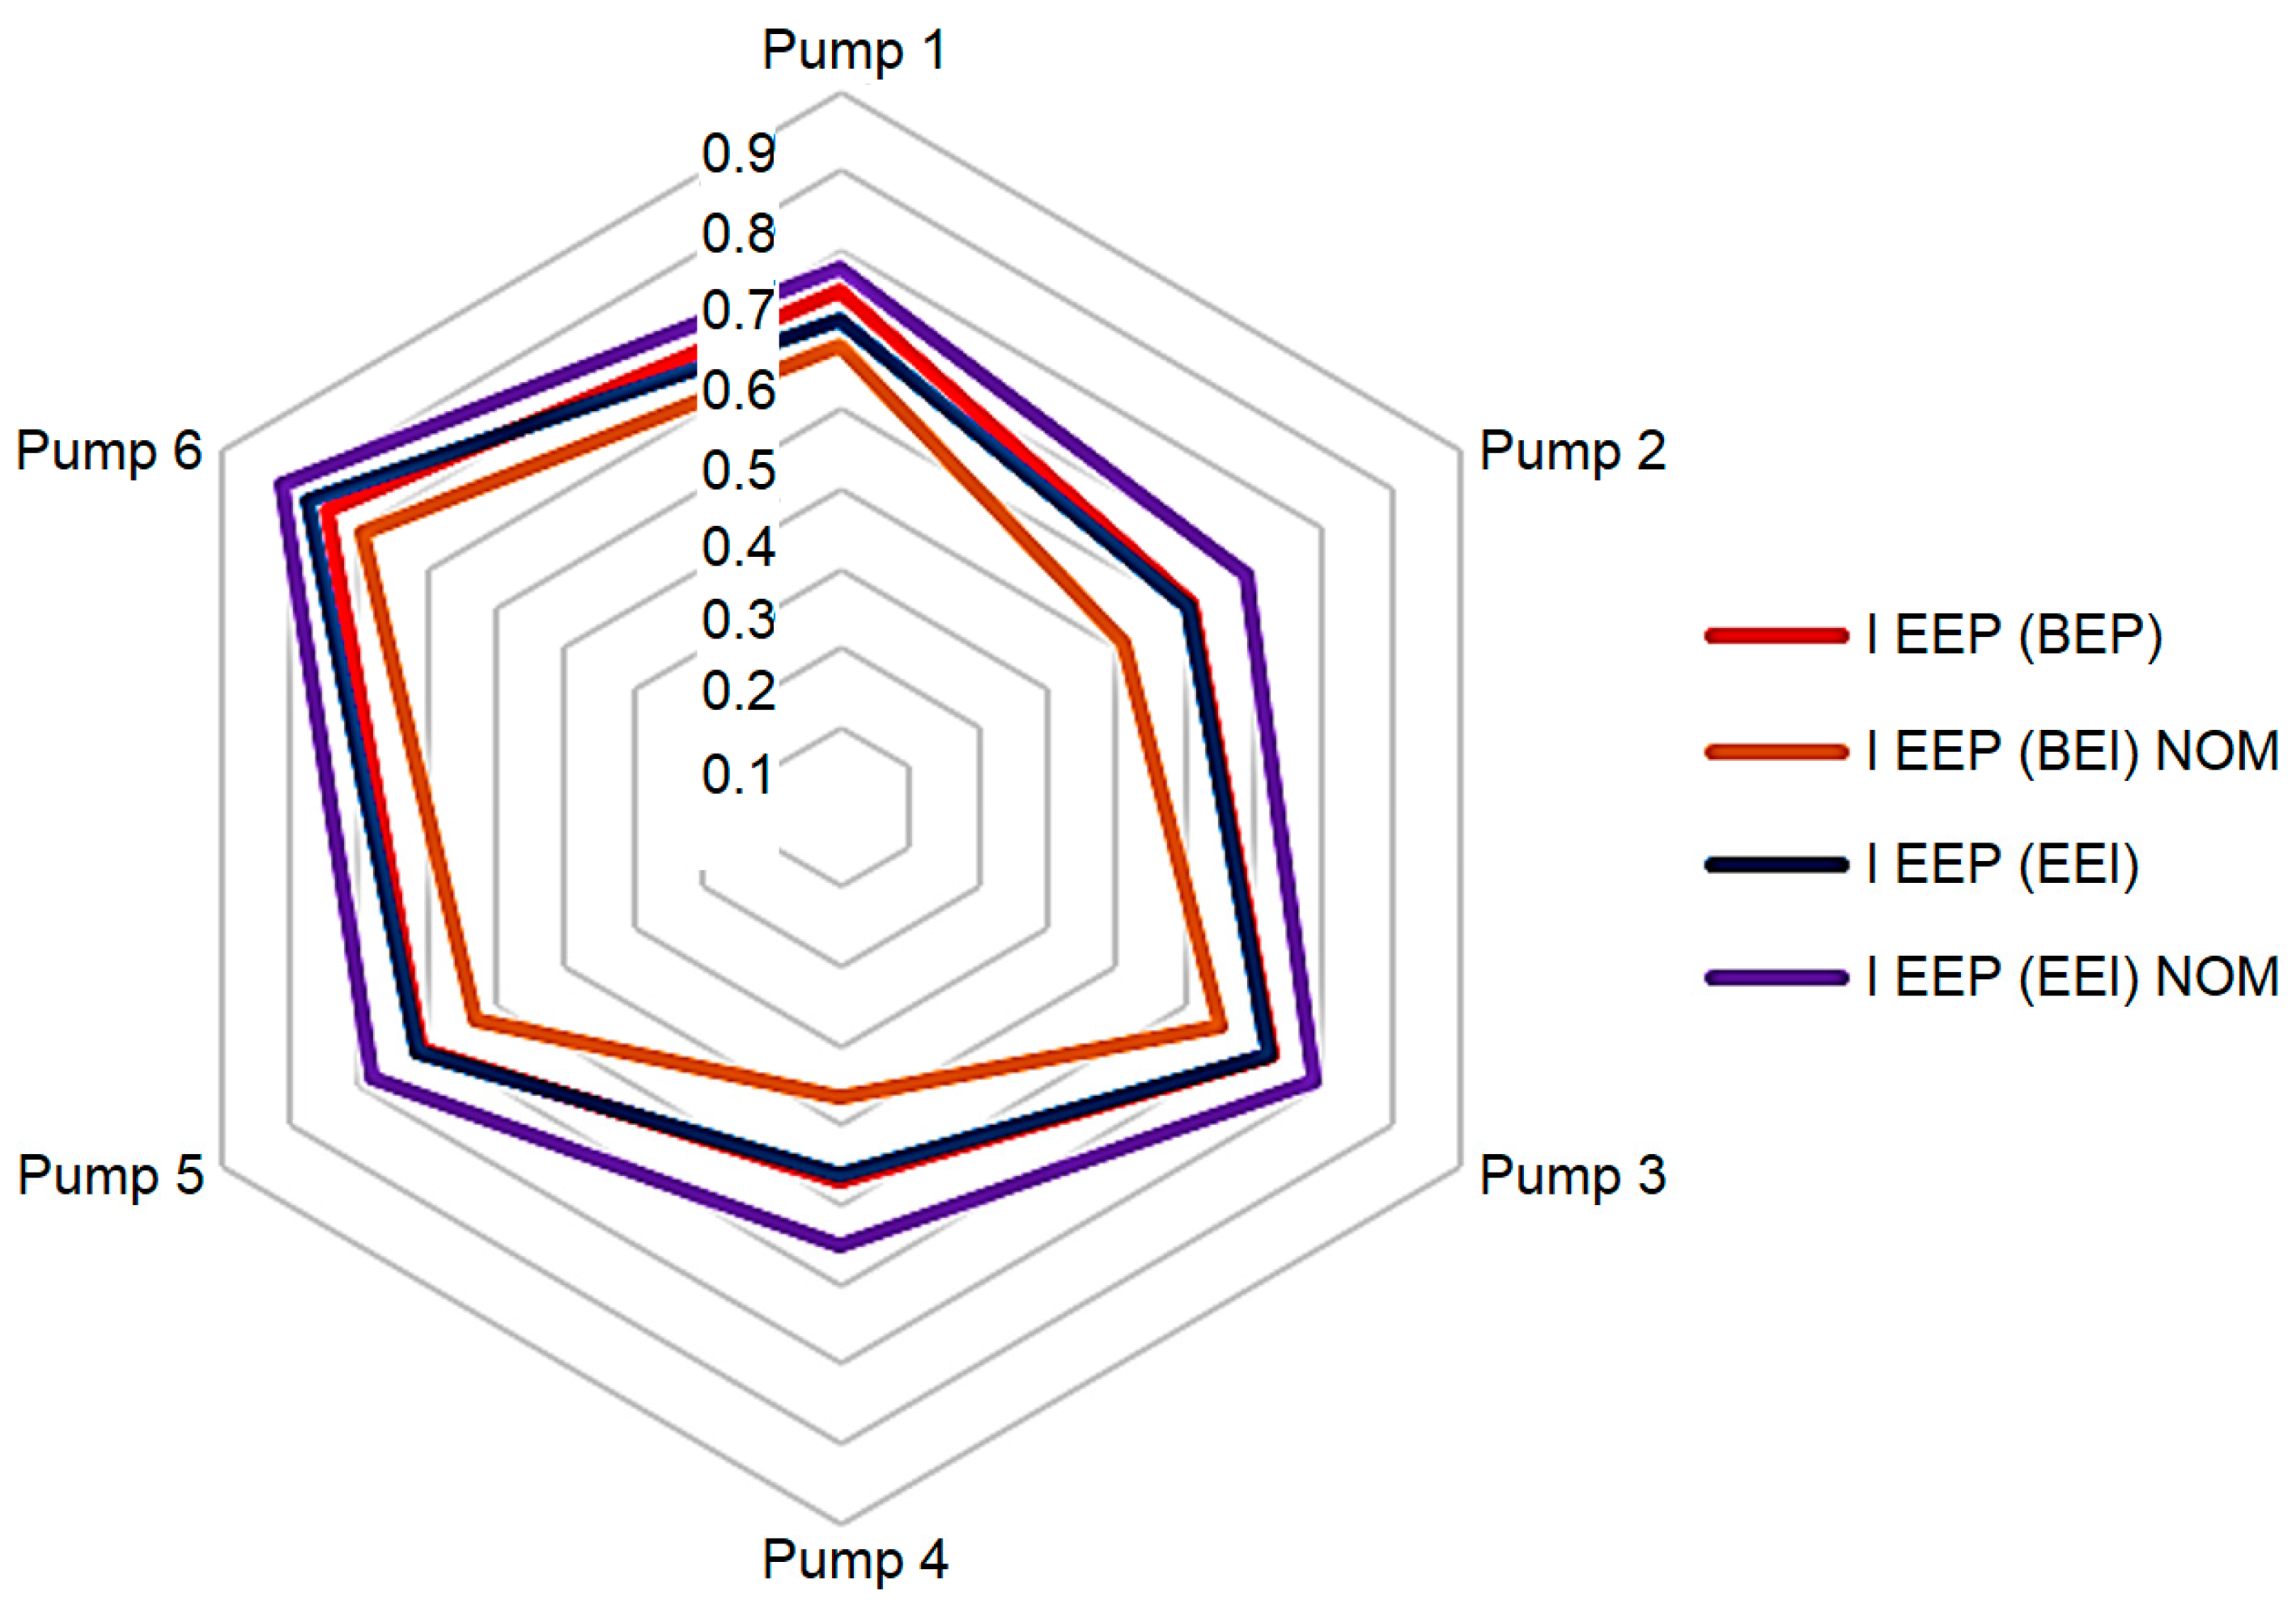
3.4. Diagram of the Energy Efficiency Indicators’ Distribution
4. Discussion
5. Conclusions
Author Contributions
Funding
Data Availability Statement
Acknowledgments
Conflicts of Interest
Nomenclature
| EEI | Energy efficiency index | |
| ISO 9906:2012 | Rotodynamic pumps. Hydraulic performance acceptance tests. Grades 1, 2 and 3 | |
| EN 16297-1 | Pumps. Rotodynamic pumps. Glandless circulators. General requirements and procedures for testing and calculation of energy efficiency index (EEI) | |
| IEEP | Energy efficiency indicator of equipment | |
| Symbols and Units | ||
| η | efficiency | % |
| H | Head | m |
| Q | Flow rate | m3/h |
| PL,avg | Average compensated network power | W |
| Pref | Reference power at the pump inlet | W |
| PL,i%(Qi) | Network hydraulic power | W |
| Flow rate for the i-th network loading mode | m3/h | |
| hnet | Function that characterizes the network head rate | m |
| Phyd | Hydraulic output power | W |
| ηQ* | Efficiency of pumping equipment at the flow rate of pumping equipment Q* | m3/h |
References
- Poorly Designed Pumps Use 10% of World Energy. Available online: https://blogs.sw.siemens.com/simcenter/poorly-designed-pumps-use-10-of-world-energy/ (accessed on 4 June 2023).
- Is Reduction of Global Electricity Consumption by 4 per Cent Possible? Available online: https://www.eco-business.com/news/is-reduction-of-global-electricity-consumption-by-4-per-cent-possible/ (accessed on 24 May 2023).
- Andrusiak, V.O.; Lugova, S.O.; Medvid, S.A.; Tkach, P.Y.; Rudenko, A.A. Effect of front impeller seal leakages on centrifugal stage characteristics. J. Phys. Conf. Ser. 2021, 1741, 012036. [Google Scholar] [CrossRef]
- Water and Energy Efficiency. Available online: https://sdgs.un.org/goals/ (accessed on 4 June 2023).
- Gheorghe, C.M.; Macinic, I.-A.; Gheorghe, A.G. Oblong core cross-section impact on power transformer characteristics. Rev. Roum. Sci. Tech. Ser. Electrotech. Energetique 2022, 67, 281–286. [Google Scholar]
- Commission Regulation (EC) No 641/2009 of 22 July 2009. Implementing Directive 2005/32/EC of the European Parliament and of the Council with Regard to Ecodesign Requirements for Glandless Standalone Circulators and Glandless Circulators Integrated in Products. Available online: https://eur-lex.europa.eu/LexUriServ/LexUriServ.do?uri=OJ:L:2009:191:0035:0041:EN:PDF#:~:text=This%20Regulation%20establishes%20ecodesign%20requirements,I%2C%20point%202(4)%3B (accessed on 25 July 2023).
- Fontana, F. Performance Analysis of Compact Multistage Pumps Manufactured from Sheet Metal. In Proceedings of the 12th European Conference on Turbomachinery Fluid Dynamics and Thermodynamics, ETC 2017, Stockholm, Sweden, 3–7 April 2017. [Google Scholar] [CrossRef]
- Emami, S.A.; Emami, M.H. Design and implementation of an online precise monitoring and performance analysis system for centrifugal pumps. IEEE Trans. Ind. Electron. 2017, 65, 1636–1644. [Google Scholar] [CrossRef]
- Panchenko, V.; Ivchenko, A.; Dynnyk, O.; Drach, O. Increasing the technical level of a torque flow pump by changing the geometry of a flowing part. Technol. Audit. Prod. Reserves 2018, 3, 10–21. [Google Scholar] [CrossRef]
- Mandryka, A.; Majid, A.P.; Ratushnyi, O.; Kulikov, O.; Sukhostavets, D. Ways for improvement of reverse axial pumps. J. Eng. Sci. 2022, 9, D14–D19. [Google Scholar] [CrossRef]
- Kondus, V.Y.; Kotenko, A.I. Investigation of the impact of the geometric dimensions of the impeller on the torque flow pump characteristics. East.-Eur. J. Enterp. Technol. 2017, 4, 25–31. [Google Scholar] [CrossRef][Green Version]
- Gusak, A.G.; Krishtop, I.V.; German, V.F.; Baga, V.N. Increase of economy of torque flow pump with high specific speed. IOP Conf. Ser. Mater. Sci. Eng. 2017, 233, 012004. [Google Scholar] [CrossRef]
- Puzik, R.V.; Kondus, V.Y.; Pavlenko, I.V.; Antonenko, S.S. The influence of the impeller design features on the combined operating process of the torque-flow pump. Nauk. Visnyk Natsionalnoho Hirnychoho Universytetu 2023, 2, 71–76. [Google Scholar] [CrossRef]
- Kondus, V.Y.; Puzik, R.V.; German, V.F.; Panchenko, V.O.; Yakhnenko, S.M. Improving the efficiency of the operating process of high specific speed torque-flow pumps by upgrading the flowing part design. J. Phys. Conf. Ser. 2021, 1741, 012023. [Google Scholar] [CrossRef]
- Panchenko, V.; German, V.; Kondus, V.; Ivchenko, O.; Ryasnaya, O. Combined operating process of torque flow pump. J. Phys. Conf. Ser. 2021, 1741, 012022. [Google Scholar] [CrossRef]
- Ejiri, E.; Kubo, M. Flow and loss analysis of a torque converter pump in the higher speed ratio range. Trans. Jpn. Soc. Mech. Eng. Part B 1998, 64, 2102–2108. [Google Scholar] [CrossRef][Green Version]
- Krishtop, I.V. Creating the flowing part of the high energy-efficiency torque flow pump. East.-Eur. J. Enterp. Technol. 2015, 2, 31–37. [Google Scholar] [CrossRef][Green Version]
- Yang, J.; Liu, B.; Zhang, T.; Hong, J.; Zhang, H. Multi-parameter controlled mechatronics-electro-hydraulic power coupling electric vehicle based on active energy regulation. Energy 2023, 263, 125877. [Google Scholar] [CrossRef]
- Li, W.; Huang, Y.; Ji, L.; Ma, L.; Agarwal, R.K.; Awais, M. Prediction model for energy conversion characteristics during transient processes in a mixed-flow pump. Energy 2023, 271, 127082. [Google Scholar] [CrossRef]
- KSB. Dry-Installed Pump. Sewatec. Available online: https://www.ksb.com/uk-ua/lc/products/pump/dry-installed-pump/sewatec/S02B/ (accessed on 24 May 2023).
- EN 16297-1:2012. Pumps—Rotodynamic Pumps—Glandless Circulators. Part 1: General Requirements and Procedures for Testing and Calculation of Energy Efficiency Index (EEI). Available online: https://standards.iteh.ai/catalog/standards/cen/6da838fa-9c3b-4373-8328-00ed7dc7d11e/en-16297-1-2012/ (accessed on 4 June 2023).
- EN 16297-2:2012. Pumps—Rotodynamic Pumps—Glandless Circulators. Part 2: Calculation of Energy Efficiency Index (EEI) for Standalone Circulators. Available online: https://standards.iteh.ai/catalog/standards/cen/33c0204d-1332-436b-b858-7aeeb957888e/en-16297-2-2012 (accessed on 4 June 2023).
- EN 16297-3:2012. Pumps—Rotodynamic Pumps—Glandless Circulators. Part 3: Energy Efficiency Index (EEI) for Circulators Integrated in Products. Available online: https://standards.iteh.ai/catalog/standards/cen/0319682c-4b48-4d5a-9569-7f0aa75dee68/en-16297-3-2012/ (accessed on 4 June 2023).


| Characteristic of the Conventional Network | Value |
|---|---|
| Flow rate at the nominal network loading mode QNOM, m3/h | 100 |
| Maximum flow rate Qmax = 1.2 · QNOM, m3/h | 120 |
| Pressure head at the nominal network loading mode HNOM, m | 30 |
| The minimum head rate in the network Hmin, m | 10 |
| The maximum head rate in the network Hmax, m | 45 |
| Technical Characteristics | Pump Markings | |||||
|---|---|---|---|---|---|---|
| 065–215 (210) 1 | 065–215 (190) 1 | 050–216 (210) 1 | 050–216 (190) 1 | 80–32 | 125–32 | |
| Pump ID | 1 | 2 | 3 | 4 | 5 | 6 |
| Size D2, mm | 210 | 190 | 210 | 190 | 325 | 325 |
| Rotation speed n, rpm | 2900 | 2900 | 2900 | 2900 | 1500 | 1500 |
| Head rate 2 HNOM at the point QNOM, m | 40.18 | 29.71 | 44.56 | 31.43 | 31.32 | 32.77 |
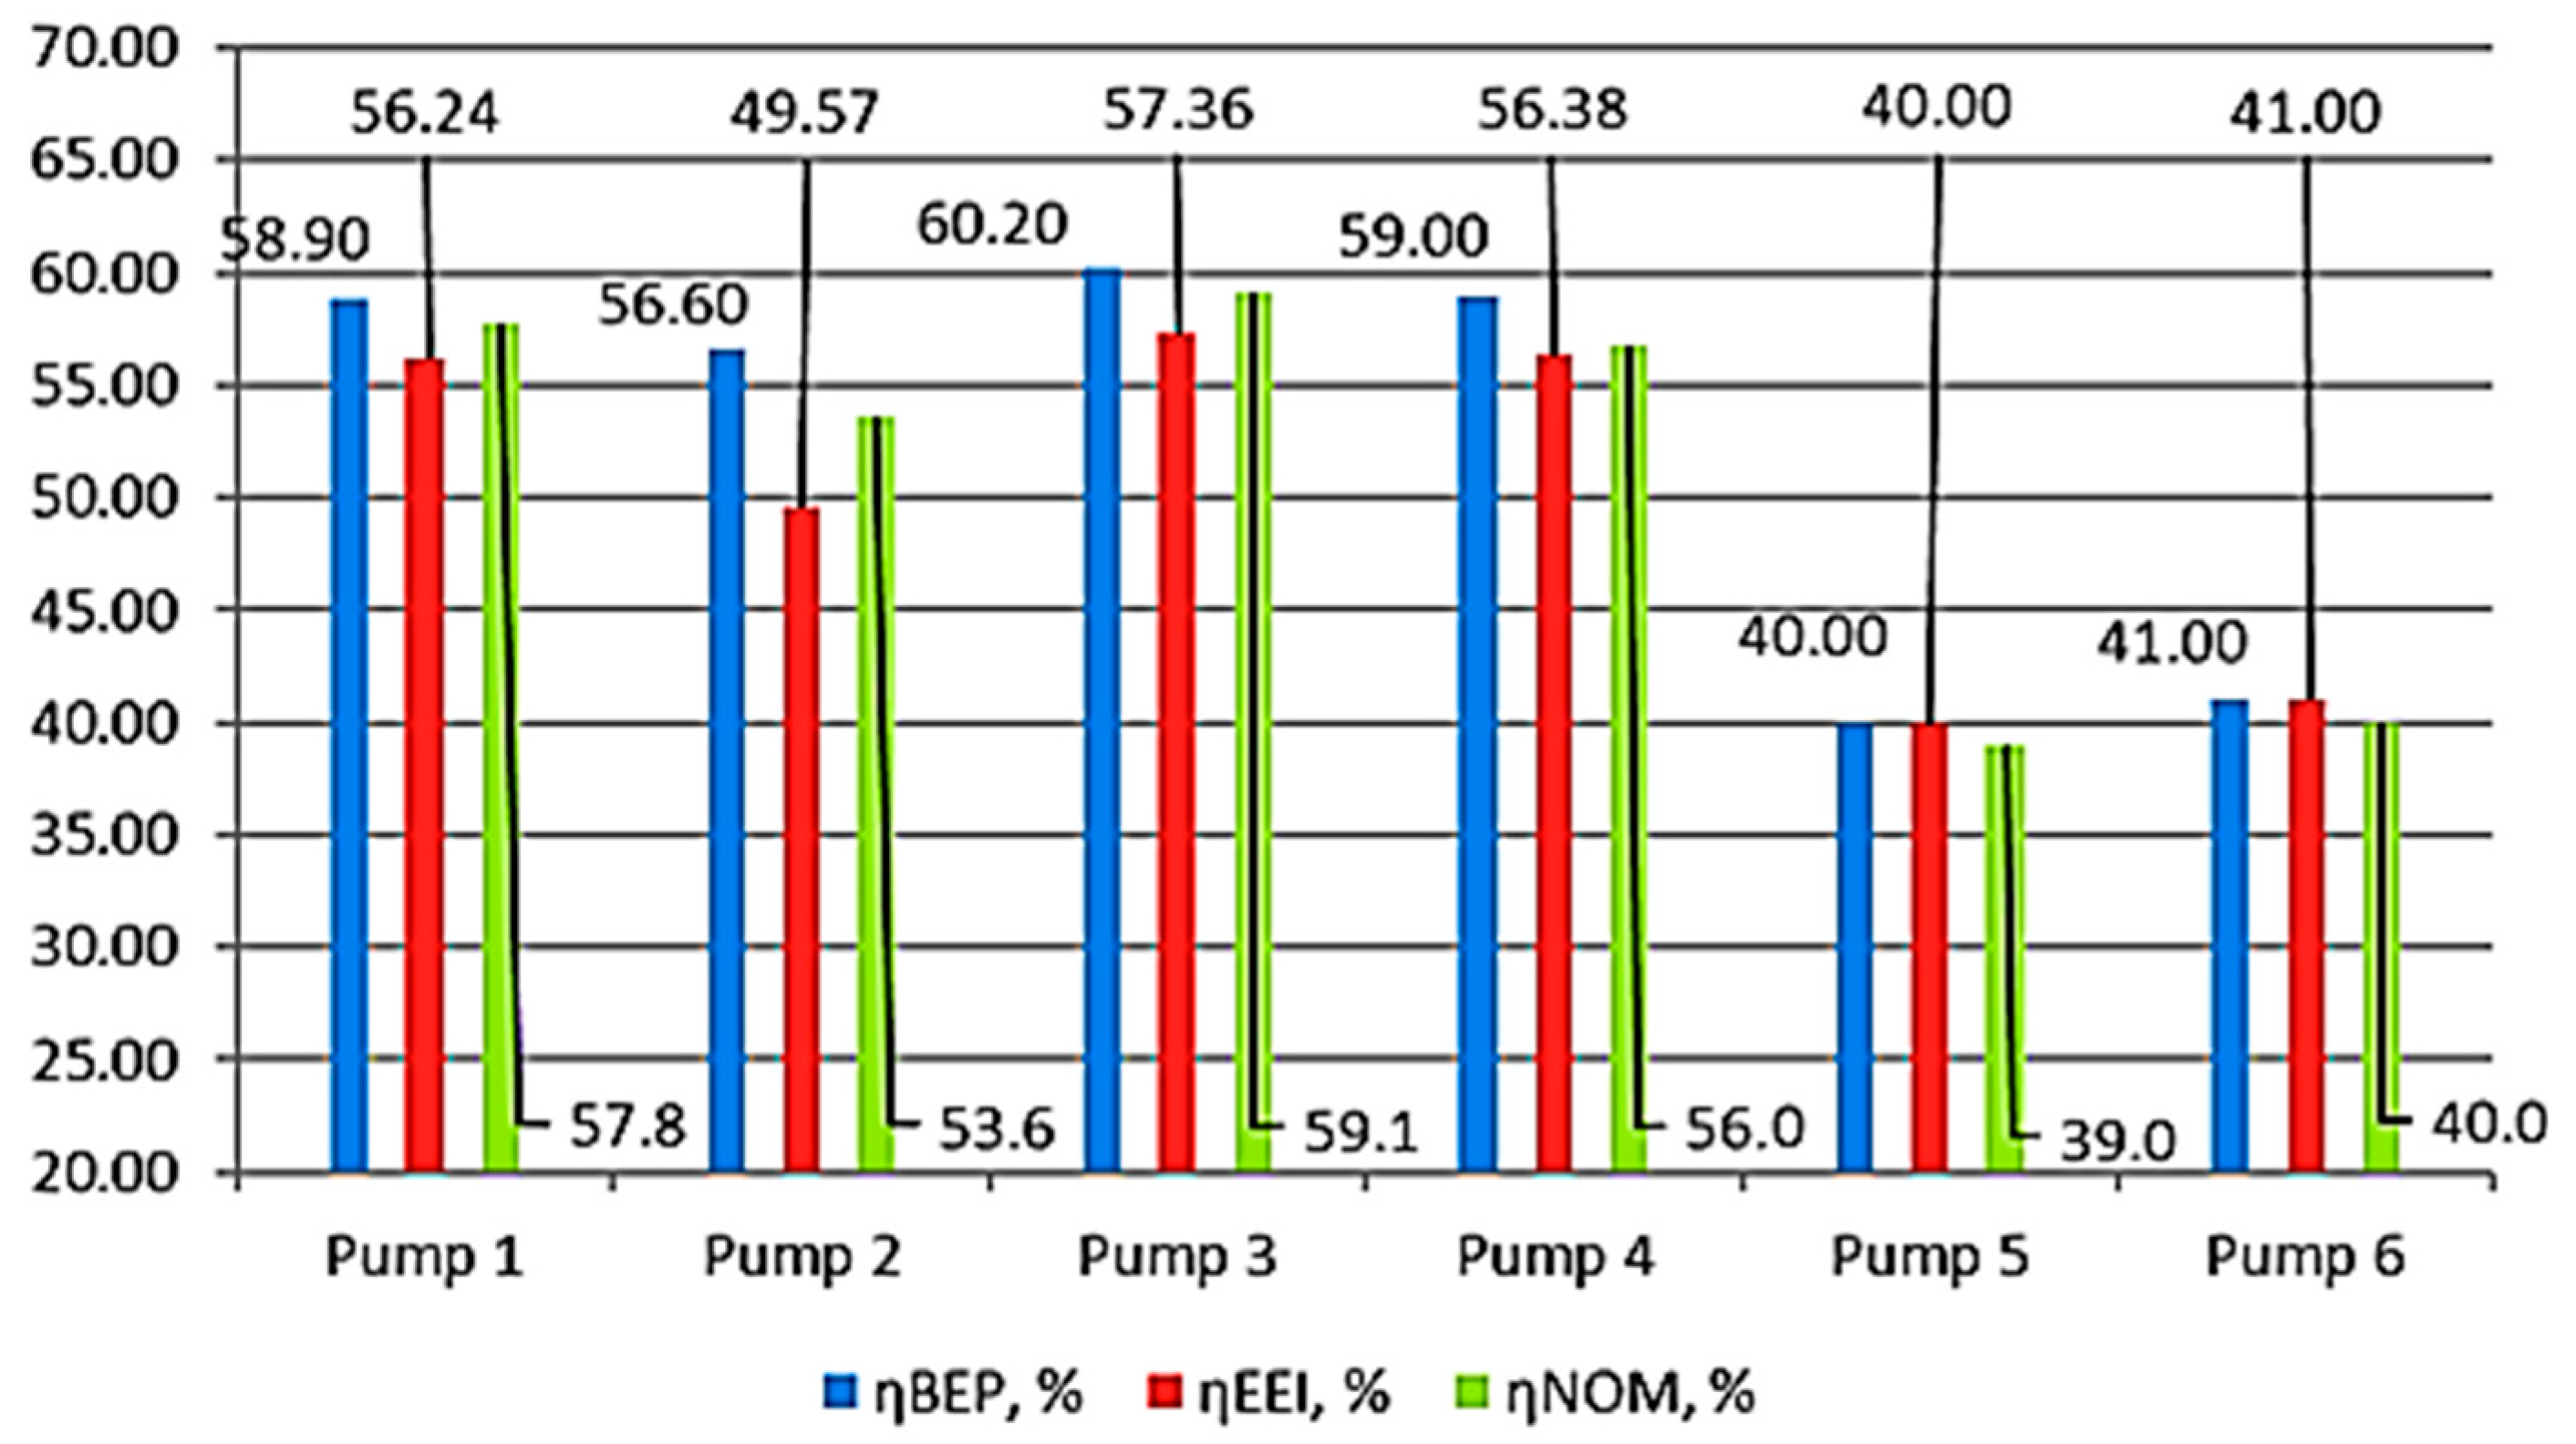
| Efficiency 3 ηNOM, % | 57.8 | 53.6 | 59.1 | 56.0 | 39.0 | 40.0 |
| The Ratio of Q/QNOM, % | Value 1 of hnet(Q), m | Operating Time per Year in Hours Li%, % |
|---|---|---|
| 120 | 38.8 | 10 |
| 100 | 30.0 | 60 |
| 70 | 19.8 | 10 |
| 50 | 15.0 | 10 |
| 20 | 10.8 | 10 |
| Indicator | Pump ID | Notes | |||||
|---|---|---|---|---|---|---|---|
| Pump 1 | Pump 2 | Pump 3 | Pump 4 | Pump 5 | Pump 6 | ||
| QBEP, m3/h | 110 | 91 | 80 | 68 | 80 | 125 | Note 1 |
| ηBEP, % | 58.9 | 56.6 | 60.2 | 59.0 | 40.0 | 41.0 | Note 1 |
| HBEP, m | 38.11 | 31.68 | 50.01 | 40.93 | 31.97 | 32.16 | Note 2 |
| Phyd(QBEP), W | 11,403.60 | 7841.11 | 10,882.42 | 7571.30 | 6956.83 | 10,934.24 | Equation (9) |
| Pref(QBEP), W | 19,360.96 | 13,853.55 | 18,077.11 | 12,832.72 | 17,392.09 | 26,668.88 | Equation (7) |
| PL,avg, W | 6802.18 | Equation (3) | |||||
| , W | 8160.00 | Note 3 | |||||
| εBEP | 0.351 | 0.491 | 0.376 | 0.530 | 0.391 | 0.255 | Equation (2) |
| 0.421 | 0.589 | 0.451 | 0.636 | 0.469 | 0.306 | Note 3 | |
| 0.649 | 0.509 | 0.624 | 0.470 | 0.609 | 0.745 | Equation (1) | |
| 0.579 | 0.411 | 0.549 | 0.364 | 0.531 | 0.694 | Note 3 | |
| Indicator 1 | Pump ID | Notes | |||||
|---|---|---|---|---|---|---|---|
| Pump 1 | Pump 2 | Pump 3 | Pump 4 | Pump 5 | Pump 6 | ||
| QEEI, m3/h | 132.31 | 111.24 | 113.94 | 97.10 | 100.00 | 180.00 | Equation (7) 2 |
| HEEI, m | 32.93 | 27.07 | 40.00 | 32.41 | 31.32 | 30.03 | Equation (7) 2 |
| ηEEI, % | 56.24 | 49.75 | 57.36 | 56.38 | 40.00 | 41.00 | Equation (9) |
| Phyd(QEEI), W | 11,851.09 | 8190.84 | 12,398.43 | 8558.95 | 8519.69 | 14,702.86 | Equation (9) |
| Pref(QEEI), W | 21,072.36 | 16,464.0 | 21,615.12 | 15,180.82 | 21,299.22 | 35,860.63 | Equation (7) 2 |
| PL,avg, W | 6810.88 | Equation (3) | |||||
| , W | 8160.00 | Table 4 | |||||
| εEEI | 0.387 | 0.496 | 0.378 | 0.538 | 0.383 | 0.228 | Equation (2) |
| 0.323 | 0.414 | 0.315 | 0.449 | 0.320 | 0.190 | Note 1 | |
| 0.613 | 0.504 | 0.622 | 0.462 | 0.617 | 0.772 | Equation (1) | |
| 0.677 | 0.586 | 0.685 | 0.551 | 0.680 | 0.810 | Note 1 | |
| Indicator | Pump ID | |||||
|---|---|---|---|---|---|---|
| Pump 1 | Pump 2 | Pump 3 | Pump 4 | Pump 5 | Pump 6 | |
| ηEEI | 3 | 4 | 1 | 2 | 6 | 5 |
| ηBEP | 3 | 4 | 1 | 2 | 6 | 5 |
| ηNOM | 2 | 4 | 1 | 3 | 5 | 6 |
| 3 | 2 | 5 | 1 | 4 | 6 | |
| 3 | 2 | 3 | 1 | 4 | 6 | |
| 5 | 2 | 4 | 1 | 3 | 6 | |
| 5 | 2 | 4 | 1 | 3 | 6 | |
Disclaimer/Publisher’s Note: The statements, opinions and data contained in all publications are solely those of the individual author(s) and contributor(s) and not of MDPI and/or the editor(s). MDPI and/or the editor(s) disclaim responsibility for any injury to people or property resulting from any ideas, methods, instructions or products referred to in the content. |
© 2023 by the authors. Licensee MDPI, Basel, Switzerland. This article is an open access article distributed under the terms and conditions of the Creative Commons Attribution (CC BY) license (https://creativecommons.org/licenses/by/4.0/).
Share and Cite
Ivchenko, O.; Andrusiak, V.; Kondus, V.; Pavlenko, I.; Petrenko, S.; Krupińska, A.; Włodarczak, S.; Matuszak, M.; Ochowiak, M. Energy Efficiency Indicator of Pumping Equipment Usage. Energies 2023, 16, 5820. https://doi.org/10.3390/en16155820
Ivchenko O, Andrusiak V, Kondus V, Pavlenko I, Petrenko S, Krupińska A, Włodarczak S, Matuszak M, Ochowiak M. Energy Efficiency Indicator of Pumping Equipment Usage. Energies. 2023; 16(15):5820. https://doi.org/10.3390/en16155820
Chicago/Turabian StyleIvchenko, Oleksandr, Vladyslav Andrusiak, Vladyslav Kondus, Ivan Pavlenko, Serhii Petrenko, Andżelika Krupińska, Sylwia Włodarczak, Magdalena Matuszak, and Marek Ochowiak. 2023. "Energy Efficiency Indicator of Pumping Equipment Usage" Energies 16, no. 15: 5820. https://doi.org/10.3390/en16155820
APA StyleIvchenko, O., Andrusiak, V., Kondus, V., Pavlenko, I., Petrenko, S., Krupińska, A., Włodarczak, S., Matuszak, M., & Ochowiak, M. (2023). Energy Efficiency Indicator of Pumping Equipment Usage. Energies, 16(15), 5820. https://doi.org/10.3390/en16155820