1. Introduction
Floodlighting is a popular form of lighting objects with interesting architecture, including sacral, historical, and public buildings [
1]. Illuminated objects are usually characterized by large dimensions and complex geometry, so lighting designs are made using advanced simulation tools that map the physical course of light rays in space [
2,
3,
4,
5,
6,
7]. Illumination is a complex design and execution activity in which a number of factors should be taken into account, such as investment costs, operating costs of the illumination installation, the level of external lighting impact on the illuminated object, etc. [
8]. At the same time, IT solutions are proposed to simplify the modeling steps while maintaining the high accuracy of the simulation results obtained. For example, article [
9] presents a computer application that allows visualization of an illuminated object based on a daytime photograph. The effect of mapping the accuracy of the 3D model of the designed object on the resulting photometric calculations is presented in articles [
10,
11,
12]. Studies of the effects of reflectance and transmittance of facade coating materials on the luminance values obtained are presented in publications [
11,
13].
Another topic related to floodlighting includes problems related to the lighting method used and the selection and placement of luminaires within the illuminated object [
14]. The development of semiconductor LED light sources and their use in illumination lighting have given new lighting possibilities unheard of in the previously used luminaires with discharge light sources. Multicolored linear LED luminaires, complex lenses, and reflector systems precisely forming the distribution of the luminous flux enabled the creation of complex illumination projects [
15,
16,
17]. Detailed research regarding the zonal lighting of window niches using linear luminaires with LED sources is described in article [
18], while a simplified procedure for the selection of lighting equipment for window niche lighting is presented in publication [
19]. Article [
20] presents an economic analysis of the costs of energy consumption in external lighting of buildings for LED floodlights and discharge floodlights with the use of photovoltaic panels.
On the other hand, in article [
21], three methods, including real measurements, a survey, and energy efficiency simulation, were combined in order to develop a luminance control curve of an illuminated object at night. The research took into account various values of sky luminance, which was used to develop the control curve of the floodlights used, and the energy-saving effect obtained for each of the variants was higher than 15%.
The possibility of using VR technology (virtual reality) in the design of lighting systems, e.g., illumination lighting is presented in article [
22]. The computer simulations carried out in it were compared with the real results, and the analysis of the luminance of the virtual reality display confirmed that the mentioned technique can be used in lighting technology after appropriate calibration. Another form of creating a night view of an object with interesting architecture is mapping, which is a combination of lighting and multimedia technology. In this solution, selected elements of the object are illuminated with the use of projector light, previously prepared animation in combination with music [
23].
Reducing light pollution is an important issue in outdoor lighting [
24,
25]., Scientific papers published on the aforementioned topic show the technical possibilities of reducing the above phenomenon while increasing the energy efficiency of the lighting system. Article [
26] presents the concept of a design algorithm for quantitative evaluation of illumination, enabling the minimization of energy losses of the lighting system and the reduction of the light-pollution phenomenon, while article [
27] defines new parameters defining the use of the lighting system.
Another issue worth considering regarding the design of floodlighting is the consideration and possible use of an additional component of street lighting, located in close proximity to the illuminated object. Taking into account the above factor can increase the energy efficiency of the designed lighting system. Currently, there are no presented research results in the available literature looking at this issue.
The aforementioned issue is particularly relevant to cities and urbanized zones, where there is a high saturation of architectural objects of high historical value. At these locations, there is an impact of varying degrees of street lighting on the facades of these structures. The planning of illumination in these areas must, therefore, take this impact into account. The first factor of major importance in the impact of street lighting on facades is the type of luminaires located in the vicinity of the architectural structures. There are generally two groups of luminaires with light distributions dedicated to lighting streets (street luminaires), squares, and open areas (decorative luminaires) [
28,
29,
30]. Other factors include the location of the luminaires in relation to the facade of the building on an axis parallel to the facade, the distance of the luminaires from the facade, the height of the lighting poles, the wattage of the luminaires, the distances between the poles, and the reflectance of the light from the facade [
31].
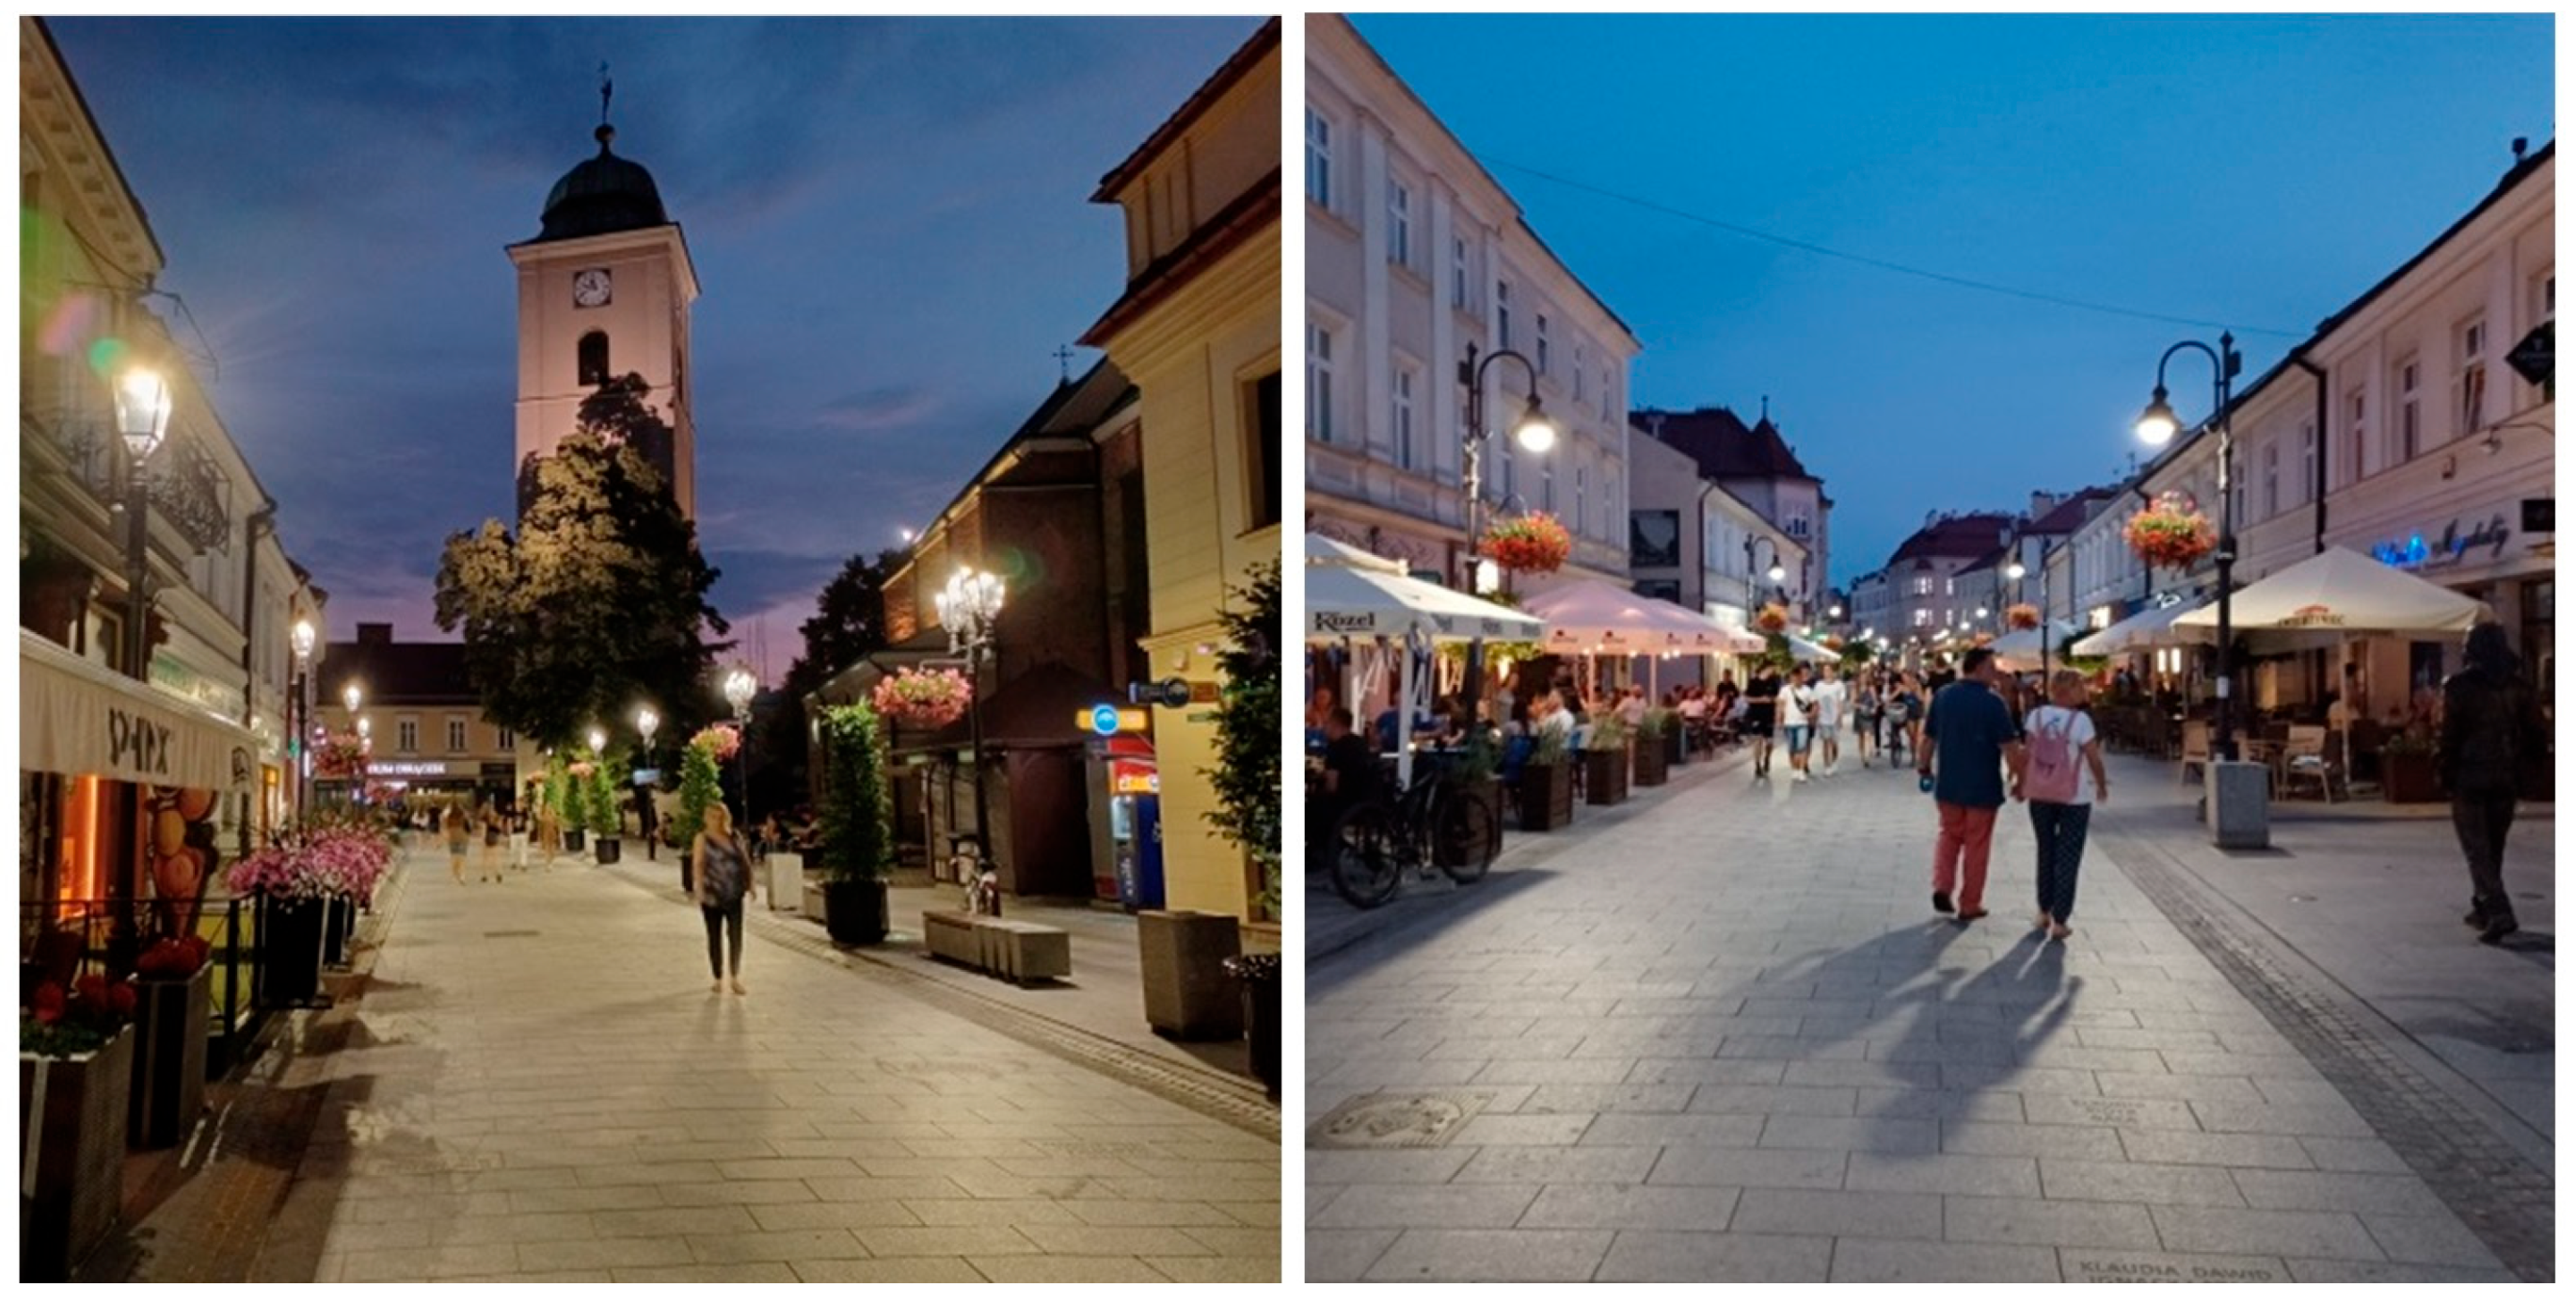
Figure 1 illustrates the illuminated facades of the historic center of one of the cities.
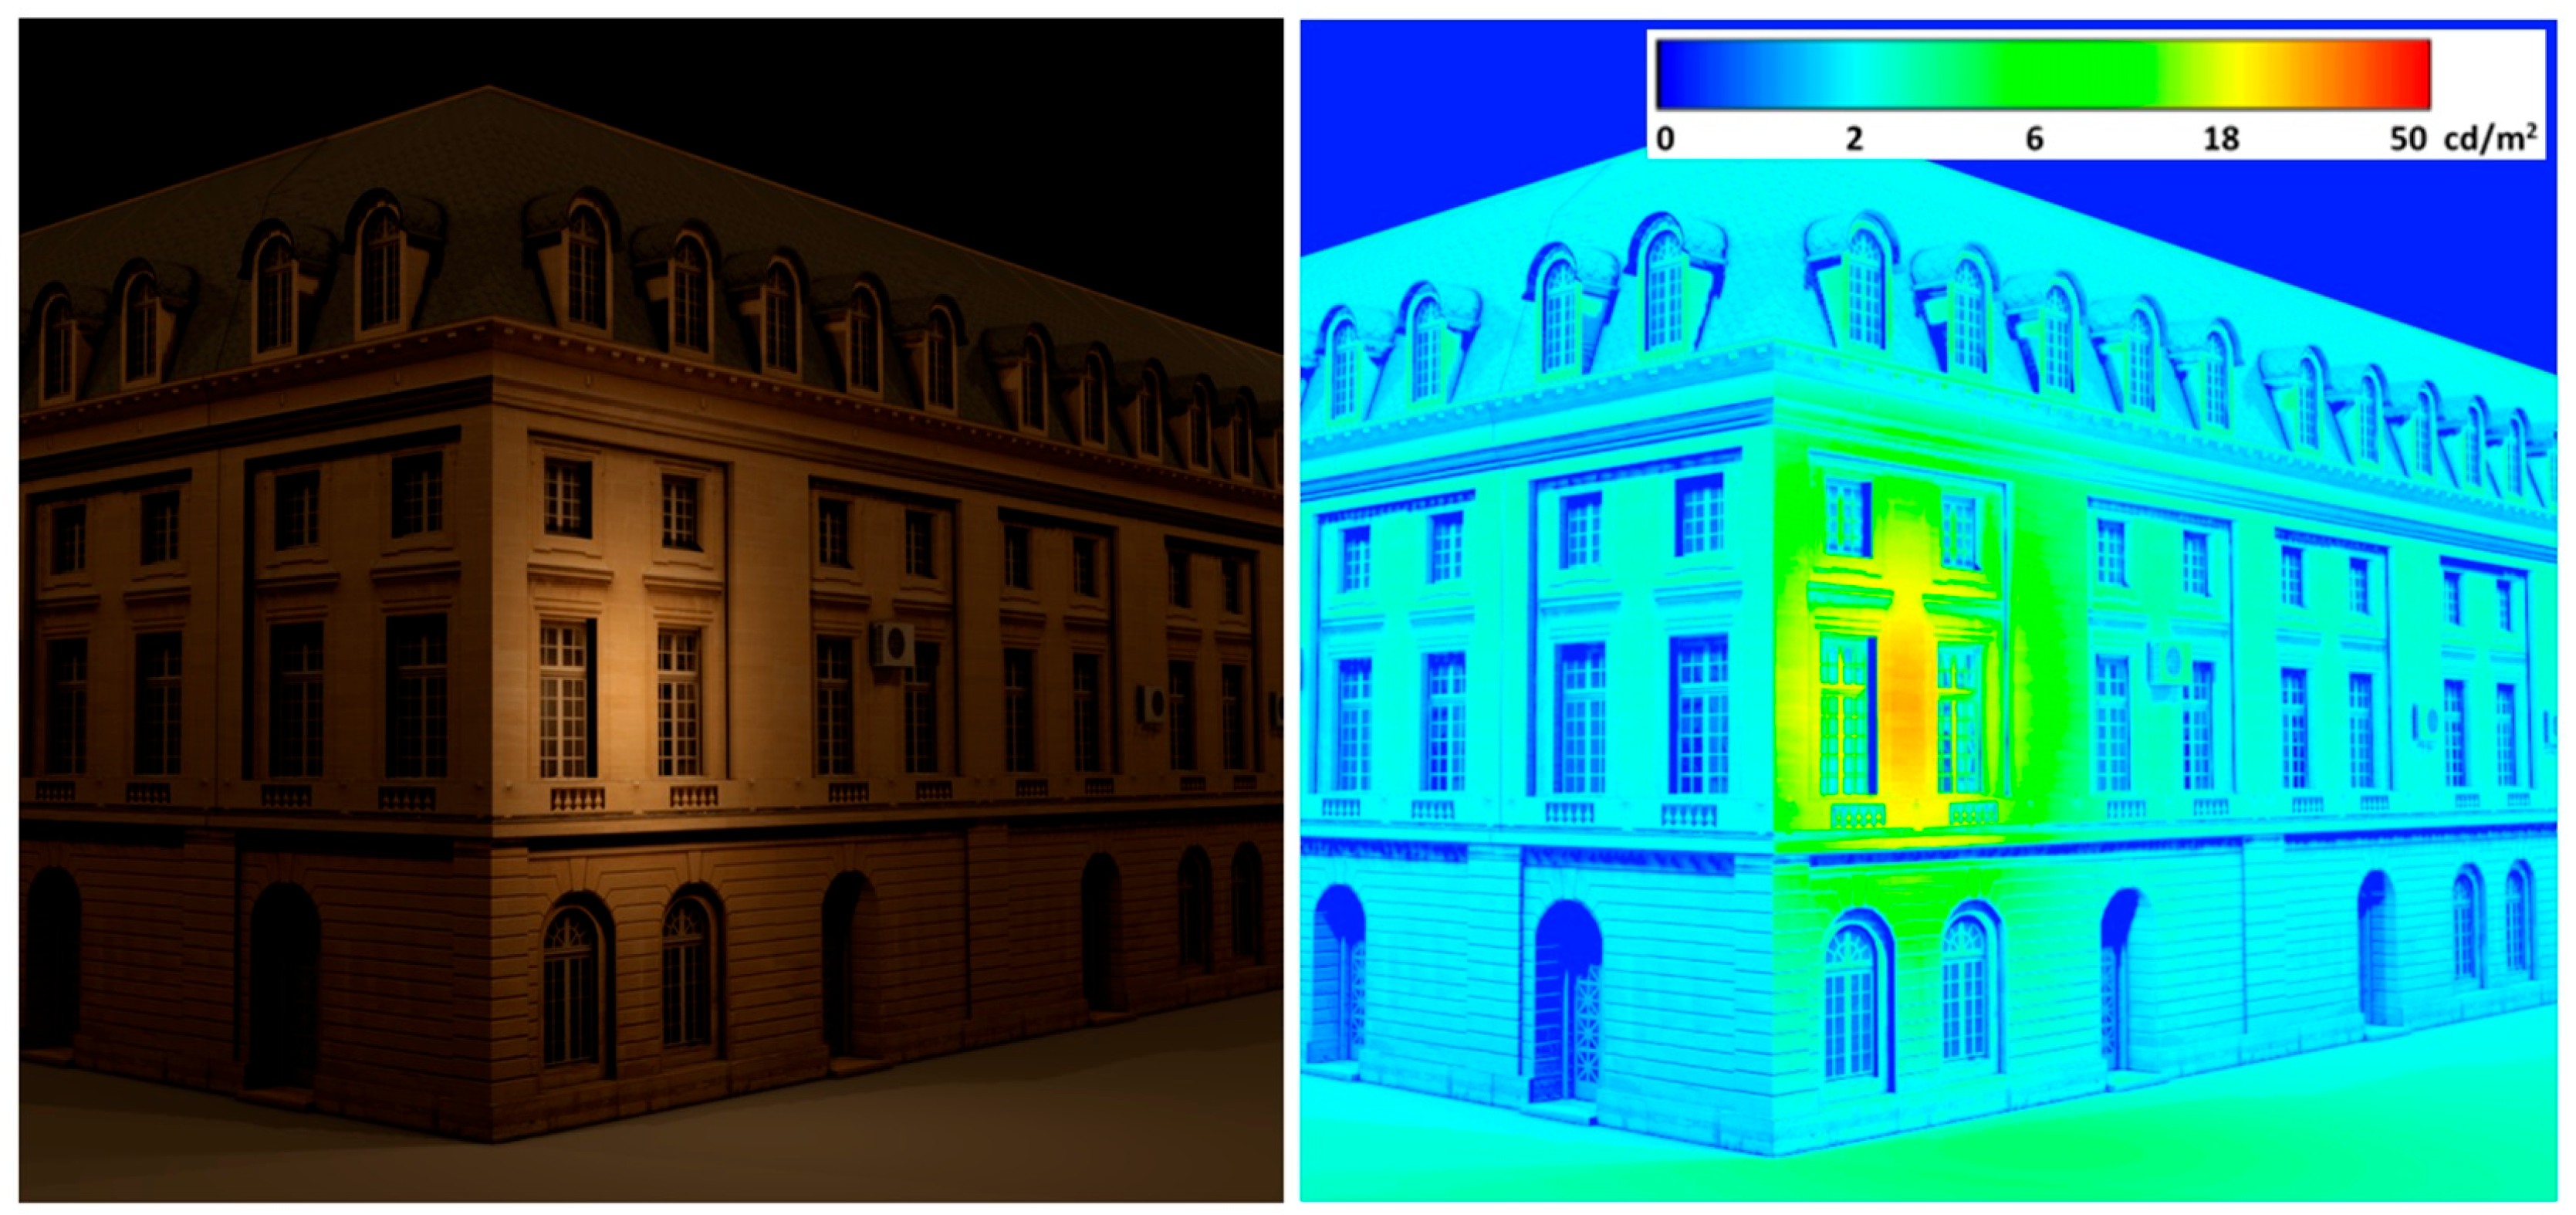
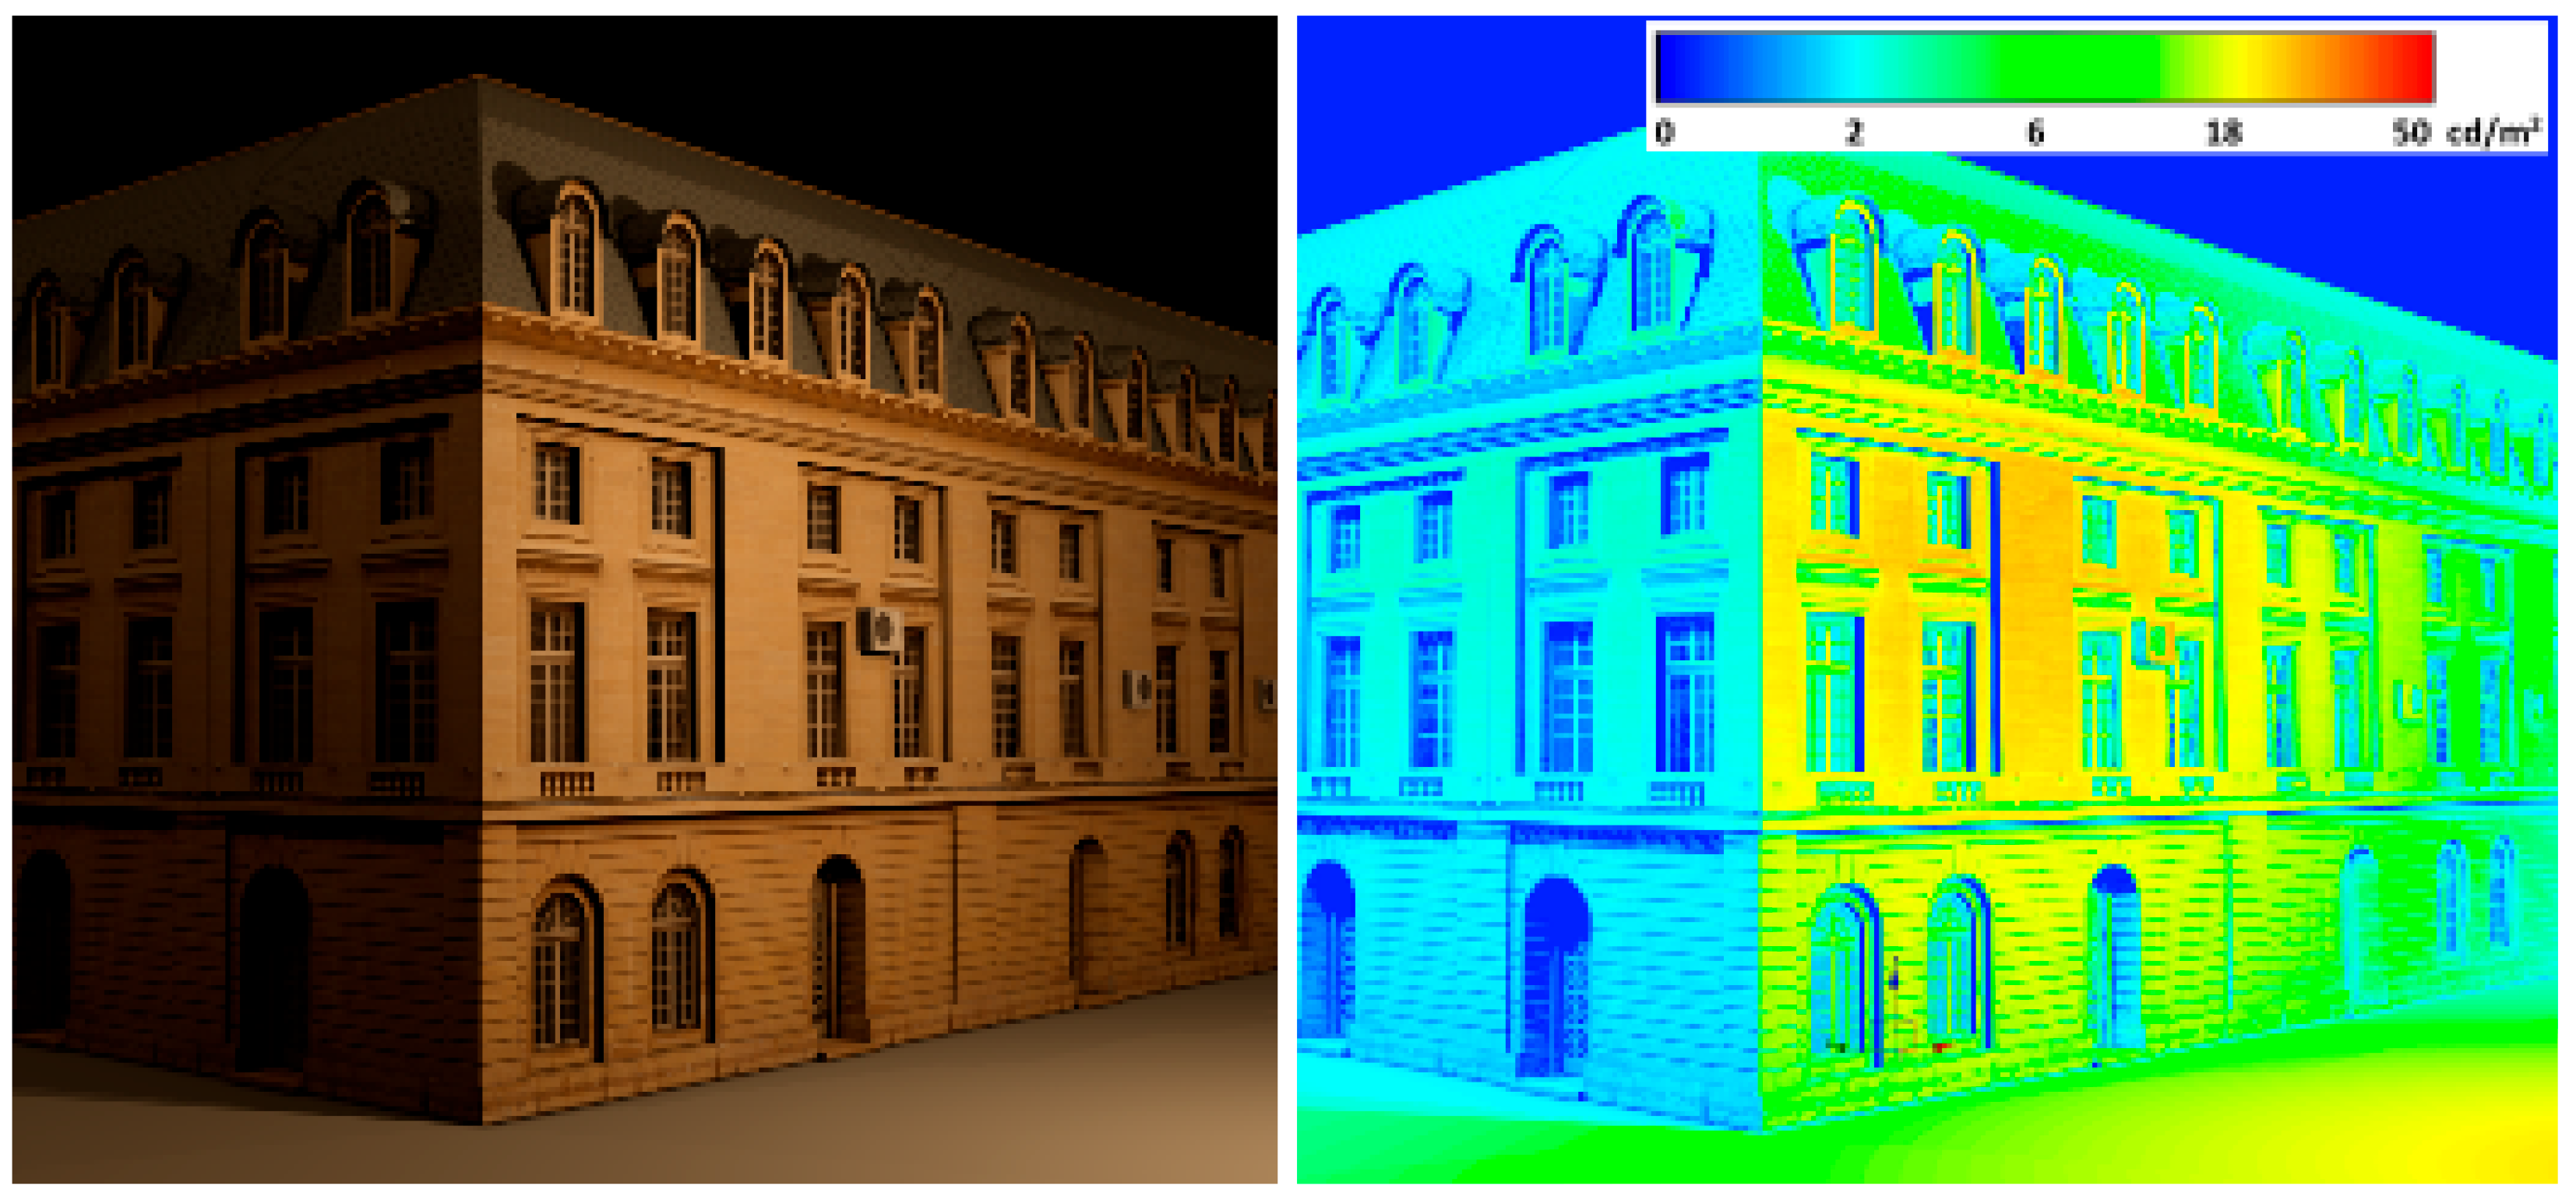
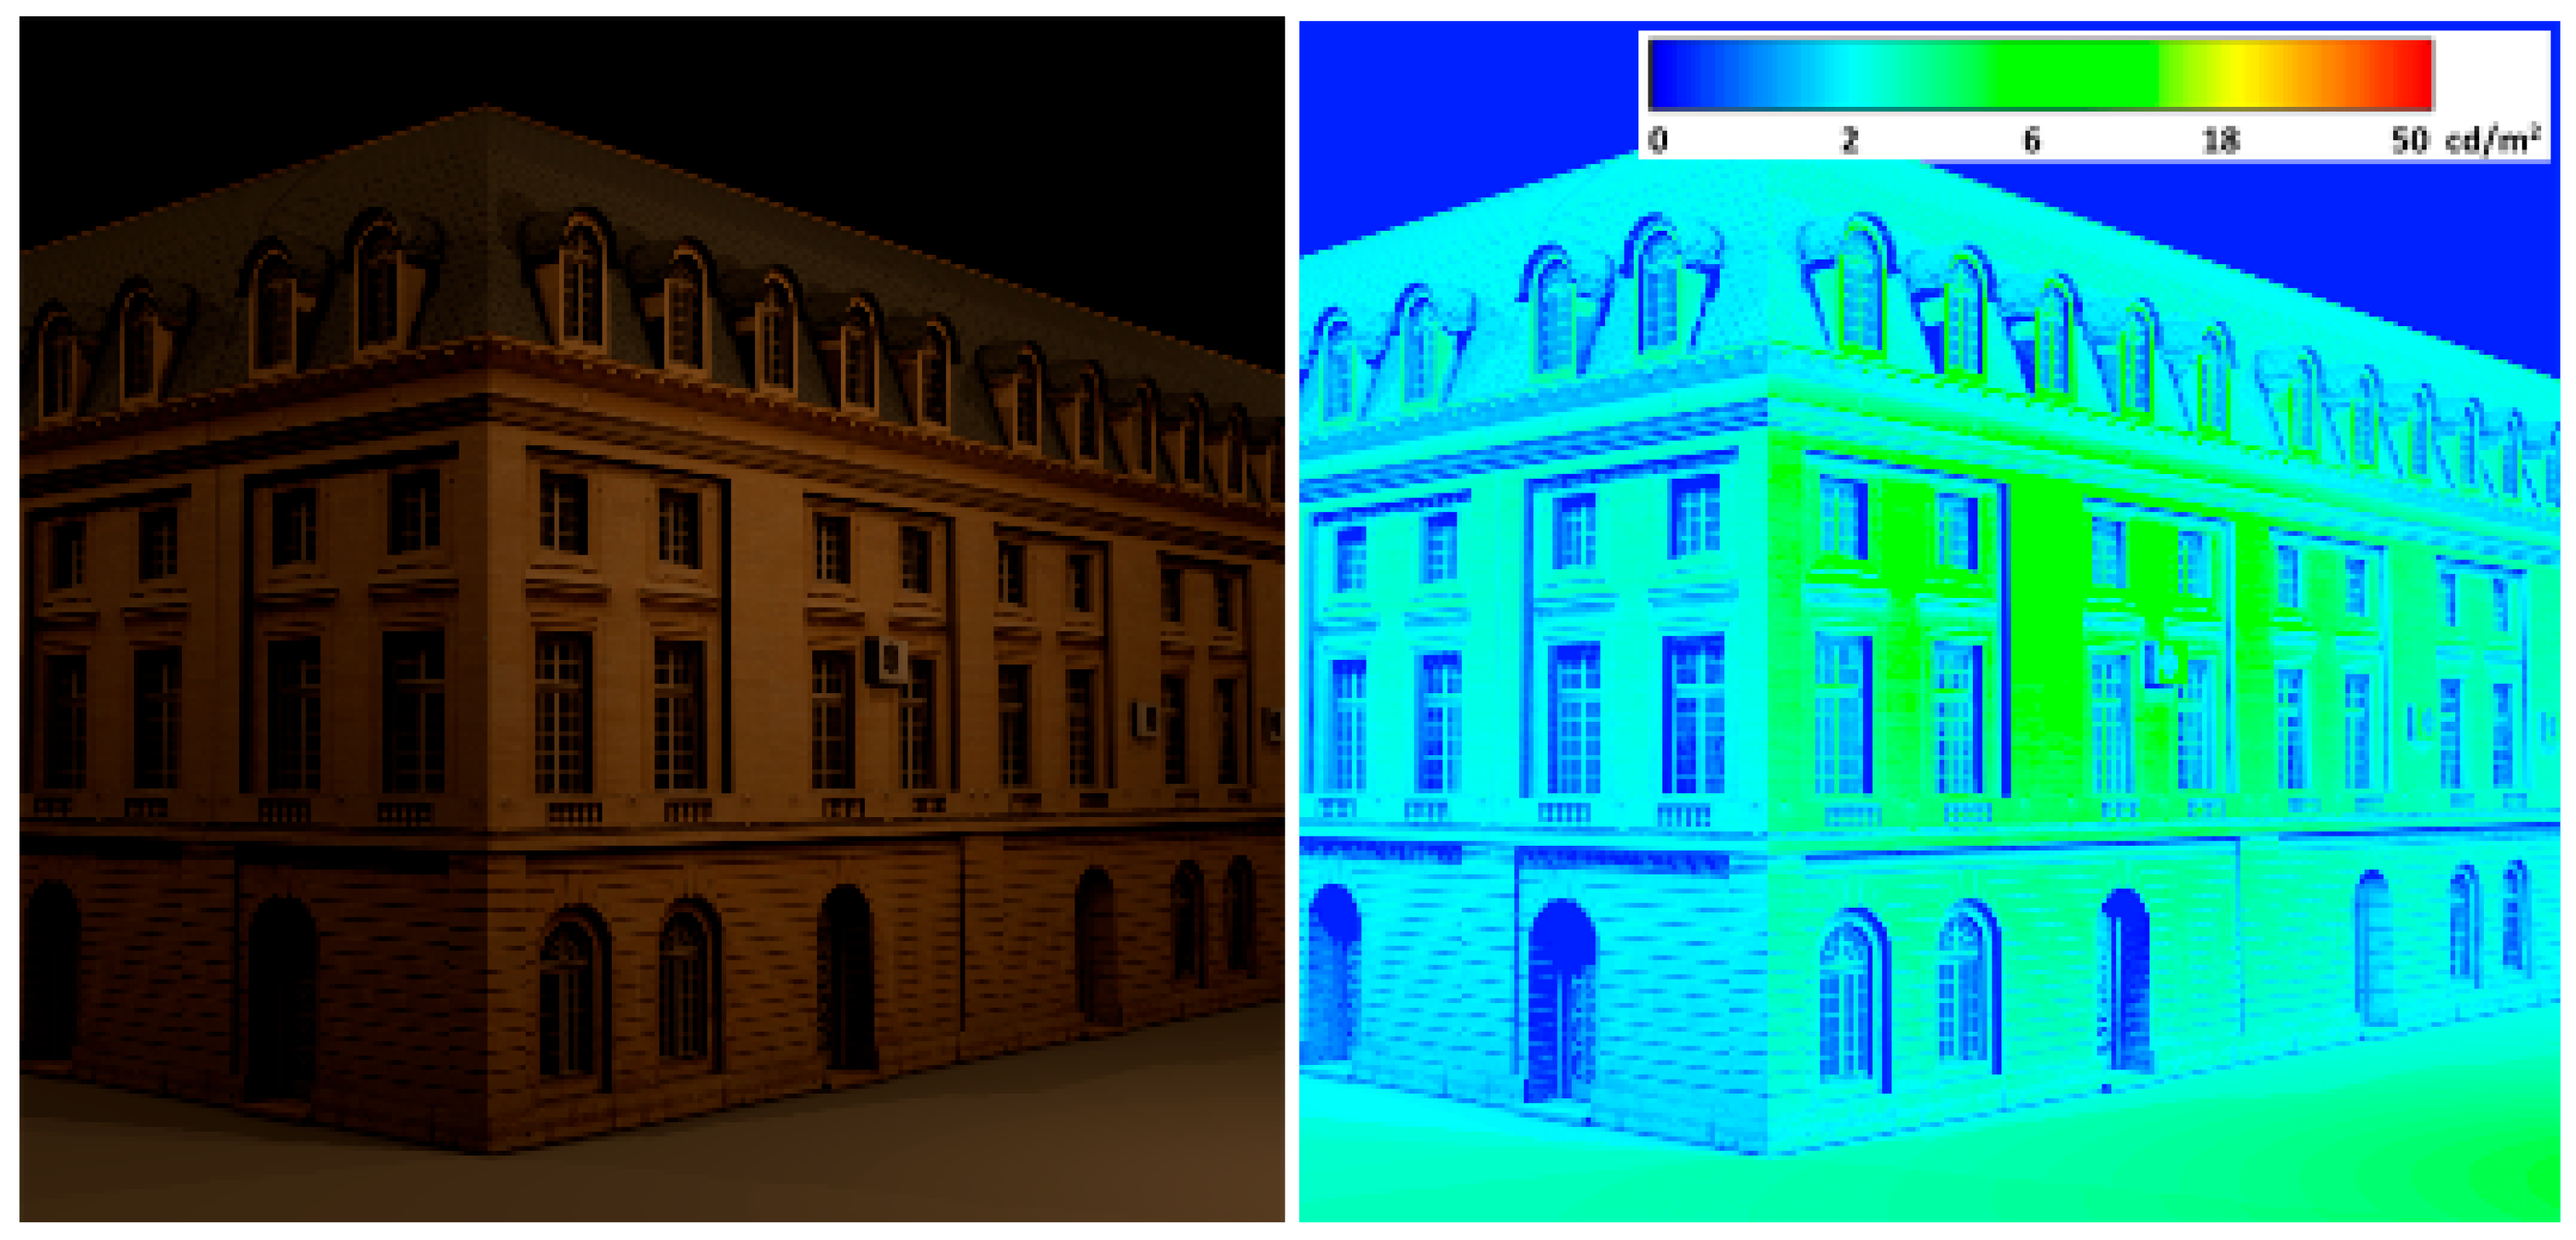
A set of the above factors can promote the creation of illumination conditions through which favorably placed and selected street lighting will have the potential to realize contour illumination of building facades. There may also be a situation where, most often, the street lighting fixtures are a significant distance from the facade, so the levels of luminance distribution on the facade will unfortunately not be high enough. There can also be a case, and this one is the most common, when, with the close proximity of a street luminaire to a facade, a high-intensity light spot is locally created on the facade. These three situations are illustrated in
Figure 2,
Figure 3 and
Figure 4.
The analysis of the options presented above makes it possible to pose the following questions: Can there be areas—fields on the façade—illuminated by the light of road luminaires that can be a component of flood illumination or even create flood illumination on their own? What are the illuminance levels generated by street lighting, and what uniformity of light spots can we achieve on the façade? Can street lighting alone create a contour illumination with a sufficiently high-intensity light spot, or can a not-so-intense but uniform illumination of the facade provide a foundation for zonal illumination, where it is only sufficient to deploy illuminators in close proximity to the facade?
The last variant, illustrated in
Figure 2, concerns a situation in which an intense, relatively small patch of light is created on the facade. The question then arises whether it is possible to offset it by proper selection of floodlighting fixtures. Current scientific publications analyze the impact of lighting on the facade of a building, however, only in the context of excessively high levels of illumination within the windows [
18,
19]. However, again, there are a large number of public facilities in which it is not necessary to analyze the impact of lighting on window zones, due to the working hours in such facilities.
Another problem to consider is the size and location of the light spot on the facade surface, where according to current recommendations and requirements of ULOR ([
32,
33] the luminous flux of outdoor lighting fixtures should be entirely directed into the lower half-space [
26,
27]. ULOR—Unified Glare Rating (ULR) is a measure used to quantify the discomfort caused by glare. There is a strong correlation here between the illumination of higher parts of the facades with the design specifics of street luminaire optics. Emission involving the penetration of too much light into structures through windows is not addressed in the current discussion. It was assumed that a significant part of the illuminated structures are historical, sacral, or public buildings, without a residential function. In this case, the impact of road lighting and illumination on the conditions of the facility during the evening and night hours is not considered.
The article presents the results of simulation studies related to the possibility of using the existing street and park lighting in the illumination of objects located in the close vicinity of the above-mentioned installations. The research was carried out on the impact of the applied street and park luminaires, their assembly geometry, applied power, and light distribution on the shaping of the light spot on the surface of the model illumination wall. Then, the average values of the illuminance of the light spots and their area were determined in terms of the possibility of creating direct illumination or creating an additional auxiliary component in the designed illumination. Finally, based on the detailed research, illumination of the real object was implemented using the existing street lighting.
2. Extent of Impact of Street Lighting on Facades of Architectural Structures
The detailed analysis involved the preparation of a facade model in the Dialux Evo simulation environment [
34] and the use of photometric solids of street and park luminaires to determine their effect on the size and intensity of the average luminance of the generated light spot on the facade surface. Luminaires with solid-state light sources, which have become the dominant solution in lighting technology in recent years, were used for the simulation. LED sources are characterized by high luminous efficacy and a high color rendering index, and their main limitation is thermal problems and the effect of connection temperature on light-electric performance [
35,
36,
37].
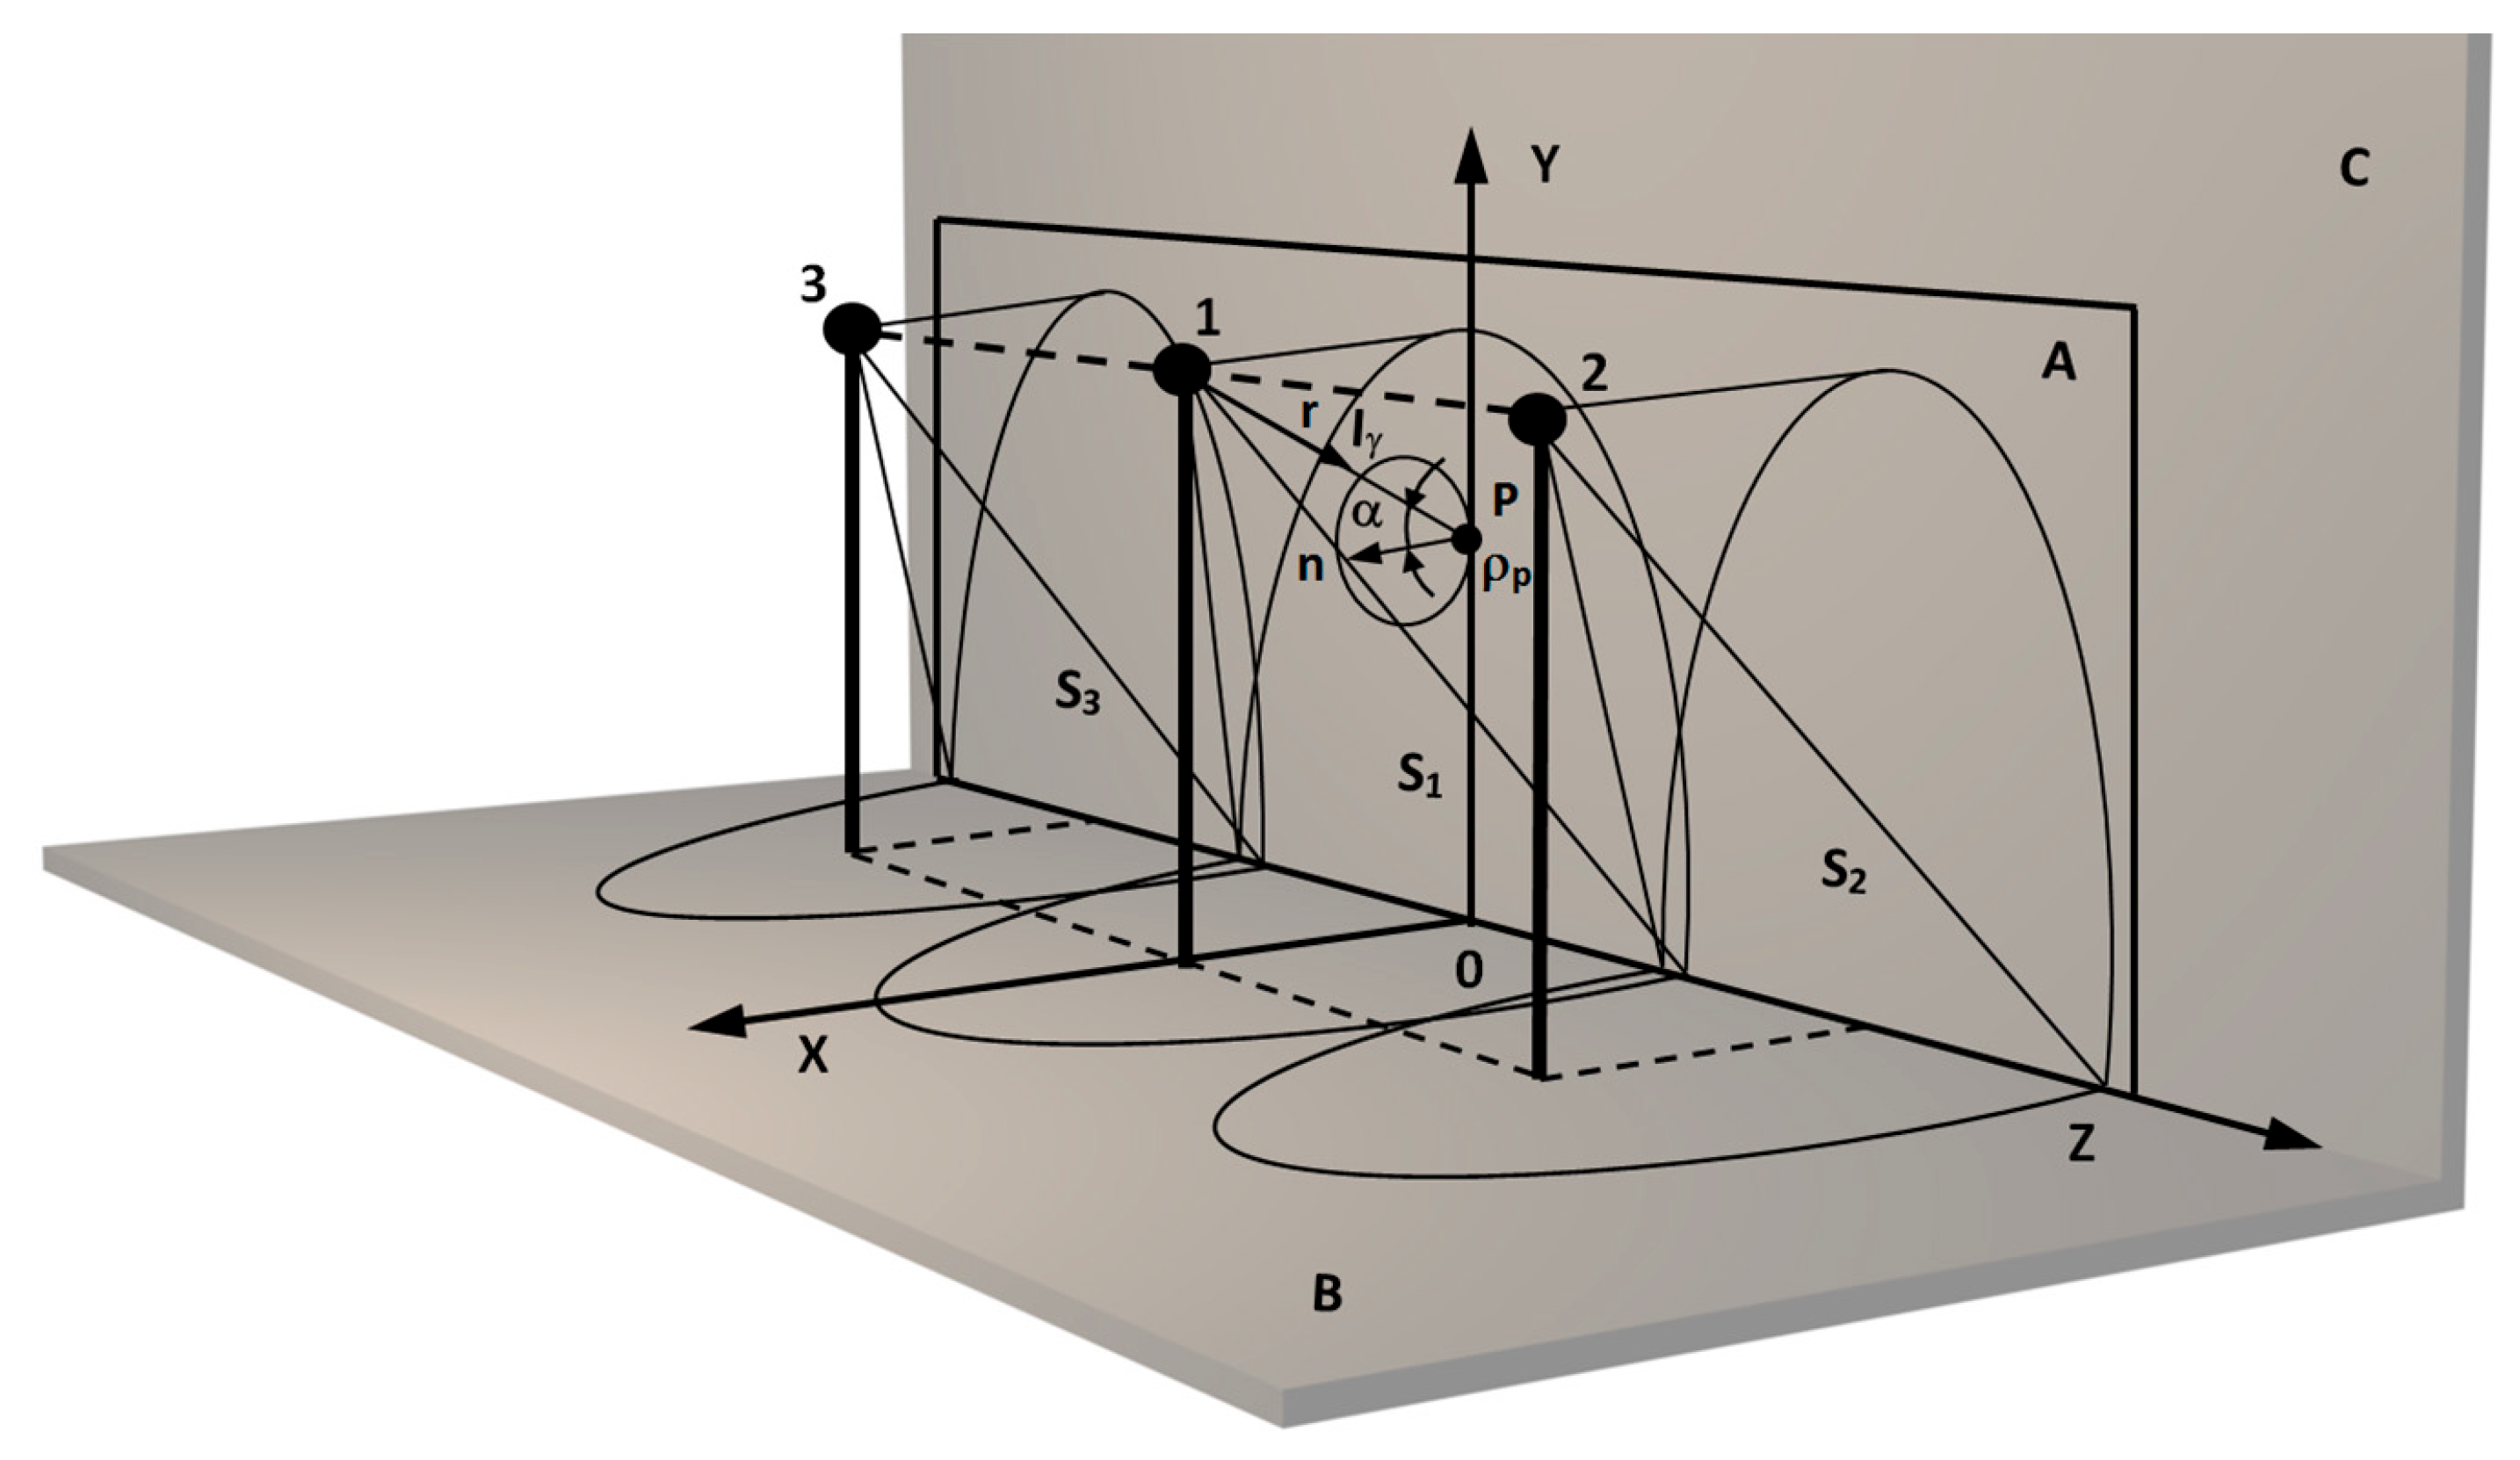
Figure 5 shows a simplified model of the light environment, which became the basis for developing a simulation model in specialized graphics software in the next step.
In the figure shown, the following quantities are defined: A—separated vertical calculation surface on projection screen; C, B—ground surface; (x,y,z)—Cartesian reference system; 1, 2, 3—street lighting luminaires; P—illuminance analysis point; Ep—illuminance at point P; r—distance from luminaire mounting point 1 to analysis point P; α—plane angle between normal to point P and segment r; Iγ—luminance of direction γ of luminaire 1 to point P; ρp—reflectance at point P; S1, S2, S3—areas of light spots on the design surface A; Lp—luminance at point P; α—is the plane angle between the normal n to the elementary surface of point P and the segment r.
The bundle of light rays emitted from the luminaire (1) in the γ direction towards the point P forms the luminosity I
γ. This luminosity depends on the nature of the luminaire’s distribution and results from the optics used and the luminous flux emitted in a given direction of space:
where:
ω—solid angle involving a bunch of elementary rays radiated in the direction of γ,
Φγ—luminous flux radiated in the direction of γ.
The luminous flux of a luminaire is defined as the product of the electrical power P
el and its luminous efficiency η according to the Formula (2):
where:
—electrical power of the luminaire,
η—luminous efficiency of the luminaire.
The light flux directed toward the facade will be partially absorbed and partially reflected by it. Facade surfaces are porous surfaces for the most part, so it is possible, when analyzing the nature of the expected distribution of the luminous flux of the luminaire, to assume that the elementary rays will be reflected from the example elementary surface of point P of the facade according to the Lambert law. In this situation, it is possible to determine the luminance L of the elementary surface (c) of the facade related to the reflectance
and the illuminance E on that surface:
where:
—reflectance of the analysis point P,
Ep—illuminance at the analysis point P,
Lp—luminance at the point of analysis P.
On the other hand, the illuminance E on the elementary surface (C) can be expressed by a relation representing the inverse square of the distance (4):
where:
—distance from the luminaire mounting point 1 to the analysis point P,
—plane angle between the normal to point P and the segment r,
—luminance of direction γ of light fixture 1 to point P.
From the above relationships, it can be seen that the distribution of luminance L
p on the facade will depend on the facade reflectance
and the distribution of illuminance E
p on the facade. This one will be related to the distance of the luminaire from the facade r, the nature of the luminaire’s luminous flux distribution, and the luminaire’s power P
el [
31].
The detailed research undertaken was directed toward the search for the dependence of the parameters defined above on the size of the light spot S formed on the facade with the expected uniformity of illumination.
The literature states that there should be a 2:1 relationship between the point maximum illuminance of a light spot on a facade and the minimum illuminance value within the spot [
31]. Such a gradient of illumination intensity ensures the uniformity of the light spot on the facade. Of course, for the perception points and the average luminance of the whole structure, the ratio should be 10:1, and the ratio of the luminance at the focal points to the ambient luminance should be 4:1. However, for the purpose of providing flood illumination that provides contour illumination of the facade, only the first of these recommendations will apply.
Typically, scientific publications on illumination make use of the notion of magnitude of luminance. There is a good reason for this, as the illuminated surfaces of the facades of buildings become secondary light emitters. In such a situation, however, it is necessary to have a reflectance value for each case of illumination under consideration
. This is related to the color of the facade and its level of porosity [
38]. In the presented considerations, keeping in mind the broader context beyond the strictly defined concepts of illumination and concerning the lighting conditions created by street luminaires, it is proposed to use the distribution of illuminance on the facade. This approach will further allow us to conduct an analysis of facade lighting conditions without referring to the limitations associated with the need to define the reflectance. This will make it possible to derive research conclusions in a wider range referring to the variety of colors and types of facade materials of architectural objects that occur in reality.
For detailed analysis, an x, y, and z coordinate system was introduced, with its origin fixed as shown in
Figure 5. The x-direction is related to the location of the light pole shafts along the traffic route and the optical layout of the luminaires used. There are situations where a single pole with a battery of street luminaires is located on the
x-axis. In the
y-axis, the light spot forms a distribution pattern of the luminance on the facade. Its uniformity, shape, size, and location are closely related to the height of the street luminaire mounting and the optical system used. The third direction relates to the distance of the light poles from the facade to the luminance of the light spot and its size on the facade. Thus, it is possible to distinguish five features of the light spot (its range of influence) formed on the facade as a result of it being illuminated with street luminaires. These are the average luminance of the light spot, the distribution of the light spot, the size of the light spot, the shape of the light spot, and the location of the light spot. A set of these characteristics in some circumstances can create conditions favorable to the illumination concept under development, becoming a component of the illumination, while in other situations, it is a factor that significantly hinders the selection of illumination luminaires by generating spots of light that are small in terms of area but highly intense on parts of the facade [
39,
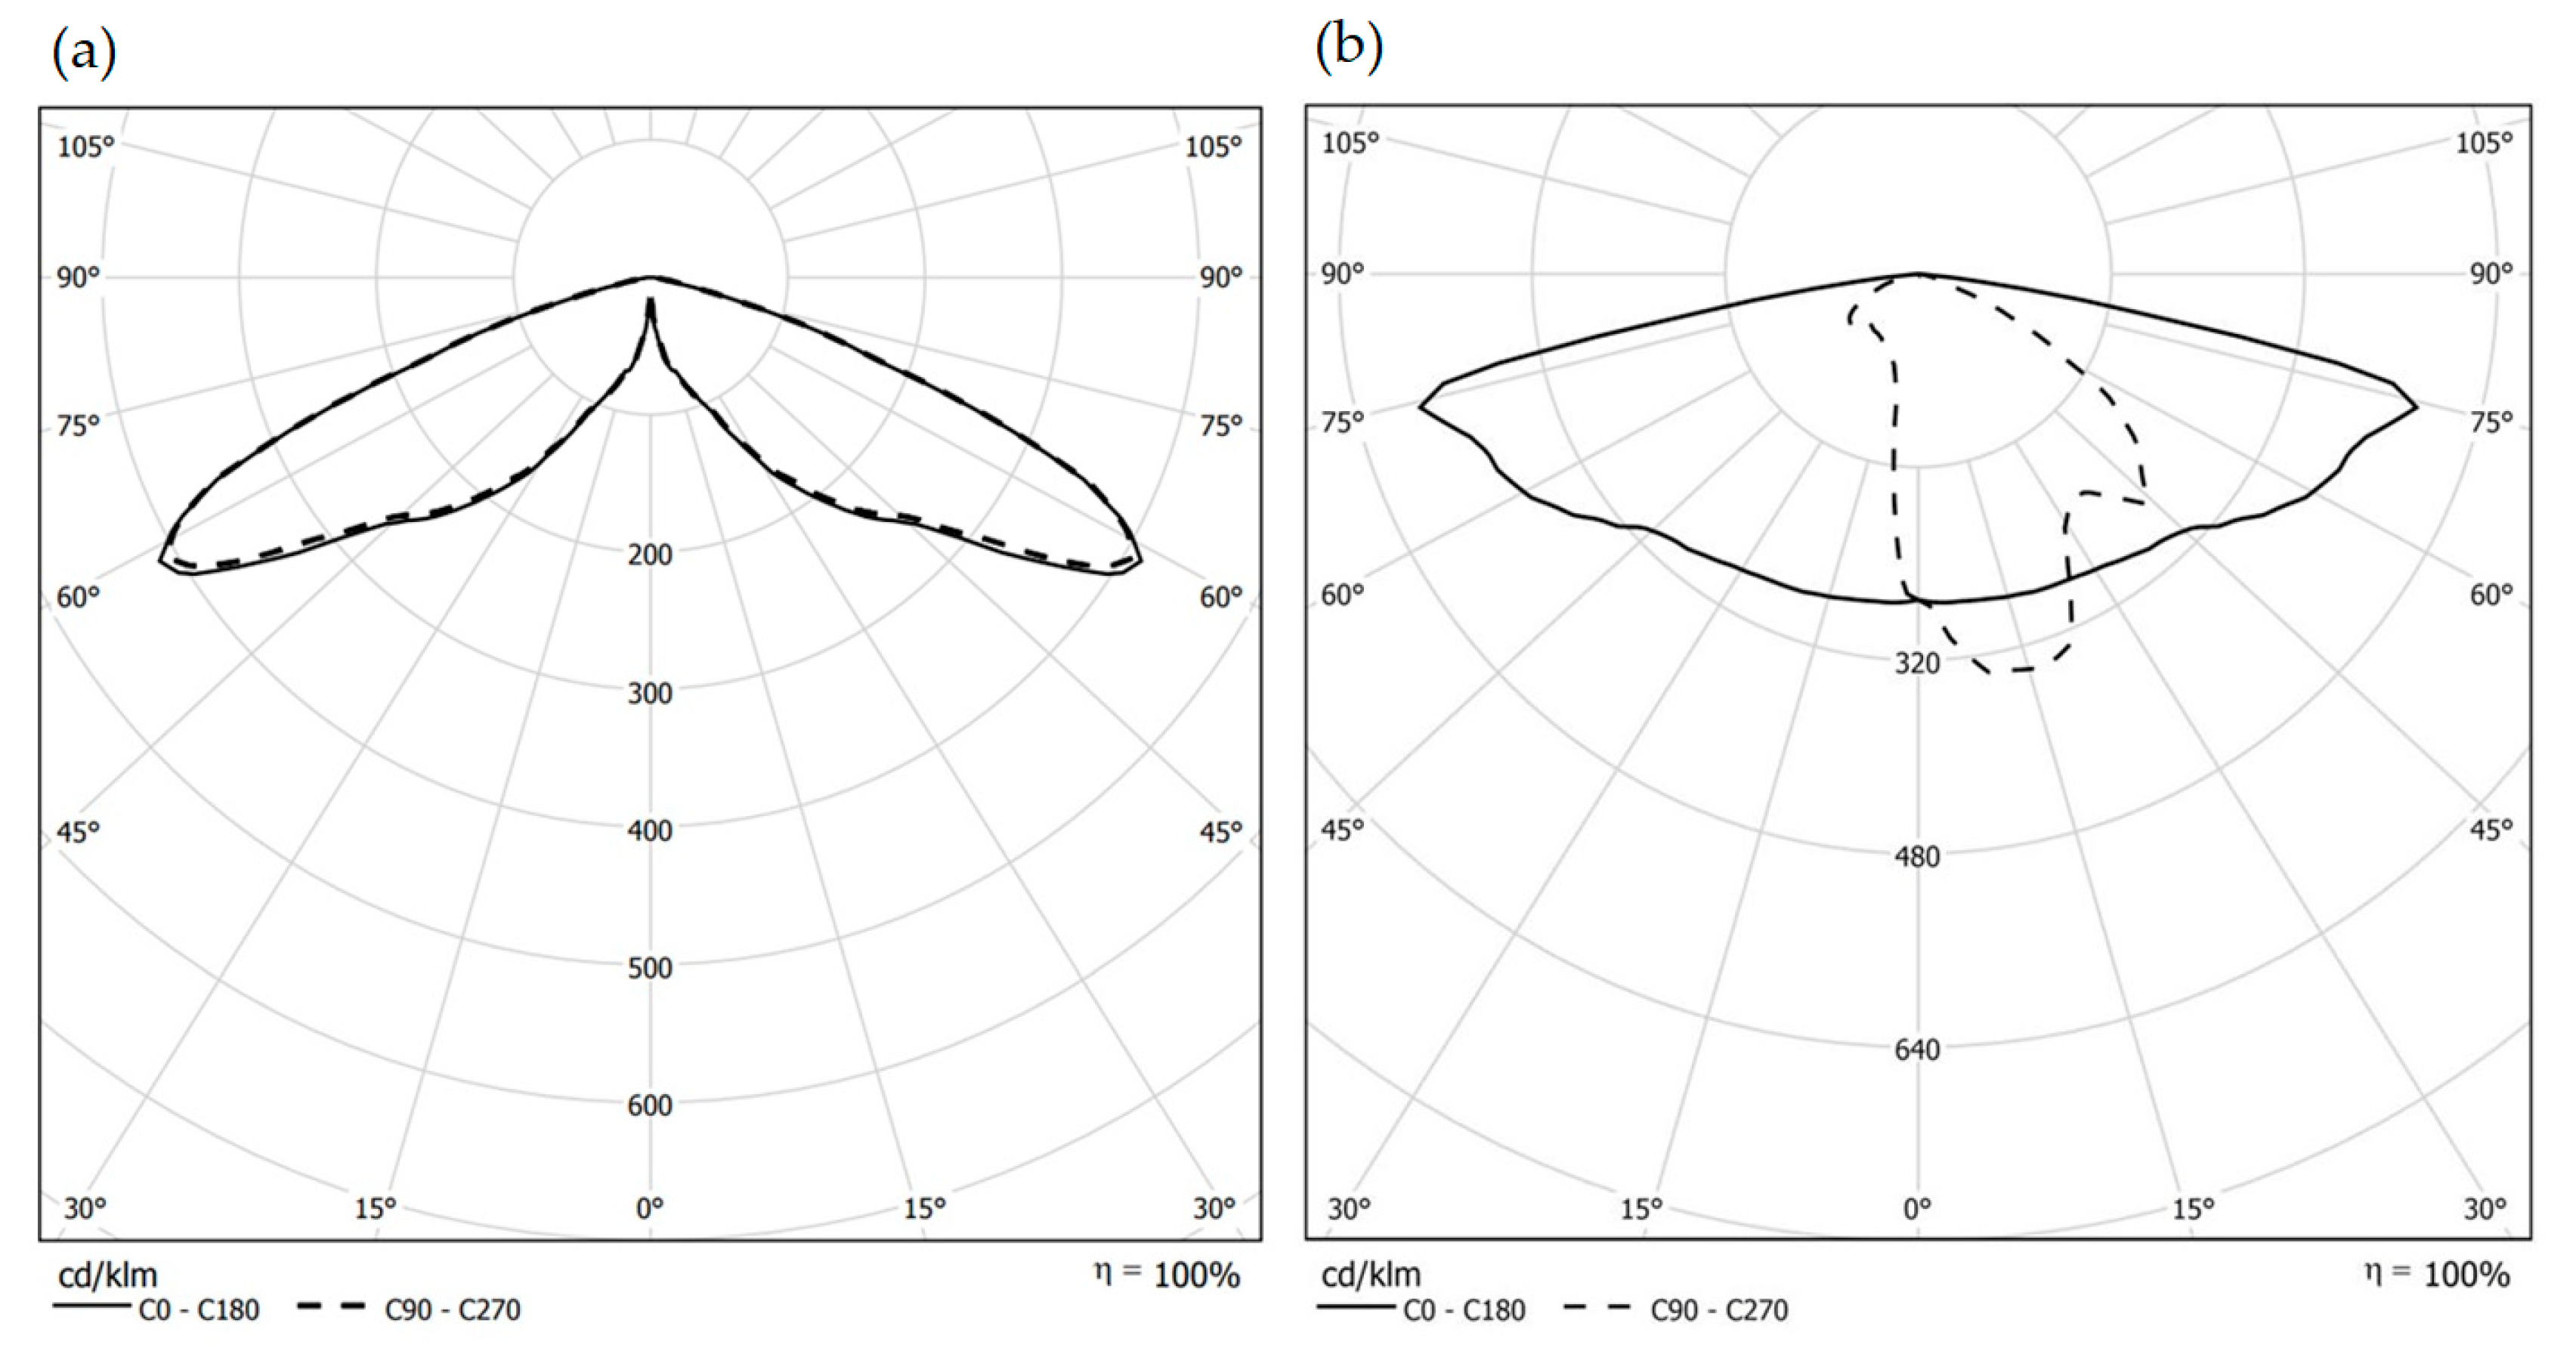
40]. In the analysis in question, two types of outdoor lighting fixtures were used: a road luminaire and a decorative street-lamp type fixture. Typical propagation characteristics of these two design solutions are presented in
Figure 6.
It should be noted that many leading manufacturers of street and park luminaires offer a whole range of dedicated optical systems for particular types of luminaires. This creates difficulties in choosing the most typical light curves for the representation of street and park luminaires. Therefore, in the conducted research, it was decided to divide the optical systems used into those with rotationally symmetric and asymmetric characteristics. As noted, the work did not use the classic parameter of luminance distribution to assess the state of illumination. The use of this quantity must be related to the light reflectance of the material reflecting the light rays emitted from the floodlights. In real conditions, the façade’s light reflection coefficient will depend on a number of factors, such as the degree of dirt on the façade and the heterogeneous colors of the façade, windows, etc. Therefore, the level of impact of street or park lighting in given real conditions and a specific facility should be considered individually.
In both cases, the impact of part of the luminaires’ luminous flux in the upper half-space was minimized in accordance with current regulations. This will be important in effectively illuminating the higher facades of architectural structures. For the park luminaire version, a variant with street light distribution was also evaluated.
3. Obtained Results of Simulation Calculations
Starting the detailed analysis, a reference model was prepared. The external dimensions of the façade model were 15 m high and 30 m wide. This is due to two conditions relating to the height and width of the model. The model should, within the adopted dimension of the length of the facade, give the opportunity to freely carry out tests with different distances between the lighting luminaires that occur in reality. A classic example of this is, for example, a market square with a series of lanterns located along the frontage. The proposed vertical dimension of the model results from the different heights of park and street poles used in reality. The height dimension was chosen to allow simulation tests to be carried out on the highest street poles (12 m) and park poles (8 m). This corresponds to the facade of a building with three or four floors, depending on the style of the building. Based on the discussed spatial model of the facade and street and park luminaires, a detailed analysis of the distribution of luminous flux in space was carried out using the Dialux Evo simulation tool. To carry it out, five main factors affecting the size, shape, and intensity of the light spot on the facade surface were selected: the effect of the distance of the luminaires from the facade surface, the effect of the mounting height of the luminaires, the effect of the luminaire power used, the effect of the light curve and the possibility of light spots from neighboring luminaires overlapping. For the above cases, the most characteristic range of parameter sizes related to the distribution and power of luminaires, encountered within the inner city, was selected.
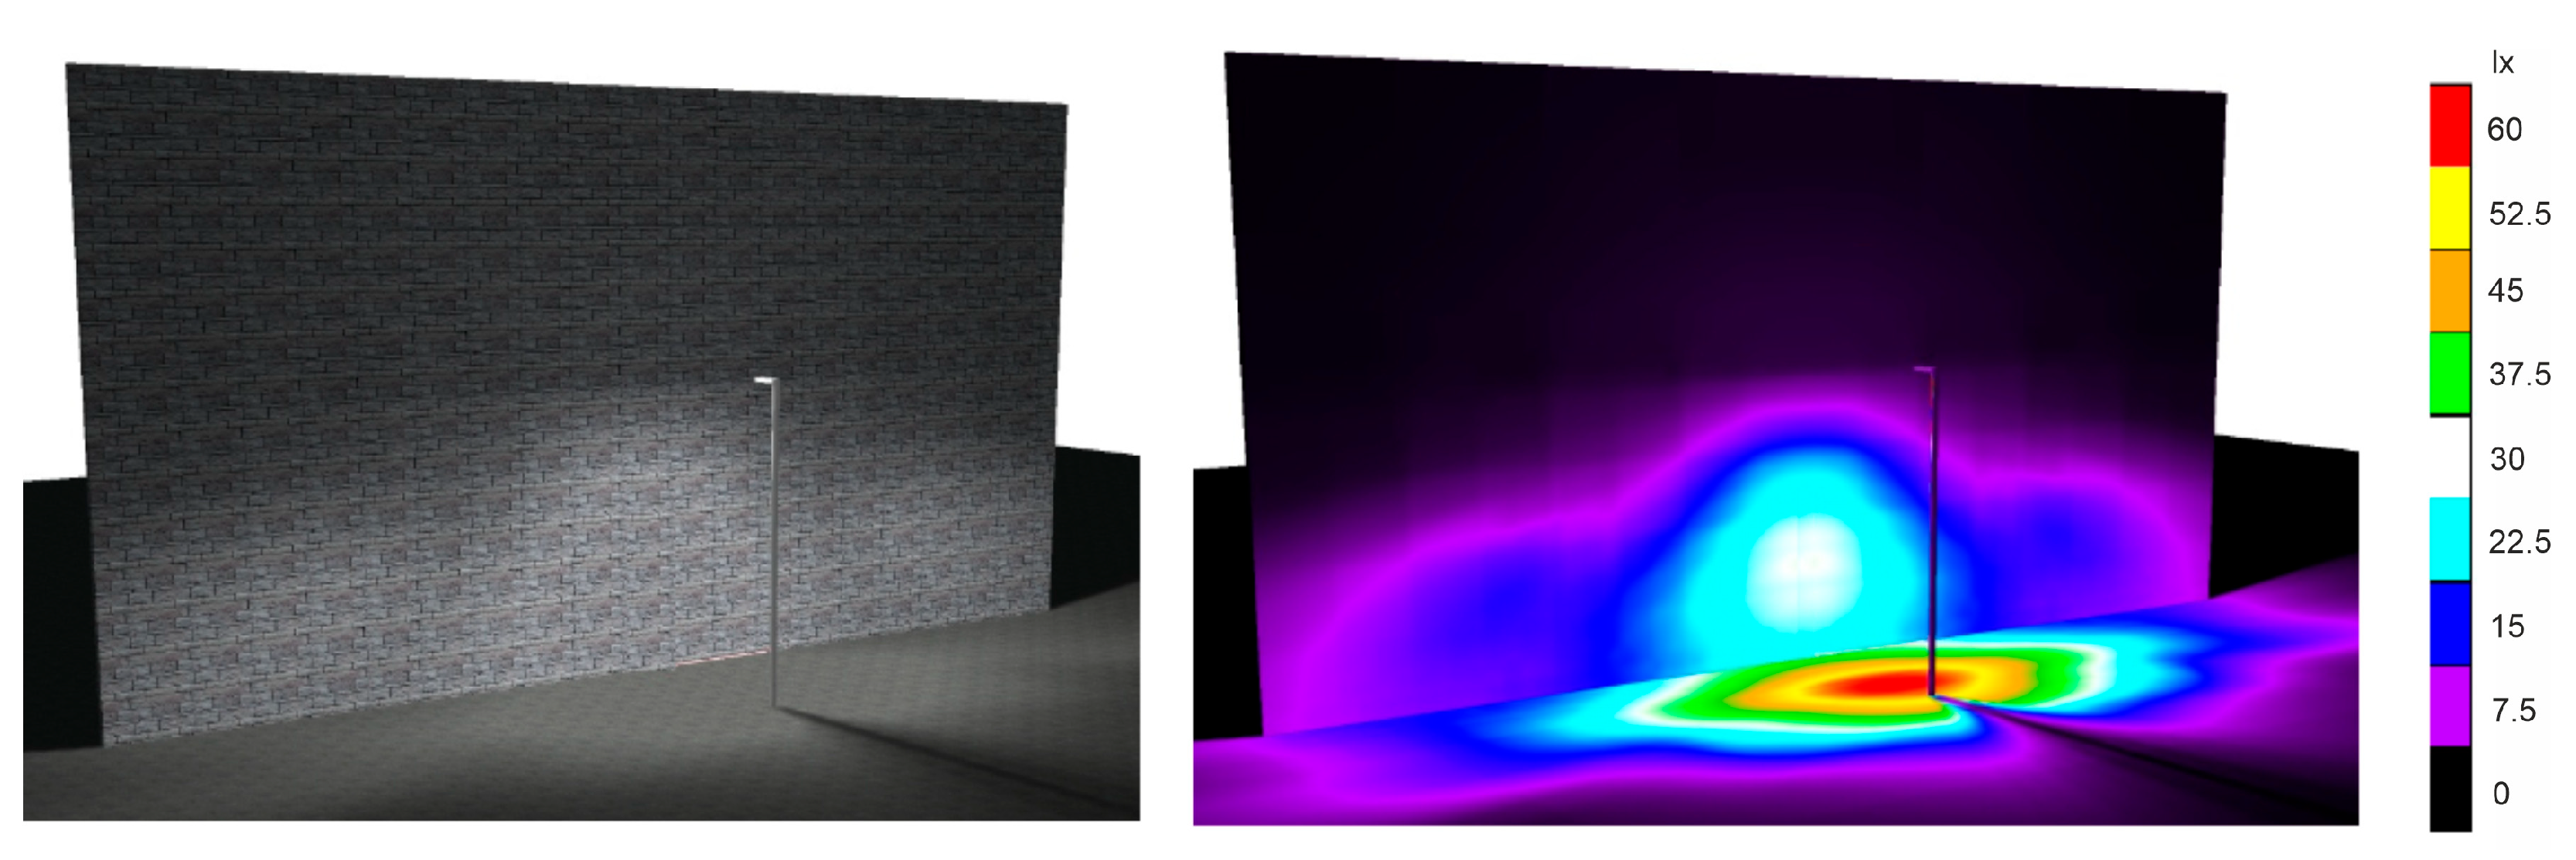
Figure 7 shows an example visualization of the actual view and the distribution of illuminance on the surface of the facade illuminated by the street luminaire.
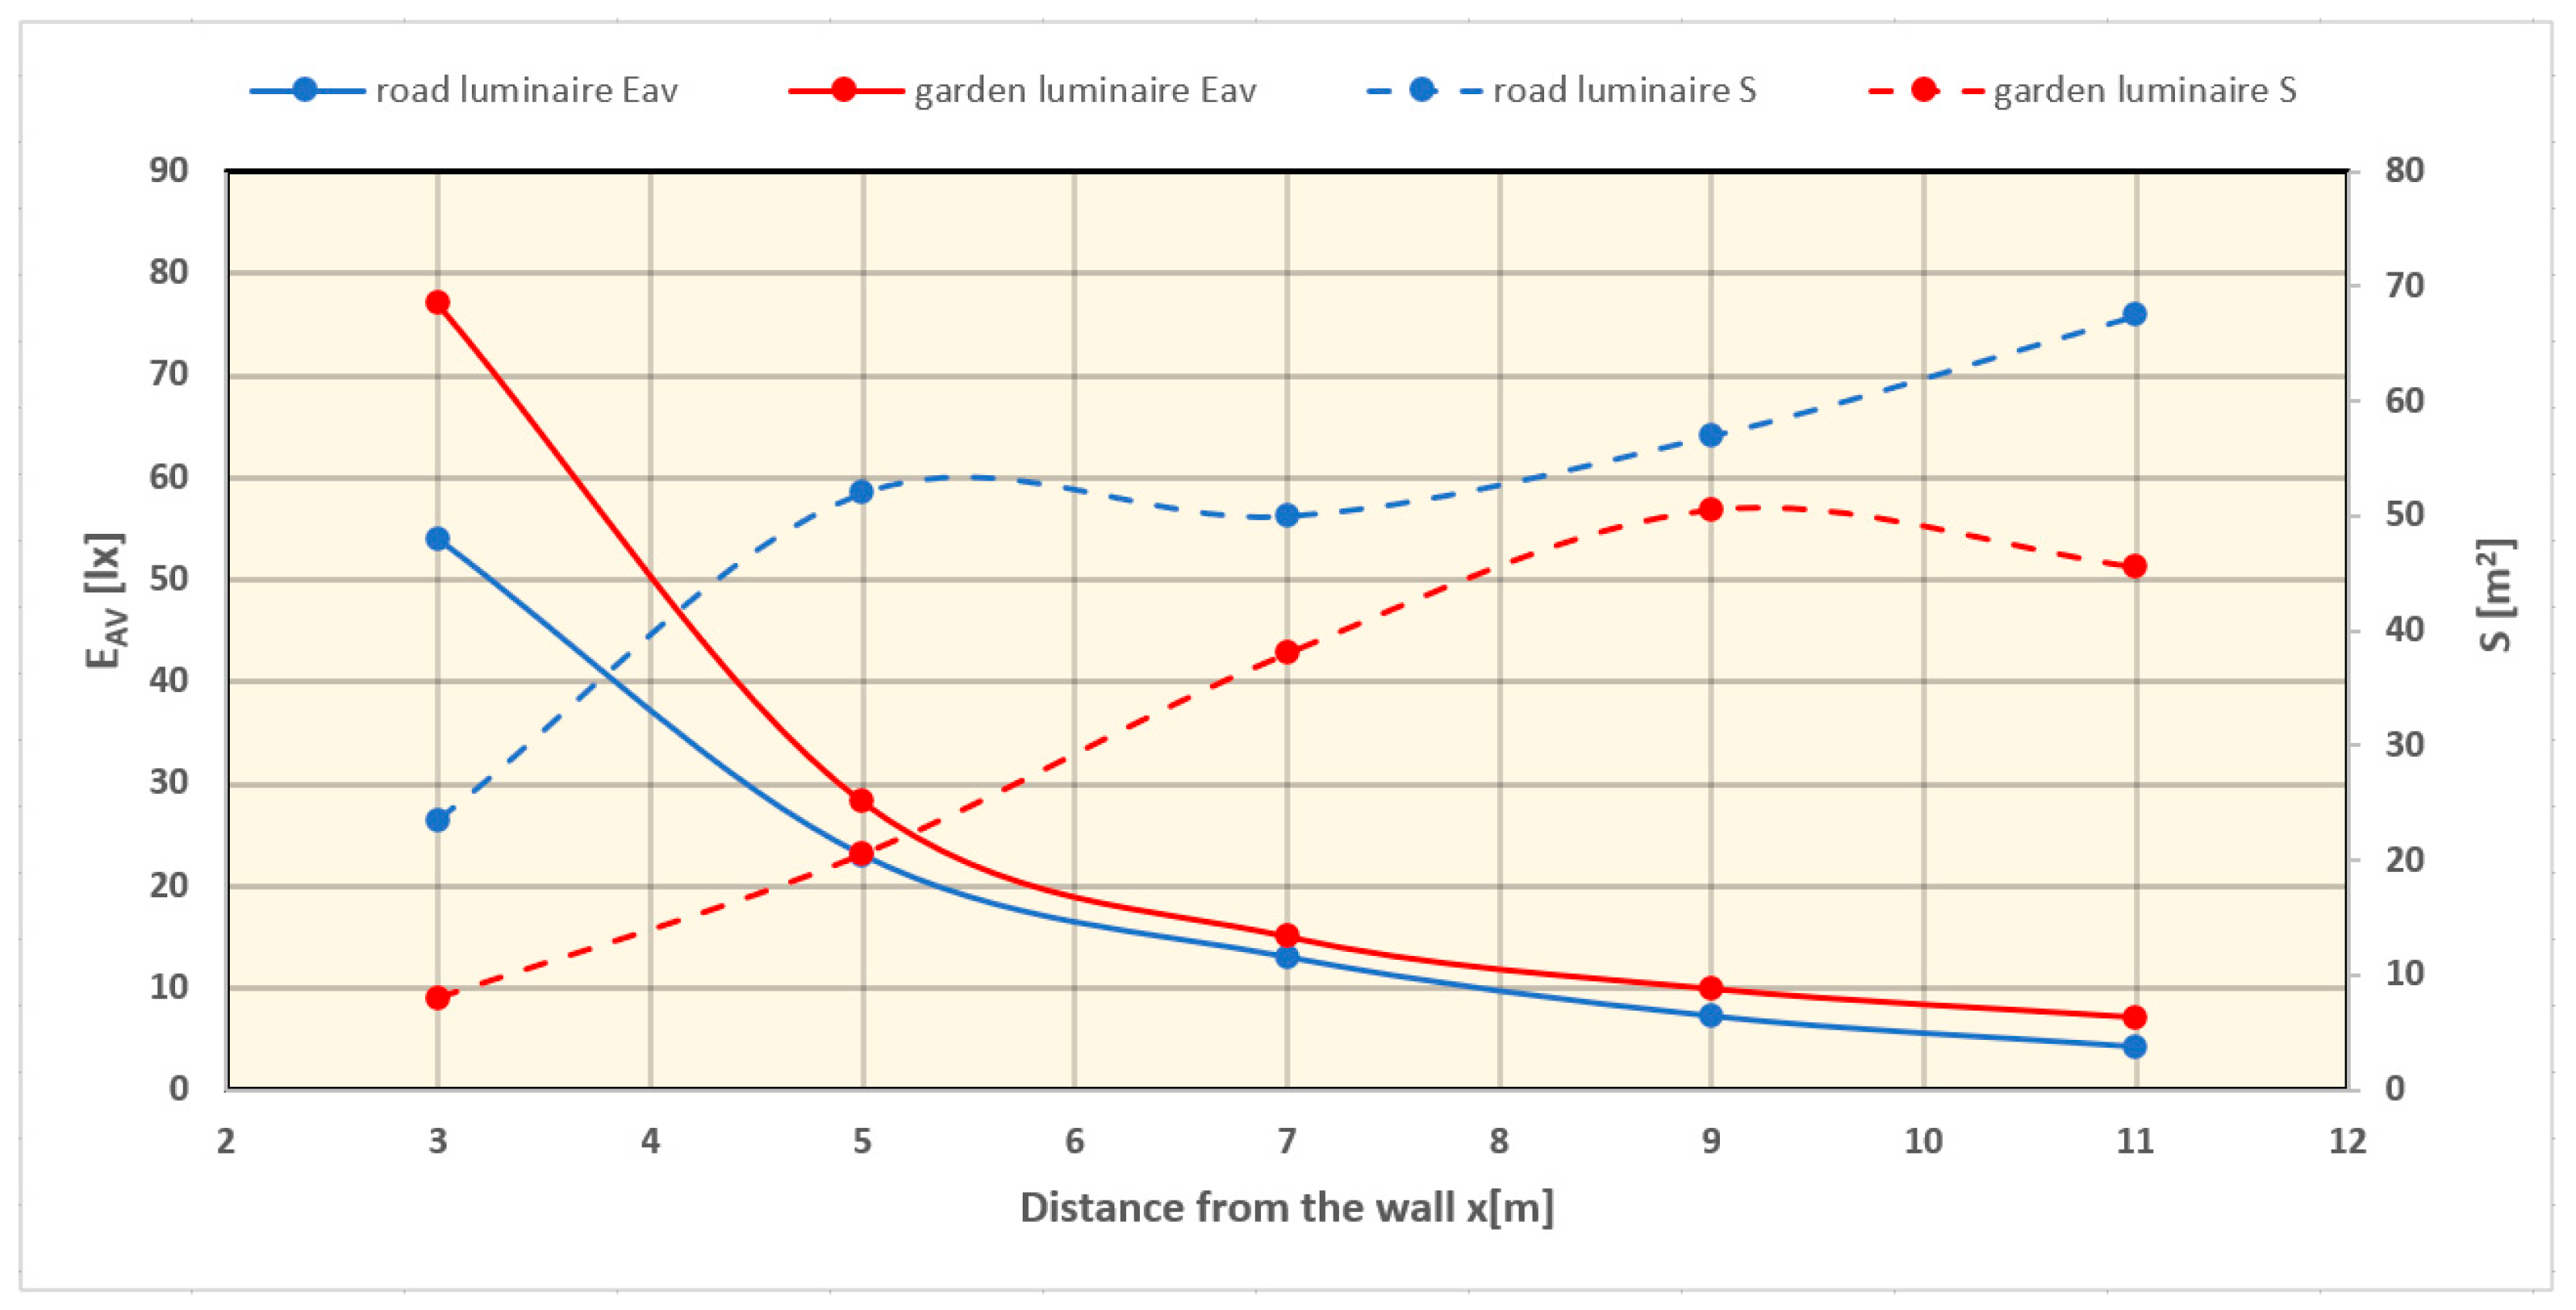
Figure 8 shows the effect of the distance of the luminaires from the surface of the facade wall on the obtained values of the average illuminance and the area of the light spot, meeting the condition of the 2:1 ratio of maximum illuminance to minimum illuminance.
For the above case, the distance of the street and park luminaire from the facade surface was changed from 3 to 11 m. This is a typical range of luminaire installation distances from buildings in downtown areas that meets the requirements for narrow streets and sidewalks as well as wider roads with high traffic volumes. The street luminaire was characterized by a power output of 68 watts and the light distribution shown in
Figure 6b. The park luminaire had a power of P
el = 35 W and a light curve as shown in
Figure 6a. The mounting height for the street luminaire was 8 m, while for the park luminaire, it was 6 m.
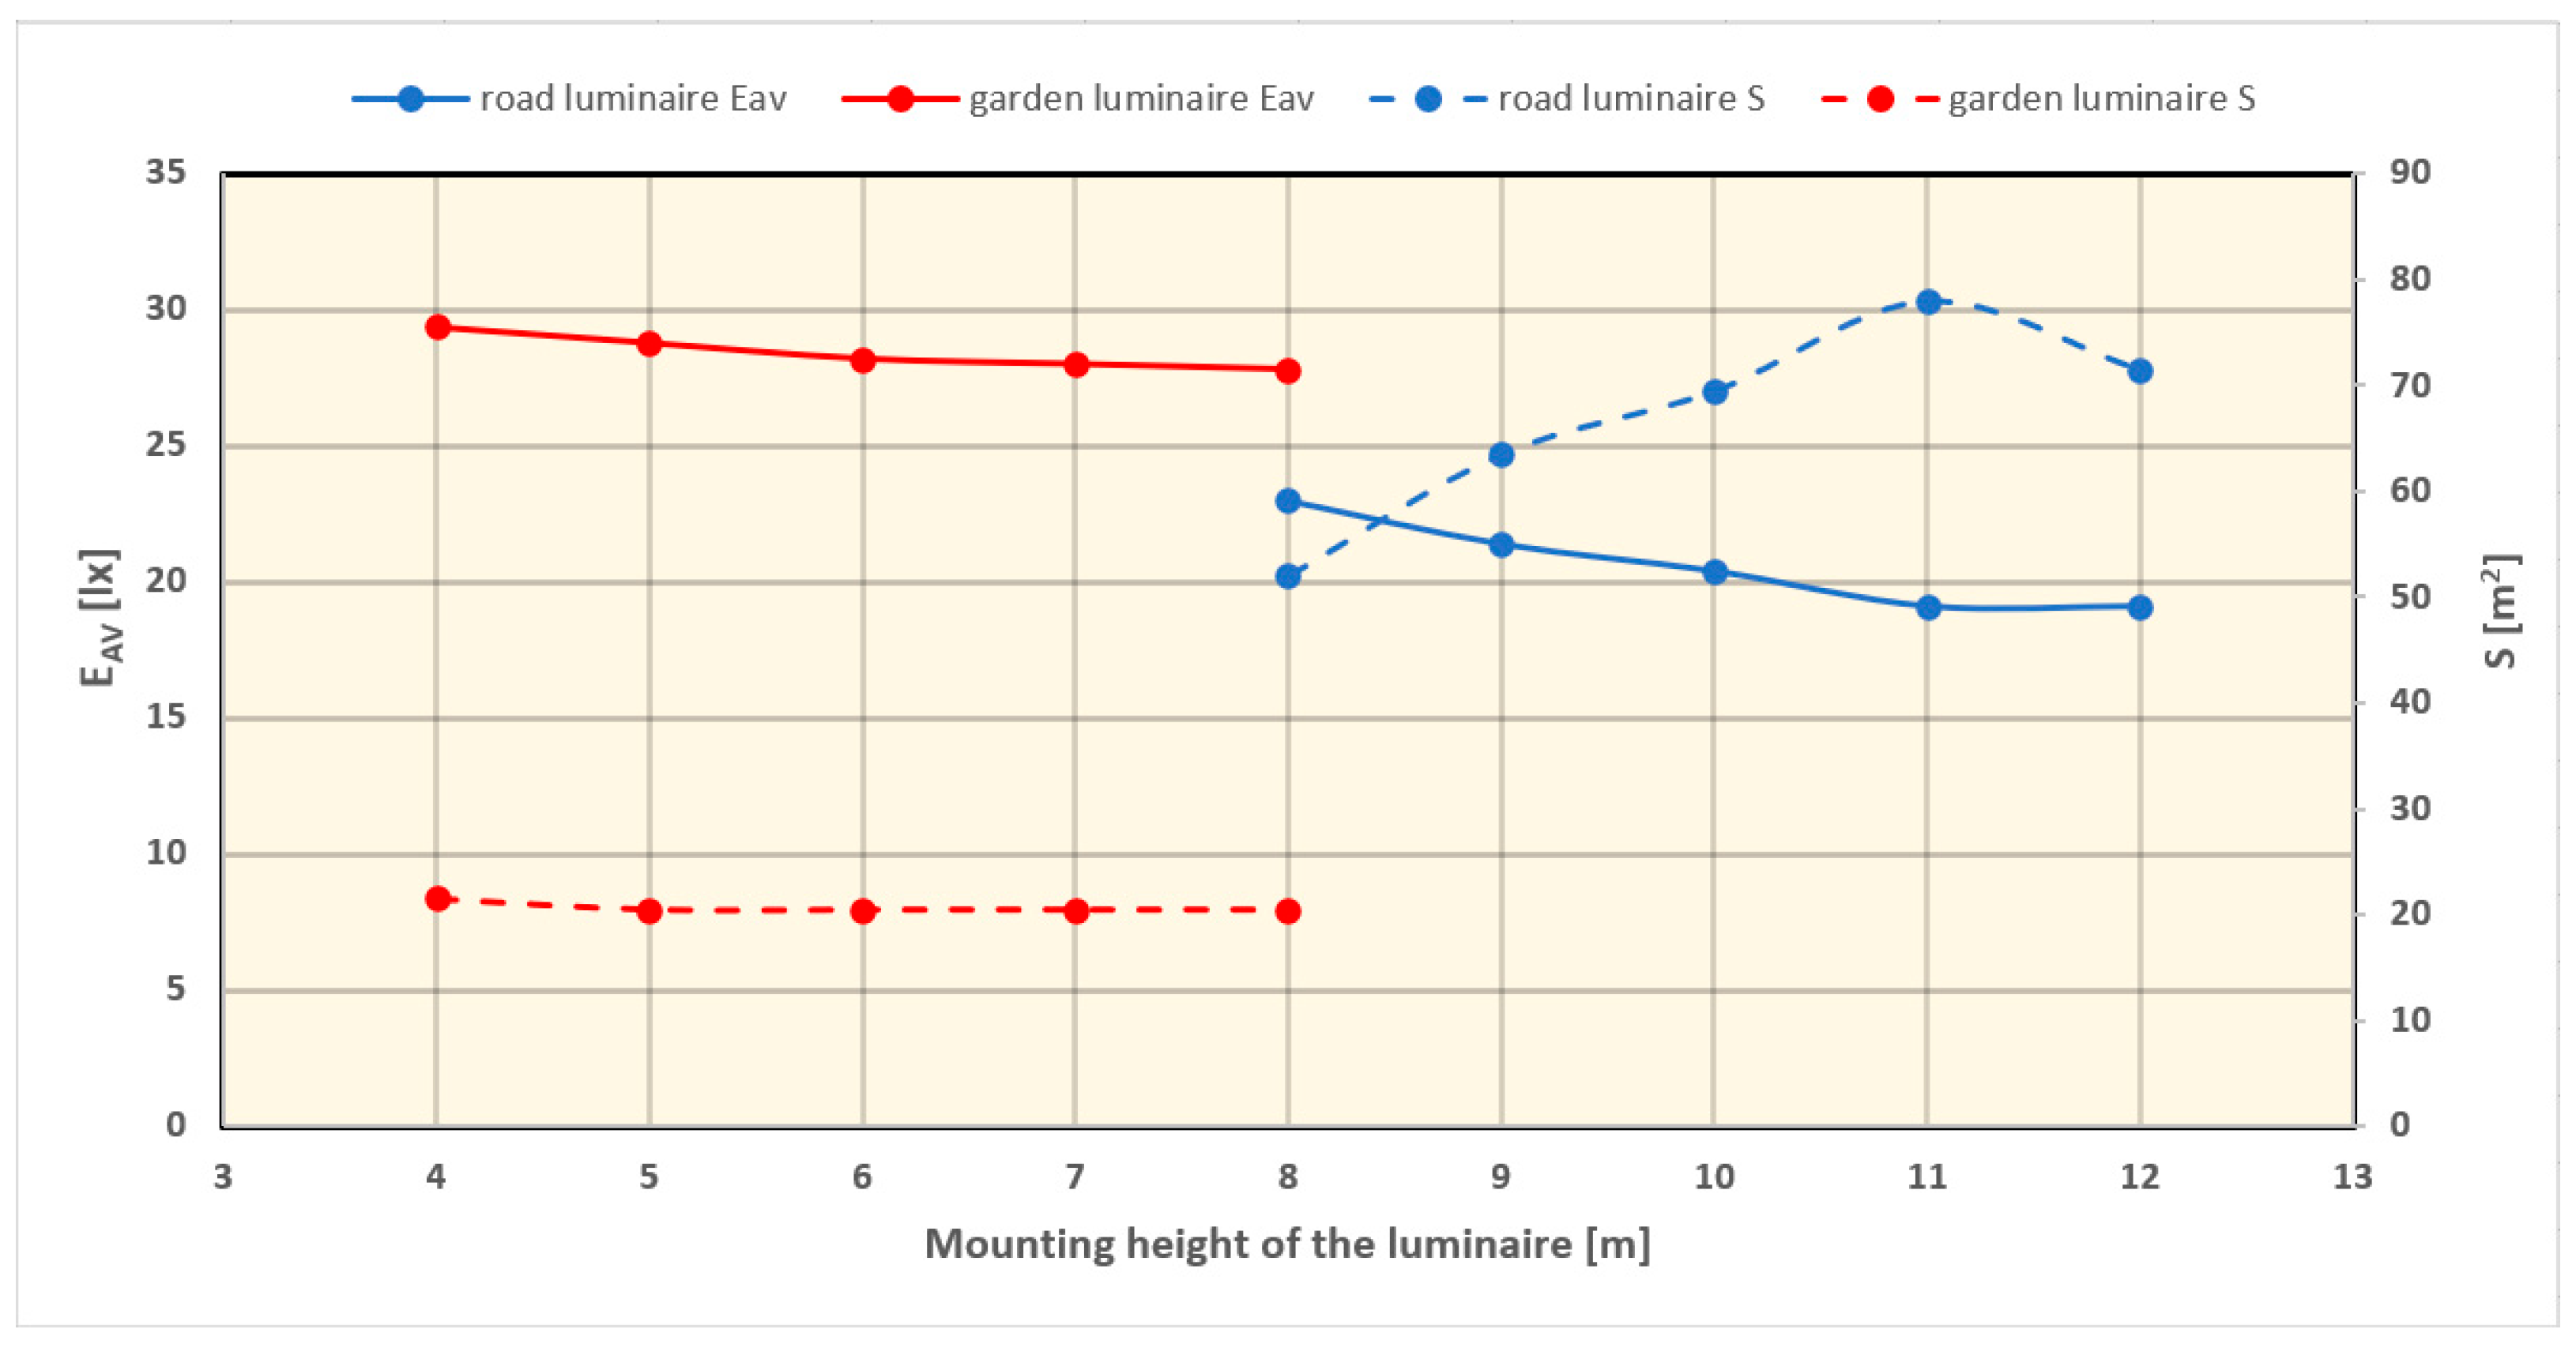
Figure 9 shows the results for the second variant of the simulation study, which investigated the effect of luminaire mounting height on the obtained values of average illuminance E
AV and area of light spot
S, satisfying the condition as in the earlier variant.
In this case, the installation height of the street luminaire was changed within the range of the most common heights for the analyzed situation and ranged from 8 to 12 m. For the park luminaire, the height was varied from 4 to 8 m. The luminaires were installed at a distance of 5 m from the facade wall. For the simulation studies, the same wattages and light distribution curves of the street and park luminaire were used as in the previously discussed case.
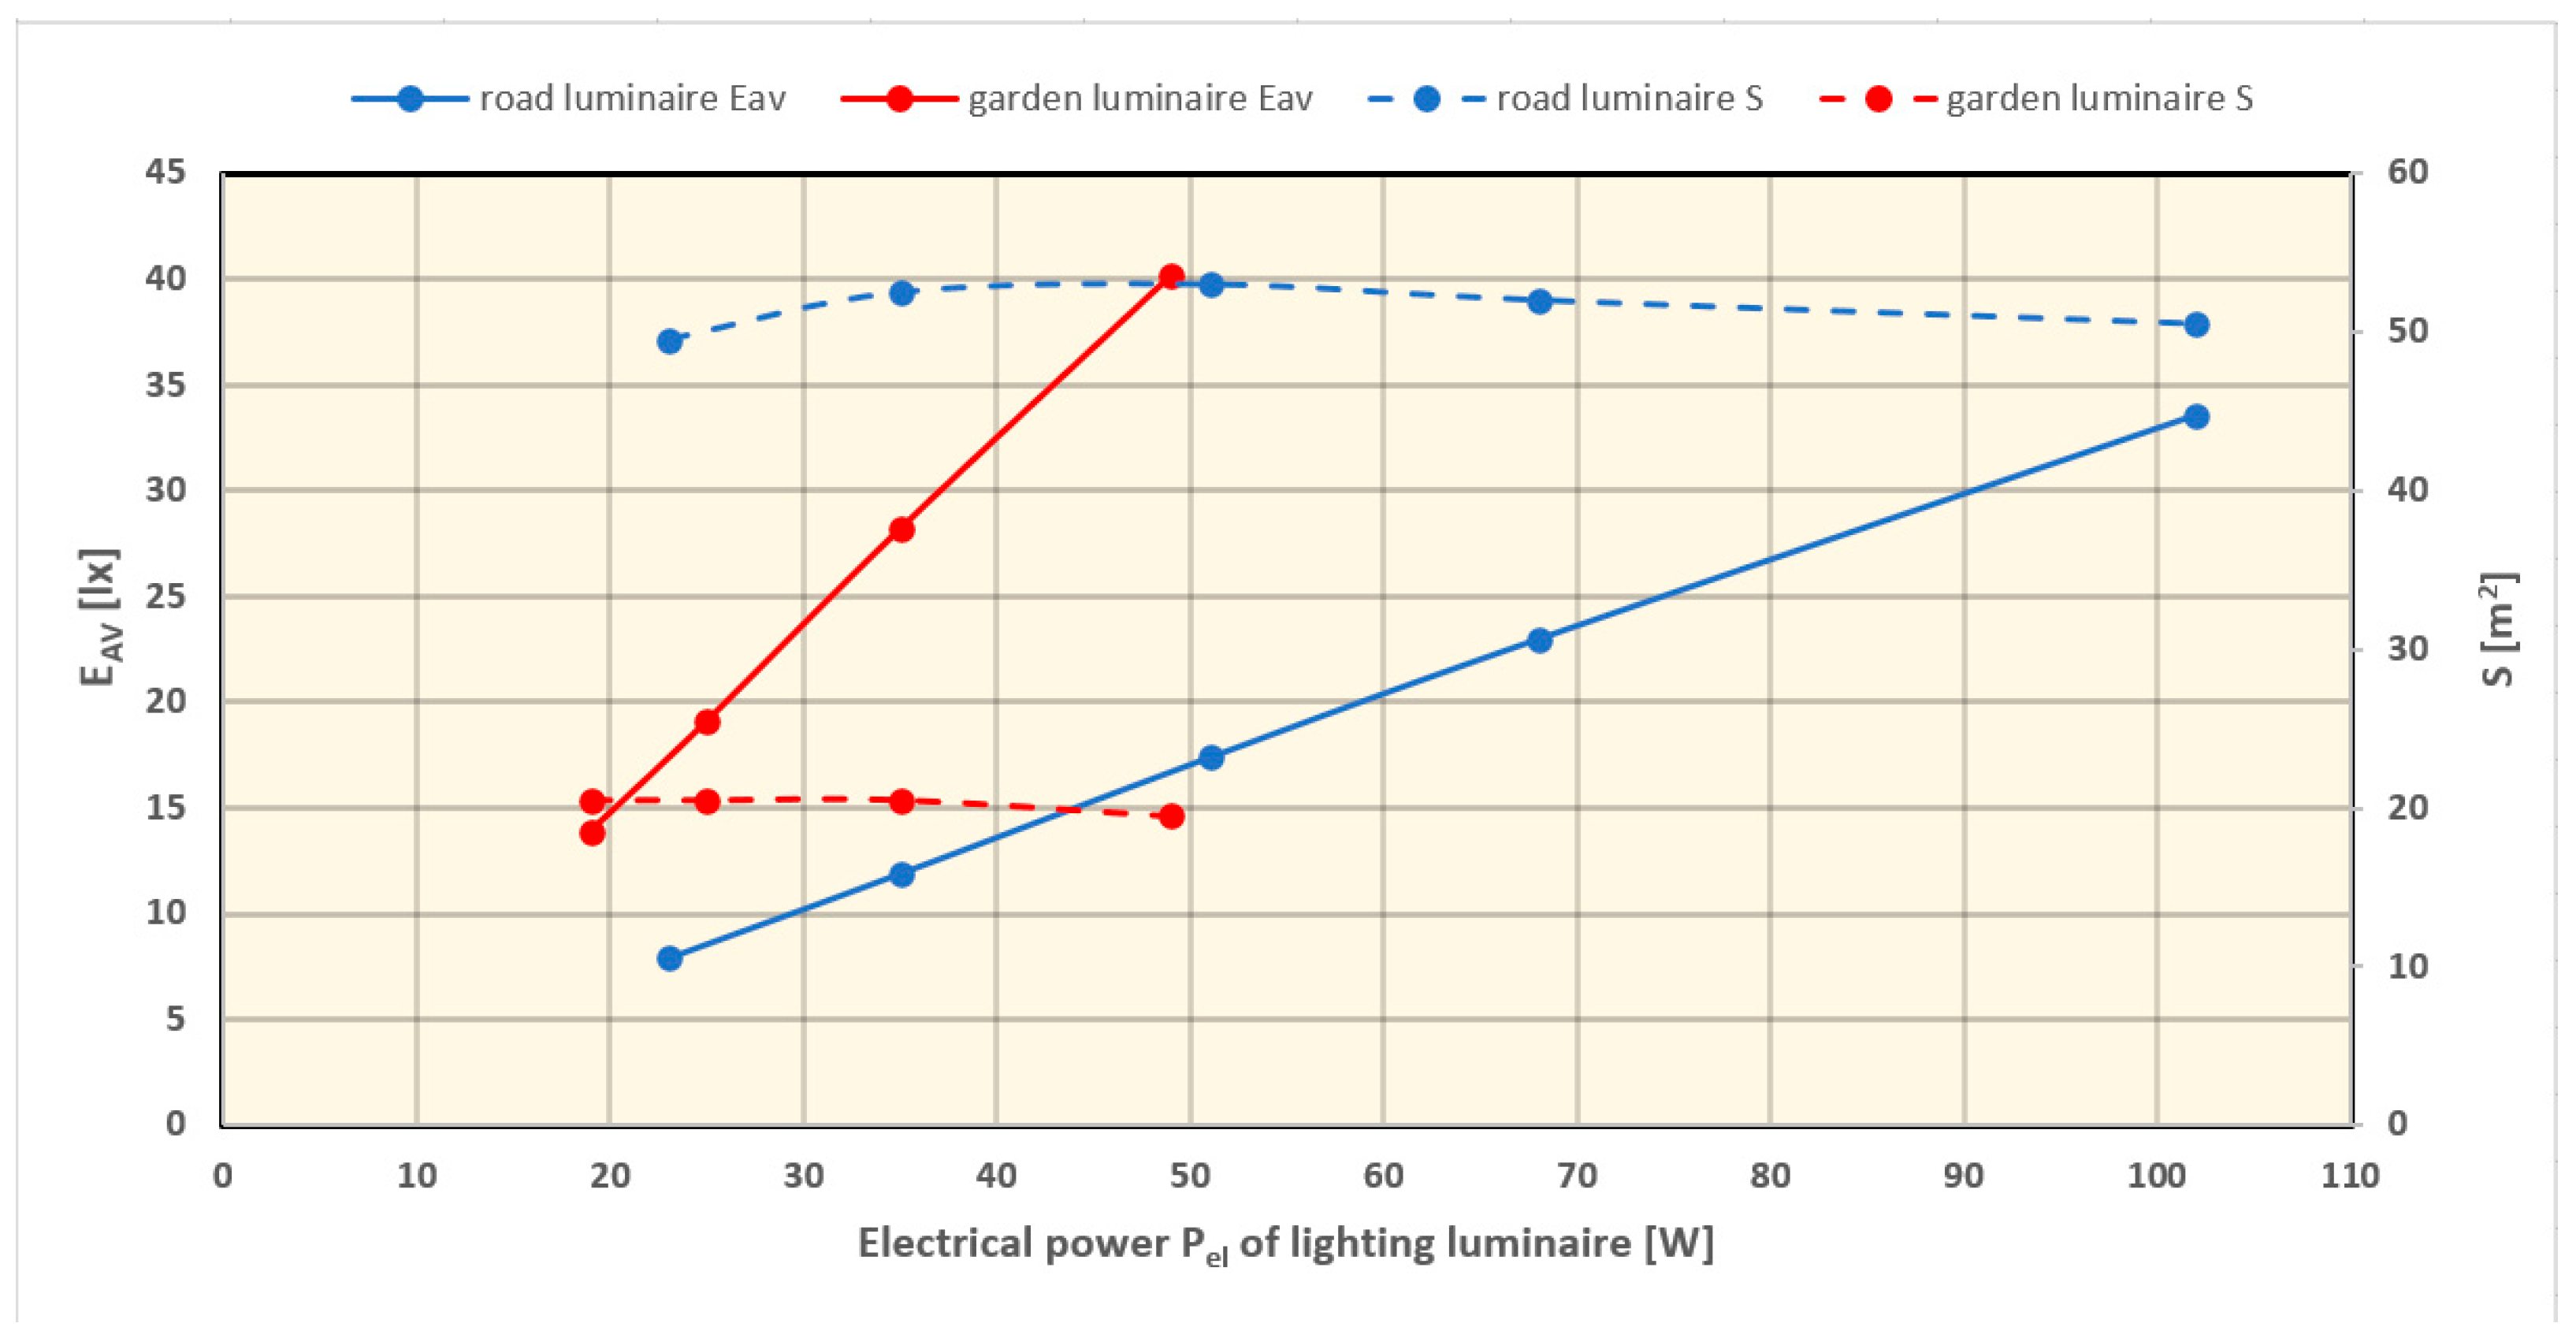
The effect of the applied P
el powers of luminaires on the E
AV value of the average illuminance and on the size of the light spot that meets the requirements for uniformity of illumination was analyzed in the third variant (
Figure 10).
The third variant changed the electrical power P
el of the street luminaire from 23 W to 102 W and the power P
el of the decorative luminaire from 19 W to 49 W. The mentioned power range makes it possible to meet the requirements for different classes of street lighting [
41] encountered within downtown developments. The luminaires were installed at a distance of 5 m from the model wall, and the mounting height was 8 m for the street luminaire and 6 m for the park luminaire. The luminaires’ light distribution curves used are shown in
Figure 6.
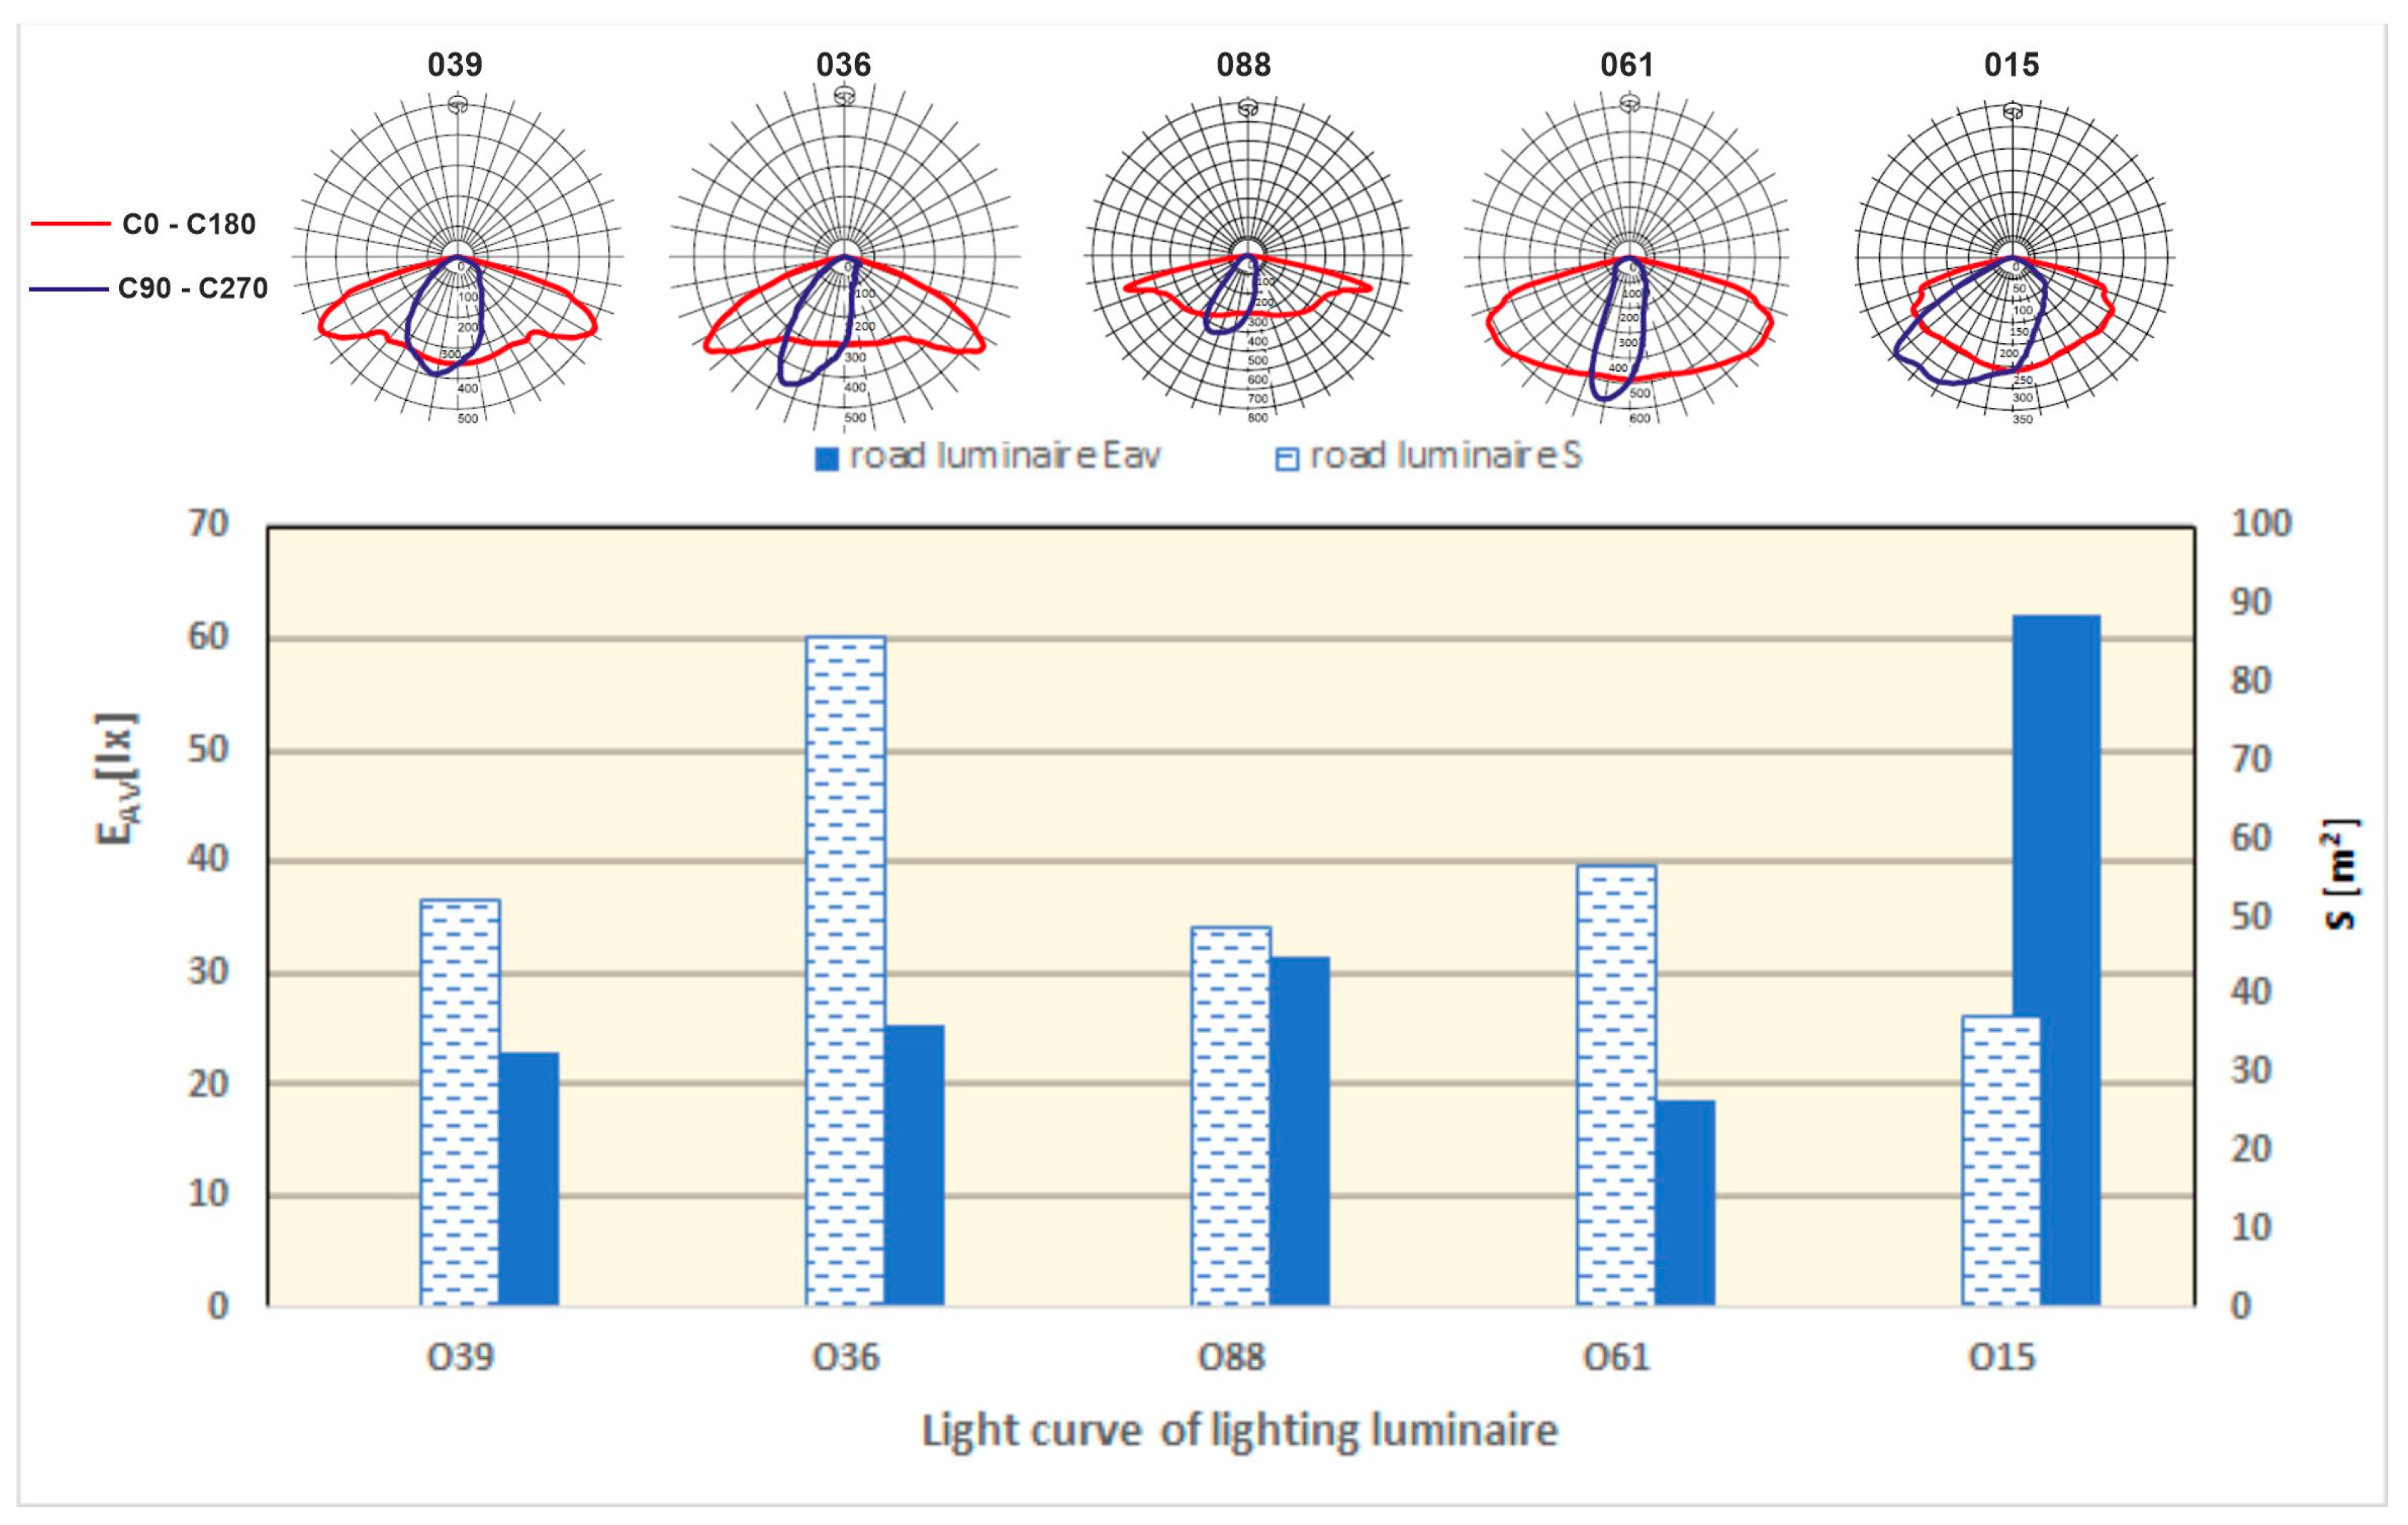
Figure 11 and
Figure 12 show the obtained simulation results related to the influence of the applied different light curves of luminaires on the formation of the light spot on the surface of the facade wall.
The example presented here analyzed the effect of using different light curves for street luminaires and park luminaires.
Five characteristic manners of forming the luminous flux were selected for the street luminaire. These are distributions adapted to road lighting characterized by a wide angle of illumination in the longitudinal axis and a narrow angle in the transverse axis, which is related to the geometry of the roadway to be illuminated [
40]. The 039, 036, and 088 optics are tailored to illuminate typical urban roads for different lighting classes, the 061 optics are dedicated to lighting narrow roads, while the 015 optics allow illumination of wide roads having several roadway lanes [
42].
Three of the five selected park luminaire optics (024, 030, and 020) were characterized by a rotationally-symmetrical way of forming the luminous flux distribution. These optics are used to illuminate vast areas such as parks, which may be in the vicinity of the object to be illuminated. The 024 optics had the widest light distribution, while the 030 optics had the most concentrated light flux formation. The other two optics: 031 and 022 were used for lighting sidewalks and bicycle paths [
39].
In the case under review, the luminaires were arranged similarly to the earlier variant. The electrical power Pel of the street luminaire was 68 watts, while for the park luminaire, it was 35 watts.
In the last case considered, the possibility of overlapping light spots on the facade surface from adjacent luminaires located in close proximity was analyzed. The simulation results obtained are shown in
Figure 13.
In the case under consideration, the distance between the adjacent street and park luminaires illuminating the surface of the facade wall was changed. Consideration was given to changing the distances at which light spots from individual luminaires overlapped and created favorable illumination conditions in terms of uniformity of illumination. The distance between adjacent luminaires varied from 6 m to 14 m for a park luminaire and from 11 m to 25 m for a street luminaire. During the simulation tests, the luminaires were located at a distance of 5 m from the facade and spaced at a height of 6 m for the park luminaire and 8 m for the street luminaire. The light distributions used are shown in
Figure 6, the power of the luminaires was 35 W and 68 W for the park and street luminaires, respectively.
Based on the tests, the obtained illuminance values on the facade and the size of light spots meeting the requirements of illuminance uniformity in the range of 2:1 were evaluated. The obtained average E
AV illuminance values within the light spots that meet the uniformity condition of 2:1 were juxtaposed with the literature requirements for illumination design [
31]. It will also be important here to take into account the correction factors, that is, the type of light source used related to the level of extinction of the luminous flux over time and the cleanliness of the surfaces of the facades of buildings. For LED light sources, the correction factor is assumed to be k
1 = 1.2, which is related to its luminous flux extinction curve over time.
The results show that only for a small group of luminaire arrangement configurations relative to the facade were satisfactory values of average illuminance obtained, which were characterized by a relatively small area of light spot (favorable illuminance values are marked in bold in
Table 1).
4. Discussion of the Obtained Calculation Results
The realized simulation studies and the analysis of factors influencing the formation of the light spot on the facade surface made it possible to evaluate the obtained values of illuminance and the area of the light spot.
For the close mounting distance of the luminaires (3 m), relatively high values of average illuminance E
AV were obtained, which were about 78 lx and 55 lx for the park and street luminaires, respectively. Increasing the mounting distance of the luminaires from the facade wall resulted in a significant reduction in average illuminance, which for a distance of 11 m was below 10 lux for both types of luminaires. Increasing the mounting distance of the luminaires from the facade wall had the simultaneous effect of increasing the area of the light spot meeting the requirements of uniformity of illumination in terms of a 2:1 ratio. Increasing the listed distance resulted in an increase in the area of the light spot from 10 m
2 to 50 m
2 for the park luminaire and from 23 m
2 to 68 m
2 for the street luminaire (
Figure 8).
Changing the mounting height of the luminaires had a negligible effect on the illuminance value, and this value practically remained constant. For the park luminaire, the change in mounting height did not affect the size of the light spot, while for the street luminaire, increasing the mounting height of the luminaire from 8 m to 11 m resulted in an increase in the area of the light spot on the facade surface from 50 m
2 to about 80 m
2 (
Figure 9).
For the third variant of the simulation study analyzed, the change in electrical power P
el affected the change in the illuminance value obtained on the wall surface. An increase in the mentioned power resulted in a linear increase in the value of average illuminance EA
V, while it did not affect the size of the illuminated area, which was constant (
Figure 10).
The type of luminaire light curve used significantly affected the illuminance values obtained and the shape and area of the light spot, both for the park and street luminaire. Depending on the radiant luminous flux angle of the photometric luminaire used, the average illuminance E
AV varied from about 18 lx to 62 lx and the area of the light spot from about 37 m
2 to 86 m
2. An analogous situation occurred in the case of park luminaires where changing the luminaire light curve used resulted in a change in E
AV illuminance values from 12 lx to 28 lx and a change in the size of the light spot from 20 m
2 to 63 m
2. It should be noted that for all light distribution curves studied, the values of average illuminance E
AV and the size of the area of the light spot obtained were related. The higher the obtained illuminance value, the lower the value of the illuminated facade area (
Figure 11).
The last variant analyzed investigated the possibility of overlapping light spots from neighboring luminaires (
Figure 12). In the case of the distribution of street lighting fixtures at a distance of 22 m from each other, the area of the resultant light spot that meets the requirements of uniformity of illumination was obtained with a value of 145 m
2. In the case of park luminaires, the maximum resultant light spot area obtained from neighboring luminaires was less than 50 m
2.
The obtained values of average E
AV illuminance for the considered variants indicate that only for a few cases are the obtained values sufficient to independently implement floodlighting in accordance with the accepted recommendations [
31].
Table 1 summarizes the recommended illuminance values on the facade of the illuminated object depending on the brightness of the object’s surroundings, the light source used, and the cleanliness of the facade material. Based on the simulation results obtained, it can be generally concluded that the street lighting accompanying the illuminated structure does not produce a light spot on the façade, ensuring the recommended illuminance values are achieved. Only for a few selected variants, in which luminaires were installed in close proximity to the wall, did the obtained illuminance values meet the requirements for clean facades and low background luminance, which is rare in the context of downtown areas (
Table 1, green).
However, the resulting EAV illuminance values on the facade surface from street and park luminaires can act as auxiliary illumination for illuminated structures contributing to the energy efficiency of the lighting system. In such a case, an important issue is to determine the maximum area of light spots from street or park luminaires that can be used as auxiliary or supplementary lighting in creating illumination of the structure.
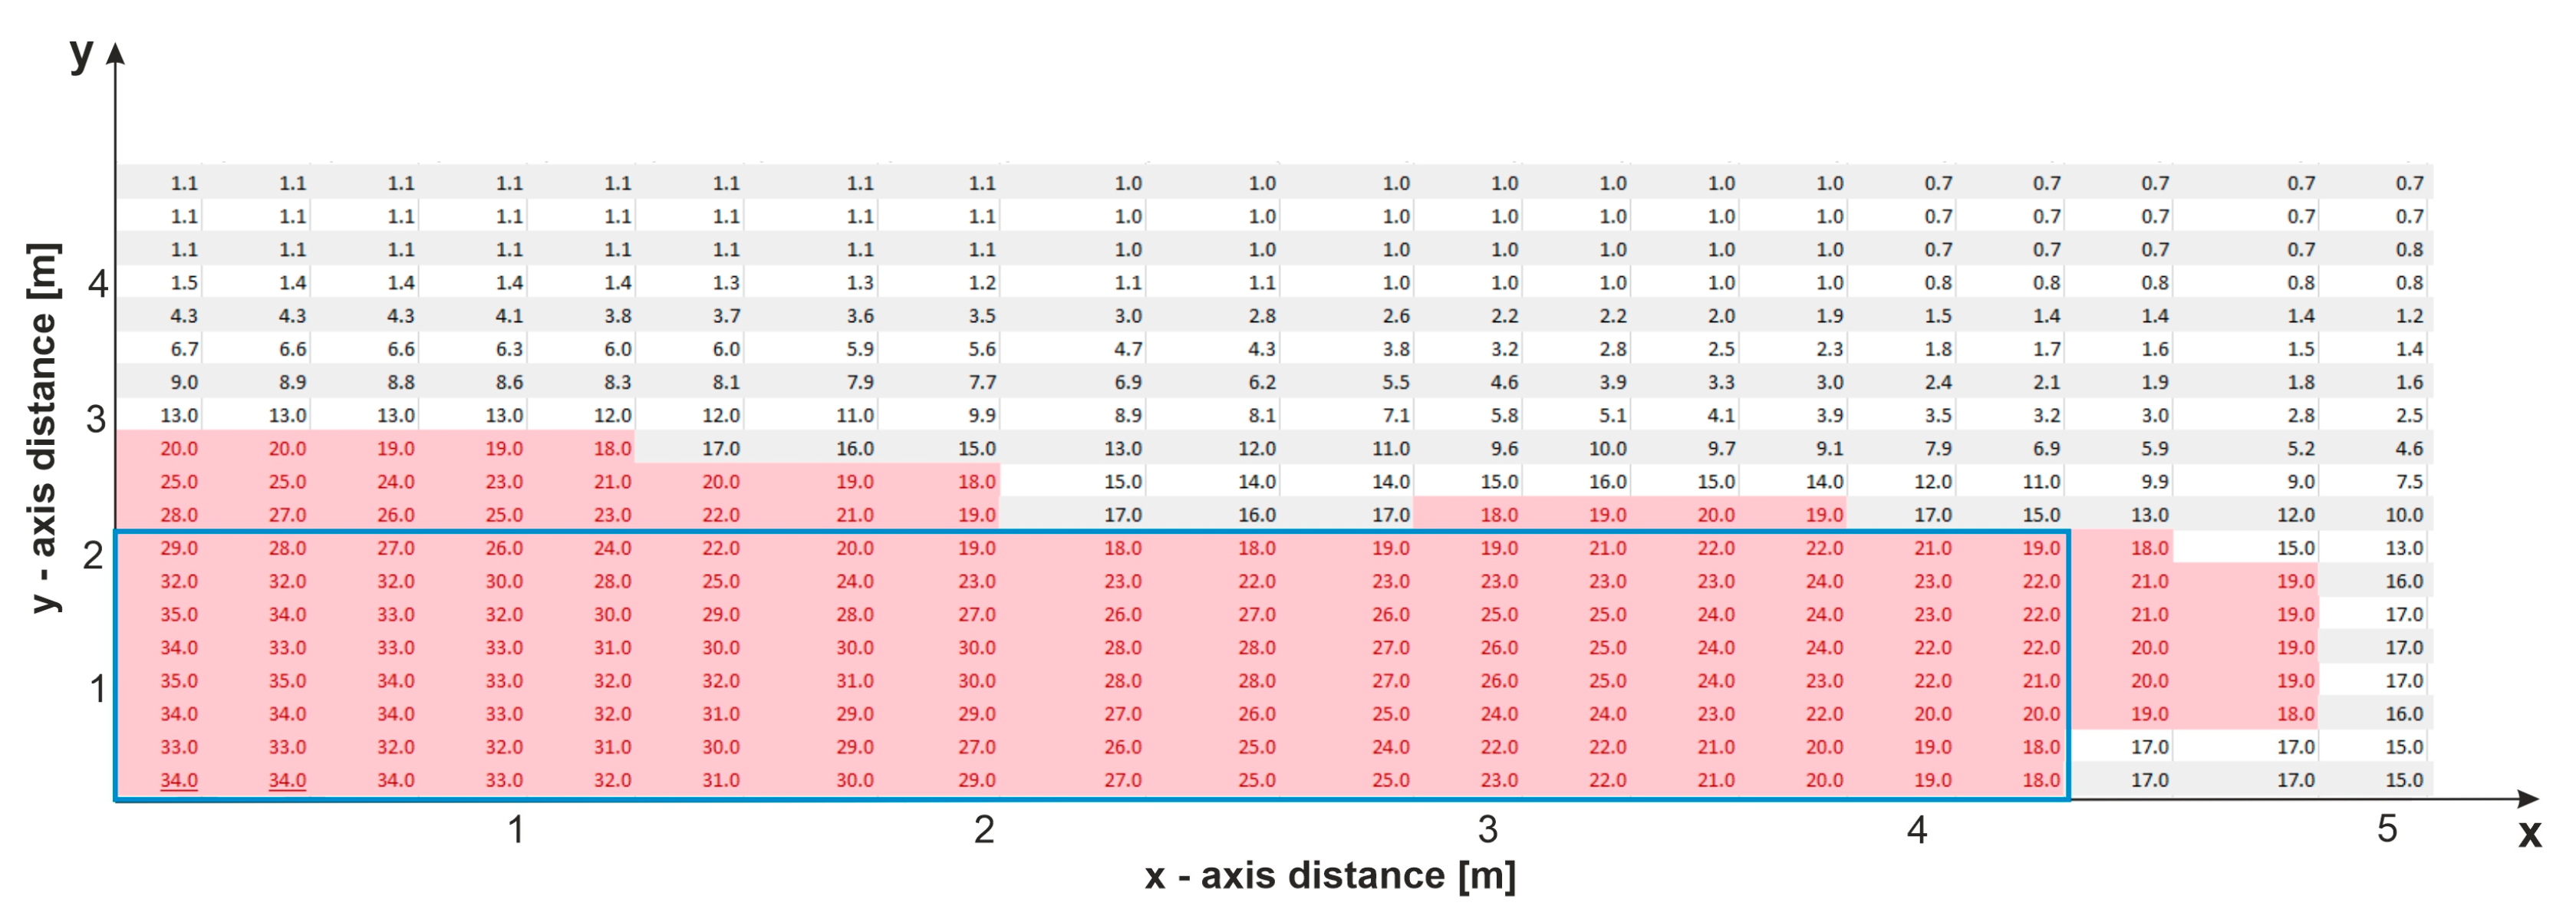
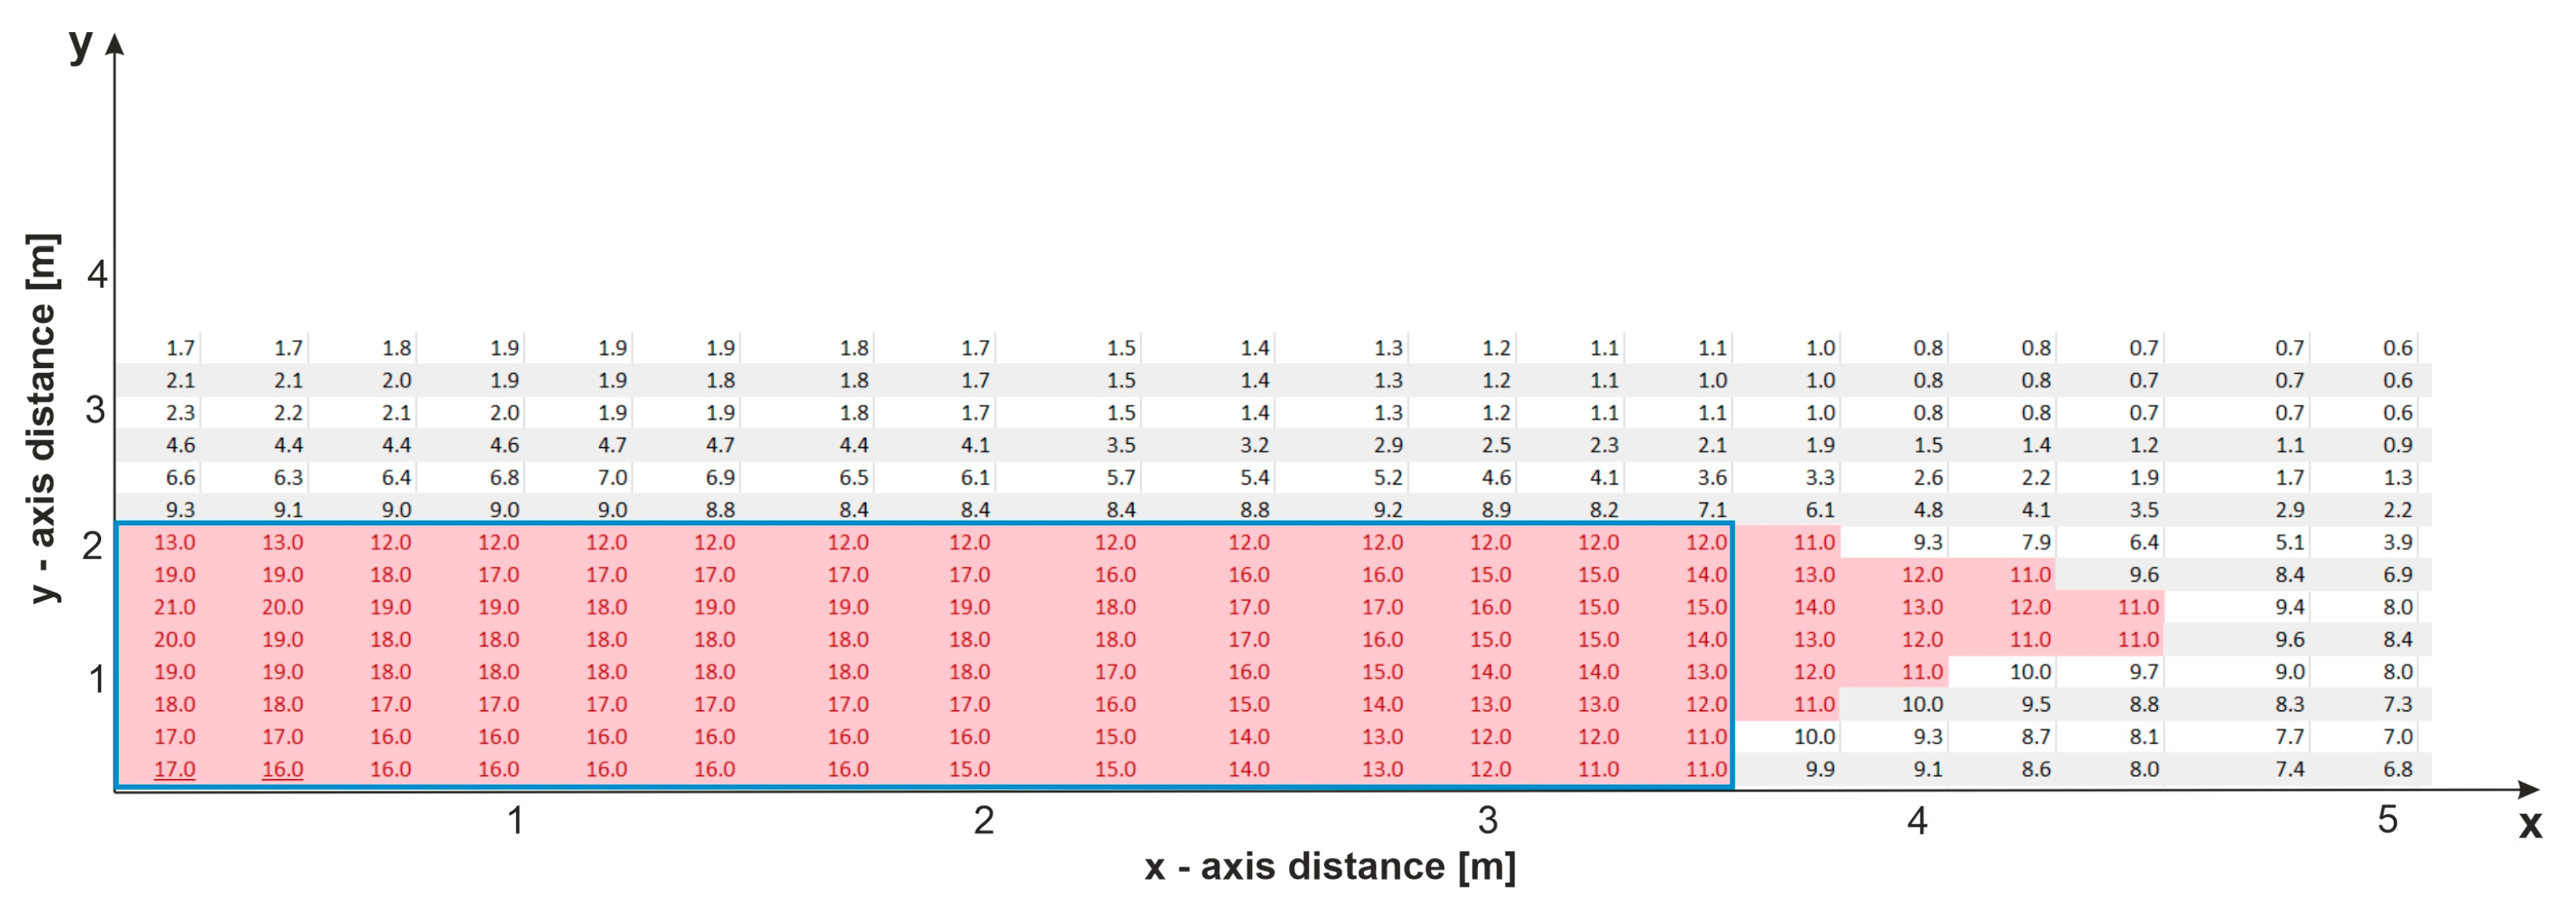
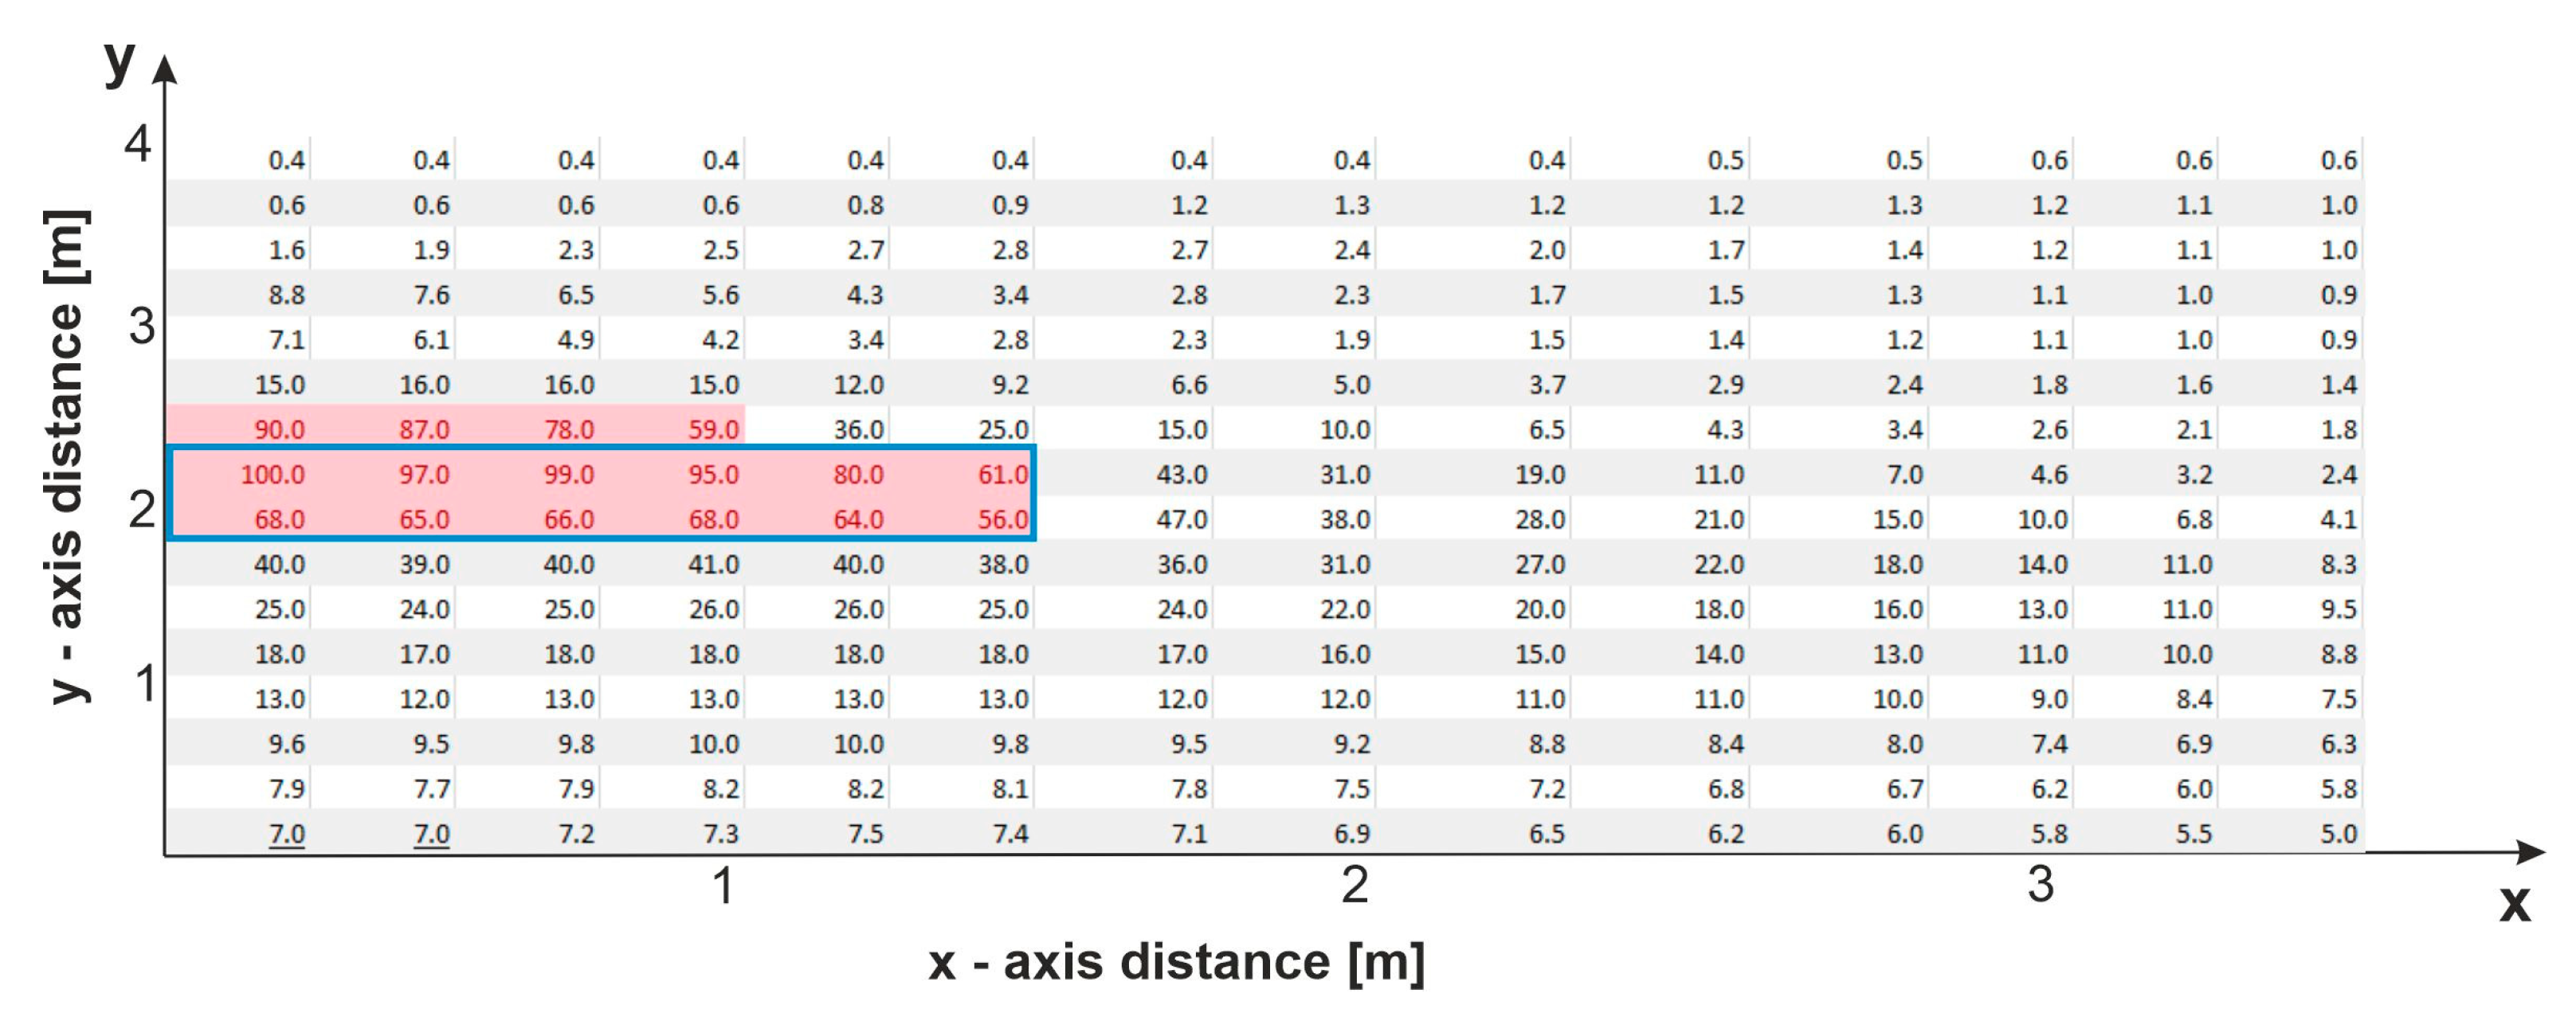
In order to illustrate the possible shapes and sizes of light spots coming from street lighting, which can be used as auxiliary lighting for the illuminated object, four characteristic cases of street lighting effects on facades are presented (
Figure 14,
Figure 15,
Figure 16 and
Figure 17).
The above figures show selected examples of the distribution of half of the light spot (the total shape is a reflection symmetrical about the y-axis) from street and park luminaires, where the y-axis coincides with the shaft of the pole while the x-axis runs parallel to the elevation. The red field includes illuminance values in the range Emax/Emin = 2/1. The outline of a rectangle symbolizing the contour of the façade (blue line), which can form the basis of the contour illumination of the facade of an architectural structure, was inscribed in the defined field.
Based on the presented variants of shaping the light spot on the facade surface, the following main situations can be defined:
- -
For a street luminaire, assuming the relatively high power P
el of the luminaire
, the considerable height of the luminaire mounting, and a suitable lenticular arrangement, there is the possibility of using the light spot shaped by it for the function of supporting the shaping of the illumination of the structure or even for the independent creation of the illumination of the structure with the fulfillment of selected assumptions (clean facade, low background luminance). The aforementioned assumptions can be met for relatively long, one- or two-story buildings. In the example in
Figure 14, the illuminated field is up to 10 m long.
- -
In the case of the use of a park luminaire, depending on the optics used, there is an analogous possibility to the above case, with the difference that the vast majority of available park optics systems allow illumination of shorter and at the same time higher facade wall surfaces,
- -
For the case shown in
Figure 16. where adjacent street luminaires are installed in close proximity, the shaped light spot, which is the sum of two spots, makes it possible to use it as illumination support for relatively long sections of the illuminated object. For the case mentioned, the length of the field affecting the facade is about 15 m.
- -
The example in
Figure 17 shows the least favorable case, when a park luminaire with relatively high electrical power P
el, close mounting distance from the wall surface and an optical system with a narrow light distribution creates an intense light spot with small dimensions. In the aforementioned case, the created spot with the above parameters is a hindrance to the shaping of the illumination of the object and does not constitute lighting complementary to the floodlighting of the object.
5. Analysis of the Impact of Street Lighting on the Facade of a Building for a Real-World Example
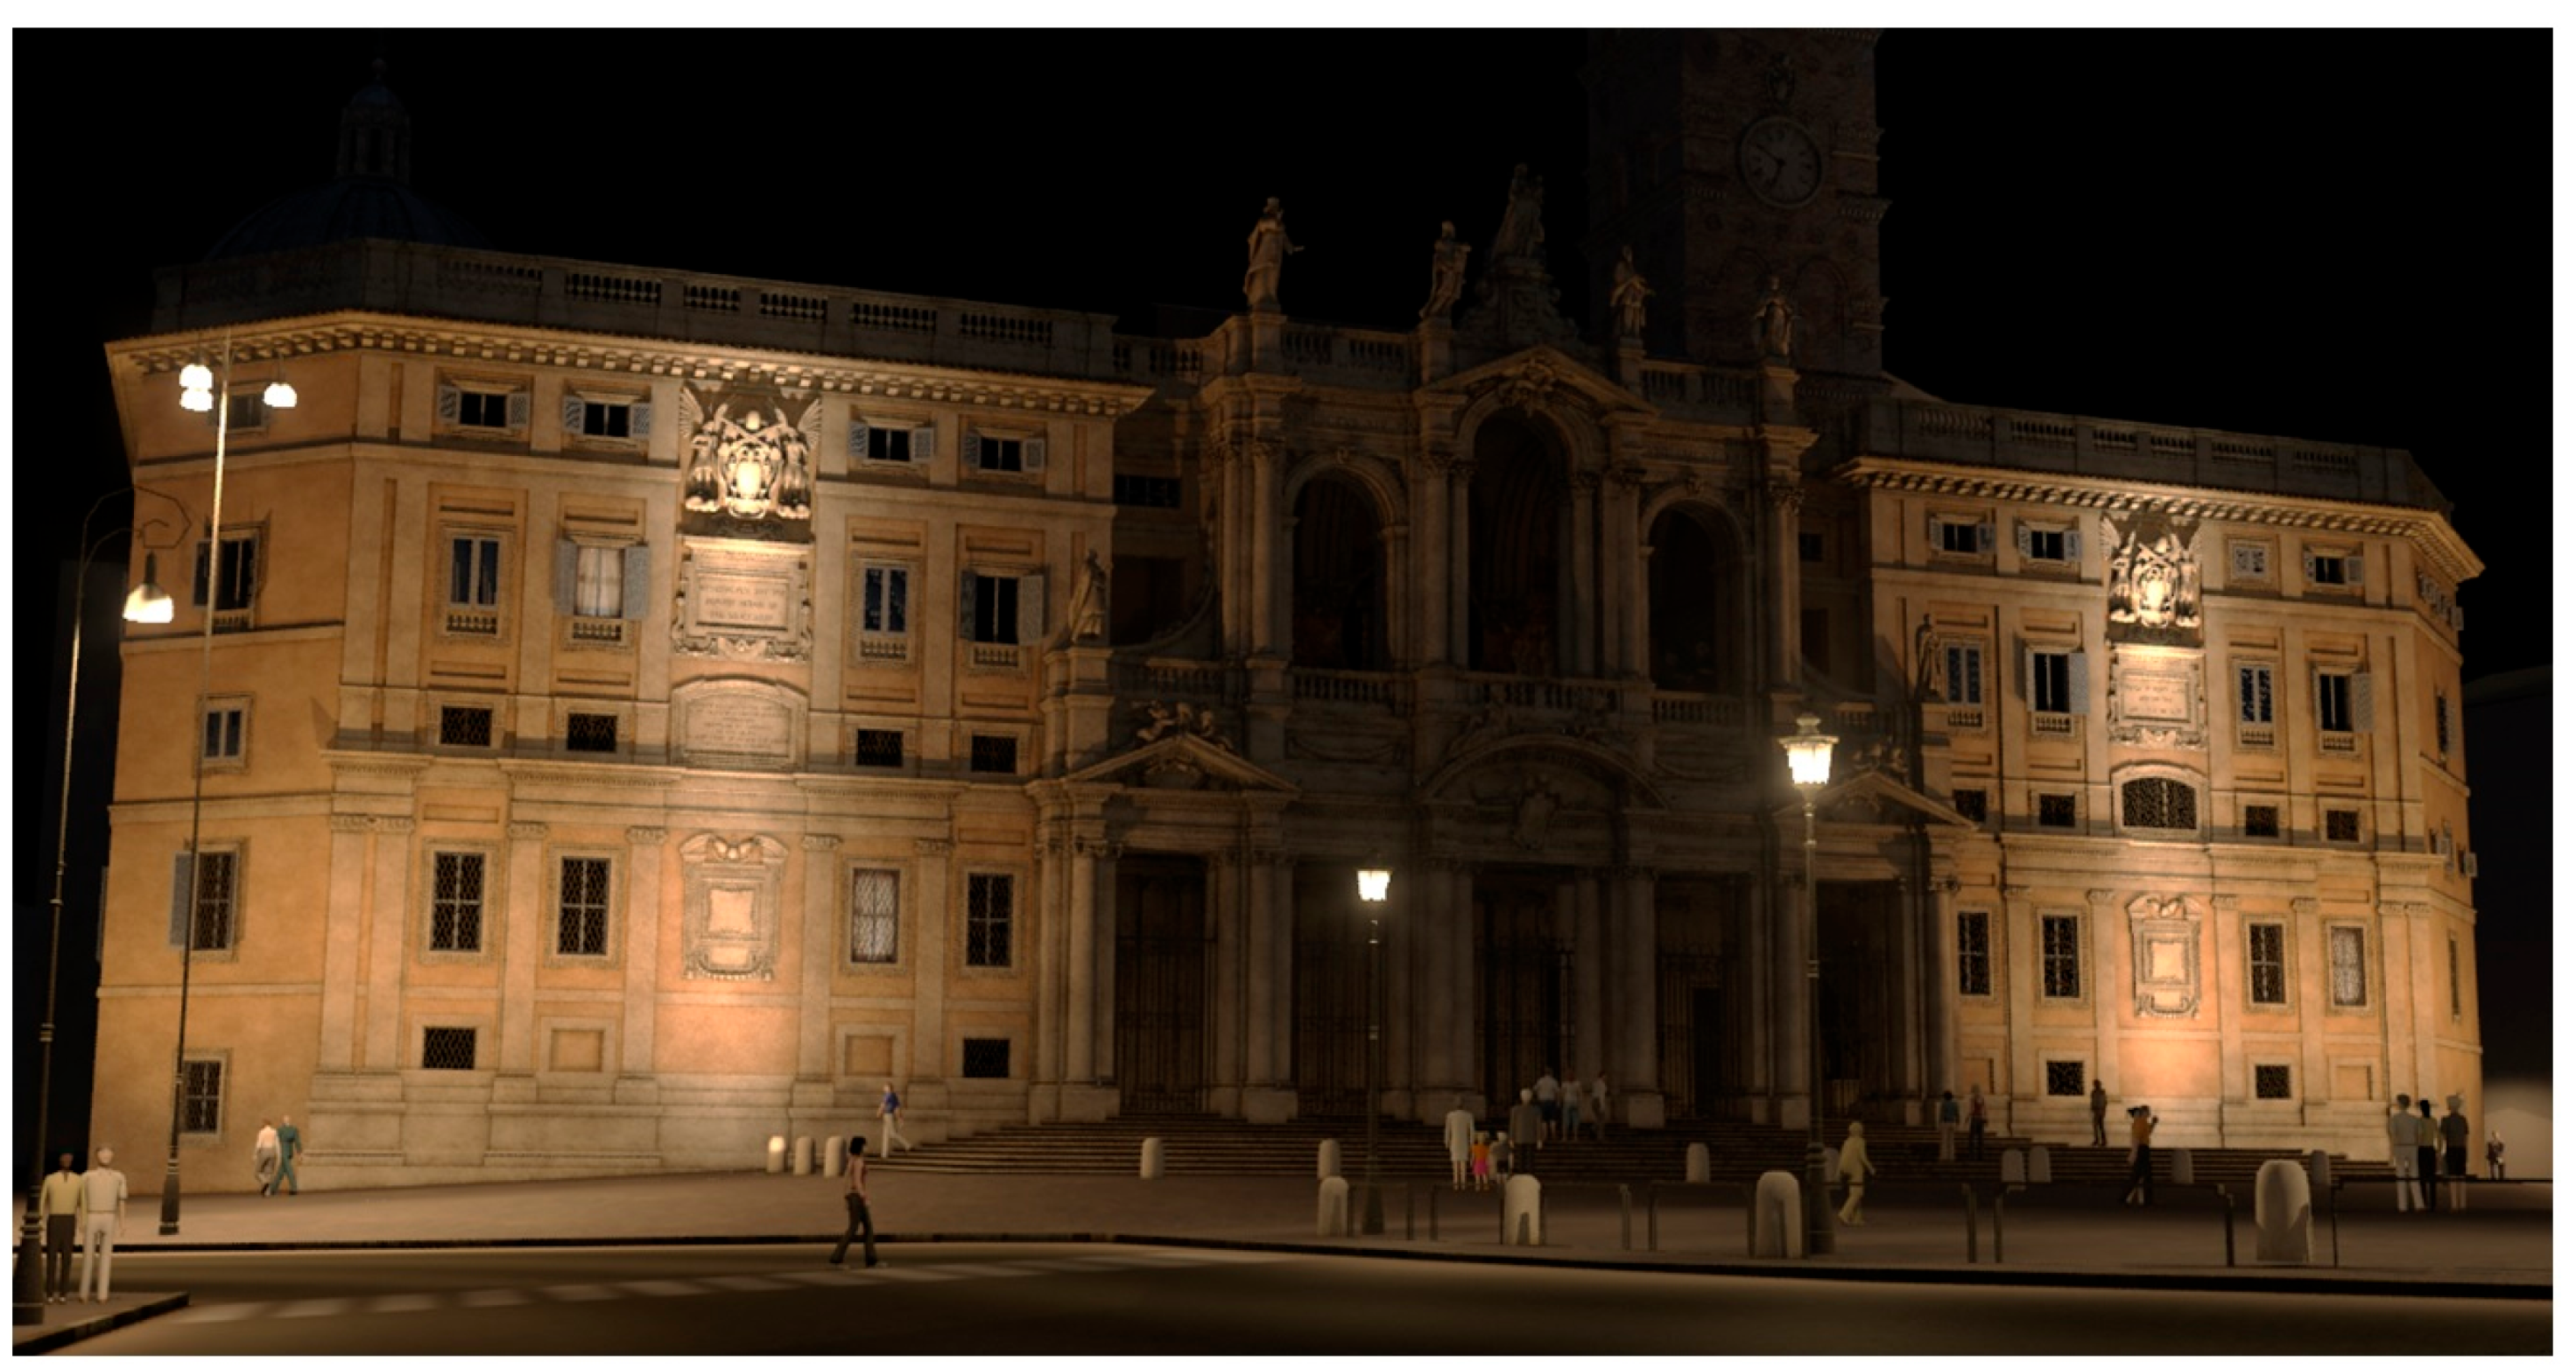
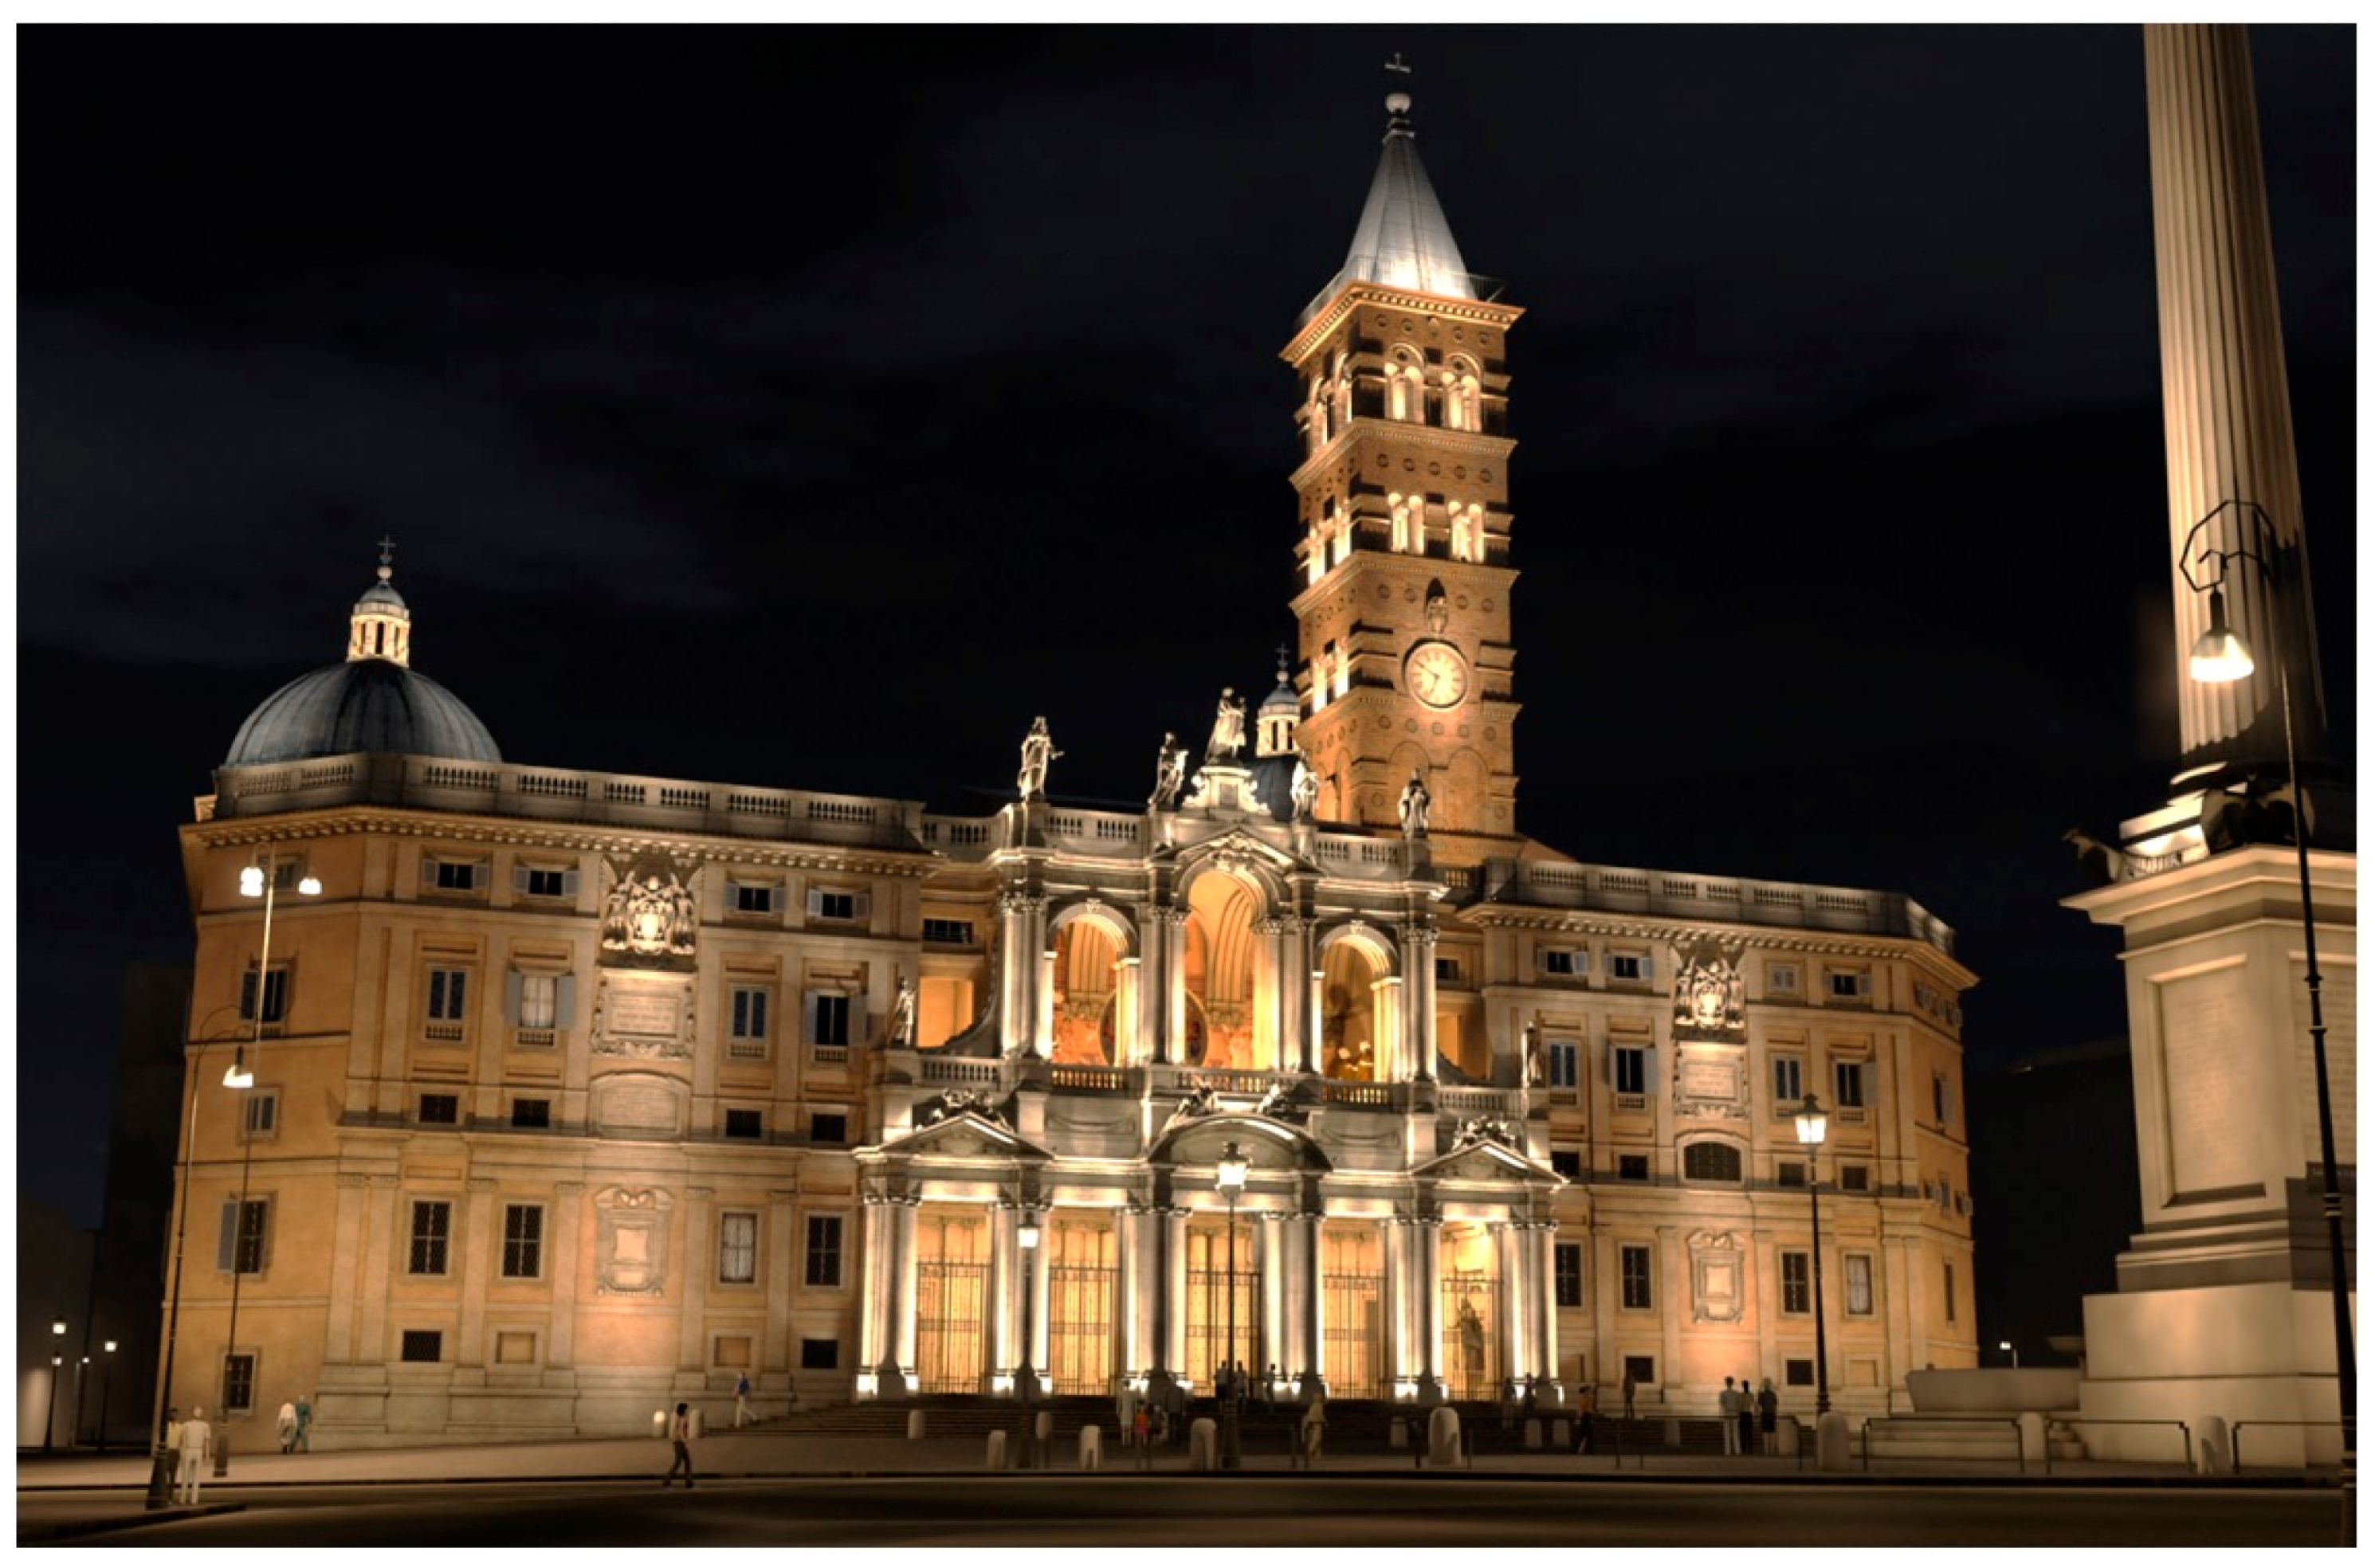
It can be expected that from the point of view of illumination practice, a significant number of cases will be variants in which street lighting will be a component that hinders the execution of floodlighting for a structure with the assumed parameters, mainly uniformity, average illuminance, and the size of the light spot. In order to illustrate the mentioned problem, this article presents an example indicating the technical possibility of reducing and even eliminating the mentioned phenomenon. An attempt was made to realize the illumination under the “interrupting” impact of street lighting for which the light spot is intense and located asymmetrically on the facade. Such a case can occur when, for example, batteries of floodlights are placed on relatively high masts located in close proximity to the facade. This is the case, for example, with the Basilica di Santa Maria Maggiore in Rome, specifically with the basilica’s fronton and its immediate surroundings—the square in front of the front facade. When choosing a real object to present the use of street lighting as a component of illumination, we were guided by two considerations. The first is to show the possibility of developing an attractive illumination of a building of great European historical and cultural prestige given the unfavorable influence of street lighting. The selected object is generally contour illuminated. According to the opinion of the authors of this article, it will be much more advantageous to illuminate it in zones, thanks to the front façade being richly decorated with architectural ornaments. This task was successfully accomplished. The second reason for choosing the Basilica of Santa Maria Maggiore for detailed research was the challenge of leveling the negative impact of floodlight battery lighting on the homogeneous distribution of luminance on the front façade of the basilica. Such situations occur quite often, which creates a big design problem for illumination designers. A computer simulation technique was used to analyze this case in detail [
2,
27].
The use of modern computer graphics in the conceptual-design work of illumination to take into account the impact of street lighting, eliminating polygonal tests becomes very helpful, and sometimes, for large-scale structures, even necessary [
43]. In addition, no-cost computer simulations make it possible to analyze the selection of floodlighting luminaires in a multi-variant manner, taking into account the full range of street lighting specifics in the course of modeling. The proposed methodology of the work made it possible to achieve the stated goal, which was to reproduce the impact of street lighting on the facades of the building, and then to select the quantitative and qualitative models of floodlighting luminaires in such a way as to achieve final compliance of the project with the applicable literature guidelines. The aforementioned Basilica di Santa Maria Maggiore in Rome was chosen as the object for the detailed work. Prior to the lighting test phase, a model of the basilica’s facade and street lighting environment was developed in an advanced graphics application, with a large-scale geometric mapping adopted, as well as the transmission and reflection characteristics of the materials covering the facades—in this case, mainly travertine (
Figure 18).
An important element was to reproduce the intensity distribution of the light spot coming from street lighting on the facade as closely as possible. This task can be performed by measuring luminance with a spot luminance meter [
44] at designated points on the facade, and then converting the luminance values into illuminance values, according to a formula that takes into account Lambertian reflection (5):
where:
Eo—illuminance reflected from the facade measured at the facade measurement point under consideration,
—reflectance of the facade material,
Ep—illuminance of incident light on the facade measured at the measurement point on the facade under consideration.
Knowing the reflectance from the above formula, it is possible to determine the illuminance at a given point according to Formula (3).
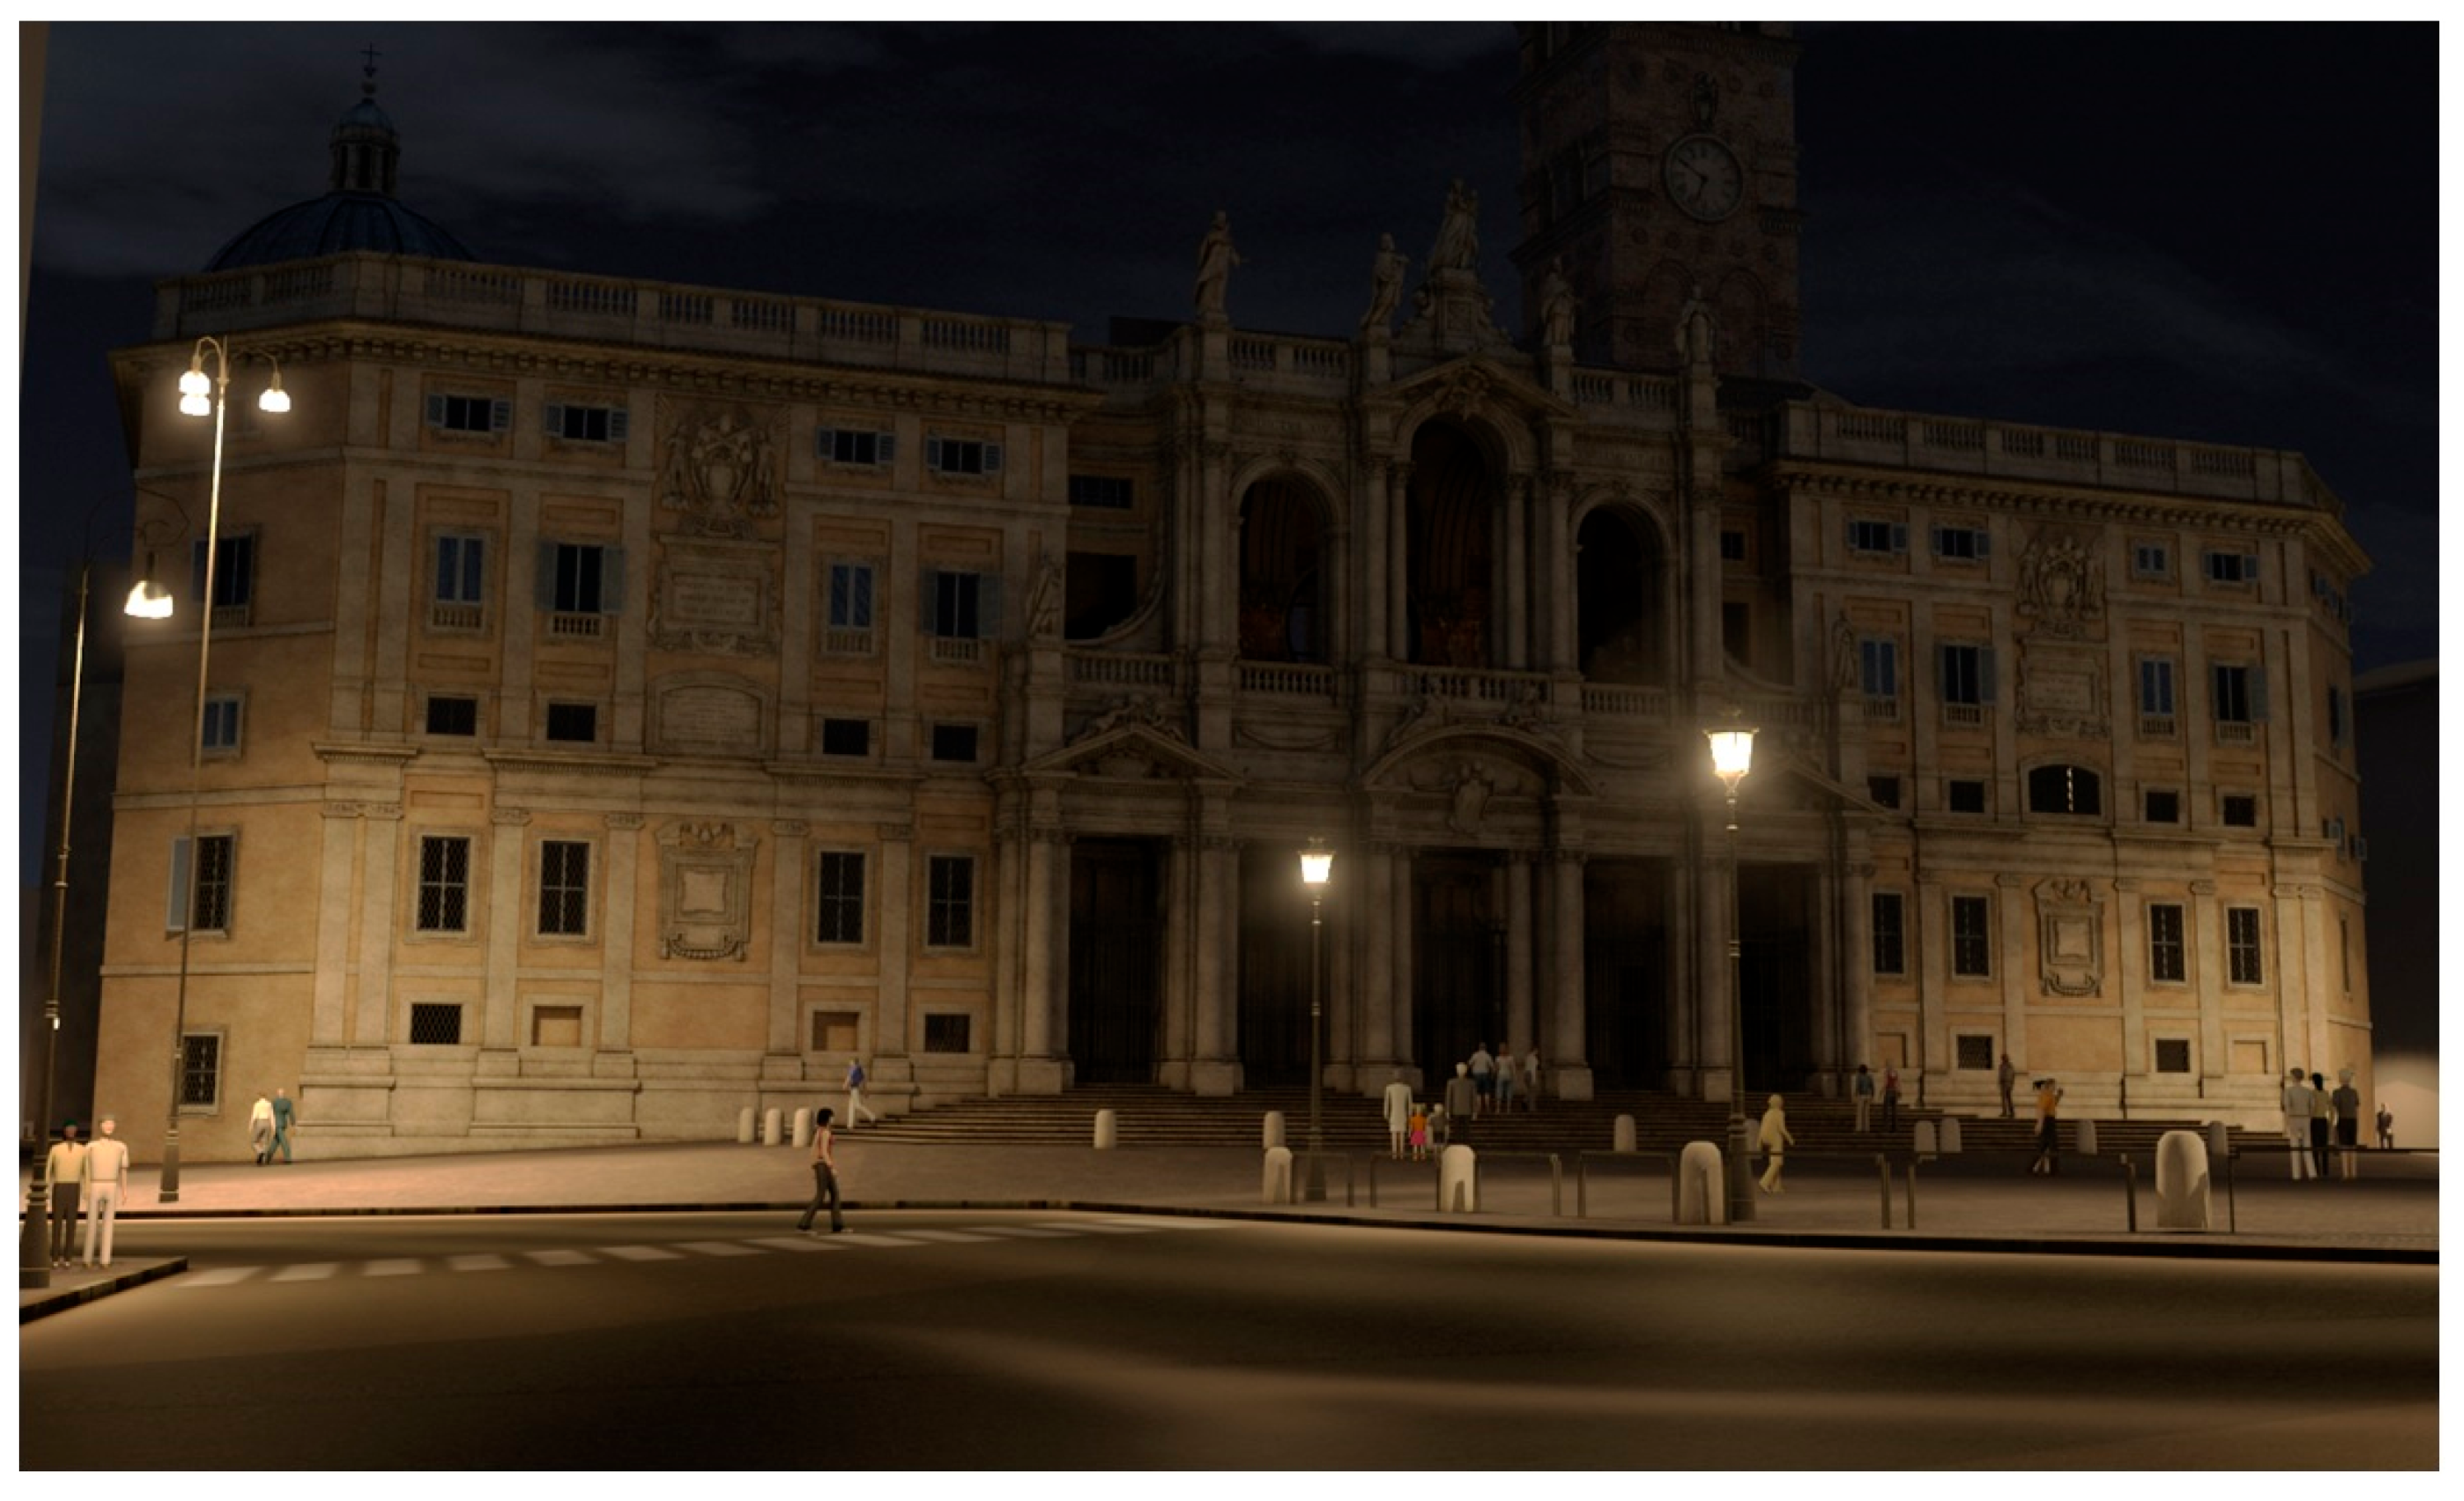
In the first stage of preparatory work, a model of the building was made with a representation of external lighting affecting the facades—these are batteries of lanterns on both sides of the pediment illuminating asymmetrically the extremes of the basilica’s fronton. In the initial phase of the lighting study, all five features of the impact of real street lighting on the front facade discussed earlier were modeled (
Figure 19). This task was performed by comparing the distribution of light spots on the facade of the real-life object and the model. In
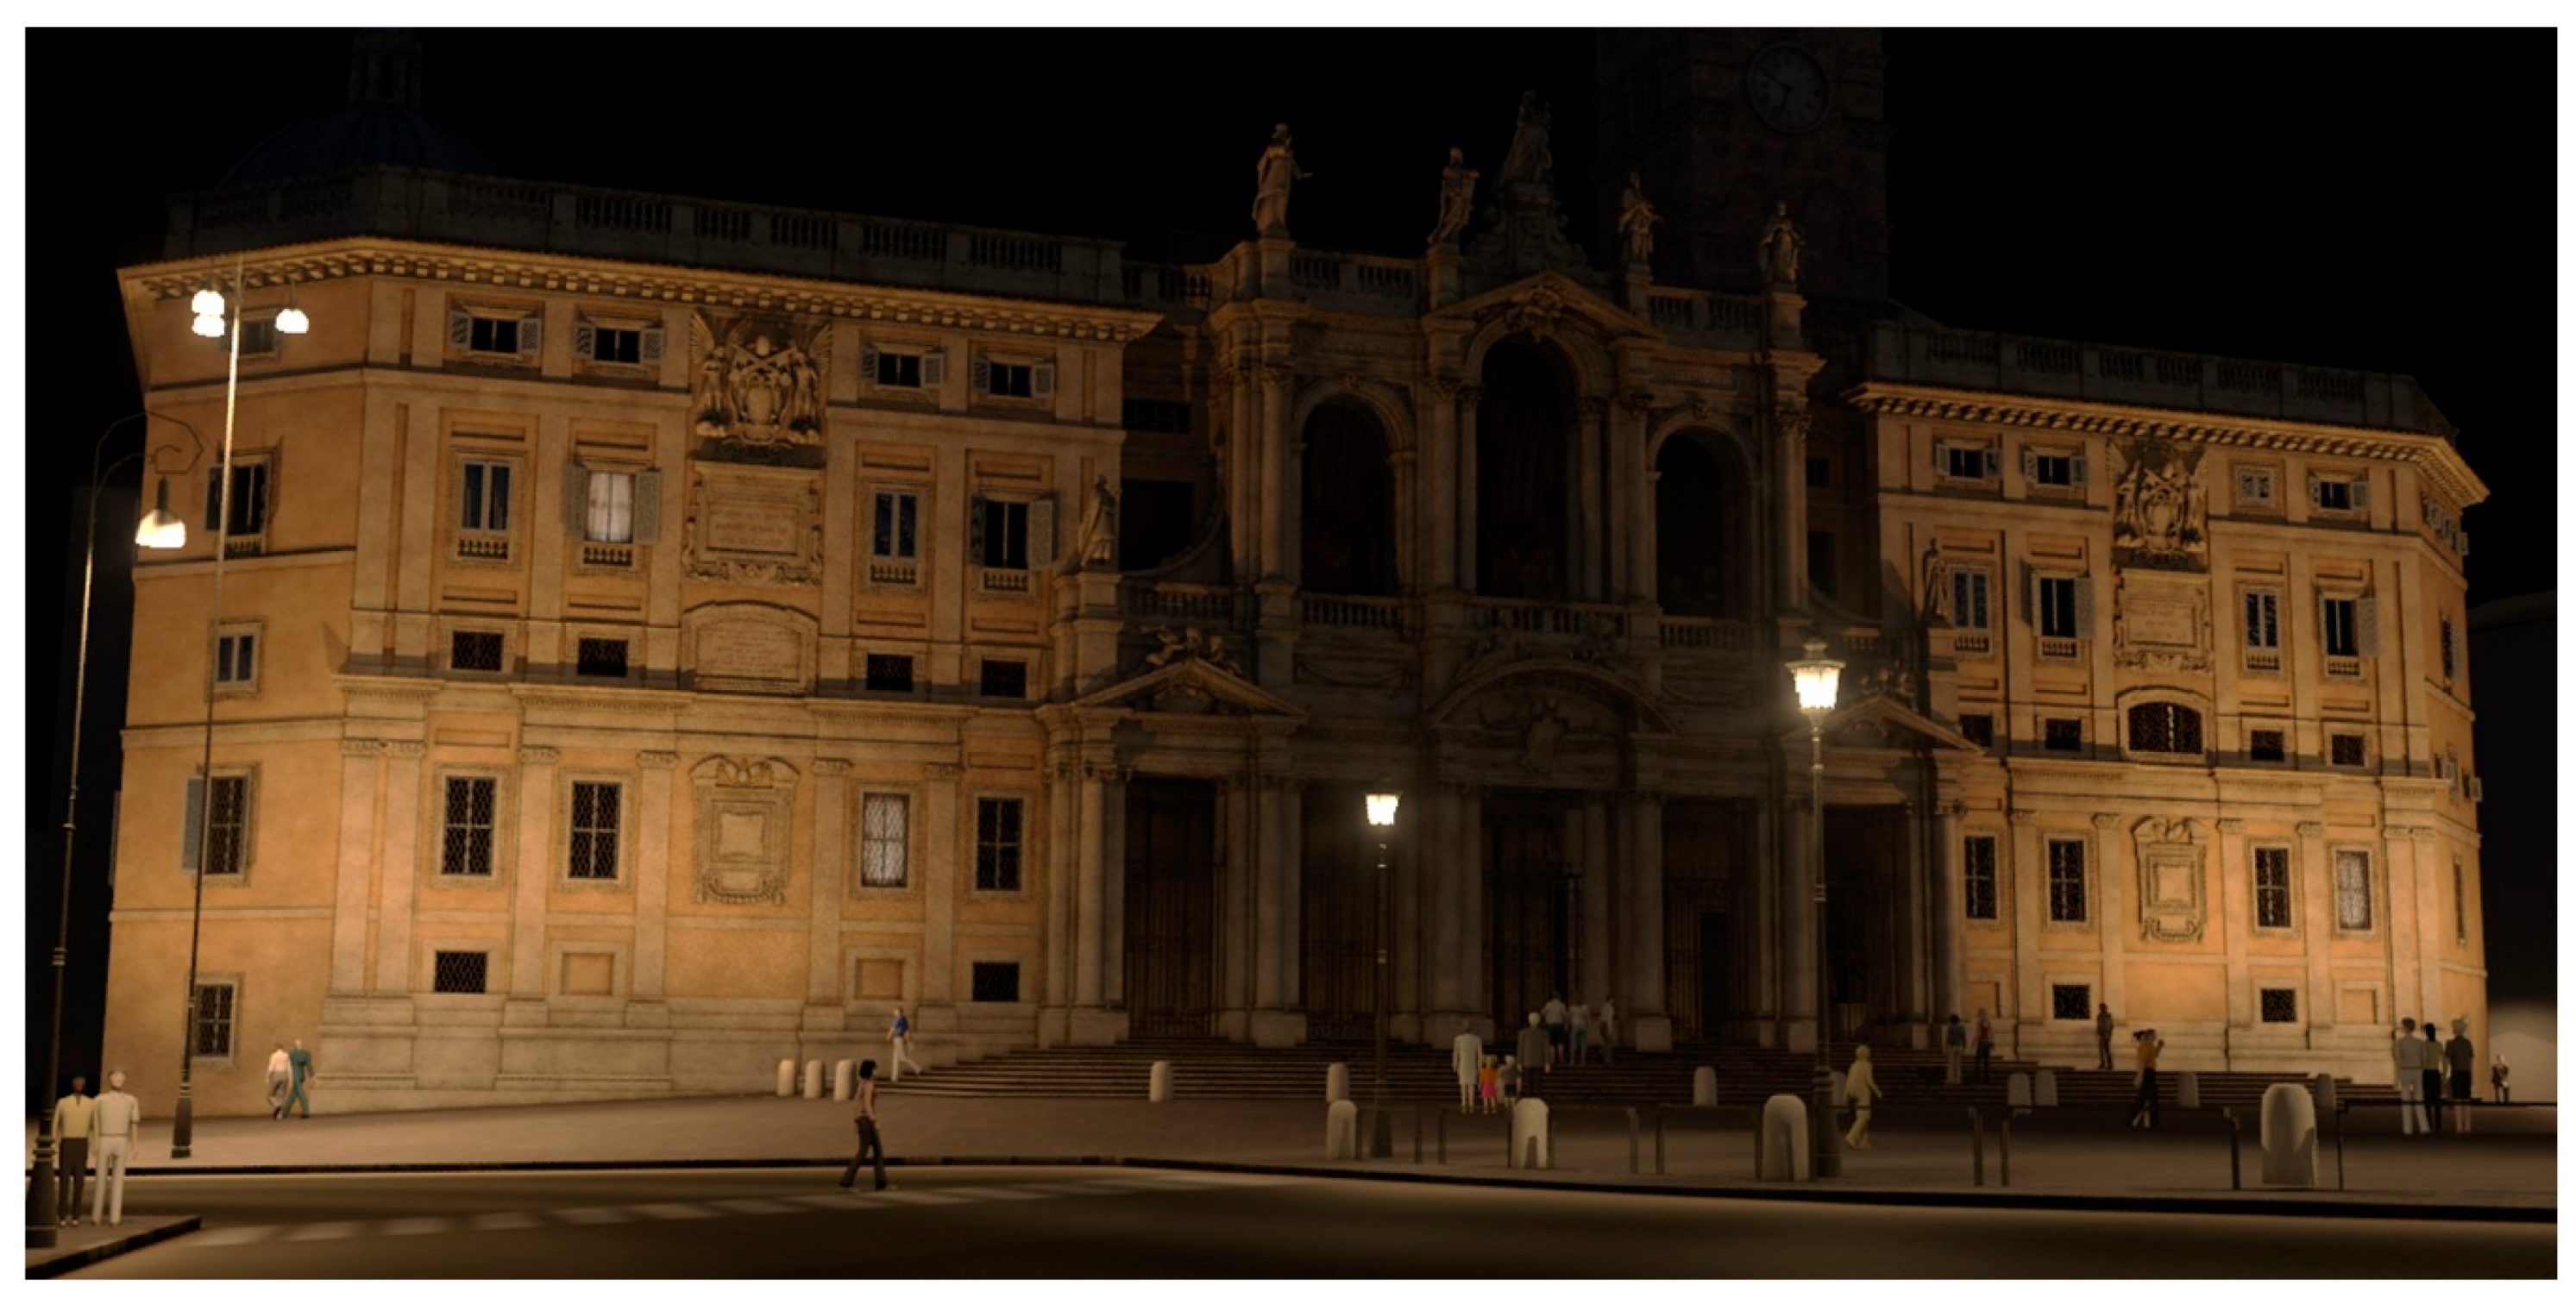
Figure 20, the visualization of the impact of street lighting was supplemented with additional floodlighting, and in
Figure 21 with accent illumination.
In the case under consideration, the street lighting luminaires emit light output asymmetrically into the lower parts of the fronton. The central, richly decorated part of the fronton remained temporarily darkened to improve the readability of the visualization. In this case, street lighting is a factor that severely hinders the development of attractive illumination.
6. Evaluation of the Selection of Luminaires in the Context of Inclusion of Street Lighting in the Created Illumination Concept
The second phase of the work was aimed at supplementing the central zone of the front with floodlighting and offsetting the unfavorable distribution of luminance on the side zones of the structure’s front. As a result of repeated attempts to select the light curves of the floodlighting luminaires, targeting, and placement, the task was accomplished as designed (
Figure 22). An evaluation of the simulation result can be made by analyzing the final luminance distribution of the basilica’s floodlighting design, obtained after the final rendering in the form of a pseudo-color image (
Figure 23).
Based on the luminance distribution, it can be seen that the equalization of the luminance distribution in the intensive lighting zone of the decorative luminaire battery at the entrance square of the basilica has been successfully executed. The right choice of illumination equipment allowed for the decisive equalization of the distribution of light spots within the contour of the basilica’s front. It should be noted that the task was accomplished despite the negative impact of street lighting while meeting the principle of enhancing depth and consistency [
31].
7. Conclusions
The article assesses the extent of the impact of street lighting on the freedom to create floodlighting of architectural objects, located in close proximity to street lighting installations. This situation applies mainly to downtown developments and city centers. Several general conclusions can be drawn from the computer calculations. Currently, available graphical applications make it possible to analyze the fully complex processes of street lighting effects on the facade of a building. The assortment of available mathematical models for floodlighting luminaires is sufficient to effectively eliminate the adverse effects of street lighting on planned floodlighting design work.
The article examines the influence of a number of street lighting factors, such as the mounting height and installation distance of street and park luminaires from the object being illuminated, their electrical power, and the light distributions used as well as the impact of neighboring luminaires located in close proximity. For the above-mentioned factors, the obtained light spot on the facade was analyzed in terms of the possibility of using it to create an overall or fragmentary illumination of the object, located in close proximity to street lighting. The simulation studies conducted gave rise to several major conclusions:
- -
For selected variants of the placement of street and park luminaires, with their relatively high power and appropriate photometric bodies, it is possible to obtain a spot of light, allowing independent creation of floodlighting of the structure. This case can be met mainly for clean facades and those in low background luminance environments,
- -
For most of the implemented variants related to the distribution of luminaires, their power, and the applied light curve, the obtained values of the illuminance of the light spot did not allow independent creation of floodlighting, while the obtained light spot can be an auxiliary component of the designed floodlighting. Depending on the geometry of the distribution of street luminaires, the auxiliary component can cover an area of the facade from a dozen to more than 100 m2 in the case of the effect of street luminaires in close proximity to the object,
- -
For variants characterized by the close distance of luminaire installation from the facade wall and a concentrated light distribution curve, there is the unfavorable phenomenon of the formation of a light spot with a high illuminance value and a small area. This is a component of the illumination “interfering” with the design work of the floodlighting system.
The conducted analysis of the impact of street lighting on the design of floodlighting provided the basis for the successful execution of the floodlighting design for the least favorable case, in which the existing street lighting was a component “hindering” the designed floodlighting. Using an advanced graphics application, a floodlighting design was made for the Basilica di Santa Maria Maggiore in Rome, taking into account the existing street lighting that adversely affects the facade of the building. The inclusion in the design of light spots created by street luminaires adjacent to the structure, as well as the selection of appropriate floodlighting equipment to illuminate the front area, made it possible to create a coherent night image of the basilica structure while exposing the principle of enhancing depth and coherence.
It is better to study the impact of street lighting on a specific facade by analyzing the distribution of luminance. In this case, a significant limitation of the research is the need to have a point or matrix luminance meter. Precise mapping of the luminance distribution on the façade of a real object in a computer program environment is of fundamental importance in the subsequent selection of computer models of floodlights. In the future, the authors plan to dynamically incorporate elements of artificial intelligence into the illumination design work. The use of artificial intelligence (AI) would allow, for example, the identification of the distribution of luminance on the façade generated by street lighting in terms of automating the selection of light parameters for floodlights.
The research results presented in this article can provide valuable guidance to lighting designers, mainly for floodlighting, regarding the possibility of using or reducing the harmful effects of existing street lighting on the designed illumination, while improving the energy efficiency of the designed floodlighting.
