Article

Performance, Emissions, and Combustion Characteristics of a Hydrogen-Fueled Spark-Ignited Engine at Different Compression Ratios: Experimental and Numerical Investigation

1
Clean Combustion Research Center, King Abdullah University of Science and Technology (KAUST), Thuwal 23955-6900, Saudi Arabia
2
Hydrogen Technology Center, GTI Energy, 1700 S Mount Prospect Rd, Des Plaines, IL 60018, USA
*
Author to whom correspondence should be addressed.
Energies 2023, 16(15), 5730; https://doi.org/10.3390/en16155730
Submission received: 5 July 2023 / Revised: 21 July 2023 / Accepted: 27 July 2023 / Published: 31 July 2023
(This article belongs to the Special Issue Combustion and Flame: Latest Research)

Abstract

:
This paper investigates the performance of hydrogen-fueled, spark-ignited, single-cylinder Cooperative Fuel Research using experimental and numerical approaches. This study examines the effect of the air–fuel ratio on engine performance, emissions, and knock behaviour across different compression ratios. The results indicate that λ significantly affects both engine performance and emissions, with a λ value of 2 yielding the highest efficiency and lowest emissions for all the tested compression ratios. Combustion analysis reveals normal combustion at λ ≥ 2, while knocking combustion occurs at λ < 2, irrespective of the tested compression ratios. The Livenwood–Wu integral approach was evaluated to assess the likelihood of end-gas autoignition based on fuel reactivity, demonstrating that both normal and knocking combustion possibilities are consistent with experimental investigations. Combustion analysis at the ignition timing for maximum brake torque conditions demonstrates knock-free stable combustion up to λ = 3, with increased end-gas autoignition at lower λ values. To achieve knock-free combustion at those low λs, the spark timings are significantly retarded to after top dead center crank angle position. Engine-out NOx emissions consistently increase in trend with a decrease in the air–fuel ratio of up to λ = 3, after which a distinct variation in NOx is observed with an increase in the compression ratio.

1. Introduction

Global warming, due to greenhouse gas emissions, has become a major concern associated with the use of fossil fuels. Coal, oil, and natural gas are the primary sources of energy for transportation, electricity generation, and industrial processes, and they contribute significantly to global carbon dioxide emissions. In fact, approximately 73% of global emissions are due to the combustion of fossil fuels for energy production [1]. Road vehicles, which are predominantly powered by internal combustion engines (ICEs), make a substantial contribution to global carbon dioxide emissions, representing approximately 16% of these emissions [2].
In response to the need for a more efficient and cleaner operation of ICEs and to mitigate the environmental impact of fossil fuel use, significant progress has been made in researching low-carbon-intensity alternative fuels [3,4]. Numerous studies have examined the utilisation of various alternative fuels, such as compressed natural gas [5], liquefied petroleum gas [6], hydrogen [7], and alcohol fuels [8], in spark-ignition (SI) engines. Among these fuels, hydrogen has gained significant attention due to its high combustion efficiency, zero carbon emissions during combustion, and improved fuel efficiency compared to conventional fossil fuels.
Hydrogen can theoretically be used in ICEs without major modifications [9]. There are two main methods for supplying hydrogen: port-fuel injection (PFI) and direct injection (DI). PFI systems are cost-effective and easy to implement in an ICE, while the DI system allows for more precise control, resulting in higher fuel efficiency. However, the high-pressure requirement in the hydrogen DI system makes it less practical. Compared to gasoline engines, hydrogen PFI combustion provides higher efficiency and very low emissions but lower power output due to the reduction in volumetric efficiency [10]. However, a hydrogen ICE produces higher NOx emissions near to λ = 1 due to the high combustion temperature [11].
There are several methods for improving the performance of hydrogen ICEs. The theoretical Otto cycle is commonly used as a comparative cycle for analysing the performance of ICEs, including hydrogen-powered engines [7]. Considering the theoretical cycle efficiency (Equation (1)) [12], one method is to increase the compression ratio (CR) of a hydrogen engine to enhance its power output and overall efficiency, as hydrogen demonstrates high knock resistance due to its high autoignition temperature [13]. Boosting systems can also be used to increase the amount of air induced and achieve higher volumetric efficiency, resulting in more fuel being completely burned [14]. Lee et al. demonstrated that boosting the hydrogen PFI engine with a turbocharger results in a 41% increase in engine power output compared to the naturally aspirated condition [15]. Additionally, the wide flammability range of hydrogen enables the possibility of operating at extremely lean conditions, resulting in enhanced fuel efficiency and emissions-free combustion [16].
η O t t o = 1 1 C R γ 1
where γ represents the ratio of specific heat; for hydrogen–air mixtures, the value is approximately 1.4.
Hydrogen has a high-octane rating, especially when operating under lean conditions [13], making it a potential source of high power output in engines by increasing the compression ratio [17]. However, due to its extremely low ignition energy of 0.019 mJ, abnormal and unstable combustion behaviour can occur, posing challenges for engine operation and control [18]. In addition, the high reactivity of hydrogen can lead to pre-ignition, backfire, and knock, which can further affect the engine’s performance and reliability [19]. Therefore, optimising the engine operating conditions, including the air–fuel ratio and ignition timing at given compression ratios, is critical to achieving efficient and stable hydrogen combustion in engines [20].
In order to provide optimal performance for SI engines powered by hydrogen, the combustion behaviour of H2 needs to be characterised. In this study, the performance of a spark-ignited, port-fuel-injected (PFI) single-cylinder Cooperative Fuel Research (CFR) engine fueled with hydrogen was specifically focused on. A detailed investigation of hydrogen-fueled engine operation is necessary to facilitate its use as an ICE fuel with near-zero emissions. This study begins by conducting detailed experimental research to evaluate the effect of the air–fuel ratio and compression ratio on the performance, emissions, and combustion characteristics of a modified Cooperative Fuel Research (CFR) engine fueled by hydrogen in the SI and PFI modes. Additionally, an assessment of the autoignition potential of the fuel–air mixture is conducted using the Livengood–Wu (LW) integral method, providing insights into the probability of knock and assessing the impact of air–fuel mixture reactivity on combustion processes [21,22,23].

2. Experimental Method

2.1. Experimental Setup

For the experimental investigations, a modified CFR F1/F2 engine with a PFI of hydrogen and variable compression ratio technology was utilised. The engine specifications are presented in Table 1. To control the speed and load of the engine, an ABB electric motor was connected to the engine. Hydrogen, at a pressure of 6 bar, was injected into the intake manifold and was achieved using a quantum VW-type port-fuel injector. Previous research has indicated that advancing fuel injection timing enhances the uniformity of the air–fuel mixture distribution within the combustion chamber [24]. Conversely, delaying the injection timing can result in localised irregularities in fuel distribution, potentially leading to inefficient or incomplete combustion [25]. Therefore, in order to maintain a well-mixed mixture and prevent backfire, the fuel injection timing was consistently fixed at 280 crank angle degrees (CAD) before top dead center (bTDC) throughout the experiments.
The AVL ZI33 Y5M spark-plug type pressure transducer was utilised to accurately capture and record the instantaneous pressure changes in the combustion chamber during engine operation. Intake pressure and exhaust pressure data were measured using absolute pressure sensors (GH14D, AVL, Graz, Austria). An AVL angle encoder 365C with a 0.2 CAD resolution was utilised to record 300 full engine cycles, which are required to achieve a robust statistical analysis of the knocking events. To facilitate engine control and monitoring, a customised LabView program was developed.
Hydrogen from a gas cylinder at a pressure of 200 bar was then reduced to 6 bar prior to delivery to the injector. The hydrogen flow rate was monitored using a mass flow controller (MFC) (SLA5800, Brooks, Bellingham, WA, USA). Clean air was supplied to the intake port through another MFC (SLA5800, Brooks). To prevent the accumulation of hydrogen concentration, the crankcase was continuously ventilated using an active ventilation system. The air–fuel ratio was measured using a wide-band oxygen sensor (LSU 4.2, Bosch, Gerlingen, Germany) connected to a lambda metre (LA4, ETAS, Stuttgart, Germany). Temperature measurements at the inlet and exhaust ports were carried out using K-type thermocouples.
To measure regular exhaust emissions from the engine, a FTIR-type emissions analyser (SESAM i60, AVL) was used. The hydrogen concentration level in the exhaust was measured using an ECOM-J2KNpro portable analyser. A schematic of the experimental setup is shown in Figure 1. The accuracy and range of each measurement device are presented in Table 2.

2.2. Experimental Conditions

In this study, the CFR engine was operated with pure hydrogen supplied to the intake manifold at different compression ratios. The engine was operated at a speed of 600 RPM, corresponding to the most convenient speed for fuel testing in a CFR engine [26]. The spark timing was varied to maintain the MBT condition where the crank angle at 50% mass fraction burned (CA50) at approximately 10 ± 1 CAD aTDC throughout the tests.
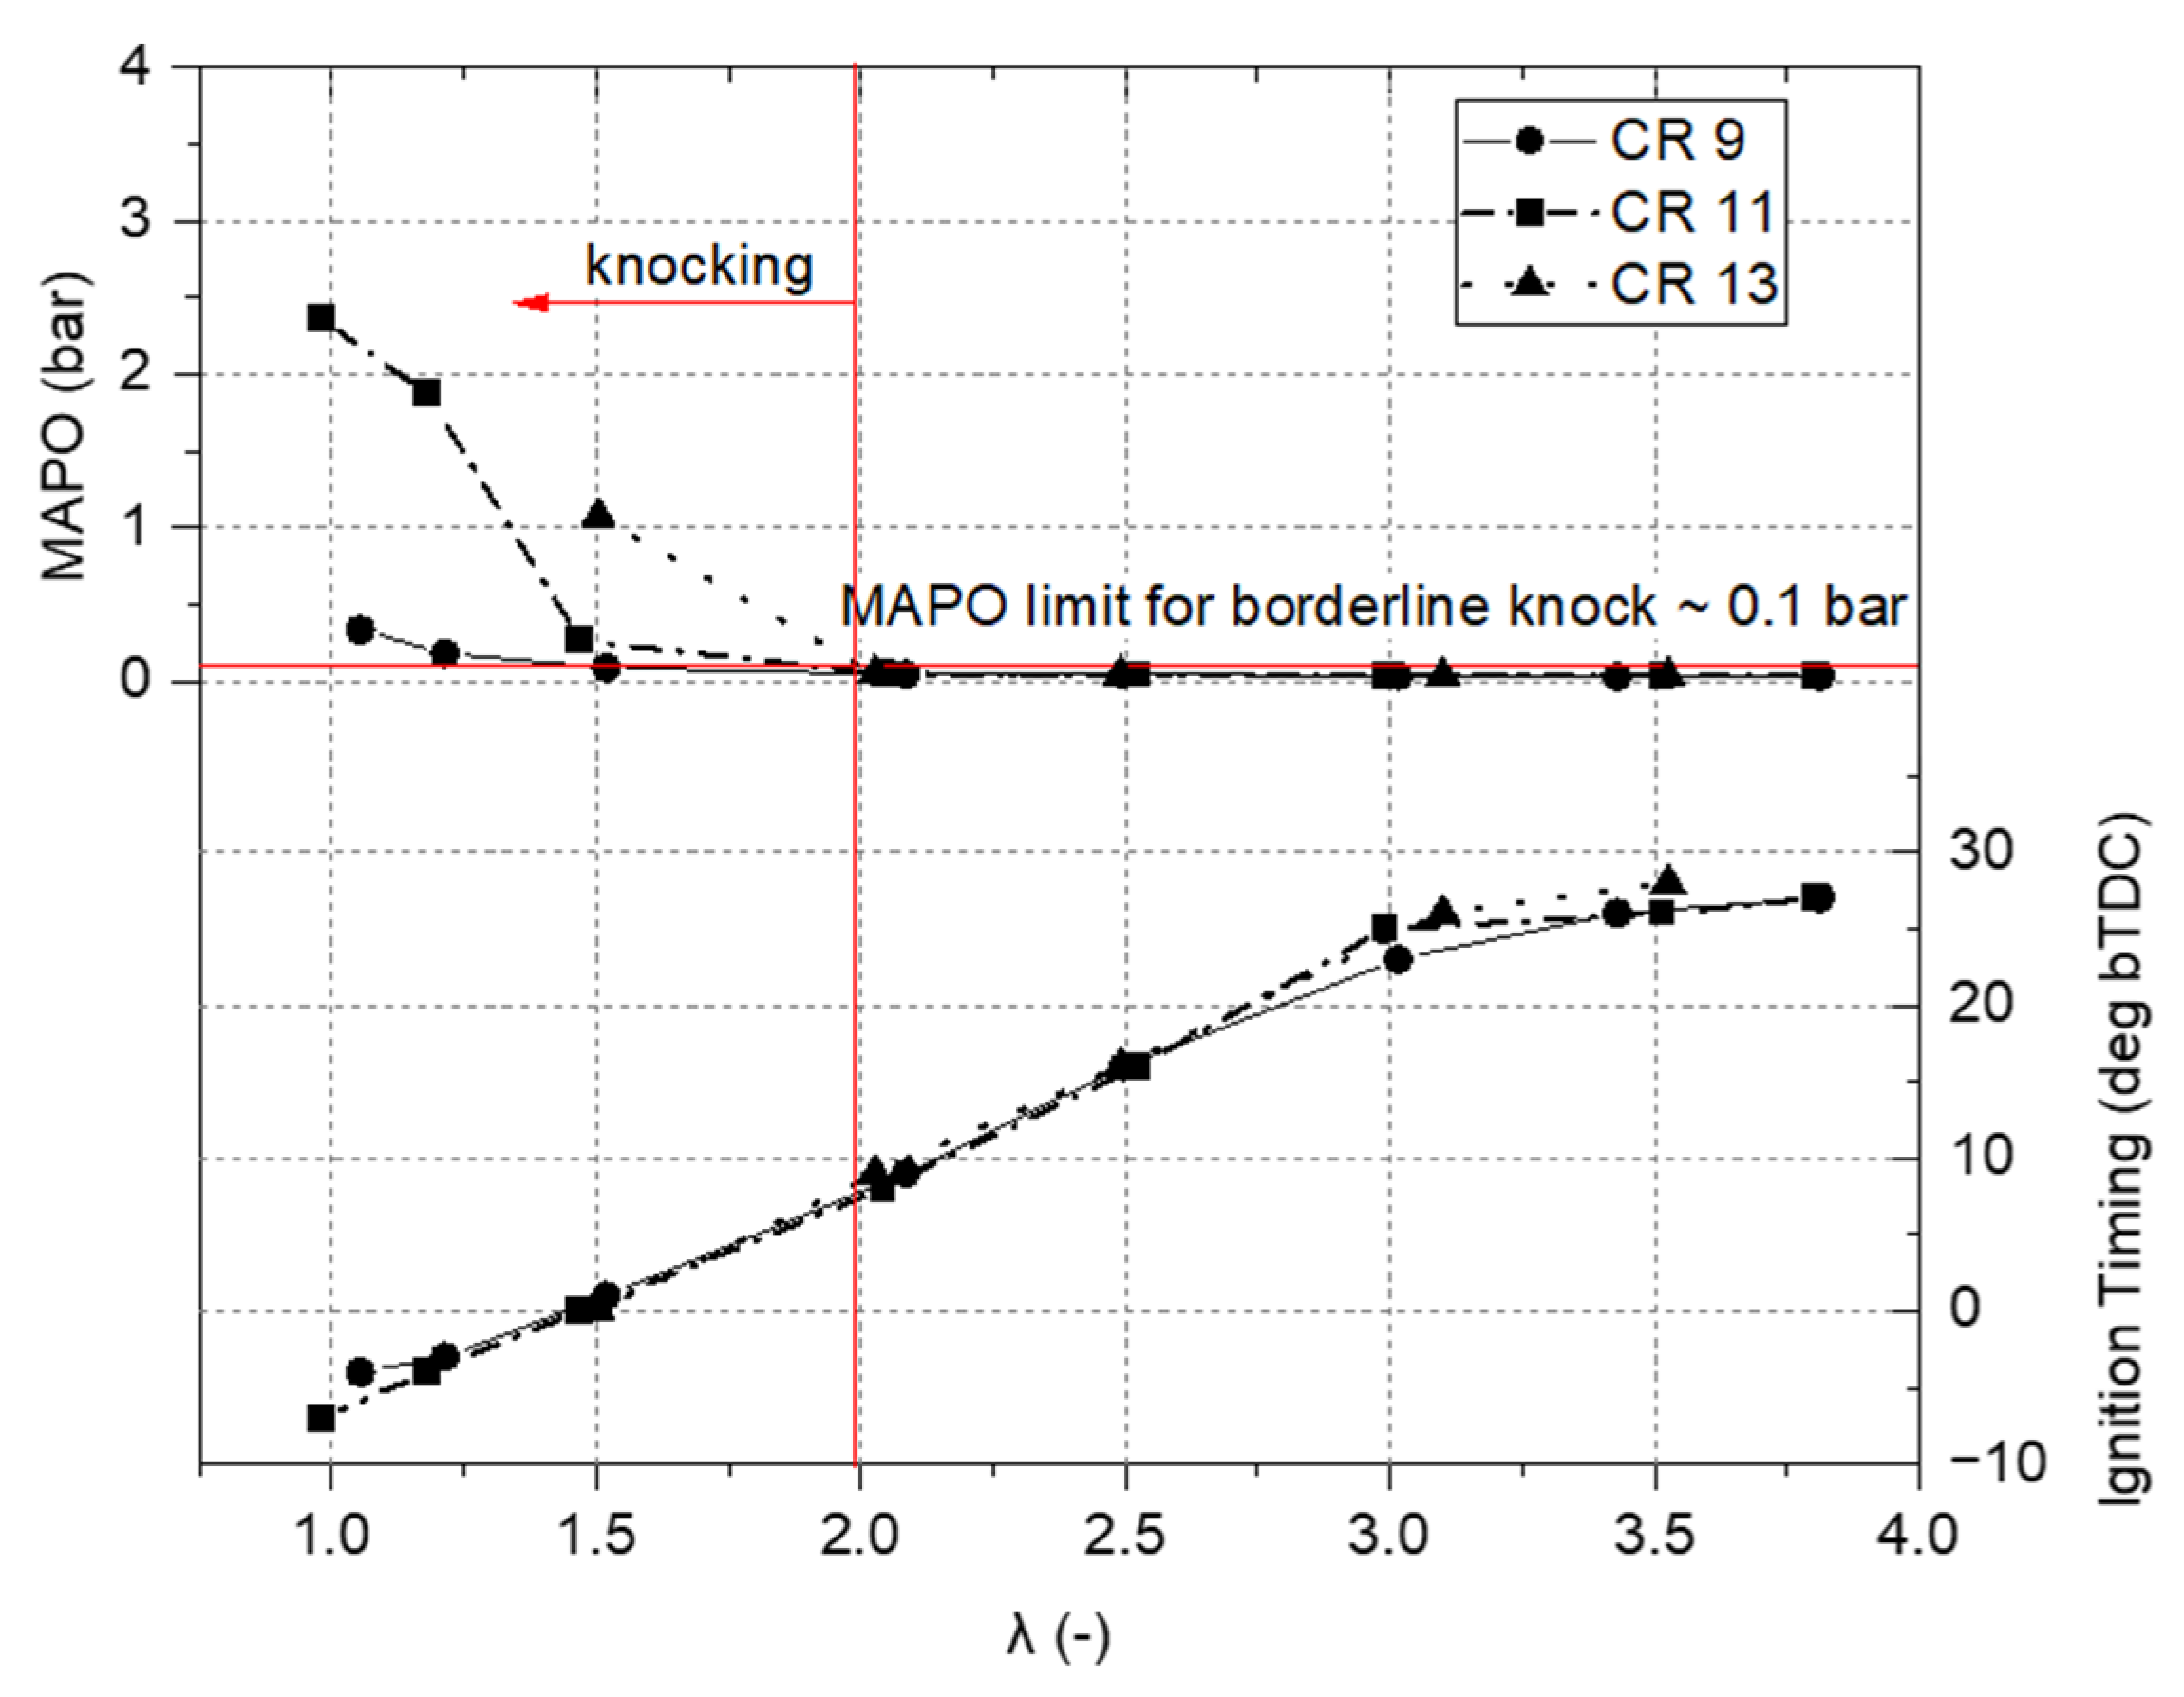
To capture all high-frequency pressure oscillations associated with knocking combustion, an in-house built LabView code with a Butterworth-type bandpass filter was used. The lower and upper cut-off frequencies of the filter were set to 3 and 20 kHz, respectively [27]. Various metrics were utilised to assess knocking combustion, including the maximum amplitude of high-frequency pressure oscillation (MAPO), knock point (KP), and knock-point pressure. The MAPO was determined by calculating the maximum absolute amplitude of the bandpass-filtered in-cylinder pressure associated with knock [28]. A MAPO value of approximately 0.1 bar is considered indicative of being borderline for defining knock based on audible sounds from the CFR engine [29]. The value of KP was determined by identifying the CAD that corresponds to the maximum point of the second derivative of the in-cylinder pressure [30,31]. A detailed description of each parameter can be found in the previous study by the authors [32].
To identify normal and abnormal combustion conditions, a single representative in-cylinder pressure trace was selected from the recorded 300 cycles. The selection was performed by minimising a cost function (CF) defined by Equation (2). A detailed description of this can be found in [33,34].
C F i = d P / d t m a x i d P / d t m a x a v g d P / d t m a x a v g + E r e s i E r e s a v g E r e s a v g + M A P O i M A P O a v g M A P O a v g
where dP/dt represents the maximum pressure rise rate, and Eres corresponds to the unsteady pressure field described by the energy of resonance.

3. Numerical Method

3.1. Chemical Kinetic Model

For the kinetic evaluations, the CHEMKIN-Pro version 2020 R1 software [35] was utilised as a tool for solving reaction kinetics. The software facilitated the calculation of ignition delay time (IDT) and laminar flame speed of hydrogen–air mixture trapped in-cylinder. A detailed explanation of the model can be found in the previous study by the author [36]. Notably, the measured in-cylinder pressure and the unburned gas temperature, obtained from the GT-Power Three Pressure Analysis (TPA) model, were utilised as inputs in the kinetic model. The chemical kinetic mechanism incorporated in the model involved NO chemistry and encompassed a total of 153 species and 1227 elementary reactions [37].
The Livengood–Wu (LW) method [21,22,23] is an analytical approach used to assess the autoignition potential of a fuel–air mixture. This method utilises various factors, such as fuel composition, in-cylinder pressure, and temperature data, to calculate the ignition delay time (IDT) of the mixture. Autoignition, on the other hand, refers to the chance that a fuel–air mixture will spontaneously ignite without an external ignition source. It is influenced by factors like fuel properties, compression ratio, and engine operating conditions. The LW integral can be mathematically described as the following equation:
1 = 0 τ i g n 1 τ   d t
where τ i g n represents the duration between ignition events, and τ denotes the immediate ignition delay time. When the integration of the LW integral approaches or reaches a value of 1, it signifies that the air–fuel mixture is prone to autoignition, given the specific temperature and pressure conditions [23].

3.2. CFR Engine Model

This study implemented a 0D/1D simulation through Gamma Technologies’ GT-Power (version: 2022.0.7501) software platform based on the TPA method [30,38,39]. This modelling approach combines Woschni’s heat transfer correlation and the two-zone combustion concepts to simulate the behaviour of the engines [40]. The simulated data was validated by comparing it with the experimental data, ensuring the accuracy and reliability of the simulation [36]. Figure 2 illustrates a comparison between the experimental and non-predictive simulation results of hydrogen combustion at CR 9, demonstrating a close agreement and affirming the accuracy of the model.

4. Results and Discussion

4.1. Engine Performance

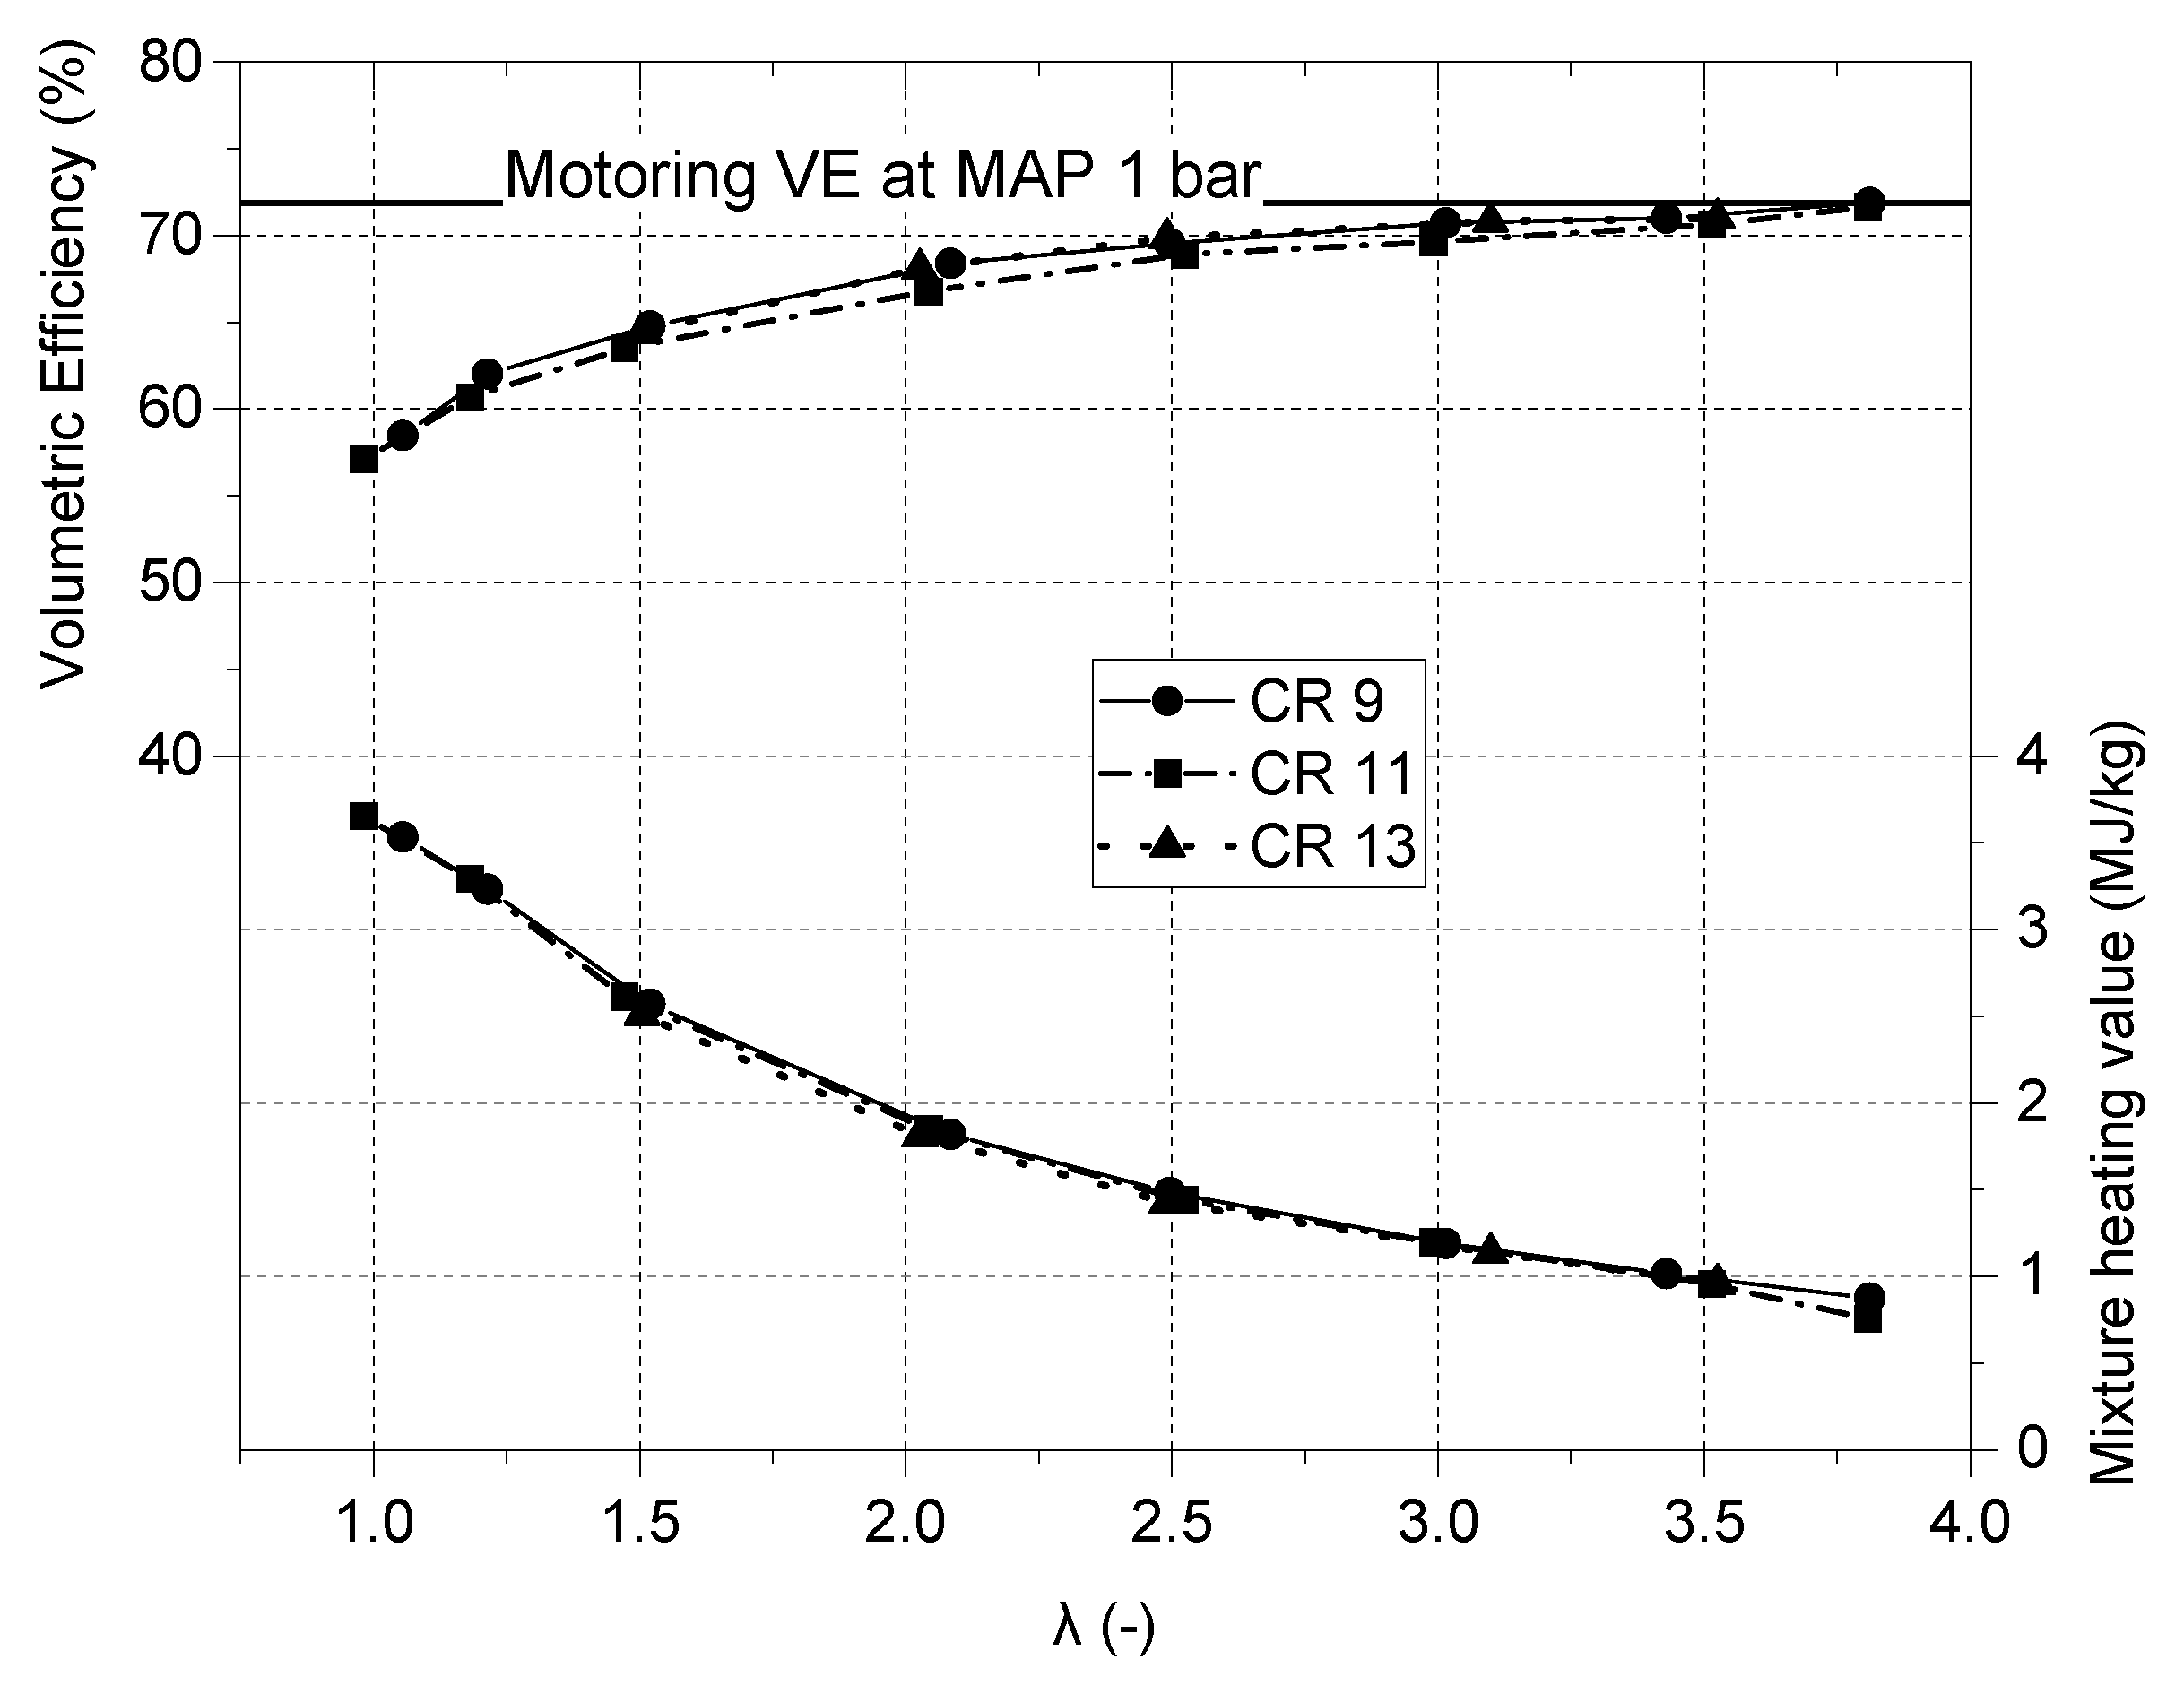
This section presents the engine performance results over a range of excess air–fuel ratios at CRs of 9, 11 and 13. Figure 3 shows the impact of the excess air–fuel ratio (λ) on volumetric efficiency (VE). At the tested manifold air pressure (i.e., 1 bar), volumetric efficiency drops as the air–fuel ratio decreases, and a maximum of a 34% drop in VE is observed in the stoichiometric conditions (λ = 1). With the decrease of λ, the amount of H2 injected into the engine increases and displaces more incoming air, resulting in lower volumetric efficiency. In contrast, as shown in Figure 4, the net indicated mean effective pressure (IMEP) increases with a decreasing λ, reaching a peak value of 5.2 bar. This is because the mixture heating value increases with lower λ values at a given intake pressure.
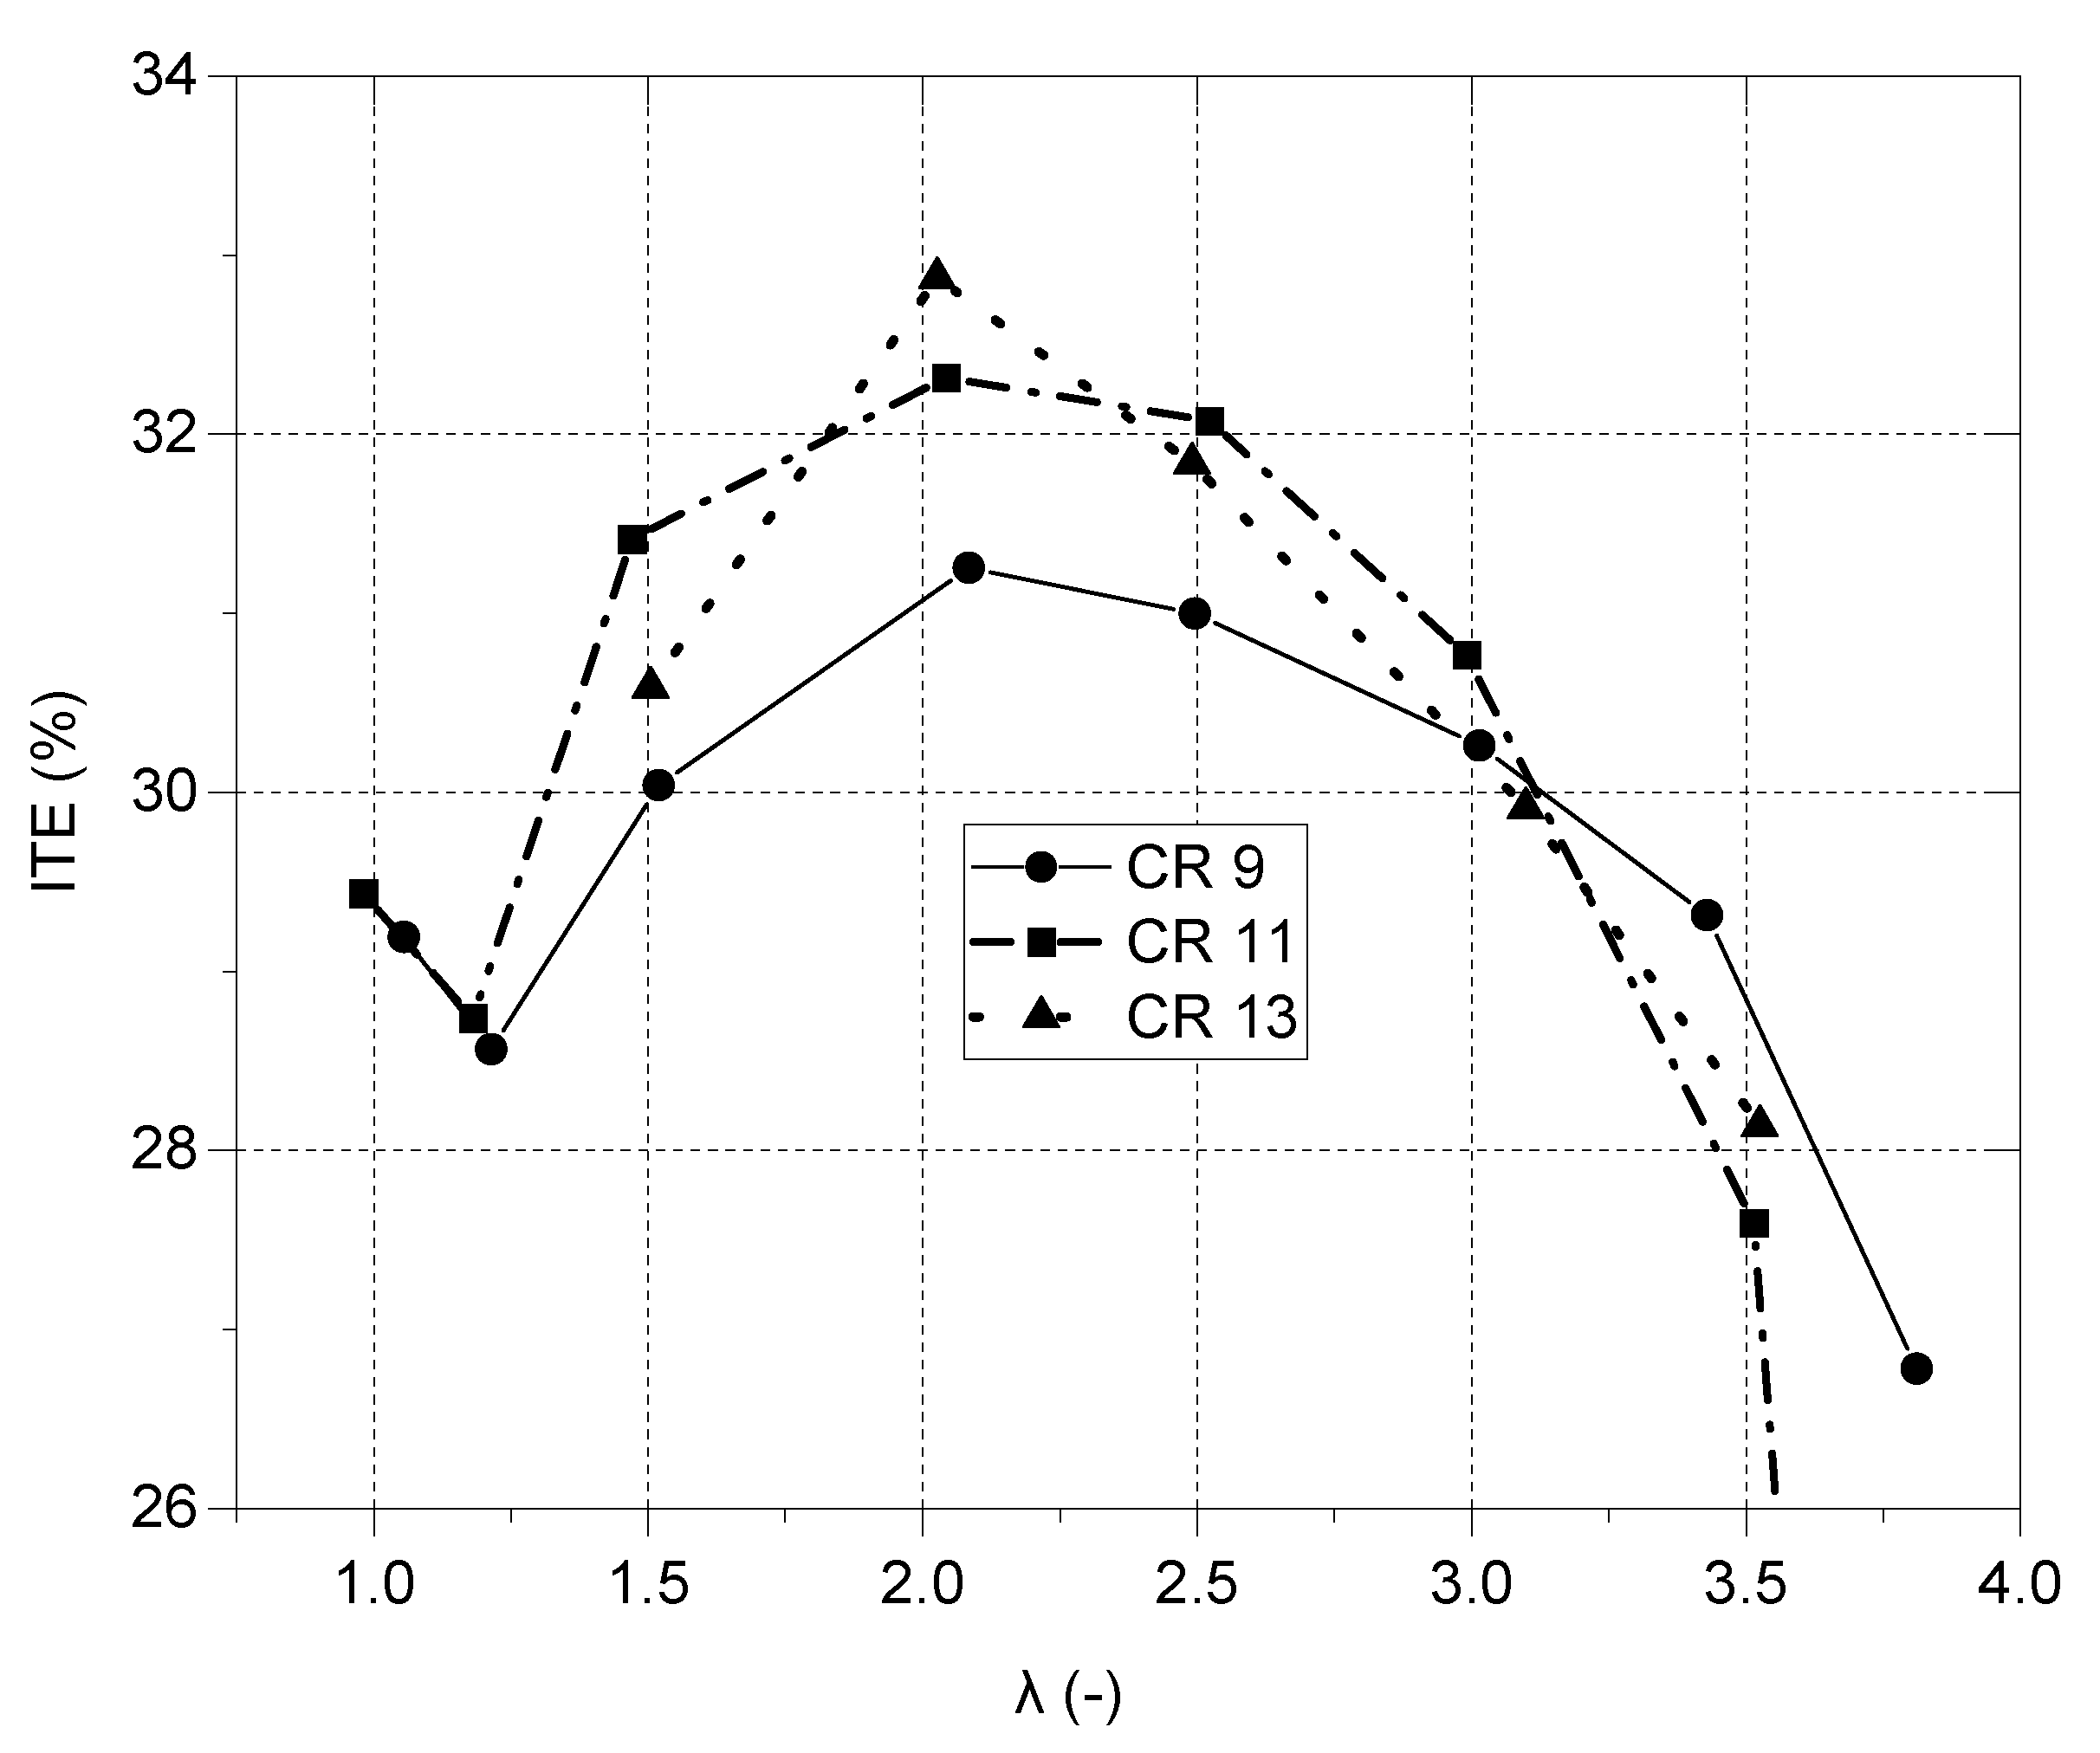
The indicated thermal efficiency (ITE) peaks at around λ = 2 and starts to drop on both sides of this excess air–fuel ratio, as shown in Figure 5. When the mixture becomes richer (i.e., λ < 2), the ITE drops, likely due to the increase in wall heat transfer losses [41]. On the other hand, despite the increase in the specific heat ratio with a lean mixture, the ITE decreases with λ > 2, which could be attributed to a drop in combustion efficiency due to an increase in unburned hydrogen emissions, which will be discussed in a later part.
Additionally, with CR 9, the hydrogen–air mixture undergoes further complete combustion, resulting in higher thermal efficiency. However, as the CR increases, the combustion process becomes more constrained, and the mixture becomes less homogeneous, leading to decreased efficiency. Also, at λ values beyond 3, the engine operates under lean conditions, which reduces combustion stability and efficiency due to the reduced heat losses and increased pumping losses. The combination of lean operation and a lower CR (CR 9 in this study) promotes better combustion, leading to higher ITEs compared to other CR conditions.
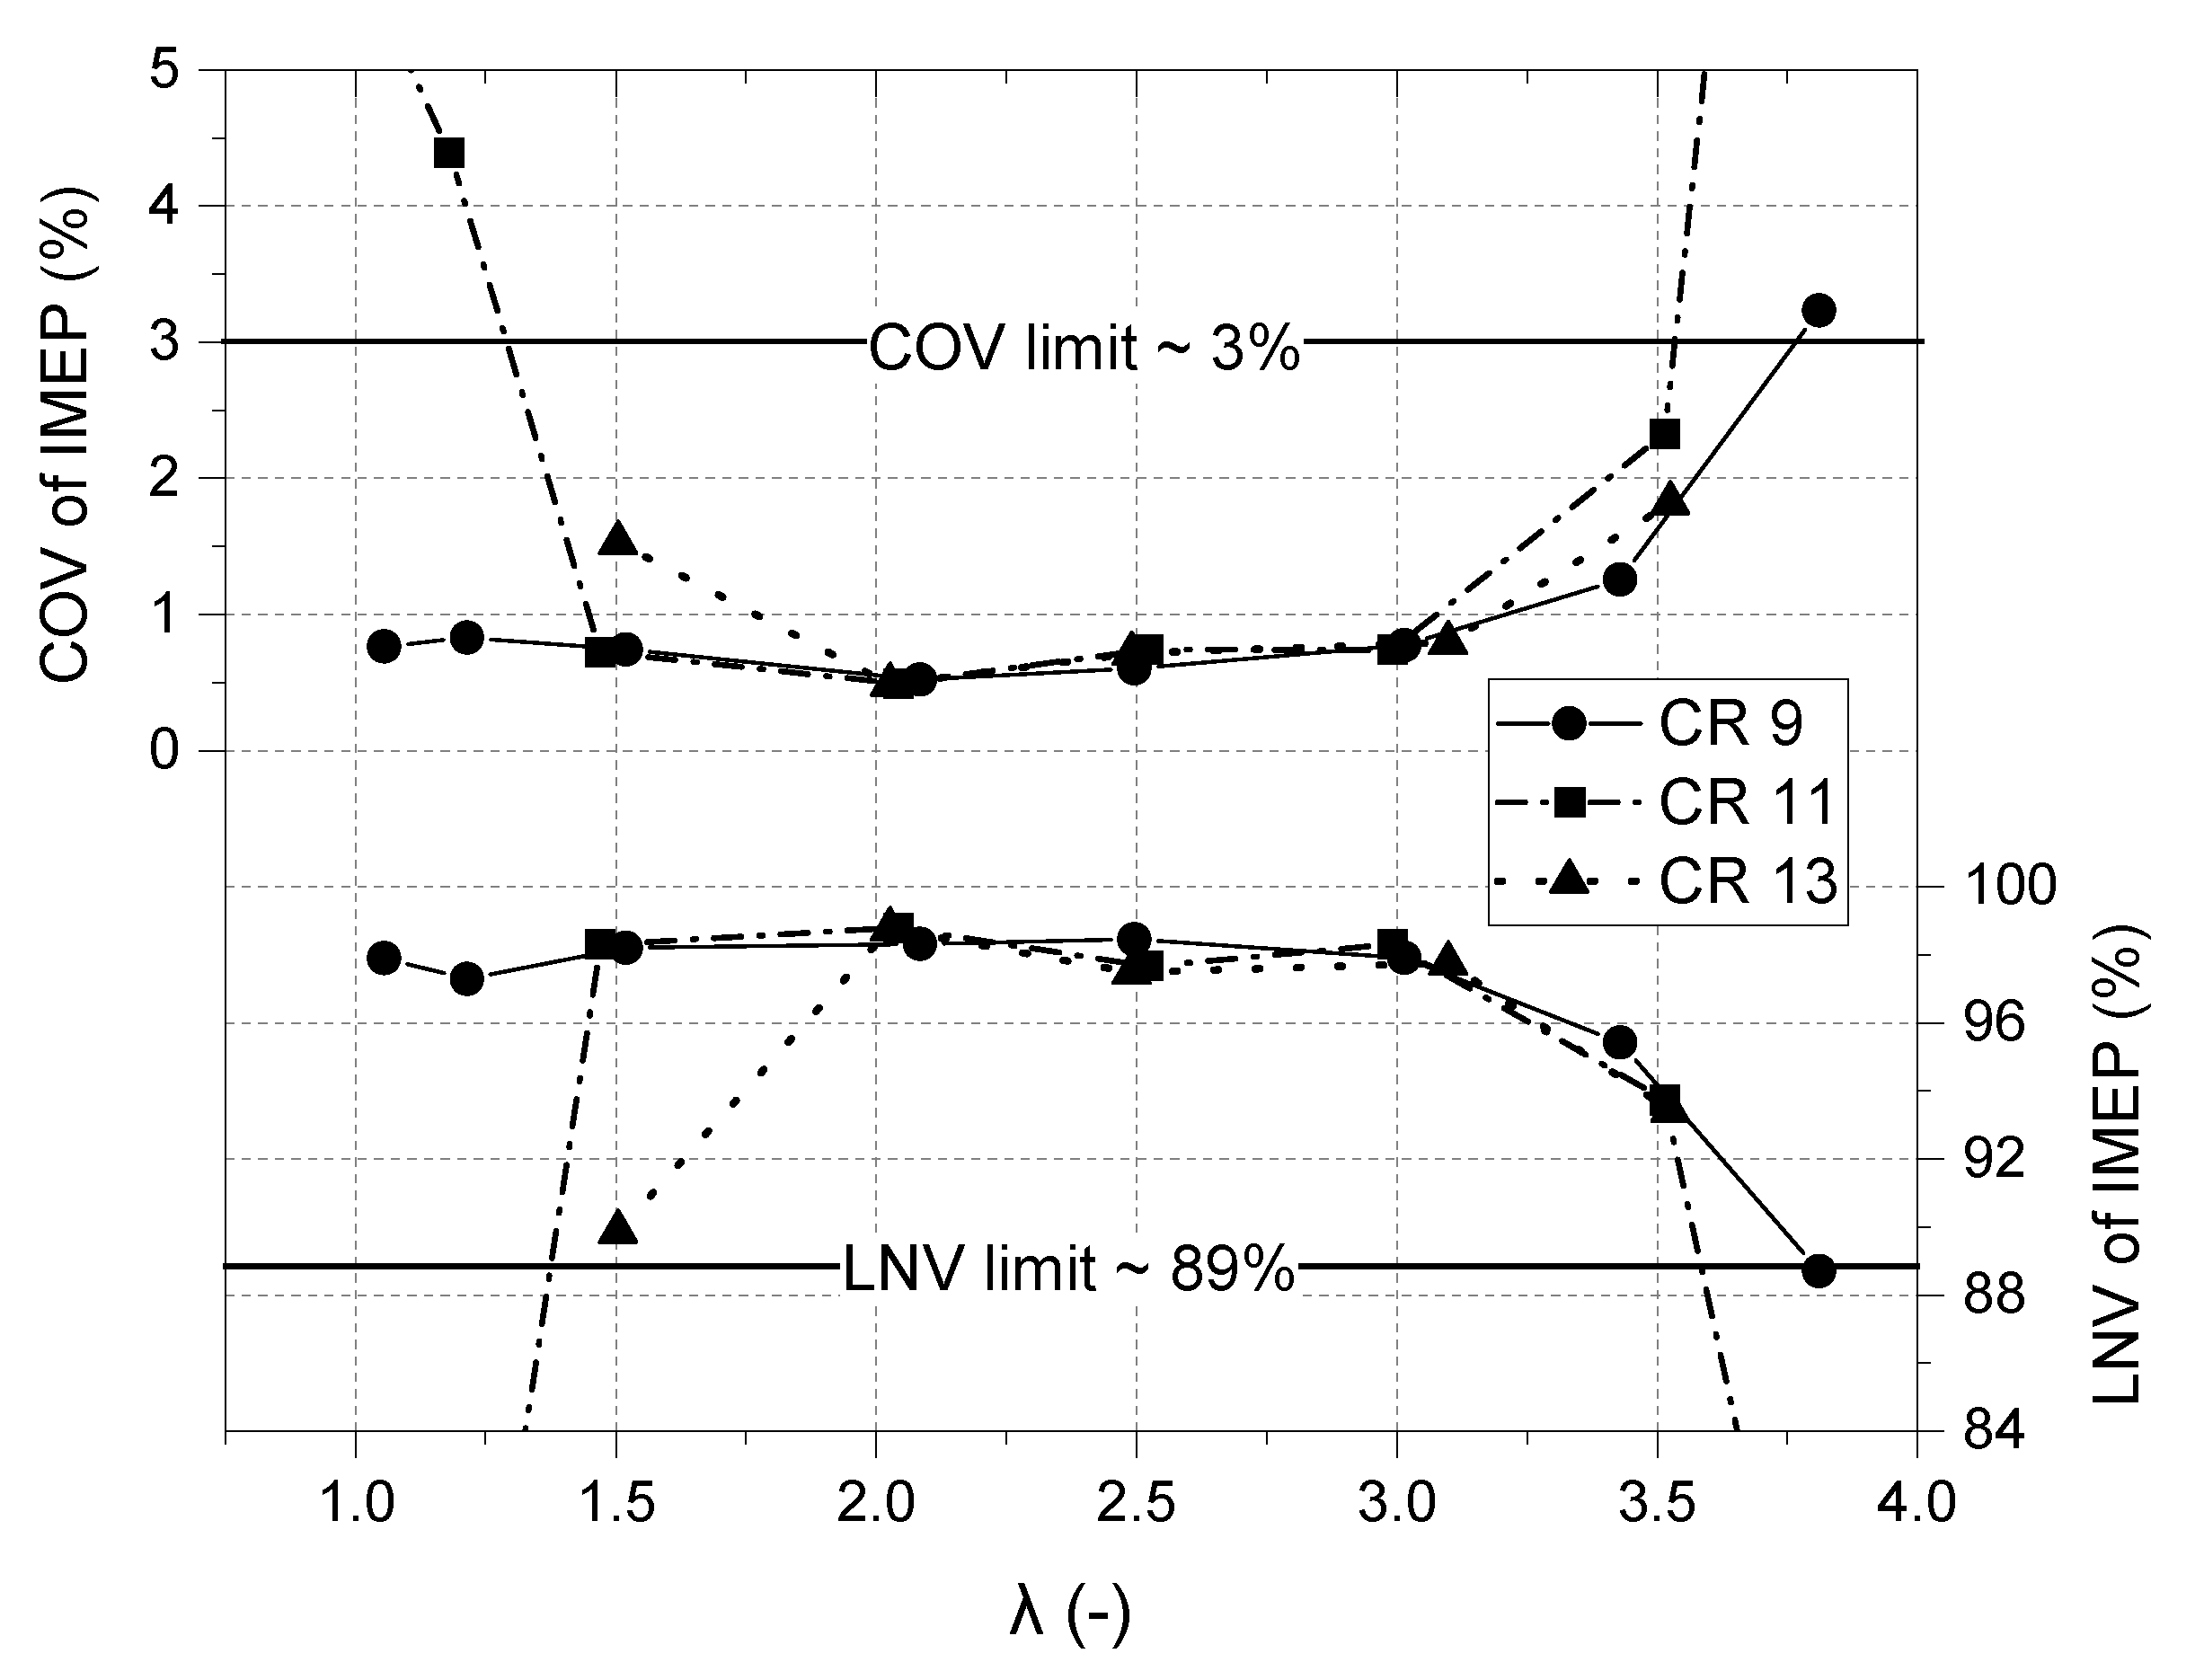
To evaluate the engine’s combustion stability, the coefficient of variation of the indicated mean effective pressure (COV of IMEP) is a significant parameter. A COV of less than 3% is generally considered a stable engine operation [25]. For nearly all tested cases, the COV is lower than 3% and indicates good combustion stability, as illustrated in Figure 6. However, the COV values increased significantly with λ < 1.5 and λ > 3.5 at CR 11, suggesting unstable combustion under these conditions.
Furthermore, the lowest normalised value (LNV) of IMEP provides an additional indication of the engine’s stability under different operating conditions. A low value of LNV indicates that the engine is not operating efficiently and is likely to suffer from instability, misfire or knocking [42,43]. The LNV values are found to be higher than 89% for all experimental cases except for λ < 1.5 and λ > 3.5, which is similar to the trend observed with the COV of the IMEP. These results suggest that an optimal air–fuel ratio range is crucial for achieving stable combustion with the hydrogen-fueled operation.

4.2. Engine Emissions

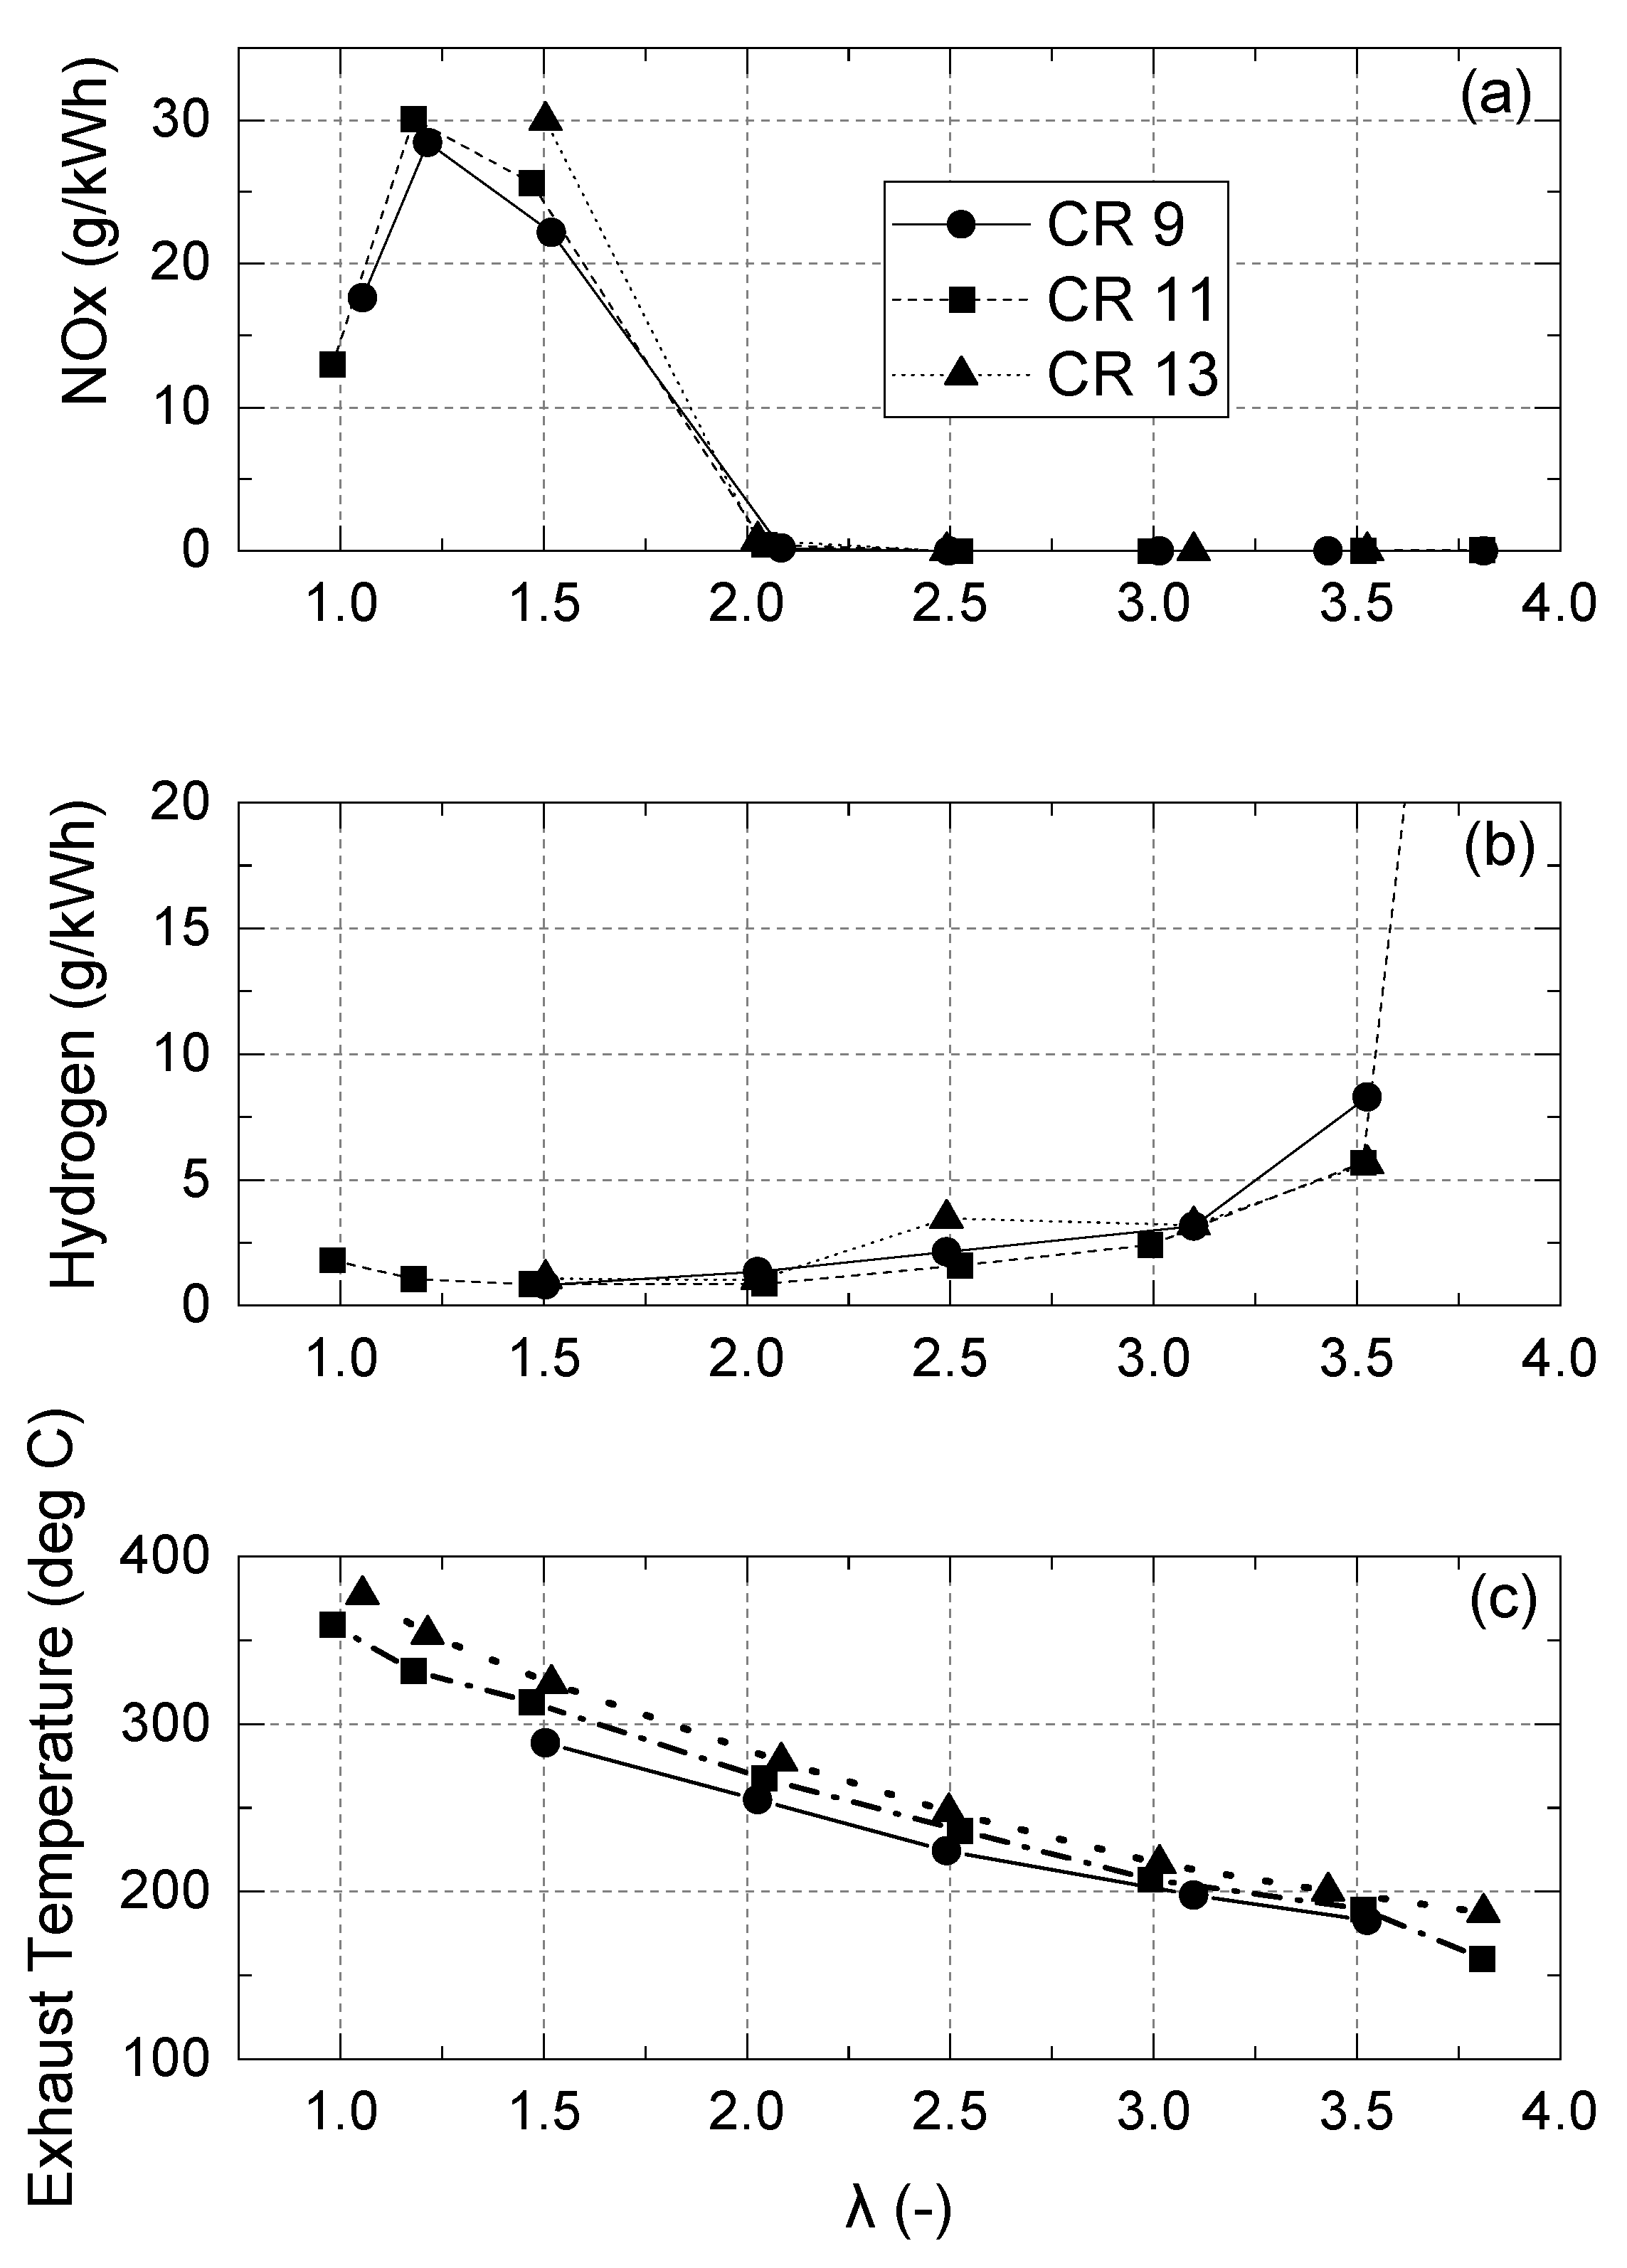
Figure 7a illustrates the engine-out NOx emissions, which primarily depend on the combustion temperature and oxygen concentration. Under very lean conditions at λ ≥ 2, NOx emissions are quite low and negligible due to reduced combustion temperatures. NOx emissions start to increase with λ < 2 and peak at λ = 1.2 due to the higher combustion temperature and high oxygen availability but drop with a further decrease in λ because of the lack of in-cylinder oxygen concentration.
Additionally, the use of an oxidation catalyst at λ = 1 can be considered to mitigate the impact of higher NOx emissions [44]. Incorporating this catalyst in the exhaust system of hydrogen engines operating at λ = 1 can help to effectively reduce NOx emissions and enhance the overall emission control performance.
Figure 7b presents unburned hydrogen emissions over a range of λs. As shown, unburned hydrogen emissions increase with a higher air–fuel ratio (i.e., λ > 3) due to incomplete combustion.
As shown in Figure 7c, for the λ ≥ 2 cases, the measured exhaust temperatures are below 300 °C, which is lower than the light-off temperature of a commonly used three-way catalyst (TWC) system in SI engines [45], and therefore can potentially impact its performance. However, under lean conditions, a hydrogen engine generally produces very low levels of NOx emissions. Furthermore, unburned hydrogen in the exhaust can act as a reducing agent in the catalytic converter, leading to high conversion efficiency, as reported by Verhelst et al. [46]. Hence, the combination of an oxidation catalyst near stoichiometry and the utilisation of unburned hydrogen as a reducing agent can effectively address emissions challenges and optimise the performance of hydrogen engines.
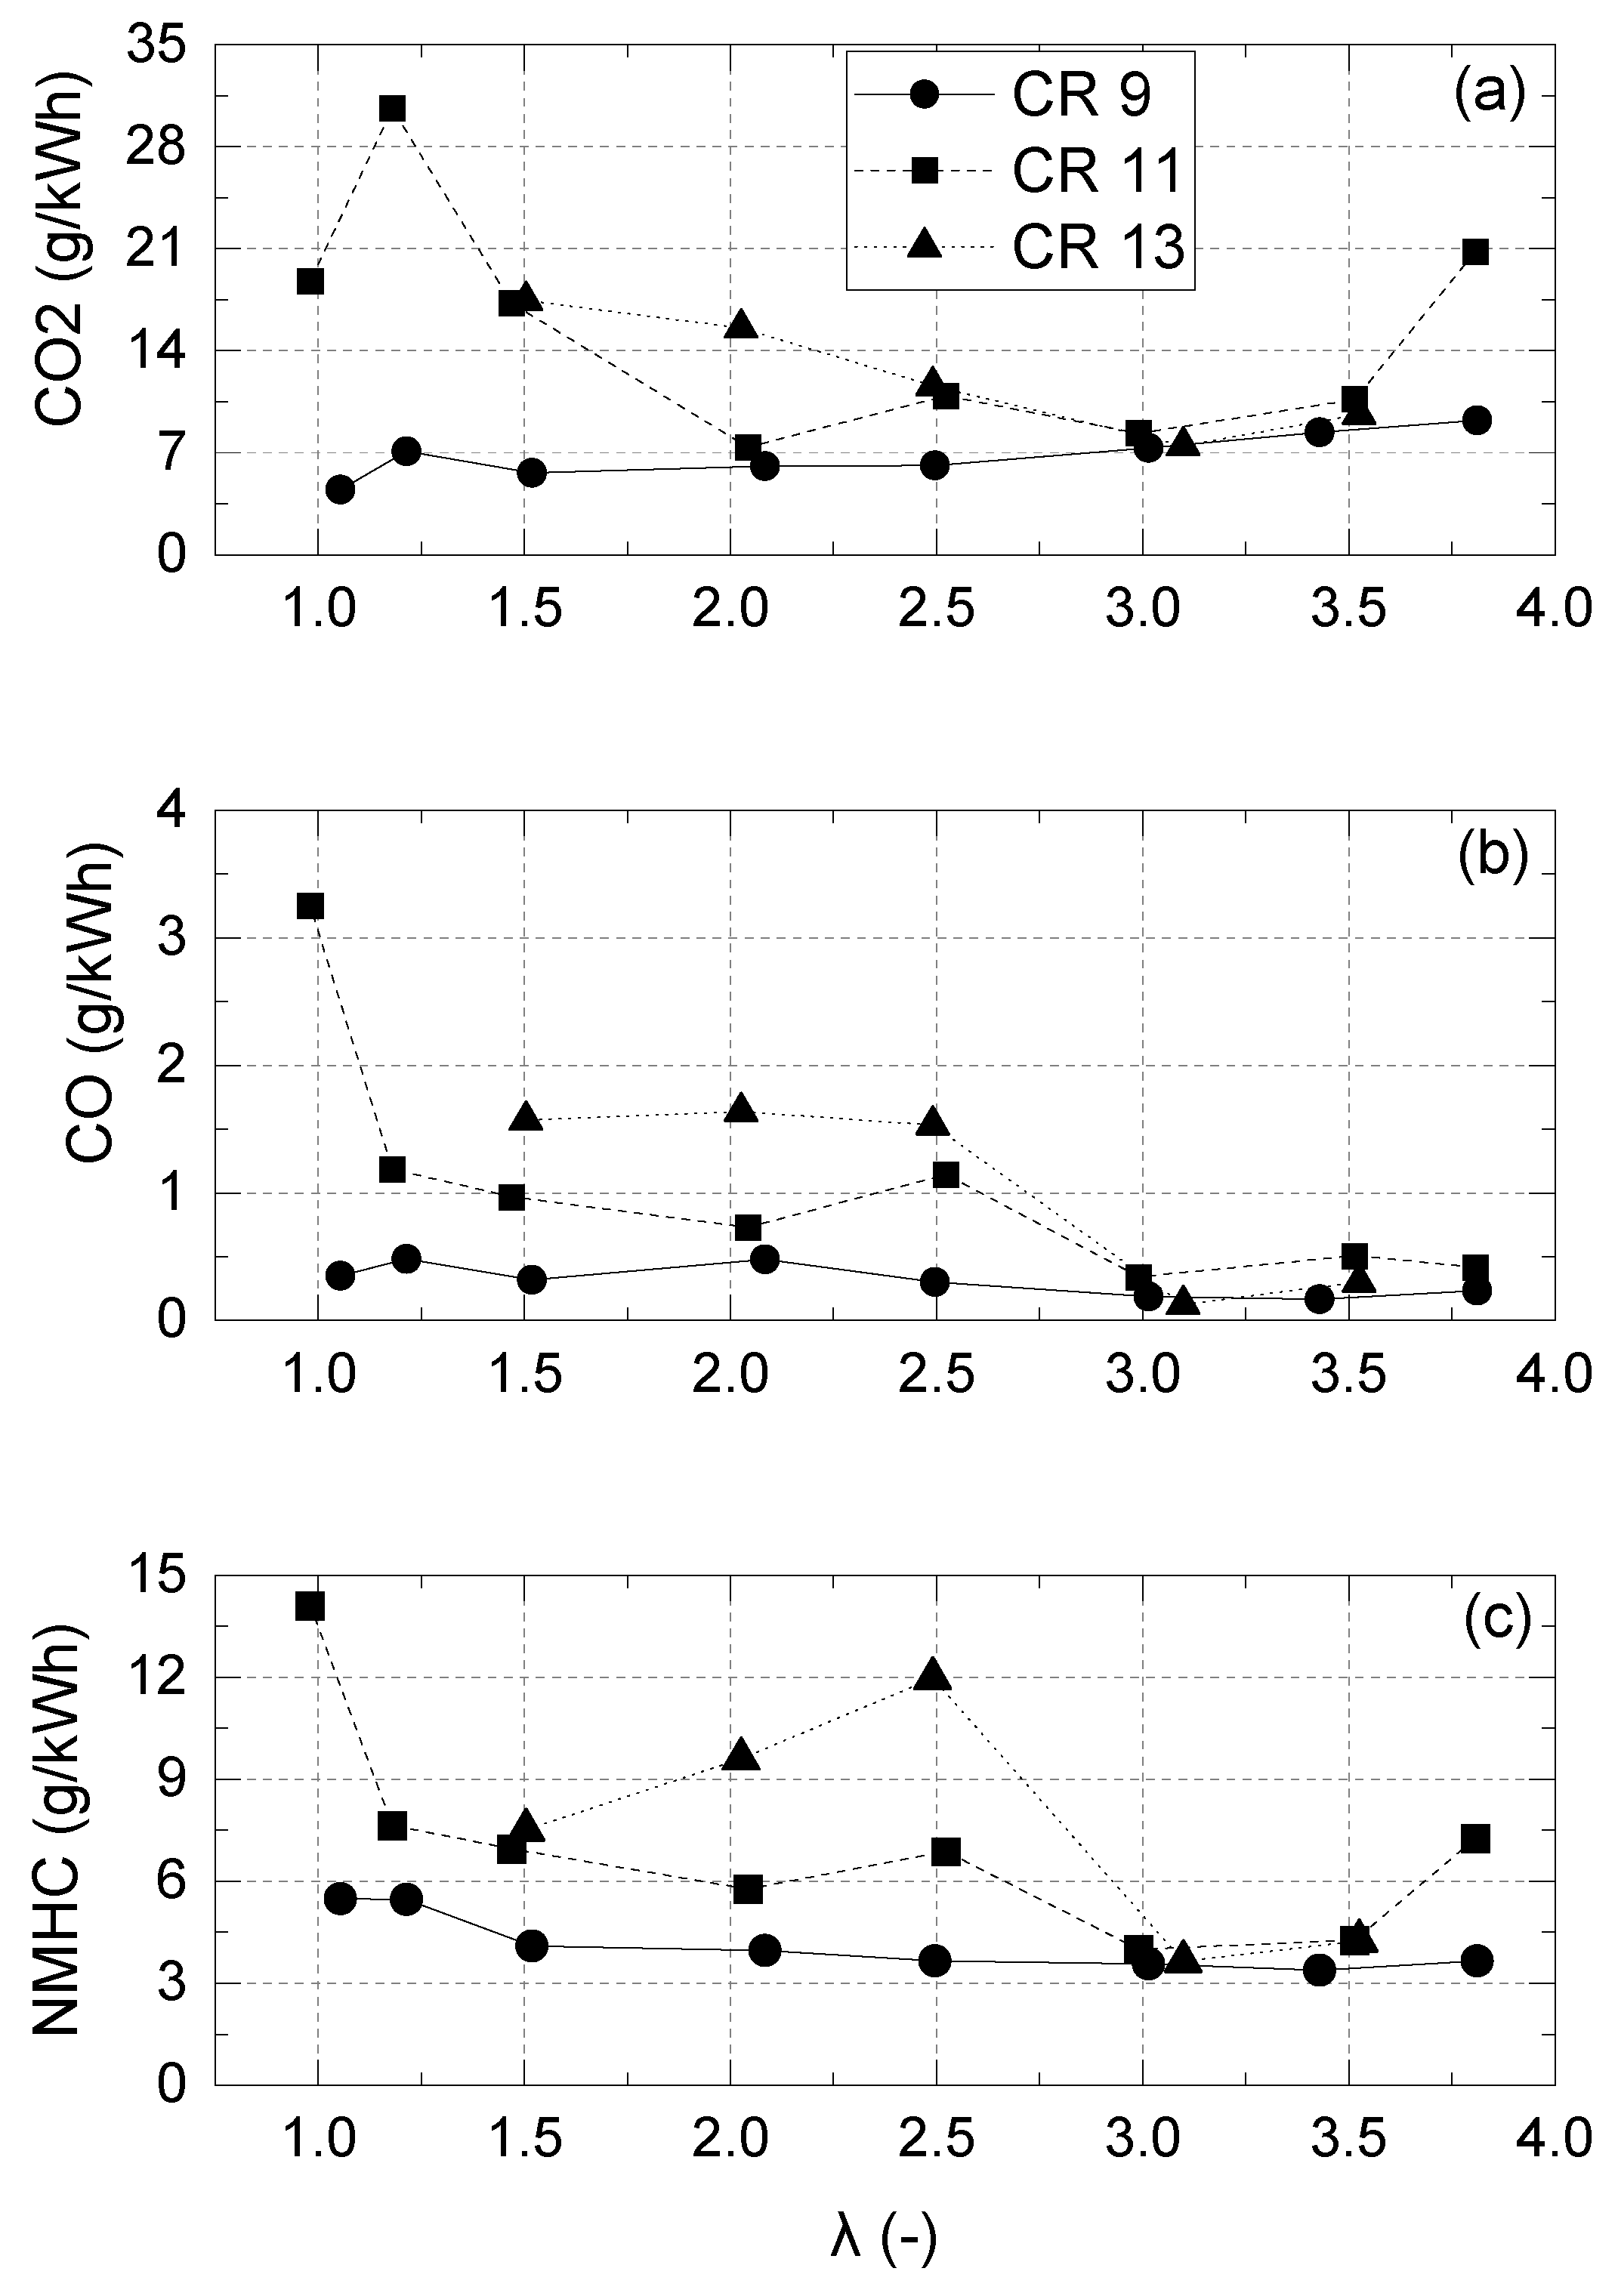
In a CFR engine, lubricating oil can also contribute to emissions of CO2, CO, and hydrocarbons (HC). As shown in Figure 8, this study finds that these emissions are in negligible amounts at λ ≥ 2 but start to increase within a λ range of 1 to 1.5. This is because, in this λ range, combustion temperatures are higher, which burns the lubricating oil and results in an increase in CO2 and HC emissions. Therefore, optimization of the air–fuel ratio to achieve an optimal lean burn operation can significantly reduce the emissions from hydrogen engines.
It should, however, be noted that the CFR engine was designed nearly 100 years ago and has very old piston ring pack and bore surface technology, completely unlike modern internal combustion engines. It would therefore be not unexpected that oil would find its way past the rings relatively easily compared to the current state-of-the-art technology, and this would explain the presence of any carbonaceous emissions in the exhaust gas beyond background CO2 emissions [47]. Since hydrogen combustion cannot give rise to these species, their concentration suggests that the ring pack of the CFR engine should be modified and modernised for dedicated hydrogen combustion investigations, and it is recommended that this be investigated. This is because, as more and more research work report emissions of CO, CO2, and H2, it is important that the levels of these not be misinterpreted by legislators as being of the level expected from a modern-technology hydrogen engine. It is contended that such a modern engine would, in fact, be expected to have very low levels of oil consumption and, thus, absolutely minimal concentrations of these species in its exhaust gas.

4.3. Combustion Characteristics

4.3.1. Combustion Characteristics

Figure 9 shows the result of the in-cylinder pressure data under a CR of 9, 11 and 13. As expected, with an increase in CR, the location of peak pressure moves closer to TDC and in-cylinder pressure increases. It was found that the in-cylinder pressure increased with an increasing CR and decreasing air–fuel ratio. At CR 13, the engine’s operation with H2 is limited to λ = 1.5 to avoid any engine damage, as very high-pressure oscillations are observed with a λ < 1.5.
The high-octane rating of hydrogen with a research octane number (RON) > 120 makes it favourable for use in high CR engines. However, under stoichiometric conditions, the RON of hydrogen is 93.7, as reported in [13]. Therefore, knock via high-frequency pressure oscillations can occur at low air–fuel ratio mixtures due to the rapid combustion rate of hydrogen, as indicated in Figure 10. At CR 9, the engine can operate at stoichiometric conditions without knocking. However, with a further increase in the compression ratio, the normal operation limit of a rich air–fuel ratio is limited, as knocking combustion starts to occur at λ values of 1.2 and 1.5 for the compression ratios of 11 and 13, respectively.
Figure 11 presents the MAPO and ignition timing results under various λ conditions for the three tested CRs. In this study, a borderline limit for the knocking condition is found at around a MAPO of 0.1 bar. For all tested CRs with a λ < 2, the MAPO is above 0.1 bar, indicating knocking combustion. However, normal H2 combustion is observed for λ ≥ 2 cases, as the MAPO values are lower than 0.1 bar.
Ignition timing is very sensitive when controlling hydrogen combustion phasing due to the high flame speed of the hydrogen–air mixture. When the mixture becomes richer with λ < 1.5, the ignition timing has to be retarded after top dead center to maintain the MBT conditions, as shown in Figure 11, due to the high reactivity of hydrogen. This suggests that special considerations are required in designing the H2 engine when compared to other conventional fueled SI engines, particularly near the rich stoichiometric air–fuel ratio conditions.
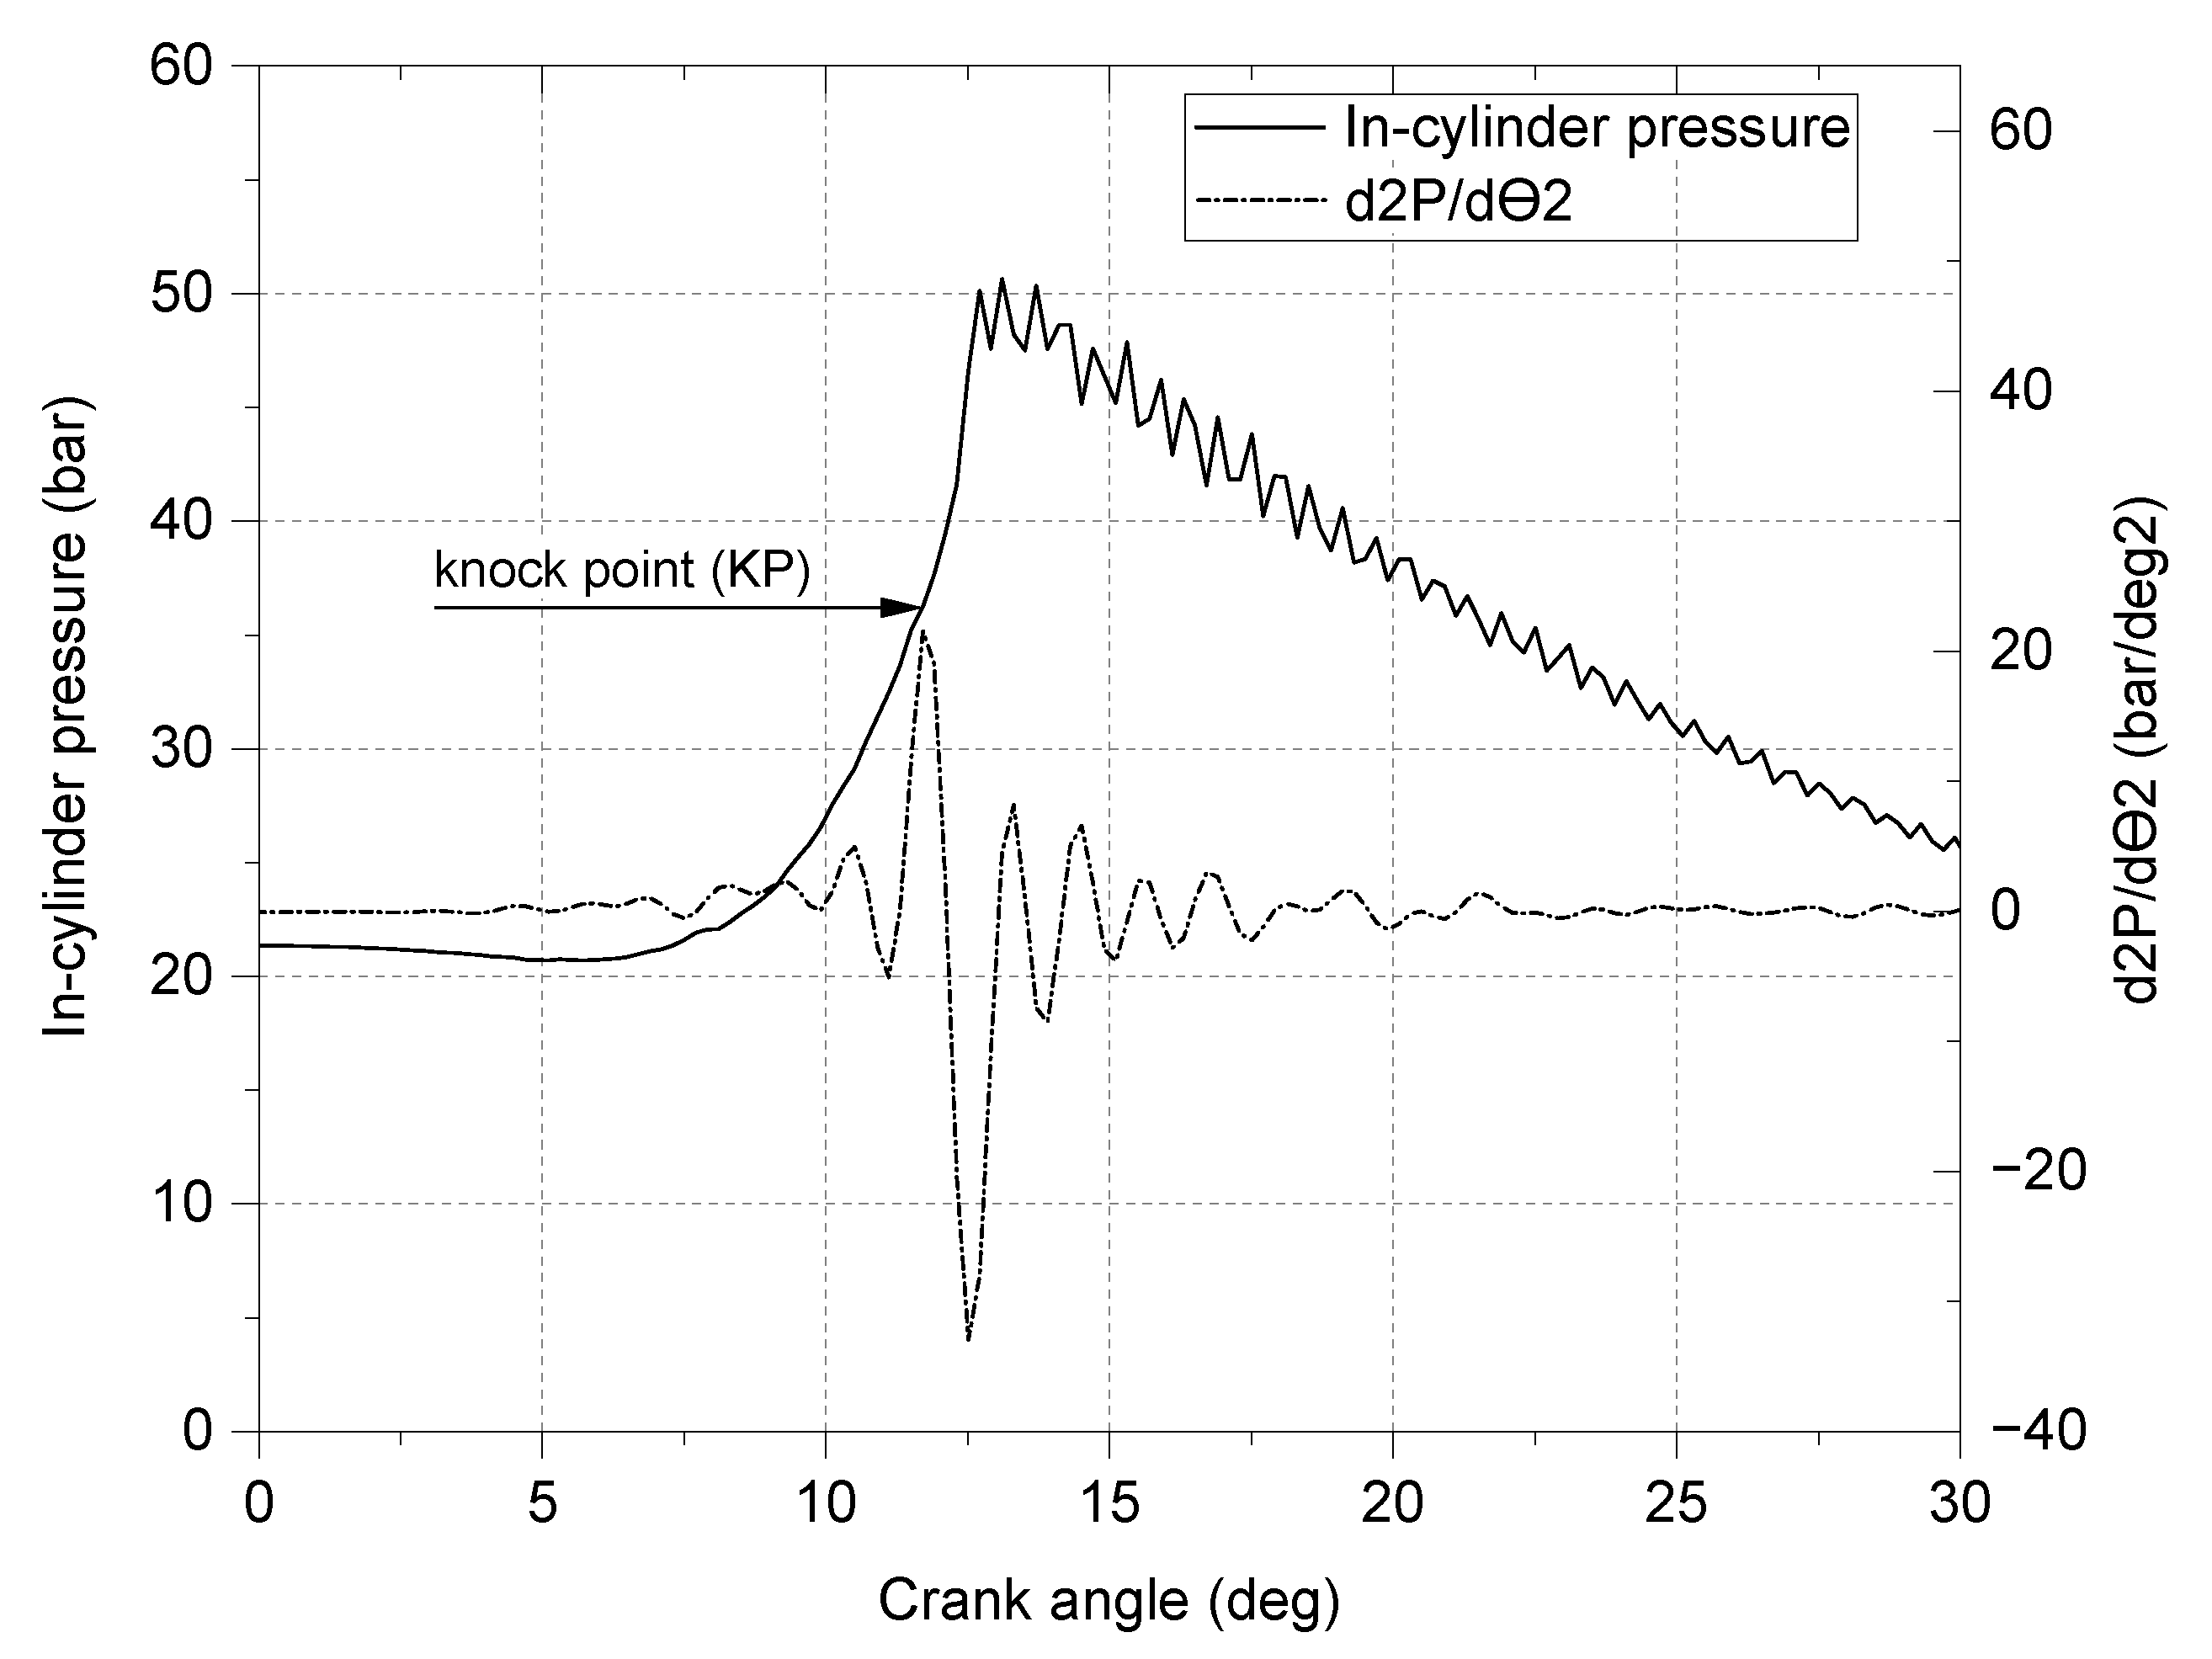
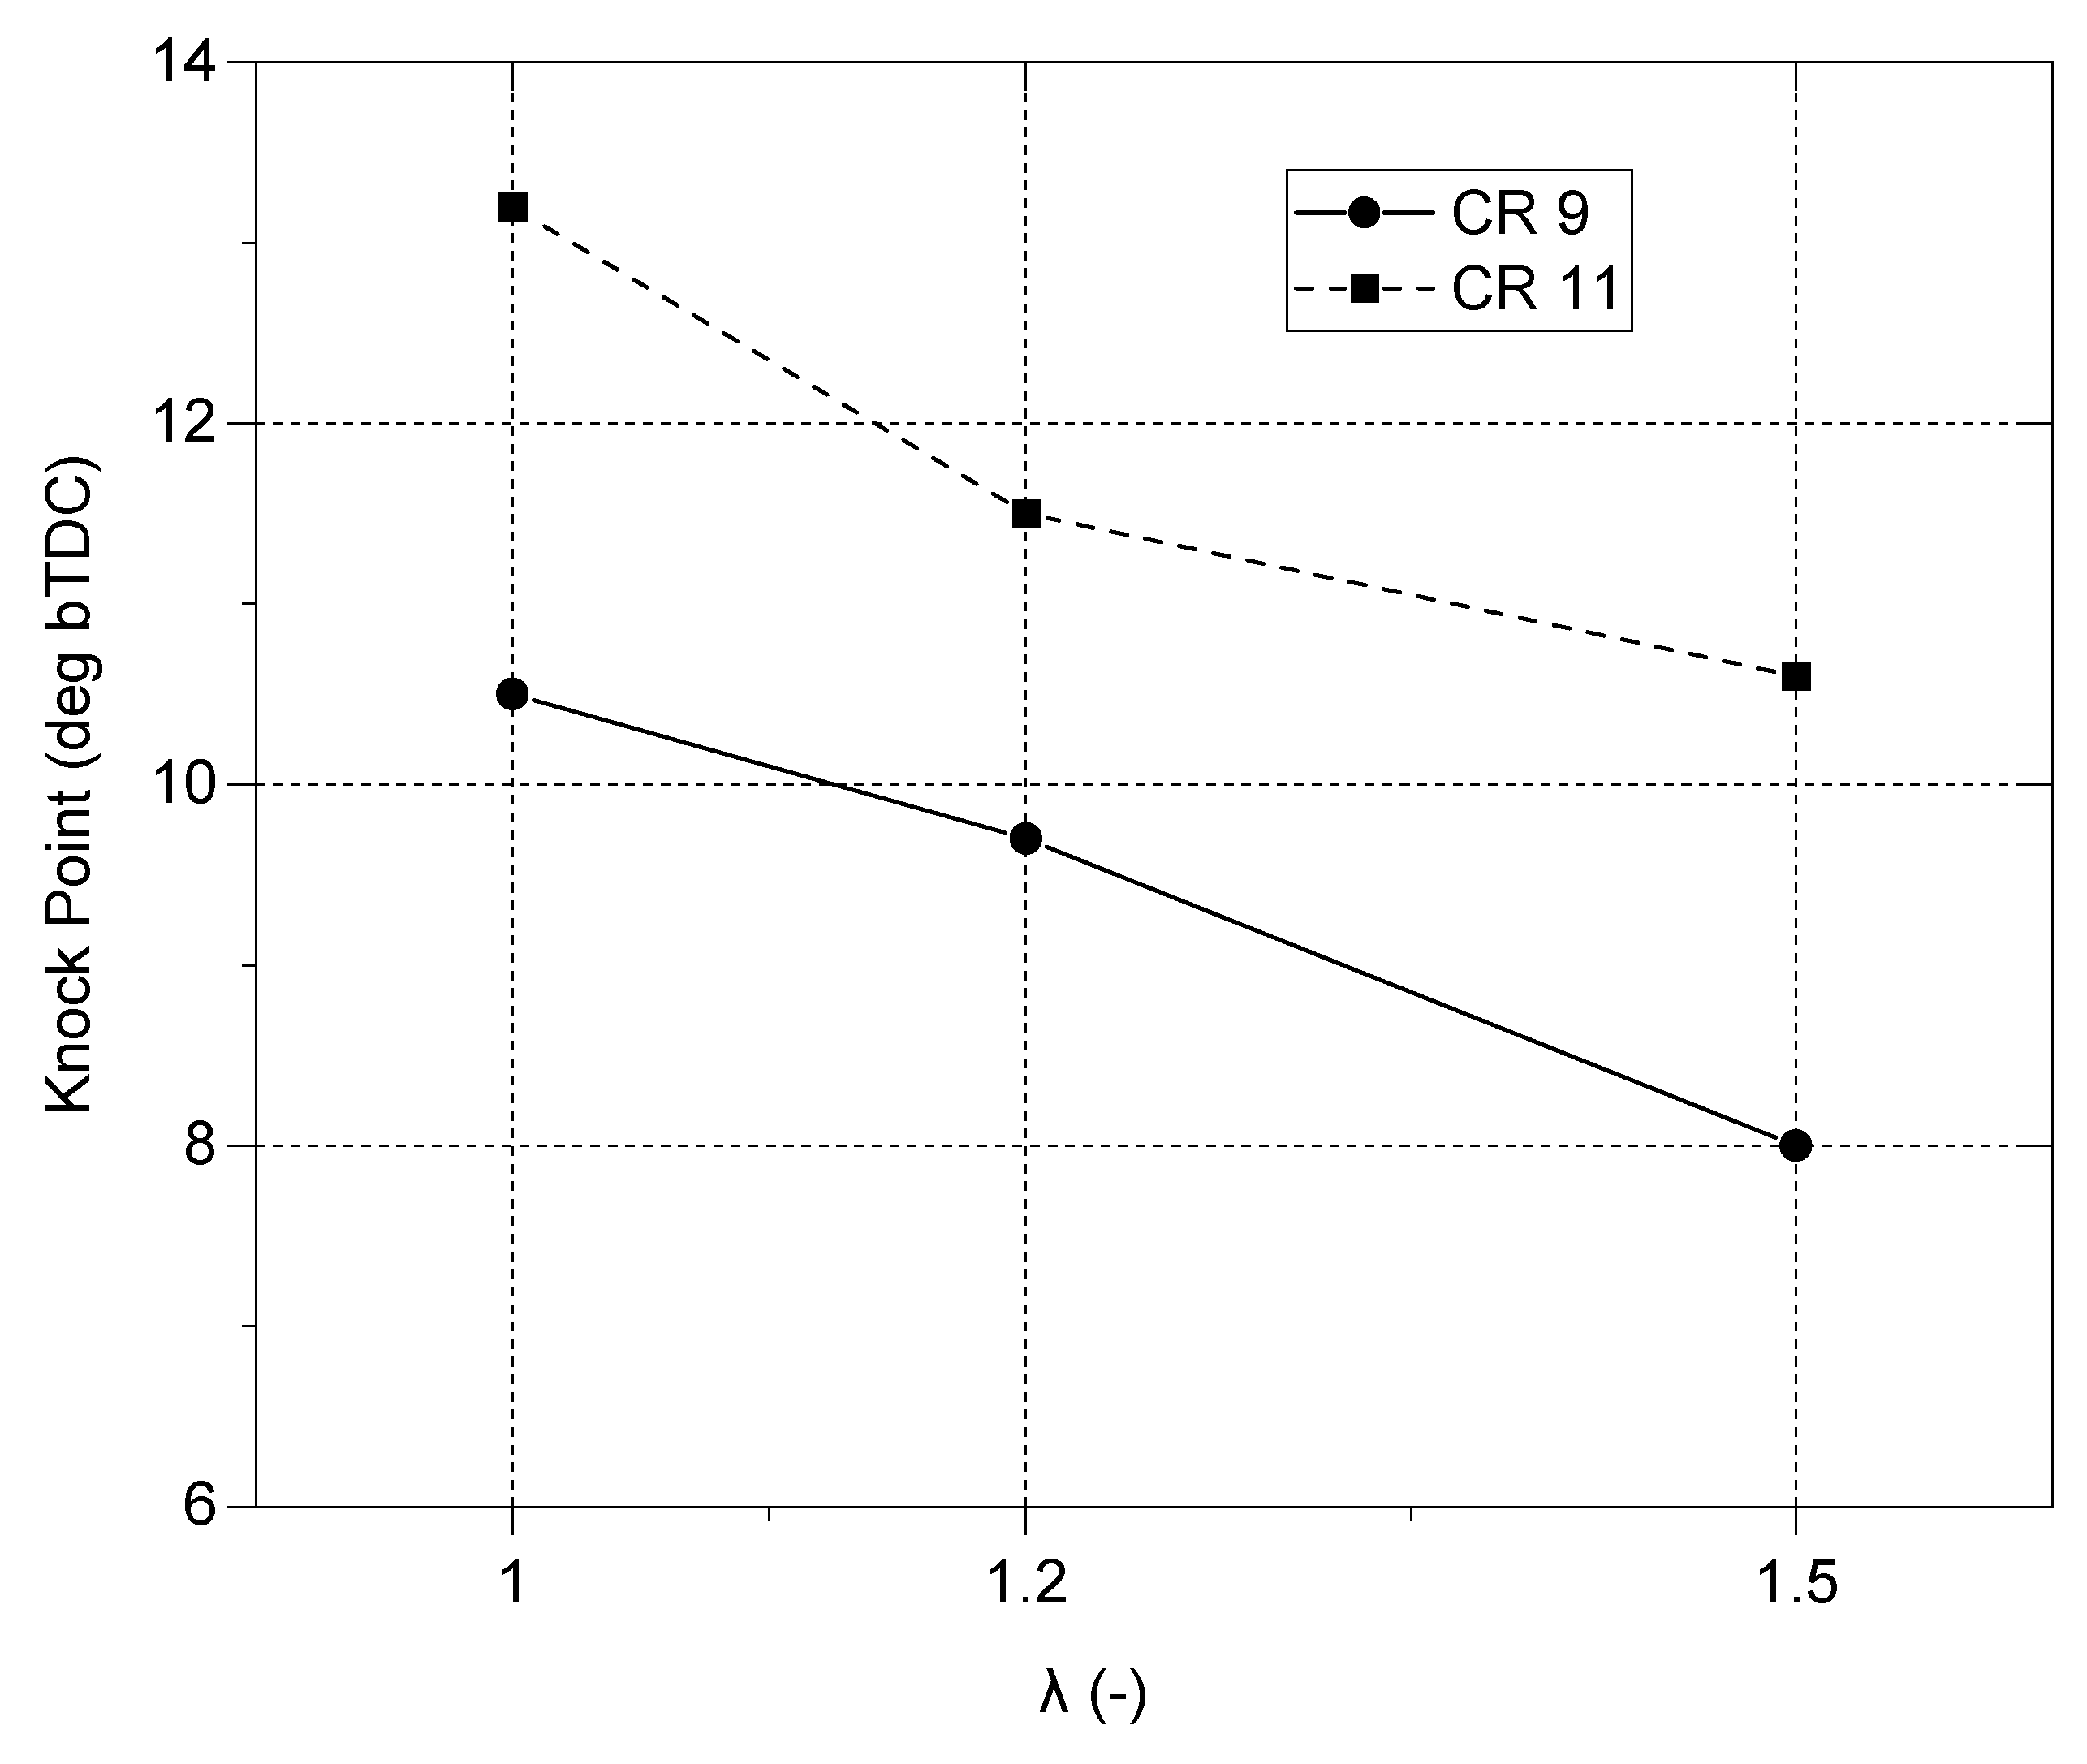
Knock point (KP) is one of the important parameters that determine the limit of maximum achievable performance of an ICE. KP is determined from a single, representative cycle from the 300 cycles recorded, and it is the location where the maximum of the second derivative of the pressure trace was reached. An example of selected cycle in-cylinder pressure data with the corresponding knock point is presented in Figure 12. This study found that the KP of a hydrogen-fueled operation is advanced by approximately 2 CAD when the engine’s CR increased from 9 to 11, as shown in Figure 13, which supports the pressure oscillation results shown in Figure 13. Additionally, the results indicate that decreasing the air–fuel ratio of the mixture results in an advance in the KP, with the KP shifting from 10.3 at λ = 1.5 to 13.1 CAD bTDC at λ = 1 for a compression ratio of 11, which indicates an increasing knock tendency with a decreasing air–fuel ratio.

4.3.2. Simulation Results—Reactivity of Hydrogen

The hydrogen–air mixture reactivity and its impact on the combustion processes will be evaluated in this section, with a particular emphasis on the occurrence of end-gas autoignition. This aspect can result in engine damage and decreased overall efficiency.
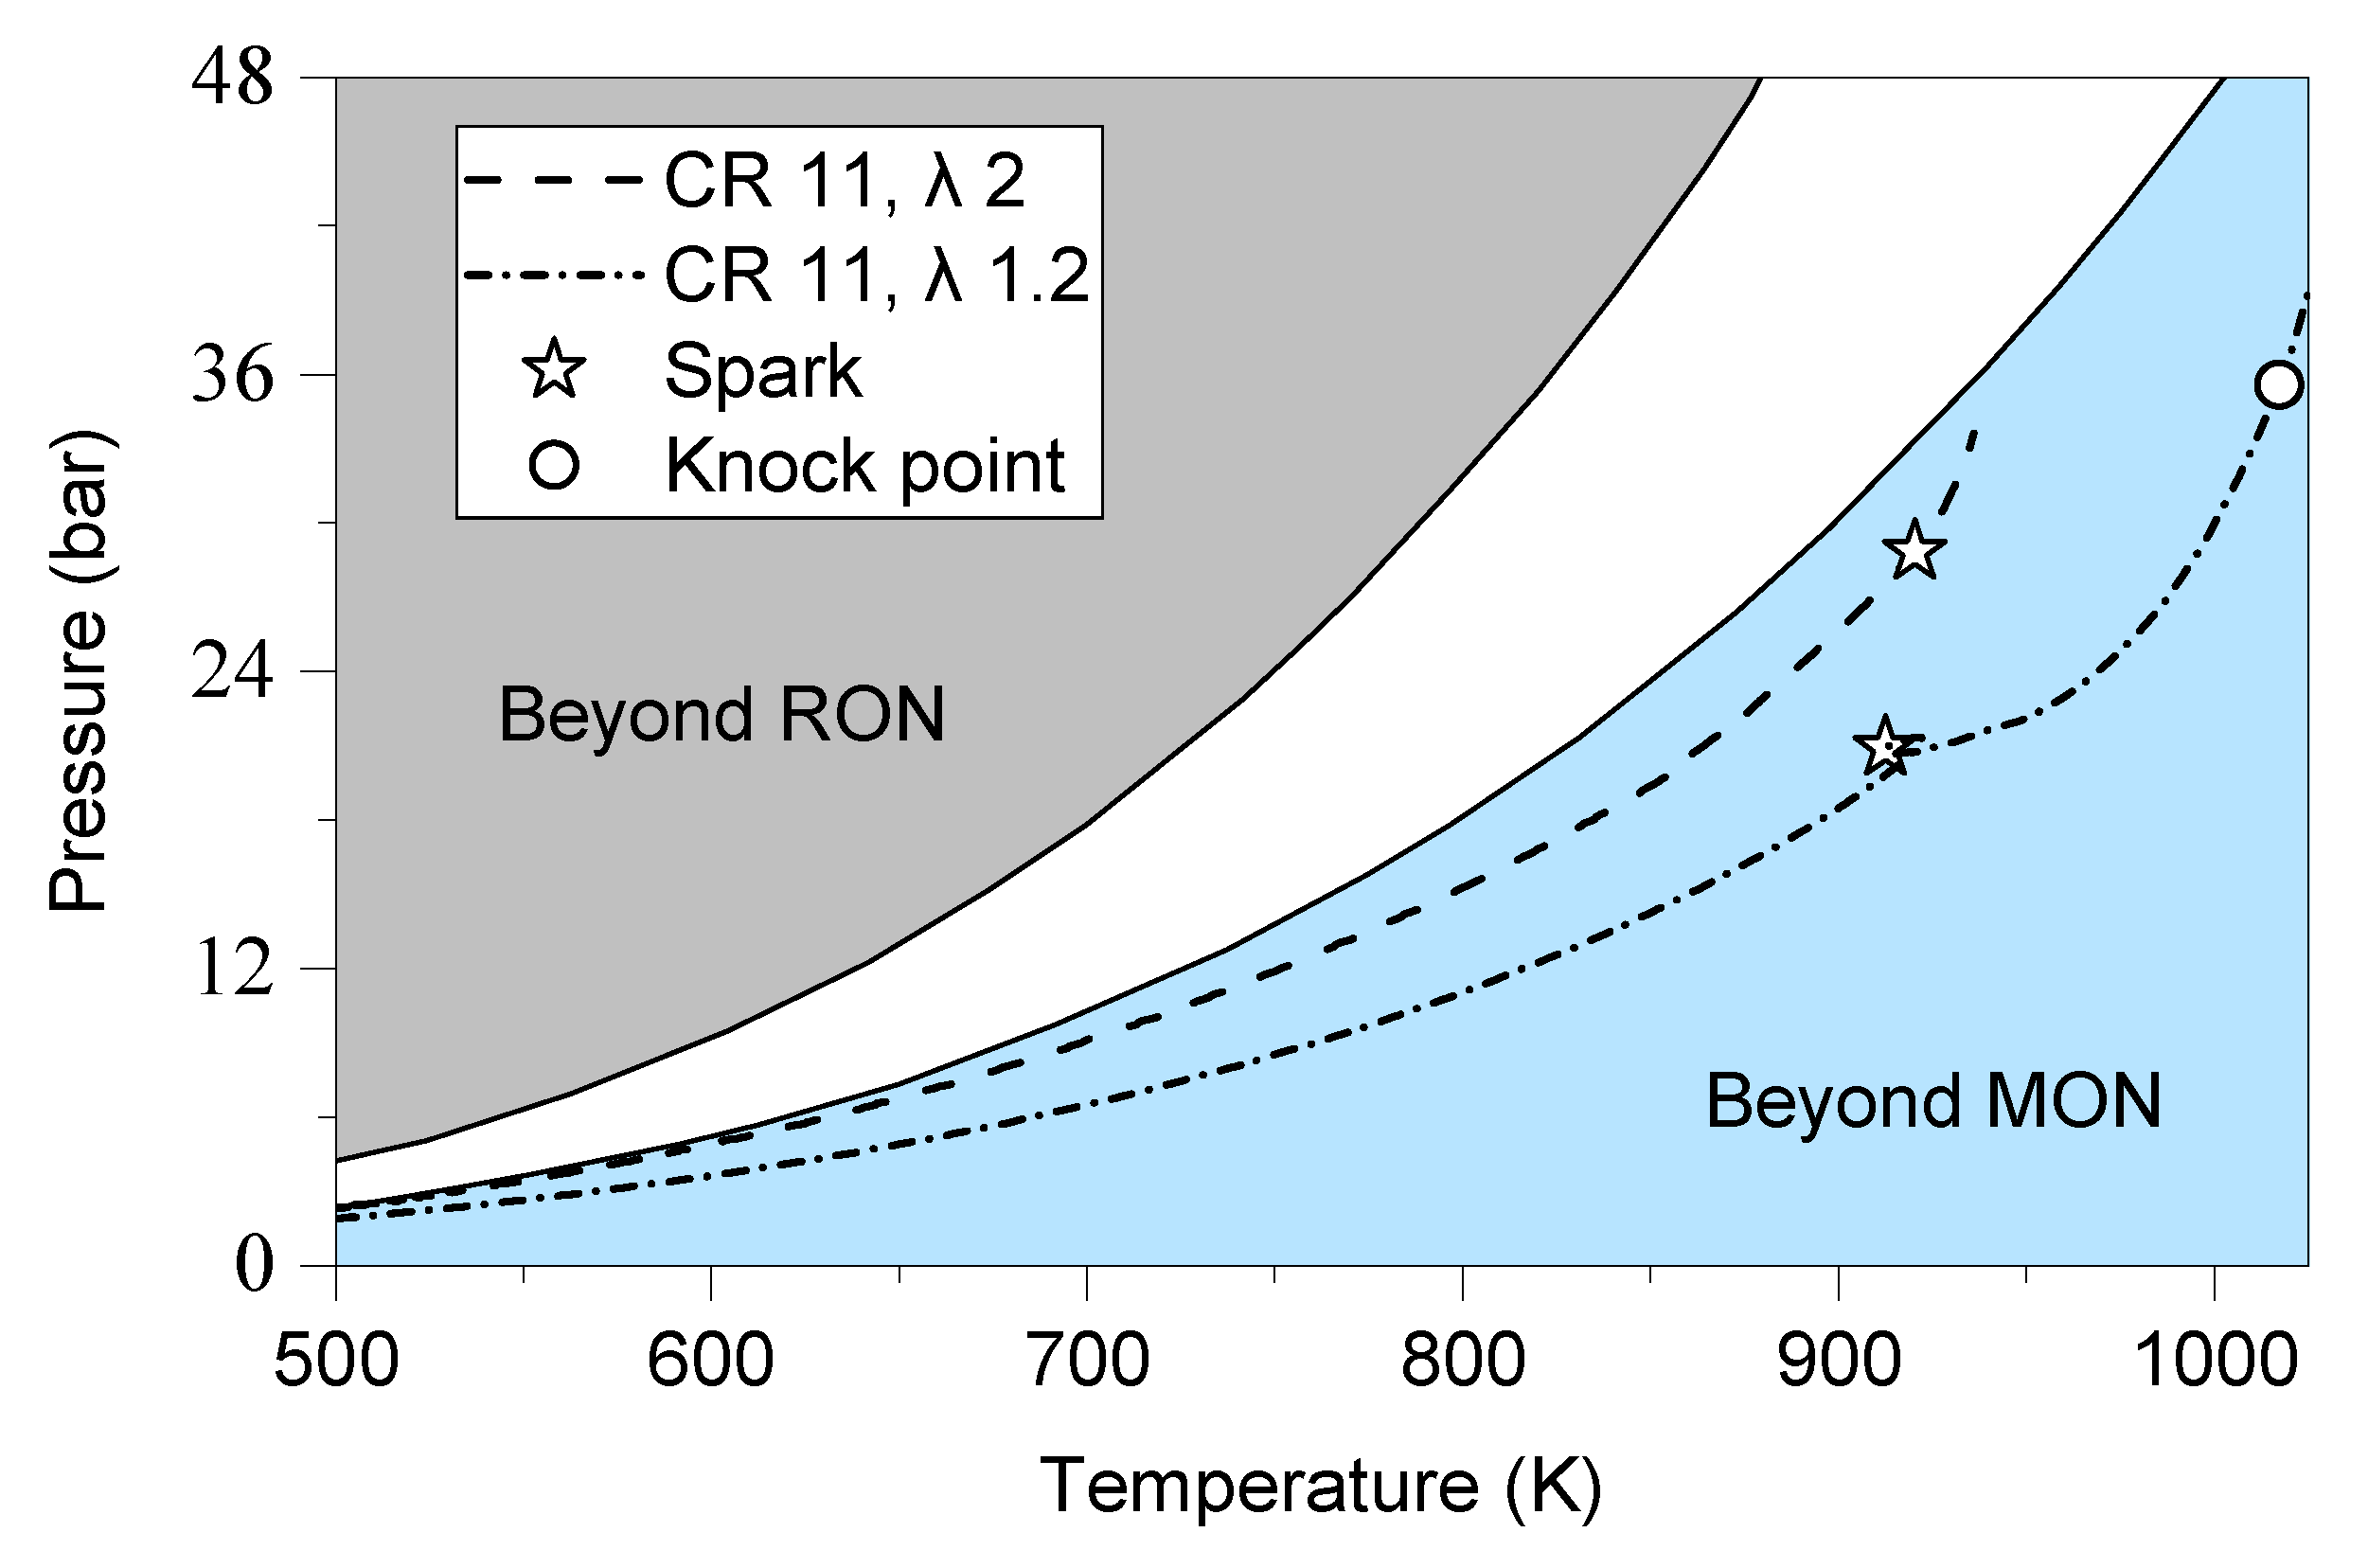
Figure 14 illustrates the pressure–temperature (P–T) trajectories derived from the in-cylinder pressure and unburned gas temperatures obtained from the non-predictive TPA model for hydrogen at CR 11. The highlighted regions in the figure represent the RON and MON regions typically employed for gasoline fuel [48], encompassing a wide range of engine operating conditions for hydrogen within the pressure–temperature domain. Notably, the P–T paths of hydrogen at λ = 2 and 1.2 are displayed in the ‘Beyond MON’ region, indicating higher temperatures compared to the RON trajectory at the same pressure conditions.
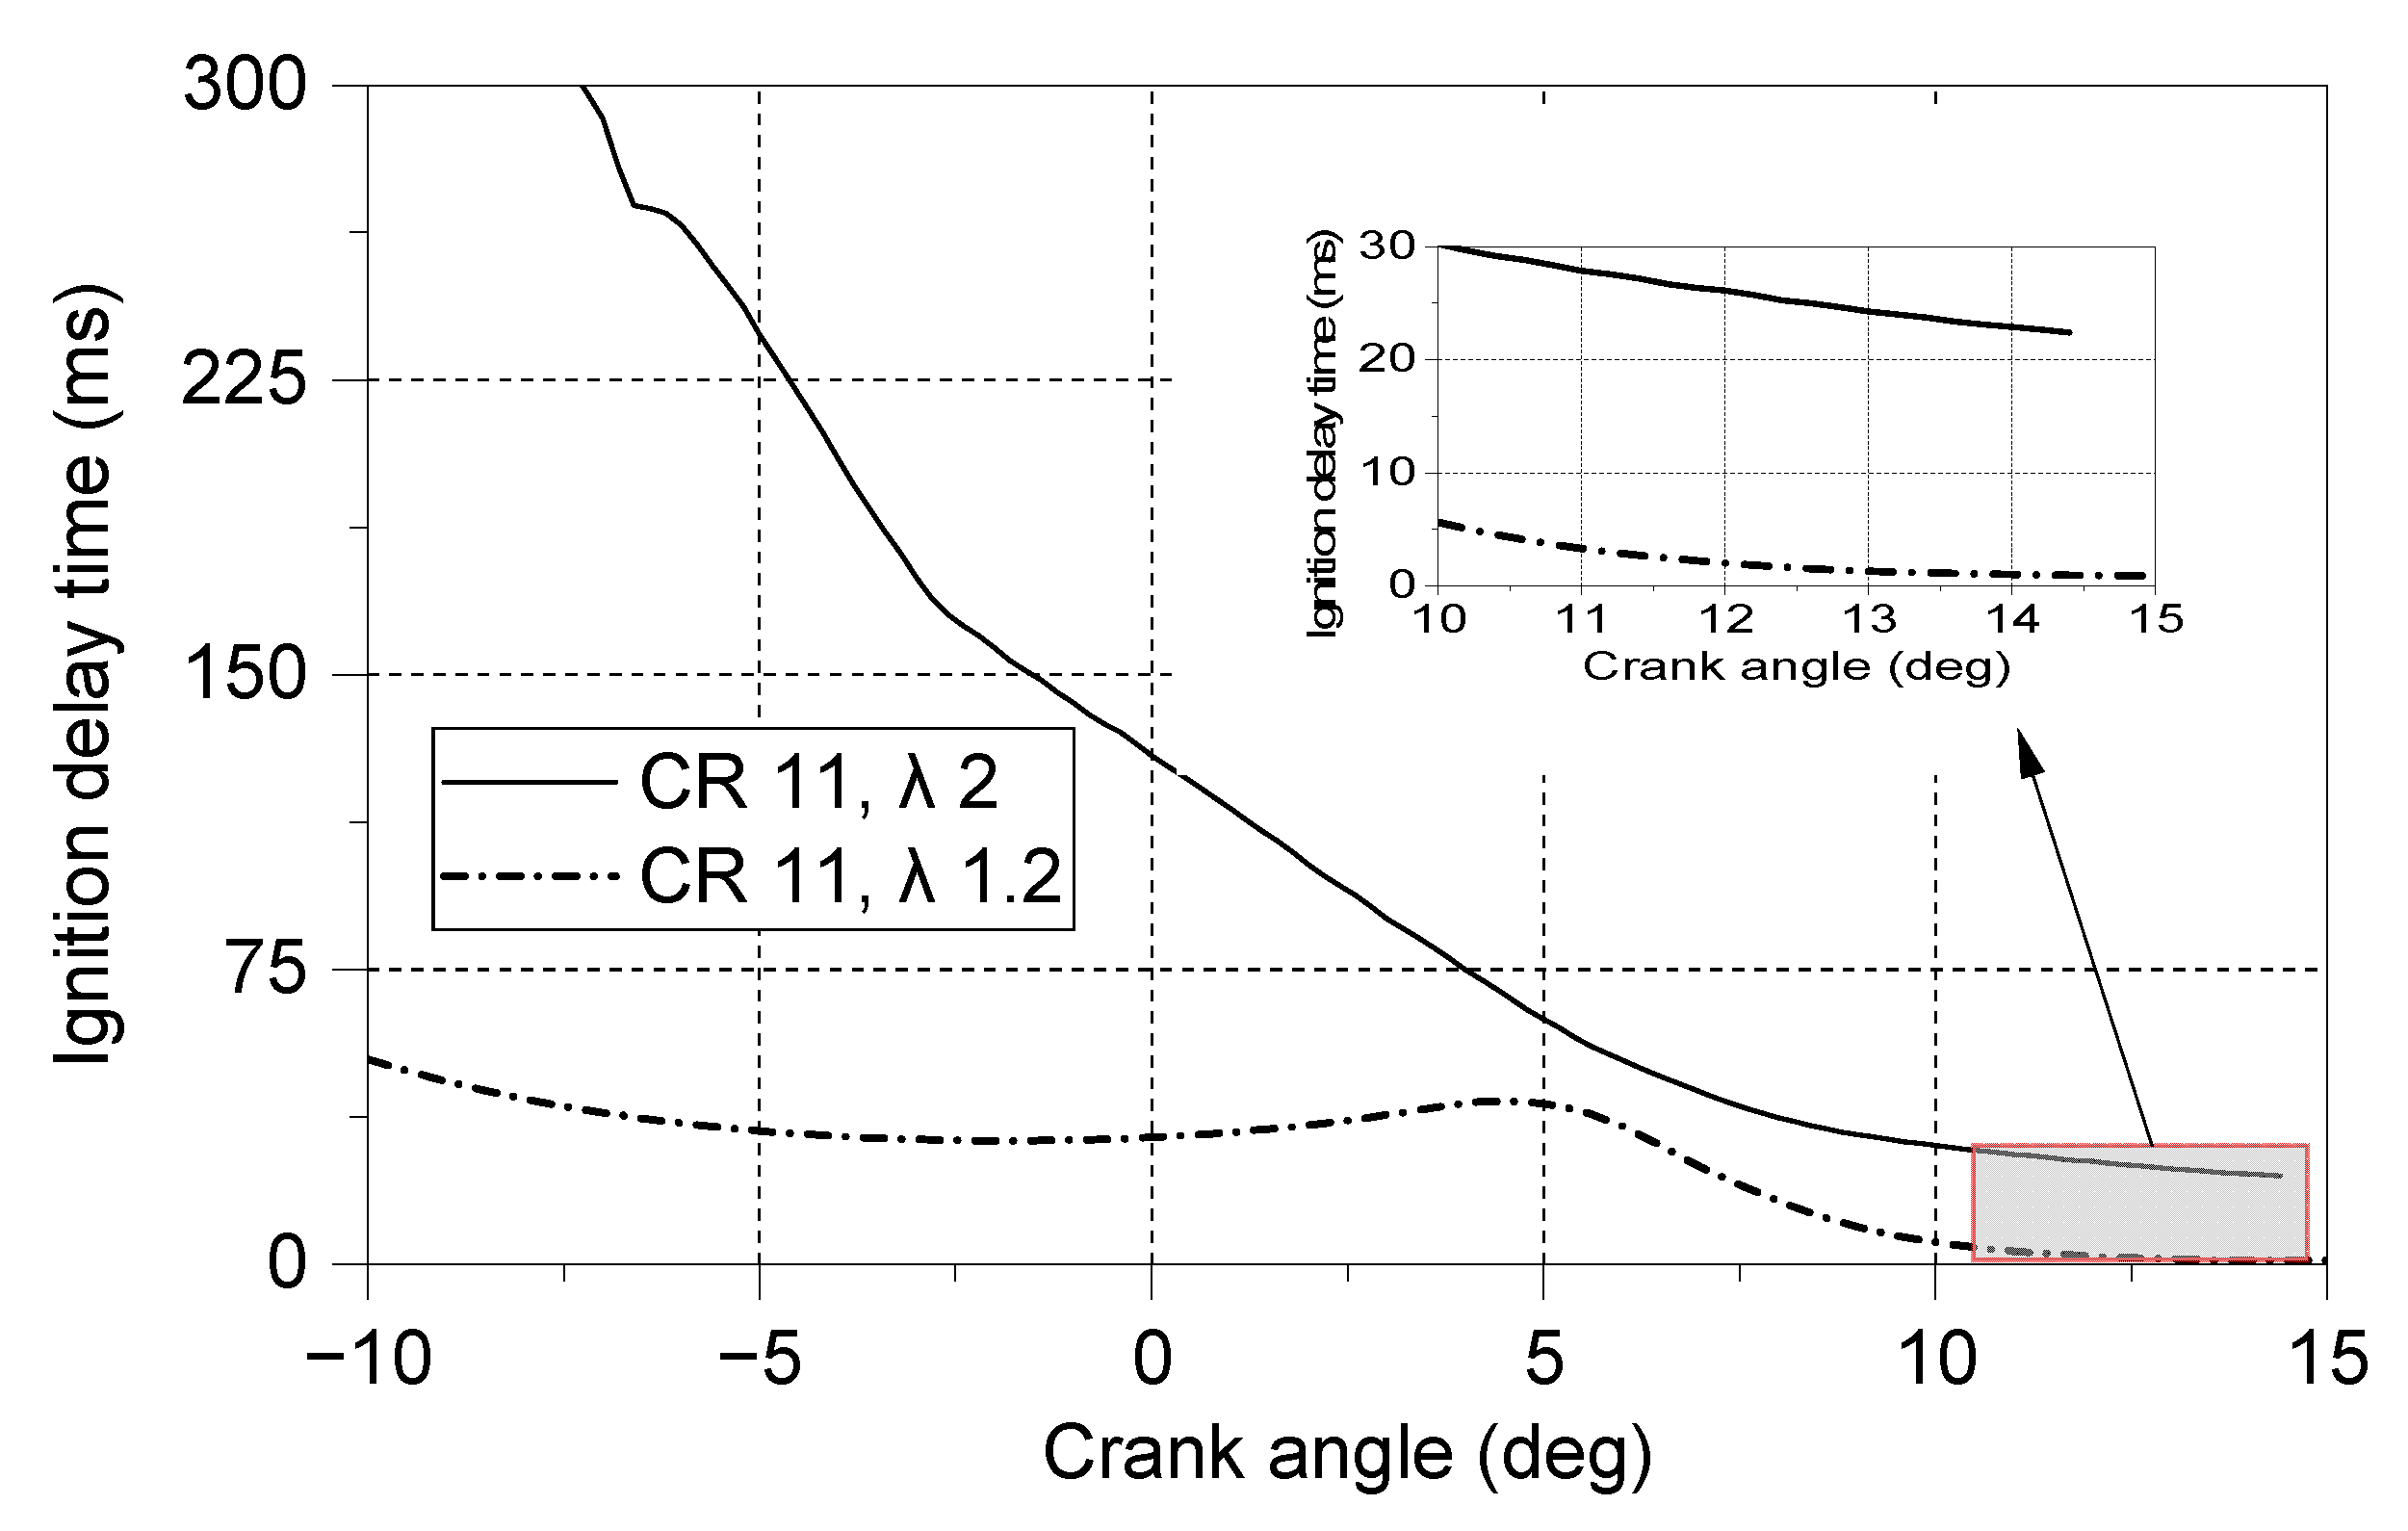
Ignition delay time (IDT) is a key parameter affecting the combustion process in hydrogen engines [36]. Figure 15 shows the results of the ignition delay time of hydrogen combustion at CR 11 for λ = 1.2 and 2. As the temperature and pressure increase, the IDT generally decreases rapidly due to increased reaction rates. However, hydrogen engines exhibit a unique IDT behaviour without any negative temperature coefficient behaviour [49]. As shown, the IDT in hydrogen engines increases with an increasing air–fuel ratio. For example, the simulated IDT for λ = 1.2 is 5.5 ms compared to 30 ms with λ = 2 for the P–T conditions at 10 CAD aTDC. This is because the IDT is directly related to the unburned gas temperature, and a higher cylinder gas temperature at λ = 1.2 prompts a shorter ignition delay. A shorter IDT at λ = 1.2 indicates a higher mixture reactivity and potential for faster end-gas autoignition before the flame front consumes the unburned mixture, resulting in knocking combustion. Therefore, utilisation of a lean air–fuel mixture to increase the IDT via lower mixture reactivity and combustion temperatures can help to prevent knock and improve engine performance.
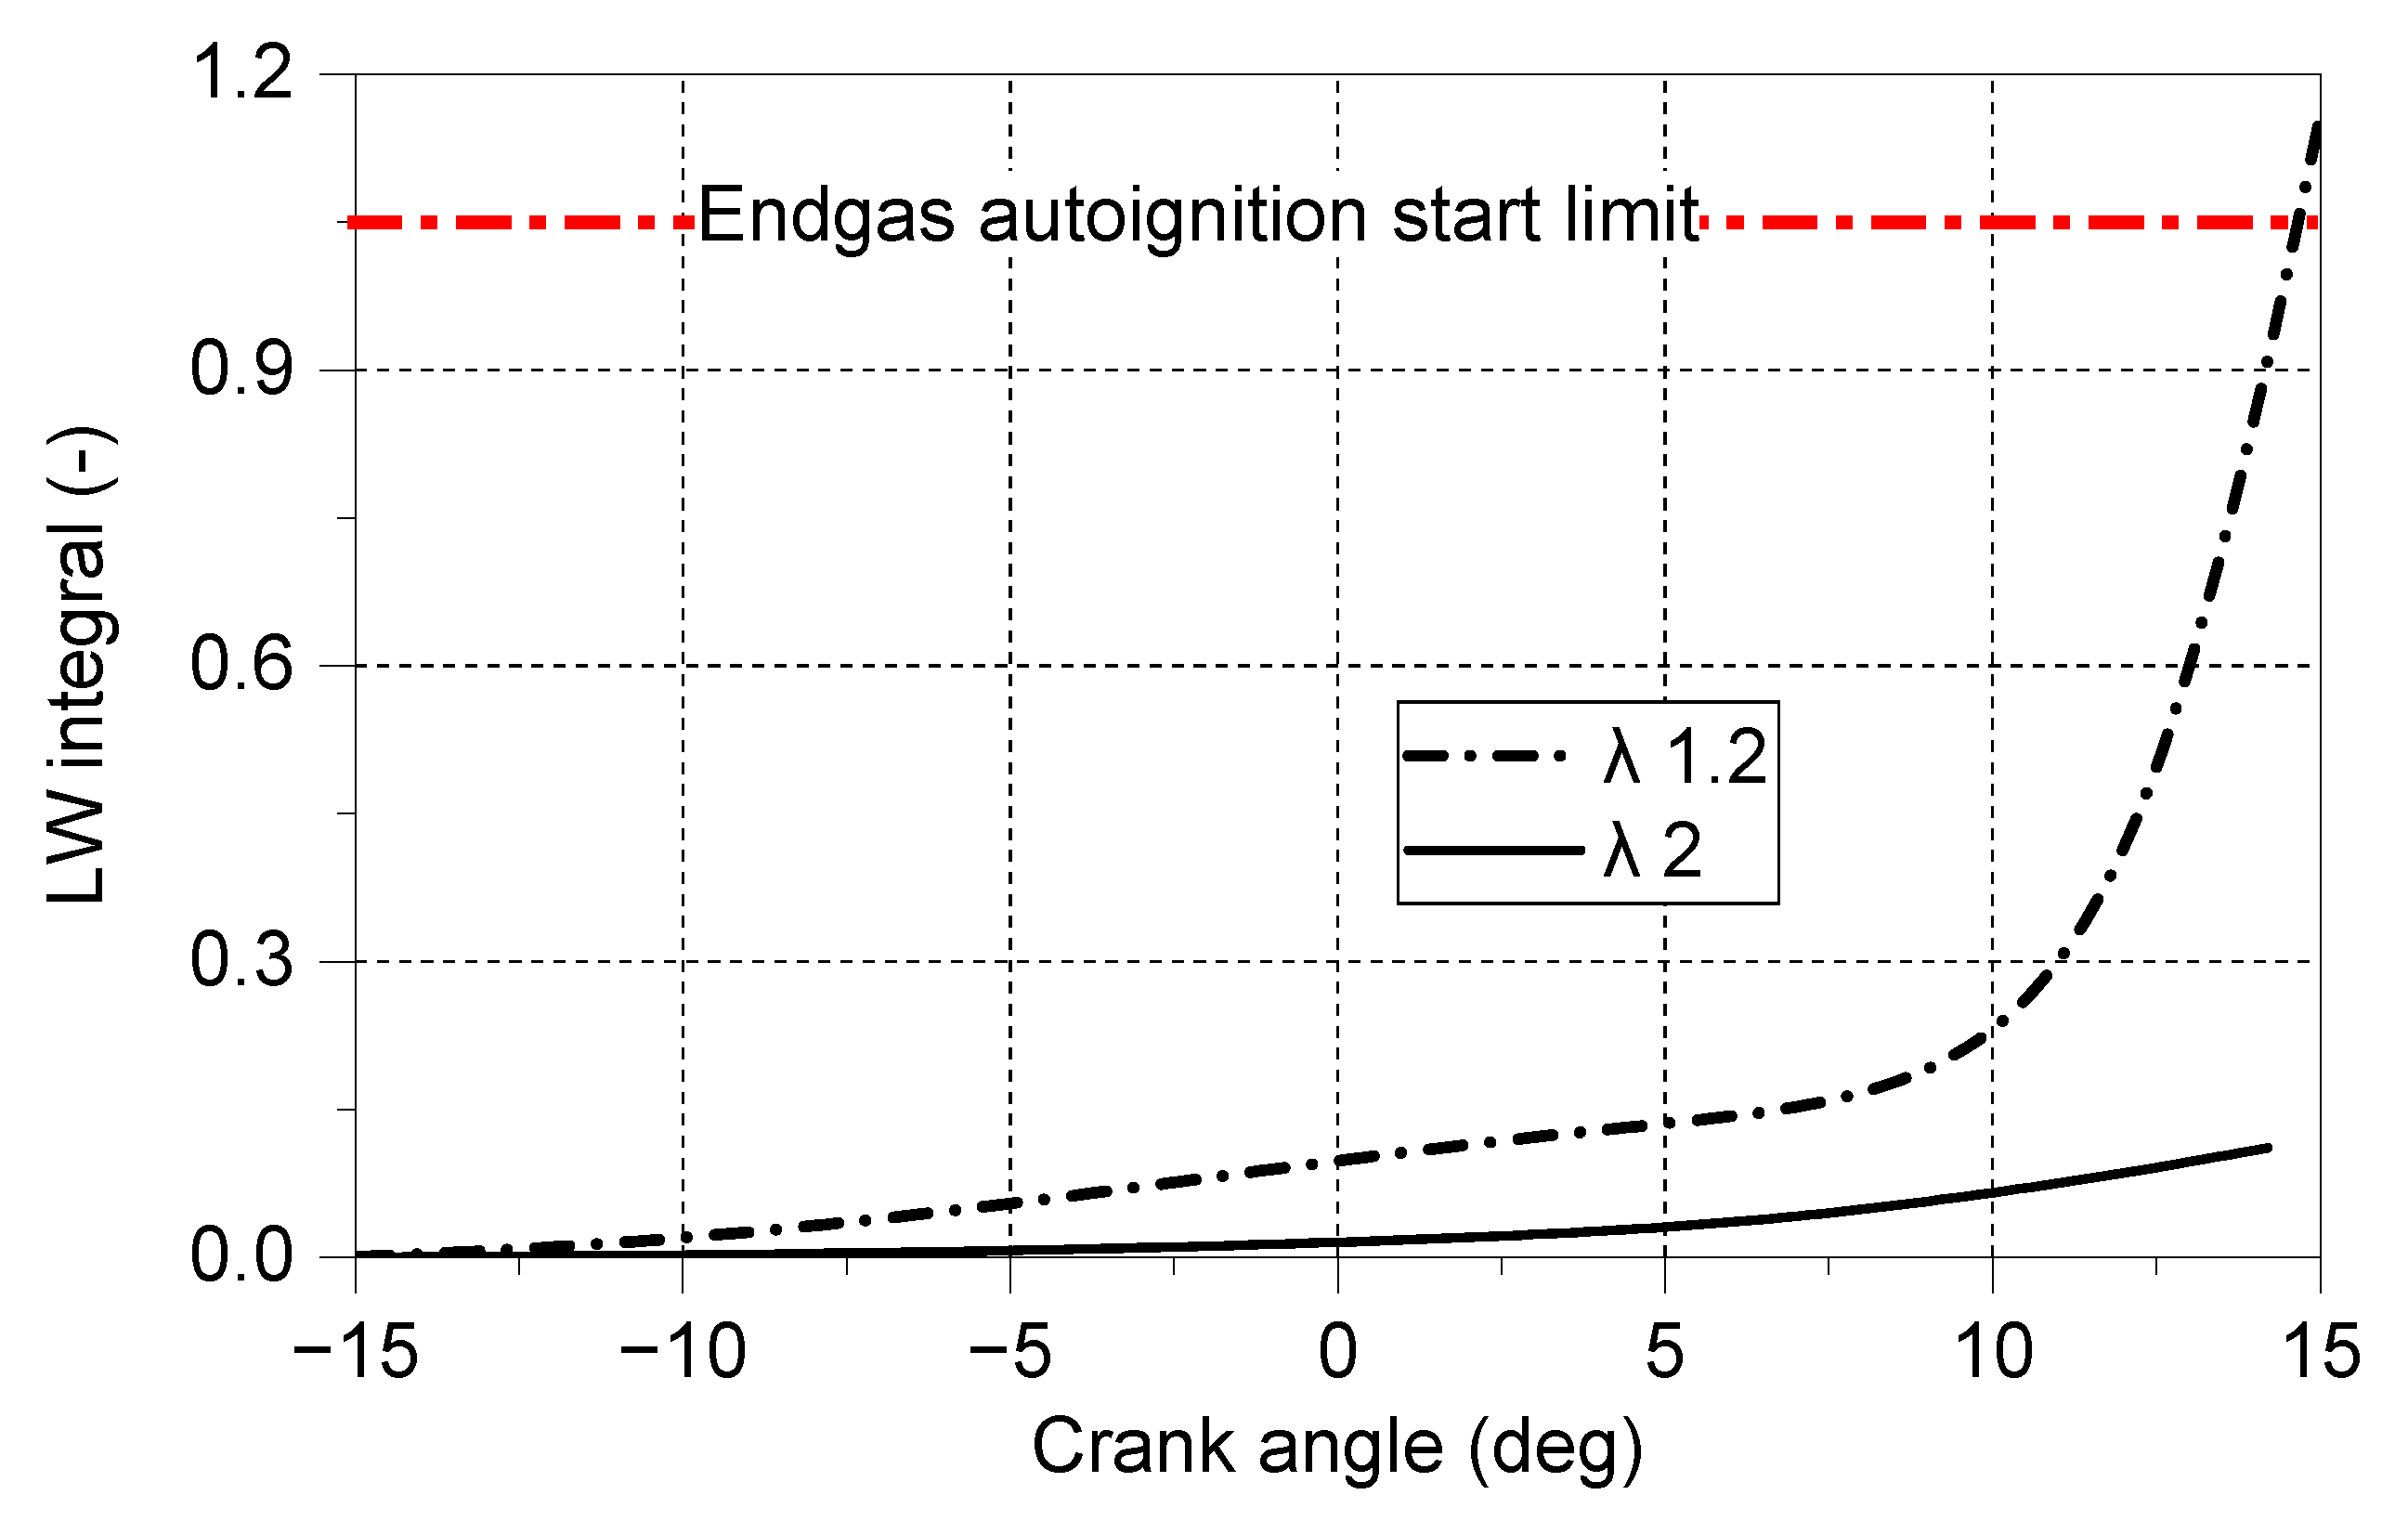
The LW integral is a valuable tool for assessing the risk of knock in ICEs. Figure 16 shows the calculated LW results for hydrogen-fueled operation based on the simulated ignition delays corresponding to the pressure–temperature trajectories at λ = 1.2 and 2 at CR 11. According to the LW integral approach, the prone to autoignition of end-gas in SI engines occurs when the integral value equals unity. As shown in Figure 16, at λ = 1.2, the LW integral value for hydrogen combustion reaches unity, suggesting a potential for end-gas autoignition. However, it is unlikely to have end-gas autoignition in the λ = 2 case, as the LW integral does not reach unity. These results are consistent with the experimental results presented in Figure 9b.
The LW integral can be used to optimise engine performance and prevent knock. By adjusting parameters, such as the air–fuel ratio and ignition timing, the LW integral can be kept below one, reducing the likelihood of knock occurring during the combustion process. This information is valuable in the design and optimisation of hydrogen engines, where the high reactivity of hydrogen can pose a challenge in controlling the onset of end-gas autoignition.

5. Conclusions

This paper presents the experimental and numerical outcomes of a CFR engine utilising hydrogen fuel and SI technology. This study investigates the impact of varying air–fuel ratios on engine performance, emissions, and combustion characteristics at different compression ratios. The key findings of this research can be summarised as follows:
  • Increasing the compression ratio of hydrogen engines results in an increase in the peak pressure and advancement in the knock point. However, it also leads to an increase in thermal efficiency, indicating the trade-off between performance and knock propensity.
  • The air–fuel ratio (λ) has a significant impact on the performance and emissions of a hydrogen ICE. The results at λ = 2 demonstrated the highest thermal efficiency and low emissions of NOx, CO, and UHC but had a relatively low power output. In contrast, a higher power output but lower thermal efficiency, along with higher emissions, were observed at λ = 1.2.
  • Based on the combustion analysis, hydrogen-fueled operation demonstrated normal combustion with the λ ≥ 2 cases but knocking combustion with the λ < 2 cases, irrespective of the tested compression ratios.
  • The LW integral approach was used to assess the likelihood of knock, and the results indicated both normal and knocking combustion possibilities, similar to what was observed in the experimental investigations. The knock-free stable combustion from the lean stable operation has limits of up to a λ of 3. However, a significant increase in end-gas autoignition was observed, with a further decrease in λ for all tested CRs.
Overall, the findings of this study suggest that hydrogen has the potential to be a viable alternative fuel for spark-ignition engines, provided that the combustion process is well-controlled to prevent end-gas autoignition. The results highlight the importance of carefully balancing the compression ratio and air–fuel ratio in order to optimise engine performance while minimising emissions and avoiding knock. For example, it was observed that maintaining a lambda value of 2 resulted in the highest efficiency and lowest emissions. Further research is needed to fully understand the complex combustion processes, such as the direct injection of hydrogen in spark-ignition engines. Additionally, the development of effective control strategies to mitigate knock and end-gas autoignition is crucial.

Author Contributions

Conceptualization, D.N. and T.K.; methodology, D.N.; software, D.N.; validation, J.W.G.T.; formal analysis, T.K.; investigation, J.W.G.T.; resources, J.W.G.T.; data curation, D.N.; writing—original draft preparation, D.N.; writing—review and editing, T.K. and J.W.G.T.; visualization, D.N. and T.K.; supervision, J.W.G.T.; project administration, J.W.G.T.; funding acquisition, J.W.G.T. All authors have read and agreed to the published version of the manuscript.

Funding

This research received no external funding.

Data Availability Statement

Raw data can be provided by the corresponding and first author (D.N.) upon reasonable request.

Acknowledgments

The authors would like to thank Riyad Jambi, Adrian Ichim, and Christopher E. Motter for their valuable contributions to the safety control and modification of the test cell. This work was performed at the Clean Combustion Research Center of King Abdullah University of Science and Technology under the Center Competitive Fund framework.

Conflicts of Interest

The authors declare no conflict of interest.

Abbreviations

aTDCAfter top dead center
bTDCBefore top dead center
CADCrank angle degree
CFRCooperative fuel research
COVCoefficient of variation
CRCompression ratio
DIDirect injection
HCHydrocarbons
ICEInternal combustion engines
IDTIgnition delay time
IMEPIndicated mean effective pressure
ITEIndicated thermal efficiency
KPKnock point
LNVLowest normalized value
LWLivengood–Wu
MAPManifold absolute pressure
MAPOMaximum amplitude of high-frequency pressure oscillation
PFIPort-fuel injection
SISpark ignition
TDCTop dead center
TPAThree pressure analysis
TWCThree-way catalyst

References

  1. Ritchie, H.; Roser, M.; Rosado, P. CO2 and Greenhouse Gas Emissions. Our World Data. 2020. Available online: https://ourworldindata.org/co2-and-greenhouse-gas-emissions (accessed on 4 July 2023).
  2. Senecal, K.; Leach, F. Racing Toward Zero: The Untold Story of Driving Green; SAE International: Warrendale, PA, USA, 2021. [Google Scholar]
  3. Bae, C.; Kim, J. Alternative fuels for internal combustion engines. Proc. Combust. Inst. 2017, 36, 3389–3413. [Google Scholar] [CrossRef]
  4. Turner, J.W.G.; Leach, F.C.P. 3-Using alternative and renewable liquid fuels to improve the environmental performance of internal combustion engines: Key challenges and blending technologies. In Alternative Fuels and Advanced Vehicle Technologies for Improved Environmental Performance, 2nd ed.; Folkson, R., Sapsford, S., Eds.; Woodhead Publishing: Soston, UK, 2022; pp. 57–92. [Google Scholar]
  5. Husted, H.; Karl, G.; Schilling, S.; Weber, C. Direct injection of CNG for driving performance with low CO2. In Proceedings of the 23rd Aachen Colloquium Automobile and Engine Technology, Aachen, Germany, 6–8 October 2014; pp. 829–850. [Google Scholar]
  6. Rengarajan, S.; Liu, Z.; Lerin, C.; Stetter, J.; Narang, V.; Lana, C. LPG Direct Injection Engine for Medium Duty Trucks; Technical Paper 2020-07-5008; SAE: Warrendale, PA, USA, 2020; pp. 1–10. [Google Scholar] [CrossRef]
  7. Verhelst, S.; Wallner, T. Hydrogen-fueled internal combustion engines. Prog. Energy Combust. Sci. 2009, 35, 490–527. [Google Scholar] [CrossRef] [Green Version]
  8. Verhelst, S.; Turner, J.W.G.; Sileghem, L.; Vancoillie, J. Methanol as a fuel for internal combustion engines. Prog. Energy Combust. Sci. 2019, 70, 43–88. [Google Scholar] [CrossRef] [Green Version]
  9. Sopena, C.; Diéguez, P.M.; Sáinz, D.; Urroz, J.C.; Guelbenzu, E.; Gandía, L.M. Conversion of a commercial spark ignition engine to run on hydrogen: Performance comparison using hydrogen and gasoline. Int. J. Hydrog. Energy 2010, 35, 1420–1429. [Google Scholar] [CrossRef]
  10. Sun, D.; Liu, F. Research on the Performance and Emission of a Port Fuel Injection Hydrogen Internal Combustion Engine. In Proceedings of the 2011 International Conference on Computer Distributed Control and Intelligent Environmental Monitoring, Changcha, China, 19–20 February 2011; pp. 963–966. [Google Scholar]
  11. Verhelst, S.; Sierens, R.; Verstraeten, S. A Critical Review of Experimental Research on Hydrogen Fueled SI Engines; Technical Paper 2006-01-0430; SAE: Warrendale, PA, USA, 2006; Volume 115, pp. 264–274. [Google Scholar] [CrossRef]
  12. Stone, R. Introduction to Internal Combustion Engines; Springer: London, UK, 1999; Volume 3, pp. 1–16. [Google Scholar]
  13. Poursadegh, F.; Brear, M.; Hayward, B.; Yang, Y. Autoignition, knock, detonation and the octane rating of hydrogen. Fuel 2023, 332, 126201. [Google Scholar] [CrossRef]
  14. Turner, J.W.G.; Popplewell, A.; Patel, R.; Johnson, T.R.; Darnton, N.J.; Richardson, S.; Bredda, S.W.; Tudor, R.J.; Bithell, C.I.; Jackson, R.; et al. Ultra Boost for Economy: Extending the Limits of Extreme Engine Downsizing. SAE Int. J. Engines 2014, 7, 387–417. [Google Scholar] [CrossRef]
  15. Lee, J.; Park, C.; Kim, Y.; Choi, Y.; Bae, J.; Lim, B. Effect of turbocharger on performance and thermal efficiency of hydrogen-fueled spark ignition engine. Int. J. Hydrog. Energy 2019, 44, 4350–4360. [Google Scholar] [CrossRef]
  16. Oh, S.; Park, C.; Nguyen, D.; Kim, S.; Kim, Y.; Choi, Y.; Lee, J. Investigation on the operable range and idle condition of hydrogen-fueled spark ignition engine for unmanned aerial vehicle (UAV). Energy 2021, 237, 121645. [Google Scholar] [CrossRef]
  17. Heywood, J.B. Internal Combustion Engine Fundamentals; McGraw-Hill Education: New York, NY, USA, 2018. [Google Scholar]
  18. White, C.M.; Steeper, R.R.; Lutz, A.E. The hydrogen-fueled internal combustion engine: A technical review. Int. J. Hydrog. Energy 2006, 31, 1292–1305. [Google Scholar] [CrossRef]
  19. Gao, J.; Wang, X.; Song, P.; Tian, G.; Ma, C. Review of the backfire occurrences and control strategies for port hydrogen injection internal combustion engines. Fuel 2022, 307, 121553. [Google Scholar] [CrossRef]
  20. Fischer, M.; Sterlepper, S.; Pischinger, S.; Seibel, J.; Kramer, U.; Lorenz, T. Operation principles for hydrogen spark ignited direct injection engines for passenger car applications. Int. J. Hydrog. Energy 2022, 47, 5638–5649. [Google Scholar] [CrossRef]
  21. Livengood, J.C.; Wu, P.C. Correlation of autoignition phenomena in internal combustion engines and rapid compression machines. Symp. Int. Combust. 1955, 5, 347–356. [Google Scholar] [CrossRef] [Green Version]
  22. Khaled, F.; Badra, J.; Farooq, A. Ignition delay time correlation of fuel blends based on Livengood-Wu description. Fuel 2017, 209, 776–786. [Google Scholar] [CrossRef]
  23. Fagundez, J.L.S.; Sari, R.L.; Garcia, A.; Pereira, F.M.; Martins, M.E.S.; Salau, N.P.G. A chemical kinetics based investigation on laminar burning velocity and knock occurrence in a spark-ignition engine fueled with ethanol–water blends. Fuel 2020, 280, 118587. [Google Scholar] [CrossRef]
  24. Wang, L.; Yang, Z.; Huang, Y.; Liu, D.; Duan, J.; Guo, S.; Qin, Z. The effect of hydrogen injection parameters on the quality of hydrogen–air mixture formation for a PFI hydrogen internal combustion engine. Int. J. Hydrog. Energy 2017, 42, 23832–23845. [Google Scholar] [CrossRef]
  25. Sun, B.-G.; Zhang, D.-S.; Liu, F.-S. Cycle variations in a hydrogen internal combustion engine. Int. J. Hydrog. Energy 2013, 38, 3778–3783. [Google Scholar] [CrossRef]
  26. ASTM D2699-22a; Standard Test Method for Research Octane Number of Spark-Ignition Engine Fuel. ASTM: West Conshohocken, PA, USA, 2023.
  27. Millo, F.; Ferraro, C.V. Knock in S.I. Engines: A Comparison between Different Techniques for Detection and Control; Technical Paper 982477; SAE: Warrendale, PA, USA, 1998; Volume 107, pp. 1091–1112. [Google Scholar] [CrossRef]
  28. Smith, J.R.; Green, R.M.; Westbrook, C.K.; Pitz, W.J. An experimental and modeling study of engine knock. Symp. Int. Combust. 1985, 20, 91–100. [Google Scholar] [CrossRef]
  29. Hoth, A.; Kolodziej, C.P. Effects of knock intensity measurement technique and fuel chemical composition on the research octane number (RON) of FACE gasolines: Part 1—Lambda and knock characterization. Fuel 2021, 304, 120722. [Google Scholar] [CrossRef]
  30. Kar, T.; Fosudo, T.; Slunecka, C.; Marchese, A.; Windom, B.; Olsen, D. A Study of Propane Combustion in a Spark-Ignited Cooperative Fuel Research (CFR) Engine; Technical Paper 2022-01-0404; SAE: Warrendale, PA, USA, 2022. [Google Scholar] [CrossRef]
  31. Rockstroh, T.; Kolodziej, C.P.; Jespersen, M.C.; Goldsborough, S.S.; Wallner, T. Insights into Engine Knock: Comparison of Knock Metrics across Ranges of Intake Temperature and Pressure in the CFR Engine. SAE Int. J. Fuels Lubr. 2018, 11, 545–561. [Google Scholar] [CrossRef]
  32. Nguyen, D.; Turner, J.W.G. Effect of nitric oxide on the performance and emissions of a hydrogen-fueled HCCI engine. Fuel 2023, 349, 128611. [Google Scholar] [CrossRef]
  33. Pal, P.; Kolodziej, C.P.; Choi, S.; Som, S.; Broatch, A.; Gomez-Soriano, J.; Wu, Y.; Lu, T.; See, Y.C. Development of a Virtual CFR Engine Model for Knocking Combustion Analysis. SAE Int. J. Engines 2018, 11, 1069–1082. [Google Scholar] [CrossRef]
  34. Kar, T.; Zhou, Z.; Brear, M.; Yang, Y.; Khosravi, M.; Lacey, J. A Comparative Study of Directly Injected, Spark Ignition Engine Combustion and Energy Transfer with Natural Gas, Gasoline, and Charge Dilution. SAE Int. J. Fuels Lubr. 2022, 15, 199–220. [Google Scholar] [CrossRef]
  35. Ansys Chemkin-Pro. Theory Manual; Ansys: Canonsburg, PA, USA, 2021. [Google Scholar]
  36. Kar, T.; Fosudo, T.; Marchese, A.; Windom, B.; Olsen, D. Effect of fuel composition and EGR on spark-ignited engine combustion with LPG fueling: Experimental and numerical investigation. Fuel 2022, 327, 125221. [Google Scholar] [CrossRef]
  37. Slunecka, C.J.; Zdanowicz, A.; Bhoite, S.; Vaughan, S.; Windom, B.; Olsen, D.; Marchese, A. Autoignition of Premixed Liquefied Petroleum Gas in a Rapid Compression Machine: Experimental Results and Chemical Kinetic Mechanism Reduction. In Proceedings of the 12th U.S. National Combustion Meeting, College Station, TX, USA, 24–26 May 2021; Colorado State University: Fort Collins, CO, USA, 2021. [Google Scholar]
  38. GT-Power. Engine Performance Application Manual; Gamma Technologies: Westmont, IL, USA, 2018. [Google Scholar]
  39. Choi, S.; Kolodziej, C.P.; Hoth, A.; Wallner, T. Development and Validation of a Three Pressure Analysis (TPA) GT-Power Model of the CFR F1/F2 Engine for Estimating Cylinder Conditions; Technical Paper 2018-01-0848; SAE: Warrendale, PA, USA, 2018. [Google Scholar] [CrossRef]
  40. Woschni, G.A. Universally Applicable Equation for the Instantaneous Heat Transfer Coefficient in the Internal Combustion Engine; Technical Paper 670931; SAE: Warrendale, PA, USA, 1967. [Google Scholar] [CrossRef]
  41. Assanis, D.; Wiese, K.; Schwarz, E.; Bryzik, W. The Effects of Ceramic Coatings on Diesel Engine Performance and Exhaust Emissions; Technical Paper 910460; SAE: Warrendale, PA, USA, 1991; Volume 100, pp. 657–665. [Google Scholar] [CrossRef]
  42. Han, S.B. Cycle-to-cycle variations under cylinder-pressure-based combustion analysis in spark ignition engines. KSME Int. J. 2000, 14, 1151–1158. [Google Scholar] [CrossRef]
  43. Hoard, J.; Rehagen, L. Relating Subjective Idle Quality to Engine Combustion; Technical Paper 970035; SAE: Warrendale, PA, USA, 1997. [Google Scholar] [CrossRef]
  44. Han, L.; Cai, S.; Gao, M.; Hasegawa, J.-Y.; Wang, P.; Zhang, J.; Shi, L.; Zhang, D. Selective Catalytic Reduction of NOx with NH3 by Using Novel Catalysts: State of the Art and Future Prospects. Chem. Rev. 2019, 119, 10916–10976. [Google Scholar] [CrossRef]
  45. Getsoian, A.B.; Theis, J.R.; Lambert, C.K. Sensitivity of Three-Way Catalyst Light-Off Temperature to Air-Fuel Ratio. Emiss. Control Sci. Technol. 2018, 4, 136–142. [Google Scholar] [CrossRef]
  46. Verhelst, S.; Maesschalck, P.; Rombaut, N.; Sierens, R. Increasing the power output of hydrogen internal combustion engines by means of supercharging and exhaust gas recirculation. Int. J. Hydrog. Energy 2009, 34, 4406–4412. [Google Scholar] [CrossRef] [Green Version]
  47. Li, H.; Karim, G.A.; Sohrabi, A. Examination of the Oil Combustion in a S.I. Hydrogen Engine; Technical Paper 2004-01-2916; SAE: Warrendale, PA, USA, 2004. [Google Scholar] [CrossRef]
  48. Szybist, J.P.; Wagnon, S.W.; Splitter, D.; Pitz, W.J.; Mehl, M. The Reduced Effectiveness of EGR to Mitigate Knock at High Loads in Boosted SI Engines. SAE Int. J. Engines 2017, 10, 2305–2318. [Google Scholar] [CrossRef]
  49. Jain, S.; Li, D.; Aggarwal, S.K. Effect of hydrogen and syngas addition on the ignition of iso-octane/air mixtures. Int. J. Hydrog. Energy 2013, 38, 4163–4176. [Google Scholar] [CrossRef]
Figure 1. Schematic of the experimental setup.
Energies 16 05730 g001
Figure 2. Comparison of experimental results with non-predictive (left) and predictive (right) simulation results from GT-Power.
Energies 16 05730 g002
Figure 3. VE and mixture heating value over a range of air–fuel ratios for different compression ratios.
Energies 16 05730 g003
Figure 4. nIMEP results over a range of λs for different compression ratios.
Energies 16 05730 g004
Figure 5. Indicated thermal efficiency over a range of λs for different compression ratios.
Energies 16 05730 g005
Figure 6. COV and LNV of IMEP over a range of λs for different compression ratios.
Energies 16 05730 g006
Figure 7. Engine-out emissions (a) NOx, (b) H2, and (c) exhaust gas temperature over a range of λs for different compression ratios.
Energies 16 05730 g007
Figure 8. Engine-out emissions: (a) CO2, (b) CO, and (c) NMHC over a range of λs for different compression ratios.
Energies 16 05730 g008
Figure 9. Comparison of in-cylinder pressure and high-frequency pressure oscillation for compression ratios (a) 9, (b) 11, and (c) 13 over a range of tested λs.
Energies 16 05730 g009
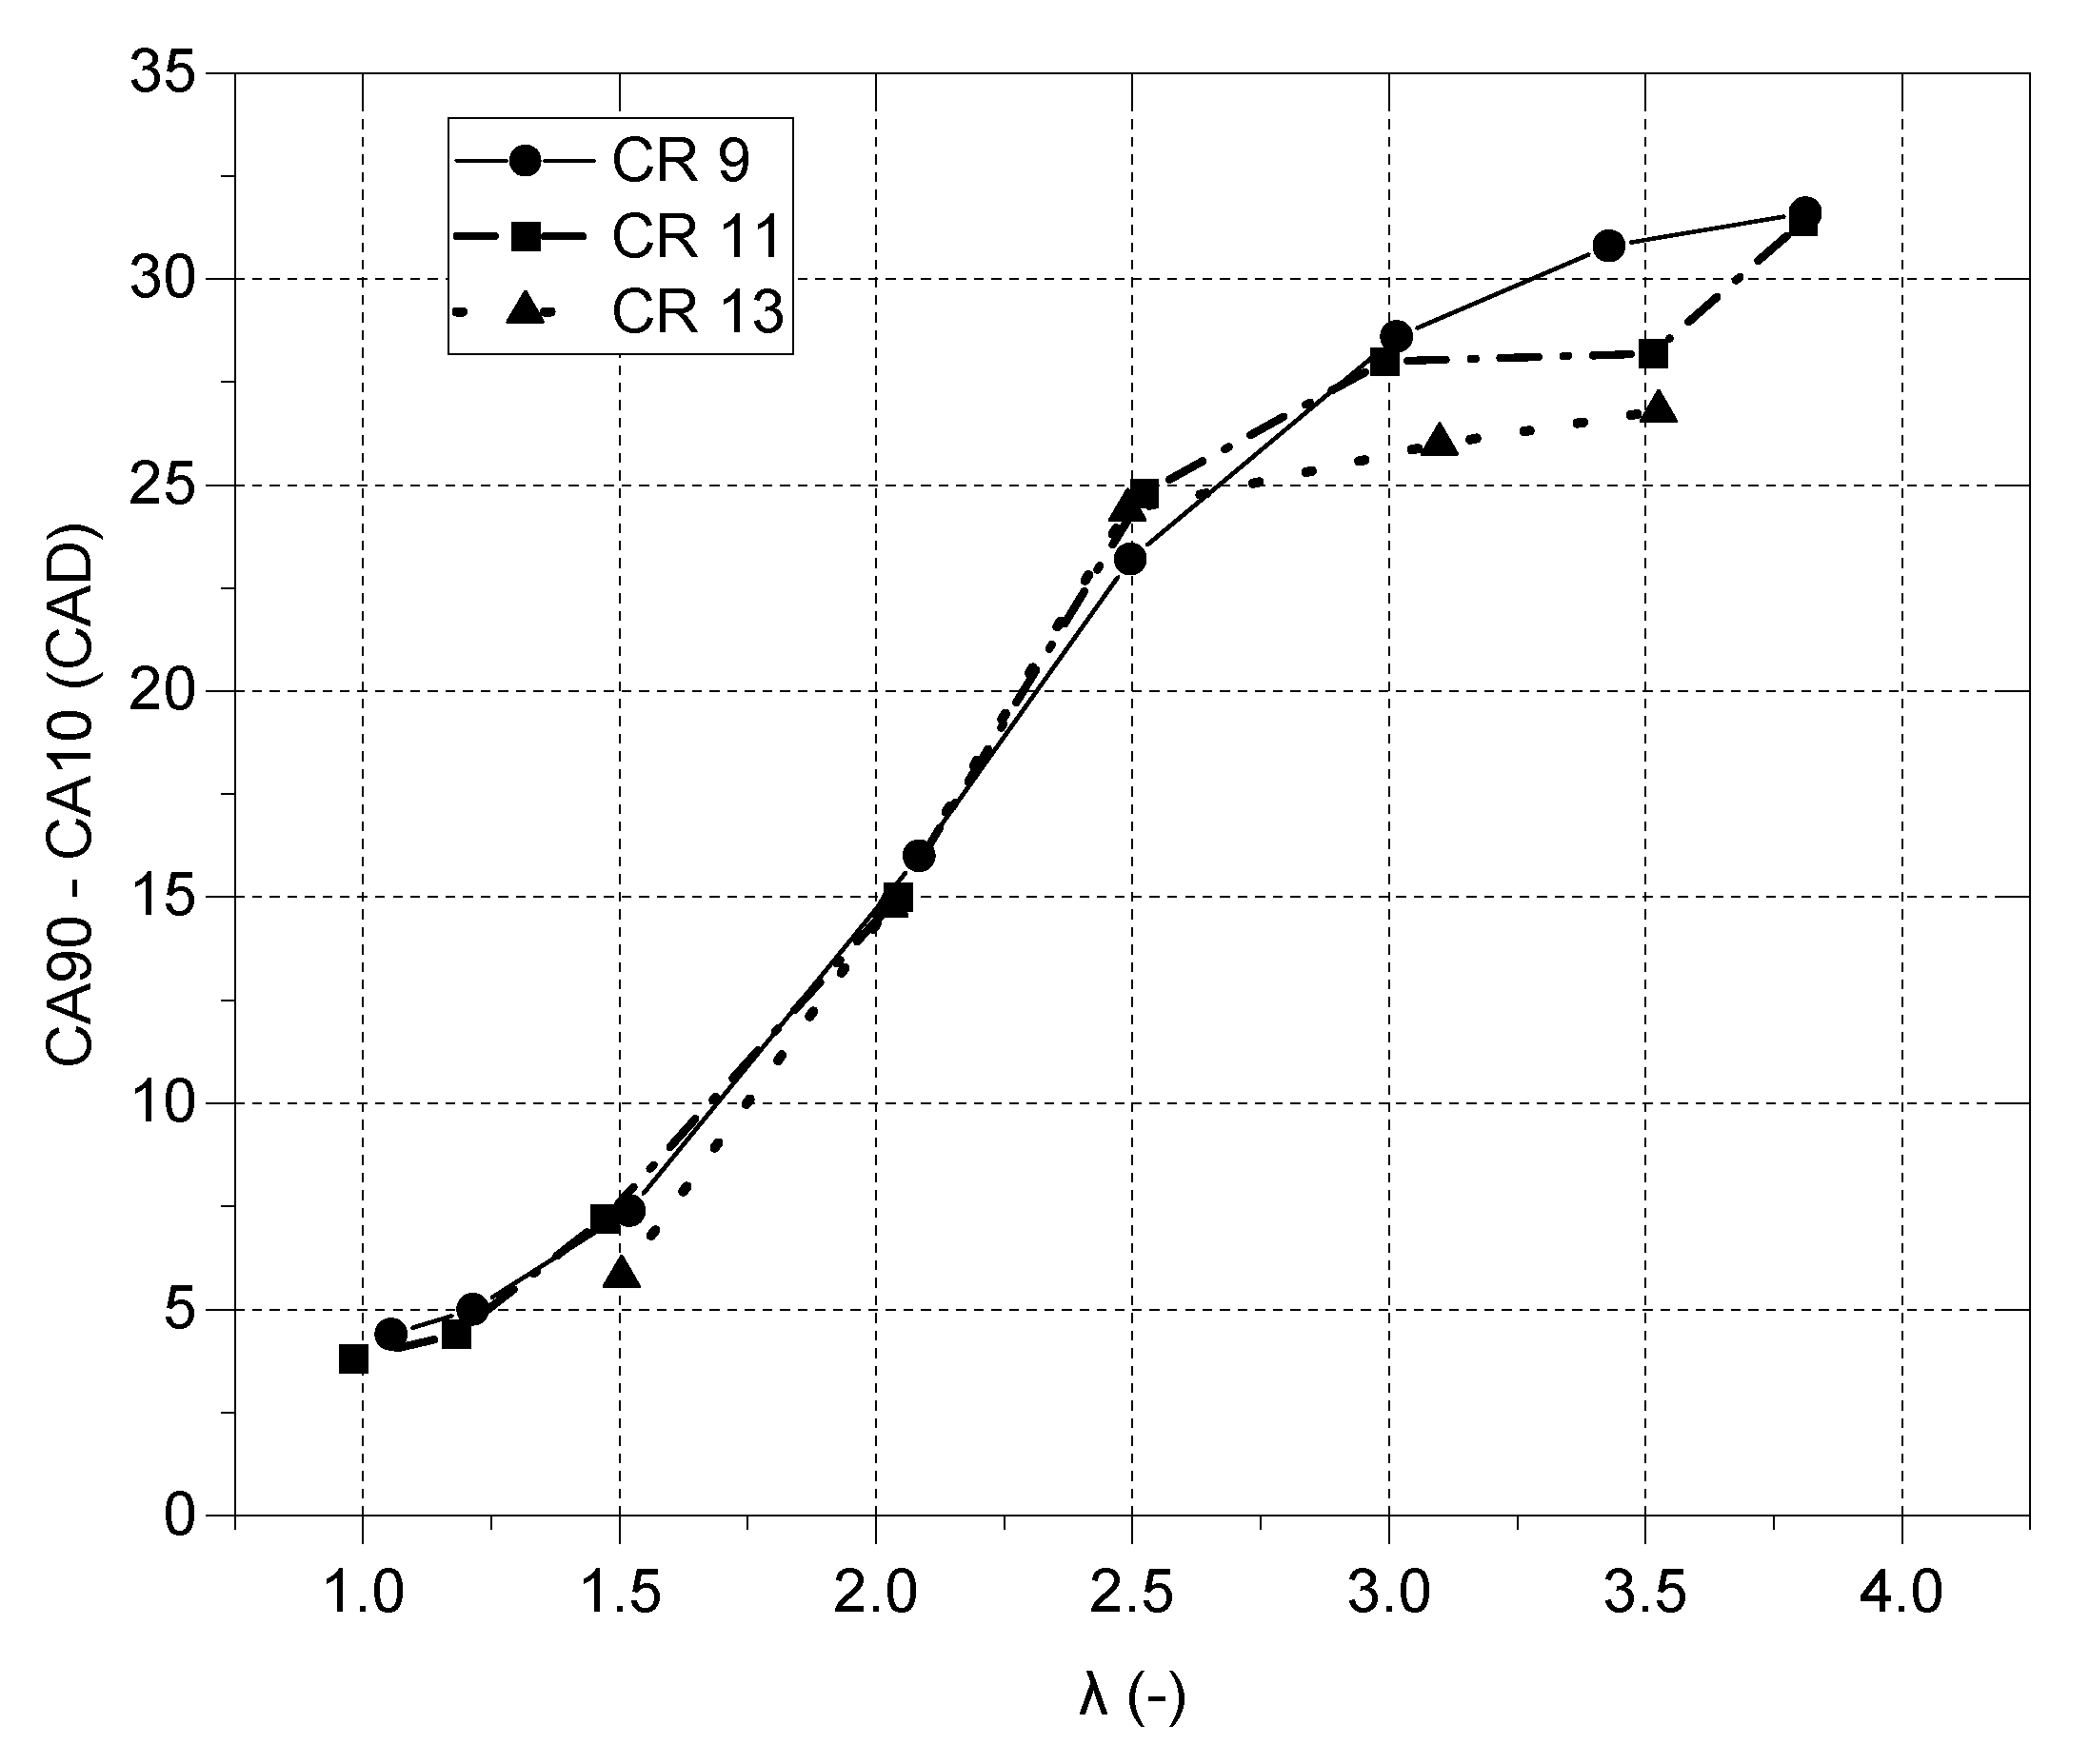
Figure 10. Combustion duration (10–90% mass fraction burned duration) over a range of λs for three different CRs.
Energies 16 05730 g010
Figure 11. MAPO and ignition timing over a range of tested λs for three different compression ratios.
Energies 16 05730 g011
Figure 12. Example of knock point detection for CR = 9 using the second derivative of the in-cylinder pressure trace.
Energies 16 05730 g012
Figure 13. Knock point locations for CR 9 and 11 over the tested λ cases.
Energies 16 05730 g013
Figure 14. Pressure–temperature trajectory of H2 for λ = 1.2 and 2 at CR 11 and 600 RPM. Standard RON and MON regions were taken from [48].
Energies 16 05730 g014
Figure 15. The ignition delay time (IDT) of H2 combustion corresponds to the P–T trajectory presented in Figure 14.
Energies 16 05730 g015
Figure 16. LW integral for H2 combustion corresponds to the respective P–T boundary conditions for λ= 1.2 and 2 at CR 11.
Energies 16 05730 g016
Table 1. CFR engine specifications.
Displacement volume611.7 cc
Intake systemNaturally aspirated
Compression Ratio4:1 to 18:1
Bore, Stroke82.55 mm, 114.3 mm
Number of Valves2
Exhaust Valve Open140 CAD ATDC
Exhaust Valve Close345 CAD BTDC
Inlet Valve Open350 CAD BTDC
Inlet Valve Close146 CAD BTDC
Table 2. Specifications of measuring devices.
DeviceMeasuring RangeAccuracy
Air mass flow controller0–1000 SLPM±0.5% of the flow rate
±0.1% of the full scale
Hydrogen mass flow controller0–100 SLPM±0.5% of the flow rate
±0.1% of the full scale
In-cylinder pressure transducerUp to 150 bar±0.3% of the full scale
FTIR analyser0–10,000 ppm≤2% of the measured value
Hydrogen portable analyser0–20,000 ppm±100 ppm or 5% of the measured value
Intake and exhaust pressure transducers0–10 bar±0.1% of the full scale
Thermocouples−200–1250 °C±0.75% of the full scale
Disclaimer/Publisher’s Note: The statements, opinions and data contained in all publications are solely those of the individual author(s) and contributor(s) and not of MDPI and/or the editor(s). MDPI and/or the editor(s) disclaim responsibility for any injury to people or property resulting from any ideas, methods, instructions or products referred to in the content.