Article

Energy Storage and Release of Class I and Class II Rocks

1
State Key Laboratory for Geomechanics and Deep Underground Engineering, China University of Mining and Technology, Xuzhou 221116, China
2
School of Mechanics and Civil Engineering, China University of Mining and Technology, Xuzhou 221116, China
*
Author to whom correspondence should be addressed.
Energies 2023, 16(14), 5516; https://doi.org/10.3390/en16145516
Submission received: 8 June 2023 / Revised: 13 July 2023 / Accepted: 17 July 2023 / Published: 20 July 2023
(This article belongs to the Section D: Energy Storage and Application)

Abstract

:
As underground excavations become deeper, violent rock failures associated with the sudden release of elastic energy become more prevalent, threatening the safety of workers and construction equipment. It is important to figure out the energy-related failure mechanisms of rocks. However, the energy evolution across the complete deformation of different types of rocks and the effect of high confinement on energy storage and release are not well understood in the literature. In this study, a series of cyclic triaxial compression tests were conducted for Class I and Class II rocks to investigate the confinement-dependent characteristics of energy evolution. The results showed that three types of energy evolution were identified as the rock behavior changed from brittle to ductile. The energy storage limit was linearly enhanced by confinement. The nonlinear increase in dissipated energy at peak stress with increasing confinement was suggested to indicate the start of the brittle–ductile transition. The post-peak fracturing process was characterized using the ratio of the local withdrawn elastic energy and fracture energy, and a novel energy-based index was proposed to quantify the failure intensity of the rock. This paper presents a complete investigation of the energy conversion characteristics of the rock, which may shed light on the failure mechanisms of violent rock failures in underground projects.

1. Introduction

With an increase in depth, in situ stress becomes highly relative to the strength of rock masses. Underground excavation at great depths may induce high-stress concentrations or the accumulation of a large amount of strain energy [1,2,3,4]. Under such a situation, the occurrence of violent rock failures, i.e., rockbursts, increases accordingly. This problem always causes the violent ejection of rock fragments into the openings, which poses a great threat to the safety of equipment, facilities, and workers [1,2]. From the viewpoint of energy balance, excavation activities involve the conversion of strain energy within the rock masses [5,6,7]. When the stored elastic energy reaches a critical value, it starts to be released. Some of the energy is consumed by the rock fracture, and the remaining energy is converted to kinetic energy. Rockburst is the result of the intense and sudden release of this excess energy. Therefore, to help understand the process of such violent rock failures, the confinement-dependent energy storage and release of intact rock need to be studied fundamentally.
In recent years, considerable experimental studies were carried out from the perspective of energy to explore the deformation and damage process of rock. By performing uniaxial and triaxial compression tests, general consent has been achieved by many authors that the process of rock deformation and failure is associated with energy conversion, including the accumulation, dissipation, and release of strain energy [8,9,10]. Studies were also devoted to analyzing the effects of loading rate, stress path, sample size, and confining pressure on the energy conversion rule, and to disclosing the relationship between energy evolution and the rock damage process [11,12,13,14,15,16,17,18]. Nevertheless, most of the above-mentioned studies focused on one type of rock, i.e., brittle and hard rock. For Class II rock, the results were normally presented at the pre-peak stage. Moreover, the applied confining pressures were relatively low in rock strength (in other words, the rock deformation was in a brittle regime). Hence, a supplementary study that covers the above-mentioned gaps is needed to provide a complete understanding of the energy evolution characteristics of rocks.
In coal mining, soft rocks, such as coal, sandy mudstone, and argillaceous sandstone, are normally involved, and the so-called “coal bump” is an explosive failure associated with the sudden release of strain energy as well, which poses a great threat to workers [2,19]. On the other hand, the knowledge of the complete stress–strain response of the rock, particularly the post-failure behavior, is important for the design or stability assessment of underground structures [20,21]. Wawersik and Fairhurst [22] classified rocks into Class I and Class II, depending on their post-failure reactions. For Class I rocks, the failure is stable, and energy needs to be constantly applied to the specimen to achieve failure. In contrast, the failure of Class II rocks is unstable or self-sustaining due to the sufficient elastic strain energy built up inside the specimen [22]. To capture the complete stress–strain behavior of Class II rocks, the circumferential strain control mode has to be implemented using a closed-loop servo-controlled test machine [23,24,25]. The importance of this testing method was emphasized by Bruning et al. [23] not only for determining Class II behavior but also for obtaining the correct pre-peak damage process of brittle rocks.
In this study, a series of conventional and cyclic triaxial loading–unloading compression tests were performed on granite, red sandstone, coal, and mudstone samples. A wide range of confining pressures (relative to the rock strength) was applied to the latter two types of rock. To obtain the post-failure behavior of Class II rock, the lateral control mode was used. The rock materials and test methodology are described in detail in Section 2. Section 3 presents the results of the mechanical behavior and failure characteristics of rocks. The analyses of energy evolution and energy parameters are presented in Section 4. Based on the results, a discussion is provided in Section 5. Section 6 summarizes the major conclusions and provides suggestions for future research.
This study furnishes a comprehensive understanding of energy evolution over the full stress–strain response for both Class I and Class II rocks. Novel energy ratios are proposed to quantify the post-peak fracturing process and failure intensity of the rock. The results can help to reveal the energy source mechanism underlying the elevated frequency and violence of unstable rock failures at greater depths.

2. Rock Materials and Test Methodology

2.1. Rock Description and Sample Preparation

Four types of rocks, granite, red sandstone, coal, and mudstone, were used for testing. The former two rock types were collected from the Sichuan and Hubei provinces in China. The coal and mudstone samples were collected from Inner Mongolia, China. The granite is a bright white-colored medium-grained hard rock (see Figure 1a), with an average density of 2.60 g/cm3. An XRD analysis showed that granites consist of 14% of quartz, 41% of plagioclase, 32% of orthoclase, and 10% of muscovite. The red sandstone has a relatively homogeneous structure of fine grains (see Figure 1b), with a density of about 2.20 g/cm3. The major composed minerals include 41% of quartz, 28% of plagioclase, 10% of orthoclase, and 10% of calcite. The coal is dull with minor bright bands (see Figure 1c), and the average density is 1.25 g/cm3. The inorganic minerals in coal are mainly composed of quartz (26%), calcite (17%), and kaolinite (56%). The mudstone is composed of 33% of clay (kaolinite, illite, and chlorite) and 65% of non-clay particles (quartz, plagioclase, and orthoclase). It is very fine-grained (see Figure 1d), with an average density of 2.0 g/cm3.
Cylindrical rock specimens were prepared with dimensions of 50 mm (diameter) and 100 mm (height), as shown in Figure 1, following the ASTM standard D7012 [26]. At the same time, sound wave tests were conducted, and the undamaged specimens with close P-wave velocities were used for testing.

2.2. Test Apparatus and Scheme

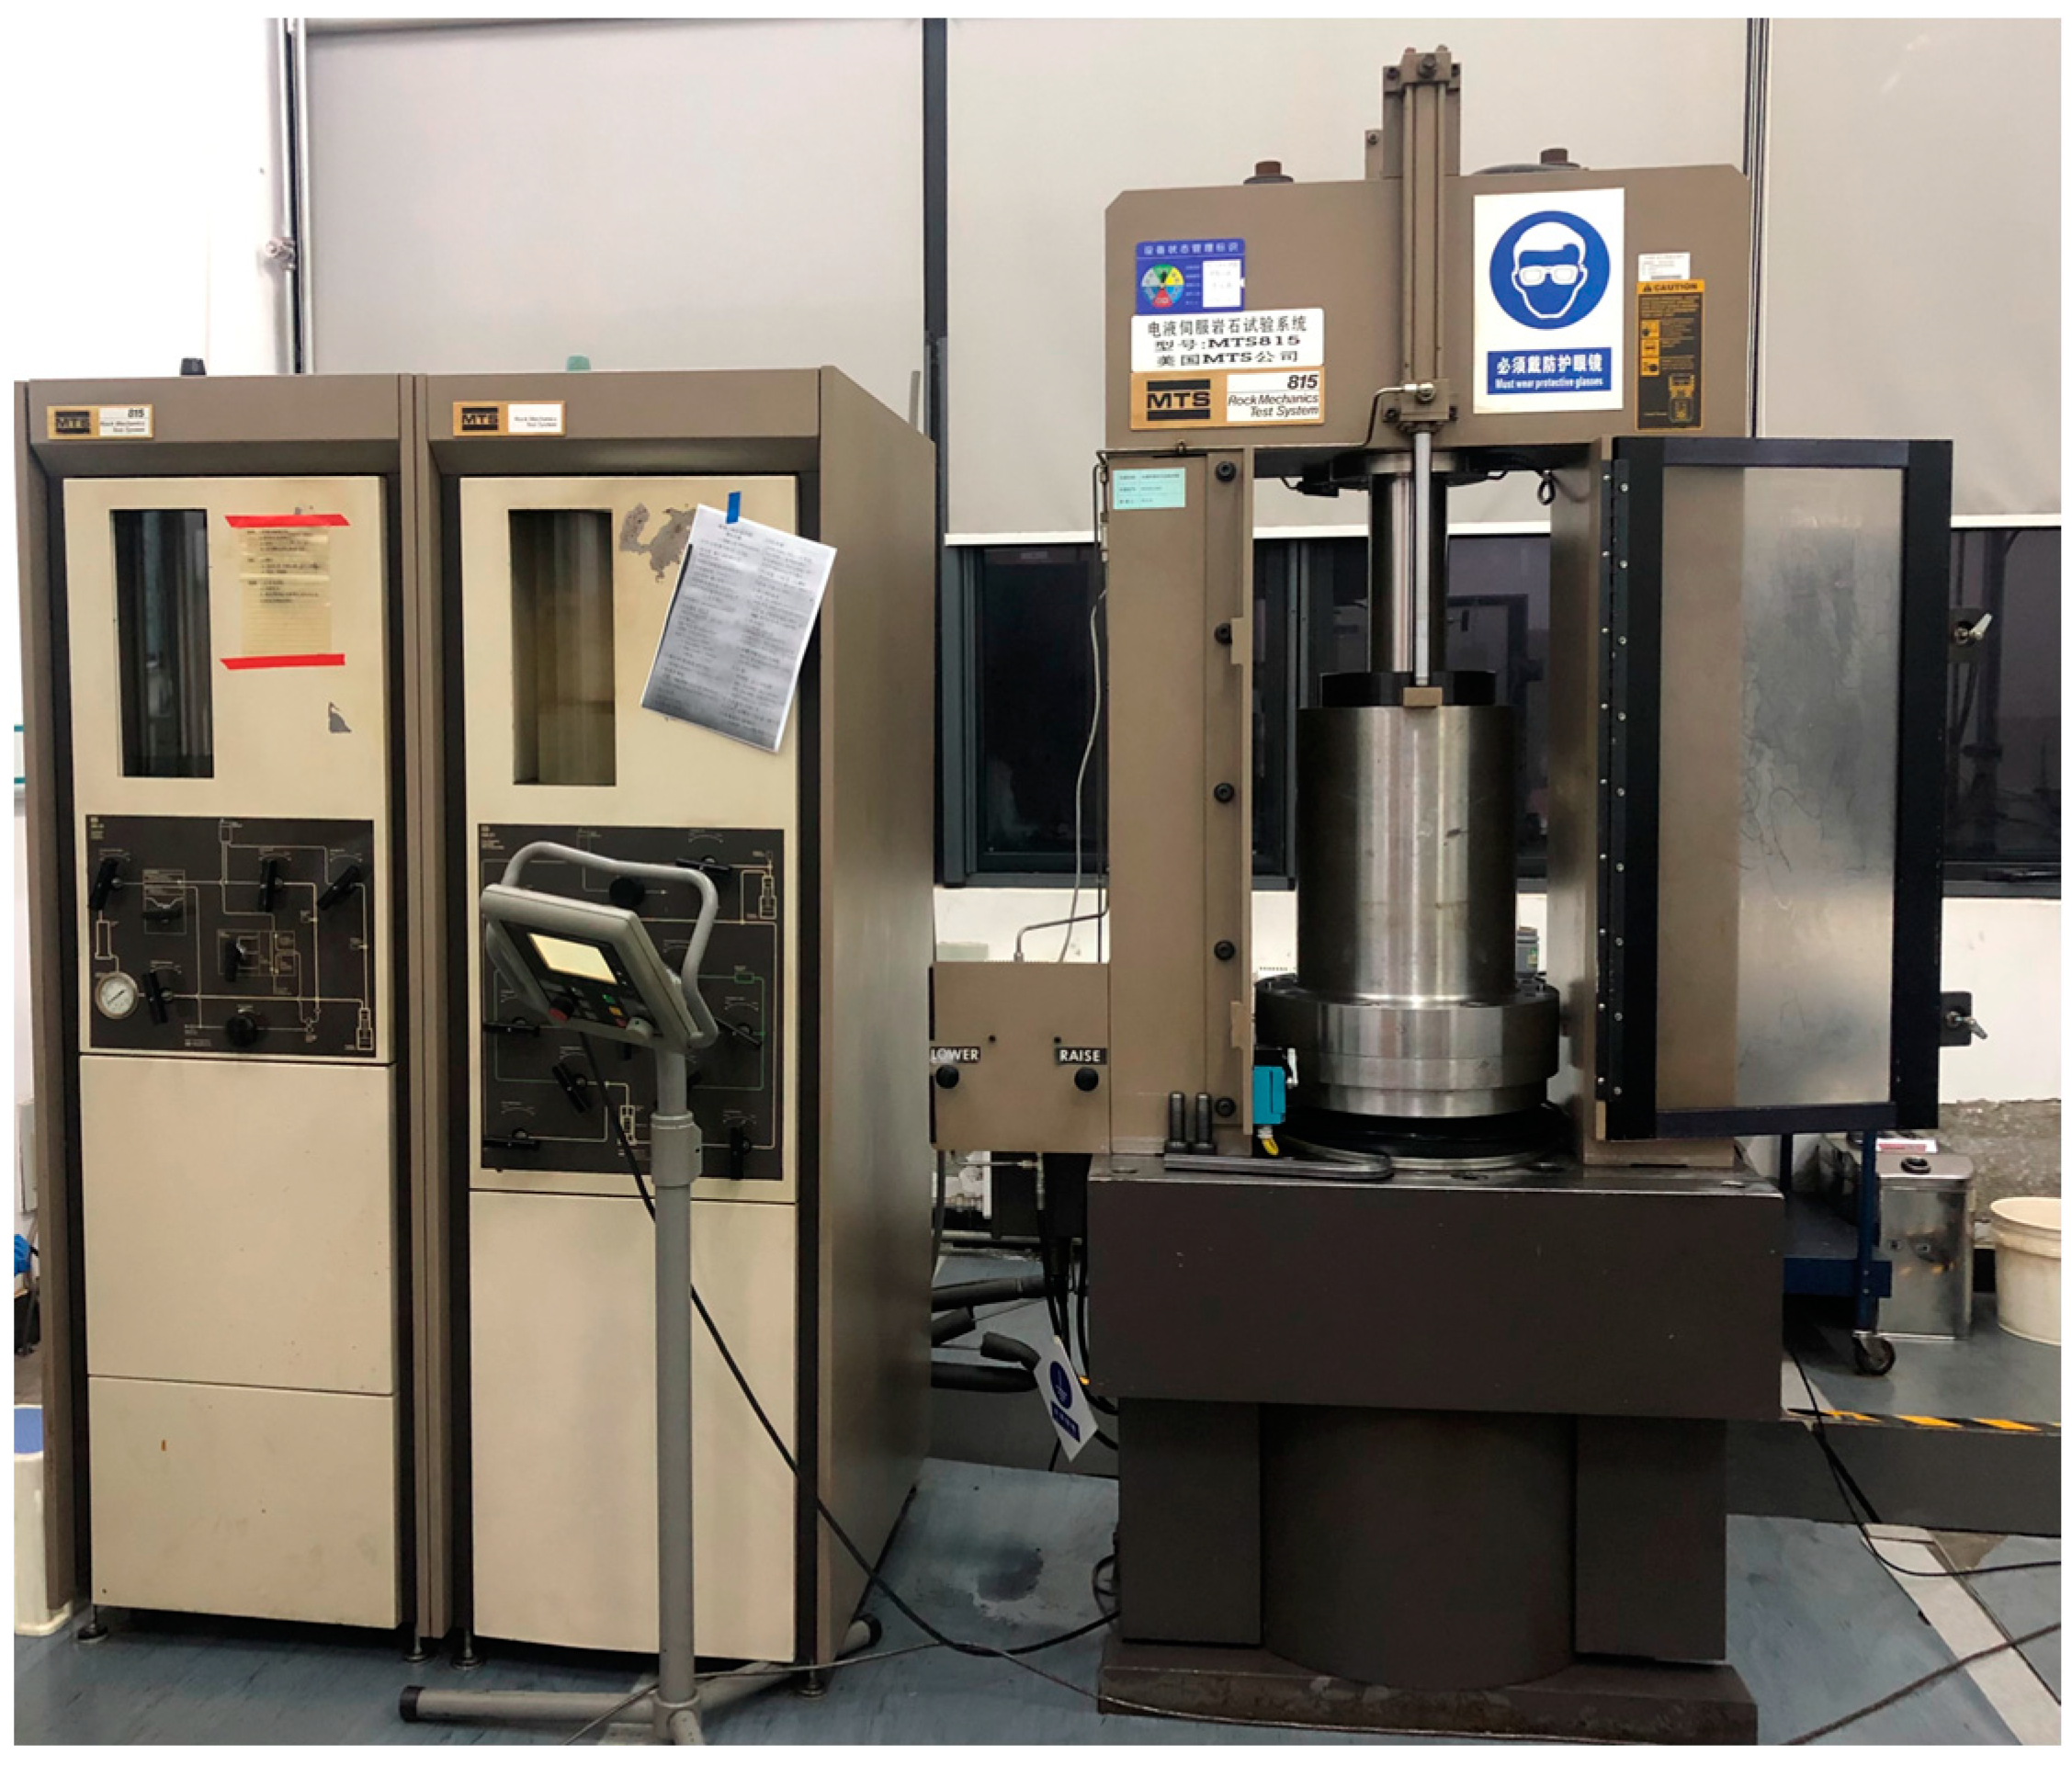
All the triaxial compression tests were performed using an MTS815 servo-controlled rock mechanics testing system (shown in Figure 2) at the State Key Laboratory for Geomechanics and Deep Underground Engineering at China University of Mining and Technology (CUMT). Axial displacements were measured using linear variable differential transducers (LVDTs), and circumferential deformation was measured using a chain extensometer. The applied confining pressures are listed in Table 1.
Studies [11,12] showed that the mechanical properties and fracturing process are rate-dependent under quasi-static loading ( ε ˙ = 10 5 ~ 10 2 /s). In particular, if a high or intermediate loading rate is applied, the failure process or post-peak behavior of Class II rock may not be accessible. In this study, low strain rates were applied.
Conventional compression tests were performed to provide referential information, including the loading increment and peak load, for the design of cyclic compression tests. Hydrostatic stress was first applied to the rock specimen at a rate of 0.5 MPa/s until the required confinement was reached. Then, the confining stress was maintained constant, and the axial stress was applied under axial displacement control at a rate of 0.003 mm/s until the specimen failed.
For triaxial cyclic loading–unloading compression tests, experimental procedures were implemented in three steps. (1) Hydrostatic pressure was applied to the designed confining stress at a rate of 0.5 MPa/s. (2) The confinement was maintained constant, and the axial stress was applied to load–unload cycles with an increment in axial displacement at a rate of 0.003 mm/s. For brittle rocks (such as granite, red sandstone, and low-confined coal samples), the axial load was increased to approximately 75% of the peak load, and then the loading mode was switched to circumferential displacement control at a rate of 0.002 mm/s. (3) At the post-peak phase, the axial stress was applied to load–unload cycles under axial/circumferential displacement control mode until the residual state was approached. As mentioned above, the axial or circumferential displacement increment in each load–unload cycle was determined based on the results of the conventional compression tests. Normally, 10–15 load–unload cycles were designed for the pre-peak stage and 5–10 load–unload cycles for the post-peak stage.

3. Mechanical Behavior and Fracture Characteristics of the Rocks

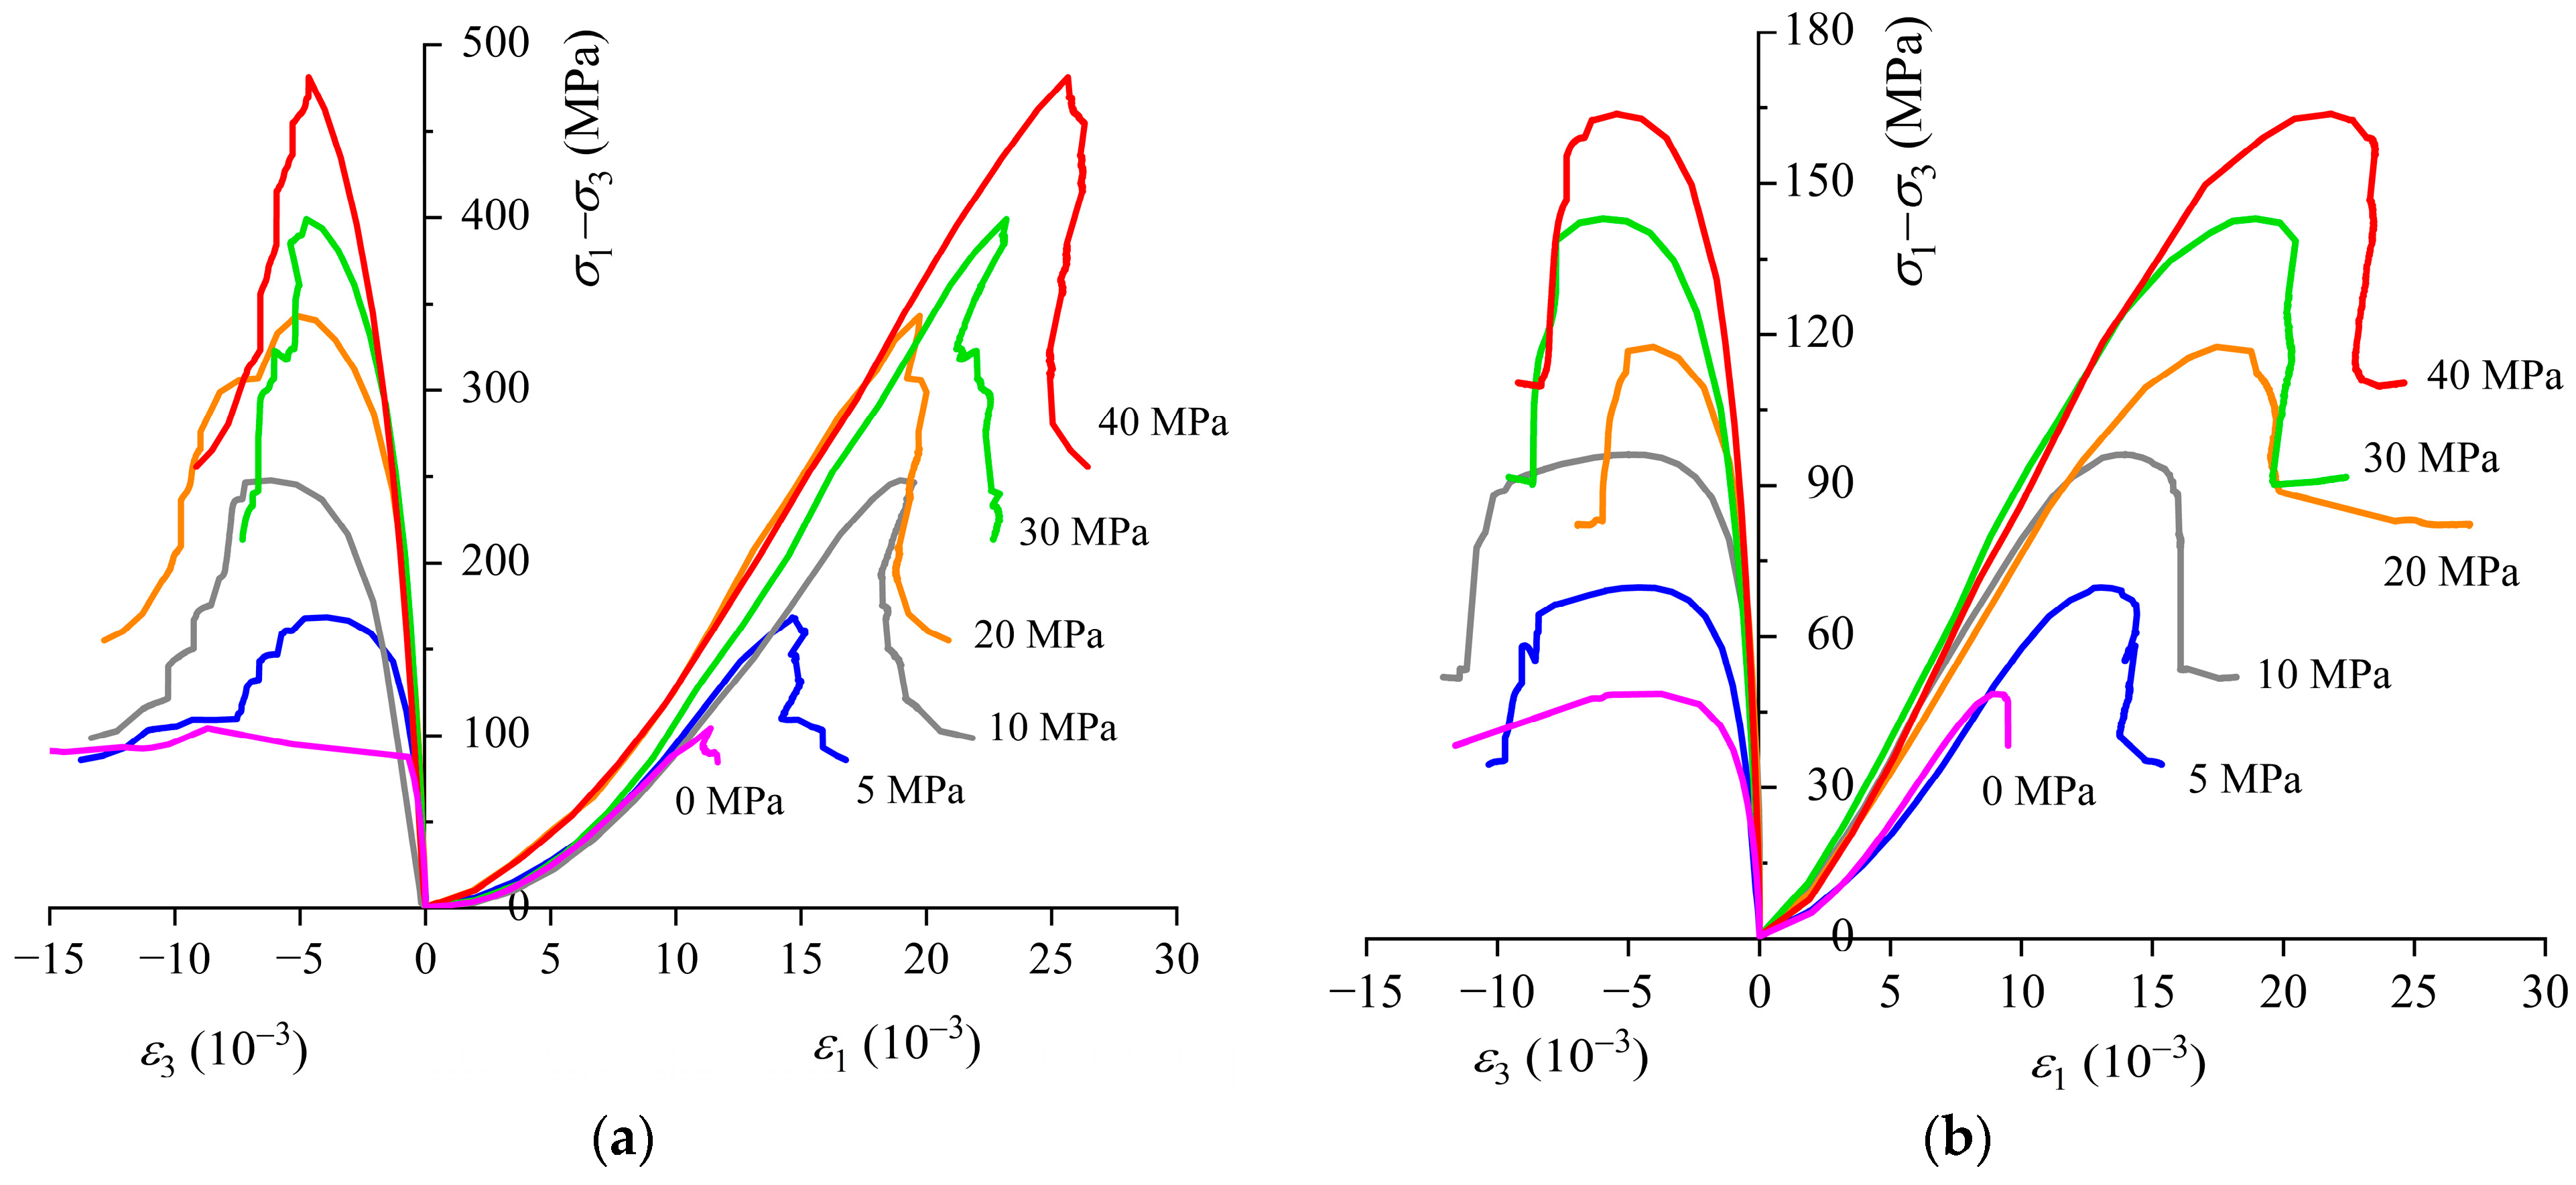
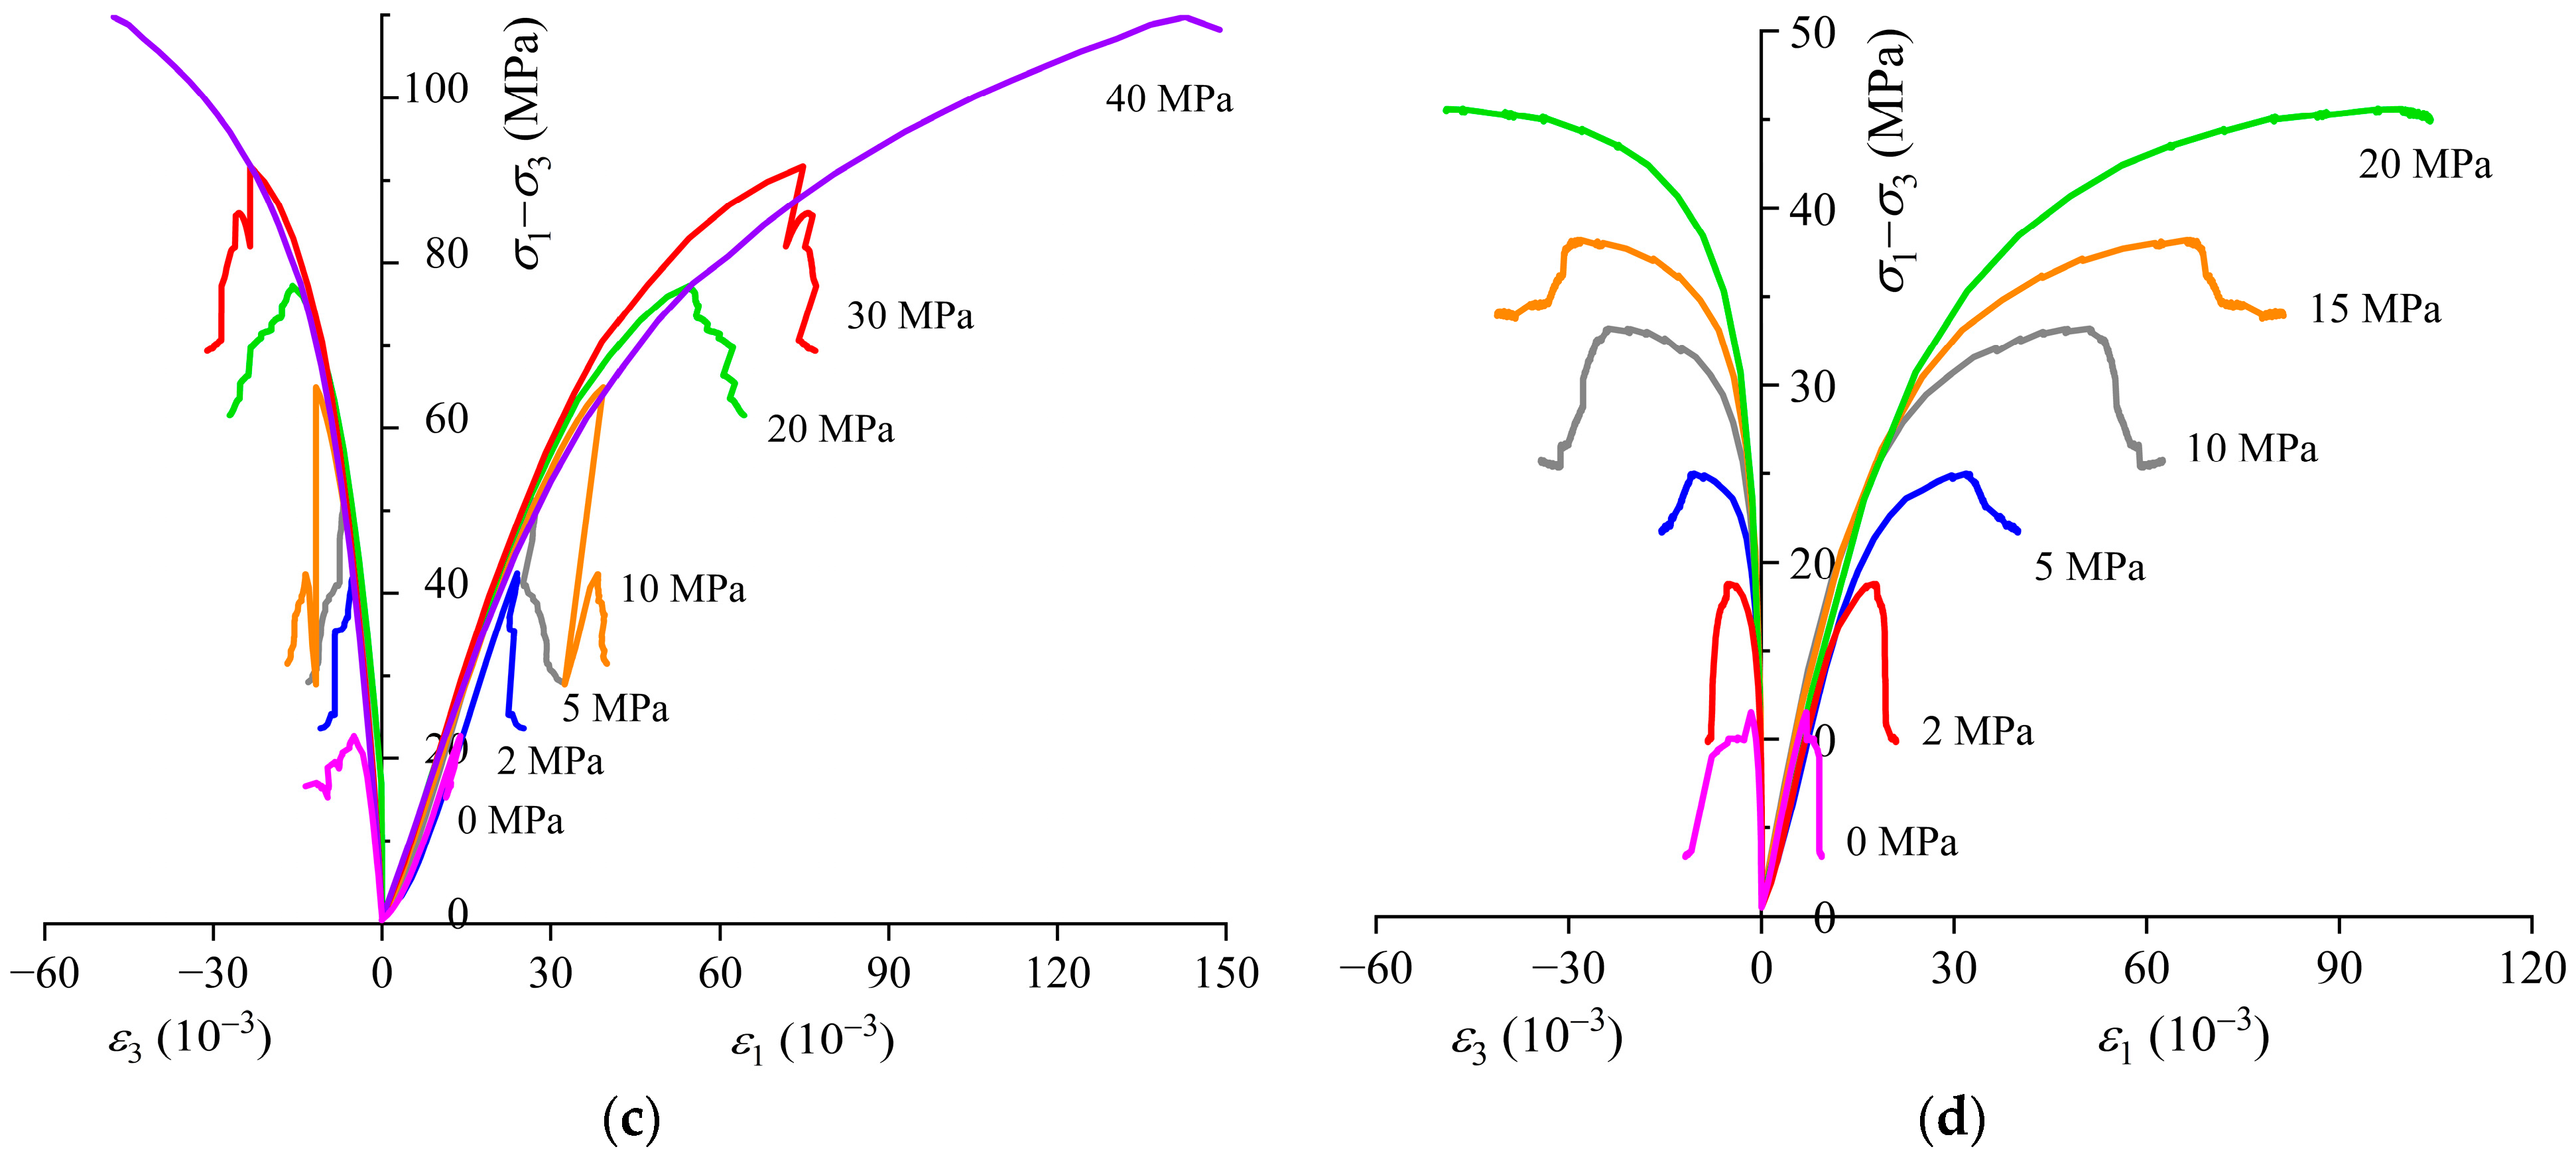
The obtained strength and deformations from conventional and cyclic triaxial tests showed similar results, indicating that the stress–strain responses of the rocks were not affected by the load–unload test method. This conclusion is consistent with that reported by previous authors [16,27]. Thus, the results were interpreted using the upper strength envelopes of the cyclic stress–strain curves of the rocks with the load–unload cycles removed, as shown in Figure 3. In Figure 3, the horizontal (x-) axes represent the axial strain (ε1) on the right side (x ≥ 0) and the lateral strain (ε3) on the left side (x ≤ 0), and the vertical (y-) axis represents the differential stress (σ1σ3). It can be seen that the stress–strain curves at σ3 = 5 MPa present diverse characteristics in the deformation and strength of the four types of rocks (see Figure 3). Figure 4 illustrates the envelopes of the cyclic stress–strain curves of all the tested rock samples, and the strength and deformation property values are summarized in Table 2. Martin [28] defined the long-term strength of brittle rocks, known as crack damage stress (CD), which can be identified by the reversal point of volumetric strain under unconfined conditions. In confined situations, however, the mechanism of CD can be different, and it is not necessary to correspond to the reversal of volumetric strain [29]. In the current study, the CD or yield point, corresponding to the onset of unstable cracking or plastic behavior, was estimated by the start of nonlinearity of the axial strain–axial stress curve. The results are also listed in Table 2.

3.1. Granite

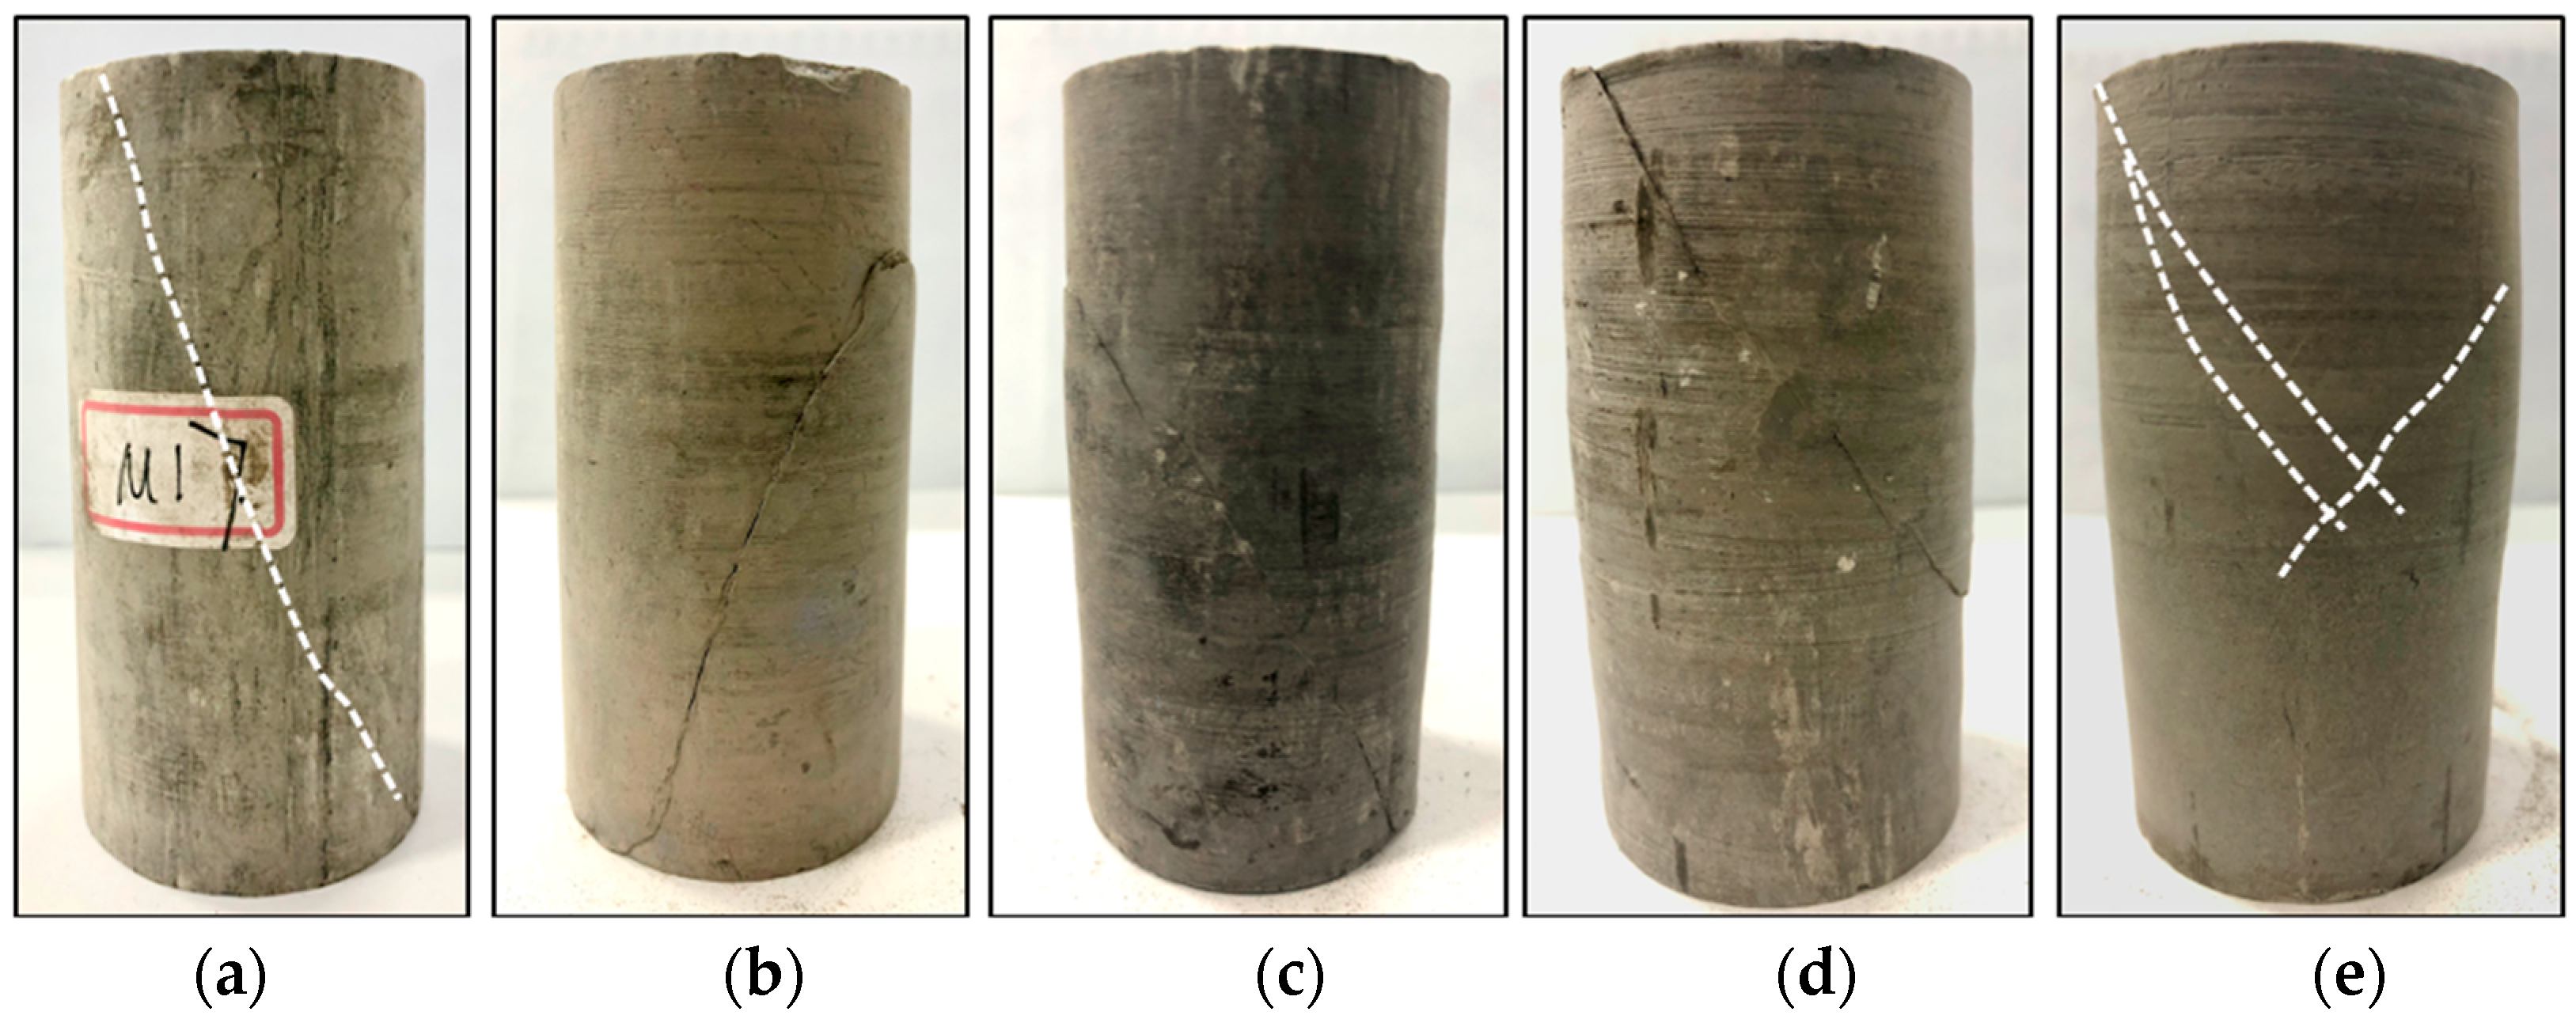
It can be seen from Figure 4a and Table 2 that the granite is the strongest with an average UCS of 124.73 MPa and displays brittle behavior. Unstable cracking (CD) occurs at 84–91% of the peak stress (see Table 2). The applied confinements for granite are relatively low in strength, with a ratio of differential stress to minor principal stress ( σ 1 σ 3 σ 3 ) greater than 12. Within this range, Class II behavior is presented (see Figure 4a), and the plastic strain before the peak stress ( ε 1 p ) is insignificant at less than 0.13% (see Table 2). This suggests that the deformation of granite samples occurs in a brittle regime. Figure 5 shows the failed granite samples. Mixed axial splitting and shear fractures are the major failure modes at low confinements, i.e., σ3 = 5 and 10MPa. At higher pressures, brittle shear faulting is observed (see Figure 5c–e), and the fracturing process tends to be more intense, accompanied by a louder sound. As the confining pressure increases, the angle of the fractures to the major principal stress (σ1) is increased, which agrees with the phenomenon observed in previous studies [24,30].

3.2. Red Sandstone

The stress–strain response of red sandstone samples illustrates a less brittle behavior than that of granite. For instance, a more distinct yielding phenomenon is seen at the pre-peak stage (see Figure 4b). It corresponds to the earlier occurrence of CD (68–78% σ1p) and a larger irreversible strain (see results in Table 2). After the peak stress, mixed Class I/Class II behavior is seen for the samples at σ3 = 5, 30, and 40 MPa. The stress slowly descends with a certain amount of displacement (Class I behavior) and is followed by a sudden decrease in the stress with the reverse of the axial strain (Class II behavior). The failure process is less intense and the stress finally stabilizes at a residual strength. An increase in the confinement up to 40 MPa leads to slight changes in the post-peak stress–strain behaviors (Figure 4b), which implies that red sandstone deforms in the brittle regime as well. In accordance with that, brittle faulting takes place in all confined cases (see Figure 6). A thoroughgoing and open shear fracture is seen at a pressure of 5MPa (see Figure 6a). Due to local extension, the fracture tends to be parallel to σ1 at the ends of the specimen. At higher pressures, the shear fault becomes more compact, and the fracture angle increases (see Figure 6b–e).

3.3. Coal

The coal exhibits fairly brittle behavior at low confinements (i.e., 2, 5, and 10 MPa) (see Figure 4c). Under these conditions, the pre-peak stress–strain curve increases linearly until the stress is improved to approximately 70–90% of the peak strength, and the post-peak Class II behavior is presented. As σ3 increases to 20 MPa, a distinct nonlinearity before the peak strength is observed, with a plastic strain of 1.3% (see Table 2). In particular, the Class II stress–strain response is suppressed and replaced by Class I behavior at this pressure (see Figure 4c). At a higher pressure, i.e., 40 MPa, a more substantial irreversible strain (8.2%) is attained (see Table 2). Due to the fact that the circumferential strain of coal at σ3 = 40 Mpa exceeded the measuring range of the chain extensometer, the residual strength data of this sample are unavailable (similar situations appear for the mudstone samples at a confinement of 20 MPa). Nevertheless, the test was terminated at an axial strain of 15%, which was sufficient to show ductile behavior. At this pressure, the ratio of differential stress to minor principal stress is equal to 2.74, which is lower than the ratios at the brittle–ductile transition for silicate and carbonate rocks (3.4 and 5), as suggested by Mogi [31]. It seems that a pressure of 40 MPa marks the location where the brittle–ductile transition of coal occurs.
The failed coal samples (Figure 7) show that macroscopic fractures change from axial splitting to shear faulting, and the fracture angle increases with the increasing confinements. A localized shear zone is formed at high pressures (i.e., 30 and 40 MPa). Since fully plastic behavior was not achieved, purely diffusional deformation is absent. Instead, the semi-brittle behavior at σ3 = 40 MPa is manifested by a wide shear band and bulging deformation outside the shear zone (see Figure 7f). Inside this shear zone, the cataclastic flow associated with pervasive pore collapse and crushing is likely to occur.

3.4. Mudstone

The mudstone is the weakest rock that illustrates typical Class I behavior under uniaxial and confined conditions. The point of yielding takes place much earlier than the previous three types of rocks, at 48–63% of the peak strength (see Table 2). Relatively brittle behavior is presented at low confinements (i.e., 0 and 2 MPa). At σ3 = 5 MPa, a large irreversible strain of 1.8% before the peak is induced, accompanied by a slight strain-softening curve to the residual stress level (see Figure 4d and Table 2). Further increase in the confining pressure (σ3 ≥ 10 MPa) results in a more ductile behavior, which is characterized by the greater irreversible strain to maintain the peak strength and less distinct strain-softening behavior. At these pressures, shear fractures in the samples present a certain width, and lateral expansion can be noticed (Figure 8c–e). This suggests that a pressure of 10 MPa marks the boundary of the brittle–ductile transition for mudstone. At this pressure, the ratio of differential stress to minor principal stress is around 3.32. At σ3 = 20 MPa, the conjugate and compacted bands are observed (see Figure 8e), and the lateral expansion becomes more prominent, which represents a more diffused deformation.

4. Effect of Confinement on Energy Evolution and Energy Parameters

4.1. Estimation of Strain Energy and Energy Portions for Class I and Class II Rocks

As mentioned previously, rock deformation under compression is accompanied by the conversion (i.e., the accumulation, dissipation, and release) of strain energies. The values of total absorbed strain energy (u0), stored elastic strain energy (ue), and dissipated strain energy (ud) per unit volume of the rock can be estimated using the triaxial loading–unloading compression test, which has been elaborated by Xie et al. [8] and Ning et al. [16]. To quantify the post-peak energy behaviors, the withdrawn elastic strain energy d w e and fracture energy d w f are determined by the following equations:
d w e = u e p u e r
d w f = u d r u d p
where u e p   and u e r are elastic strain energy corresponding to the peak and residual stresses, respectively; u d p and u d r are dissipative strain energy corresponding to the same stress levels.
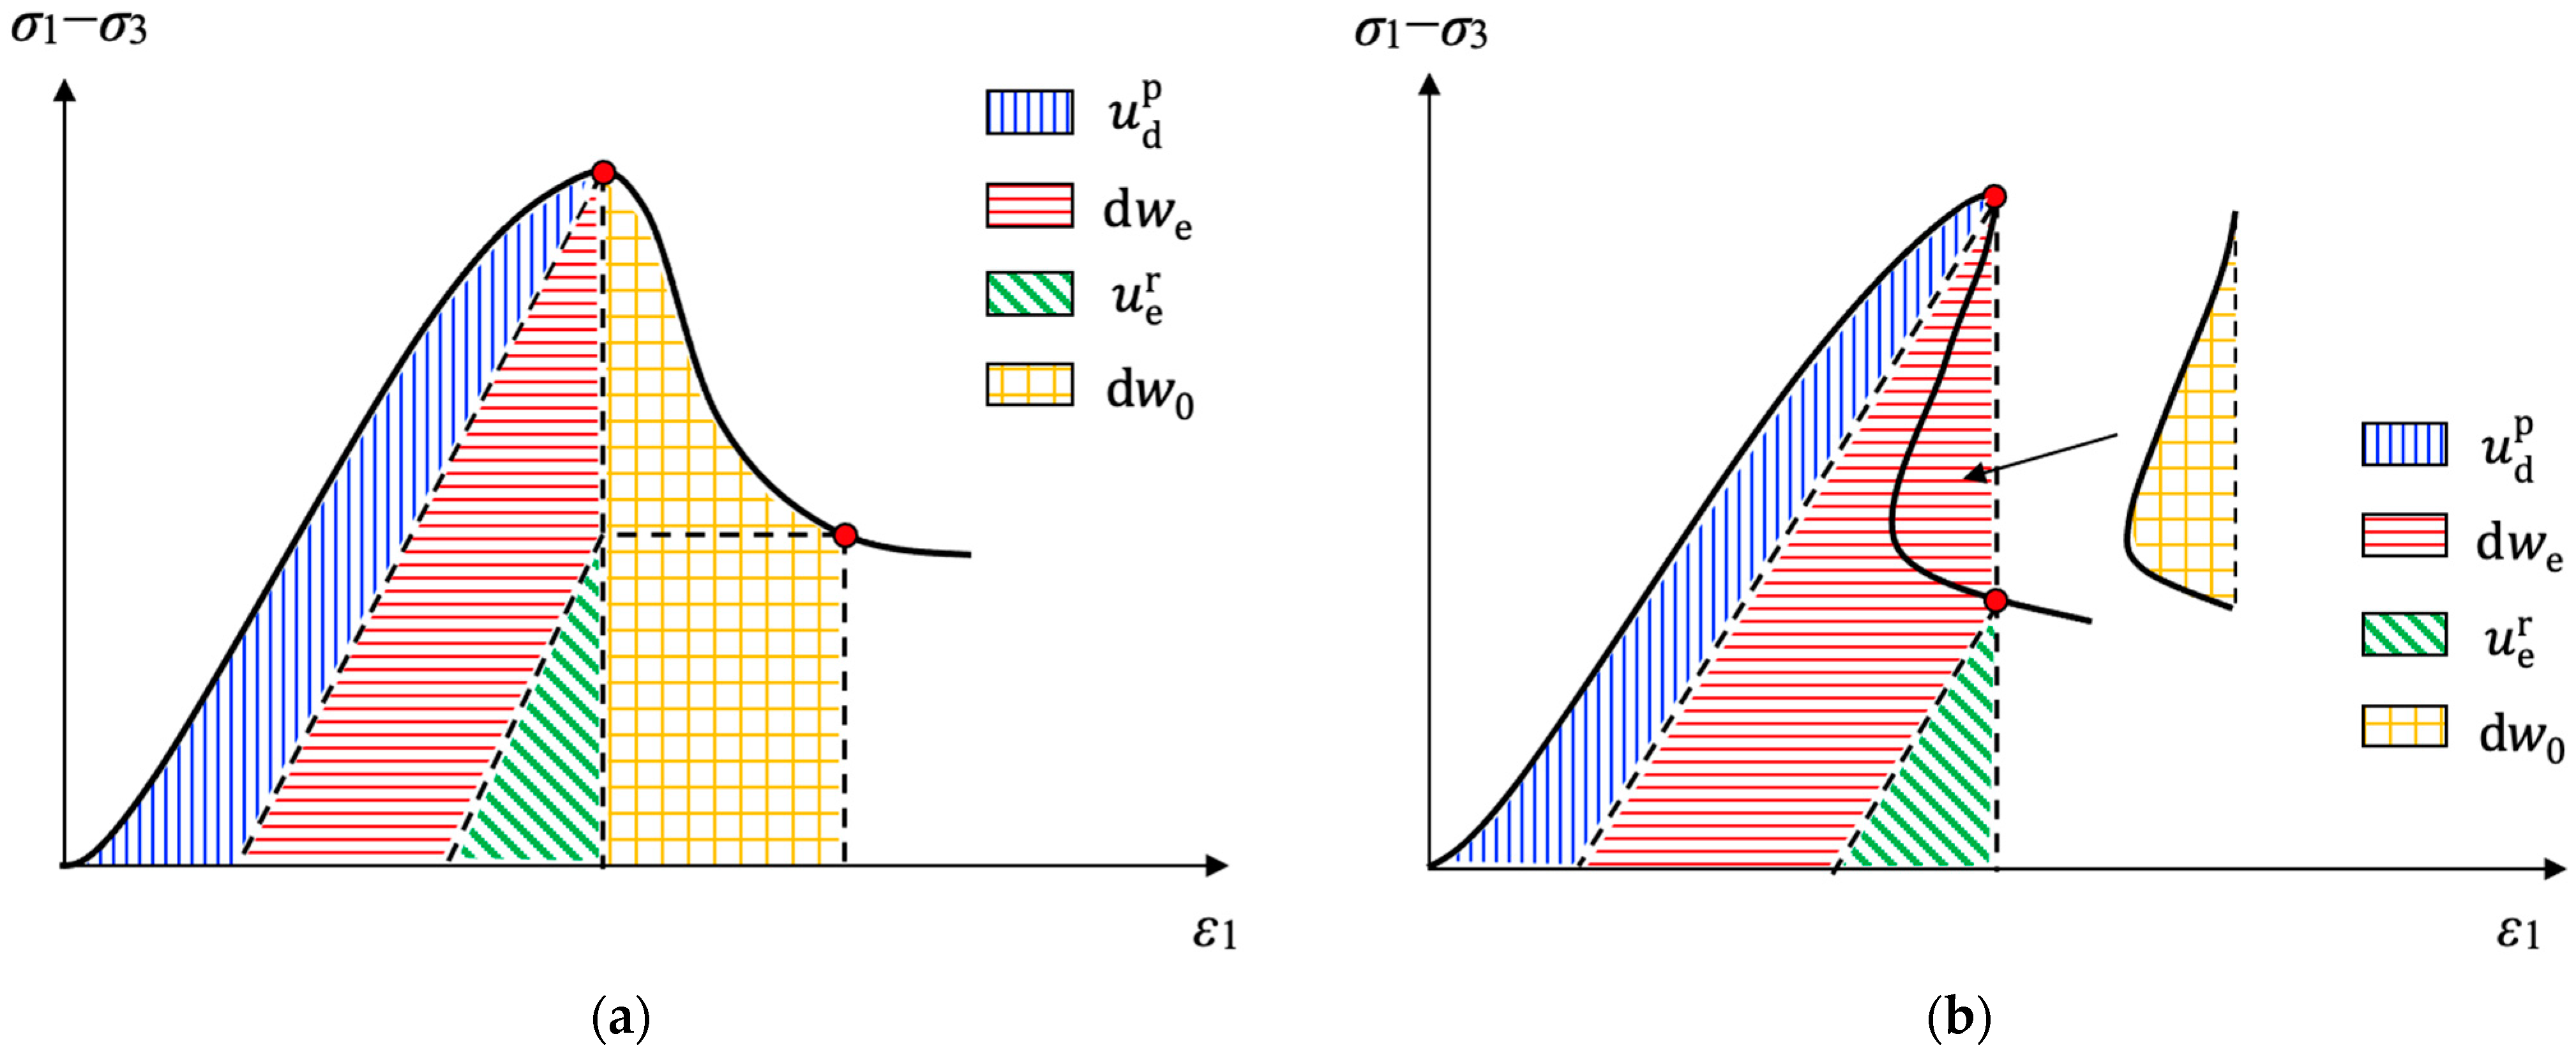
Figure 9 illustrates each portion of the strain energy for Class I and Class II rocks corresponding to the peak stress and post-peak failure processes. The blue line area represents the energy dissipated ( u d p ) due to the damage induced in the material at the peak stress. The withdrawn elastic energy ( d w e ) during the failure process is delineated by the red line area. Thus, the elastic energy at the peak stress ( u e p ) is the summation of the red line ( d w e ) and green line ( u e r ) areas (see Equation (1)). For Class I rock, as shown in Figure 9a, additional energy d w 0 , represented by the yellow grid area, is needed from the loading apparatus to assist rock failure. In contrast, for Class II rock (Figure 9b), the withdrawn elastic energy ( d w e ) is sufficient for fracturing the sample, and a certain amount of excess energy is released. In this case, d w 0 represents the released excess energy, the value of which is negative. For both types of rocks, the energy dissipated for post-peak failure (fracture energy) is d w f = d w e + d w 0 .

4.2. Energy Evolution over Complete Stress–Strain Response of the Rocks

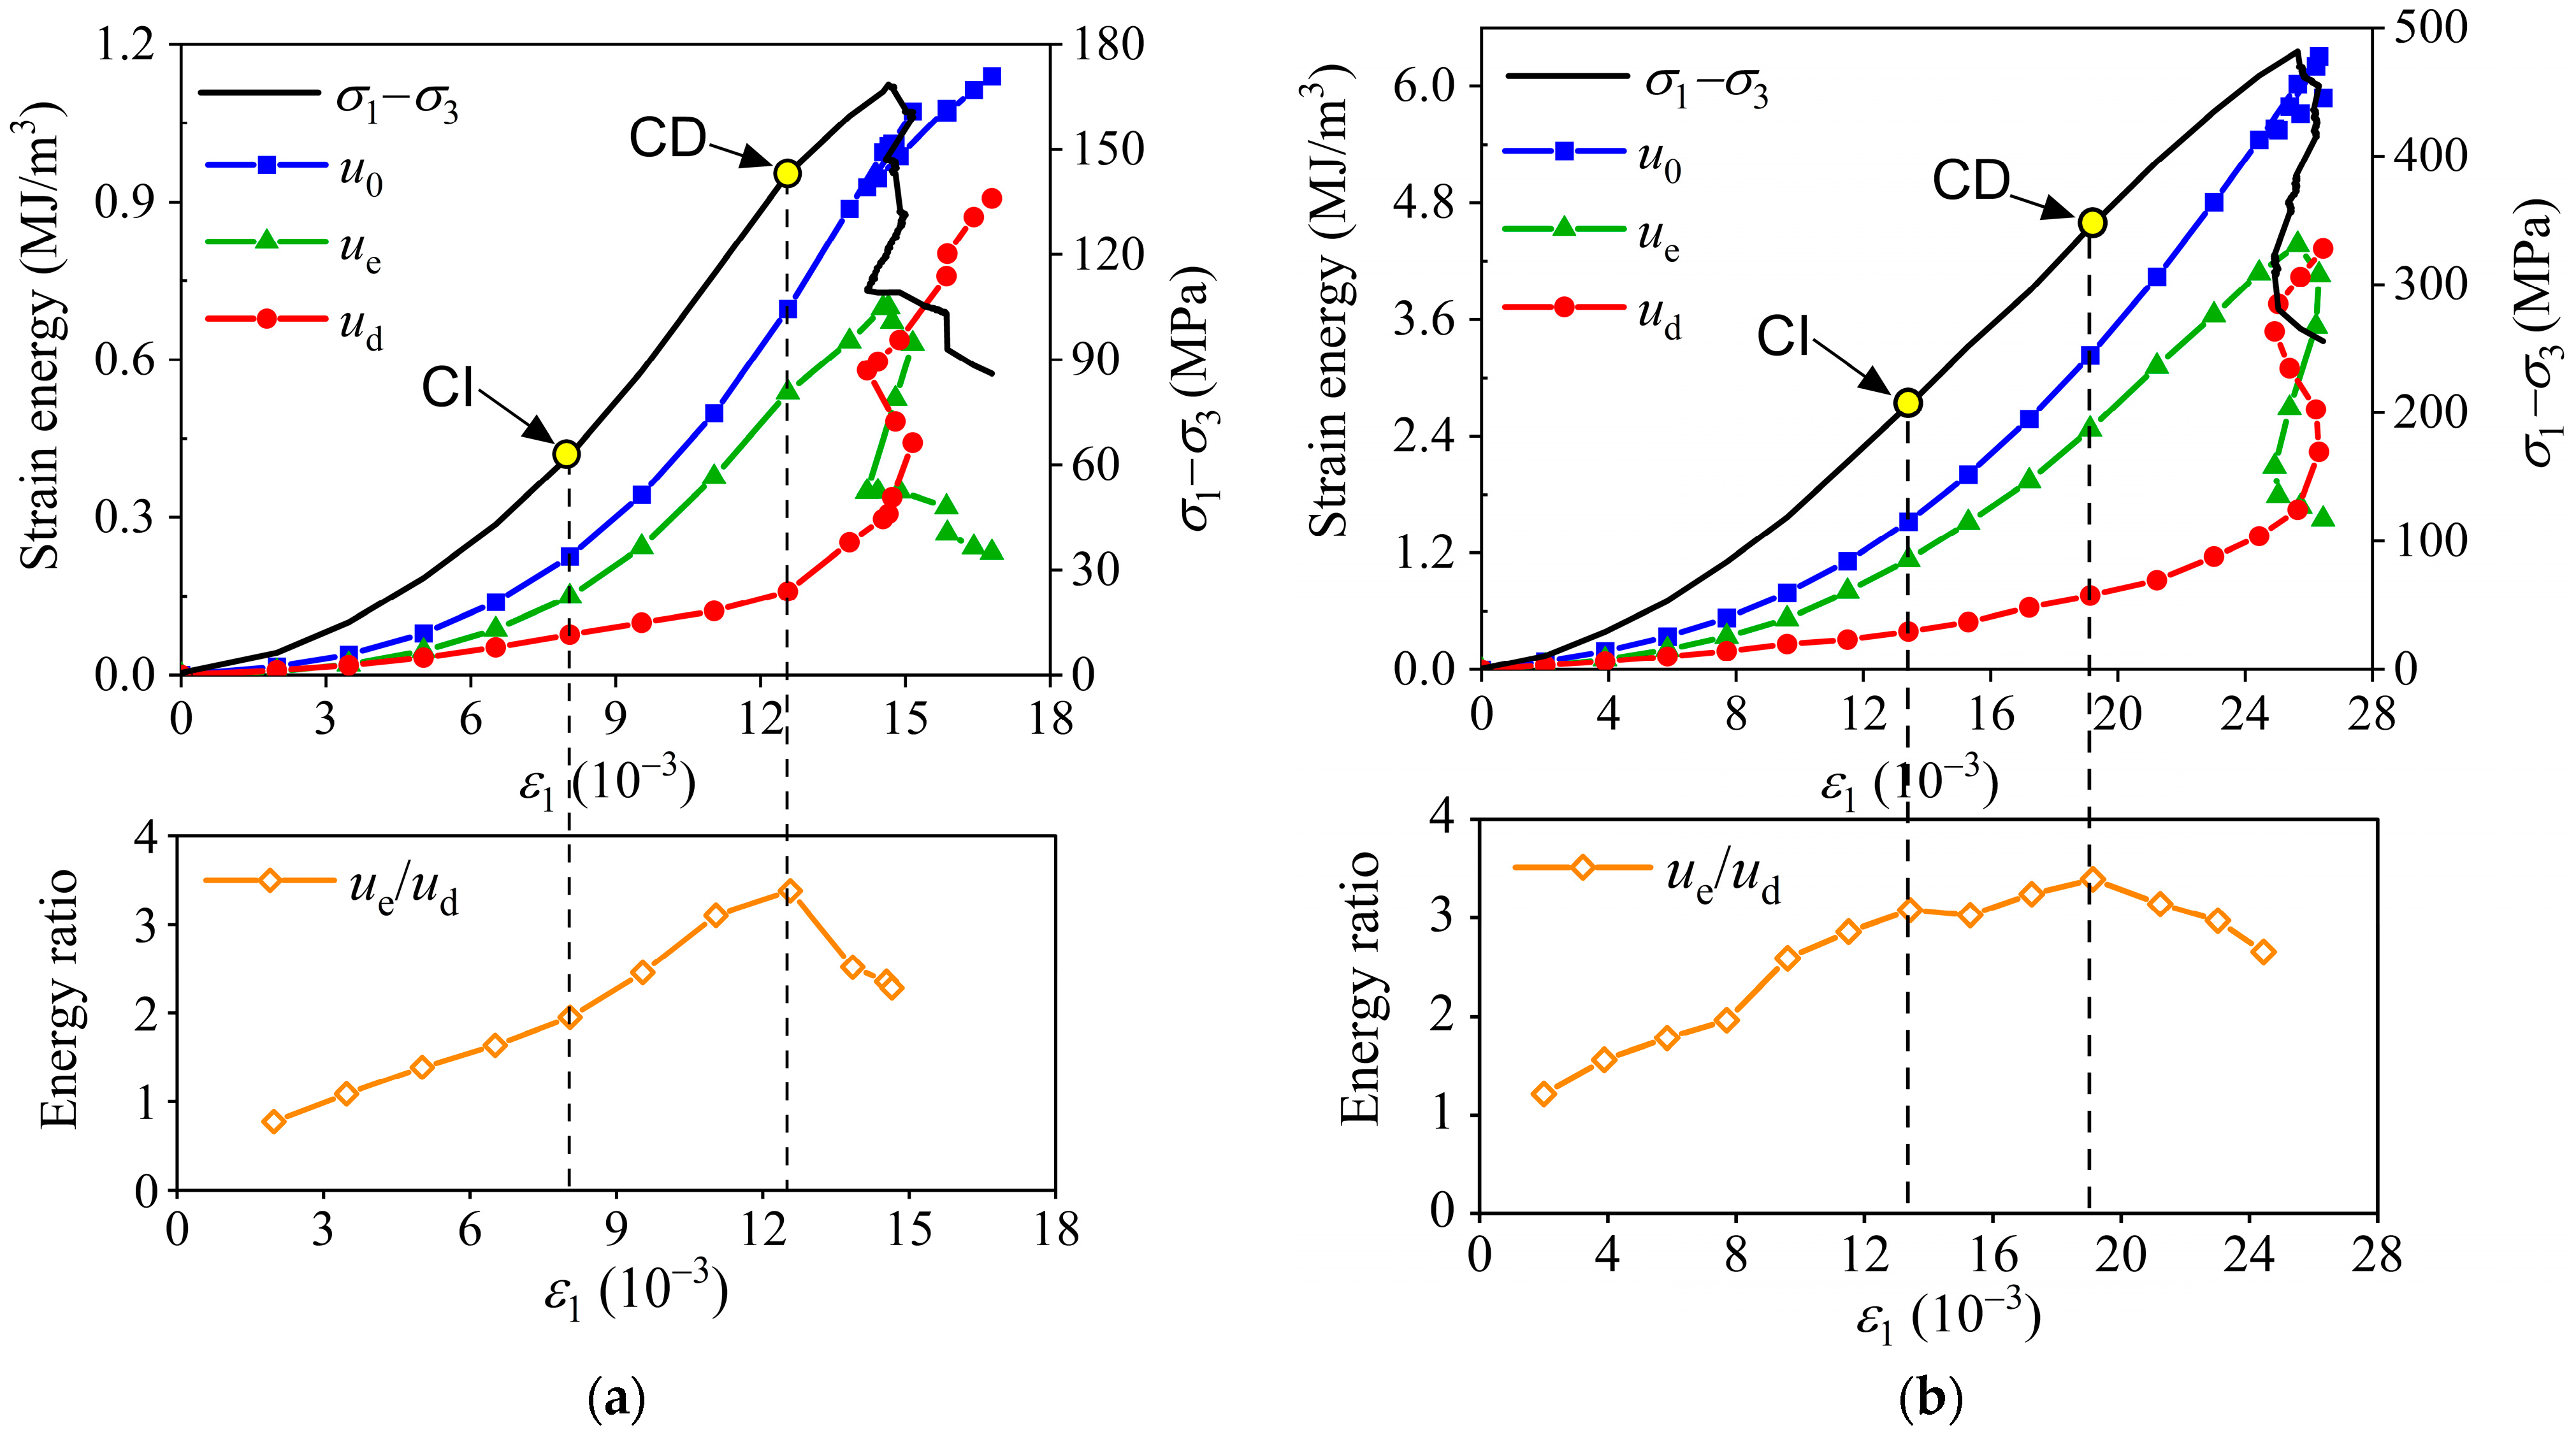
Figure 10, Figure 11, Figure 12 and Figure 13 present the stress–strain and energy evolution curves for the specimens at some representative confinements. The figures also include the evolution of the ratio of elastic energy to dissipative energy (ue/ud) (see the lower parts of Figure 10, Figure 11, Figure 12 and Figure 13).

4.2.1. Granite

Figure 10 illustrates the results for granite at σ3 = 5 and 40 MPa. It can be seen that the pre-peak energy evolution of granite is similar to that of typical brittle rocks as reported in the literature [11,12,14,16]. Energy accumulation is the major process while the dissipation of energy is insignificant. To be more specific, ue increases at a rising rate, but the growth of ud is much slower before CD (see Figure 10). This is because the damage (i.e., the coalescence and frictional sliding along the surfaces of pre-existing fractures, the initiation and propagation of new cracks, etc.) is minimal prior to CD. This is consistent with the observations in the stress–strain response. At the same time, the ratio of ue/ud increases. When CD is approached, the dissipative mechanism is activated, accounting for the unstable growth or coalescence of microcracks. Thus, a noticeable improvement appears in ud, and the peak value of ue/ud is attained. The growth of ue starts to weaken. At the peak stress, the maximum value ( u e p ) of ue is reached. For granite, the energy accumulated within the rock specimen is twice greater than that dissipated ( u e p / u d p   > 2.0). Accordingly, self-sustaining behavior ( d w e > d w f ) is seen during the post-failure process, where a large amount of ue is withdrawn (see Figure 10). Part of the energy is consumed for the formation of a major fracture and its frictional sliding, inducing a considerable increase in ud (see Figure 10). The remaining energy is released. If the circumferential control method is not applied, this part of the energy would be converted to the kinetic energy of the rock fragments, leading to the unstable failure of the specimen. Finally, the value of ue stays constant as the residual stress is attained. Under this process, extra energy is needed from external loading, which is consumed for the frictional sliding along macro-fractures. Due to the fact that granite samples behaved in a brittle regime within the applied confinements, the energy evolutions show similar trends (see Figure 10a,b).

4.2.2. Red Sandstone

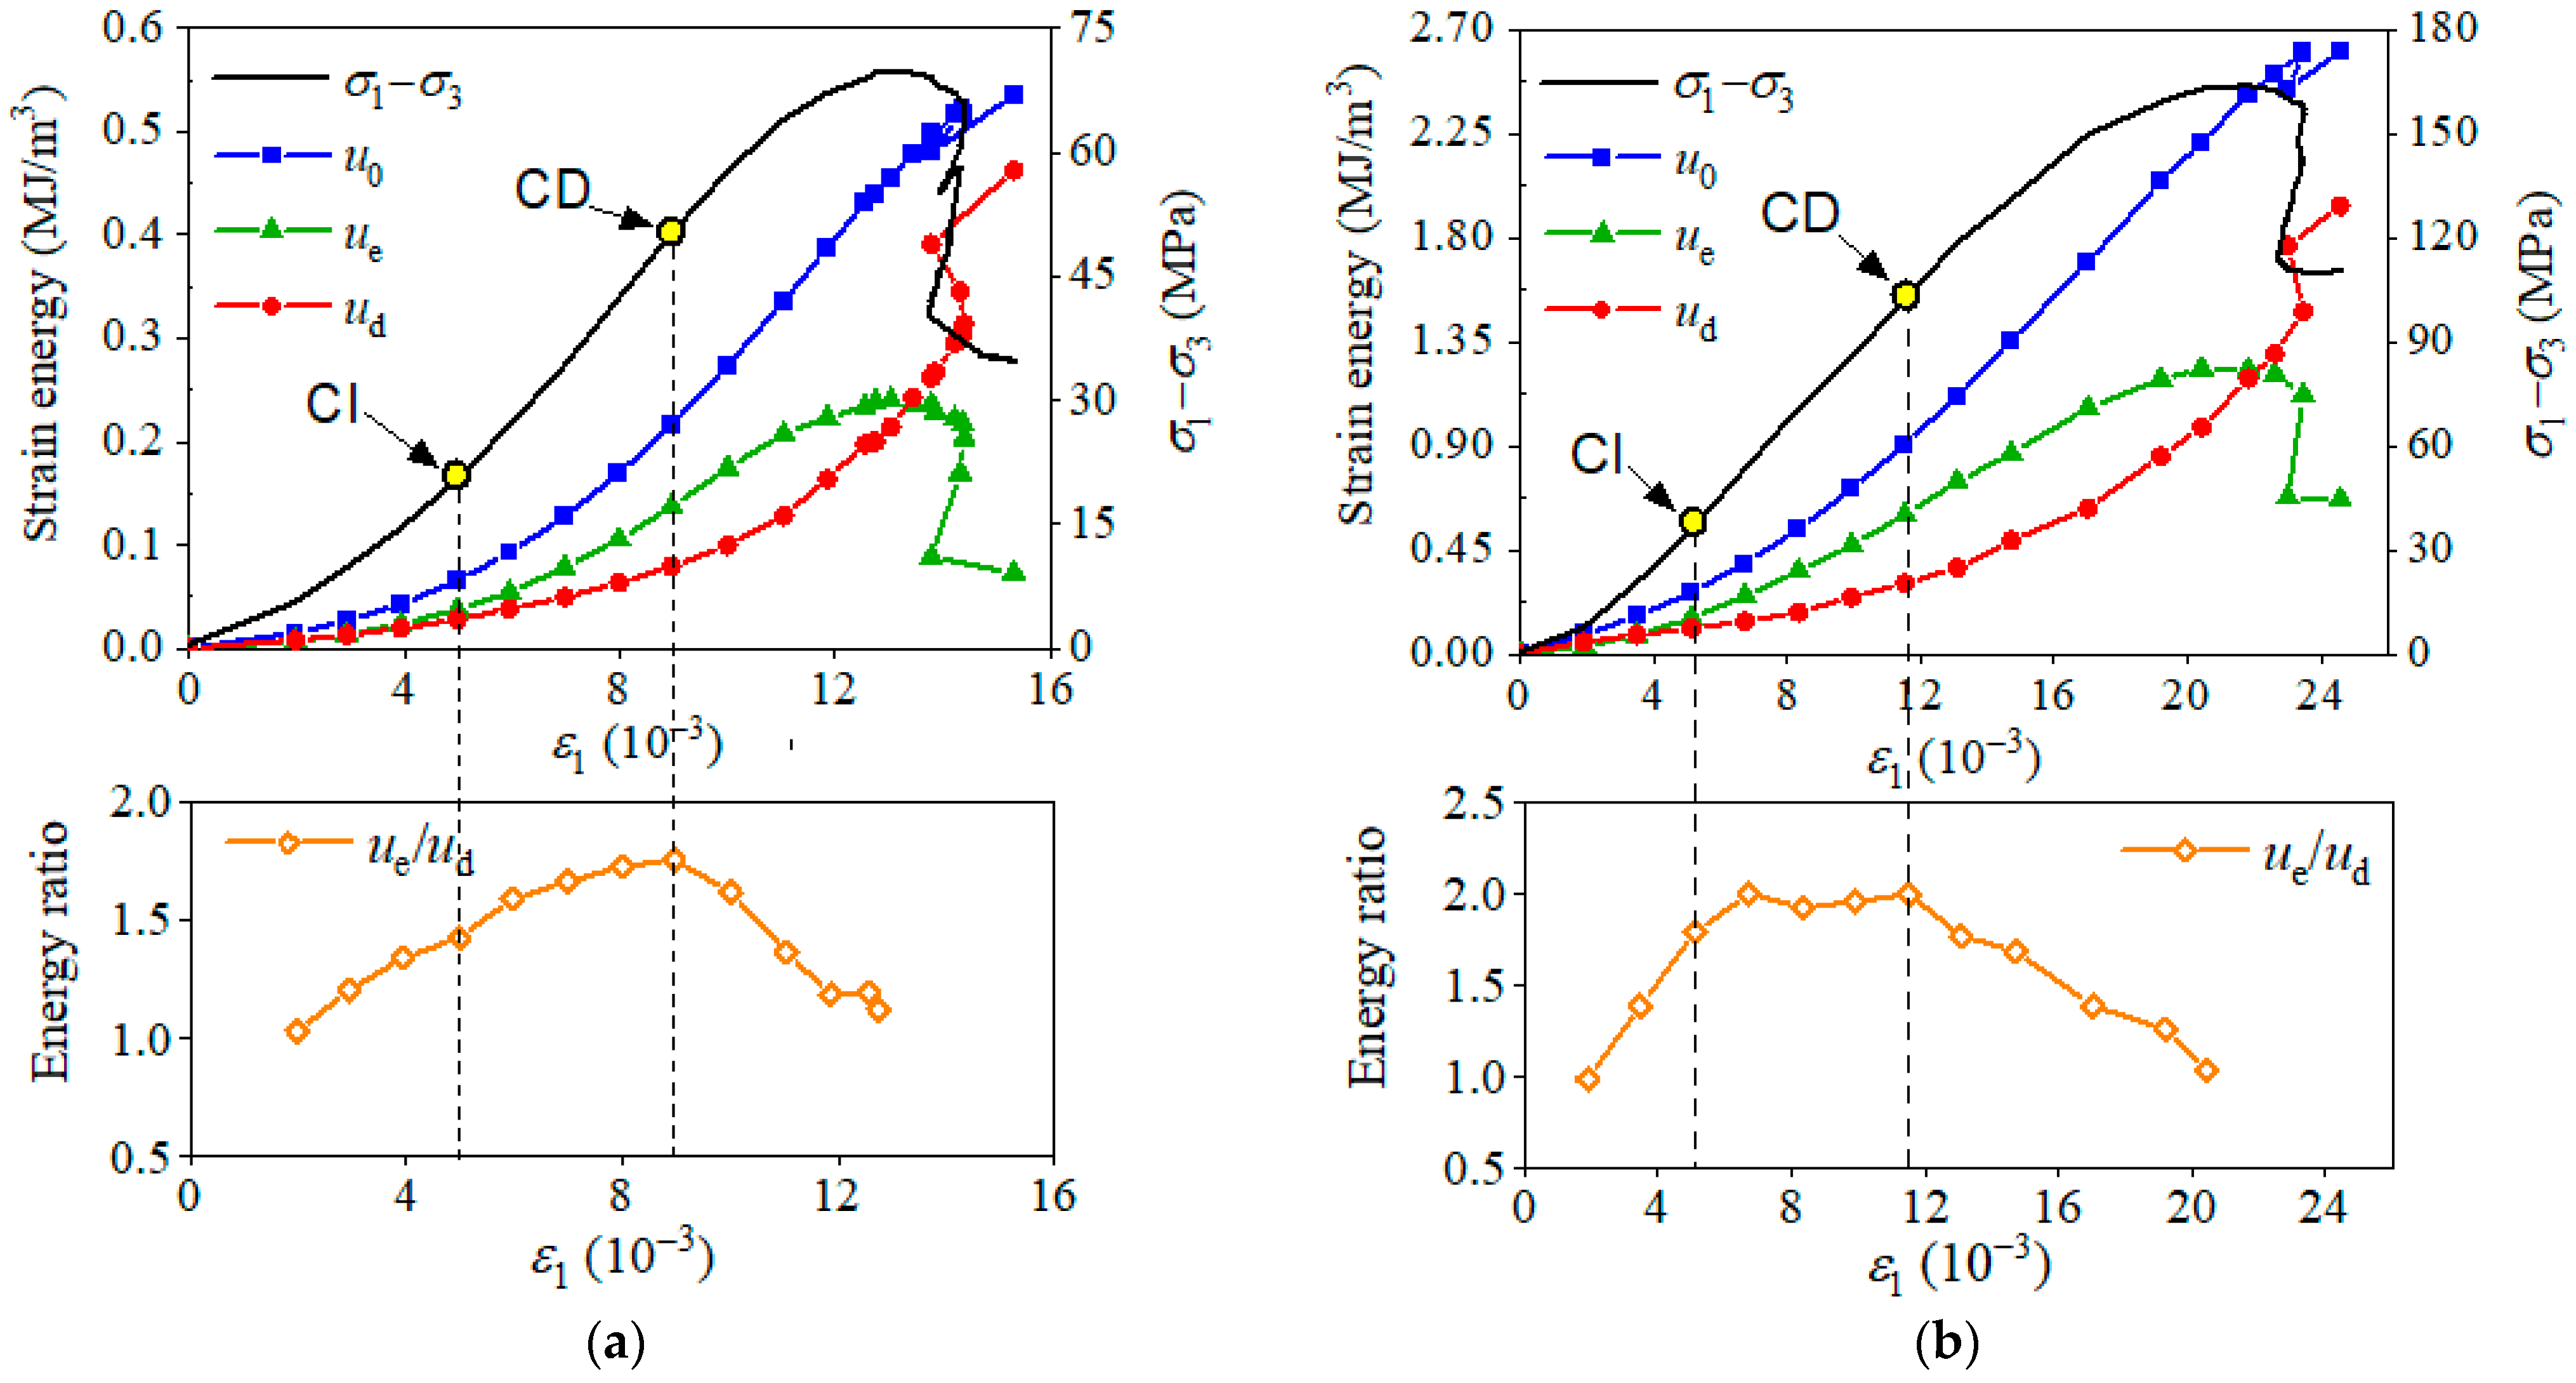
The energy evolution of red sandstone shares some common features with those of granite (see Figure 11). During the stages of elastic deformation and stable cracking, ue increases faster than ud. But the energy dissipation of the red sandstone seems to be stronger, which is manifested by the relatively higher values of ud compared to ue or the lower ue/ ud (see Figure 11). This can be caused by the more severe damage of the red sandstone samples, including pore collapse, intergranular cracking, and frictional sliding along micro-cracks. In the phase of unstable cracking (between CD and the peak stress), the values of ue and ud become comparable (see Figure 11). The value of u e p / u d p is around 1.0. All these facts denote a stronger dissipative mechanism of red sandstone, which agrees with its less brittle behavior than granite illustrated by the mechanical response. During post-peak fracturing, a certain amount of energy must be input to assist the failure process, although an amount of excess elastic energy is observed to be released afterward. The withdrawn ue is more or less equivalent to the increased ud ( d w e / d w f 1 ) during the post-failure process, which also represents a milder failure than that of granite. With respect to the effect of confining pressure, the outlines of energy evolution do not show excess differences.

4.2.3. Coal

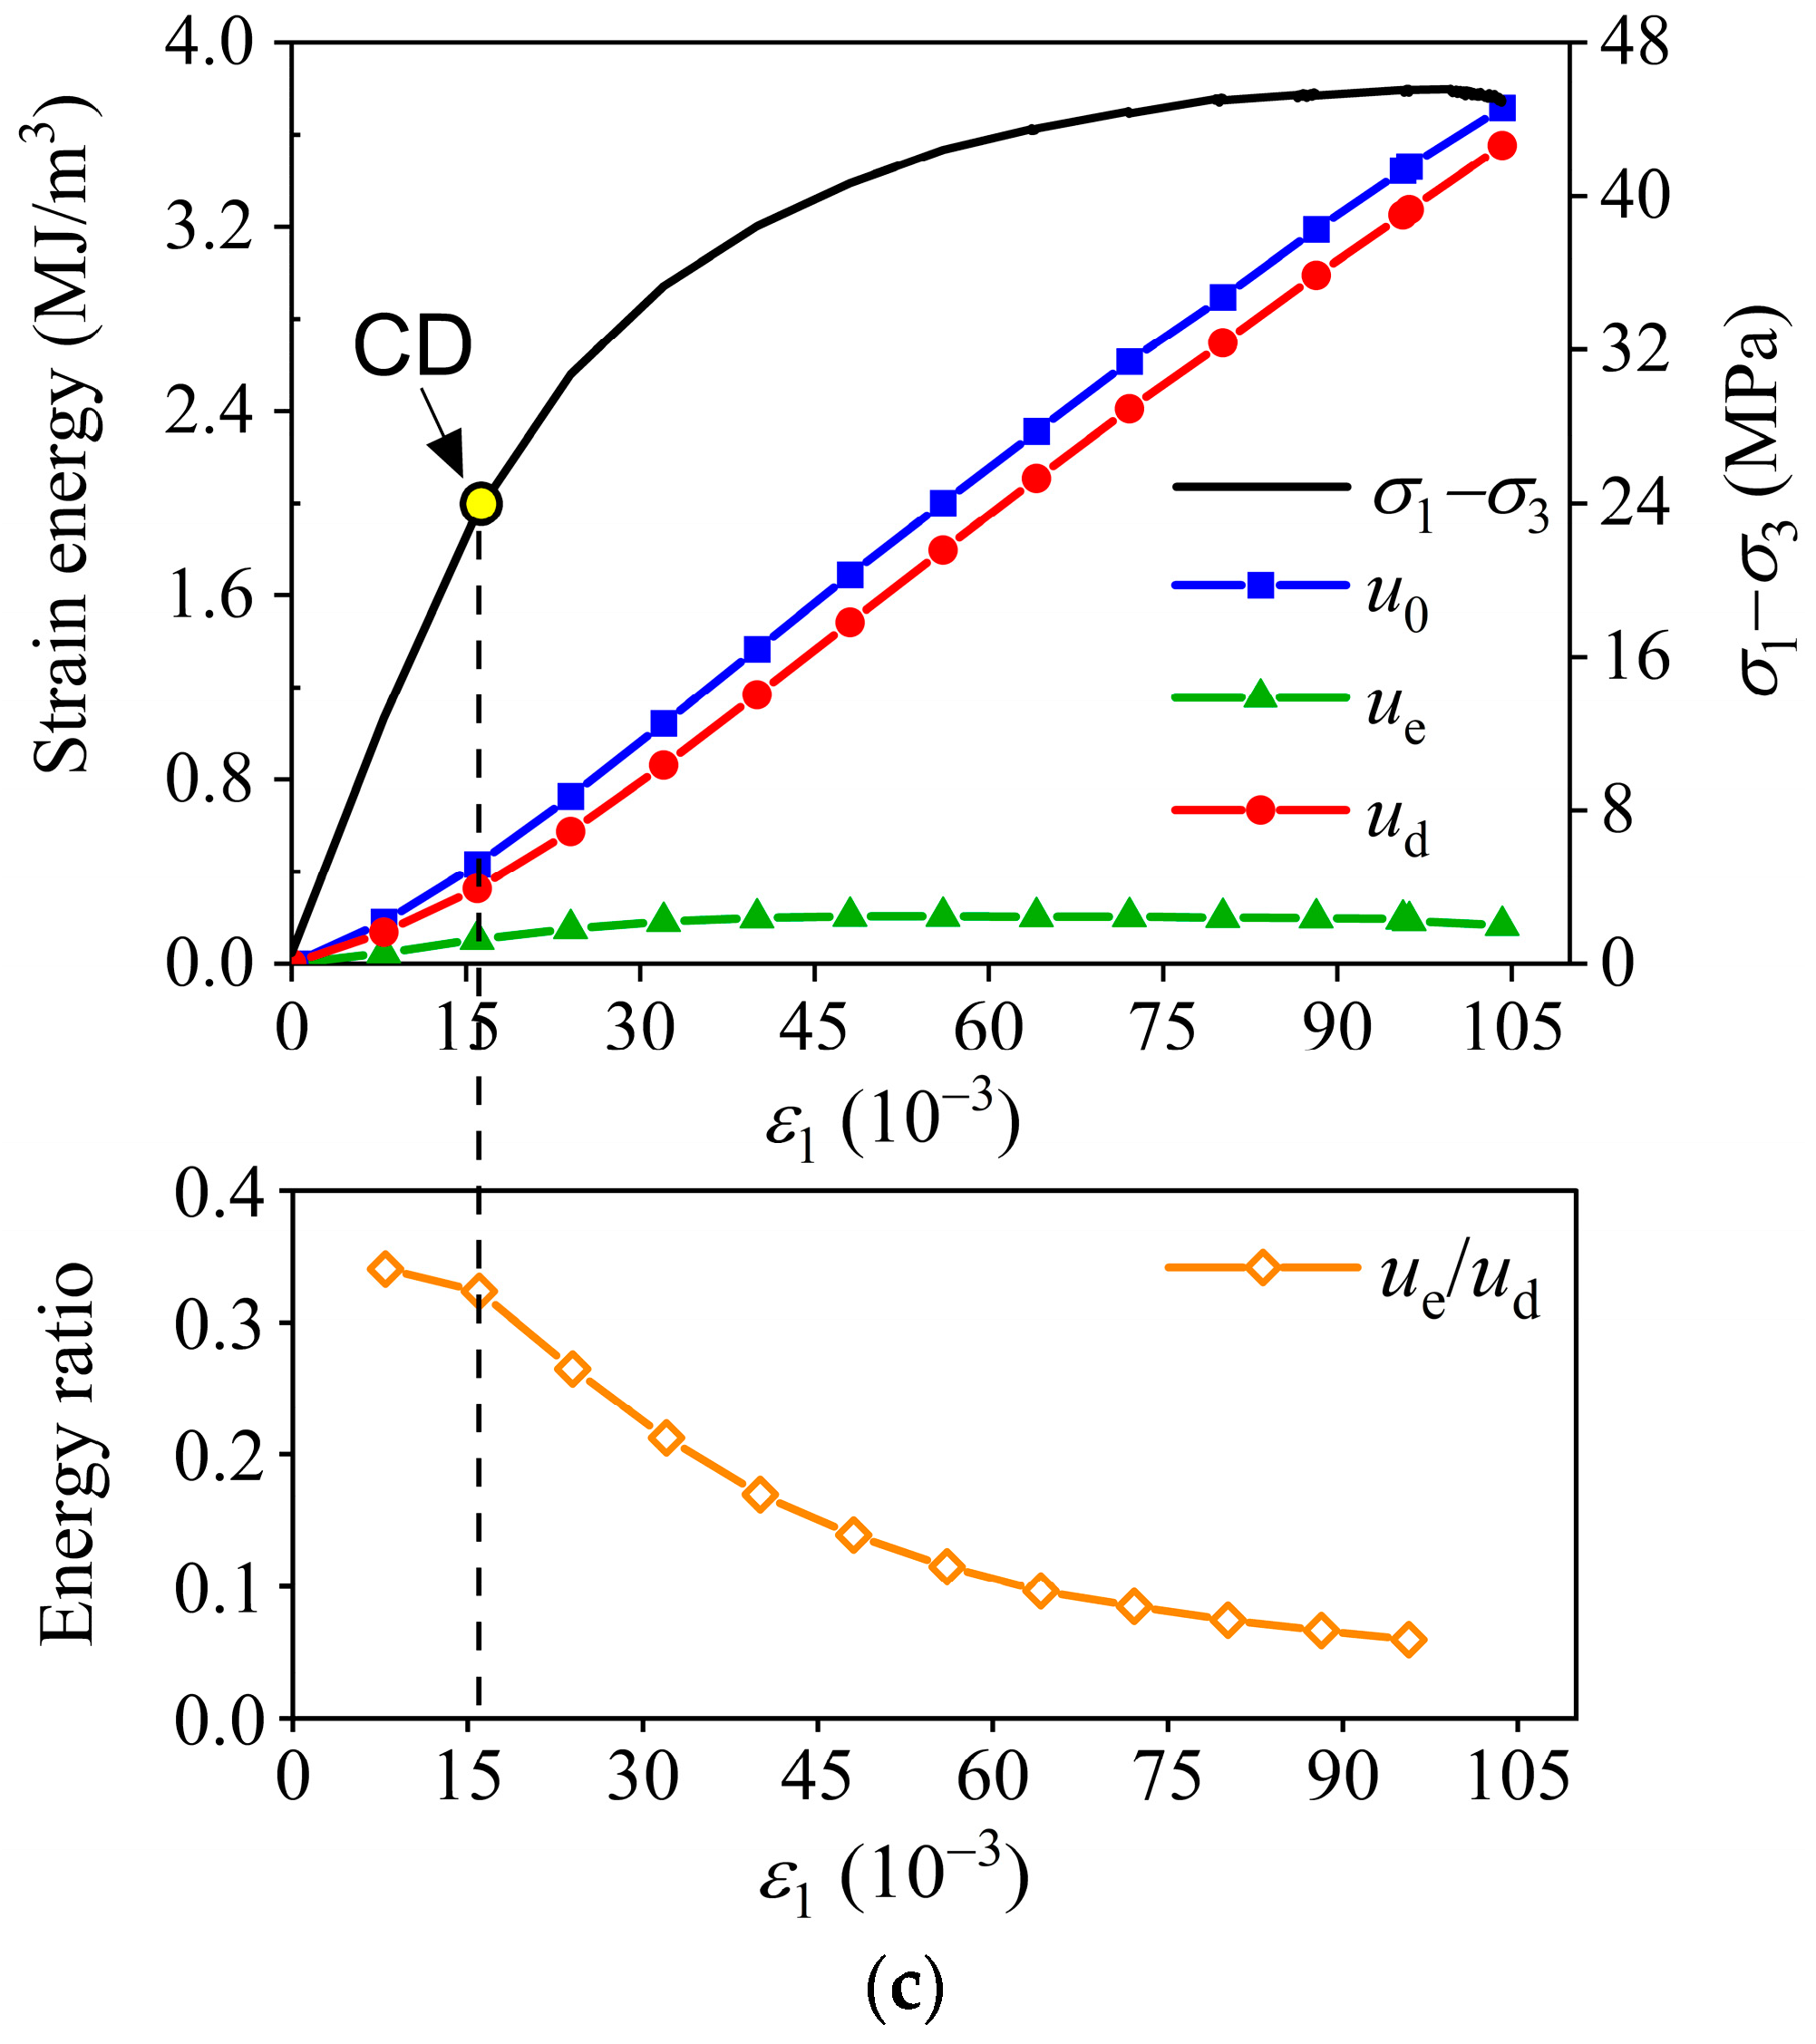
Figure 11 shows that the coal specimens display different types of energy evolution due to the wide range of confinements. At low confinements (i.e., 2 MPa in Figure 11a), the rock exhibits similar energy evolution to that of granite, that is, the accumulation of elastic energy is predominant in the pre-peak region. The values of ue increase at a relatively high rate until the maximum value is achieved at the peak stress. At the peak stress, the value of u e p / u d p is around 3.5, corresponding to a high ability for energy storage. Correspondingly, an incredible amount of ue is withdrawn after the peak with the release of excess elastic energy. At an intermediate pressure of 20 MPa (Figure 12b), the mechanism of energy dissipation is strengthened, analogous to that of the red sandstone (see Figure 12). The value of u e p / u d p decreases to 1.0 (Figure 12b). At σ3 = 40 MPa, where the brittle–ductile transition is believed to occur, the energy dissipation is further intensified (see Figure 12c). The value of ue is markedly surpassed by that of ud, and a fairly low value of u e p / u d p (around 0.3) is obtained.

4.2.4. Mudstone Samples

For mudstone samples, the values of ud always exceed those of ue under all confinements, and the difference is aggravated as the confining pressure increases (see Figure 13). This indicates that the deformation of mudstone is governed by the mechanism of dissipation. Even at a low pressure of 2 MPa, where a relatively brittle mechanical behavior is presented, ud is higher than ue from the beginning of differential loading (see Figure 13a). The SEM results showed that the micro-scale damage inside the samples for σ3 ≥ 2 MPa is characterized by considerable pore collapse and grain crushing. This agrees with the observations of Desbois et al. [32]. They found that although brittle shear fracturing with an obvious stress drop after peak stress was observed for Callovo-Oxfordian clay under the pressures of 2 MPa and 10 MPa, micro-mechanically, the cataclastic was the major deformation mechanism. Therefore, the stored ue is insignificant to ud, and almost no elastic energy is released after the peak (see Figure 13).

4.2.5. Three Types of Energy Evolution

The values of the energy parameters of the rock samples are provided in Table 3. Based on the results, the energy evolution of rocks can be classified into three groups.
For rocks that show high brittleness, such as confined granite and low-confined (0–10 MPa) coal specimens, Type I energy evolution is presented. It is characterized by the accumulation of elastic energy at the pre-peak stage (see Figure 9 and Figure 11a). In particular, the value of u e p is much greater than u d p (i.e., u e p / u d p > 2.0). In this situation, the release of post-peak elastic energy is termed as strong, that is, d w e > d w f (corresponding to Class II or self-sustaining behavior).
For rocks with less brittleness, i.e., confined red sandstone and medium-confined (20–30 MPa) coal samples, Type II energy evolution is shown (see Table 3). Energy accumulation and energy dissipation are two competitive processes at the pre-peak stage (0.5 < u e p / u d p < 2.0), and the post-peak failure is accompanied by the weak release of elastic energy ( d w e d w f ).
If the mechanical behavior of rocks is in the regimes of brittle–ductile transition to ductility or the rock micromechanically fails in the cataclastic flow to plasticity (i.e., confined mudstone and 40 MPa-confined coal samples), the rock exhibits Type III energy evolution. For these rocks, energy dissipation is the major process during the deformation and failure processes, and the released elastic energy after the peak is less than the fracture energy ( d w e / d w f 0 ).

4.3. Energy Storage and Dissipation of the Rocks

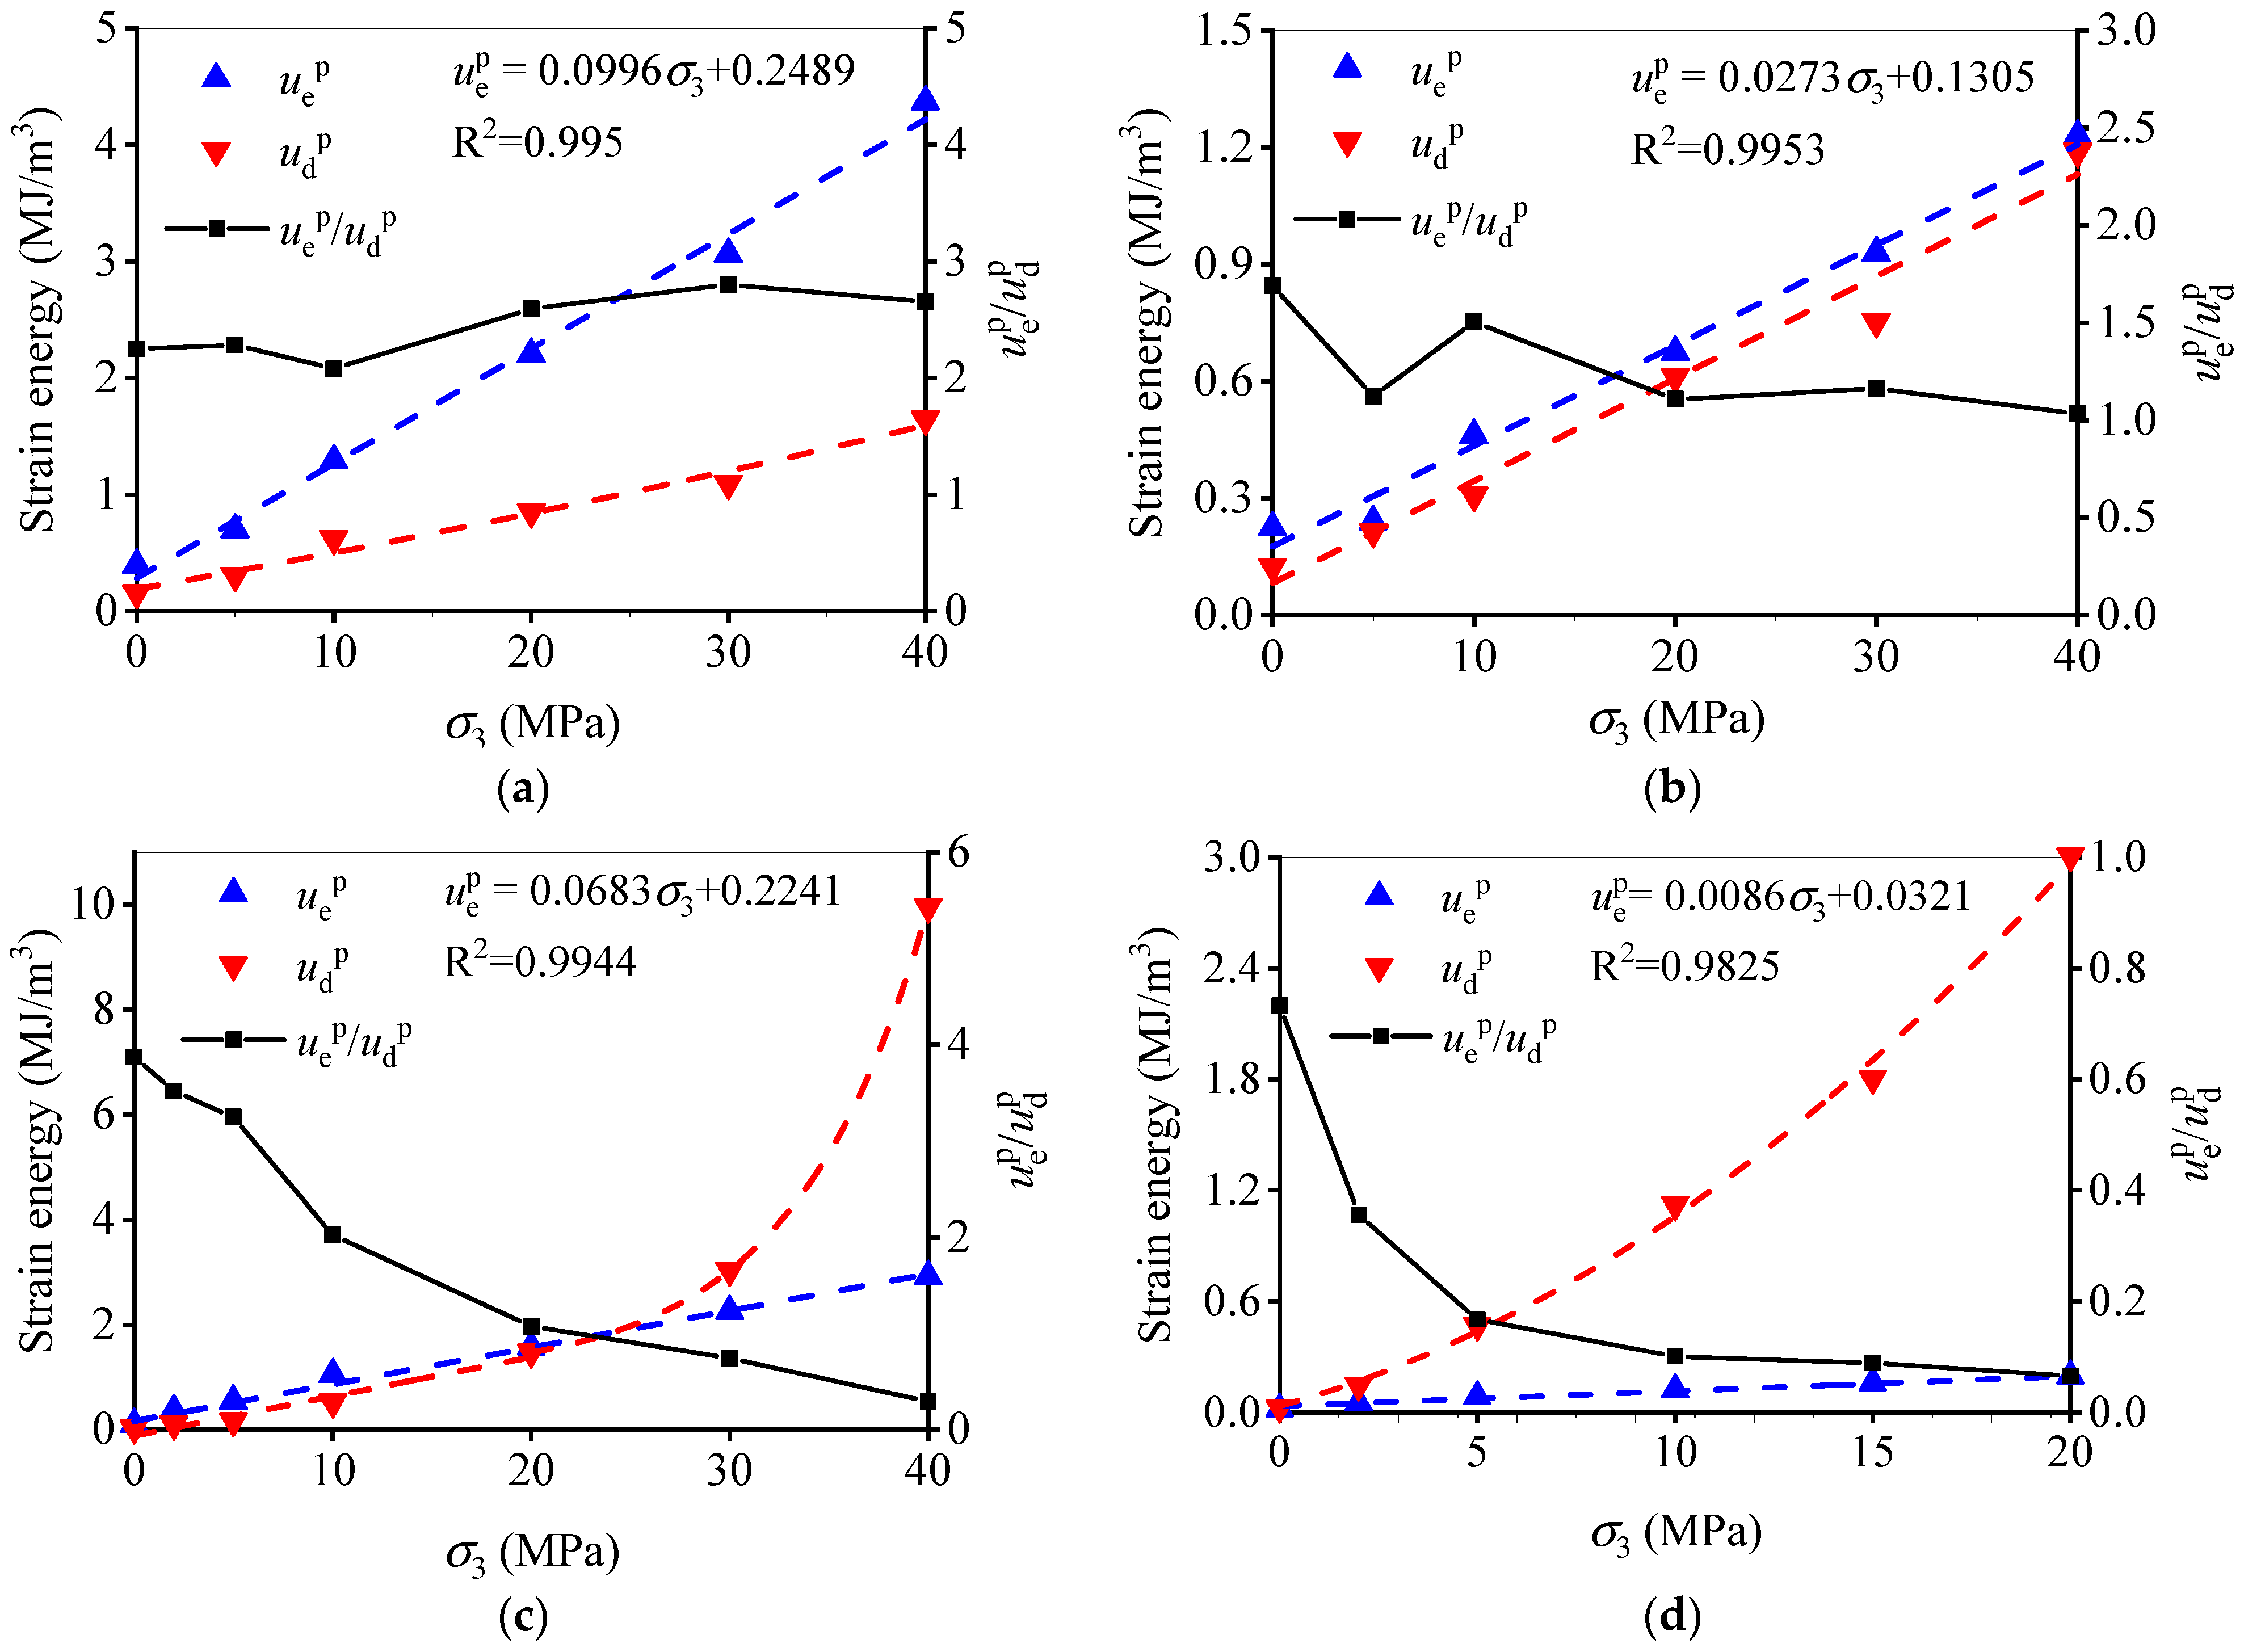
Figure 14 shows the variations in u e p and u d p versus the confining pressure for rocks. Linear relations appear between the energy storage limit ( u e p ) and the confining pressure for all rock types, and the equations of the fitted curves are provided (see Figure 14a–d). It can be seen that the enhancement effect of the confining pressure on u e p is the largest for the granite (with the greatest slope), but the lowest for the mudstone. For instance, the values of u e p for the granite, red sandstone, and coal are improved from 0.70 MJ/m3, 0.24 MJ/m3, and 0.55 MJ/m3 at σ3 = 5 MPa to 4.37 MJ/m3, 1.23 MJ/m3, and 2.93 MJ/m3 at σ3 = 40 MPa, respectively; the value of u e p for the mudstone is improved from 0.05 MJ/m3 at σ3 = 5 MPa to 0.20 MJ/m3 at σ3 = 20 MPa. Since the linear variation of u e p with σ3 is applicable to all rock types, it is believed to be an intrinsic property of the rock. A universal failure criterion can probably be proposed based on this linear relationship. Also, it is an important property of rocks due to the fact that it forms the source of rock failure.
The variations in u d p with increasing σ3 are not consistent for the rocks. It can be seen that u d p increases linearly with σ3 for granite and red sandstone (see Figure 14a,b). For coal, u d p improves linearly at low to intermediate pressures, but an accelerating growth in u d p is seen at σ3 ≥ 30 MPa (see Figure 14c). For mudstone samples, a nonlinear increase in u d p with σ3 seems to appear at σ3 ≥ 5 MPa (see Figure 14d). It can be recalled that the failure of granite, red sandstone, and low- to medium-confined coal samples is brittle fracturing. In contrast, the coal shows semi-brittle behavior at a pressure of 40 MPa, where the cataclastic mechanism of deformation occurs. Under this condition, a large amount of energy is needed for pervasive micro-cracking, frictional sliding along micro-cracks, etc. For mudstone samples, although the cataclastic flow is observed at σ3 = 2 MPa, the occurrence of brittle–ductile transition is observed at a pressure of 10 MPa. In other words, the mechanism of deformation somehow changes at σ3 = 10 MPa. Probably, the growth of microcracks was speeded up, or plastic deformation was involved, either of which will result in an accelerated consumption of energy. Since the nonlinear growth of u d p with increasing σ3 corresponds to a change in the deformation mechanism (Figure 14c,d), it can serve as an indicator of the brittle–ductile transition of the rock.
The ratio u e p / u d p can be used as an indicator of rock property (i.e., rock brittleness), and the variations in u e p / u d p versus σ3 are plotted in Figure 14. For granite and red sandstone, the values of u e p / u d p at all confinements are more or less constant, with a few fluctuations (see the black lines in Figure 14a,b). This indicates that the brittleness of the rock specimens did not change too much due to the application of the confinement. A high ratio ( u e p / u d p ) between 2.0 and 3.0 can be observed for granite, while that of red sandstone is within 1.0–2.0, implying a higher brittleness of the former rock. For the coal and mudstone samples (see Figure 14c,d), the ratio of u e p / u d p decreases distinctly with increasing σ3, which means that rock brittleness was reduced to a great degree. In particular, the strong brittleness of coal samples at low confinements (i.e., 0–10 MPa) can be identified by the very high values of u e p / u d p (>3.0). The ductile behavior is characterized by the low values of u e p / u d p (<0.3) for coal at σ3 = 40 MPa and mudstone at σ3 > 5 MPa. These results agree well with the mechanical behavior.

4.4. Post-Peak Energy Release and the Degree of Failure Intensity

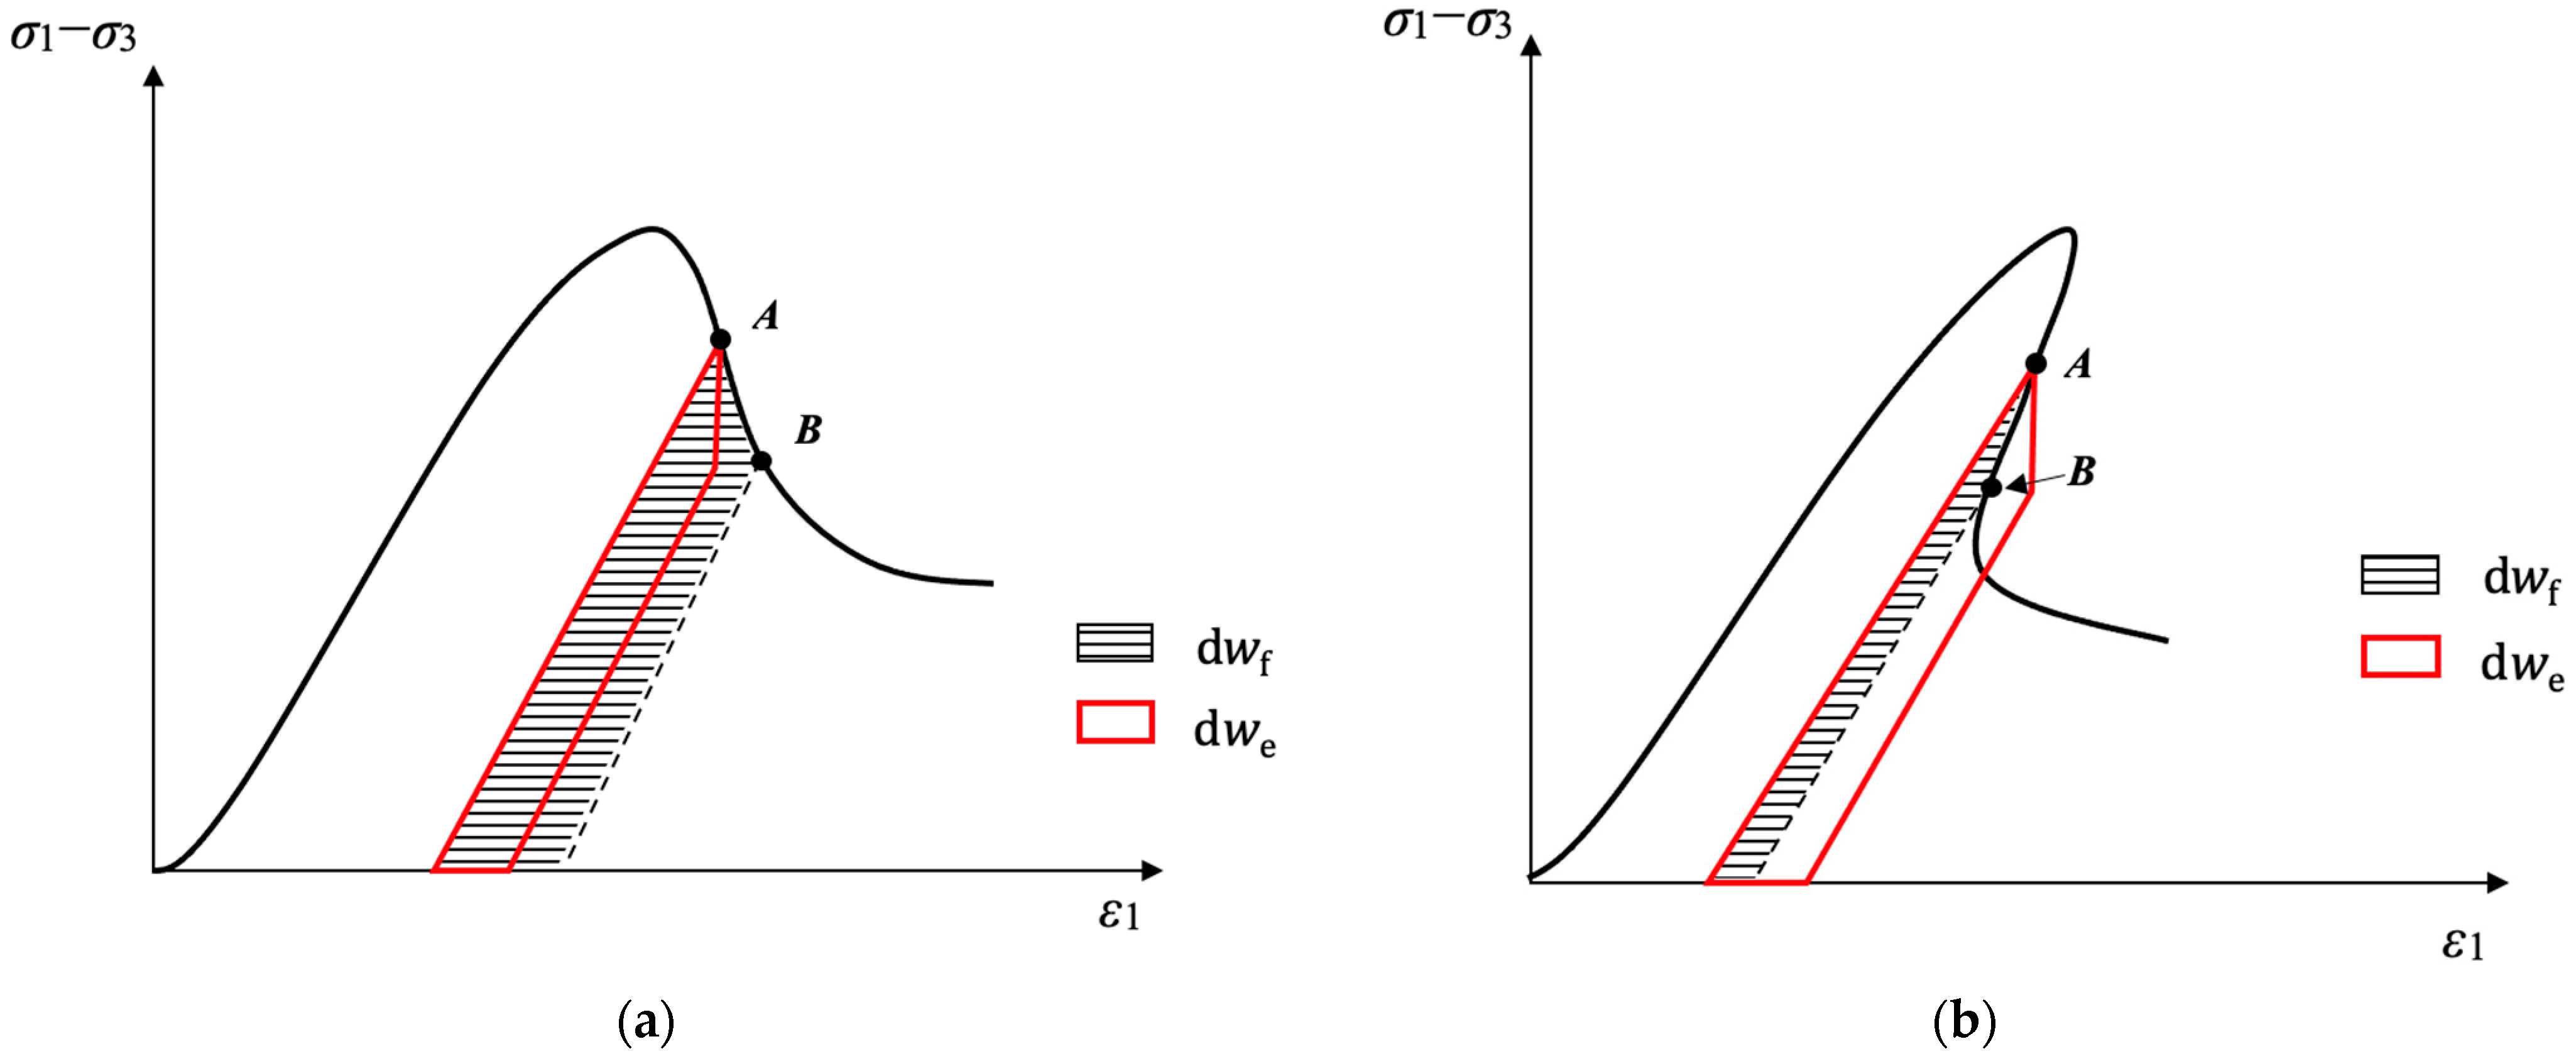
Based on the results presented above, the difference between the withdrawn elastic energy during rock failure and the fracture energy can characterize the degree of stability of rock failure. For Class II rocks, the elastic energy is sufficient for post-peak fracturing, and the existence of excess energy makes the failure process unstable. The greater the difference between the withdrawn elastic energy and fracture energy, the more violent the failure. On the other hand, the withdrawn elastic energy of Class I rock is less than the high amount of fracture energy, and thus the failure process becomes stable. Hence, the ratio of local d w e to d w f is used to depict the stability of the post-peak fracturing process. As shown in Figure 15, the local d w e and d w f between two points on the post-peak curve are represented by the areas delineated by the red and black lines, respectively. In the current study, A and B are two adjacent unloading points on the post-peak curve.
The evolution of d w e / d w f and stress degradation during the post-peak failure process of the rocks are presented in Figure 16. The x-axis represents the load–unload cycle number (i) at the post-peak stage (i = 0 corresponds to the peak stress). It can be seen that the stored elastic energy starts to be released after the peak stress ( d w e / d w f < 0 ). As plotted in Figure 16a, the stress drop for granite is gentle right after the peak stress (i = 0–2), and it corresponds to the Class I curve. During this stage, stable crack propagation or coalescence is the major mechanism. The amount of d w e is less than that of d w f , resulting in 1 < d w e / d w f < 0 . At the stage between i = 2 and 3, a greater stress drop is seen, and this process is accompanied by the distinct value of d w e / d w f = 2.6 , representing unstable fracturing. In fact, the Class II stress–strain curve is shown at this stage. In the successive stage, the stress drop is more significant, and a value of d w e / d w f = 1.82 is attained. It can be deduced that a major fracture is formed during the two stages. After that, the stress stabilizes, and the value of d w e / d w f is around 0. For the red sandstone (Figure 16b), the post-peak fracturing becomes less intense. Stable cracking or coalescence of fractures ( 1 < d w e / d w f < 0 ) continues until the seventh load–unload cycle is completed. After that, unstable local fracturing ( d w e / d w f = 1.77 ) is observed at the stage between i = 7 and 8 (see Figure 16b). Also, this corresponds to the formation of a major fracture. For coal at σ3 = 2 MPa (see Figure 16c), the fracturing process seems to be extremely unstable, with the values of d w e / d w f equal to −2.32 and −6.05 right after the peak stress. In contrast, the fracturing process of the unconfined mudstone is the most stable, with the values of d w e / d w f greater than −1.0 during the whole post-peak stage (see Figure 16d).
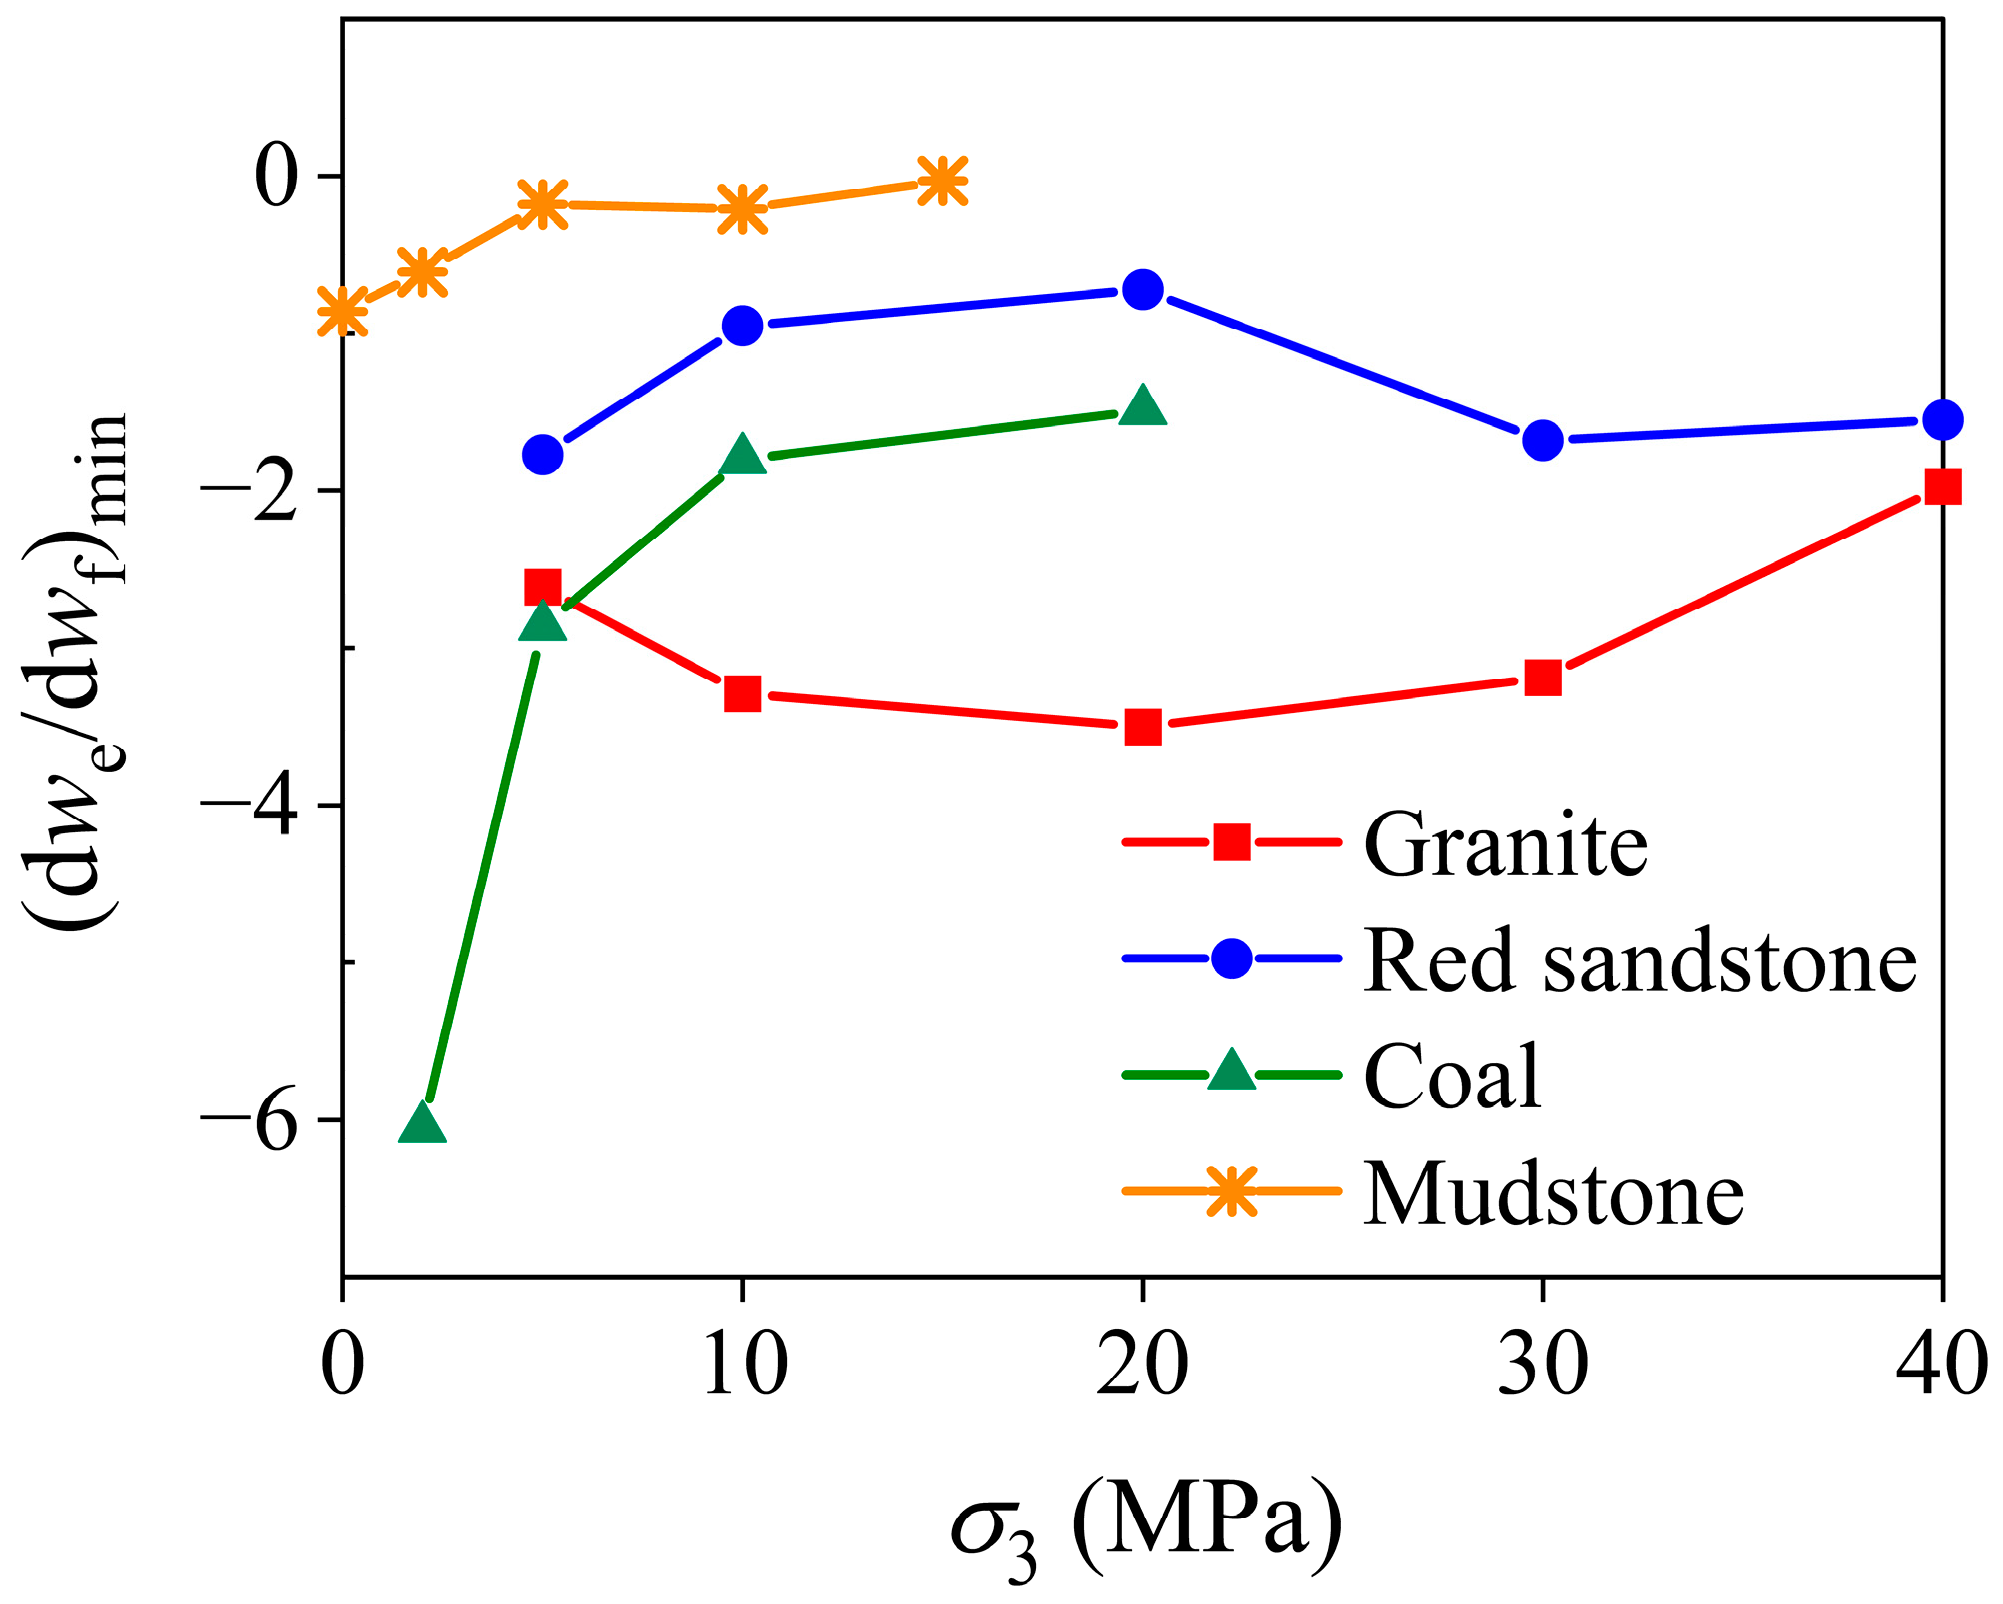
Since the minimum value of d w e / d w f during the failure process corresponds to the formation of the major fracture, it can be used as an indicator, defined as FI ( F I = ( d w e / d w f ) min ), to quantify the failure intensity of the rock specimen. Figure 17 illustrates the variations in FI with σ3 for the tested rock samples. According to the availability of excess energy, the failure of the rock can be classified as stable ( F I > 1 ) or unstable ( F I < 1 ). This shows that the mudstone samples and red sandstone samples at σ3 = 10 and 20 MPa show stable failure. Moreover, the failure of the former rock samples is more stable since the higher values of FI are obtained (see yellow results in Figure 17). The failure of the red sandstone samples at σ3 = 5, 30, and 40 MPa shows a certain degree of instability ( 1.8 < F I < 1 ), which corresponds to the mixed Class I and Class II curves. For granite, the values of F I are within the range of −4.0~−2.0, indicating a high degree of failure intensity of the sample. The most violent failure, manifested by the lowest F I of −6.05, occurs in the coal sample at σ3 = 2 MPa.
In general, the failure intensity of coal and mudstone was suppressed by the confining pressure, and the effect of the confining pressure is more distinct for the former rock. For granite and red sandstone, the variation in failure intensity with increasing confinement is not monotonic. A higher degree of failure intensity can be observed for red sandstone at σ3 = 30 and 40 MPa and for granite at σ3 = 30 MPa. The results are in good agreement with the mechanical behavior and pre-peak energy conversion of the rocks.

5. Discussion

In deep underground construction, the rock suffers from high in situ stress, and a high amount of elastic energy is stored inside the rock, forming the source of rock failure. This agrees with the results that the energy storage limit of the rocks is linearly improved by the confining pressure.
If the rock is very brittle (i.e., exhibits Type I energy evolution), the stored energy ( u e p ) is much higher than that dissipated ( u d p ) during rock deformation. Accordingly, the withdrawn elastic energy during the failure process is greater than that dissipated during fracturing ( d w e > d w f ), leading to unstable rock failure. Nevertheless, the results also showed that the dissipated energy due to fracturing rises. It may correspond to the general sense that rock brittleness decreases as the confining pressure increases, which seems to be contradictory to the phenomenon that unstable rock failures occur more frequently and violently at greater depths. In fact, the results of this study showed that the brittleness of granite did not reduce monotonically as the confining pressure increased. Instead, slight embrittlement was observed at σ3 = 20 and 30 MPa. The failure intensity was also high for these samples. This indicates that the brittle nature of the rock is preserved and enhanced at low confinements (relative to its strength). Similarly, the coal exhibited a brittle nature at σ3 = 0–10 MPa, and the failure intensity of these rock samples was high ( F I < 1.8 ). In the field, the rock masses around underground excavations or tunnels are under unconfined conditions. Even for the rock masses with supports, the interior rock masses near the excavation, or the center of a pillar, the confinements are in low values. Within this range, the rock presents highly brittle behavior, and the failure of the rock can be more violent at a greater depth.
For rocks with medium brittleness (i.e., with Type II energy evolution), the failure process is milder due to the fact that the stored elastic energy is insufficient to induce post-peak fracturing. Yet, if a soft roof or floor is encountered, extra energy is available from the loading system, which contributes to the instability of rock failure.
Therefore, the results of this study provide a preliminary evaluation of the bursting liability of rocks for underground applications. If the rock shows a Type I energy evolution, the bursting liability of such rocks is high. Measures should be taken to reduce the elastic energy stored inside rocks in high-stress concentration areas. If Type II energy evolution is present, the bursting liability of the rock is low. Nevertheless, attention should be paid if a soft roof, floor, or other sources exist. For rocks with Type III energy evolution, dissipation is the major mechanism during rock deformation. Little elastic energy can be withdrawn or released after the peak stress so that the bursting liability of the rock turns out to be none.

6. Conclusions and Future Research

In this study, a series of cyclic triaxial compression tests were conducted to explore the effect of confining pressure on the energy evolution, energy storage, and release of Class I and Class II rocks, including granite, red sandstone, coal, and mudstone.
The stress–strain curves showed that the granite samples under all confinements presented snap-back Class II behavior. The mechanical behavior of red sandstone was less brittle, and the rock exhibited combined Class I and Class II behaviors at some confinements. Brittle faulting was the major failure type for the two types of rocks. The mechanical behavior of coal changed from very brittle (Class II) at low confinements to less brittle (Class I) at higher pressures until the semi-brittle behavior was observed at σ3 = 40 MPa. The mudstone is a typical Class I rock, and its ductility increases distinctly as the confining pressure improves.
Three types of energy evolution were identified as the rock behavior changed from brittle to ductile. As one part of the source of rock failure, the energy storage limit ( u e p ) linearly improved with increasing confinement for all types of rocks, which was believed to be an intrinsic property of the rock. In contrast, the dissipated energy at the peak stress ( u d p ) varied linearly with increasing σ3 only for the specimens that failed in the brittle regime. Hence, the nonlinear improvement in u d p with σ3 was suggested to indicate the start of the brittle–ductile transition of the rock.
The ratio of the local withdrawn elastic energy and fracture energy was used to characterize the post-peak fracturing process, and a novel energy-based index was proposed to quantify the failure intensity of the rock.
It should be mentioned that although a comprehensive study was presented on the energy evolution for various types of rocks, more laboratory tests should be performed in the future to conduct a quantitative analysis. In particular, due to the fact that the post-peak behavior of coal and mudstone at high confining pressures is unavailable, additional data should be added to quantify the energy evolution across the brittle–ductile transition of the rock. Furthermore, the results of this study should be applied to and verified by engineering projects in the future, probably through numerical modeling and field monitoring methods. With respect to the discussed source mechanism, conclusions were made based on the intrinsic properties of intact rocks. Nevertheless, rock masses in the field usually contain discontinuities, such as joints, bedding planes, faults, etc., which have not been considered in this research. These discontinuities play critical roles in the storage, dissipation, and release of the strain energy. For instance, a fault-slip burst is triggered by the shear failure along pre-existing or newly formed faults, shear zones, etc., which causes the release of considerable energy [1,2,4]. These features should be included in future investigations of energy-related failure mechanisms of rocks or coal bursts.

Author Contributions

Conceptualization and methodology, F.G. and Z.Z.; experiment and formal analysis, Y.X. and W.Z.; writing—original draft preparation, review and editing, Y.X. All authors have read and agreed to the published version of the manuscript.

Funding

This research work was financially supported by the National Natural Science Foundation of China (Grant No. 52004268, 51934007, and 52174091) and by the by the National Key R&D Program of China (2022YFC3004600).

Data Availability Statement

The data presented in this study are available on request from the corresponding author. The data are not publicly available due to privacy.

Conflicts of Interest

The authors declare no conflict of interest.

References

  1. Kaiser, P.K.; Cai, M. Design of rock support system under rockburst condition. J. Rock Mech. Geotech. Eng. 2012, 4, 215–227. [Google Scholar] [CrossRef] [Green Version]
  2. Mazaira, A.; Konicek, P. Intense rockburst impacts in deep underground construction and their prevention. Can. Geotech. J. 2015, 52, 1426–1439. [Google Scholar] [CrossRef]
  3. Akdag, S.; Karakus, M.; Nguyen, G.D.; Taheri, A.; Bruning, T. Evaluation of the propensity of strain burst in brittle granite based on post-peak energy analysis. Undergr. Space 2021, 6, 1–11. [Google Scholar] [CrossRef]
  4. Li, C.C.; Zhao, T.; Zhang, Y.; Wan, W. A study on the energy sources and the role of surrounding rock mass in strain burst. Int. J. Rock Mech. Min. Sci. 2022, 154, 105114. [Google Scholar] [CrossRef]
  5. Cook, N.G.W.; Hoek, E.; Pretorius, J.P.G.; Ortlepp, W.D.; Salamon, M.D.G. Rock mechanics applied to the study of rockbursts. J. S. Afr. Inst. Min. Metal. 1966, 66, 435–528. [Google Scholar]
  6. Mitri, H.S.; Tang, B.; Simon, R. FE modelling of mining-induced energy release and storage rates. J. S. Afr. Inst. Min. Metal. 1999, 99, 103–110. [Google Scholar]
  7. Wang, J.A.; Park, H.D. Comprehensive prediction of rockburst based on analysis of strain energy in rocks. Tunn. Undergr. Space Technol. 2001, 16, 49–57. [Google Scholar] [CrossRef]
  8. Xie, H.; Li, L.; Peng, R.; Ju, Y. Energy analysis and criteria for structural failure of rocks. J. Rock Mech. Geotech. Eng. 2009, 1, 11–20. [Google Scholar] [CrossRef] [Green Version]
  9. Huang, D.; Li, Y. Conversion of strain energy in triaxial unloading tests on marble. Int. J. Rock Mech. Min. Sci. 2014, 66, 160–168. [Google Scholar] [CrossRef]
  10. Meng, Q.; Zhang, M.; Han, L.; Pu, H.; Nie, T. Effects of acoustic emission and energy evolution of rock specimens under the uniaxial cyclic loading and unloading compression. Rock Mech. Rock Eng. 2016, 49, 3873–3886. [Google Scholar] [CrossRef]
  11. Liang, C.; Wu, S.; Li, X.; Xin, P. Effects of strain rate on fracture characteristics and mesoscopic failure mechanisms of granite. Int. J. Rock Mech. Min. Sci. 2015, 76, 146–154. [Google Scholar] [CrossRef]
  12. Zhao, K.; Yu, X.; Zhou, Y.; Wang, Q.; Wang, J.; Hao, J. Energy evolution of brittle granite under different loading rates. Int. J. Rock Mech. Min. Sci. 2020, 132, 104392. [Google Scholar] [CrossRef]
  13. Yan, J.; Gong, F.; Luo, S. Effects of length-to-diameter ratio on energy storage characteristics of rock materials under uniaxial compression. Bull. Eng. Geol. Environ. 2022, 81, 508. [Google Scholar] [CrossRef]
  14. Li, D.; Sun, Z.; Xie, T.; Li, X.; Ranjith, P.G. Energy evolution characteristics of hard rock during triaxial failure with different loading and unloading paths. Eng. Geol. 2017, 228, 270–281. [Google Scholar] [CrossRef]
  15. Zhang, L.; Cong, Y.; Meng, F.; Wang, Z.; Zhang, P.; Gao, S. Energy evolution analysis and failure criteria for rock under different stress paths. Acta Geotech. 2021, 16, 569–580. [Google Scholar] [CrossRef]
  16. Ning, J.; Wang, J.; Jiang, J.; Hu, S.; Jiang, L.; Liu, X. Estimation of crack initiation and propagation thresholds of confined brittle coal specimens based on energy dissipation theory. Rock Mech. Rock Eng. 2018, 51, 119–134. [Google Scholar] [CrossRef]
  17. Wen, T.; Tang, H.; Huang, L.; Wang, Y.; Ma, J. Energy evolution: A new perspective on the failure mechanism of purplish-red mudstones from the Three Gorges Reservoir area, China. Eng. Geol. 2020, 264, 105350. [Google Scholar] [CrossRef]
  18. Yang, B.; Xue, L.; Duan, Y. Investigation into energy conversion and distribution during brittle failure of hard rock. Bull. Eng. Geol. Environ. 2022, 81, 114. [Google Scholar] [CrossRef]
  19. Lu, J.; Yin, G.; Zhang, D.; Gao, H.; Li, C.; Li, M. True triaxial strength failure characteristics of cubic coal and sandstone under different loading paths. Int. J. Rock Mech. Min. Sci. 2020, 135, 104439. [Google Scholar] [CrossRef]
  20. Arzua, J.; Alejano, L.R. Dilation in granite during servo-controlled triaxial strength tests. Int. J. Rock Mech. Min. Sci. 2013, 61, 43–56. [Google Scholar] [CrossRef]
  21. Hou, P.Y.; Cai, M. Post-peak stress-strain curves of brittle hard rocks under different loading environment system stiffness. Rock Mech. Rock Eng. 2022, 55, 3837–3857. [Google Scholar] [CrossRef]
  22. Wawersik, W.R.; Fairhurst, C. A study of brittle rock fracture in laboratory compression experiments. Int. J. Rock Mech. Min. Sci. Geomech. Abstr. 1970, 7, 561–575. [Google Scholar] [CrossRef]
  23. Bruning, T.; Karakus, M.; Nguyen, G.D.; Goodchild, D. Experimental study on the damage evolution of brittle rock under triaxial confinement with full circumferential strain control. Rock Mech. Rock Eng. 2018, 51, 3321–3341. [Google Scholar] [CrossRef]
  24. Zhang, H.; Li, C. Effects of confining stress on the post-failure behaviour and fracture angle of Fauske marble and Iddefjord granite. Rock Mech. Rock Eng. 2019, 52, 1377–1385. [Google Scholar] [CrossRef] [Green Version]
  25. Wang, H.; Dyskin, A.; Pasternak, E.; Dight, P. Mixed Class I/Class II post-peak curves of mortar models of rock samples. Theor. Appl. Fract. Mech. 2022, 117, 1031178. [Google Scholar] [CrossRef]
  26. ASTM D7012; Standard Test Methods for Compressive Strength and Elastic Moduli of Intact Rock Core Specimens under Varying States of Stress and Temperatures. ASTM International: West Conshohocken, PA, USA, 2014.
  27. Martin, C.D.; Chandler, N.A. The progressive fracture of Lac du Bonnet granite. Int. J. Rock. Mech. Min. Sci. Geomech. Abstr. 1994, 31, 643–659. [Google Scholar] [CrossRef]
  28. Martin, C.D. Strength of Massive Lac du Bonnet Granite around Underground Openings. Ph.D. Thesis, University of Manitoba, Winnipeg, MB, Canada, 1993. [Google Scholar]
  29. Walton, G.; Hedayat, A.; Kim, E.; Labrie, D. Post-yield strength and dilatancy evolution across the brittle-ductile transition in Indiana limestone. Rock Mech. Rock Eng. 2017, 50, 1691–1710. [Google Scholar] [CrossRef]
  30. Tarasov, B.; Yves, P. Universal criteria for rock brittleness estimation under triaxial compression. Int. J. Rock Mech. Min. Sci. 2013, 59, 57–69. [Google Scholar] [CrossRef]
  31. Mogi, K. Pressure dependence of rock strength and transition from brittle fracture to ductile flow. Bull. Earthq. Res. Inst. 1966, 44, 215–232. [Google Scholar]
  32. Desbois, G.; Hohne, N.; Urai, J.L.; Besuelle, P.; Viggiani, G. Deformation in cemented mudrock (Callovo-Oxfordian Clay) by microcracking, granular flow and phyllosilicate plasticity: Insights from triaxial deformation, broad ion beam polishing and scanning electron microscopy. Solid Earth 2017, 8, 291–305. [Google Scholar] [CrossRef] [Green Version]
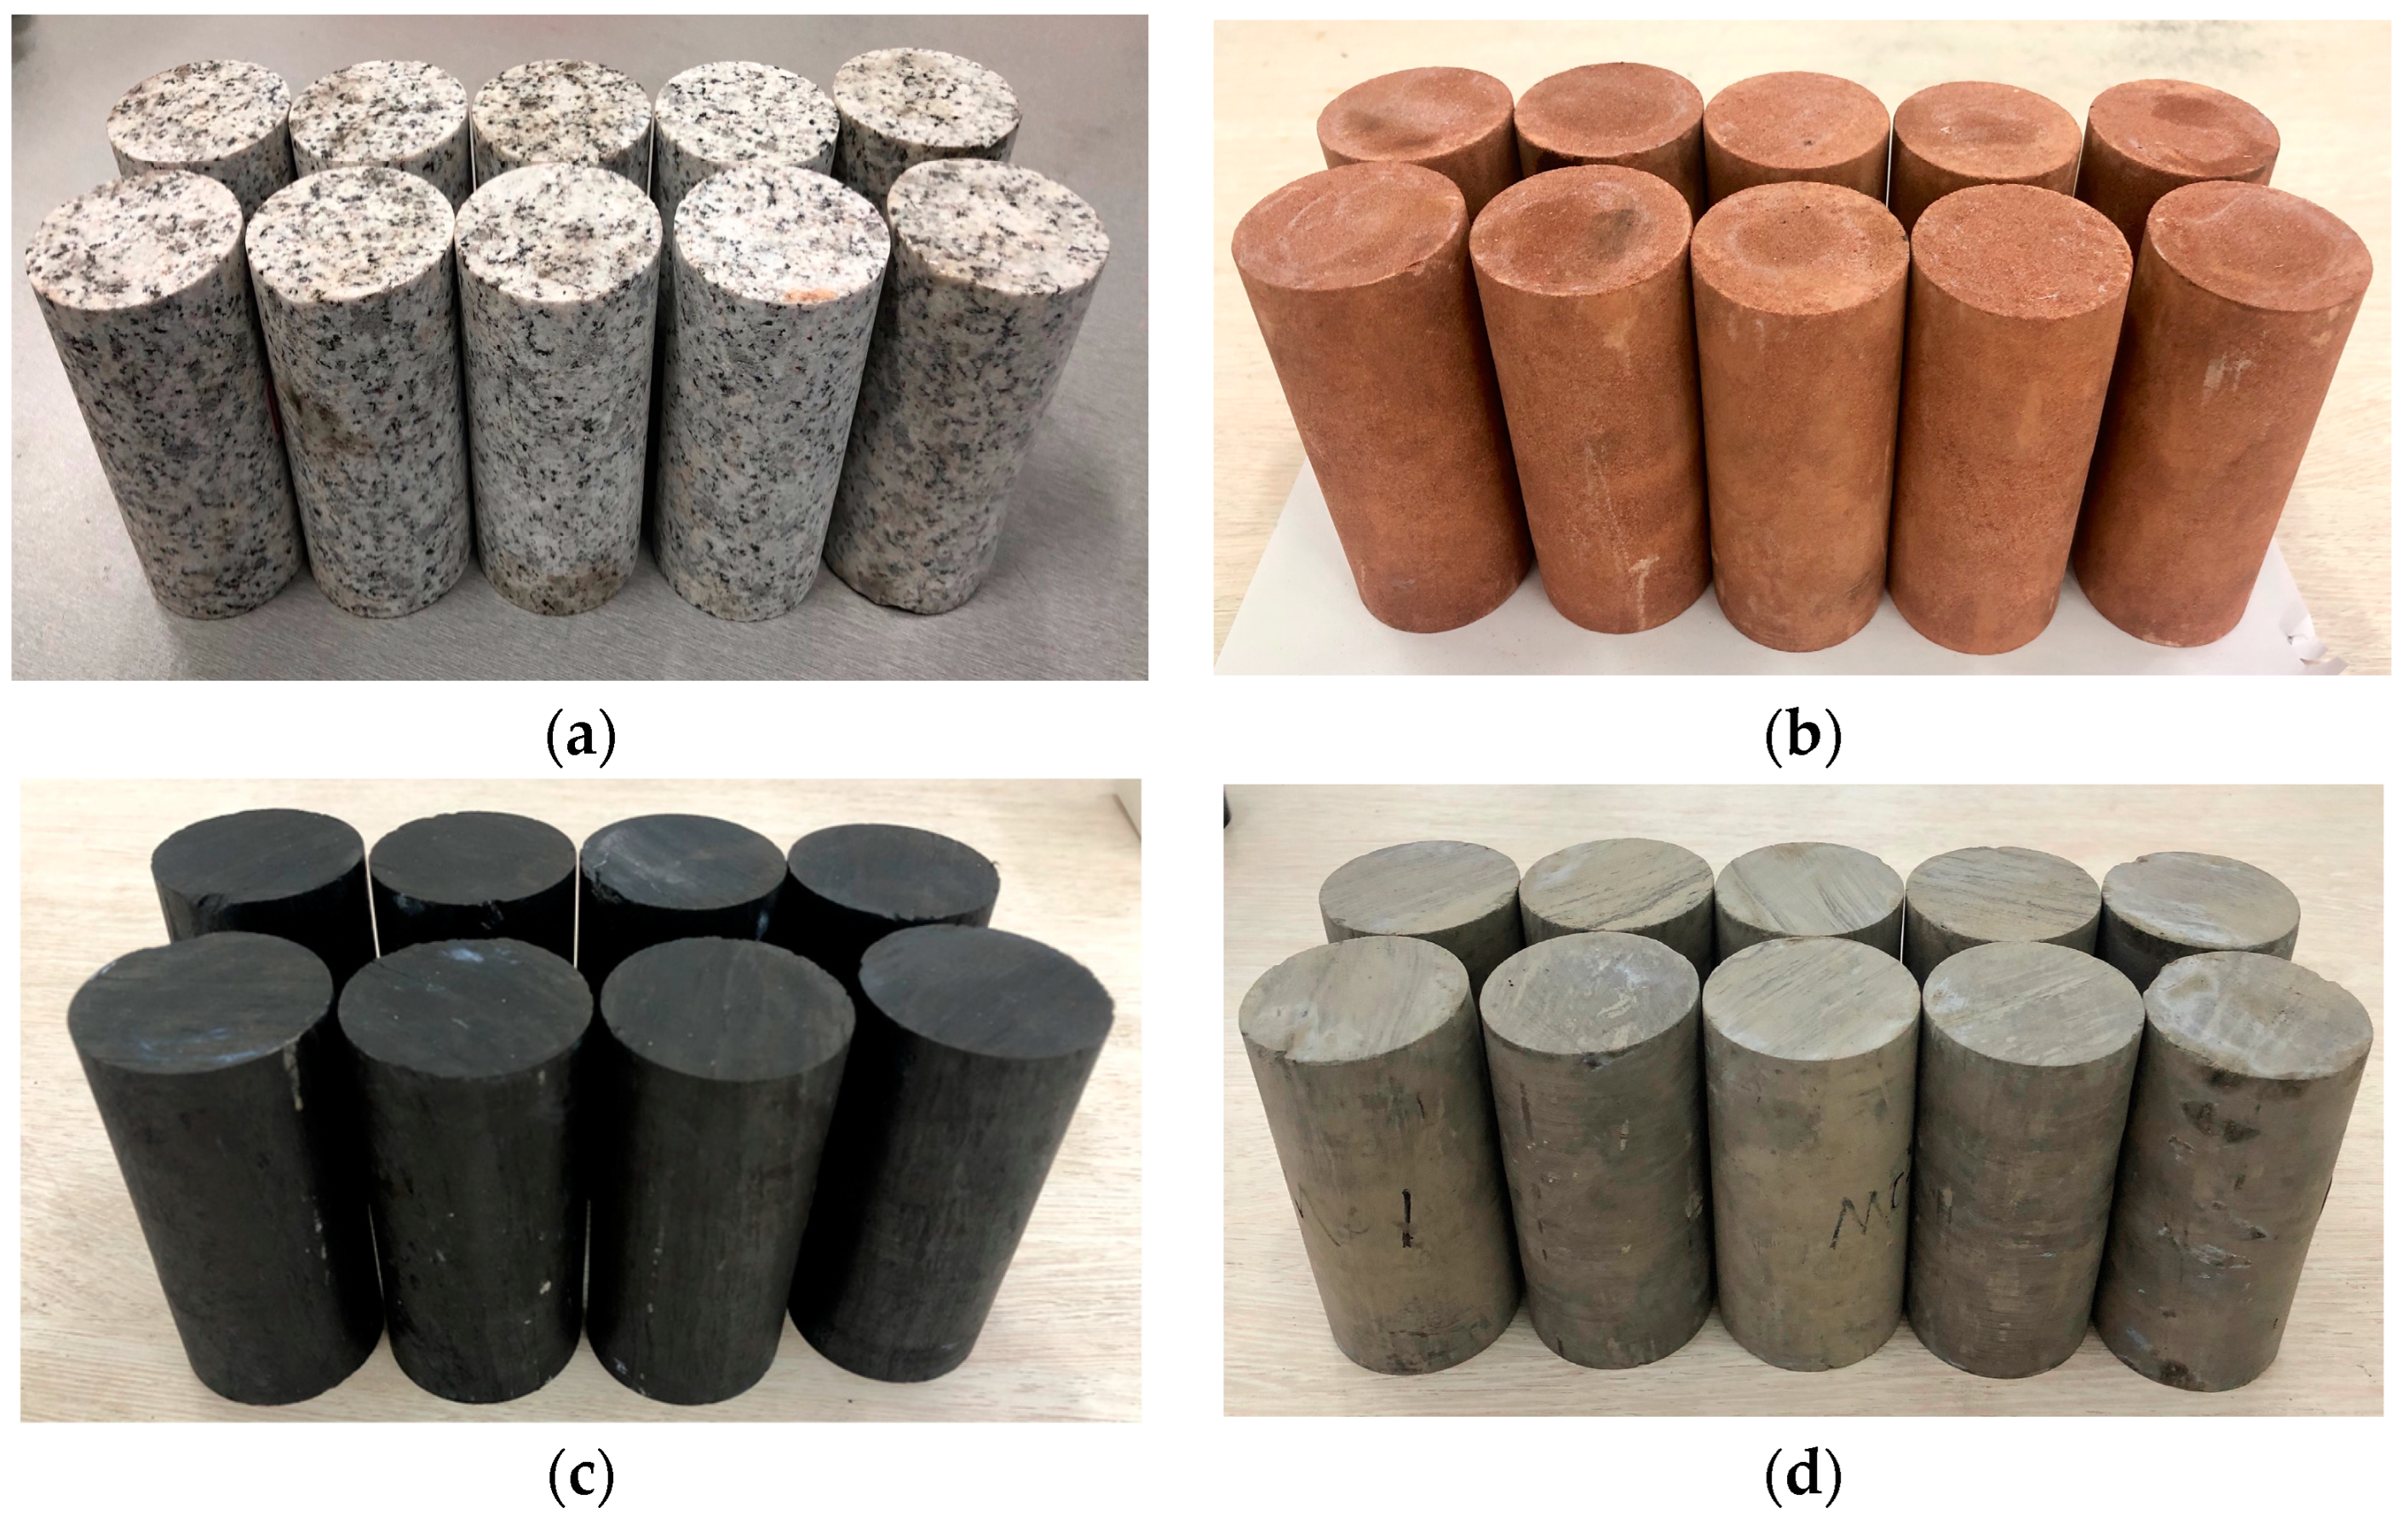
Figure 1. Prepared rock samples for testing: (a) granite; (b) red sandstone; (c) coal; (d) mudstone.
Energies 16 05516 g001
Figure 2. MTS815 servo-controlled rock mechanics testing system.
Energies 16 05516 g002
Figure 3. Cyclic stress–strain curves and upper strength envelopes at σ3 = 5 MPa of the rocks: (a) granite; (b) red sandstone; (c) coal; (d) mudstone.
Energies 16 05516 g003
Figure 4. Envelopes of the complete stress–strain curves of the tested rocks: (a) granite; (b) red sandstone; (c) coal; (d) mudstone. (Unloading–reloading cycles were removed).
Energies 16 05516 g004aEnergies 16 05516 g004b
Figure 5. Failed granite specimens at (a) σ3 = 5 MPa; (b) σ3 = 10 MPa; (c) σ3 = 20 MPa; (d) σ3 = 30 MPa; (e) σ3 = 40 MPa.
Energies 16 05516 g005
Figure 6. Failed red sandstone specimens at (a) σ3 = 5 MPa; (b) σ3 = 10 MPa; (c) σ3 = 20 MPa; (d) σ3 = 30 MPa; (e) σ3 = 40 MPa.
Energies 16 05516 g006
Figure 7. Failed coal specimens at (a) σ3 = 2 MPa; (b) σ3 = 5 MPa; (c) σ3 = 10 MPa; (d) σ3 = 20 MPa; (e) σ3=30 MPa; (f) σ3 = 40 MPa.
Energies 16 05516 g007
Figure 8. Failed mudstone specimens at (a) σ3 = 2 MPa; (b) σ3 = 5 MPa; (c) σ3 = 10 MPa; (d) σ3 = 15 MPa; (e) σ3 = 20 MPa.
Energies 16 05516 g008
Figure 9. Illustration of strain energies for (a) Class I and (b) Class II rocks.
Energies 16 05516 g009
Figure 10. Energy evolution for granite samples at confinements of (a) 5 MPa; (b) 40 MPa.
Energies 16 05516 g010
Figure 11. Energy evolution for red sandstone samples at confinements of (a) 5 MPa; (b) 40 MPa.
Energies 16 05516 g011
Figure 12. Energy evolution for coal samples at confinements of (a) 2 MPa; (b) 20 MPa; (c) 40 MPa.
Energies 16 05516 g012aEnergies 16 05516 g012b
Figure 13. Energy evolution for coal samples at confinements of (a) 2 MPa; (b) 5 MPa; (c) 20 MPa.
Energies 16 05516 g013aEnergies 16 05516 g013b
Figure 14. Variation in strain energy values at the peak stress with confining pressure for the different types of rocks: (a) granite; (b) red sandstone; (c) coal; (d) mudstone.
Energies 16 05516 g014
Figure 15. Calculation of local d w e and dwf for (a) Class I and (b) Class II rocks.
Energies 16 05516 g015
Figure 16. Evolution of post-peak energy ratio and differential stress for rocks: (a) granite at σ3 = 5 MPa; (b) red sandstone at σ3 = 5 MPa; (c) coal at σ3 = 2 MPa; (d) mudstone at σ3 = 0 MPa.
Energies 16 05516 g016
Figure 17. Variation in FI values with confining pressure for tested rocks.
Energies 16 05516 g017
Table 1. Confining pressures applied to each type of rock.
Type of the RockConfining Pressure (MPa)
Conventional TestsCyclic Loading–Unloading Tests
Granite0, 5, 10, 20, 30, 400, 5, 10, 20, 30, 40
Red sandstone0, 5, 10, 20, 30, 400, 5, 10, 20, 30, 40
Coal0, 2, 5, 10, 20, 30, 400, 2, 5, 10, 20, 30, 40
Mudstone0, 2, 5, 10, 15, 200, 2, 5, 10, 15, 20
Table 2. Strength and deformability properties of the rock samples.
Type of RockConfining Pressure, σ3 (MPa) Peak   Strength ,   σ 1 p (MPa) Young’s Modulus, E (GPa)Poisson’s Ratio, μCD/Peak Stress Irreversible   Strain   at   Peak   Stress ,   ε 1 p (10−3) (σ1p − σ3)/σ3
Granite0104.3813.740.090.840.36-
5173.6618.500.130.850.7533.73
10257.8718.910.190.880.9024.79
20362.9724.230.150.840.8417.15
30429.1224.160.120.910.7413.30
40521.3624.270.160.841.2512.03
Red sandstone048.617.740.220.770.58-
574.808.020.120.741.3513.96
10106.148.610.130.681.309.62
20137.558.780.090.772.215.88
30172.7210.470.130.722.534.75
40203.809.830.110.783.354.10
Coal022.752.060.270.900.35-
244.442.150.220.820.4221.22
556.252.240.240.801.9610.25
1074.981.970.270.674.776.50
2097.251.990.280.6512.723.86
30121.682.020.290.5725.123.06
40149.751.870.260.5083.232.74
Mudstone011.521.790.080.631.39-
220.621.620.060.627.789.37
529.781.550.060.6315.425.00
1043.061.780.080.5533.393.32
1552.951.82-0.5147.342.55
2065.261.54-0.4870.392.54
Table 3. Energy properties and type of energy evolution for the rock samples.
Type of Rockσ3 (MPa) u e p (MJ/m3) u d p (MJ/m3) d w e (MJ/m3) d w f (MJ/m3) Type of Energy Evolution
Granite50.6990.3060.3500.332I
101.2920.6210.9090.879I
202.2060.8511.5561.294I
303.0661.0941.9151.531I
404.3731.6472.7982.625I
Red sandstone50.2400.2010.1570.219II
100.4580.3110.2900.397II
200.6760.6110.2620.503II
300.9310.8000.4740.540II
401.2301.1900.5560.627II
Coal20.3780.1070.2290.203I
50.5530.1700.2060.186I
101.0580.5220.6820.539I
201.5861.4740.6211.020II
302.2613.041--II
402.9309.959--III
Mudstone20.0520.1460.0350.095III
50.0880.5240.0210.185III
100.1231.2170.0380.263III
150.1601.8020.0220.515III
200.1983.007--III
Disclaimer/Publisher’s Note: The statements, opinions and data contained in all publications are solely those of the individual author(s) and contributor(s) and not of MDPI and/or the editor(s). MDPI and/or the editor(s) disclaim responsibility for any injury to people or property resulting from any ideas, methods, instructions or products referred to in the content.