Article

Determination and Application of Archie Model Parameters in Hydrate Formation under Different Temperature Gradients

1
School of Energy and Power Engineering, Lanzhou University of Technology, Lanzhou 730050, China
2
Gansu Key Laboratory of Complementary Energy System of Biomass and Solar Energy, Lanzhou 730050, China
3
State Key Laboratory of Frozen Soil Engineering, Northwest Institute of Eco-Environment and Resources, Chinese Academy of Sciences, Lanzhou 730000, China
*
Author to whom correspondence should be addressed.
Energies 2023, 16(14), 5517; https://doi.org/10.3390/en16145517
Submission received: 21 June 2023 / Revised: 12 July 2023 / Accepted: 18 July 2023 / Published: 21 July 2023

Abstract

:
To investigate the impact of geothermal gradient on the distribution and reserves of hydrate in permafrost regions, it is crucial to utilize the Archie formula to compute hydrate saturation and adjust parameters to enhance the model’s precision under varying temperature gradient conditions. This study formed methane hydrate under four temperature gradients of 0.02 °C/cm, 0.07 °C/cm, 0.11 °C/cm and 0.18 °C/cm, and two sand particle ratios. The values of porosity index (m) and saturation index (n) were fitted according to different conditions. The water saturation and hydrate saturation were then calculated and contrasted with experimental results. Findings indicate that the influence of temperature gradient on the values of m and n is intricate, with n decreasing gradually and m fluctuating with an increase in temperature gradient. The discrepancies between the optimized Archie model and the actual calculated hydrate saturation values ranged from 0.8% to 2.5%, with average errors of less than 3%, proving its applicability. Finally, the optimized Archie model was used to investigate the hydrate saturation and its distribution in different layers, which confirmed the significant effect of temperature gradient on the assessment of hydrate storage and distribution by Archie’s equation.

1. Introduction

Gas hydrate is a natural product, which is a crystal formed by natural gas and water under high pressure and low-temperature conditions. It is an ice-like solid, but it loses its stability at atmospheric pressure and room temperature, breaking down into natural gas and water [1,2]. Natural gas hydrate is an important energy resource, and its reserves are considered to be more than twice the reserves of oil and natural gas. Natural gas hydrate saturation in porous media refers to the content of natural gas hydrate in porous media. Porous media refers to the geological materials containing pores such as rocks, sandstones and mudstones. In porous media, the content of natural gas hydrate is affected by many factors, including temperature, pressure, porosity, pore size and so on. Therefore, it is of great significance to study the change law of natural gas hydrate saturation in porous media for the exploitation and utilization of natural gas hydrate. There are many methods for measuring the saturation of natural gas hydrate in porous media. Among them, the most commonly used methods include the hydrate classification method, physical model method, electromagnetic method, acoustic method and so on. These methods have their own advantages and disadvantages, so it is necessary to choose the appropriate method according to the actual situation.
As one of the reservoir logging response methods, resistivity detection technology can not only determine the location of hydrates, but also detect hydrate nucleation, formation and saturation. This technology is of great significance for studying the distribution and formation mechanism of hydrates in geological reservoirs [3,4]. As the basis of resistivity logging technology, the Archie formula was originally used to calculate the hydrocarbon content of oil and gas. After the parameters were improved and optimized by Archie [5], Sweeney [6] and Waxman [7], it was used to calculate the formation hydrate saturation. The expression is:
R t R w = a b φ m S w n
where Rt is the resistivity of the sedimentary layer (Ω·m); Rw is the resistivity of pore water (Ω∙m); φ is porosity; Sw is water saturation; m and n are cementation index and saturation index, respectively; and a and b are lithologic coefficients. Since the influence of m and n is much greater than a and b in the calculation of hydrate saturation, a and b are usually considered to be 1 when exploring the influence of m and n on resistivity [8]. Generally, m is the curvature of rock pore structure, also known as the change rate of porosity, which is a function of permeability and porosity [9,10]. The physical meaning of n is the correction of wettability distribution in rock pores, which is quantified by the linear relationship between water and oil wettability in pores [11]. When Archie was used to calculate the hydrate saturation of sandstone reservoirs in the early stage, the empirical values of m and n were generally 1.9386 and 1.3 [9,12]. However, the internal structure of hydrate-bearing sediments in permafrost regions and sea areas is complicated with the change of geological pore space movement path, including the influence of external additional conductive factors, effective pore size distribution, permeability and particle size, which leads to the randomness and inhomogeneity of hydrate distribution [13,14]. At the same time, due to the change of temperature and salinity, the change of fluid flow path in sediment pores will also cause the change of resistance of hydrate-bearing sediments [15]. Therefore, considering the influence of the above factors, the selection of m and n in different geological regions should be different.
Jackson et al. [16] found that the value of m varied from 0.8 to 4 in the calculation of hydrate saturation in sedimentary layers such as sandstone, limestone, porous dolomite and loose sediments. Shankar et al. [17] concluded that the value of m is between 0.8 and 1 when the sediment is mainly clay. In addition, the decrease of particle roundness and the continuous fractal of pore structure will also change the physical properties of rock permeability and conductivity, and indirectly affect the value of m [18]. Anderson et al. [19] found that when the water saturation changes around 30%, the range of n value will increase to 2~3.5 due to the influence of pore connectivity or viscosity change. Spangenberg et al. [20] verified that the n value range can vary between 0.5 and 4 through the formation of hydrates in reservoirs. However, when the hydrate saturation is high (Sh > 70%), the hydrate acts as a part of the matrix, and the n value can reach up to 6. Experiments show that with the increase of logging depth (220~280 m), the error between hydrate saturation calculated by fixed m value and actual core data increases. At this time, hydrate exists in the mixed layer or stratification of silty clay, quartz sand and fine sand. When Sh < 60%, the calculated value of m with curvature should be between 1.7 and 3.2 [21].
The above research considers the influence of different factors on the values of m and n in the Archie formula, which improves the accuracy of hydrate saturation calculation to a certain extent. In addition to the above factors, the stability and reserves of natural gas hydrates in permafrost regions are also affected by the geothermal gradient [22]. Therefore, based on the methane hydrate formation test, the m and n values were fitted and the hydrate saturation was calculated under various temperature gradient conditions. The research results not only expand the application range of the Archie formula in the field of natural gas hydrate, but also improve the accuracy of the Archie formula in evaluating formation hydrate reserves.

2. Materials and Methods

2.1. Experimental Apparatus

This experiment utilized an experimental device consisting of three main components: a hydrate reaction and monitoring system, a data acquisition system (DT80, DT500) and a temperature and pressure control system. The hydrate reaction monitoring system was made up of a reactor and resistivity and temperature test systems. The reactor was composed of an external stainless steel body and an internal insulating barrel with a volume of 1419.28 mL and a pressure range of −0.1 to 10 MPa. To measure the resistivity of hydrate, the constant voltage source method was employed using 11 double-layer copper plates with equal spacing distribution installed in the insulating barrel. The expressed current was converted into resistance by the apparent resistivity method. The copper sheets had a diameter of 79 mm, 45 holes with a diameter of 1 mm and a thickness of 0.05 mm. The double-layer copper sheets were insulated by coating. During measurement, the upper and lower ends of each layer of sand and the DT80 expansion plate of the output port formed a loop. To ensure the accuracy of the resistance, a standard 10 K resistance was connected in parallel on each channel. Temperature measurement was carried out by 11 thermistor sensors with equal spacing distribution, and the probe and the electrode copper plate remained insulated. The temperature and pressure control system included two circulating cold bath and gas supply systems connecting the top and bottom of the reactor. The pressure sensor was an MPM4760 intelligent pressure sensor made by Mac Sensors Co., Ltd. (Changsha, China). The measurement range was −0.1 to 15.0 MPa, and the product accuracy was 0.25%. The temperature probe was a thermistor with high pressure resistance and low temperature resistance made by the Northwest Institute of Ecological Environment and Resources of the Chinese Academy of Sciences (State Key Laboratory of Frozen Soil Engineering). The measurement range of the thermistor sensor was −20 to 30 °C, and the measurement accuracy was ±0.01 °C. The temperature control range of the cold bath was −100 to 250 °C, and the accuracy was ±0.1 °C. To minimize the impact of ambient temperature on the hydrate formation process, the entire device was located in a thermostat with a temperature control accuracy of ±0.05 °C. Figure 1 is a schematic diagram of the experimental device used in this experiment.

2.2. Experimental Materials

According to the hydrate reservoir exploration of the SH3 station in the Shenhu sea area of the South China Sea in 2016, it has been pointed out that the grain size of hydrate-bearing sediments is relatively coarse. Some studies have also shown that hydrates exist in fine-grained and coarse sand or silt mixed-sediment layers in most cases [23,24]. Therefore, in this experiment, coarse sand with a particle size of 0.5–1 mm and 300 mesh silt were selected for mixing and making samples. The specific physical parameters of the sample and the specifications and sources of the experimental materials are shown in Table 1 and Table 2. In terms of the addition of water content, taking into account most of the actual marine sediments in nature, in the specific period of free-gas-forming hydrate, the sedimentary layer is temporarily in an unsaturated state. And in coarse-grained sediments (coarse sand) with usually high saturation, it is generally in a semi-saturated water-bearing state [25]. Therefore, the water saturation was set to 50%; that is, the volume of water in the pore accounted for 50% of the total pore volume.

2.3. Experimental Procedure

First, before the experiment, the air tightness of the whole reaction system was first checked, and the reactor was sealed. The reactor was filled with 8.5 MPa gas, the temperature in the reactor was adjusted to 273.65 K by adjusting the cold bath temperature and the temperature in the reactor and the environment were kept stable. The whole system was placed for 24 h. If the pressure in the reactor did not decrease, or the change range was ±0.1 MPa, the reaction system had good air tightness.
Second, deionized water was prepared, using deionized water to wash the insulation cylinder, mixing rod, temperature probe and other components of the reactor. Then, the products that needed to be dried were placed in an oven at 378.15 K for 24 h.
Third, research has indicated that hydrates typically exist in the mixed layer of sediments composed of fine-grained and coarse sand or silt [23,24]. As such, this study selected coarse sand with a particle size ranging from 0.5 to 1 mm and silt with a particle size of less than 0.075 mm for mixing. Samples of 100% pure coarse sand and 85% coarse sand mixed with 15% silt were prepared. Initially, the porosity (φ) of sand was measured through the ring knife method [26] (the ring knife method is a non-destructive method for measuring porosity. It is based on the following principle: when the ring knife passes through the material, the pores in the material will be filled by the ring knife. By measuring the volume change before and after the ring knife, the volume fraction of the pores in the material can be calculated) in geotechnical experiments. Subsequently, the sand required for the experiment was repeatedly washed with deionized water and dried in an oven for 24 h. After drying, the soil sample was mixed with water in accordance with the experiment’s initial water saturation of 50%. Finally, the sand and deionized water were mixed. The specific parameters of each sample group are presented in Table 3.
Fourth, the well-proportioned sand samples were placed in an insulating cylinder layer by layer, and each 120 g sand sample was compacted with a standard copper block and the probe was placed in the middle of the sand. At the same time, 11 full-section electrodes were arranged in the medium spacing of the sand sample.
Fifth, the sample was placed in a sealed reactor and vacuumed for 5 min. After ensuring that everything was functioning normally, the two circulating cold baths were opened to cool down until the temperature in the reactor dropped to 13 °C and remained stable. Then, the reactor was inflated to a pressure of 9.0 MPa, and then left for two hours to ensure stable pressure. Then, the methane hydrate formation experiment was carried out according to different temperature gradient strips.
Sixth, a cooling rate of 8 °C/h was achieved by adjusting the cold bath and thermostat, and stable hydrate formation was achieved by combining four temperature gradient conditions: 0.02 °C/cm, 0.07 °C/cm, 0.11 °C/cm and 0.18 °C/cm. The temperature of the bottom plate corresponding to each temperature gradient condition was +1 °C and was in direct contact with the temperature control plate, resulting in good conduction. The final temperatures of each upper floor cold bath control were 0.5 °C, −0.5 °C, −1.5 °C, and −3 °C, respectively. Table 4 outlines the specific temperature and pressure conditions. Once hydrate formation was complete, the sample was frozen, weighed and decomposed layer by layer.

2.4. Calculation Methods

2.4.1. Hydrate Resistivity

The resistivity of hydrate was obtained by converting the current measured in the experiment using the apparent resistivity method. In this experiment, the constant pressure source method was used; that is, the resistivity between the copper electrodes at both ends of each layer of soil sample was taken as the resistivity of a sedimentary layer. The calculation formula of the apparent resistivity of a hydrate sedimentary layer is:
ρ = R S L
where ρ is the apparent resistivity of hydrate deposits between adjacent plates (Ω·m), R is the resistance reading between adjacent copper electrodes measured by data acquisition (Ω), S is the plate area (m2) and L is the distance between adjacent plates (m).

2.4.2. Hydrate Saturation

In this experiment, hydrate saturation calculation included the gas consumption method and resistivity method. The former calculates the overall hydrate saturation based on the actual consumption of methane gas during hydrate formation. The latter is mainly based on the Archie formula to solve the hydrate saturation stratification. The two methods are introduced as follows:
Method 1: Gas consumption method.
In the calculation of the gas consumption method, the volume of methane under different temperature and pressure conditions is converted into the volume under standard conditions, and the following relationship exists:
V g s = V g s 1 V g s 2
V g s = ( 273.15 P 1 V g 1 ) 0.1 T 1 Z 1 273.15 P 2 V g 1 V g 0.2 164 0.1 T 2 Z 2
where Vgs1 and Vgs2 are the volume of the initial and formed gas in the kettle under standard conditions (cm3), T1, P1 are the initial state of the system temperature and pressure, Vg1 is the gas volume in the initial state (m3), T2, P2 are the system temperature and pressure in the generation; and Z1 and Z2 are the compression factors corresponding to temperature T1, pressure P1 and temperature T2, pressure P2, respectively.
Assuming that all hydrates are formed in the pores, the hydrate saturation (Sh) in the sand sample is calculated as:
S h = V g s 164 V 100 %
where V is the pore volume of sand, cm3. Gas hydrate dissociation per unit volume under standard conditions can produce 164 units of CH4 gas and 0.8 m3 water.
Method 2: Resistivity method.
The formation stage of hydrate has a regional boundary. Although the general gas consumption method can roughly divide the induction, nucleation and formation stages, the response of resistivity is more sensitive than the influence of the nature of hydrate itself [27].
As shown in Formula (1), Archie’s formula is expressed as a functional relationship between sedimentary layer resistivity (Rt), pore water resistivity (Rw), porosity (φ) and water saturation (Sw).
Based on Archie’s law, the relationship between resistivity, temperature and water saturation is established as follows:
R w = R w 0 T 0 + 21.5 T 1 + 21.5
Because the resistivity of pore water is not easy to measure, the resistivity of pore water is calculated by the resistivity of a completely saturated pure coarse sand experiment:
R 0 = R w 0 × T 0 + 21.5 × ϕ m T 1 + 21.5
The results show that when T0 = 13.2 °C, the resistivity is 55 Ω·m, and Rw0 = 18.1 Ω·m.
The formula for determining water saturation (Sw) under different temperature conditions is derived:
S w = R w 0 T 0 + 21.5 T 1 + 21.5 φ m R t n
Combined with the relationship between water saturation (Sw) and hydrate saturation (Sh) in porous media and real-time effective pores:
φ = φ 0 1 S h
Finally, the calculation formula of Sw is obtained:
S w = R w φ m R t 1 n
The m and n in the formula will be linearly fitted according to the functions of water saturation, temperature, resistivity and other parameters under different experimental variables. The saturation index (n) depends on the fluidity of pore water, commonly known as rock wettability. Experiments show that the difference in the growth position and thickness of hydrate film will lead to the migration and rearrangement of water during hydrate formation [28]. This affects the distribution of water saturation and indirectly affects the applicability of n value.
In the process of pore fluid being replaced by hydrate, the solution f equation of layered hydrate saturation is:
S h i = S w 0 S w i K h ( i = 1 , 2 , , 10 )
where Sw0 is the initial water saturation calculated by the Archie equation; Swi is the water saturation calculated in real time according to each layer of hydrate formation; and Kh is the expansion coefficient of hydrate; that is, the expansion coefficient of water converted to hydrate, generally 1.25 [29,30].

3. Result and Discussion

3.1. The Fitting of m and n Values in Archie Formula under Different Temperature Gradient Conditions

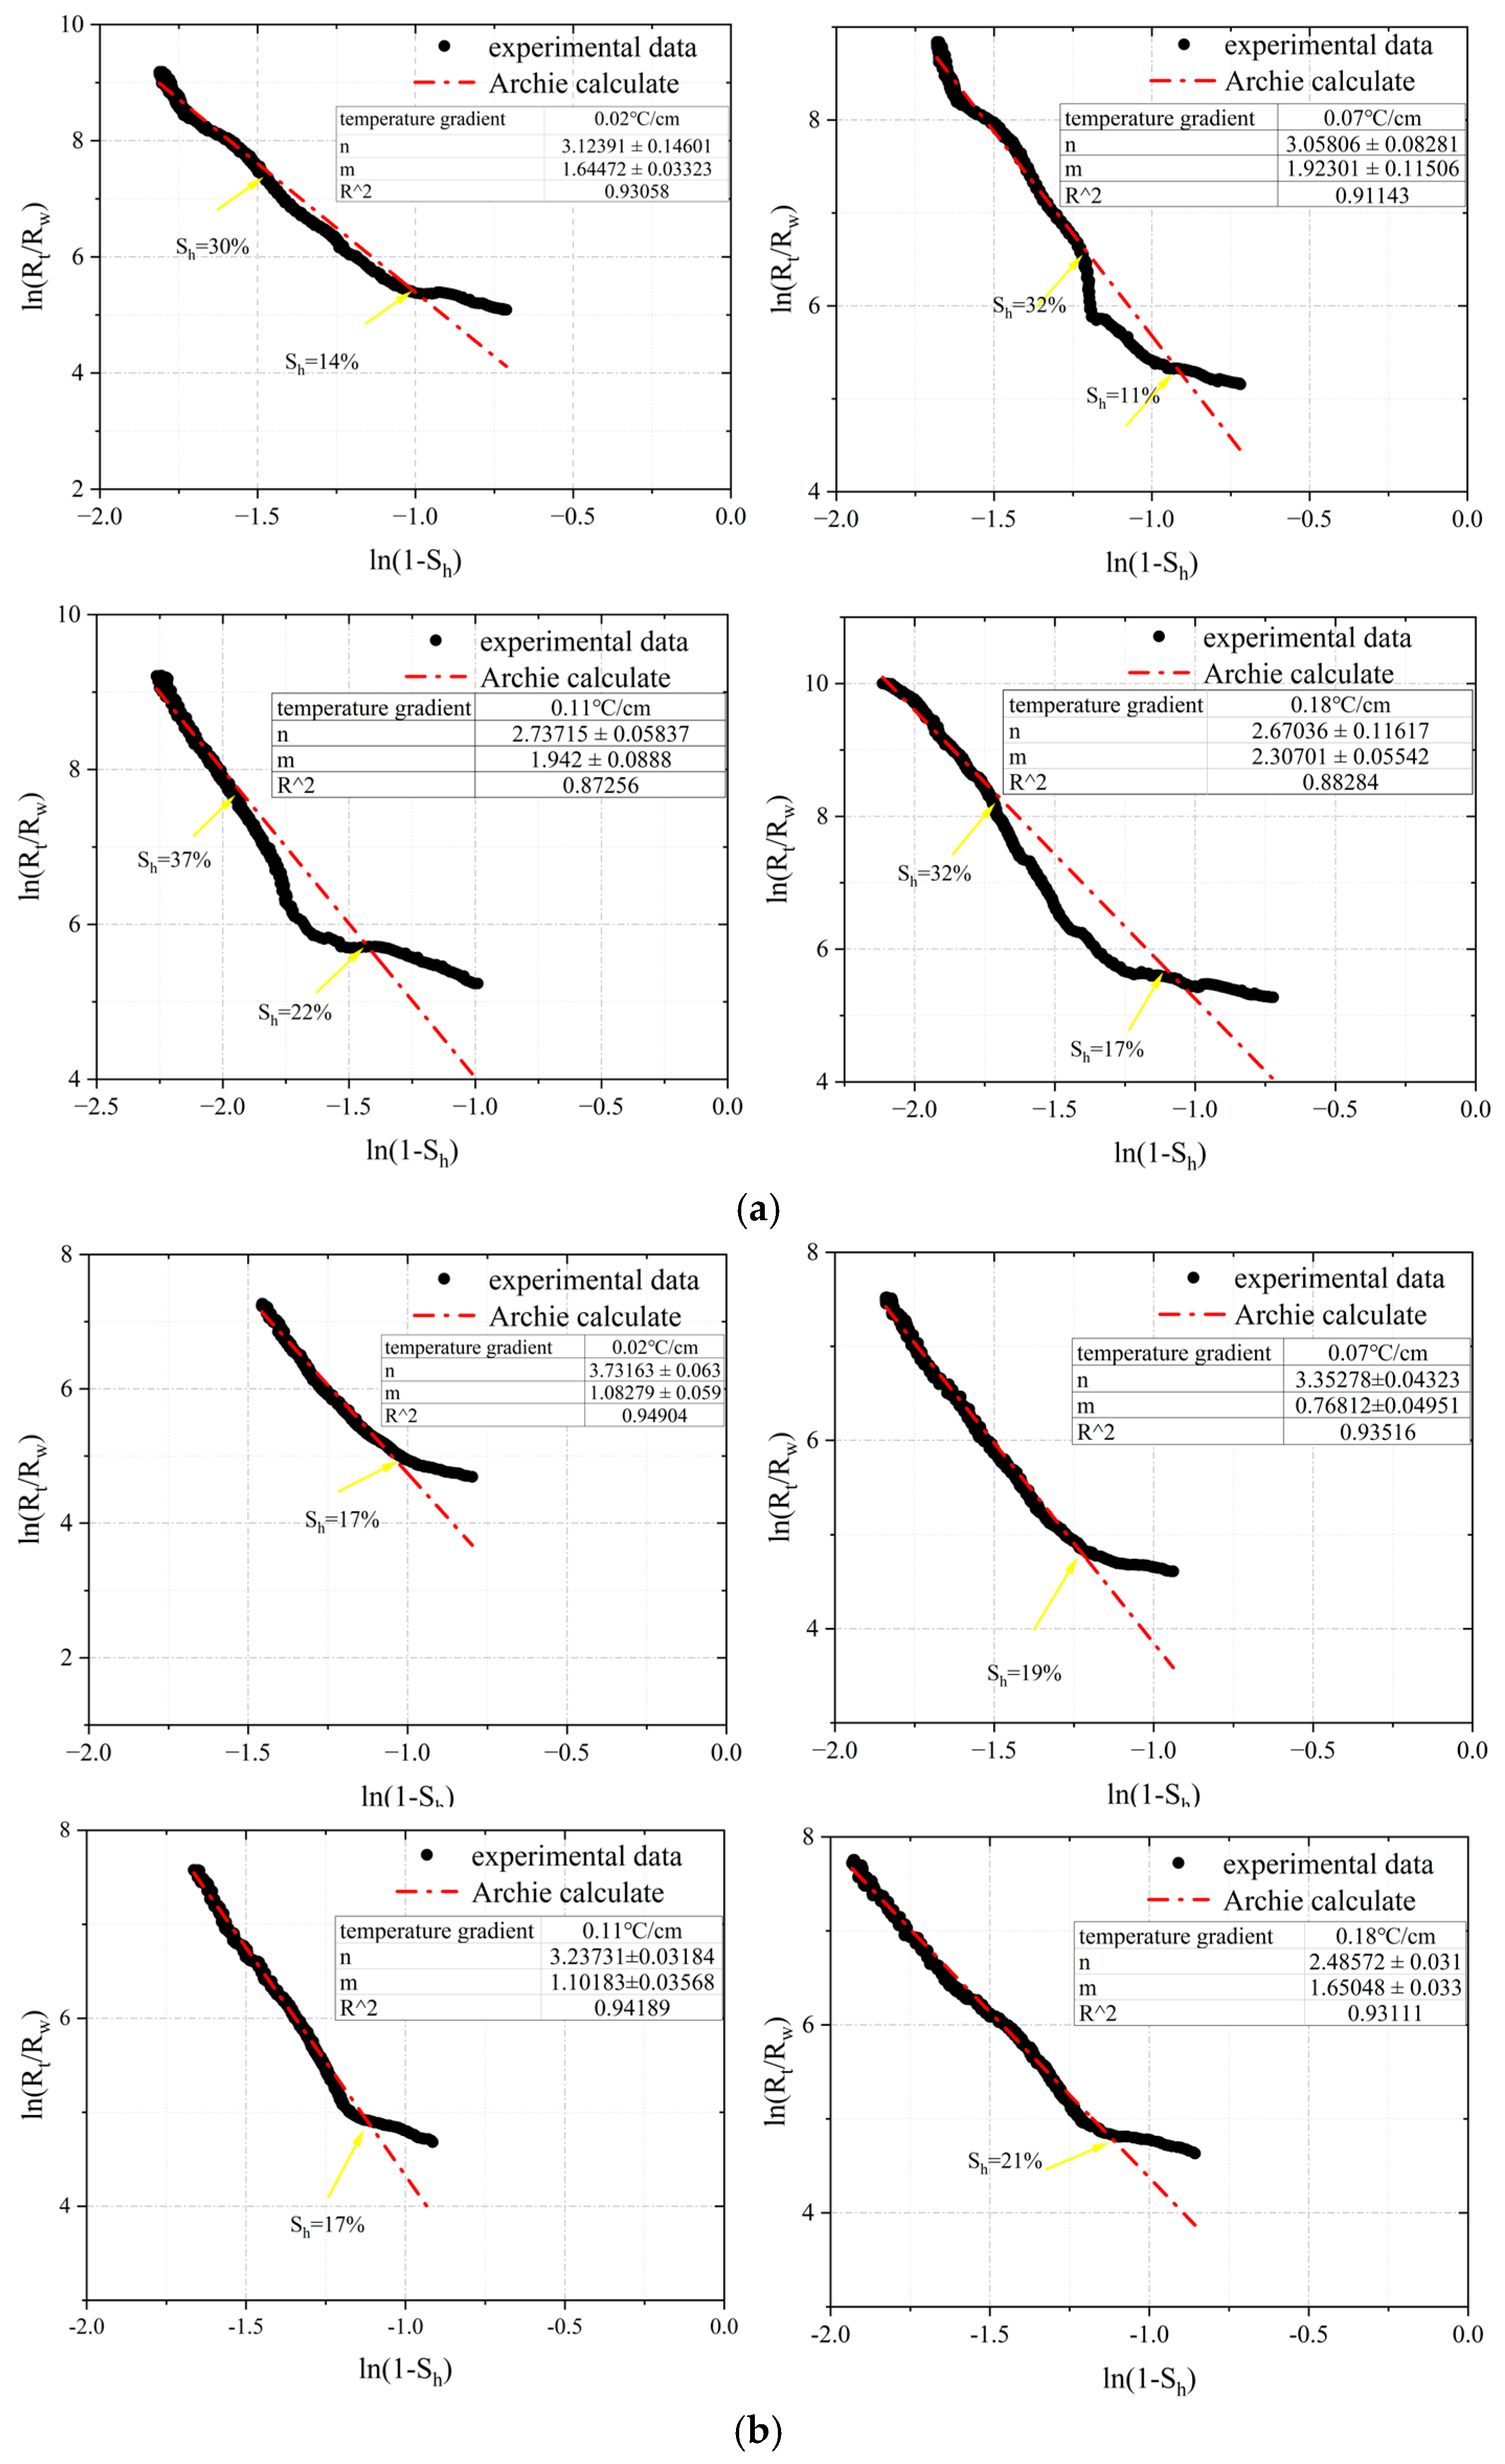
In this study, the temperature gradient was used as the variable condition, and the relative resistivity was selected as the function of the water saturation volume in the sediment pore space. The fitting results of pure coarse sand (a) and mixed sand (b) under different temperature gradient conditions are shown in Figure 2. With the decrease of temperature, the ionization degree of deionized water decreases and the resistivity increases gradually. In contrast, the fitting effect in mixed sand is better (R2 is higher); in pure coarse sand, the deviation between the actual data and the fitting line is greater with the increase of temperature gradient.
In pure coarse sand (Figure 2a), when the temperature gradient is 0.02 °C/cm, the fitting degree of m and n values (R2) is highest, and the calculated value of the optimized Archie model formula is almost the same as the actual data after Sh > 14%. When the temperature gradient is 0.07~0.18 °C/cm, and during the rapid formation of hydrate, the hydrate saturation calculated by the fitted m and n parameters is not in good agreement with the measured values. After the hydrate formation is stable, the two calculations are in good agreement under different temperature gradient conditions.
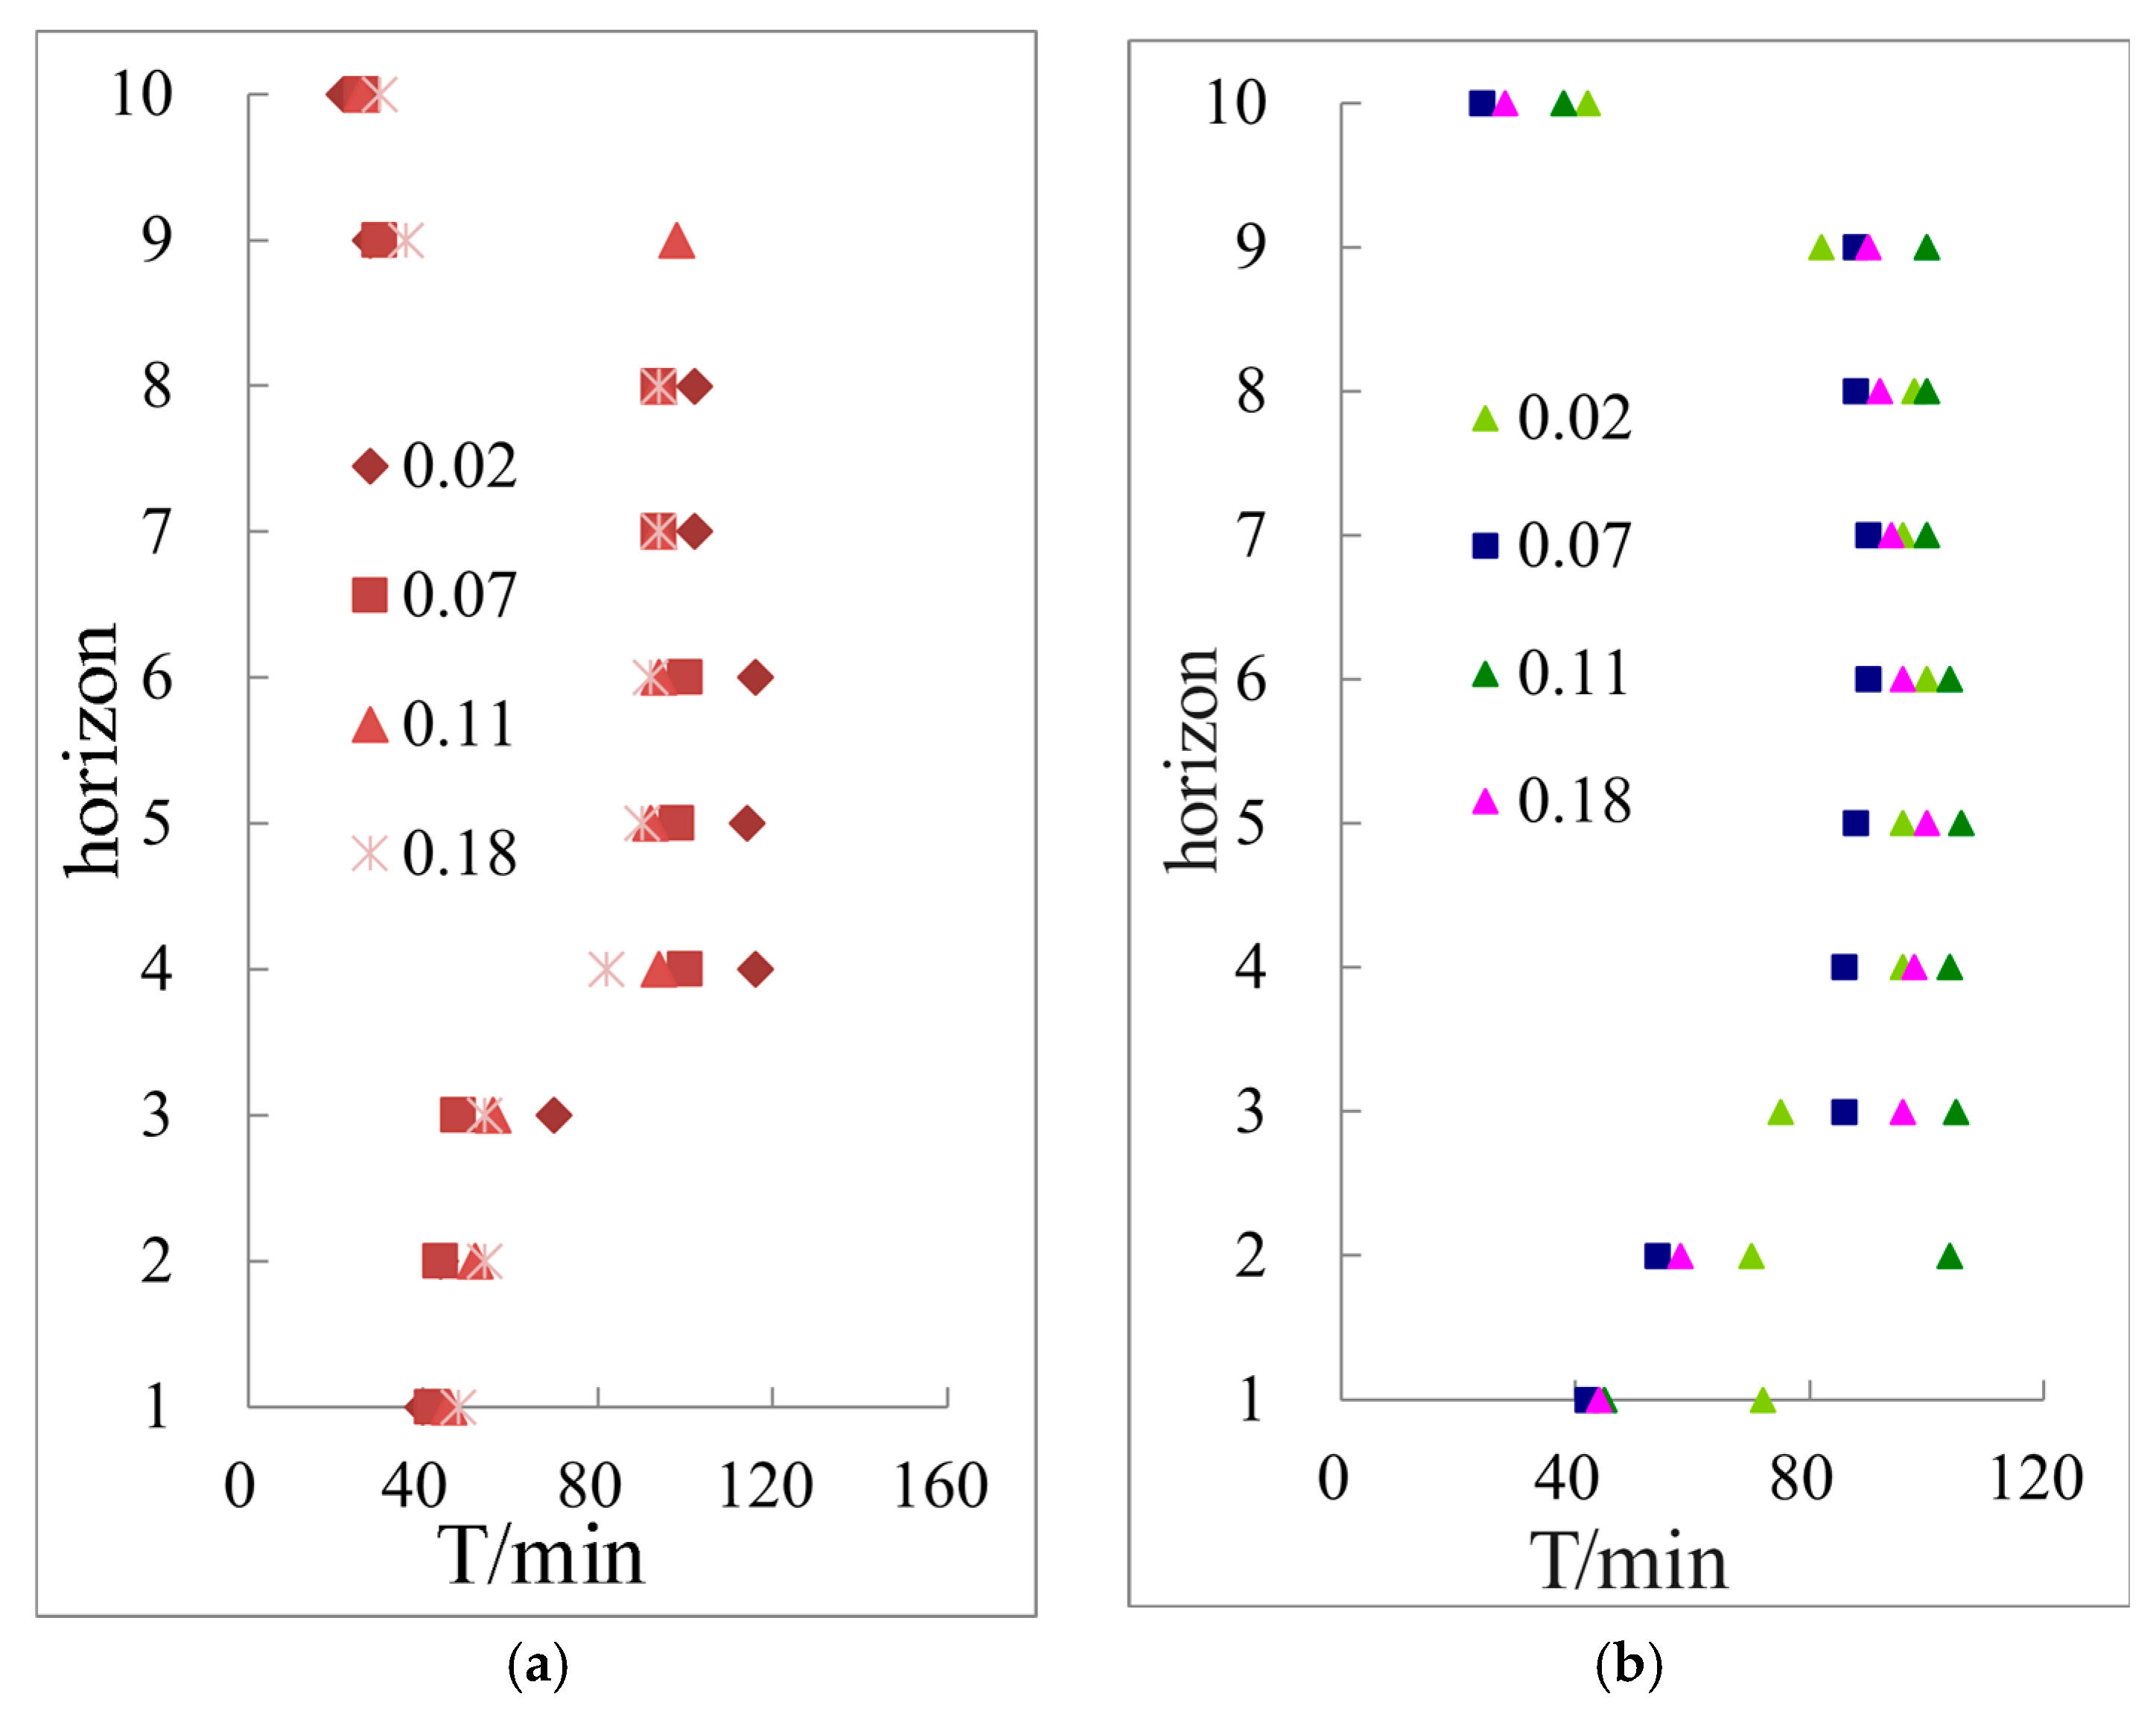
In mixed sand (Figure 2b), when Sh > 20%, the deviation between the actual data and the Archie model is smaller and more consistent. This may be due to the fact that the nucleation time of each layer of hydrate in mixed sand is relatively average (in Figure 3), which indirectly leads to a more uniform position of hydrate in different layers. In addition, the mixed sand may rapidly generate expansion-filled pores in the early stage, and the overall pore utilization rate is reduced in the later stage, resulting in slower and more stable hydrate formation. On the other hand, compared with coarse sand, the nucleation of top and bottom hydrates is mainly controlled by the initial cooling rate and less affected by the temperature gradient. In contrast, in different hydrate formation conditions, the influence of mineral particle ratio on the determination of m and n values may be greater than the cooling process, which needs to be further demonstrated in the future.
The results show that the Archie formula is more suitable for the evaluation of low-temperature-gradient- and high-saturation data (Sh ≥ 30%) in pure coarse sand, and there was a large error when the hydrate saturation is between 20% and 30% (during the rapid formation of hydrate). In the mixed sand, the influence of temperature gradient was reduced, and the overall applicability was better after Sh > 20%. However, there may be two main reasons for the deviation of Rt/Rw from the Archie equation at low saturation. On the one hand, pore structure has an influence. When the pore size and distribution are not uniform, the measurement results of electrical properties will also be affected. Therefore, at low saturation, the influence of pore structure on electrical properties may cause Rt/Rw to deviate from the Archie equation. On the other hand, at low saturation, there may be retained water in the rock. Retained water is water that cannot be excluded from pores and usually has low electrical conductivity. Therefore, at low saturation, the presence of retained water may cause Rt/Rw to deviate from the Archie equation.

3.2. The Range and Applicability Analysis of m and n Values under Different Temperature Gradient Conditions

3.2.1. The Range of m and n Values in Archie Model under Different Temperature Gradients

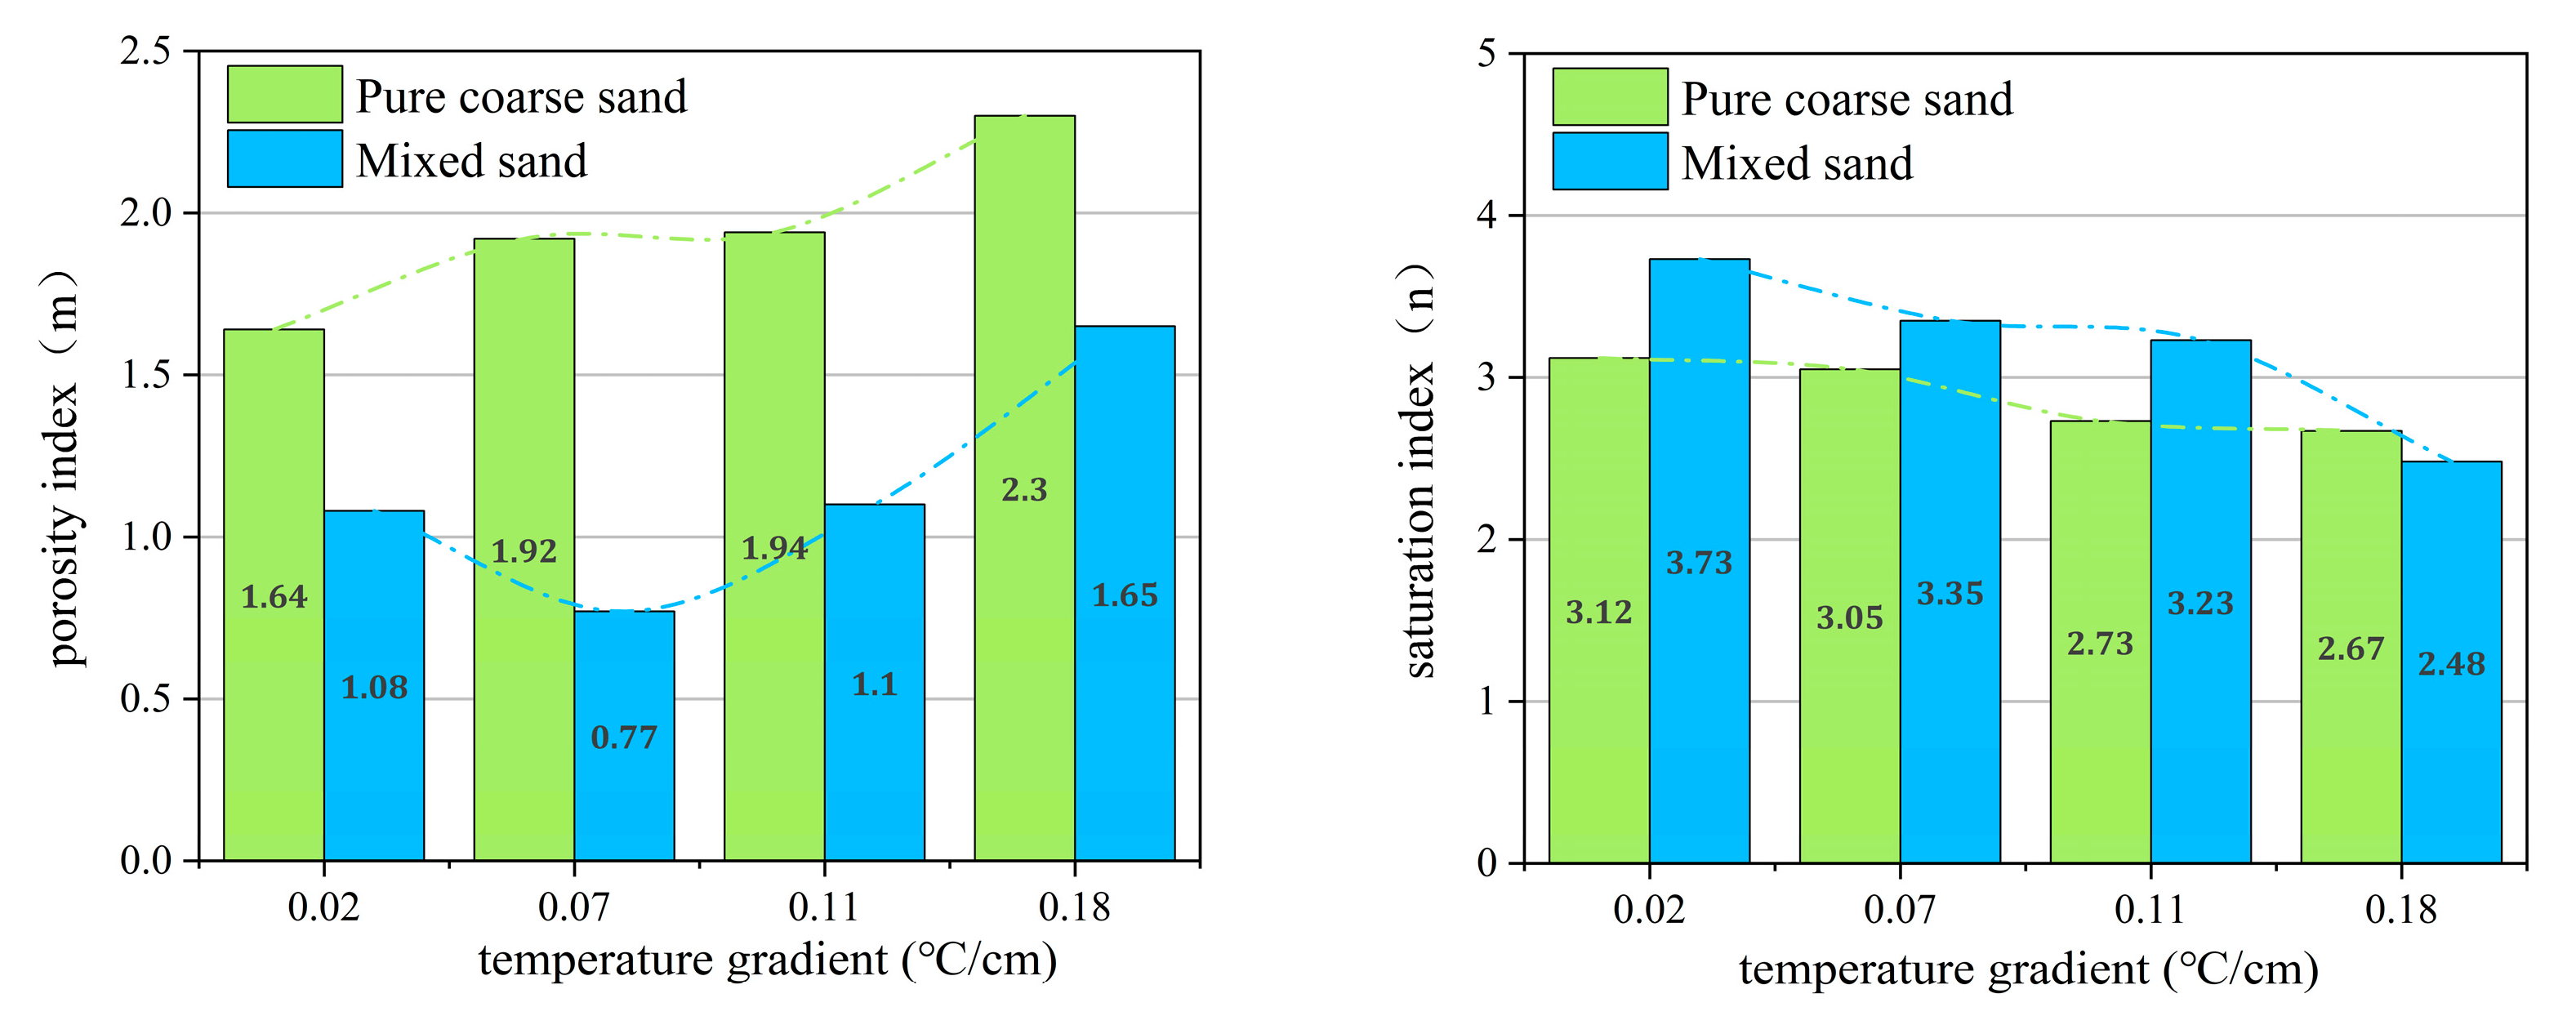
As shown in Figure 4 in the pure coarse sand experiment, the m value obtained by the optimized Archie model was 1.64~2.30, and was 0.77~1.65 in mixed sand. For the value of n, the range of n in pure coarse sand was 2.67~3.12, and was 2.48~3.73 in mixed sand. It can also be seen from the figure that the values of m and n are also closely related to the temperature gradient. In the pure coarse sand system, the m value increases with the increase of temperature gradient. In the mixed sand system, the value of m is a fluctuating change. When the temperature gradient was 0.07 °C/cm, m was the smallest, only 0.77. In addition, the m value of the pure coarse sand system was greater than that of the mixed system. In general, the n values of the two patterns obtained by fitting gradually decrease with the increase of temperature gradient. In addition, except for the 0.18 °C/cm temperature gradient, the n values of mixed sand under other temperature gradients are higher than those of pure coarse sand. The possible reason is that the number of hydration driven by low porosity (mixed sand) decreases under high temperature gradient, which affects the fitting structure of n value and reduces it. In general, the ranges of m and n in different temperature gradients and sand samples obtained by the optimized Archie model were 0.77~2.30 and 2.48~3.73, respectively.

3.2.2. Hydrate Saturation Calculated by Gas Consumption Method under Different Temperature Gradient Conditions

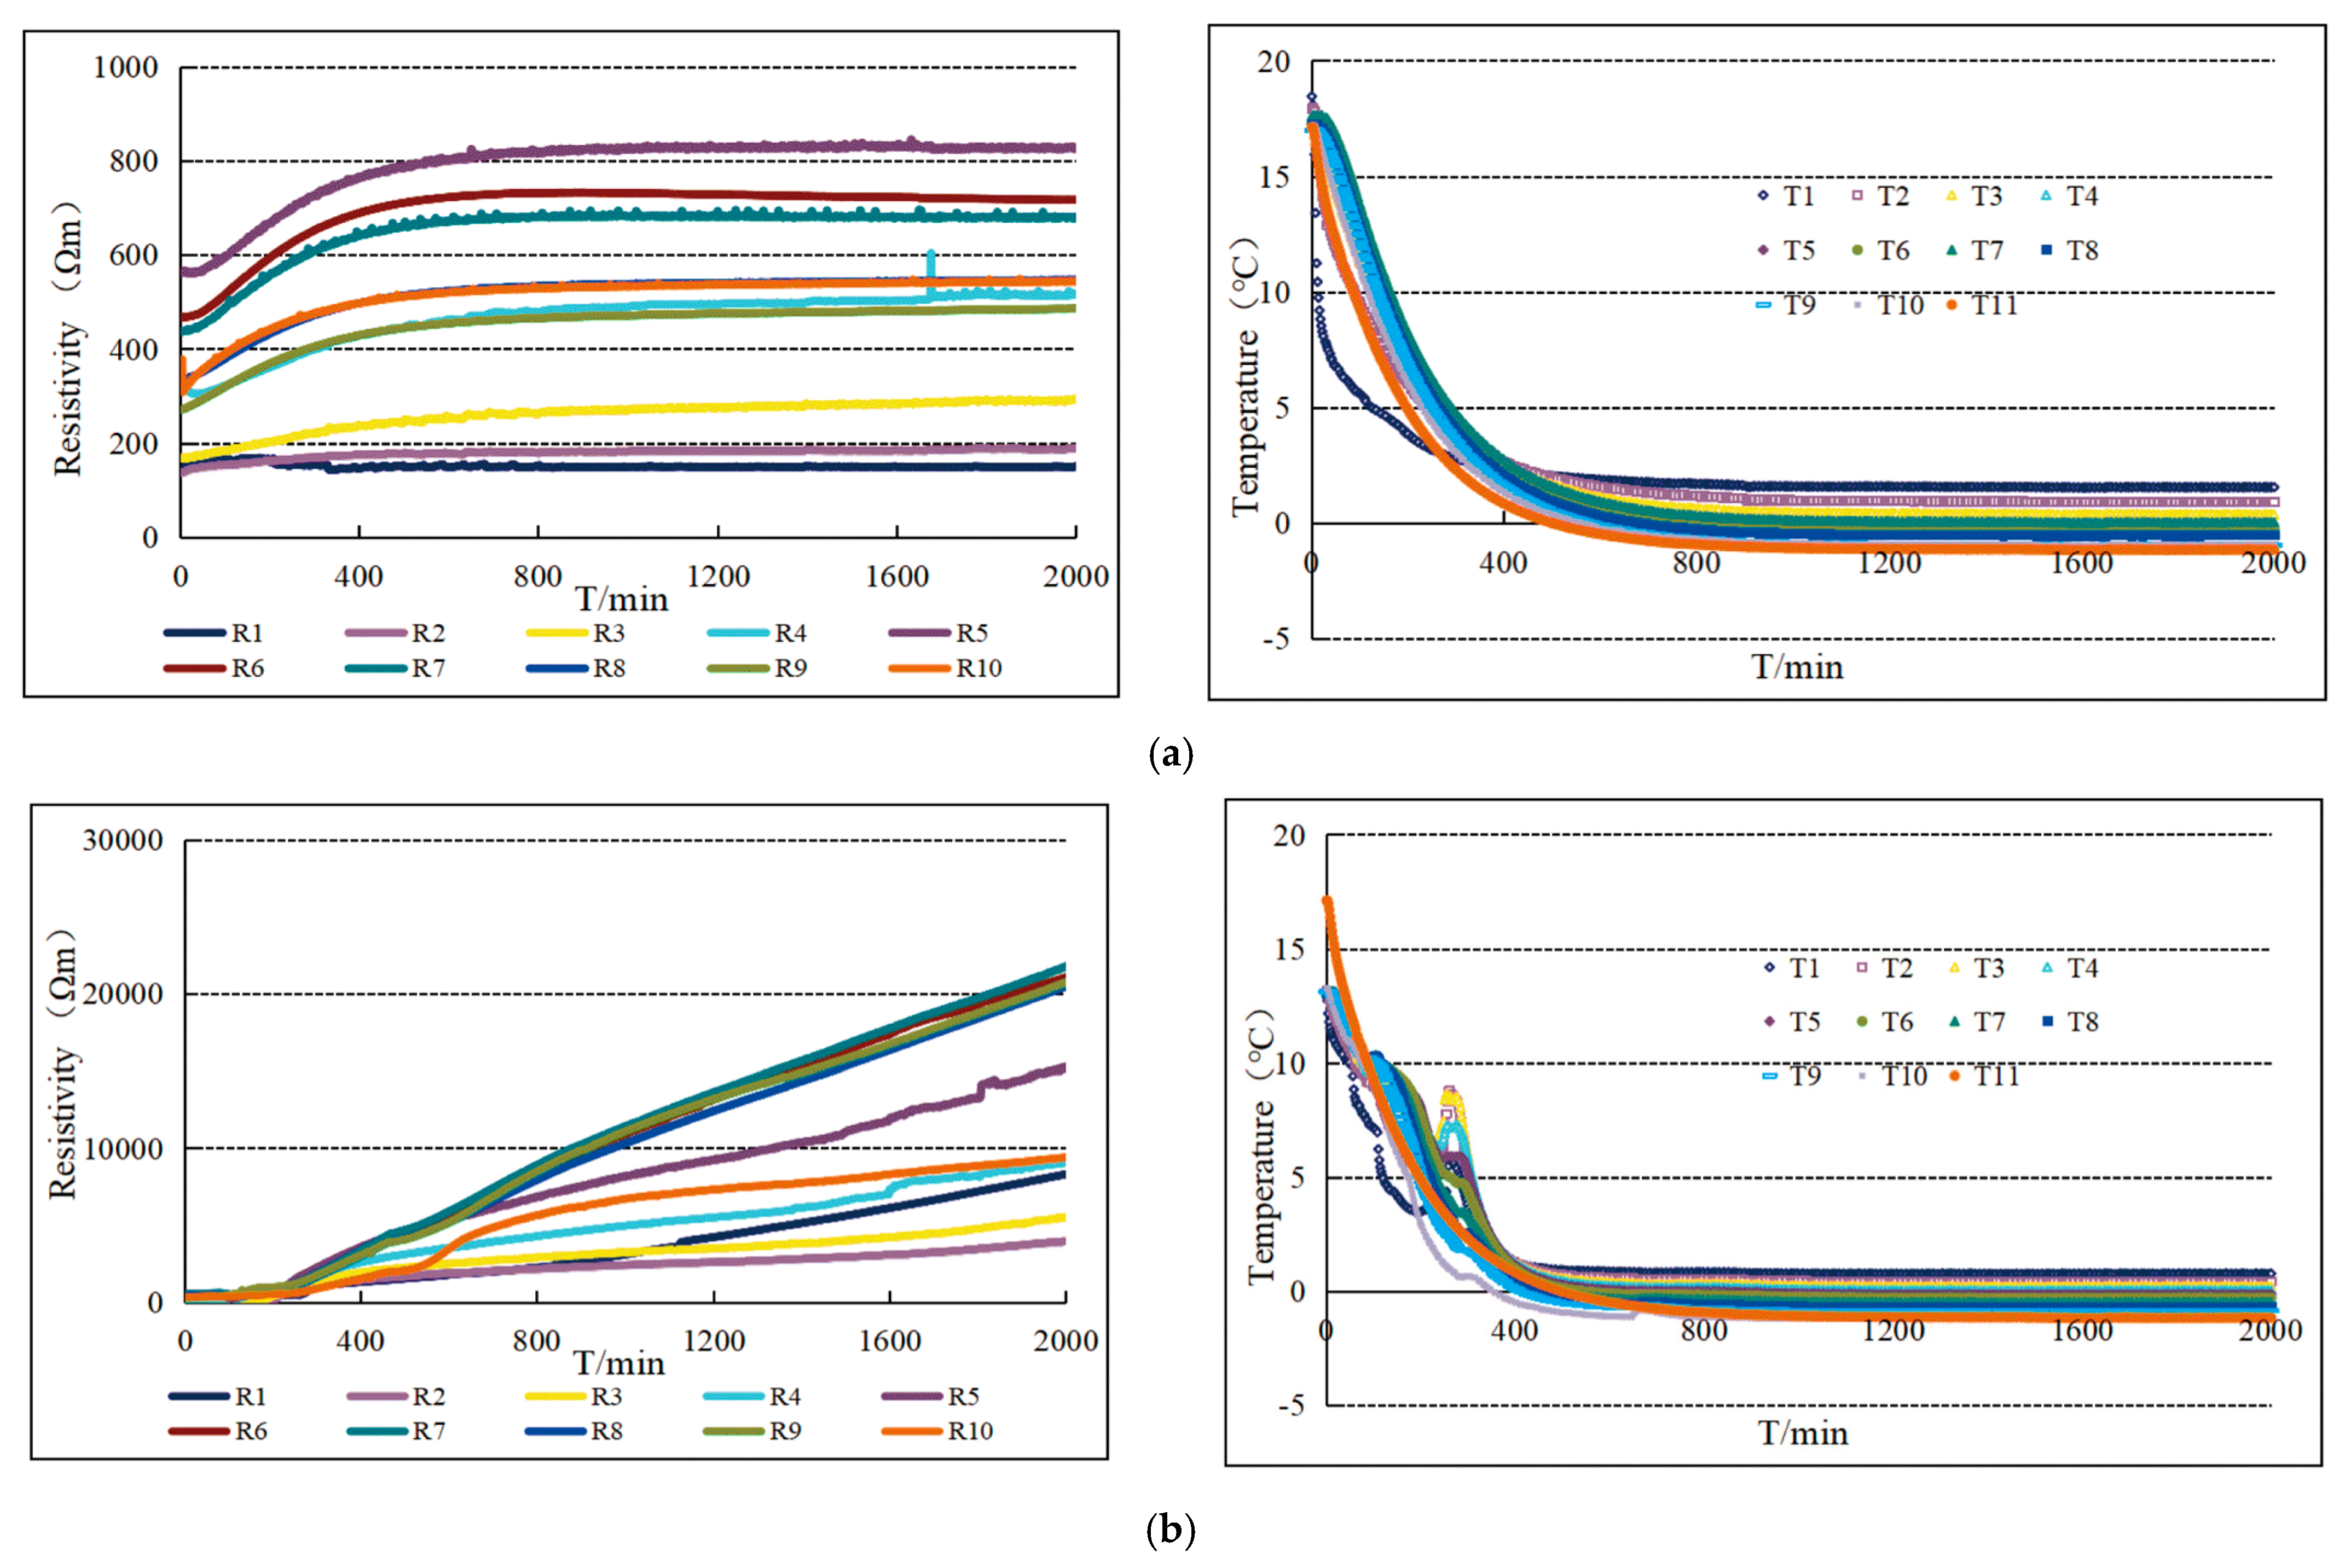
In the experiment, hydrate saturation calculation included the gas consumption method and resistivity method. The former calculates the overall hydrate saturation of the sample based on the actual consumption of methane gas during hydrate formation, while the latter can solve the real-time hydrate saturation according to the Archie formula. The gas consumption method was used to calculate the hydrate saturation generated under different temperature gradients, and it was verified that hydrate formation was the first step. In this paper, a blank control experiment was carried out, and a pure coarse sand system with a temperature gradient of 0.02 °C/cm was selected to compare the temperature and resistance processes in the formation of ice and hydrate.
As shown in Figure 5 (R1 to R10 represents the resistivity of each layer from layer1 to layer 10; T1 to T10 represents the temperature of each layer from layer 1 to layer 10; T11 represents the gas phase temperature of the reactor). Under the temperature gradient of 0.02 °C/cm, the resistivity of each layer in the uninflated (ice generation) experimental group increases slowly with the decrease of temperature, and the resistivity of each layer tends to be stable with the temperature tends to be stable, the maximum is only 800 Ω·m; in the aerated group (hydrate formation), the resistivity of each layer increases linearly after the temperature is stable, and the resistivity of the lowest layer can reach 8000 Ω·m, which is much larger than that of the uninflated experimental group, which fully indicates that hydrate is formed in the coarse sand system under this temperature gradient. The saturation of hydrate formation under different temperature gradients is calculated by the combined Formula (5), which lays a foundation for verifying the certainty of Archie formula model parameters, and the calculation results are shown in Figure 6.

3.2.3. Comparison of Dynamic Hydrate Saturation Calculated by Optimized Archie Model and Gas Consumption Method

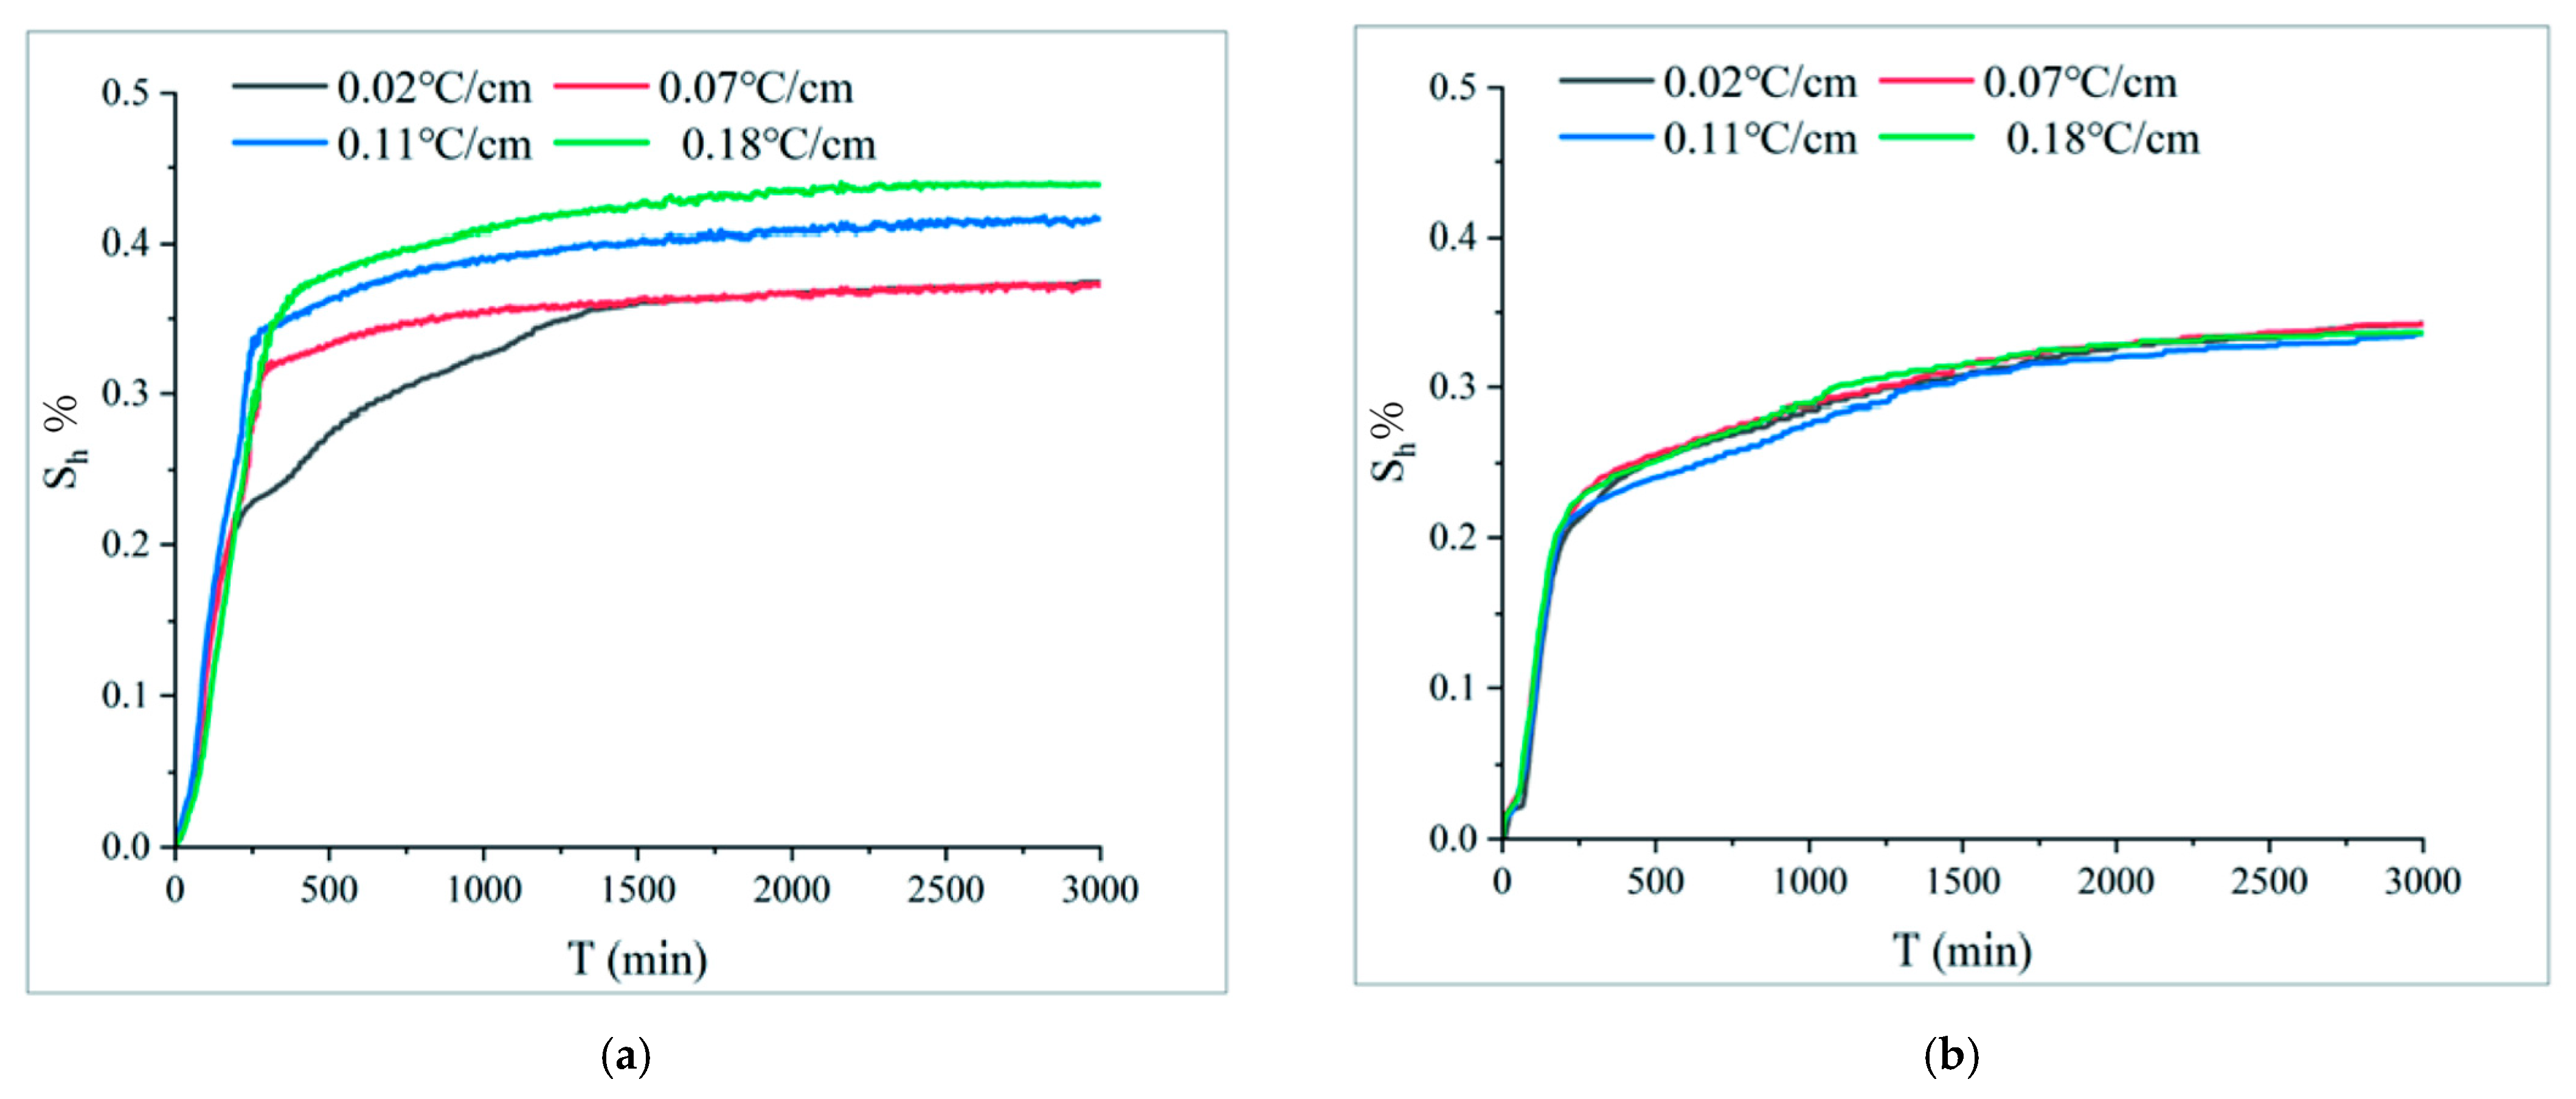
Figure 7 shows the comparison of dynamic hydrate saturation under different temperature gradient conditions based on the optimized Archie model and gas consumption method. After back substitution, the difference between the optimized Archie model and the actual calculation was between 0.8% and 2.5%. Except for a few experimental groups, the average error was less than 3%, and the relative error was small as a whole. This shows that the parameters m and n fitted under different temperature gradient conditions are reliable.
In pure coarse sand, the variation function of hydrate saturation with time calculated by gas consumption was always higher than that calculated by resistivity method in the first 20 h, but the calculation difference was basically stable in the last 30 h. However, in the mixed sand, the stability time was delayed, but the difference between the hydrate saturation value calculated by the final model and the actual measurement was smaller than that of the coarse sand. Figure 7 also shows that the selection of m and n values is suitable for the saturation calculation after hydrate stabilization. The reason for the high change of hydrate saturation calculated by gas consumption method with time may be: On the one hand, when methane is injected into the reactor, the temperature in the reactor increases due to the work of the gas in the reactor, which makes the calculated initial gas volume in the reactor higher, resulting in higher gas consumption and higher hydrate saturation. On the other hand, under the condition of high pressure in the early stage, the dissolution of methane gas in water consumes a part of methane gas, resulting in a rapid decrease in pressure, which in turn leads to a large calculated value of hydrate saturation. When the temperature gradient was 0.07 °C/cm, the overall applicability of the optimized Archie model in the two sands was the best. In summary, as long as the correct m and n values are determined, the optimized Archie model can improve the accuracy of hydrate saturation assessment compared with previous studies [31]. This also shows that the calculation of hydrate saturation with the Archie formula can ignore the influence of gas in porosity to some extent. More pores are filled or cemented completely when water expands to hydrate, and the remaining pores are reduced.
Taking 0.07 °C/cm as the boundary value, with the increase of temperature gradient, the gap between the optimized Archie calculation model and the actual gas calculation hydrate saturation conversion was higher. Especially in the pure coarse sand with a temperature gradient of 0.18 °C/cm, the main reason is the influence of the random distribution of hydrate. The reason for this phenomenon is that the temperature around the top decreases rapidly, and the pore water in the medium migrates to the top due to the temperature gradient and hydrate formation. The results are shown in Figure 8, which clearly shows the presence of hydrates around the copper block. Compared with mixed sand, the top water migration fluctuation and hydrate formation of pure coarse sand are more significant. As the temperature decreases, the gas consumption increases and the water and gas contact more closely in a closed environment, which also aggravates the formation of upper massive hydrates [32]. Moreover, due to the freezing phenomenon after hydrate formation, more hydrates are formed outside the sand body, which will also lead to errors in saturation calculation and porosity. However, the gas consumption method calculated by temperature and pressure assumes that the location of hydrate is the calculation area of porosity in the reactor, which leads to the coarsening of porosity and reduces the total reaction interface or grain boundary energy. Therefore, it may be the case that the hydrate saturation calculated by gas conversion in the high temperature gradient and pure coarse sand system is significantly lower than that calculated by the Archie formula.
In addition, considering the influence of the expansion of pore water formed by hydrate formation on the random distribution, the maximum expansion coefficient (Kh) generally did not exceed 38%. In the stable growth stage of hydrate and after the small change of porosity, pore calculation has little effect on porosity, and the change is smaller when the hydrate saturation is higher. Because this paper chooses a unified expansion coefficient, it leads to a certain error. In most cases, hydrates will expand to varying degrees at different stages of induction, formation and stabilization (in terms of volume compared to water) and unevenly occupy pores, filling pores of sediment particles, carrying solids or cementing materials. This also shows that in practical engineering applications, due to the needs of drilling and exploration, there are errors in determining hydrate reserves after understanding sand and pores through real gas conversion. Therefore, the Archie formula is expected to improve the calculation accuracy in the future.

3.3. Determination of Hydrate Saturation and Its Distribution in Different Layers Based on the Optimized Archie Model

3.3.1. Hydrate Saturation in Different Layers under Different Temperature Gradient Conditions Calculated by Archie Model

The hydrate saturation of each layer calculated by the model was compared with the actual layered sampling and decomposition results, taking 0.02 °C/cm as an example. As shown in Table 5, the samples in the reactor are sequentially marked as 1–10 layers from bottom to top. In the coarse sand, the model calculation results show that the hydrate was mainly concentrated at both ends and less in the middle layer, while the hydrate saturation calculated by the direct estimation method was increased in the lower part and decreased in the upper part. This is because hydrates formed more massive hydrates at the top of the coarse sand system, as shown in Figure 8. At the same time, during the sampling process, partial hydrate decomposition caused the actual recorded gas production of hydrate decomposition to be small, which further indicated that the reliability of the Archie model calculation results was high. In the mixed sand, because there was no large hydrate formed at the top, the results of the model calculation and the direct estimation method were not much different, and the errors were less than 6%. This shows that the model parameter method is reliable to analyze the distribution of hydrate under different temperature gradient conditions.

3.3.2. The Saturation Variation and Distribution of Hydrate Formation Process under Different Temperature Gradients Are Simulated by Archie Model

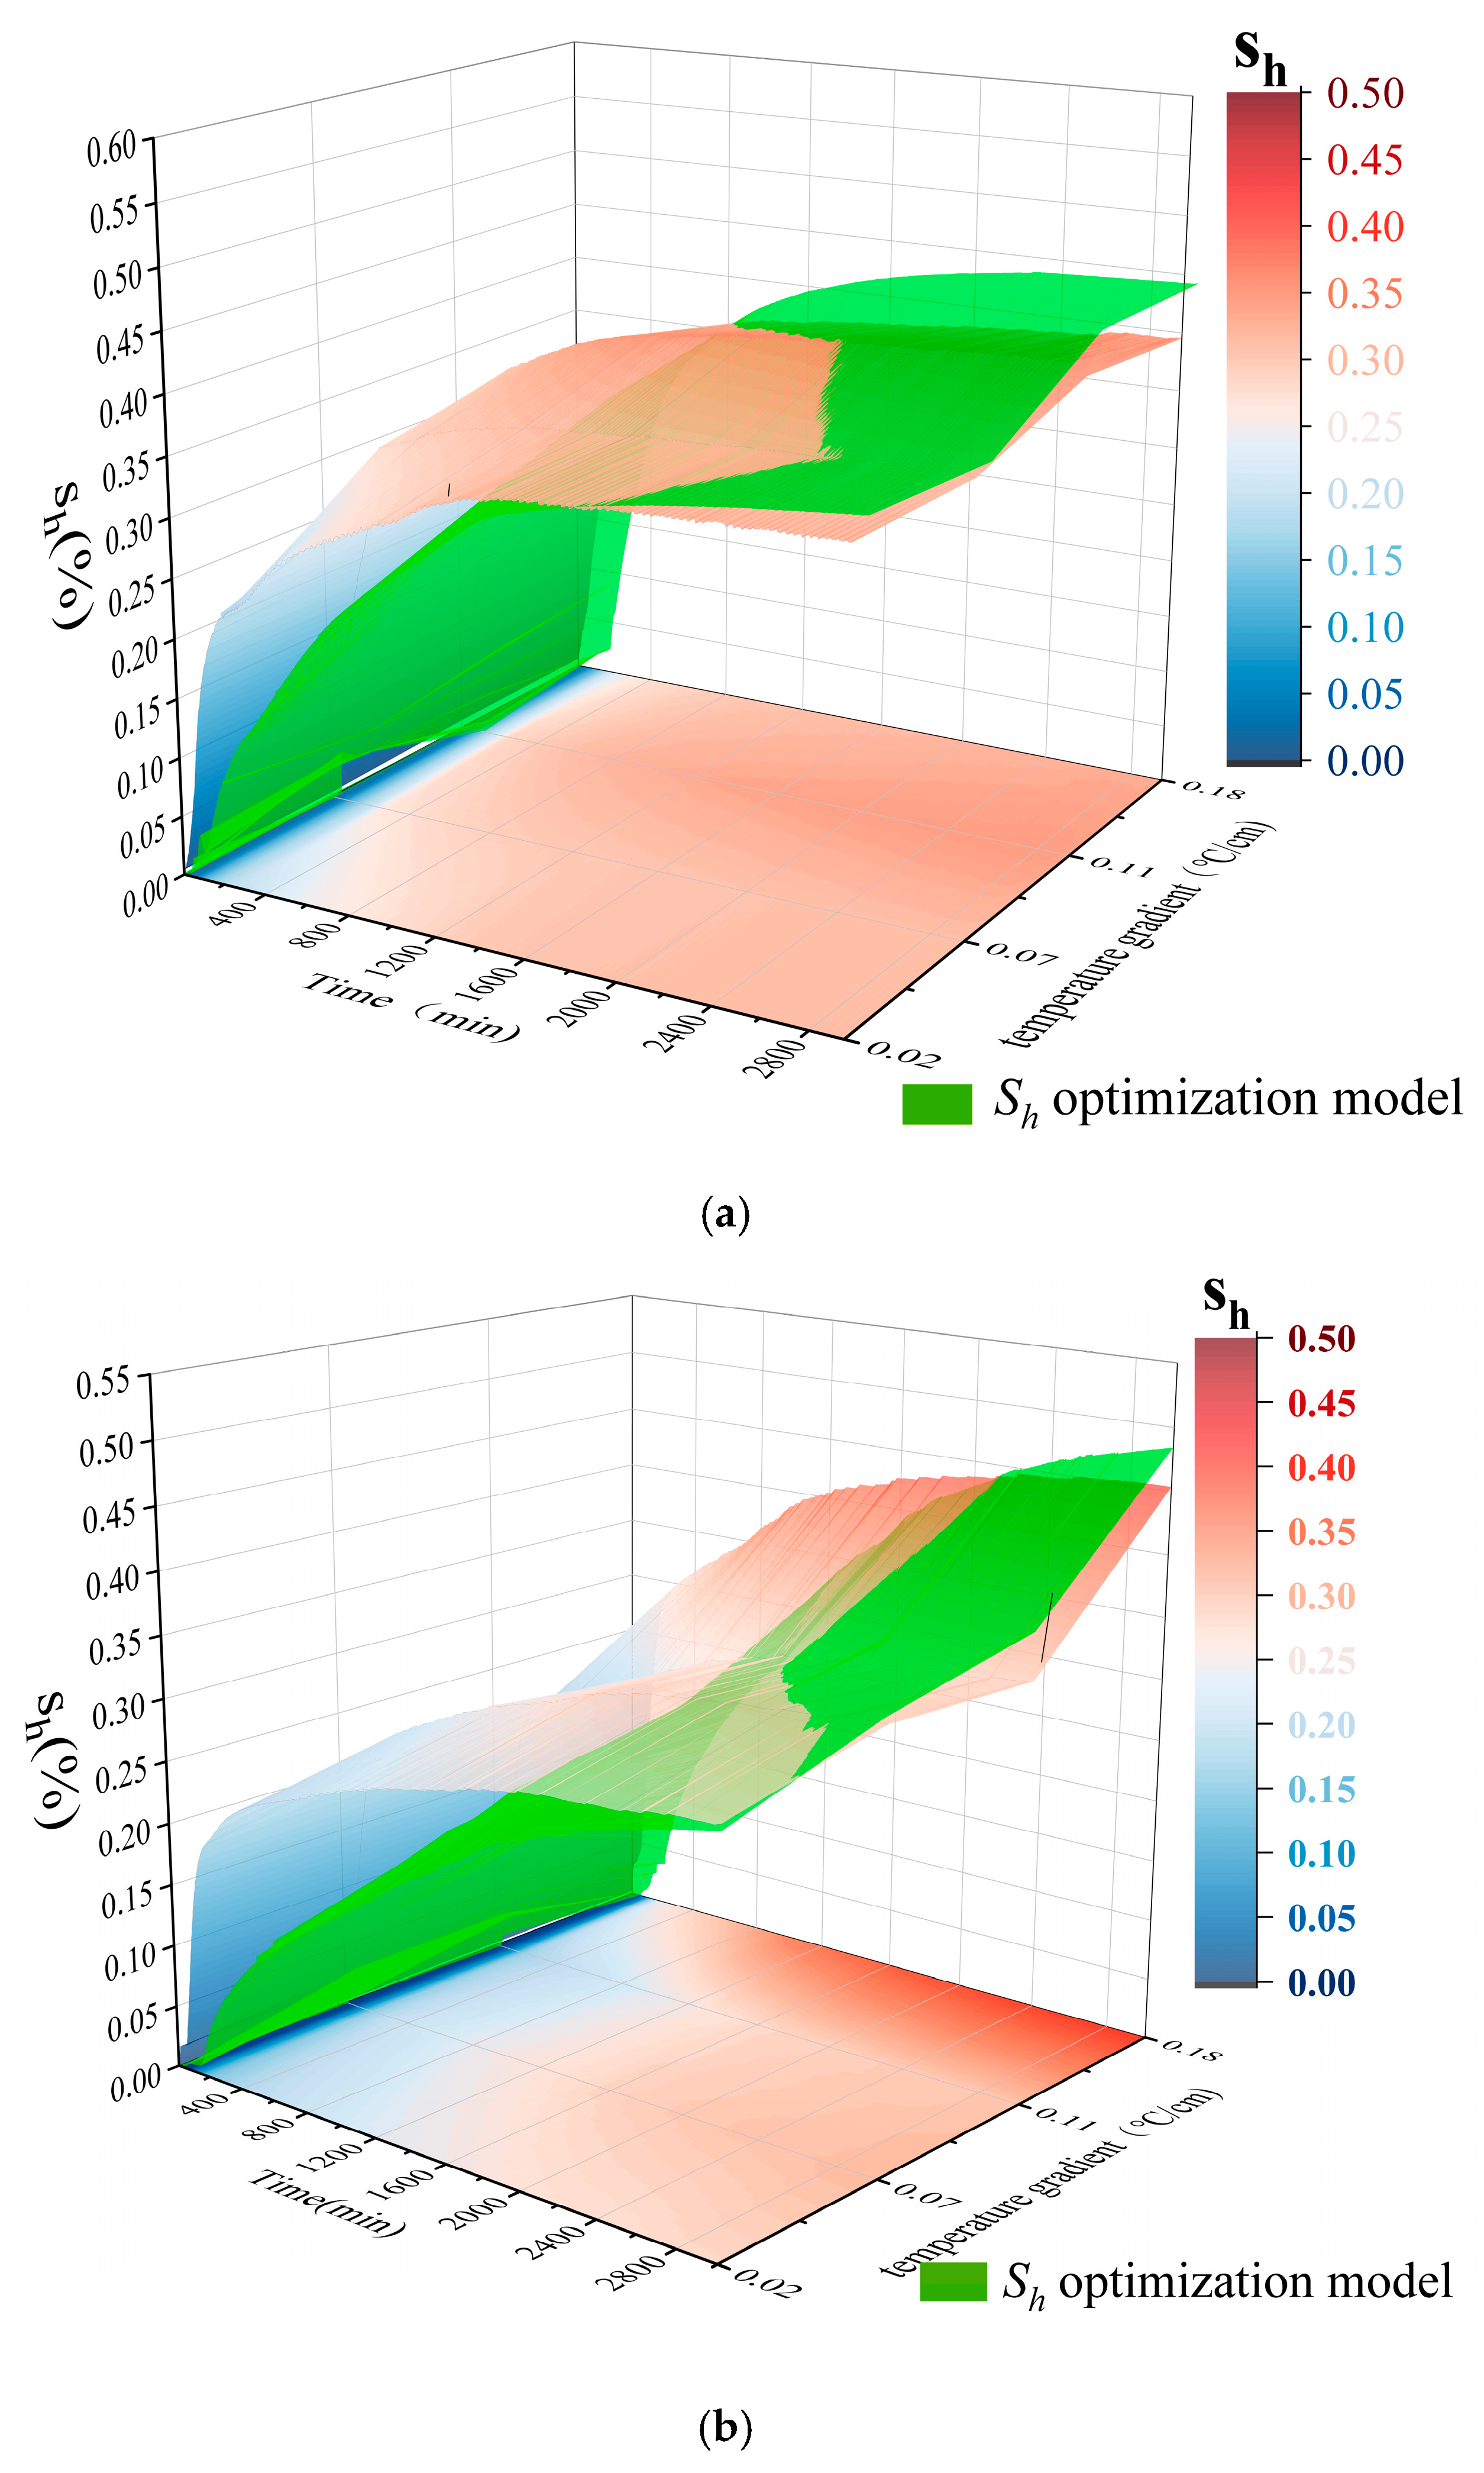
In this study, the reliability of m and n parameter values was confirmed by comparing the hydrate saturation calculated by the optimized Archie model with the gas consumption method combined with the actual amount of decomposed gas, which provided the Archie formula evaluation parameters of reservoirs with different temperature gradients for subsequent exploration data. Furthermore, the hydrate saturation and the overall change trend of different layers were calculated by the optimized Archie model. Next, the time-varying hydrate saturation distribution in coarse sand and mixed sand will be described in detail.
As shown in Figure 9 in pure coarse sand, the hydrate saturation of some layers reached 30% after 500 min. At about 1000 min, the formation of hydrate in pure coarse sand gradually approached stability in different layers, and the average hydrate saturation was above 30%. The final hydrate formation area was mainly divided into three parts: upper (11–16 cm), middle (6–11 cm) and lower (0–6 cm), and the lower part was the largest. As the temperature gradient increased, the upper hydrate saturation gradually increased, and reached a maximum of 44% when the temperature gradient was 0.18 °C/cm. When the temperature gradient was 0.02 °C/cm, the hydrate distribution was least affected by the temperature gradient. In the range of 0.07~0.11 °C/cm, the enrichment degree of hydrate at the bottom increased with the increase of temperature gradient, and the hydrate saturation reached 69% at 0.11 °C/cm. When the temperature gradient was 0.18 °C/cm, the surrounding water was affected by the lower Gibbs free energy and the suction force on the water was stronger [33], resulting in a gradual increase in the upper saturation of hydrate.
In the mixed sand, the medium had a strong retention of water, and the hydrate was more adsorbed on the surface of the sediment. At this time, the sedimentary layer had high compressibility, low water conductivity and low permeability [34], which will indirectly reduce porosity, increase contact between particles and hinder material migration within the medium, resulting in smaller differences in hydrate saturation and lower saturation in different layers. During the whole hydrate formation process of mixed sand, after 1500 min, the average hydrate saturation of different layers was more than 20%. As the temperature gradient increased, the hydrate saturation in the middle (5–10 cm) gradually increased, and the final saturation in the upper part also increased. When the temperature gradient was 0.02 °C/cm, the hydrate was mainly distributed in the bottom (0–4 cm) and middle (6–11 cm); when the temperature gradient was 0.07~0.11 °C/cm, the hydrate distribution was relatively uniform, and when 0.18 °C/cm, the hydrate accumulated in the middle, and the saturation reached a maximum of 58%. In addition, due to the better water holding capacity and lower permeability of mixed sand, the rapid formation of hydrate in pure coarse sand occurred earlier and was more saturated than that in mixed sand.
The above analysis results show that the influence of hydrate saturation distribution under different temperature gradients is slightly different. In view of the applicability of the m and n values calculated by the optimized Archie model in the hydrate formation period under specific temperature and pressure conditions, the matching degree in pure coarse sand was higher, and further study is expected on different hydrate formation periods in the future. Therefore, in order to find the evaluation of hydrate saturation suitable for different types of sandy reservoir pore space, it is of great significance to optimize the parameters of the Archie formula under different temperature gradients.

4. Conclusions

This paper primarily investigated the fitting calculation of the variables m and n, based on electrical data obtained from the methane hydrate formation process under varying temperature gradient conditions. The validity of these parameters was confirmed by comparing the gas consumption method and the amount of decomposed gas with the hydrate saturation calculated by the optimized Archie model. Additionally, the distribution of methane hydrate in unsaturated sand under different temperature gradients was explored using the optimized Archie model.
The results indicate that the ranges of m and n obtained by the optimized Archie model in different temperature gradients and sand samples are 0.77–2.30 and 2.48–3.73, respectively, which is more accurate than previous studies. The m value of pure coarse sand increases gradually with the increase of temperature gradient, while the m value of mixed sand fluctuates. The n values of both samples decrease with the increase of temperature gradient. It is evident that the influence of temperature gradient is a crucial factor in the application of Archie calculation.
Furthermore, it was found that in pure coarse sand, after the hydrate formation is stable (Sh ≥ 0.3), the difference between the optimized Archie model calculation and the actual data value is small. At this point, the fitted m and n values are the optimal parameters in this hydrate saturation state, and there is a significant error in the range of 20% < Sh < 30%. Finally, the inversion of hydrate saturation distribution by the optimized Archie model revealed that in pure coarse sand, the hydrate formation process is mainly divided into three regions, with the lower enrichment region accounting for the main part and gradually accumulating to both ends with the increase of temperature gradient. In mixed sand, the concentration of hydrate saturation in the middle increases with the increase of temperature gradient. Except for at 0.18 °C/cm, the distribution of hydrate saturation in the whole mixed sand is more uniform than that in pure coarse sand.
The above studies show that the m and n values fitted by hydrate formation experiments under different temperature gradients will greatly improve the calculation accuracy of hydrate reserves in hydrate sedimentary layers, which can improve the applicability of the Archie formula model in evaluating hydrate reserves and distribution in sedimentary layers. This provides a theoretical basis for the exploration of natural gas hydrate reservoirs. In the future, more variable conditions in the formation process of natural gas hydration should be considered, such as the fitting and influence of m and n values under different cooling processes and sand ratio contents. In addition, considering that the influence of m and n values on hydrate saturation is greater than that of a and b, m and n should be preferentially studied. In the future, it is expected that a and b will continue to be optimized, thus expanding the application scope of the Archie formula in hydrate saturation assessment.

Author Contributions

J.L. carried out most of the experiments and prepared all of the figures. The manuscripts were prepared by J.L.; Y.W., W.J., J.Z. and P.Z. conceived the research. Y.W. directed specific experiments. W.J. and Y.T. provided constructive suggestions for English translation. Y.T. conducted data analysis. All authors have read and agreed to the published version of the manuscript.

Funding

This research was funded by the Gansu Province Science and Technology Major Special Projects (22ZD6FA004), the Innovation Fund for Small- and Medium-sized Enterprises in Gansu Province, China (No. 22CX3JA003) and the Independent Research Project of State Key Laboratory of Frozen Soil Engineering (No. SKLFSE-ZT-202103).

Data Availability Statement

Not applicable.

Conflicts of Interest

The authors declare no conflict of interest.

References

  1. Fu, Y.R.; Li, M.L.; Wang, S.Y. The present situation and prospect of exploration and development of combustible ice in permafrost in China. Eng. Res.-Eng. Interdiscip. Perspect. 2007, 10, 440–450. [Google Scholar]
  2. Wei, J.; Fang, Y.; Lu, H. Distribution and characteristics of natural gas hydrates in the Shenhu Sea Area, South China Sea. Mar. Pet. Geol. 2018, 98, 622–628. [Google Scholar] [CrossRef]
  3. Nobes, D.C.; Davis, E.E.; Villinger, H. Prediction of Bulk Physical Properties of Oceanic Sediments at Depth from Sea-Floor Geophysical Measurements. Abstract 1986, 70, 941. [Google Scholar]
  4. Gabitto, J.F.; Tsouris, C. Physical properties of gas hydrates: A review. J. Thermodyn. 2010, 2010, 271291. [Google Scholar] [CrossRef] [Green Version]
  5. Archie, G.E. The electrical resistivity log as an aid in determining some reservoir characteristics. Trans. AIME 1942, 146, 54–62. [Google Scholar] [CrossRef]
  6. Sweeney, S.A.; Jennings, H.Y., Jr. Effect of wettability on the electrical resistivity of carbonate rock from a petroleum reservoir. J. Phys. Chem. 1960, 64, 551–553. [Google Scholar] [CrossRef]
  7. Waxman, M.H.; Smits, L.J.M. Electrical conductivities in oil-bearing shaly sands. Soc. Pet. Eng. J. 1968, 8, 107–122. [Google Scholar] [CrossRef]
  8. Li, F.G.; Sun, C.Y.; Li, S.L.; Chen, G.J.; Guo, X.Q.; Yang, L.Y.; Zhang, K. Experimental studies on the evolvement of electrical resistivity during methane hydrate formation in sediments. Energy Fuels 2012, 26, 6210–6217. [Google Scholar] [CrossRef]
  9. Perez-Rosales, C. On the relationship between formation resistivity factor and porosity. Soc. Pet. Eng. J. 1982, 2, 531–536. [Google Scholar] [CrossRef]
  10. Glover, P. Geophysical Properties of the Near Surface Earth: Electrical Properties-ScienceDirect. Treatise Geophys. 2015, 11, 89–137. [Google Scholar]
  11. Han, Y.; Zhou, C.; Yu, J.; Li, C.; Hu, F.; Xu, H.; Yuan, C. Experimental investigation on the effect of wettability on rock-electricity response in sandstone reservoirs. Fuel 2019, 239, 1246–1257. [Google Scholar] [CrossRef]
  12. Wyllie, M.R.J.; Gregory, A.R. Formation factors of unconsolidated porous media: Influence of particle shape and effect of cementation. J. Pet. Technol. 1953, 5, 103–110. [Google Scholar] [CrossRef]
  13. Huang, Q.; Zhang, J.; Cai, H. Evaluation Method for Identifying Low resistance reservoir based on main control factors. J. Xi’an ShiYou Univ. 2017, 32, 35–39. [Google Scholar]
  14. Zhao, J.; Liu, C.; Li, C. Pore-Scale Investigation of the Electrical Property and Saturation Exponent of Archie’s Law in Hydrate-Bearing Sediments. J. Mar. Sci. Eng. 2022, 10, 111. [Google Scholar] [CrossRef]
  15. Pearson, C.; Murphy, J.; Hermes, R. Acoustic and resistivity measurements on rock samples containing tetrahydrofuran hydrates: Laboratory analogues to natural gas hydrate deposits. J. Geophys. Res. Solid Earth 1986, 91, 14132–14138. [Google Scholar] [CrossRef]
  16. Jackson, P.D.; Smith, D.T.; Stanford, P.N. Resistivity-porosity-particle shape relationships for marine sands. Geophysics 1978, 43, 1250–1268. [Google Scholar] [CrossRef]
  17. Shankar, U.; Riedel, M. Assessment of gas hydrate saturation in marine sediments from resistivity and compressional-wave velocity log measurements in the Mahanadi Basin, India. Mar. Pet. Geol. 2014, 58, 265–277. [Google Scholar] [CrossRef]
  18. Zhang, Z.; Liu, L.; Li, C. Fractal analyses on saturation exponent in Archie’s law for electrical properties of hydrate-bearing porous media. J. Pet. Sci. Eng. 2021, 196, 107642. [Google Scholar] [CrossRef]
  19. Anderson, W. Nettability Literature Survey—Part 3: The Effects d Nettability on the Electrical Properties of Porous Media. J. Pet. 1986, 38, 1371–1378. [Google Scholar]
  20. Spangenberg, E. Modeling of the influence of gas hydrate content on the electrical properties of porous sediments. J. Geophys. Res. Solid Earth 2001, 106, 6535–6548. [Google Scholar] [CrossRef]
  21. Pandey, L.; Sain, K.; Joshi, A.K. Estimate of gas hydrate saturations in the Krishna-Godavari basin, eastern continental margin of India, results of expedition. Mar. Pet. Geol. 2019, 108, 581–594. [Google Scholar] [CrossRef]
  22. Collett, T.S.; Bird, K.J.; Kvenvolden, K.A. Geological interrelations relative to gas hydrates within the North Slop of Alaska. US Geol. Surv. Open File Rep. 1988, 88, 150. [Google Scholar]
  23. Chen, L.T.; Li, N.; Sun, C.Y.; Chen, G.J.; Koh, C.A.; Sun, B.J. Hydrate formation in sediments from free gas using a one-dimensional visual simulator. Fuel 2017, 197, 298–309. [Google Scholar] [CrossRef]
  24. Kim, H.S.; Cho, G.C.; Lee, J.Y.; Kim, S.J. Geotechnical and geophysical properties of deep marine fine-grained sediments recovered during the second Ulleung Basin Gas Hydrate expedition, East Sea, Korea. Mar. Pet. Geol. 2013, 47, 56–65. [Google Scholar] [CrossRef]
  25. Liu, C.; Meng, Q.; He, X. Characterization of natural gas hydrate recovered from Pearl River Mouth basin in South China Sea. Mar. Pet. Geol. 2015, 61, 14–21. [Google Scholar] [CrossRef]
  26. Yuan, Q. Using soil auger to improve the cutting ring method to accurately determine soil bulk density and porosity. China Hortic. Abstr. 2014, 30, 25–26. [Google Scholar]
  27. Gao, L.; Wang, Y.J.; Xing, L.C. Numerical experiments of TDR probe optimization and hydrate saturation measurement based on finite element model. Lab. Res. Explor. 2022, 41, 43–49. [Google Scholar]
  28. Santamarina, J.C.; Ruppel, C. The impact of hydrate saturation on the mechanical, electrical, and thermal properties of hydrate-bearing sand, silts, and clay. In Geophysical Characterization of Gas Hydrates; Society of Exploration Geophysicists: Tulsa, OK, USA, 2010; pp. 373–384. [Google Scholar]
  29. Chen, G.J.; Guo, T.M. A new approach to gas hydrate modelling. Chem. Eng. J. 1998, 71, 145–151. [Google Scholar] [CrossRef]
  30. Bai, Z.; Tan, M.; Shi, Y. An improved saturation evaluation method of Chang 8 tight sandstone reservoir in Longdong West area of Ordos Basin, China. Energy Explor. Exploit. 2022, 40, 97–111. [Google Scholar] [CrossRef]
  31. Feng, C.; Yang, Z.; Feng, Z. A novel method to estimate resistivity index of tight sandstone reservoirs using nuclear magnetic resonance logs. J. Nat. Gas Sci. Eng. 2020, 79, 103358. [Google Scholar] [CrossRef]
  32. Lu, H.; Zeng, H.; Ripmeester, J.A. Sediment control on the saturation level of gas hydrate in nature environments. In Proceedings of the 6th International Conference on Gas Hydrates (ICGH 2008), Vancouver, BC, Canada, 6–10 July 2008. [Google Scholar]
  33. Chuvilin, E.M.; Kozlova, E.; Skolotneva, T.S. Experimental simulation of frozen hydratecontaining sediments formation. In Proceedings of the Fifth International Conference on Gas Hydrates, Trondheim, Norway, 13–16 June 2005; pp. 13–16. [Google Scholar]
  34. Spangenberg, E.; Kulenkampff, J. Pore space hydrate formation in a glass bead sample from methane dissolved in wate. Geophys. Res. Lett. 2005, 32, 1–4. [Google Scholar] [CrossRef]
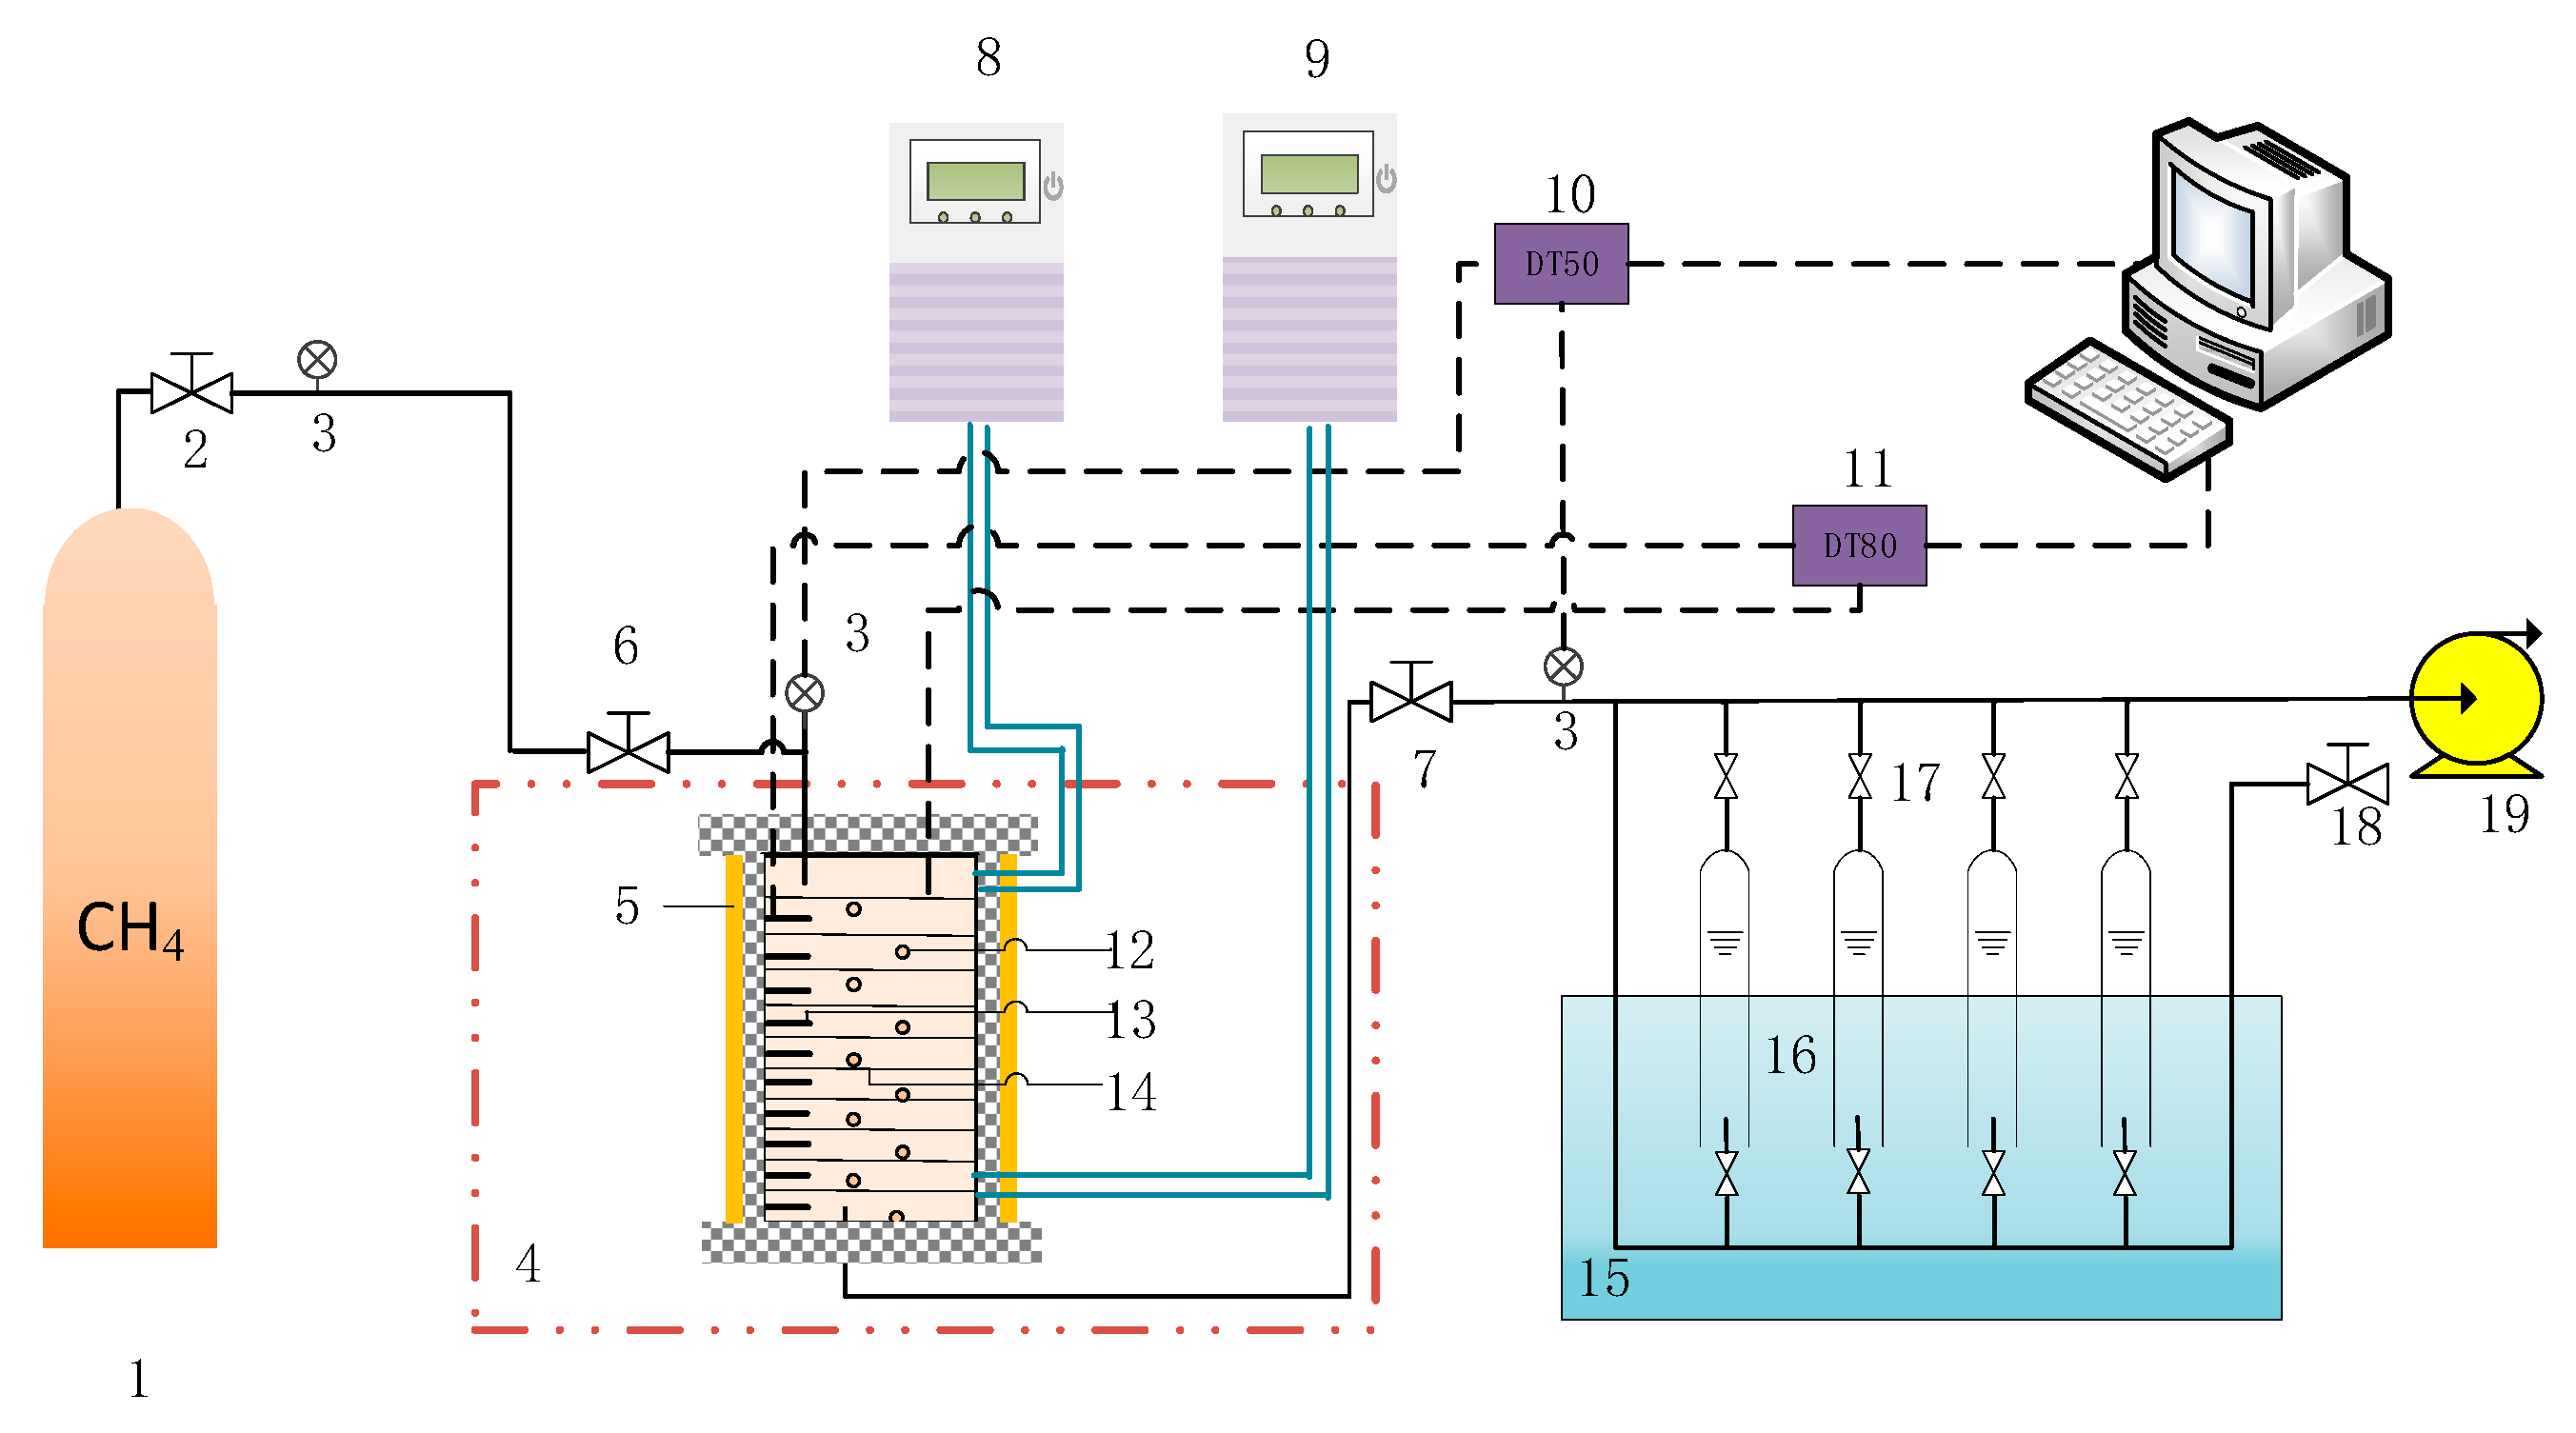
Figure 1. Gas hydrate experimental apparatus. 1: Methane cylinder; 2: check valve; 3: pressure gauge; 4: incubator; 5: insulated tank; 6, 7, 17 and 18: valves; 8 and 9: cold baths; 10: pressure data acquisition instrument; 11: temperature data acquisition instruments; 12: sand; 13: temperature probe; 14: electric plate; 15: water tank; 16: glass measuring cylinder; 19: vacuum pump.
Energies 16 05517 g001
Figure 2. Comparison of experimental data and Archie model calculation in sand under different temperature gradients. (a) Pure coarse sand; (b) mixed sand.
Energies 16 05517 g002
Figure 3. Hydrate nucleation time of different layers under different temperature gradients. (a) Pure coarse sand; (b) mixed sand.
Energies 16 05517 g003
Figure 4. The m and n values in pure coarse sand and mixed sand under different temperature gradients.
Energies 16 05517 g004
Figure 5. Comparison of ice and hydrate formation processes. (a) Ice formation process in 0.02 °C/cm pure coarse sand; (b) hydrate formation process in 0.02 °C/cm pure coarse sand.
Energies 16 05517 g005
Figure 6. Hydrate saturation calculated by gas consumption method. (a) Pure coarse sand; (b) mixed sand.
Energies 16 05517 g006
Figure 7. Saturation comparison of hydrate formation in pure coarse sand (a) and mixed sand (b) under different temperature gradients.
Energies 16 05517 g007
Figure 8. Upper layer of copper block after hydrate freezing.
Energies 16 05517 g008
Figure 9. The optimized Archie model was used to calculate the hydrate saturation distribution in coarse sand (a) and mixed sand (b) samples under different temperature gradients.
Energies 16 05517 g009
Table 1. Different sample physical parameters.
Sample CompositionParticle Size Density (g/mL)
coarse sand0.5–1 mm1.6
silt300 mesh2.6
Table 2. Specification and source of experimental materials.
Experimental MaterialsSpecificationSource
methanepurity 99.99%Chengdu, China Zhongke Kate Co., Ltd.
quartz sandSiO2Taihang Horticulture and McLean reagent
deionized waterconductivity 18.25 MΩ·cmlaboratory made
alcoholpurity 95.0%Chengdu, China Zhongke Kate Co., Ltd.
Table 3. Sample composition.
Sand RatioSand Weight (g)Dry Sand Volume (mL)Water Volume (mL)Pore Volume (mL)φ0 (%)Sw (%)
100% coarse sand1116.7451.3167.3342.142.0%48.9%
1116.2450.9167.7341.942.1%49.0%
1116.4450.8167.2342.742.1%49.1%
1116.2451.3168.1342.542.2%49.4%
Mixed sand1370.2538.89134.66281.2734.2%47.87%
1371.1539.48133.72280.6834.2%47.64%
1370.4538.99135.12281.3934.3%48.05%
1369.9538.78135.13281.3834.3%48.05%
Table 4. Formation process and conditions of methane hydrate.
Sand RatioTemperature Gradient (°C/cm)Initial Pressure (Mpa)Final Pressure (Mpa)Initial Temperature (°C)Sh
100% coarse sand0.028.846.2313.190.374
0.078.6566.0413.00.373
0.118.896.0213.060.420
0.189.016.2513.410.400
Mixed sand0.028.877.1313.090.319
0.078.837.0813.090.344
0.118.797.0612.980.339
0.188.087.0213.130.457
Table 5. Comparison of hydrate saturation between actual measurements and Archie’s model.
Horizon12345678910
100% coarse sandestimated directly0.570.540.460.420.350.340.330.350.400.40
optimization model0.560.460.390.430.390.390.390.390.450.43
Mixed sandestimated directly0.330.300.270.290.300.330.280.260.210.19
optimization model0.380.340.290.330.350.370.330.320.270.25
Disclaimer/Publisher’s Note: The statements, opinions and data contained in all publications are solely those of the individual author(s) and contributor(s) and not of MDPI and/or the editor(s). MDPI and/or the editor(s) disclaim responsibility for any injury to people or property resulting from any ideas, methods, instructions or products referred to in the content.