
Fundamental Shifts in the EU’s Electric Power Sector Development: LMDI Decomposition Analysis

 ,
,  ,
, 

Abstract
1. Introduction
2. Literature Review
3. Materials and Methods
4. Results
5. Discussion
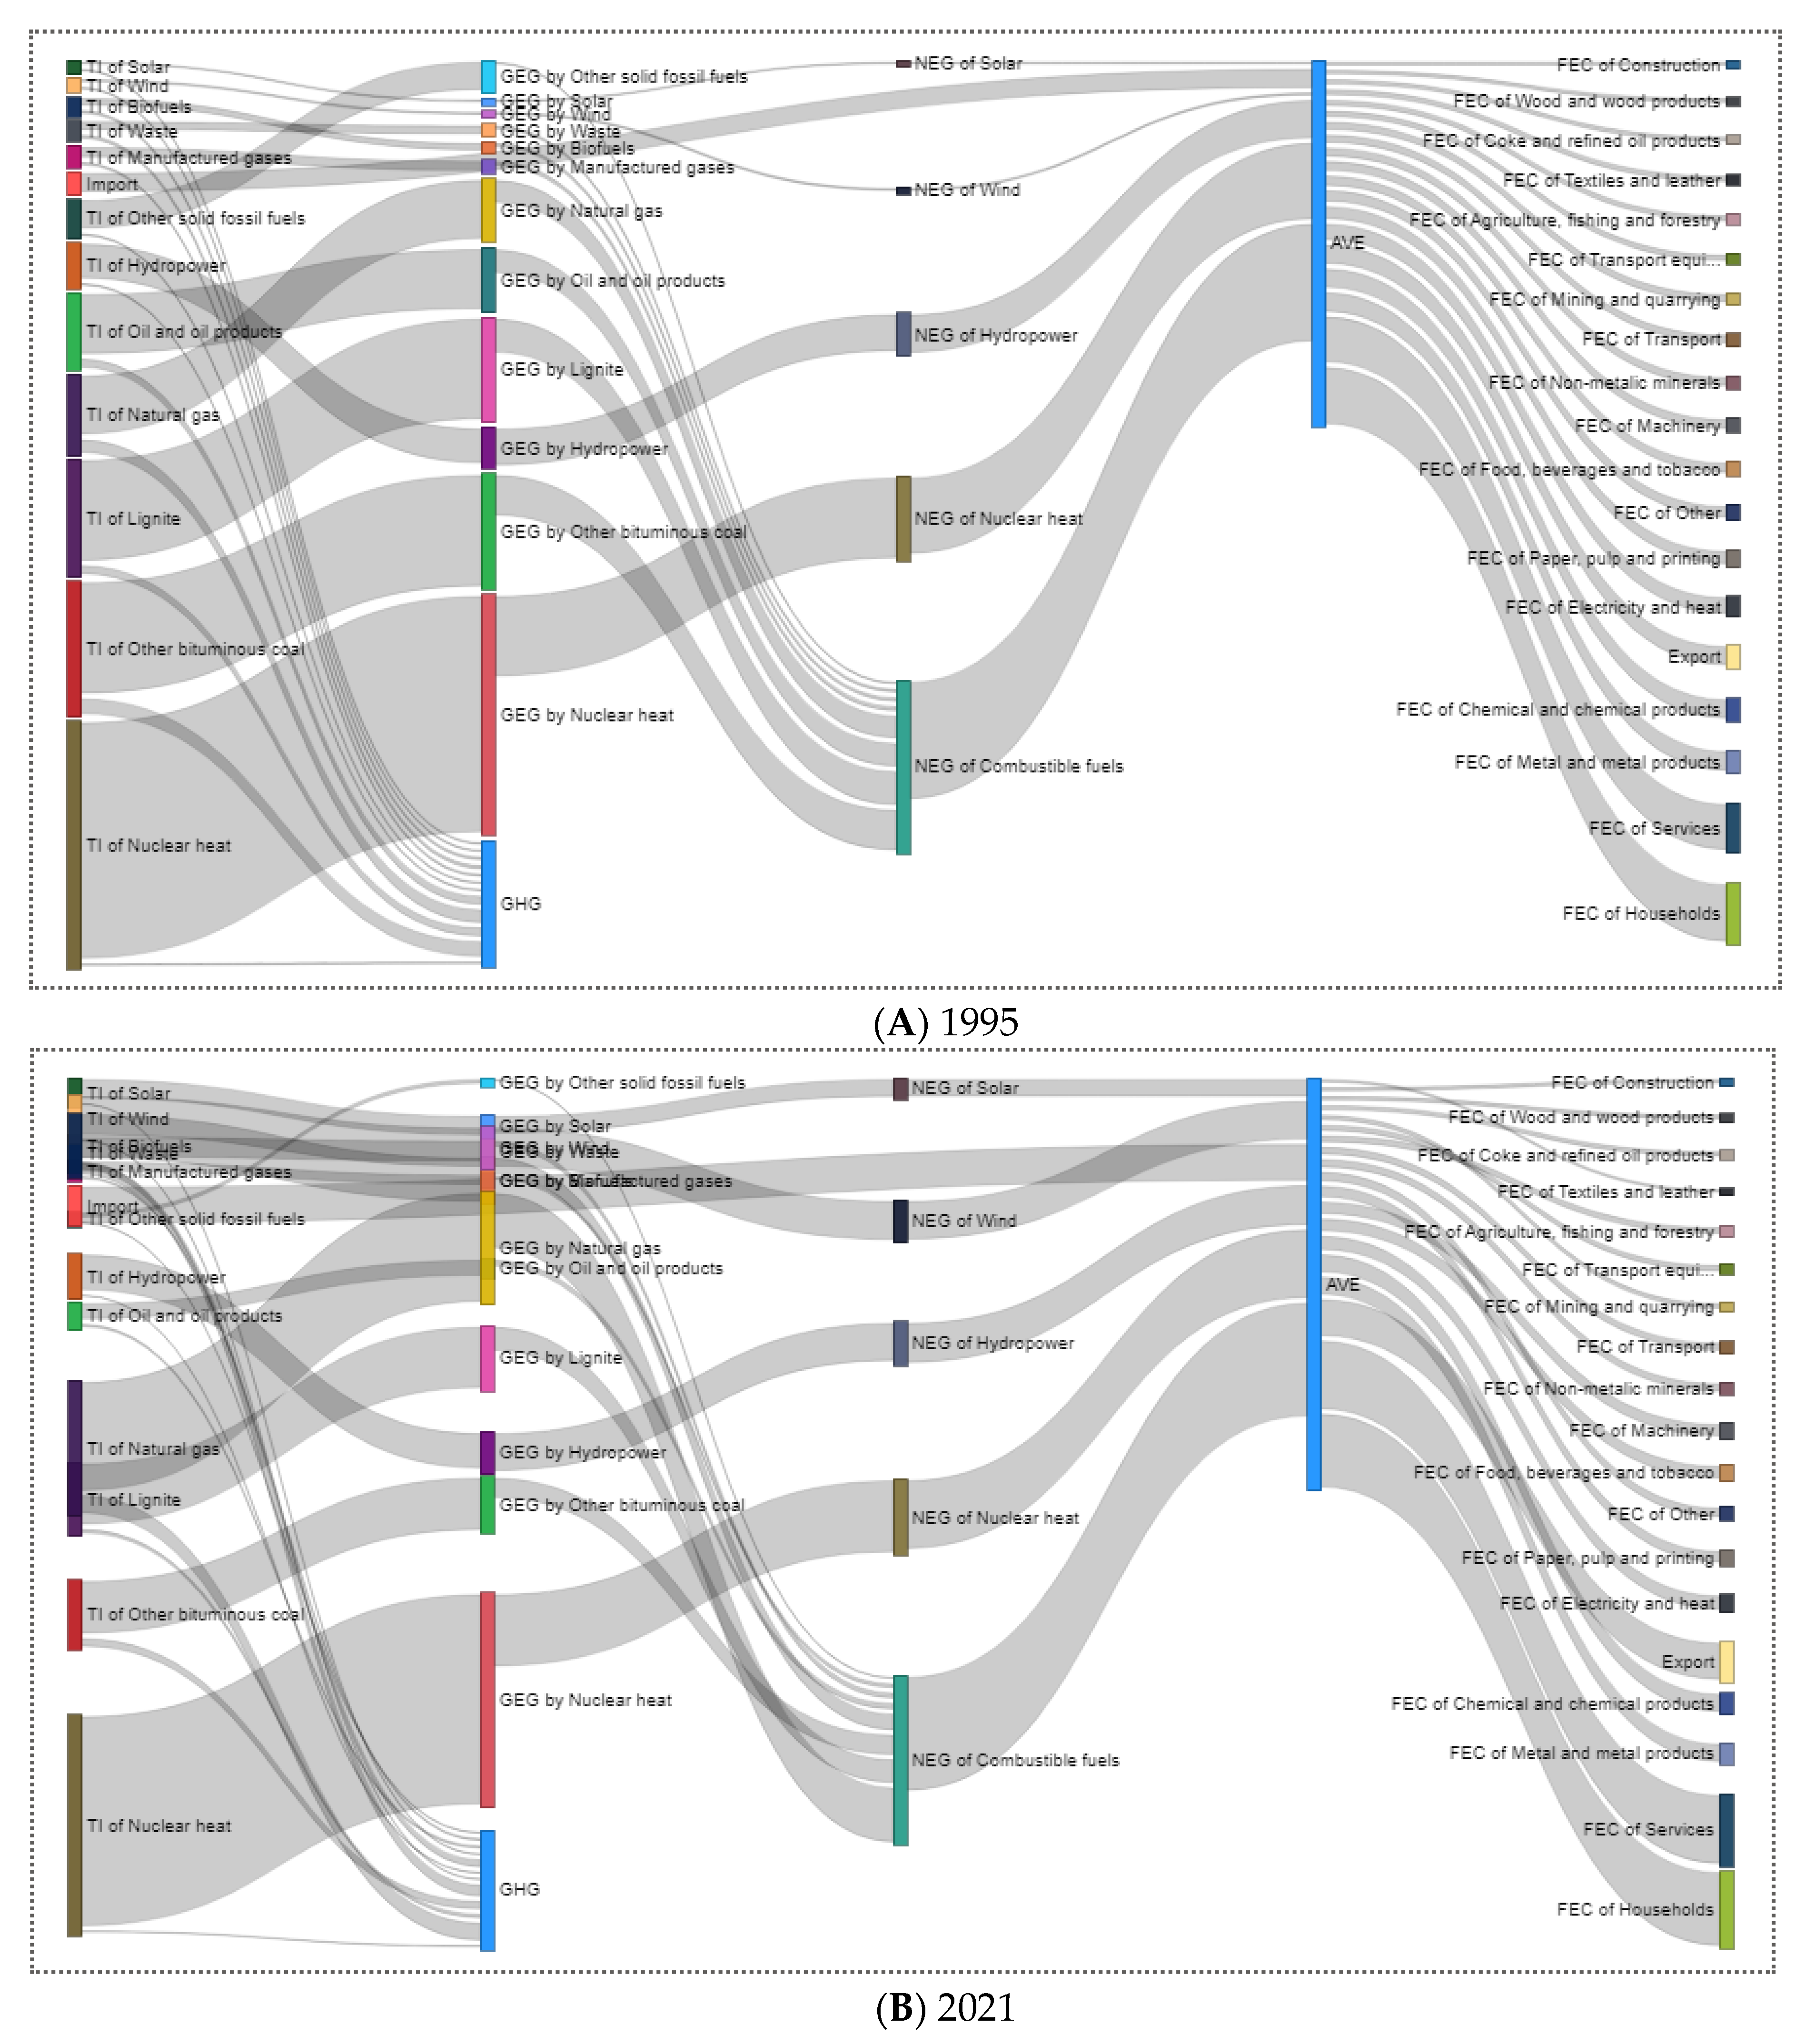
- The EU is undergoing a wind–gas transition in the electric power sector. This has enabled 131% of additional electricity demand to be covered, 70% by wind generation and the rest by gas generation. Overall, the development of renewable generation has provided +145% of additional electricity. At the same time, electricity generation from fossil fuels decreased by −105%, −95% from combustible fossil fuels and −10% from nuclear heat.
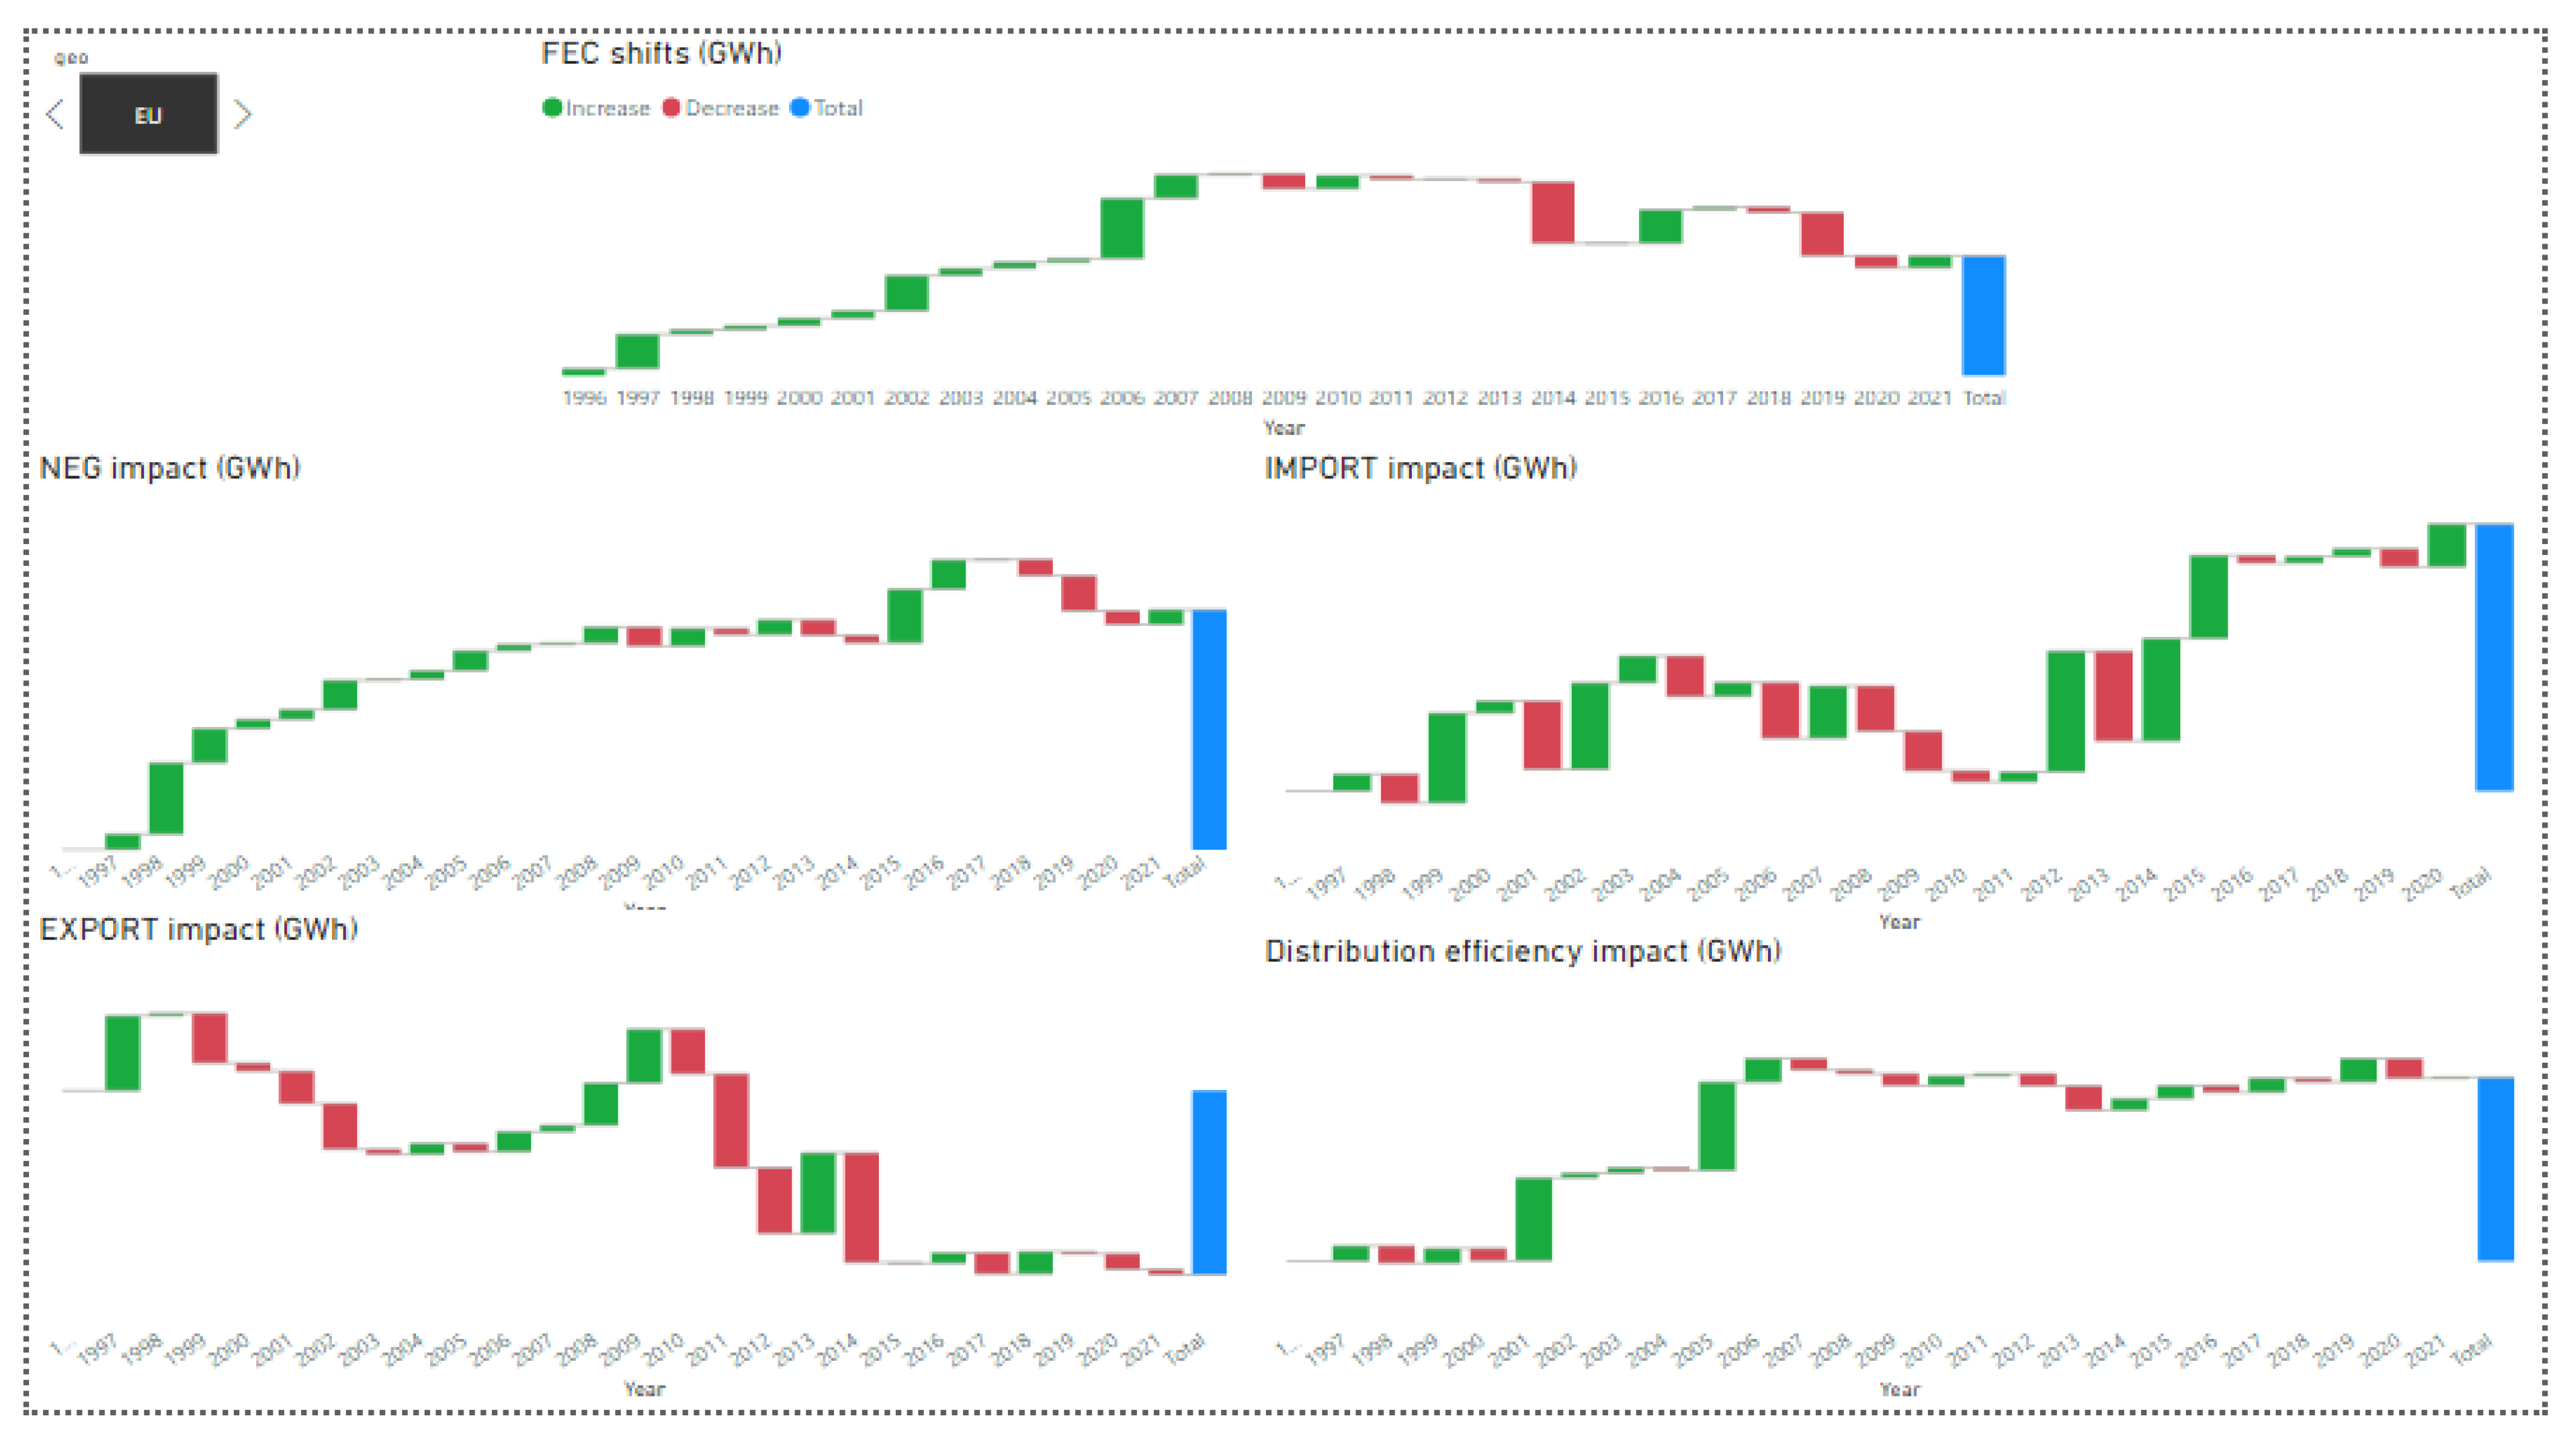
- This transition was accompanied by an increase in the energy efficiency of electricity flows, resulting in total electricity savings of 1028 TWh, 85% due to a reduction in the intensity of electricity consumption, while the remaining 15% of the savings came from the increase in the transformation efficiency of inputs in electricity generation. However, this transition led to a decrease in the efficiency of electricity generation and distribution and consequently to overconsumption of electricity by 145 TWh.
- However, this transition was also accompanied by negative structural shifts in the generation capacities and their efficiency, which ultimately led to a lack of 966 TWh in net electricity generation, −50% due to combustible fossil fuel capacities, −55% due to nuclear heat, and −16% due to hydropower capacities, while intermittent RESs (solar and wind) managed to provide only +42% of additional electricity generation.
- The expansion of the EU’s economic activity required an increase in its final energy consumption, but the structural shifts in its economy reoriented these volumes from industry (−12%) to households and services and transport (+10%).
- Such changes required an increase in the EU’s external electricity flows, which entailed additional electricity exports from net electricity generation (−31%) together with an increase in its electricity imports (+34%) to cover the deficit in final electricity consumption.
6. Conclusions
Author Contributions
Funding
Data Availability Statement
Conflicts of Interest
Appendix A

Appendix B

| Energy Source (For the Purpose of Gross Electricity Generation) | General Classification of Energy Sources (For the Purpose of Net Electricity Generation) |
|---|---|
| Natural gas | Combustible fuels |
| Lignite | Combustible fuels |
| Other bituminous coal | Combustible fuels |
| Waste | Combustible fuels |
| Nuclear heat | Nuclear heat |
| Biofuels | Nuclear heat |
| Hydro | Hydro |
| Solar | Solar |
| Manufactured gases | Combustible fuels |
| Other solid fossil fuels | Combustible fuels |
| Wind | Wind |
| Oil and oil products | Oil and oil products |
| For Final Electricity Consumption | For Economic Output | Used in Decomposition |
|---|---|---|
| Agriculture and forestry | Agriculture, fishing, and forestry | Agriculture, fishing, and forestry |
| Fishing | ||
| Chemical and petrochemical | Chemical and chemical products Pharmaceutical products | Chemical and chemical products |
| Coke oven and oil refinery | Coke and refined oil products | Coke and refined oil products |
| Construction | Construction | Construction |
| Food, beverages, and tobacco | Food, beverages, and tobacco | Food, beverages, and tobacco |
| Households | Household expenditures | Households |
| Machinery | Machinery | Machinery |
| Iron and steel Non-ferrous metals | Basic metals and fabricated metal products | Metal and metal products |
| Mining and quarrying | Mining and quarrying | Mining and quarrying |
| Non-metallic minerals | Non-metallic minerals | Non-metallic minerals |
| Not elsewhere specified | Other | Other |
| Paper, pulp, and printing | Paper and paper products, reproduction | Paper, pulp, and printing |
| Commercial and public services | All services excluding the transport sector | Services |
| Textiles and leather | Textiles and leather | Textiles and leather |
| Transport | Transport sector | Transport |
| Transport equipment | Transport equipment | Transport equipment |
| Wood and wood products | Wood and wood products | Wood and wood products |
Appendix C
| Geo 1 | Input Volume Impact (%) | Input Structure Impact (%) | Transformation Efficiency Impact (%) | GEG Shifts (%) | ||||
|---|---|---|---|---|---|---|---|---|
| GR 2 | Share 3 | GR | Share | GR | Share | GR | Share | |
| AT | 11.4 | −4.5 | 7.5 | 0.5 | 19.5 | 9.9 | 33.4 | 3.7 |
| BE | 21.2 | −5.0 | 19.4 | 1.9 | 12.7 | 8.2 | 40.9 | 4.9 |
| BG | −8.1 | 6.1 | 8.3 | 0.4 | 2.7 | 0.7 | −3.6 | −0.8 |
| CZ | 10.7 | −6.2 | 0.8 | −0.1 | 6.4 | 4.3 | 15.7 | 2.3 |
| DE | −20.3 | 119.9 | 34.1 | 37.3 | 6.9 | 31.4 | 19.2 | 18.0 |
| DK | −16.1 | 18.0 | 30.3 | 2.5 | 11.6 | 4.7 | 8.6 | −0.4 |
| EE | −8.8 | 1.9 | 262.9 | 1.5 | −5.8 | −0.5 | 178.5 | 0.9 |
| EL | −7.1 | 5.7 | 43.9 | 3.4 | 5.0 | 0.8 | 32.6 | 2.3 |
| ES | 20.4 | −17.9 | 49.2 | 17.2 | −1.8 | −7.0 | 55.5 | 18.4 |
| FI | 12.4 | −1.2 | 16.5 | 1.5 | 8.7 | 5.3 | 27.7 | 3.1 |
| FR | 9.1 | −28.3 | 9.3 | 8.1 | 0.5 | −0.7 | 17.2 | 13.9 |
| HR | 43.7 | −3.5 | 25.0 | 0.1 | 9.4 | 1.0 | 57.3 | 1.1 |
| HU | −16.6 | 6.3 | 8.5 | 0.3 | 9.5 | 2.7 | −0.2 | −0.3 |
| IE | 23.2 | −2.6 | 39.2 | 1.4 | 16.0 | 2.6 | 72.4 | 2.6 |
| IT | 10.6 | −6.9 | 15.1 | 7.2 | 16.4 | 34.7 | 39.1 | 16.8 |
| LT | −91.0 | 17.5 | 132.9 | 2.7 | 12.9 | 0.5 | −54.1 | −2.0 |
| LU | 200.1 | −0.8 | 73.2 | 0.1 | 43.9 | 0.9 | 179.2 | 0.4 |
| LV | 23.5 | −1.0 | 21.0 | 0.0 | 5.7 | 0.3 | 30.8 | 0.3 |
| NL | 12.3 | −8.1 | 9.8 | 1.4 | 11.6 | 10.5 | 29.9 | 5.7 |
| PL | 6.1 | −7.3 | 8.5 | 2.8 | 2.9 | 3.9 | 16.4 | 5.3 |
| PT | 16.4 | −0.8 | 58.5 | 2.8 | 10.1 | 2.7 | 56.4 | 3.6 |
| RO | −46.2 | 34.8 | 3.0 | −0.7 | 3.8 | 1.8 | −47.2 | −7.9 |
| SE | 6.7 | 0.2 | 26.1 | 6.5 | 1.3 | 1.8 | 26.9 | 6.8 |
| SK | 2.2 | 0.2 | −0.6 | −0.3 | 10.2 | 2.4 | 9.0 | 0.3 |
| SL | 3.9 | 0.2 | 14.5 | 0.3 | 5.1 | 0.6 | 20.3 | 0.4 |
Appendix D
| Geo | GC Impact (%) | GC Structure Impact (%) | CUF Impact (%) | Generation Efficiency Impact (%) | NEG Shifts (%) | |||||
|---|---|---|---|---|---|---|---|---|---|---|
| GR | Share | GR | Share | GR | Share | GR | Share | GR | Share | |
| AT | 46.3 | 1.9 | −11.6 | 1.1 | 2.6 | 1.1 | −6.7 | 5.7 | 27.4 | 3.1 |
| BE | 57.9 | 3.1 | −33.9 | 3.8 | 23.5 | −5.4 | −4.3 | 4.9 | 39.5 | 5.0 |
| BG | 415.4 | 4.3 | −43.1 | 2.4 | 53.7 | −9.5 | 16.7 | −7.7 | 20.5 | 1.2 |
| CZ | 43.6 | 1.9 | −5.7 | 0.7 | −9.7 | 4.3 | 9.9 | −7.6 | 35.3 | 4.4 |
| DE | 75.2 | 27.8 | −51.7 | 40.0 | 2.3 | 6.9 | −8.6 | 70.3 | 12.2 | 11.4 |
| DK | 43.2 | 0.9 | −13.2 | 0.7 | 11.4 | 0.4 | −28.9 | 15.0 | 13.8 | −0.5 |
| EE | 286.0 | 2.9 | −15.8 | 0.2 | 198.7 | −7.0 | −101.3 | 18.6 | 20.0 | −0.2 |
| EL | 86.2 | 2.8 | −19.0 | 1.4 | −25.2 | 9.0 | 0.5 | 0.1 | 36.0 | 2.8 |
| ES | 91.9 | 14.7 | −19.0 | 6.7 | −8.9 | 31.9 | −1.6 | 6.5 | 53.7 | 20.9 |
| FI | 22.9 | 0.9 | −5.3 | 0.5 | 18.7 | −4.6 | −14.3 | 14.5 | 19.3 | 1.7 |
| FR | 28.1 | 9.4 | −15.7 | 11.3 | 4.3 | −6.0 | −2.5 | 17.9 | 12.7 | 11.4 |
| HR | 111.0 | 0.7 | −38.5 | 0.8 | 47.1 | −1.2 | 6.9 | −0.7 | 69.7 | 1.1 |
| HU | 46.7 | 0.9 | −20.4 | 0.9 | −17.4 | 3.6 | 6.7 | −2.6 | 12.6 | 0.5 |
| IE | 104.6 | 1.7 | −12.0 | 0.5 | −16.8 | 3.3 | −4.9 | 2.0 | 63.3 | 2.8 |
| IT | 59.3 | 10.4 | −16.7 | 6.4 | 2.2 | 4.2 | −18.9 | 77.3 | 19.6 | 9.0 |
| LT | −37.3 | −0.4 | −0.6 | 0.5 | 63.1 | −4.4 | 18.9 | −2.9 | −18.8 | −1.4 |
| LU | 47.3 | 0.1 | 63.3 | −0.1 | 25.1 | 0.1 | −25.3 | 1.4 | 98.8 | 0.2 |
| LV | 36.9 | 0.1 | 1.6 | 0.0 | 15.1 | 0.9 | 47.8 | −2.7 | 87.5 | 0.4 |
| NL | 94.2 | 6.1 | −37.8 | 5.7 | −14.0 | 10.2 | 8.4 | −11.8 | 44.4 | 7.8 |
| PL | 60.4 | 5.6 | −20.8 | 4.2 | −16.1 | 13.6 | 7.6 | −14.2 | 27.5 | 7.4 |
| PT | 85.1 | 2.5 | −10.1 | 0.8 | 14.5 | 4.4 | −8.4 | 5.1 | 54.2 | 3.8 |
| RO | 14.1 | 0.4 | −5.0 | 0.4 | −23.3 | 7.9 | 27.8 | −18.2 | 7.7 | 0.4 |
| SE | 29.6 | 2.8 | −21.9 | 4.6 | 18.0 | −8.6 | −0.5 | 1.4 | 21.3 | 4.7 |
| SK | 5.7 | 0.0 | −2.1 | 0.2 | 13.5 | −1.6 | 7.5 | −2.2 | 19.1 | 0.8 |
| SL | 49.6 | 0.5 | −14.7 | 0.3 | −8.1 | 1.0 | 6.9 | −1.0 | 30.0 | 0.7 |
Appendix E
| Geo | NEG Impact (%) | IMPORT Impact (%) | EXPORT Impact (%) | Distribution Efficiency Impact, (%) | FEC Shifts (%) | ||||
|---|---|---|---|---|---|---|---|---|---|
| GR | Share | GR | Share | GR | Share | GR | GR | Share | |
| AT | 30.7 | 3.90 | 9.8 | 9.20 | −7.8 | 6.10 | −51.80 | 36.0 | 4.2 |
| BE | 27.2 | 5.60 | 4.9 | 3.20 | −2.9 | 11.00 | 8.70 | 17.4 | 2.7 |
| BG | 27.9 | 1.20 | 1.5 | 1.00 | −5.9 | 6.30 | 9.20 | 7.4 | 0.4 |
| CZ | 32.9 | 4.70 | 4.5 | 3.70 | −9.8 | 11.00 | 33.50 | 20.1 | 2.4 |
| DE | 28.5 | 10.50 | 1.9 | −4.30 | −2.6 | −0.30 | −45.50 | 5.4 | 4.9 |
| DK | 25.9 | −4.60 | 8.4 | 9.40 | −8.4 | −2.70 | −50.00 | 1.5 | 0.1 |
| EE | 32.1 | −0.40 | 7.4 | 4.20 | −10.9 | 2.40 | 15.40 | 41.6 | 0.6 |
| EL | 32.6 | 3.10 | 4.2 | 2.80 | −1.3 | 1.60 | −7.50 | 31.9 | 2.7 |
| ES | 39.6 | 22.40 | 1.8 | 5.20 | −1.4 | 6.00 | −17.00 | 48.0 | 17.9 |
| FI | 27.4 | 0.70 | 3.5 | 9.60 | −1.2 | 3.40 | 53.80 | 23.8 | 3.4 |
| FR | 33.2 | 8.80 | 0.7 | 11.50 | −4.1 | −1.90 | 36.50 | 22.6 | 17.8 |
| HR | 30.0 | 1.00 | 19.0 | 4.60 | −10.2 | 3.50 | 7.30 | 50.2 | 1.3 |
| HU | 24.1 | 0.40 | 10.4 | 9.30 | −4.8 | 3.50 | 26.00 | 36.3 | 2.8 |
| IE | 38.8 | 3.00 | 1.8 | 1.40 | −0.8 | 0.40 | −7.10 | 66.8 | 2.9 |
| IT | 25.9 | 9.70 | 4.3 | 4.80 | −0.2 | 1.90 | 11.40 | 19.5 | 10.5 |
| LT | 18.2 | −2.20 | 6.9 | 3.10 | −4.0 | 0.50 | 18.50 | 40.3 | 0.8 |
| LU | 13.7 | 0.20 | 24.4 | 0.40 | −7.1 | 0.20 | 2.20 | 26.2 | 0.3 |
| LV | 25.1 | 0.80 | 15.0 | 1.20 | −9.9 | 1.80 | −7.30 | 37.0 | 0.4 |
| NL | 28.4 | 8.70 | 6.4 | 5.60 | −3.1 | 12.50 | −13.70 | 29.0 | 5.8 |
| PL | 28.6 | 8.10 | 1.7 | 6.20 | −2.2 | 3.70 | 24.40 | 40.6 | 10.9 |
| PT | 36.9 | 4.20 | 5.4 | 3.00 | −3.3 | 1.00 | −9.40 | 47.5 | 3.6 |
| RO | 26.0 | 0.50 | 1.3 | 4.90 | −2.2 | 3.80 | −11.20 | 13.7 | 1.1 |
| SE | 26.4 | 7.30 | 2.4 | −4.20 | −3.7 | 14.30 | 20.00 | 2.7 | 0.6 |
| SK | 35.8 | 1.10 | 15.9 | 4.90 | −18.4 | 7.00 | 3.70 | 14.3 | 0.7 |
| SL | 26.5 | 0.80 | 10.1 | 4.40 | −9.8 | 3.90 | −20.40 | 32.3 | 0.8 |
Appendix F
| Geo | Output Volume Impact (%) | Output Structure Impact (%) | Consumption Intensity Impact (%) | FEC Shifts (%) | ||||
|---|---|---|---|---|---|---|---|---|
| GR | Share | GR | Share | GR | Share | GR | Share | |
| AT | 88.2 | 3.3 | −4.3 | −6.4 | −41.9 | −3.1 | 36.0 | 4.2 |
| BE | 86.7 | 4.4 | −2.6 | −6.8 | −46.9 | −4.8 | 17.4 | 2.7 |
| BG | 181.5 | 3.2 | 4.1 | 3.1 | −113.8 | −4.1 | 7.4 | 0.4 |
| CZ | 178.0 | 6.3 | −6.2 | −10.1 | −108.1 | −7.6 | 20.1 | 2.4 |
| DE | 42.1 | 14.0 | 8.1 | 84.1 | −37.2 | −25.1 | 5.4 | 4.9 |
| DK | 95.4 | 2.0 | −10.4 | −9.8 | −67.8 | −2.6 | 1.5 | 0.1 |
| EE | 247.1 | 1.0 | −8.6 | −1.5 | −132.7 | −1.1 | 41.6 | 0.6 |
| EL | 56.7 | 1.5 | −6.7 | −7.5 | −0.3 | −0.1 | 31.9 | 2.7 |
| ES | 79.8 | 9.6 | 10.0 | 65.6 | −26.2 | −7.5 | 48.0 | 17.9 |
| FI | 96.6 | 4.7 | −22.2 | −50.8 | −38.6 | −3.9 | 23.8 | 3.4 |
| FR | 74.8 | 19.5 | −5.9 | −71.2 | −34.2 | −17.9 | 22.6 | 17.8 |
| HR | 30.7 | −0.4 | 63.9 | 22.3 | −44.2 | −0.7 | 50.2 | 1.3 |
| HU | 158.4 | 3.3 | −7.5 | −6.7 | −79.0 | −3.3 | 36.3 | 2.8 |
| IE | 175.0 | 2.3 | −2.6 | −2.1 | −74.3 | −2.0 | 66.8 | 2.9 |
| IT | 72.3 | 12.3 | −2.1 | −17.5 | −32.7 | −10.8 | 19.5 | 10.5 |
| LT | 236.8 | 1.3 | 9.5 | 3.0 | −131.1 | −1.4 | 40.3 | 0.8 |
| LU | 229.5 | 0.8 | −15.4 | −2.7 | −62.4 | −0.5 | 26.2 | 0.3 |
| LV | 210.5 | 0.7 | 11.5 | 2.2 | −135.2 | −0.9 | 37.0 | 0.4 |
| NL | 95.8 | 6.2 | −9.5 | −27.2 | −40.3 | −5.1 | 29.0 | 5.8 |
| PL | 159.4 | 11.2 | 4.8 | 26.6 | −80.9 | −12.1 | 40.6 | 10.9 |
| PT | 62.6 | 1.5 | 8.8 | 12.2 | −17.0 | −1.1 | 47.5 | 3.6 |
| RO | 224.8 | 6.1 | −20.0 | −25.4 | −103.8 | −5.7 | 13.7 | 1.1 |
| SE | 12.9 | 4.9 | 58.9 | 139.8 | −54.1 | −8.8 | 2.7 | 0.6 |
| SK | 204.2 | 3.2 | −11.4 | −9.1 | −108.9 | −3.4 | 14.3 | 0.7 |
| SL | 115.7 | 0.9 | −4.9 | −1.7 | −40.2 | −0.6 | 32.3 | 0.8 |
References
- National Determined Contributions Registry. UNFCCC. Available online: https://unfccc.int/NDCREG (accessed on 1 May 2023).
- The Internal Energy Market. Commission Working Document. EUR-LEX. Available online: https://eur-lex.europa.eu/procedure/EN/107212 (accessed on 1 May 2023).
- Directive 96/92/EC of the European Parliament and of the Council of 19 December 1996 Concerning Common Rules for the Internal Market in Electricity. EUR-LEX. Available online: https://eur-lex.europa.eu/legal-content/EN/TXT/?uri=CELEX%3A31996L0092 (accessed on 1 May 2023).
- Directive 2003/54/EC of the European Parliament and of the Council of 26 June 2003 Concerning Common Rules for the Internal Market in Electricity and Repealing Directive 96/92/EC—Statements Made with Regard to Decommissioning and Waste Management Activities. EUR-LEX. Available online: https://eur-lex.europa.eu/legal-content/EN/TXT/?uri=celex%3A32003L0054 (accessed on 1 May 2023).
- European Comission. Third Energy Package. Available online: https://energy.ec.europa.eu/topics/markets-and-consumers/market-legislation/third-energy-package_en (accessed on 1 May 2023).
- European Comission. Clean Energy for All Europeans Package. Available online: https://energy.ec.europa.eu/topics/energy-strategy/clean-energy-all-europeans-package_en (accessed on 1 May 2023).
- REPowerEU Plan. Communication from the Commission to the European Parliament, the European Council, the Council, the European Economic and Social Committee and the Committee of the Regions. Available online: https://eur-lex.europa.eu/legal-content/EN/TXT/?uri=COM%3A2022%3A230%3AFIN&qid=1653033742483 (accessed on 18 May 2023).
- Eurostat Database. Available online: https://ec.europa.eu/eurostat/data/database (accessed on 1 May 2023).
- Afgan, N.H.; Carvalho, M.G.; Hovanov, N.V. Modelling of energy system sustainability index. Therm. Sci. 2005, 9, 3–16. [Google Scholar] [CrossRef]
- Sannino, A.; Hammons, T.; McConnach, J. Global power systems for sustainable energy development. In Proceedings of the IEEE Power Engineering Society General Meeting, Denver, CO, USA, 6–10 June 2004; pp. 2296–2297. [Google Scholar]
- Wang, D.; Gryshova, I.; Balian, A.; Kyzym, M.; Salashenko, T.; Khaustova, V.; Davidyuk, O. Assessment of Power System Sustainability and Compromises between the Development Goals. Sustainability 2022, 14, 2236. [Google Scholar] [CrossRef]
- Roldán-Blay, C.; Miranda, V.; Carvalho, L.; Roldán-Porta, C. Optimal Generation Scheduling with Dynamic Profiles for the Sustainable Development of Electricity Grids. Sustainability 2019, 11, 7111. [Google Scholar] [CrossRef]
- Koval, V.; Savina, N.; Sribna, Y.; Filipishyna, L.; Zherlitsyn, D.; Saiapina, T. European energy partnership on sustainable energy potential. In Proceedings of the IOP Conference Series: Earth and Environmental Science, Riga, Latvia, 31 October–1 November 2022; Volume 1126, p. 012026. [Google Scholar]
- Ahlqvist, V.; Holmberg, P.; Tangerås, T. A survey comparing centralized and decentralized electricity markets. Energy Strategy Rev. 2022, 40, 100812. [Google Scholar] [CrossRef]
- Osińska, M.; Kyzym, M.; Khaustova, V.; Ilyash, O.; Salashenko, T. Does the Ukrainian electricity market correspond to the European model? Util. Policy 2022, 79, 101436. [Google Scholar] [CrossRef]
- Barroso, L.A.; Cavalcanti, T.H.; Giesbertz, P.; Purchala, K. Classification of electricity market models worldwide. In Proceedings of the International Symposium CIGRE/IEEE PES, New Orleans, LA, USA, 5–7 October 2005; pp. 9–16. [Google Scholar]
- Facchini, A.; Rubino, A.; Caldarelli, G.; Di Liddo, G. Changes to Gate Closure and its impact on wholesale electricity prices: The case of the UK. Energy Policy 2019, 125, 110–121. [Google Scholar] [CrossRef]
- Matenli, A.; Abbaspourtorbati, F.; Cherkaoui, R.; Mende, F.; Luongo, L. Centralized and decentralized electricity markets: Assessment of operational and economic aspects. In Proceedings of the 13th International Conference on the European Energy Market (EEM), Porto, Portugal, 6–9 June 2016; pp. 1–5. [Google Scholar] [CrossRef]
- Lago, J.; Marcjasz, G.; De Schutter, B.; Weron, R. Forecasting day-ahead electricity prices: A review of state-of-the-art algorithms, best practices and an open-access benchmark. Appl. Energy 2021, 293, 116983. [Google Scholar] [CrossRef]
- Wang, D.; Gryshova, I.; Kyzym, M.; Salashenko, T.; Khaustova, V.; Shcherbata, M. Electricity Price Instability over Time: Time Series Analysis and Forecasting. Sustainability 2022, 14, 9081. [Google Scholar] [CrossRef]
- Chen, Q.; Balian, A.; Kyzym, M.; Salashenko, T.; Gryshova, I.; Khaustova, V. Electricity Markets Instability: Causes of Price Dispersion. Sustainability 2021, 13, 12343. [Google Scholar] [CrossRef]
- Mosquera-López, S.; Nursimulu, A. Drivers of electricity price dynamics: Comparative analysis of spot and futures markets. Energy Policy 2019, 126, 76–87. [Google Scholar] [CrossRef]
- Kaszyński, P.; Komorowska, A.; Kamiński, J. Regional distribution of hard coal consumption in the power sector under selected forecasts of EUA prices. Gospod. Surowcami Miner. Miner. Resour. Manag. 2019, 35, 113–134. [Google Scholar]
- Augustyn, A.; Kamiński, J. A review of methods applied for wind power generation forecasting. Polityka Energetyczna Energy Policy J. 2018, 21, 139–150. [Google Scholar] [CrossRef]
- Szabó, L.; Kelemen, Á.; Mezősi, A.; Pató, Z.; Kácsor, E.; Resch, G.; Liebmann, L. South East Europe electricity roadmap–modelling energy transition in the electricity sectors. Clim. Policy 2019, 19, 495–510. [Google Scholar] [CrossRef]
- Ilyash, O.; Lupak, R.; Kravchenko, M.; Trofymenko, O.; Duliaba, N.; Dzhadan, I. A forecasting model for assessing the influence of the components of technological growth on economic security. Bus. Theory Pract. 2022, 23, 175–186. [Google Scholar] [CrossRef]
- Chalvatzis, K.J. Electricity generation development of Eastern Europe: A carbon technology management case study for Poland. Renew. Sustain. Energy Rev. 2009, 13, 1606–1612. [Google Scholar] [CrossRef]
- Kravchenko, M.; Ilyash, O.; Smoliar, L.; Boiarynova, K.; Trofymenko, O. Changes in the energy supply strategy of the EU countries amid the full-scale Russian invasion. In Proceedings of the IOP Conference Series: Earth and Environmental Science, Riga, Latvia, 31 October–1 November 2022; Volume 1126, p. 012035. [Google Scholar]
- Bailis, R. Energy Policy in Developing Countries. In Climate Change and Public Health; Levy, B., Patz, J., Eds.; Oxford Academic: New York, Ny, USA, 2015; pp. 291–302. [Google Scholar]
- Koval, V.; Borodina, O.; Lomachynska, I.; Olczak, P.; Mumladze, A.; Matuszewska, D. Model Analysis of Eco-Innovation for National Decarbonisation Transition in Integrated European Energy System. Energies 2022, 15, 3306. [Google Scholar] [CrossRef]
- Guido, P.; Blechinger, P. How to meet EU GHG emission reduction targets? A model based decarbonization pathway for Europe’s electricity supply system until 2050. Energy Strategy Rev. 2017, 15, 19–32. [Google Scholar]
- Jägemann, C.; Fürsch, M.; Hagspiel, S.; Nagl, S. Decarbonizing Europe’s power sector by 2050—Analyzing the economic implications of alternative decarbonization pathways. Energy Econ. 2013, 40, 622–636. [Google Scholar] [CrossRef]
- Ostapenko, O.; Olczak, P.; Koval, V.; Hren, L.; Matuszewska, D.; Postupna, O. Application of Geoinformation Systems for Assessment of Effective Integration of Renewable Energy Technologies in the Energy Sector of Ukraine. Appl. Sci. 2022, 12, 592. [Google Scholar] [CrossRef]
- Prontera, A.; Rubino, A. Greening energy governance through agencification in the Global South: Drivers and implications. Regul. Gov. 2023; early view. [Google Scholar] [CrossRef]
- Capozza, C.; Divella, M.; Rubino, A. Exploring energy transition in European firms: The role of policy instruments, demand-pull factors and cost-saving needs in driving energy-efficient and renewable energy innovations. Energy Sources Part B Econ. Plan. Policy 2021, 16, 1094–1109. [Google Scholar] [CrossRef]
- Ang, B.W. LMDI decomposition approach: A guide for implementation. Energy Policy 2015, 86, 233–238. [Google Scholar] [CrossRef]
- Miller, R.E.; Blair, P.D. Input-Output Analysis: Foundations and Extensions, 2nd ed.; Cambridge University Press: Cambridge, UK, 2012. [Google Scholar] [CrossRef]
- Ang, B.W.; Fang, Q.Z. A survey of index decomposition analysis in energy and environmental studies. Energy 2000, 25, 1149–1176. [Google Scholar] [CrossRef]
- Ang, B.W.; Liu, F.L. A new energy decomposition method: Perfect in decomposition and consistent in aggregation. Energy 2001, 26, 537–547. [Google Scholar] [CrossRef]
- Hoekstra, R.; Van den Bergh, J.C. Comparing structural decomposition analysis and index. Energy Econ. 2003, 25, 39–64. [Google Scholar] [CrossRef]
- Sun, J.W.; Ang, B.W. Some properties of an exact energy decomposition model. Energy 2000, 25, 1177–1188. [Google Scholar] [CrossRef]
- Ang, B.W.; Liu, N. Energy decomposition analysis: IEA model versus other methods. Energy Policy 2007, 35, 1426–1432. [Google Scholar] [CrossRef]
- Diakoulaki, D.; Mandaraka, M. Decomposition analysis for assessing the progress in decoupling industrial growth from CO2 emissions in the EU manufacturing sector. Energy Econ. 2007, 29, 636–664. [Google Scholar] [CrossRef]
- Feng, D.O.N.G.; Xiao-hui, L.I.; Ru-yin, L.O.N.G. Laspeyres decomposition of energy intensity including household-energy factors. Energy Procedia 2011, 5, 1482–1487. [Google Scholar] [CrossRef]
- Choi, K.H.; Ang, B.W. Measuring thermal efficiency improvement in power generation: The Divisia decomposition approach. Energy 2002, 27, 447–455. [Google Scholar] [CrossRef]
- Ang, B.W. Decomposition analysis for policymaking in energy: Which is the preferred method? Energy Policy 2004, 32, 1131–1139. [Google Scholar] [CrossRef]
- Wood, R.; Lenzen, M. Zero-value problems of the logarithmic mean divisia index decomposition method. Energy Policy 2006, 34, 1326–1331. [Google Scholar] [CrossRef]
- Vaninsky, A. Factorial decomposition of CO2 emissions: A generalized Divisia index approach. Energy Econ. 2014, 45, 389–400. [Google Scholar] [CrossRef]
- Yan, Q.; Wang, Y.; Baležentis, T.; Streimikiene, D. Analysis of China’s regional thermal electricity generation and CO2 emissions: Decomposition based on the generalized Divisia index. Sci. Total Environ. 2019, 682, 737–755. [Google Scholar] [CrossRef]
- Jiang, J. China’s urban residential carbon emission and energy efficiency policy. Energy 2016, 109, 866–875. [Google Scholar] [CrossRef]
- Shahiduzzaman, M.D.; Layton, A. Decomposition analysis for assessing the United States 2025 emissions target: How big is the challenge? Renew. Sustain. Energy Rev. 2017, 67, 372–383. [Google Scholar] [CrossRef]
- Cansino, J.M.; Sánchez-Braza, A.; Rodríguez-Arévalo, M.L. Driving forces of Spain’ s CO2 emissions: A LMDI decomposition approach. Renew. Sustain. Energy Rev. 2015, 48, 749–759. [Google Scholar] [CrossRef]
- Moutinho, V.; Madaleno, M.; Inglesi-Lotz, R.; Dogan, E. Factors affecting CO2 emissions in top countries on renewable energies: A LMDI decomposition application. Renew. Sustain. Energy Rev. 2018, 90, 605–622. [Google Scholar] [CrossRef]
- González, P.F.; Landajo, M.; Presno, M.J. Multilevel LMDI decomposition of changes in aggregate energy consumption. A cross country analysis in the EU-27. Energy Policy 2014, 68, 576–584. [Google Scholar] [CrossRef]
- Hatzigeorgiou, E.; Polatidis, H.; Haralambopoulos, D. CO2 emissions in Greece for 1990–2002: A decomposition analysis and comparison of results using the Arithmetic Mean Divisia Index and Logarithmic Mean Divisia Index techniques. Energy 2008, 33, 492–499. [Google Scholar] [CrossRef]
- Ataman, A.Y. Index Decomposition Analysis and Energy Consumption of Turkey: 2000–2014. J. Res. Econ. 2022, 6, 107–134. [Google Scholar] [CrossRef]
- Timma, L.; Blumberga, D. Index decomposition analysis for energy sectors in Latvia. Energy Procedia 2014, 61, 2180–2183. [Google Scholar] [CrossRef]
- Torrie, R.D.; Stone, C.; Layzell, D.B. Reconciling energy efficiency and energy intensity metrics: An integrated decomposition analysis. Energy Effic. 2018, 11, 1999–2016. [Google Scholar] [CrossRef]
- Fan, F.; Lei, Y. Decomposition analysis of energy-related carbon emissions from the transportation sector in Beijing. Transp. Res. Part D Transp. Environ. 2016, 42, 135–145. [Google Scholar] [CrossRef] [PubMed]
- Ang, B.W.; Su, B. Carbon emission intensity in electricity production: A global analysis. Energy Policy 2016, 94, 56–63. [Google Scholar] [CrossRef]
- Web of Science Core Collection. Available online: https://www.webofscience.com/wos/woscc/summary/2cda0f90-16f4-4532-bff9-b3ced238bb31-89907221/times-cited-descending/1(overlay:export/exc) (accessed on 10 May 2023).
- VOS Viewer (Version 1.6.17). Visualizing Scientific Landscape. Centre for Science and Technology Studies, Leiden University, The Netherlands. 2021. Available online: https://www.vosviewer.com/ (accessed on 10 May 2023).
- Tan, Z.; Li, L.; Wang, J.; Wang, J. Examining the driving forces for improving China’s CO2 emission intensity using the decomposing method. Appl. Energy 2011, 88, 4496–4504. [Google Scholar] [CrossRef]
- Karmellos, M.; Kopidou, D.; Diakoulaki, D. A decomposition analysis of the driving factors of CO2 (Carbon dioxide) emissions from the power sector in the European Union countries. Energy 2016, 94, 680–692. [Google Scholar] [CrossRef]
- Jiang, X.T.; Li, R. Decoupling and decomposition analysis of carbon emissions from electric output in the United States. Sustainability 2017, 9, 886. [Google Scholar] [CrossRef]
- Xie, P.; Gao, S.; Sun, F. An analysis of the decoupling relationship between CO2 emission in power industry and GDP in China based on LMDI method. J. Clean. Prod. 2019, 211, 598–606. [Google Scholar] [CrossRef]
- De Oliveira-De Jesus, P.M. Effect of generation capacity factors on carbon emission intensity of electricity of Latin America & the Caribbean, a temporal IDA-LMDI analysis. Renew. Sustain. Energy Rev. 2019, 101, 516–526. [Google Scholar]
- Rüstemoğlu, H. Factors affecting Germany’s green development over 1990–2015: A comprehensive environmental analysis. Environ. Sci. Pollut. Res. 2019, 26, 6636–6651. [Google Scholar] [CrossRef] [PubMed]
- Chen, W.; Yang, M.; Zhang, S.; Andrews-Speed, P.; Li, W. What accounts for the China-US difference in solar PV electricity output? An LMDI analysis. J. Clean. Prod. 2019, 231, 161–170. [Google Scholar] [CrossRef]
- Yu, B.; Fang, D.; Dong, F. Study on the evolution of thermal power generation and its nexus with economic growth: Evidence from EU regions. Energy 2020, 205, 118053. [Google Scholar] [CrossRef]
- Miškinis, V.; Galinis, A.; Konstantinavičiūtė, I.; Lekavičius, V.; Neniškis, E. The role of renewable energy sources in dynamics of energy-related GHG emissions in the baltic states. Sustainability 2021, 13, 10215. [Google Scholar] [CrossRef]
- Sadorsky, P. Wind energy for sustainable development: Driving factors and future outlook. J. Clean. Prod. 2021, 289, 125779. [Google Scholar] [CrossRef]
- Rivera-Niquepa, J.D.; Rojas-Lozano, D.; De Oliveira-De Jesus, P.M.; Yusta, J.M. Decomposition Analysis of the Aggregate Carbon Intensity (ACI) of the Power Sector in Colombia—A Multi-Temporal Analysis. Sustainability 2022, 14, 13634. [Google Scholar] [CrossRef]
- Shi, W.; Tang, W.; Qiao, F.; Sha, Z.; Wang, C.; Zhao, S. How to Reduce Carbon Dioxide Emissions from Power Systems in Gansu Province—Analyze from the Life Cycle Perspective. Energies 2022, 15, 3560. [Google Scholar] [CrossRef]
- Yu, B.; Fang, D.; Xiao, K.; Pan, Y. Drivers of renewable energy penetration and its role in power sector’s deep decarbonization towards carbon peak. Renew. Sustain. Energy Rev. 2023, 178, 113247. [Google Scholar] [CrossRef]
- Koilakou, E.; Hatzigeorgiou, E.; Bithas, K. Carbon and energy intensity of the USA and Germany. A LMDI decomposition approach and decoupling analysis. Env. Sci. Pollut. Res. 2023, 30, 12412–12427. [Google Scholar] [CrossRef]
- Zhang, X.; Zhu, Q.; Zhang, X. Carbon Emission Intensity of Final Electricity Consumption: Assessment and Decomposition of Regional Power Grids in China from 2005 to 2020. Sustainability 2023, 15, 9946. [Google Scholar] [CrossRef]
- Eurostat Database. Energy Flow—Sankey Diagram Data. Available online: https://ec.europa.eu/eurostat/databrowser/view/NRG_BAL_SD/default/table?lang=en (accessed on 10 May 2023).
- Eurostat Database. Supply, Transformation and Consumption of Electricity. Available online: https://ec.europa.eu/eurostat/databrowser/view/NRG_CB_E/default/table?lang=en (accessed on 10 May 2023).
- Eurostat Database. Gross and Net Production of Electricity and Derived Heat by Type of Plant and Operator. Available online: https://ec.europa.eu/eurostat/databrowser/view/NRG_IND_PEH/default/table?lang=en (accessed on 10 May 2023).
- Eurostat Database. Electricity Production Capacities by Main Fuel Groups and Operator. Available online: https://ec.europa.eu/eurostat/databrowser/view/NRG_INF_EPC/default/table?lang=en (accessed on 10 May 2023).
- Eurostat Database. National Accounts Aggregates by Industry (up to NACE A*64). Available online: https://ec.europa.eu/eurostat/databrowser/view/NAMA_10_A64__custom_6702328/default/table?lang=en (accessed on 10 May 2023).
- Eurostat Database. Final Consumption Expenditure of Households by Consumption Purpose (COICOP 3 Digit). Available online: https://ec.europa.eu/eurostat/databrowser/view/NAMA_10_CO3_P3__custom_6702358/default/table?lang=en (accessed on 10 May 2023).
- Standard International Energy Product Classification (SIEC). International Family of Classifications. Available online: https://unstats.un.org/unsd/classifications/Family/Detail/2007 (accessed on 1 May 2023).
- Statistical Classification of Economic Activities in the European Community (NACE). Eurostat Statistics Explained. Available online: https://ec.europa.eu/eurostat/statistics-explained/index.php?title=Glossary:Statistical_classification_of_economic_activities_in_the_European_Community_(NACE) (accessed on 1 May 2023).
- Microsoft Corp. Power BI. Available online: https://powerbi.microsoft.com (accessed on 1 May 2023).
- European Counci. Fit for 55. Background Information. Available online: https://www.consilium.europa.eu/en/policies/green-deal/fit-for-55-the-eu-plan-for-a-green-transition/ (accessed on 1 May 2023).
- ISO 3166-1:2020; Codes for the Representation of Names of Countries and Their Subdivisions—Part 1: Country Code (ISO 3166-1:2020). ISO: Geneva, Switzerland, 2020.


| Study | Result Factor | Impact Factors | Countries | Studied Years |
|---|---|---|---|---|
| Zhongfu et al. (2011) [63] | CO2 emissions in the electric power sector | CO2 emission coefficient, energy intensity of power generation, power generation and consumption ratio, electricity intensity of the gross domestic product (GDP), provincial structural change, and the energy intensity of the GDP | China | 1998–2008 |
| Karmellos et al. (2016) [64] | CO2 emissions in the electric power sector | Level of activity, electricity intensity, electricity trade, efficiency of electricity generation, and fuel mix | EU-28 | 2000–2012 |
| Jiang (2017) [65] | CO2 emissions in the electric power sector | Electricity output effect, energy mix effect, and conversion efficiency effect | US | 1990–2014 |
| Xie et al. (2019) [66] | CO2 emissions in the electric power sector | Energy consumption in power generation, thermal power structure, power generation structure, transmission and distribution loss, electrification, energy intensity, and economic scale | China | 1985–2016 |
| De Oliveira-De Jesus (2019) [67] | CO2 emissions intensity of electricity | Fuel mix, thermal efficiency, fossil share, and geographical effects | Latin America and the Caribbean | 1990–2014 |
| Rüstemoğlu (2019) [68] | CO2 emissions in the electric power sector | Economic activity, the fuel structure effect, the pollution effect, and electricity intensity | Germany | 1990–2015 |
| Chen et al. (2019) [69] | Solar PV electricity output | Solar system efficiency, curtailment issues, and solar resources | China and the US | 2008–2015 |
| Yu et al. (2020) [70] | Thermal power generation | Economic growth, electricity security, substitution effect, electricity intensity, and technological structure | 25 EU countries | 1997–2017 |
| Miškinis et al. (2021) [71] | CO2 emissions | Impact of population change, economic growth, decline in energy intensity, RES deployment, and reduction in emissions intensity on change in GHG emissions | Baltic States | 2010–2019 |
| Sadorsky (2021) [72] | Wind energy consumption | Renewable energy share component and improvements in energy intensity | 17 European countries | 2002–2017 |
| Rivera-Niquepa et al. (2022) [73] | CO2 emissions intensities of electricity generation | Carbon intensity, generation efficiency, and contribution of fossil generation at the specific and total level of electricity production | 8 Colombian administrations | 1990–2020 |
| Shi et al. (2022) [74] | CO2 emissions from electricity systems | Total energy consumed in power generation stage, generation structure, carbon emissions factors by power generation and by grids, electricity consumption, GDP, and population | Gansu Province, China | 2000–2019 |
| Yu et al. (2023) [75] | Renewable electricity generation | Electricity consumption scale, electricity productivity, output productivity, technical efficiency, and carbon emissions | China | 1995–2018 |
| Koilakou et al. (2023) [76] | Carbon and energy intensity | Income, population, energy intensity, and energy structure | The US and Germany | 2000–2017 |
| Zhang et al. (2023) [77] | CO2 emissions intensities of electricity generation | Energy structure, energy intensity, clean production, supply structure, and power loss effects | 6 Chinese regions | 2005–2020 |
| Impacted Factor | Impacting Factor | Calculation of Impact in Absolute Terms (GWh) |
|---|---|---|
| Gross electricity generation | Input volume impact | |
| Input structure impact | ||
| Transformation efficiency impact | ||
| Net electricity generation | Generation capacity impact | |
| Generation capacity structure impact | ||
| Capacity utilization factor impact | ||
| Generation efficiency impact | ||
| Final electricity consumption | Net electricity generation impact | |
| Import impact | ||
| Export impact | ||
| Distribution efficiency impact | ||
| Output volume impact | ||
| Output structure impact | ||
| Consumption intensity impact |
| Energy Source | Input Structure Impact (%) | Transformation Efficiency Impact (%) | ||
|---|---|---|---|---|
| Growth Rate | Share from the EU | Growth Rate | Share from the EU | |
| Natural gas | 11.90 | 60.77 | 2.80 | 60.40 |
| Lignite | −4.60 | −24.89 | 0.60 | 11.85 |
| Other bituminous coal | −8.50 | −47.22 | 0.40 | 9.99 |
| Waste | 2.20 | 11.41 | 0.40 | 9.09 |
| Nuclear heat | −1.70 | −9.61 | 0.30 | 6.20 |
| Biofuels | 7.60 | 40.50 | 0.20 | 5.44 |
| Hydro | 1.20 | 5.69 | 0.10 | 2.41 |
| Solar | 5.20 | 28.92 | 0.10 | 1.86 |
| Manufactured gases | 0.00 | 0.80 | 0.10 | 1.79 |
| Other solid fossil fuels | 0.00 | −0.20 | 0.10 | 1.17 |
| Wind | 12.60 | 70.09 | 0.00 | 0.21 |
| Oil and oil products | −6.70 | −36.26 | −0.50 | −10.40 |
| Type of Capacities | GC Structure Impact (%) | CUF Impact (%) | Generation Efficiency Impact (%) | |||
|---|---|---|---|---|---|---|
| Growth Rate | Share from the EU | Growth Rate | Share from the EU | Growth Rate | Share from the EU | |
| Combustible | −17.2 | −62.8 | −7.1 | −110.9 | −2.8 | −107.7 |
| Hydropower | −5.8 | −20.5 | −0.9 | −16.1 | 0.2 | 4.1 |
| Nuclear | −19.1 | −69.2 | 0.9 | 8.7 | 0.2 | 5.1 |
| Solar | 4.8 | 17.4 | 0.3 | 3.4 | −0.0 | −0.9 |
| Wind | 9.8 | 35.1 | 1.1 | 14.9 | −0.0 | −0.7 |
| Economic Activity | Impact of Output Structure (%) | Impact of Output Structure (%) | ||
|---|---|---|---|---|
| Growth Rate | Share from the EU | Growth Rate | Share from the EU | |
| Agriculture, fishing, and forestry | −6.0 | −0.5 | −0.3 | −0.1 |
| Chemical and chemical products | −35.3 | −2.7 | −3.1 | −0.7 |
| Coke and refined oil products | 6.2 | 0.5 | −3.8 | −0.8 |
| Construction | −0.2 | 0.0 | −0.5 | −0.1 |
| Food, beverages, and tobacco | −9.5 | −0.7 | −1.1 | −0.2 |
| Households | −8.3 | −0.6 | −33.8 | −7.2 |
| Machinery | −15.5 | −1.2 | 1.8 | 0.4 |
| Metal and metal products | −8.5 | −0.7 | −12.2 | −2.6 |
| Mining and quarrying | −6.8 | −0.5 | −4.2 | −0.9 |
| Non-metallic minerals | −6.5 | −0.5 | −3.4 | −0.7 |
| Other | −19.5 | −1.5 | −1.6 | −0.4 |
| Paper, pulp, and printing | −22.9 | −1.7 | −0.7 | −0.2 |
| Services | 34.8 | 2.7 | −23.7 | −5.1 |
| Textiles and leather | −8.4 | −0.6 | −1.4 | −0.3 |
| Transport | 5.2 | 0.4 | −7.3 | −1.6 |
| Transport equipment | 4.1 | 0.3 | −4.3 | −1.0 |
| Wood and wood products | −3.1 | −0.2 | −0.4 | −0.1 |
Disclaimer/Publisher’s Note: The statements, opinions and data contained in all publications are solely those of the individual author(s) and contributor(s) and not of MDPI and/or the editor(s). MDPI and/or the editor(s) disclaim responsibility for any injury to people or property resulting from any ideas, methods, instructions or products referred to in the content. |
© 2023 by the authors. Licensee MDPI, Basel, Switzerland. This article is an open access article distributed under the terms and conditions of the Creative Commons Attribution (CC BY) license (https://creativecommons.org/licenses/by/4.0/).
Share and Cite
Koval, V.; Khaustova, V.; Lippolis, S.; Ilyash, O.; Salashenko, T.; Olczak, P. Fundamental Shifts in the EU’s Electric Power Sector Development: LMDI Decomposition Analysis. Energies 2023, 16, 5478. https://doi.org/10.3390/en16145478
Koval V, Khaustova V, Lippolis S, Ilyash O, Salashenko T, Olczak P. Fundamental Shifts in the EU’s Electric Power Sector Development: LMDI Decomposition Analysis. Energies. 2023; 16(14):5478. https://doi.org/10.3390/en16145478
Chicago/Turabian StyleKoval, Viktor, Viktoriia Khaustova, Stella Lippolis, Olha Ilyash, Tetiana Salashenko, and Piotr Olczak. 2023. "Fundamental Shifts in the EU’s Electric Power Sector Development: LMDI Decomposition Analysis" Energies 16, no. 14: 5478. https://doi.org/10.3390/en16145478
APA StyleKoval, V., Khaustova, V., Lippolis, S., Ilyash, O., Salashenko, T., & Olczak, P. (2023). Fundamental Shifts in the EU’s Electric Power Sector Development: LMDI Decomposition Analysis. Energies, 16(14), 5478. https://doi.org/10.3390/en16145478