Article

Microstructure and First Hydrogenation Properties of Ti16V60Cr24−xFex + 4 wt.% Zr Alloy for x = 0, 4, 8, 12, 16, 20, 24

Hydrogen Research Institute, Université du Québec à Trois-Rivières, Trois-Rivières, QC G9A5H7, Canada
*
Author to whom correspondence should be addressed.
Energies 2023, 16(14), 5360; https://doi.org/10.3390/en16145360
Submission received: 3 June 2023 / Revised: 4 July 2023 / Accepted: 11 July 2023 / Published: 14 July 2023

Abstract

:
In body-centered cubic (BCC) alloys of transition elements, elemental addition or substitution in the vanadium-based alloys can be beneficial for improving the hydrogen storage properties and for reducing the production cost. In this context, the current study focused on the effect of the substitution of Cr by Fe in Ti16V60Cr24−xFex + 4 wt.% Zr alloys where x = 0, 4, 8, 12, 16, 20, 24. The microstructure of each alloy was composed of a matrix having a chemical composition close to the nominal one and a Zr-rich region. From X-ray diffraction patterns, it was found that the matrix has a BCC structure, and the Zr-rich regions present the C14 Laves phase structure. The lattice parameter of BCC phases decreased linearly with x, in accordance with Vegard’s law. The measurement of the first hydrogenation at 298 K under 3 MPa of hydrogen revealed a decrease in the maximum hydrogen capacity: 3.8 wt.% for x = 0, 3.1 wt.% for x = 4 and around 2 wt.% for x = 8 to 24. The XRD patterns after hydrogenation showed a BCT phase for all alloys, with a C14 phase for x = 4, 8, 12 and with C14 and C15 for x = 16, 20 and 24.

1. Introduction

When addressing the use of hydrogen as an energy carrier, it is crucial to consider its transportation and safe storage. Several studies have been conducted to investigate the effectiveness of metal hydrides for storing hydrogen [1,2,3,4,5]. Metal hydrides are attractive due to their high volumetric hydrogen density at ambient temperature and moderate pressures [6]. Vanadium-based alloys with body-centerd cubic (BCC) structures are considered promising metal hydrides because of their high hydrogen storage capacity of ~4 wt.%, which is better than AB2 and AB5 alloys [7,8,9,10,11,12,13]. However, there are still major issues that prevent their practical use: poor first hydrogenation, complex thermodynamics, low cyclic hydrogen capacity and high cost [14]. Several studies, mainly based on elemental addition or substitution, have been done to solve these drawbacks [5,15,16,17,18,19]. Additives such as Fe, Zr and Mn have been found to be effective in lowering cost and enhancing the overall performance of the Ti-V-Cr system [20,21,22,23,24,25,26].
Yoo et al. have studied the influence of Mn and Fe on the hydrogen storage properties of the Ti0.32Cr0.43V0.25 alloy. A fraction of the Cr was replaced with Mn or a combination of Mn and Fe. They reported that the addition of Mn alone increased the effective hydrogen storage capacity while the plateau pressure showed no significant change. However, when Fe was added with Mn, both the effective hydrogen storage capacity and the plateau pressure increased [27]. Aoki et al. have investigated the improvement of cyclic durability of Ti12Cr23V65 alloy by Fe substitutions. They found out that the unsubstituted alloy desorbed 2.19 wt.% of hydrogen while the one with a small amount of Fe (Ti12Cr23V64Fe1) desorbed 2.34 wt.%. The X-ray diffraction profiles of the alloys suggest that Fe substitution inhibits the increase in the lattice strain and the decrease in the crystallite size accompanied by hydrogen absorption and desorption. This inhibition is most likely the reason for the improvement of cyclability by Fe substitution [28]. Cho et al. have studied the hydrogen storage characteristics of (Ti0.16Zr0.05Cr0.22V0.57)1−xFex (x = 0 to 0.10) at 303 K. They reported that the maximum hydrogen storage capacity decreased with increasing Fe quantity while the second plateau pressures in the pressure composition isotherms (PCI) increased. However, the first plateau was not observed in all alloys under their measuring conditions [29]. While studying the influence of Fe on the structure and hydrogen sorption properties of Ti-V-based metal hydrides, Nygard et al. reported that the addition of iron reduced the unit cell, consequently, the hydrogen capacity decreased for (Ti0.7V0.3)1−zFez alloys for z ∈ {0, 0.03, 0.06, 0.1, 0.2, 0.3} [30] This reduction in both lattice parameters and hydrogen capacity was also observed while studying the hydrogen storage properties of Ti-Zr-Cr-Fe-V based alloys rich in titanium [31].
In this study, the effects of gradually replacing Cr with Fe on hydrogen storage properties on vanadium-rich Ti-V-Cr alloys are reported. The work focused on the microstructure, the crystal structure and the first hydrogenation behavior. In a previous investigation, we found that adding 4 wt.% of zirconium to the alloy Ti16V60Cr24 made the first hydrogenation at room temperature possible [32]. Therefore, 4 wt.% Zr has been added to all alloys in the present study.

2. Materials and Methods

All elements used in this investigation were purchased from Alfa Aesar (Ward Hill, MA, USA): Ti sponge (99.95%), V pieces (99.7%), Cr pieces (99.97%), Fe pieces (99.9) and Zr sponge (99.5%). After mixing raw materials in the desired amount, each alloy was synthesized by arc melting under argon to avoid any oxidation of the material. Each ingot of 3 g was turned over and melted three times to ensure homogeneity. Each pellet was hand-crushed in an argon-filled glovebox, using a hardened steel mortar and a pestle. The chemical compositions were Ti16V60Cr1−xFex+ 4 wt.% Zr where x = 0, 4, 8, 12, 16, 20 and 24.
A little piece of each sample is mounted in epoxy, polished with a series of abrasive discs until a mirror surface is obtained. Then, the alloys microstructure was studied using a Hitachi Su1510 (Mississauga, QN, Canada) scanning electron microscopy equipped with an energy dispersive X-ray (EDX) apparatus The fraction of each region appearing in the micrographs was determined by ImageJ software (version 1.50I) [33].
X-ray diffraction patterns before and after hydrogenation were acquired using a Brucker D8 Focus (Madison, WI, USA) diffractometer with Cu radiation. Each pattern was refined with Topas software (Version 6) to determine the crystallographic parameters such as the lattice parameter, crystallite size and microstrain [34].
Hydrogenation measurements were carried out by using a homemade Sievert-type apparatus based on the volumetric method. It is a gas sorption measurement device (with a fixed known volume) where the quantity of hydrogen absorbed or desorbed by a sample is determined by the change in pressure [35]. The first hydrogenation was done at room temperature, under 3 MPa of hydrogen pressure. Before hydrogenation, the powder was first filled in the reactor and then kept under dynamic vacuum for 30 mn at room temperature before measurement.

3. Results and Discussion

3.1. Microstructure

A previous investigation showed that the alloy Ti16V60Cr24 is composed of a matrix of BCC phase and a bright secondary phase [32]. Figure 1 shows the micrographs of the Ti16V60Cr24−xFex + 4 wt.% Zr alloys for x = 0, 4, 8, 12, 16, 20, 24. The chemical composition of each alloy was confirmed by EDX measurements to be equal to the nominal value. The abundance of each phase was measured by ImageJ and listed in Table 1. The proportion of the secondary phase increased with an increasing proportion of Fe.
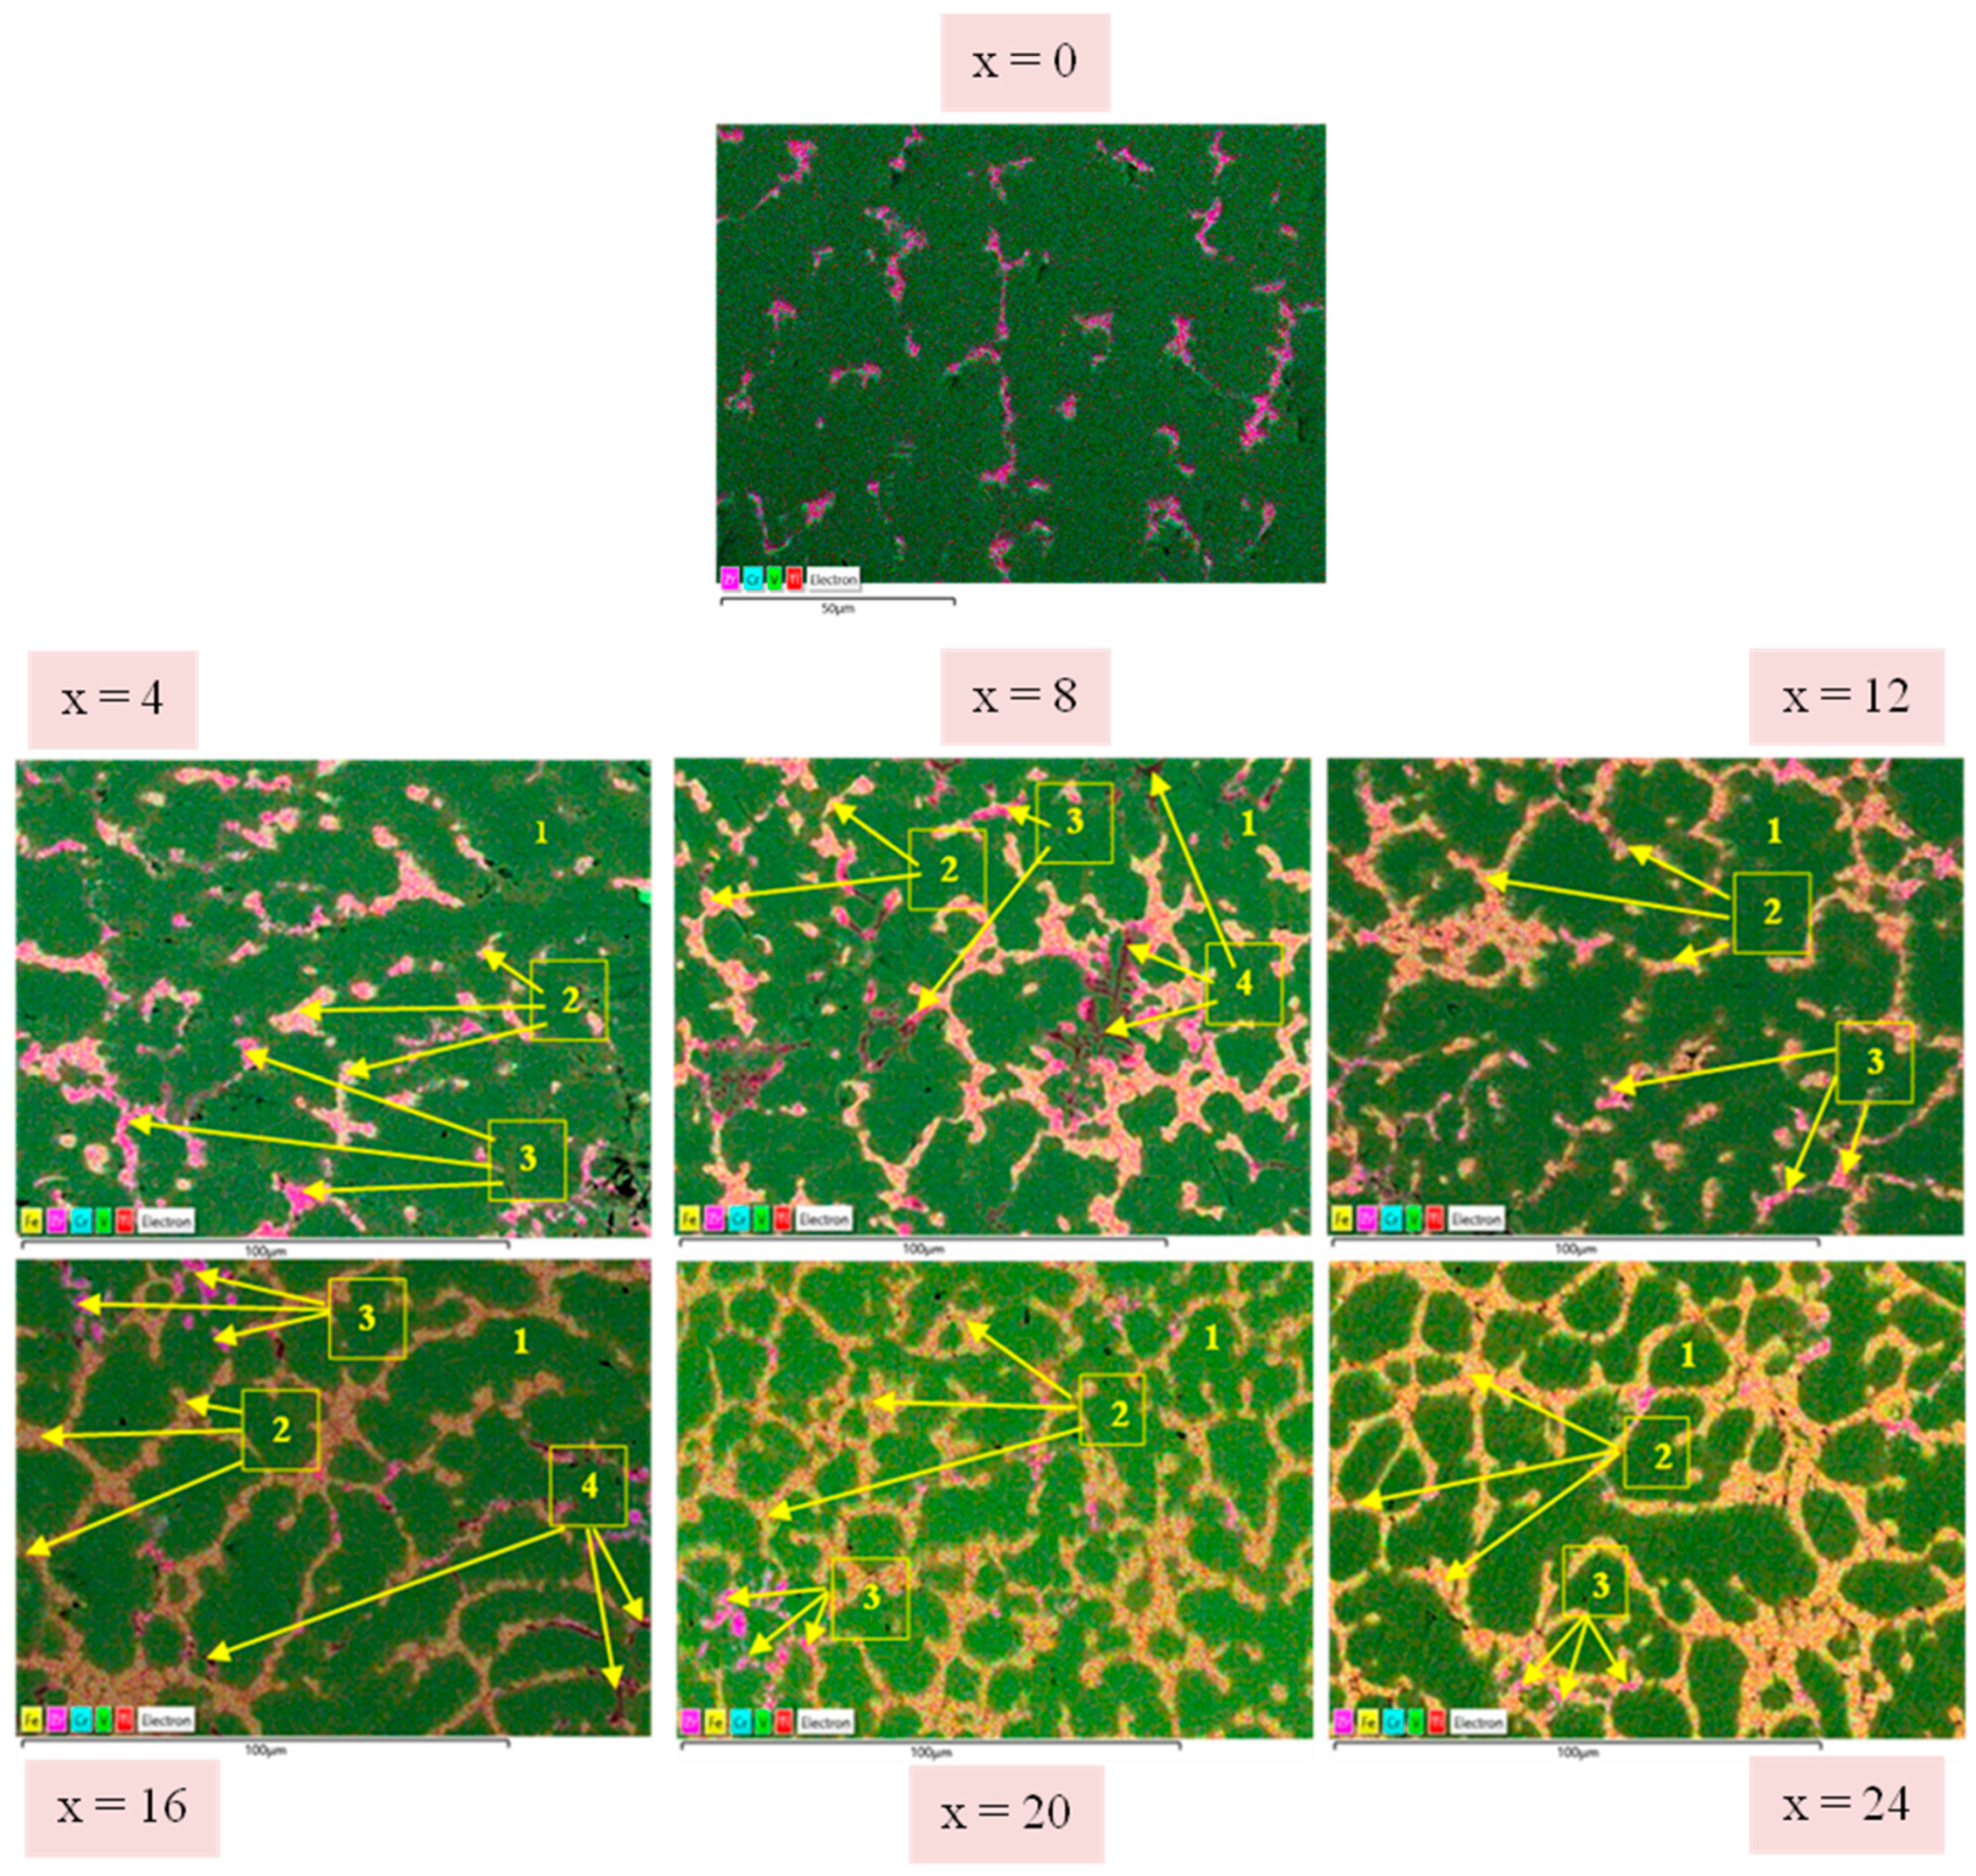
Figure 2 presents the maps of all alloys, highlighting the repartition of each element. All compositions containing Fe show two regions: a gray shade matrix (Point 1) and bright regions. The elemental maps indicate that the bright region is inhomogeneous, being composed of two levels of brightness which differ mainly in the zirconium concentration. They are identified as secondary phase 1 (Point 2) and secondary phase 2 (Point 3). This contrast may be explained by the fact that in arc melting, the pellet is mainly cooled from the bottom up. Therefore, there may be some differences in the cooling rate from one place in the ingot to another one. For x = 8 and 16, Ti precipitates (Point 4) are observed. From x = 4, the secondary phase is forming islands within the matrix. At x = 16, the percolation point is reached.
EDS analysis has been performed to measure the chemical composition of each phase. The chemical compositions of Points 1–4 are listed in Table 2, Table 3, Table 4 and Table 5, respectively. From x = 0 to x = 20, the matrix phase (Point 1, Table 1) has a composition very close to the nominal one except for zirconium which is lower than 0.6 at.% while the nominal value is around 2 at.%. For x = 24 the amount of titanium is lower than the nominal and vanadium is higher.
Regarding the bright phase with a higher Zr proportion (Point 2, Table 3), titanium and zirconium are its main elements. Vanadium, chromium, and iron are in much smaller proportions. Titanium proportion is relatively constant with x while zirconium proportion somewhat changes. But together, zirconium and titanium count for between 70% and 92% of this phase. Considering that zirconium and titanium are totally miscible, a variation in the relative proportion of titanium and zirconium may not be surprising.
The bright phase with a lower Zr proportion (Point 3, Table 4) has a high concentration of titanium, vanadium, and iron. The zirconium content is decreasing with an increasing amount of iron.
Ti precipitates (Table 5) are made of a high concentration of titanium, an equal proportion of vanadium and zirconium and a low content of chromium and iron.
In the matrix and secondary phases, the proportion of Zr changes with the x value despite the fact that the amount of Zr in the bulk is constant at 4 wt.%. This could be explained by the proportion of Zr that decreases in some phases and increases in others. The relative amount of the phases also changes; therefore, all these phenomena compensate each other and the total amount of Zr is constant. Still, the general observation about zirconium is that it does not associate with the matrix phase and “prefer” to be in the secondary phases.

3.2. Crystal Structure

Figure 3 shows XRD patterns of as-cast Ti16V60Cr24−xFex + 4 wt.% Zr alloys for x = 0 to 24. For x = 0, 4 and 8, they all consist of a single BCC phase. From x = 12, two phases are present in the diffraction patterns: a BCC phase and a C14-type Laves phase appeared. Moreover, the diffraction peaks of alloys containing Fe slightly shifted toward higher angles. For all alloys, we were expecting peaks that correspond to the secondary phase seen in SEM. However, the XRD patterns of x = 4 and x = 8 only showed a pure BCC phase. This may be due to the low abundance of the secondary phase that makes it difficult to detect by X-ray diffraction. Further investigation such as neutron diffraction measurements needs to be done to better understand the crystal structure of the secondary phase.
The abundance of each phase structure is given in Table 6. Referring to the SEM results, the BCC phase is related to the matrix while the C14 phase could be associated with the low-Zr concentration secondary phase. Compared to Table 1, x = 12 and 16 have a higher proportion of the secondary phase.
The crystallographic parameters of the BCC phase of all compositions are summarized in Table 7. With increasing Fe content, the lattice parameter of the BCC decreased linearly as seen in Figure 4. This reduction is in accordance with Vegard’s law and can be explained by the fact that the metallic radius of Fe (1.274 Å) is smaller than that of Cr (1.36 Å) [36]. The microstrain is also decreasing with increasing x.
A C14 Laves phase was identified in the patterns for x = 12 to 24. This phase should have an AB2 stoichiometry where the ideal atomic radius ratio rA/rB = 1.225 [37]. However, the range of stability is 1.19 < rA/rB < 1.32 [38]. The atomic radius of all elements are: Ti (1.462 Å), V (1.346 Å), Cr (1.36 Å), Fe (1.274 Å) and Zr (1.602 Å) [36]. Thus, we see that zirconium is certainly on the A site with vanadium, chromium and iron certainly on the B site. The case of Ti is more complicated because, as it has an intermediate atomic radius, it could occupy both A and B sites in a quaternary Laves phase [39]. From the EDS results, only the secondary phase 2 (Table 4) has stoichiometry that could fit the AB2 scheme. However, for x = 12 and 16 the sum of Ti and Zr abundance is more than 33 at.%. Therefore, Ti atoms should be on the B site. This will most likely make this phase metastable. This metastability is probably the reason for the different chemical compositions of Points 2 and 3 seen by EDS. We intend to submit these alloys to heat treatment and also to perform neutron diffraction in order to check the metastability and the exact nature of the C14 phase.
Crystallographic parameters of the C14 phase are given in Table 8. The lattice parameter of the C14 is also decreasing with an increasing Fe proportion. This is probably due to the fact that the proportion of Zr atom is decreasing with x.

3.3. First Hydrogenation

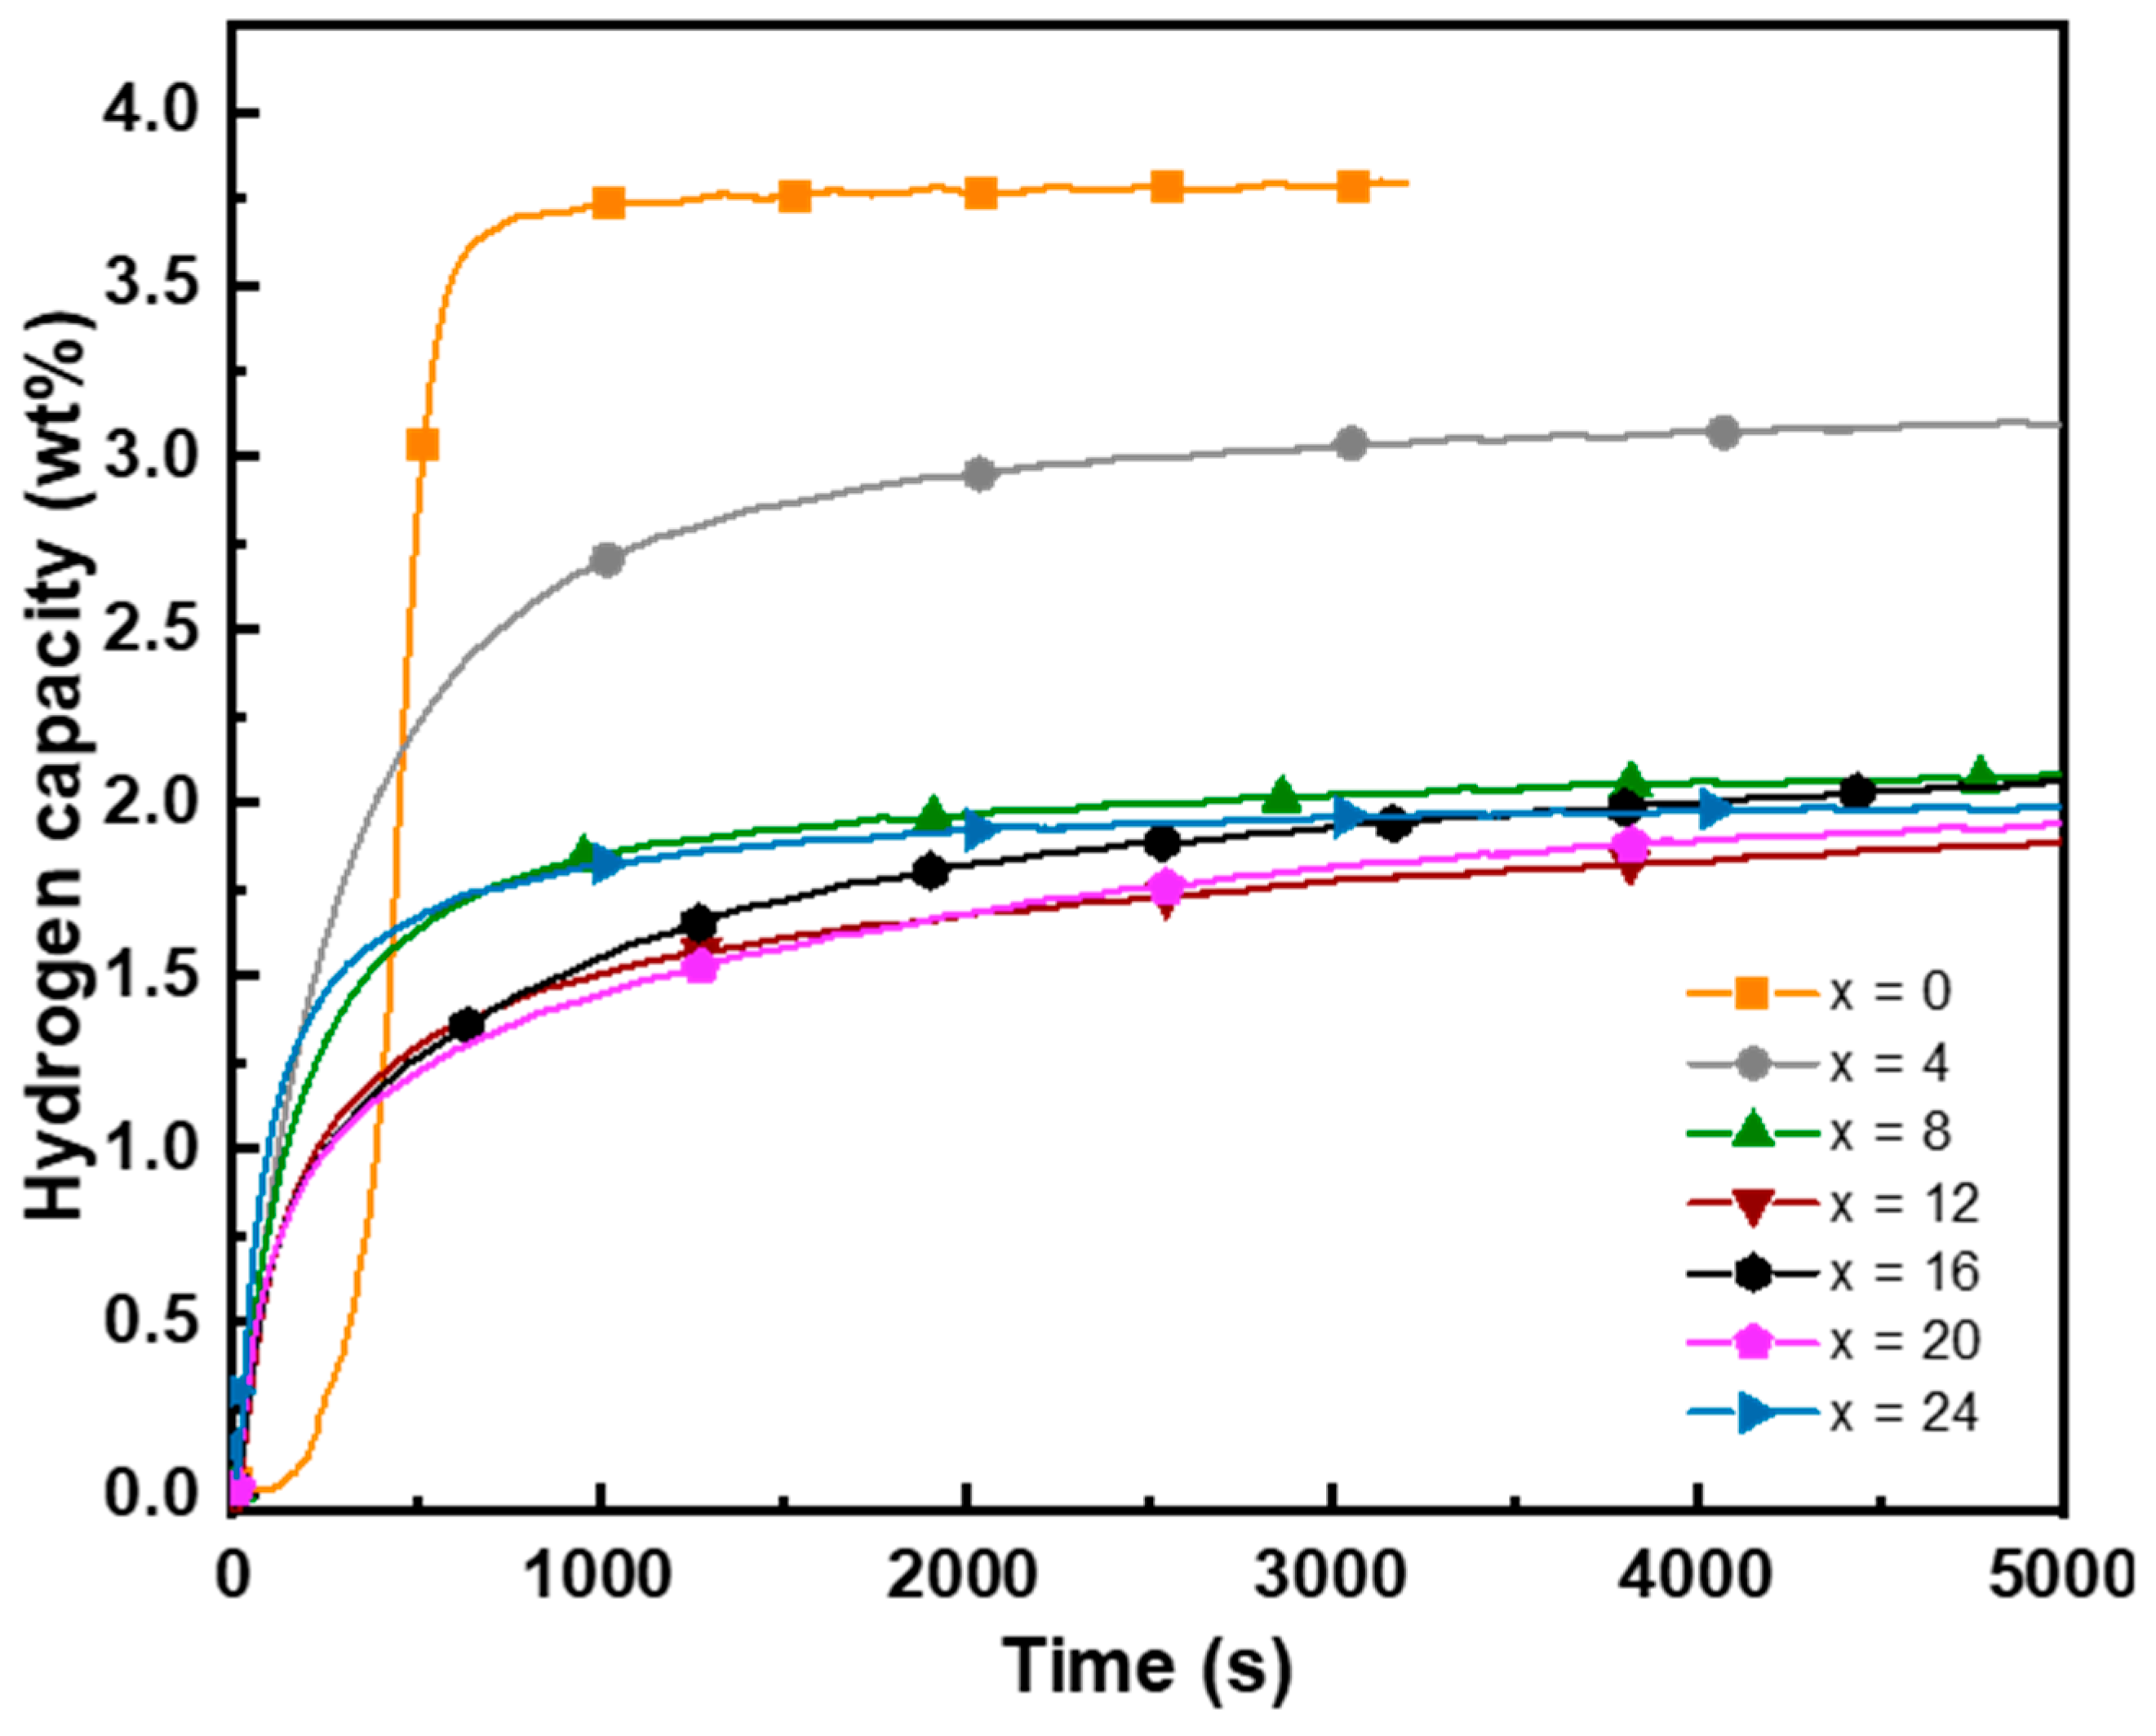
The activation process was done at 298 K, under 3 MPa of hydrogen pressure. The results are given in Figure 5. The Ti16V60Cr24 + 4 wt.% Zr alloy absorbed 3.8 wt.% of hydrogen. For x = 4, the maximum hydrogen capacity dropped to 3.1 wt.%. Then, for x = 8 to 24, the hydrogen capacity decreased again and remained at around 2 wt.%. By increasing the Fe proportion, SEM results of these alloys showed a close network of secondary phases within the matrix that may have blocked the hydrogen uptake by the matrix. Cho et al. reported that the decrease in the hydrogen capacity in the presence of Fe can be caused by three main factors: the decrease in the lattice parameter of the BCC phase as mentioned earlier, the reduction in the amount of BCC phase in the alloy (seen in Table 6) and the excess of the e/a value over 5.1 [29]. The e/a ratio of the BCC phase in each alloy was calculated: x = 4 (5.11), x = 8 (5.16), x = 12 (5.24), x = 16 (5.27), x = 20 (5.31) and x = 24 (5.27). Note that for x = 0, e/a ratio is equal to 5.08.
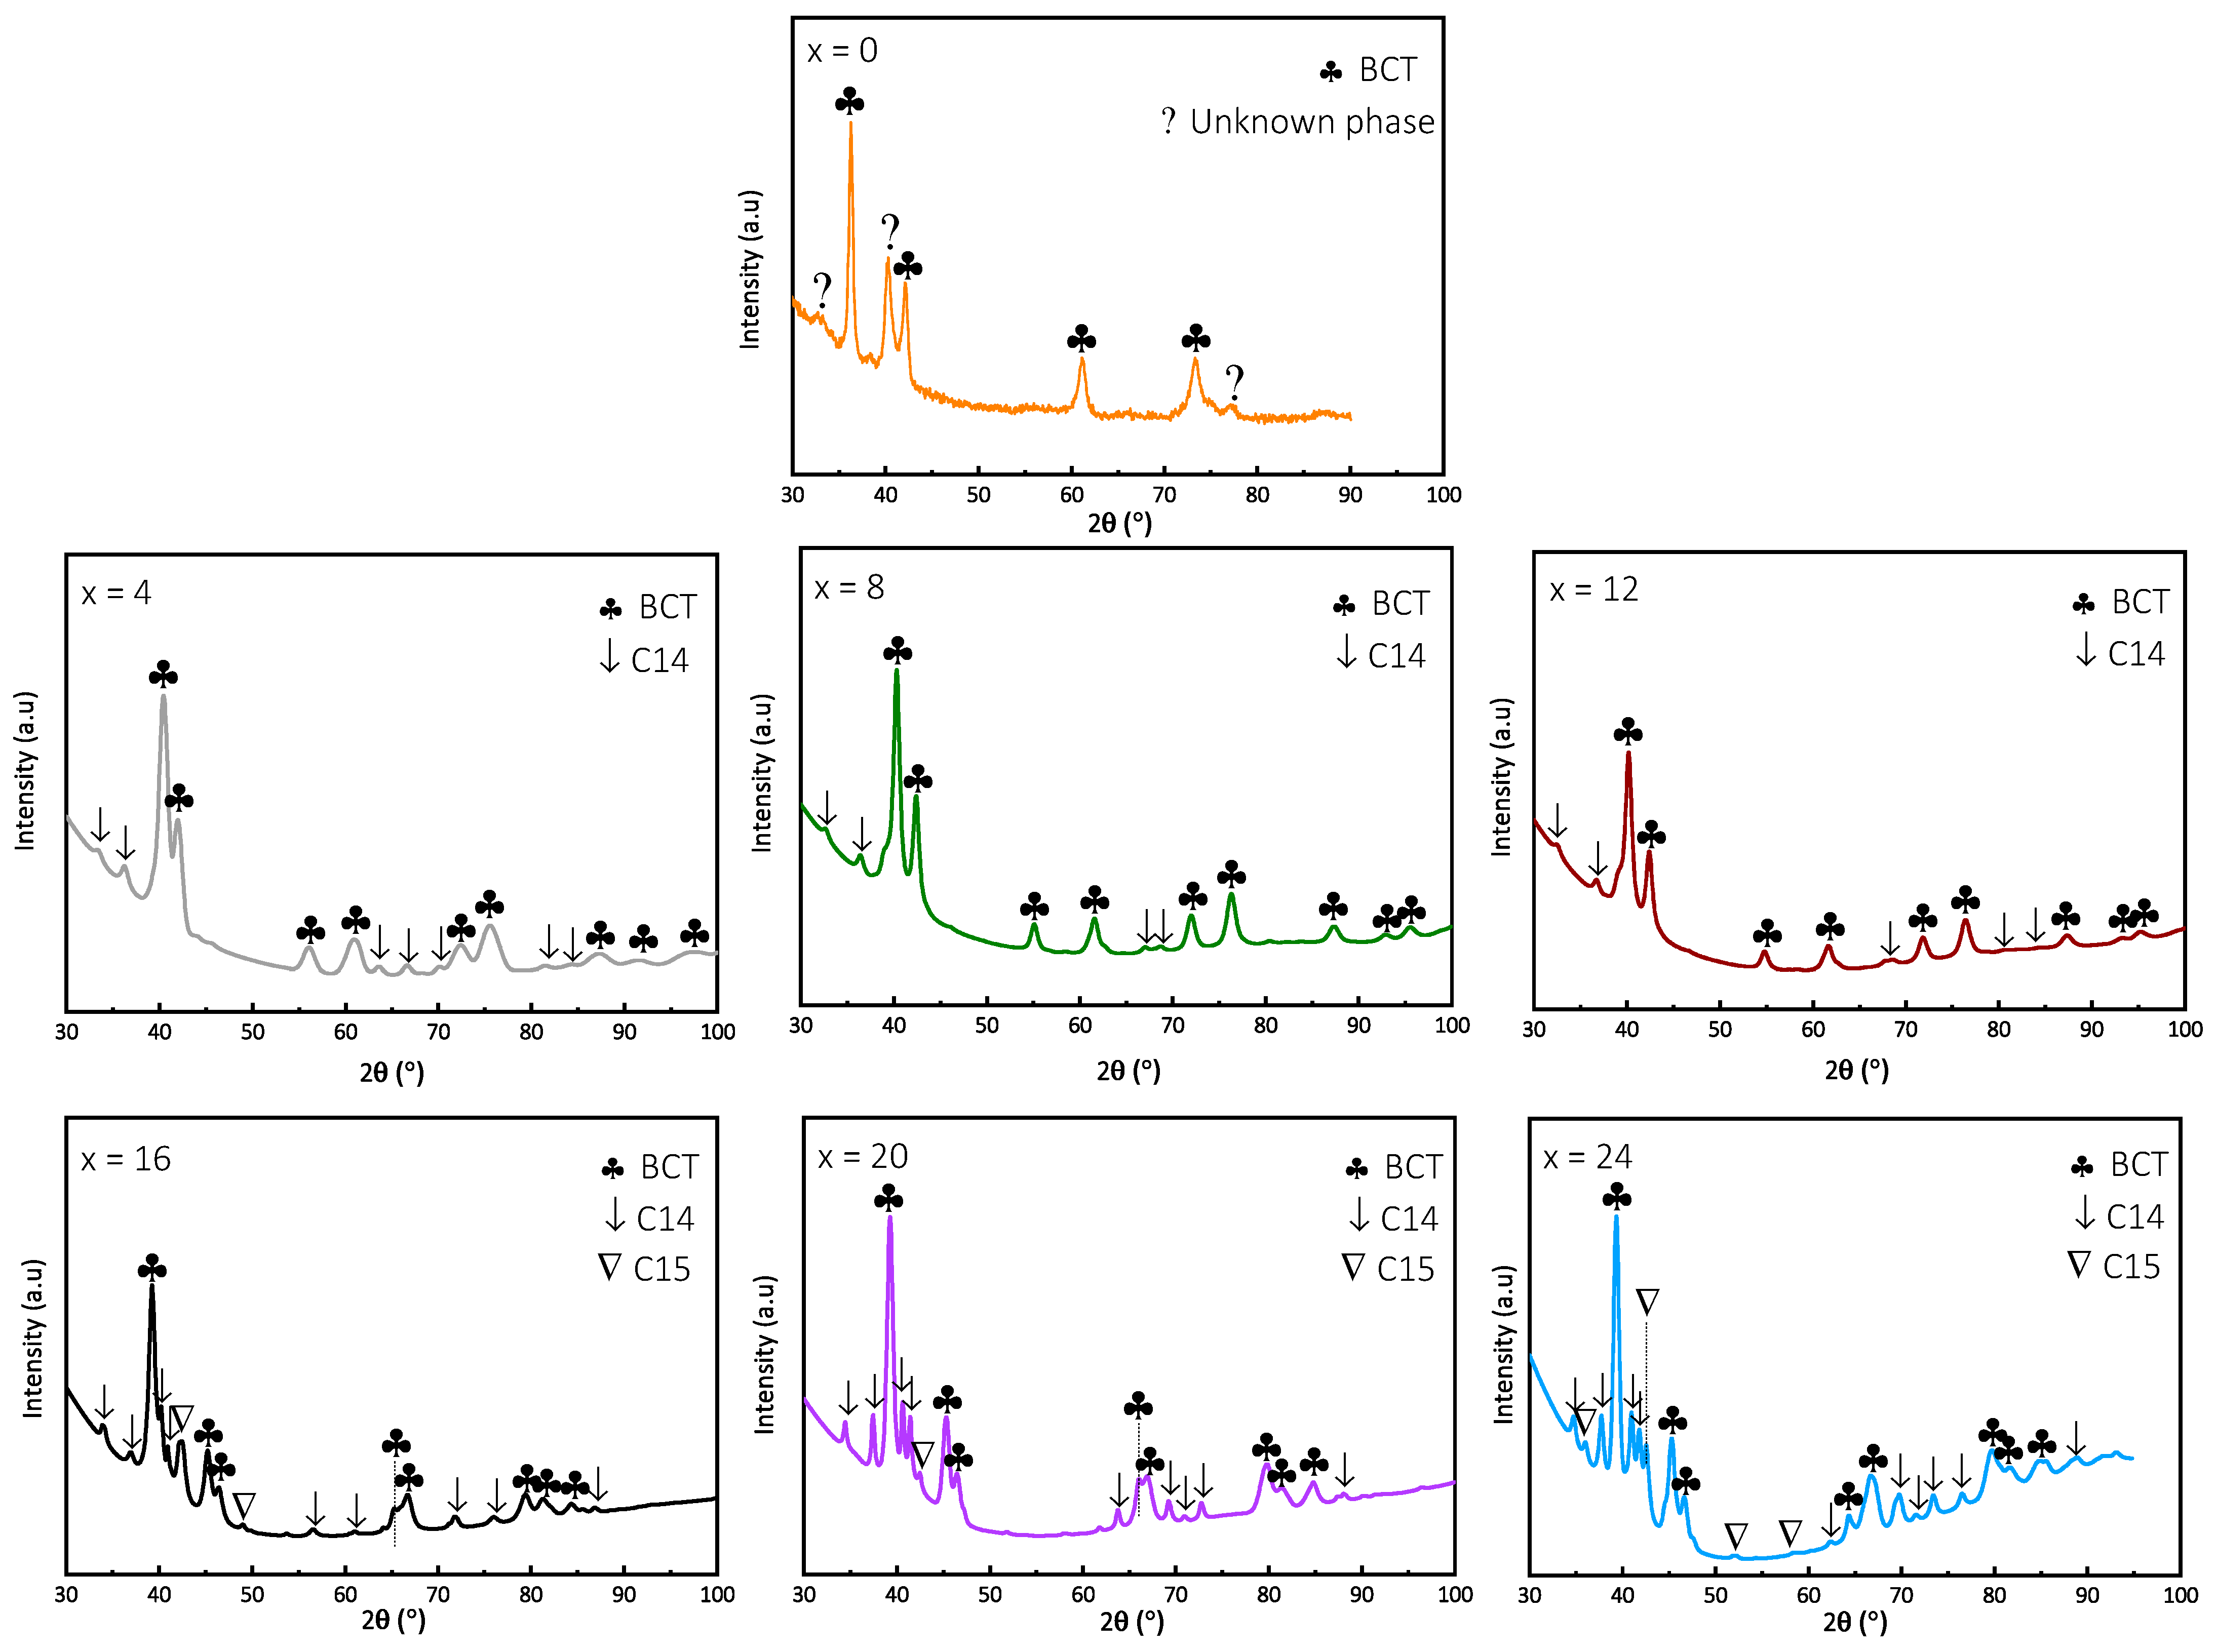
The XRD patterns after the hydrogenation of all alloys are presented in Figure 6. For x = 0, the XRD pattern shows a BCT phase with a few unknown peaks. For x = 4 to 24, the major diffraction peaks of all hydride alloys are identified as the BCT phase. Small peaks appeared with increasing the iron proportion. They are surely related to the secondary phases seen in SEM but they could not be indexed to a Laves phase. The crystallographic parameters of the hydride phase are summarized in Table 9.
For x = 4, 8 and 12, two phases were identified: BCT and C14. They correspond, respectively, to the matrix (Point 1) and the low-Zr bright phase (Point 3) seen in SEM and EDS.
For x = 16, 20 and 24, three phases were found: BCT, C14 and C15. The appearance of C15 is unclear because in the third existing phase (referred to Table 3), the ration A/B = 2 required for a Laves phase is not fulfilled. Moreover, C15 peaks have small abundances. Using the C15 phase led to a better fit for the refinement; however, we cannot bring any conclusion concerning that phase.
As the volume of the unit cell increased after hydrogenation, the hydrogen absorbed capacity can be estimated. For x = 0, as the BCC phase turned into a single BCT phase after hydrogenation, the hydrogen capacity can be calculated. However, for x = 4 to 24, it could not be estimated since the C14 and C15 were not visible in the as-cast patterns.
Considering that a hydrogen atom produces a volume expansion between 2 and 3 Å3, the estimated hydrogen capacity of the BCT phase of x = 0 was calculated. It was estimated to be between 3.68 and 5.53 wt.%. Compared with the hydrogen capacity of 3.8 wt.%, measured upon activation, the volume of the hydrogen atom is 2.95 Å3. This value matches with the volume expansion of 2.9 Å3 of a hydrogen atom for a wide range of materials according to Peisl [40].

4. Conclusions

The investigation of the microstructure and first hydrogenation properties of Ti16V60Cr24−xFex + 4 wt.% Zr alloys for x = 0, 4, 8, 12, 16, 20, 24 leads to the following conclusion:
-
All alloys presented a two-phase microstructure: a matrix and a secondary phase.
-
The as-cast XRD patterns showed a single BCC phase for x = 0 to 8 and a BCC with a C14 Laves phase for x = 12 to 24. The lattice parameter of the BCC phase linearly decreased with increasing Fe proportion. This is in accordance with Vegard’s law.
-
The first hydrogenation of all alloys at 298 K under 3 MPa revealed a decrease in the hydrogen capacity with an increasing proportion of Fe. This trend is explained by the reduction in the BCC lattice parameter and the increase in the electron-to-atom ratio due to the presence of Fe.
-
The XRD patterns of hydride alloys revealed a C14 phase in addition to the BCC phase for x = 4 and 8, and a C15 phase in addition to BCC and C14 for x = 16, 20, 24. The absence of Laves in the as-cast state is still misunderstood but neutron diffraction measurements are planned to better investigate and understand the crystal structure of all studied alloys.
-
According to the present work on the vanadium-rich Ti16V60Cr24−xFex for x = 0, 4, 8, 12, 16, 20, 24 alloys, we found that the presence of Fe enhanced the kinetic but lowered the maximum hydrogen capacity. For x higher than 4 at.%, there is a loss of almost 50% of the hydrogen capacity. Consequently, the reversible capacity will also be low. In the future, it would be interesting to only focus on x ≤ 4 alloys. Just using a small proportion of iron will stabilize the hydride while maintaining a high hydrogen capacity. Thermodynamics will be studied in a future investigation.

Author Contributions

All experiments were performed by F.R., except electron microscopy. J.H. and F.R. analyzed the results and wrote the paper. All authors have read and agreed to the published version of the manuscript.

Funding

This research received no external funding.

Data Availability Statement

Data available by contacting authors.

Acknowledgments

We would like to thank A. Lejeune and K. Milette for the electron microscopy experiments.

Conflicts of Interest

The authors declare no conflict of interest.

Correction Statement

This article has been republished with a minor correction to resolve typographical errors. This change does not affect the scientific content of the article.

References

  1. Akiba, E. Hydrogen-Absorbing Alloys. Curr. Opin. Solid State Mater. Sci. 1999, 4, 267–272. [Google Scholar] [CrossRef]
  2. Edalati, K.; Akiba, E.; Horita, Z. High-Pressure Torsion for New Hydrogen Storage Materials. Sci. Technol. Adv. Mater. 2018, 19, 185–193. [Google Scholar] [CrossRef]
  3. Akiba, E.; Okada, M. M Etallic Hydrides III: Cubic Solid-Solution Alloys. MRS Bull. 2002, 27, 699–703. [Google Scholar] [CrossRef]
  4. Møller, K.T.; Jensen, T.R.; Akiba, E.; Li, H. wen Hydrogen—A Sustainable Energy Carrier. Prog. Nat. Sci. Mater. Int. 2017, 27, 34–40. [Google Scholar] [CrossRef]
  5. Bibienne, T.; Bobet, J.L.; Huot, J. Crystal Structure and Hydrogen Storage Properties of Body Centered Cubic 52Ti-12V-36Cr Alloy Doped with Zr7Ni10. J. Alloys Compd. 2014, 607, 251–257. [Google Scholar] [CrossRef]
  6. Towata, S.I.; Noritake, T.; Itoh, A.; Aoki, M.; Miwa, K. Cycle Durability of Ti-Cr-V Alloys Partially Substituted by Nb or Fe. J. Alloys Compd. 2013, 580, S226–S228. [Google Scholar] [CrossRef]
  7. Selvaraj, S.; Ichikawa, T.; Jain, A.; Kumar, S.; Zhang, T.; Miyaoka, H.; Kojima, Y.; Isobe, S. Study of Cyclic Performance of V-Ti-Cr Alloys Employed for Hydrogen Compressor. Int. J. Hydrogen Energy 2018, 43, 2881–2889. [Google Scholar] [CrossRef]
  8. Lototsky, M.V.; Yartys, V.A.; Zavaliy, I.Y. Vanadium-Based BCC Alloys: Phase-Structural Characteristics and Hydrogen Sorption Properties. J. Alloys Compd. 2005, 404–406, 421–426. [Google Scholar] [CrossRef]
  9. Shashikala, K.; Kumar, A.; Betty, C.A.; Banerjee, S.; Sengupta, P.; Pillai, C.G.S. Improvement of the Hydrogen Storage Properties and Electrochemical Characteristics of Ti0.85VFe0.15 Alloy by Ce Substitution. J. Alloys Compd. 2011, 509, 9079–9083. [Google Scholar] [CrossRef]
  10. Cao, Z.; Ouyang, L.; Wang, H.; Liu, J.; Sun, L.; Zhu, M. Composition Design of Ti-Cr-Mn-Fe Alloys for Hybrid High-Pressure Metal Hydride Tanks. J. Alloys Compd. 2015, 639, 452–457. [Google Scholar] [CrossRef]
  11. Cho, S.W.; Han, C.S.; Park, C.N.; Akiba, E. Hydrogen Storage Characteristics of Ti-Cr-V Alloys. J. Alloys Compd. 1999, 288, 294–298. [Google Scholar] [CrossRef]
  12. Yu, X.B.; Yang, Z.X.; Feng, S.L.; Wu, Z.; Xu, N.X. Influence of Fe Addition on Hydrogen Storage Characteristics of Ti-V-Based Alloy. Int. J. Hydrogen Energy 2006, 31, 1176–1181. [Google Scholar] [CrossRef]
  13. Luo, L.; Bian, X.; Wu, W.-Y.; Yuan, Z.-M.; Li, Y.-Z.; Zhai, T.-T.; Hu, F. Influence of annealing on microstructure and hydrogen storage properties of V48Fe12Ti15Cr25 alloy. J. Iron Steel Res. Int. 2020, 27, 217–227. [Google Scholar] [CrossRef]
  14. Kumar, S.; Jain, A.; Ichikawa, T.; Kojima, Y.; Dey, G.K. Development of Vanadium Based Hydrogen Storage Material: A Review. Renew. Sustain. Energy Rev. 2017, 72, 791–800. [Google Scholar] [CrossRef]
  15. Shashikala, K.; Banerjee, S.; Kumar, A.; Pai, M.R.; Pillai, C.G.S. Improvement of Hydrogen Storage Properties of TiCrV Alloy by Zr Substitution for Ti. Int. J. Hydrogen Energy 2009, 34, 6684–6689. [Google Scholar] [CrossRef]
  16. Towata, S.I.; Noritake, T.; Itoh, A.; Aoki, M.; Miwa, K. Effect of Partial Niobium and Iron Substitution on Short-Term Cycle Durability of Hydrogen Storage Ti-Cr-V Alloys. Int. J. Hydrogen Energy 2013, 38, 3024–3029. [Google Scholar] [CrossRef]
  17. Bibienne, T.; Gosselin, C.; Bobet, J.L.; Huot, J. Replacement of Vanadium by Ferrovanadium in a Ti-Based Body Centred Cubic (BCC) Alloy: Towards a Low-Cost Hydrogen Storage Material. Appl. Sci. 2018, 8, 1151. [Google Scholar] [CrossRef]
  18. Dixit, V.; Huot, J. Investigation of the Microstructure, Crystal Structure and Hydrogenation Kinetics of Ti-V-Cr Alloy with Zr Addition. J. Alloys Compd. 2019, 785, 1115–1120. [Google Scholar] [CrossRef]
  19. Sleiman, S.; Huot, J. Microstructure and Hydrogen Storage Properties of Ti1V0.9Cr1.1 Alloy with Addition of x Wt % Zr (x = 0, 2, 4, 8, and 12). Inorganics 2017, 5, 86. [Google Scholar] [CrossRef]
  20. Abdul, J.M.; Chown, L.H.; Odusote, J.K.; Nei, J.; Young, K.H.; Olayinka, W.T. Hydrogen Storage Characteristics and Corrosion Behavior of Ti24V40C34Fe2 Alloy. Batteries 2017, 3, 19. [Google Scholar] [CrossRef]
  21. Tamura, T.; Tominaga, Y.; Matsumoto, K.; Fuda, T.; Kuriiwa, T.; Kamegawa, A.; Takamura, H.; Okada, M. Protium Absorption Properties of Ti-V-Cr-Mn Alloys with a b.c.c. Structure. J. Alloys Compd. 2002, 330–332, 522–525. [Google Scholar] [CrossRef]
  22. Taizhong, H.; Zhu, W.; Jinzhou, C.; Xuebin, Y.; Baojia, X.; Naixin, X. Dependence of Hydrogen Storage Capacity of TiCr1.8−X(VFe)X on V-Fe Content. Mater. Sci. Eng. A 2004, 385, 17–21. [Google Scholar] [CrossRef]
  23. Yu, X.B.; Wu, Z.; Xia, B.J.; Xu, N.X. Enhancement of Hydrogen Storage Capacity of Ti-V-Cr-Mn BCC Phase Alloys. J. Alloys Compd. 2004, 372, 272–277. [Google Scholar] [CrossRef]
  24. Hang, Z.; Xiao, X.; Tan, D.; He, Z.; Li, W.; Li, S.; Chen, C.; Chen, L. Microstructure and Hydrogen Storage Properties of Ti10V84−xFe6Zrx (x = 1–8) Alloys. Int. J. Hydrogen Energy 2010, 35, 3080–3086. [Google Scholar] [CrossRef]
  25. Li, J.; Guo, Y.; Jiang, X.; Li, S.; Li, X. Hydrogen Storage Performances, Kinetics and Microstructure of Ti1.02Cr1.0Fe0.7−XMn0.3Alx Alloy by Al Substituting for Fe. Renew. Energy 2020, 153, 1140–1154. [Google Scholar] [CrossRef]
  26. Charbonnier, V.; Enoki, H.; Asano, K.; Kim, H.; Sakaki, K. Tuning the Hydrogenation Properties of Ti1+yCr2−XMnx Laves Phase Compounds for High Pressure Metal-Hydride Compressors. Int. J. Hydrogen Energy 2021, 46, 36369–36380. [Google Scholar] [CrossRef]
  27. Yoo, J.H.; Shim, G.; Park, C.N.; Kim, W.B.; Cho, S.W. Influence of Mn or Mn plus Fe on the Hydrogen Storage Properties of the Ti-Cr-V Alloy. Int. J. Hydrogen Energy 2009, 34, 9116–9121. [Google Scholar] [CrossRef]
  28. Aoki, M.; Noritake, T.; Ito, A.; Ishikiriyama, M.; Towata, S.I. Improvement of Cyclic Durability of Ti-Cr-V Alloy by Fe Substitution. Int. J. Hydrogen Energy 2011, 36, 12329–12332. [Google Scholar] [CrossRef]
  29. Cho, S.W.; Enoki, H.; Akiba, E. Effect of Fe Addition on Hydrogen Storage Characteristics of Ti0.16Zr0.05Cr0.22V0.57 Alloy. J. Alloys Compd. 2000, 307, 304–310. [Google Scholar] [CrossRef]
  30. Nygård, M.M.; Sørby, M.H.; Grimenes, A.A.; Hauback, B.C. The Influence of Fe on the Structure and Hydrogen Sorption Properties of Ti-V-Based Metal Hydrides. Energies 2020, 13, 2874. [Google Scholar] [CrossRef]
  31. Cao, Z.; Zhou, P.; Xiao, X.; Zhan, L.; Li, Z.; Wang, S.; Chen, L. Investigation on Ti–Zr–Cr–Fe–V Based Alloys for Metal Hydride Hydrogen Compressor at Moderate Working Temperatures. Int. J. Hydrogen Energy 2021, 46, 21580–21589. [Google Scholar] [CrossRef]
  32. Ravalison, F.; Rabkin, E.; Huot, J. Methods to Improve the First Hydrogenation of the Vanadium-Rich BCC Alloy Ti16V60Cr24. Hydrogen 2022, 3, 303–311. [Google Scholar] [CrossRef]
  33. Collins, T.J. ImageJ for Microscopy. BioTechniques 2007, 43, S25–S30. [Google Scholar] [CrossRef] [PubMed]
  34. Bruker, A.X. TOPAS V3: General Profile and Structure Analysis Software for Powder Diffraction Data. In User’s Manual Bruker AXS; Bruker: Karlsruhe, Germany, 2005. [Google Scholar]
  35. Broom, D.P. Hydrogen Storage Materials The Characterisation of Their Storage Properties, 1st ed.; Springer: Berlin/Heidelberg, Germany, 2011; ISBN 9780857292209. [Google Scholar]
  36. Pearson, W.B. The Crystal Chemistry and Physics of Metals and Alloys; Wiley Interscience: Hoboken, NJ, USA, 1972. [Google Scholar]
  37. Stein, F.; Leineweber, A. Laves Phases: A Review of Their Functional and Structural Applications and an Improved Fundamental Understanding of Stability and Properties. J. Mater. Sci. 2021, 56, 5321–5427. [Google Scholar] [CrossRef]
  38. Hynninen, A.P.; Filion, L.; Dijkstra, M. Stability of LS and L S2 Crystal Structures in Binary Mixtures of Hard and Charged Spheres. J. Chem. Phys. 2009, 131, 064902. [Google Scholar] [CrossRef]
  39. Grytsiv, A.; Chen, X.Q.; Witusiewicz, V.T.; Rogl, P.; Podloucky, R.; Pomjakushin, V.; Maccio, D.; Saccone, A.; Giester, G.; Sommer, F. Atom Order and Thermodynamic Properties of the Ternary Laves Phase Ti(TiyNixAl1−x−y)2. Z. Fur Krist. 2006, 221, 334–348. [Google Scholar] [CrossRef]
  40. Peisl, H. Lattice Strains Due to Hydrogen in Metals. In Hydrogen in Metals I, Topics in Applied Physics; Springer: Berlin/Heidelberg, Germany, 1978; Volume 28, ISBN 978-3-540-08705-2. [Google Scholar]
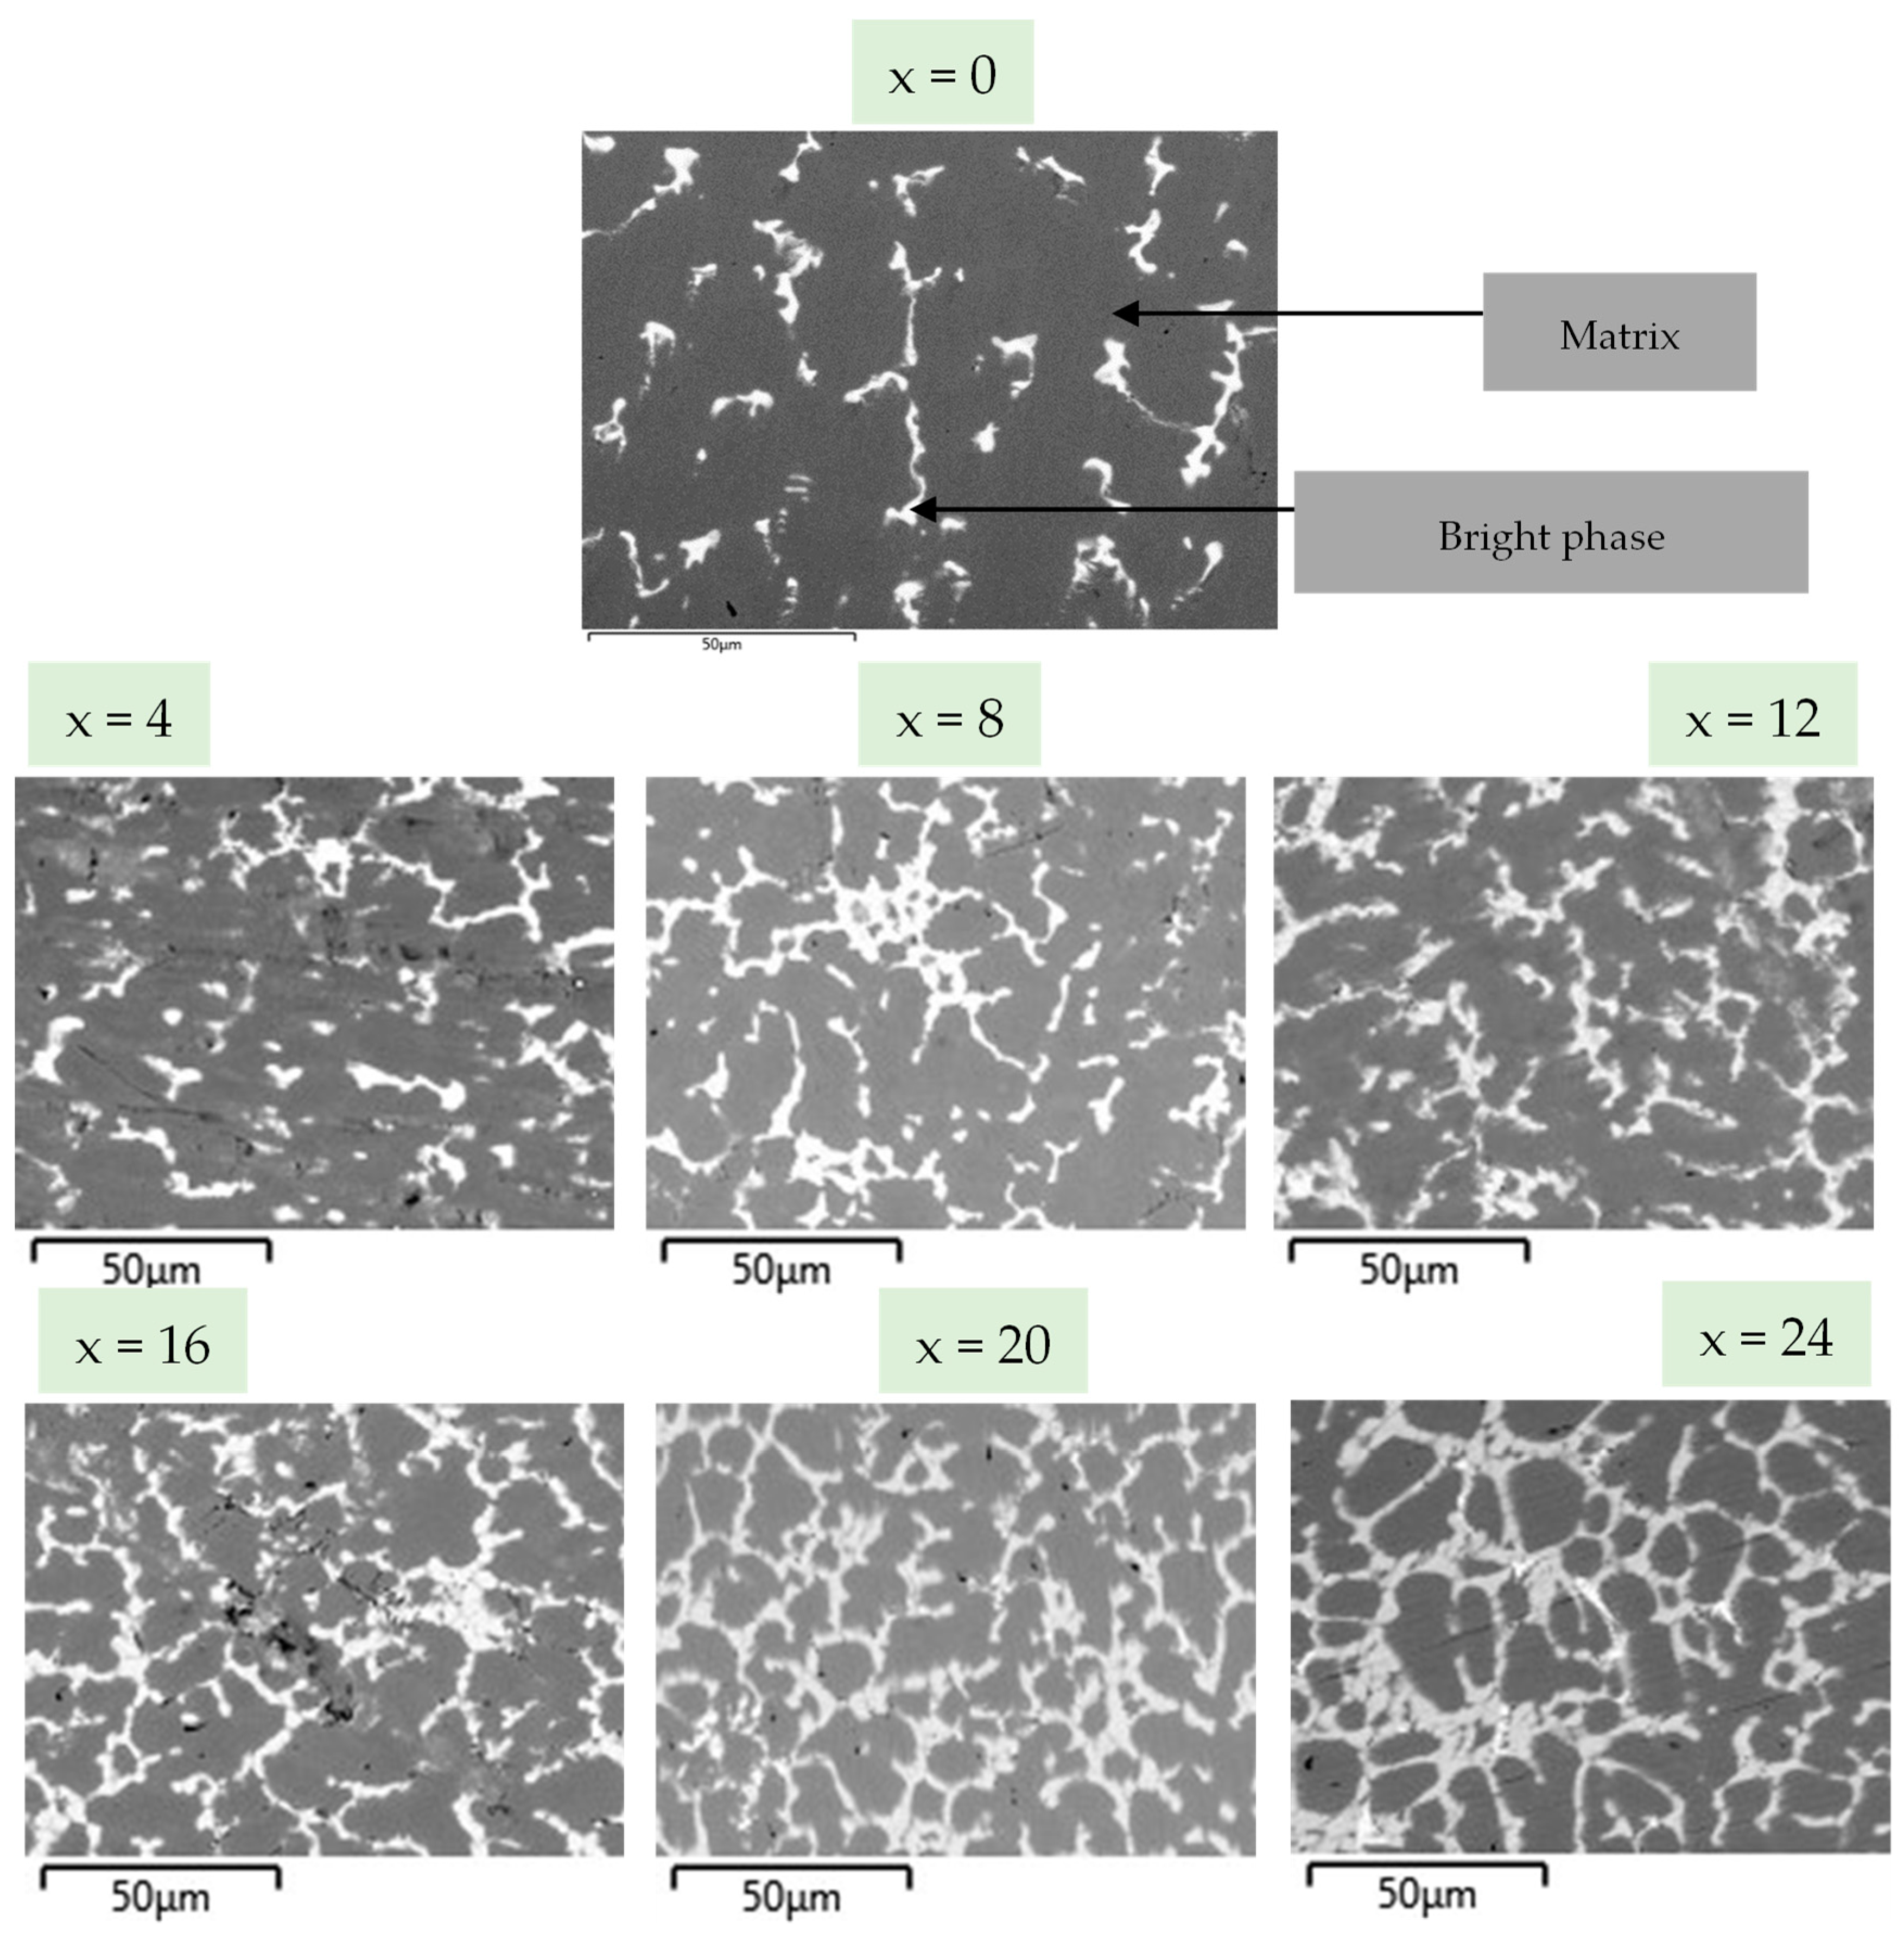
Figure 1. Backscattered electron micrographs of the Ti16V60Cr24−xFex + 4 wt.% Zr alloys for x = 0, 4, 8, 12, 16, 20, 24.
Energies 16 05360 g001
Figure 2. Elemental maps of the Ti16V60Cr24−xFex + 4 wt.% Zr alloys for x = 0, 4, 8, 12, 16, 20, 24. Points number 1 indicate the matrix, points 2 are the secondary phase 1, points 3 are the secondary phase 2 and points 4 are Ti precipitates.
Energies 16 05360 g002
Figure 3. XRD patterns of as-cast Ti16V60Cr24−xFex + 4 wt.% Zr alloys for x = 0, 4, 8, 12, 16, 20 and 24.
Energies 16 05360 g003
Figure 4. Variation of the lattice parameters of the BCC phase with Fe content for Ti16V60Cr24−xFex + 4 wt.% Zr alloys. The squares are the experimental lattices parameters as determined by X-ray diffraction.
Energies 16 05360 g004
Figure 5. First hydrogenation curves of Ti16V60CrxFe24−x alloys at 298 K under 3 MPa.
Energies 16 05360 g005
Figure 6. XRD patterns of Ti16V60Cr24−xFex alloys for x = 0, 4, 8, 12, 16, 20 and 24 after hydrogenation.
Energies 16 05360 g006
Table 1. Proportion of each phase in all alloys as measured by ImageJ software.
x04812162024
Matrix93878283816672
Secondary phase7131817193428
Table 2. EDX analysis showing the elemental composition of the matrix (Point 1) of Ti16V60Cr24−xFex + 4 wt.% Zr alloys for x = 0, 4, 8, 12, 16, 20, 24. The error on each value is ±0.1 at.%.
xTi (at.%)V (at.%)Cr (at.%)Fe (at.%)Zr (at.%)
014.262.422.9-0.5
415.960.219.34.10.5
815.260.216.17.90.6
1214.160.213.112.40.2
1613.561.78.316.20.3
2014.260.74.220.60.3
2410.470.4-190.2
Table 3. EDX analysis showing the elemental composition of the secondary phase 1 (Point 2) of Ti16V60Cr24−xFex + 4 wt.% Zr alloys for x = 0, 4, 8, 12, 16, 20, 24. The error on each value is ±0.1 at.%.
xTi (at.%)V (at.%)Cr (at.%)Fe (at.%)Zr (at.%)
033.85.11.8-59.3
432.920.17.11.838.1
832.517.05.110.435.0
1232.215.73.612.536.0
1632.311.51.88.446.0
2028.920.71.36.342.8
2431.313.4-1045.3
Table 4. EDX analysis showing the elemental composition of the secondary phase 2 (Point 3) of Ti16V60Cr24−xFex + 4 wt.% Zr alloys for x = 4, 8, 12, 16, 20, 24. The error on each value is ±0.1 at.%.
xTi (at.%)V (at.%)Cr (at.%)Fe (at.%)Zr (at.%)
419.228.716.515.420.2
823.727.910.420.517.5
1233.720.67.525.612.6
162829.34.128.210.4
2025.130.82.332.49.4
2426.131.5-33.88.6
Table 5. EDX analysis showing the elemental composition of Ti- precipitates (Point 4) of Ti16V60Cr24−xFex + 4 wt.% Zr alloys for x = 8, 16. The error on each value is ±0.1 at.%.
xTi (at.%)V (at.%)Cr (at.%)Fe (at.%)Zr (at.%)
86414.93.91.315.9
1663.414.81.84.415.6
Table 6. Phase abundance from Rietveld refinement. Error on the last significant digit is indicated in parentheses.
x04812162024
BCC10010010079 (2)77 (3)74 (2)72 (3)
C14---21 (4)23 (3)26 (2)28 (3)
Table 7. Crystallographic parameters of the BCC phase of all Ti16V60Cr24−xFex + 4 wt.% Zr alloys. Error on the last significant digit is indicated in parentheses.
BCCLattice Parameter (Å)Crystallite Size (nm)Microstrain (%)Cell Volume (Å3)
x = 03.0331 (4)36 (2)1.08 (2)27.90 (2)
x = 43.0207 (1)23 (1)0.98 (3)27.56 (1)
x = 83.0162 (1)21 (1)0.71 (3)27.43 (2)
x = 123.0105 (1)22 (1)0.60 (4)27.28 (2)
x = 163.0052 (1)33 (2)0.78 (3)27.14 (1)
x = 202.9943 (1)29 (1)0.66 (3)26.98 (2)
x = 242.9990 (2)30 (1)0.46 (2)26.97 (5)
Table 8. Crystallographic parameters of the C14 phase of as-cast Ti16V60Cr24−xFex alloys for x = 12, 16, 20 and 24. Error on the last significant digit is indicated in parentheses.
C14Lattice Parameter (Å)Crystallite Size (nm)Cell Volume (Å3)
x = 12a = 5.0280 (3)
c = 8.1850 (2)
22 (1)179.42 (4)
x = 16a = 4.9833 (2)
c = 8.1426 (2)
25 (2)175.10 (2)
x = 20a = 4.9629 (1)
c = 8.1033 (2)
46 (4)172.84 (2)
x = 24a = 4.9610 (1)
c = 8.0987 (2)
38 (2)172.62 (5)
Table 9. Crystallographic parameters of hydrogenated Ti16V60CrxFe24−x alloys for x = 0 to 24. Error on the last significant digit is indicated in parentheses.
SamplePhaseLattice Parameter (Å)Crystallite Size (nm)Microstrain (%)Cell Volume (Å3)Abundance (%)
x = 0BCTa = 3.0350 (1)
c = 4.2640 (2)
40 (1)1.0939.28 (3)100
x = 4BCTa = 3.0557 (1)
c = 3.2896 (2)
40 (1)1.0930.64 (3)80 (2)
C14a = 5.3355 (1)
c = 8.8310 (1)
11 (1)-217.72 (2)20 (1)
x = 8BCTa = 3.0068 (1)
c = 3.2896 (2)
17 (1)0.70 (1)30.08 (3)78 (1)
C14a = 5.3355 (1)
c = 8.8310 (1)
13 (1)-222.85 (3)22 (1)
x = 12BCTa = 2.9943(1)
c = 3.3338 (1)
15 (1)0.70 (1)29.89 (1)76 (1)
C14a = 5.4525 (2)
c = 8.4845 (1)
12 (1)-218.45 (2)24 (1)
x = 16BCTa = 2.8302 (1)
c = 3.9134 (2)
20 (1)1.07 (1)31.35 (2)58 (3)
C14a = 5.2568 (2)
c = 8.600 (4)
24 (1)-205.81 (2)24 (2)
C15a = 7.060 (2)16 (1)0.40 (2)352 (3)18 (2)
x = 20BCTa = 2.8279 (1)
c = 3.9014 (2)
28 (2)1.30 (2)31.20 (2)64 (3)
C14a = 5.1957 (2)
c = 8.497 (3)
30 (1)-198.65 (1)23 (2)
C15a = 7.159 (2)10 (2)-367 (2)13 (3)
x = 24BCTa = 2.8292 (1)
c = 3.8906 (2)
40 (4)1.39 (4)31.14 (2)53 (4)
C14a = 5.1957 (2)
c = 8.497 (3)
30 (1)-194.47 (5)37 (4)
C15a = 7.042 (2)20 (3)-349.2 (3)11 (2)
Disclaimer/Publisher’s Note: The statements, opinions and data contained in all publications are solely those of the individual author(s) and contributor(s) and not of MDPI and/or the editor(s). MDPI and/or the editor(s) disclaim responsibility for any injury to people or property resulting from any ideas, methods, instructions or products referred to in the content.