Article

Evaluation of the Solar Energy Nowcasting System (SENSE) during a 12-Months Intensive Measurement Campaign in Athens, Greece

by
Ioannis-Panagiotis Raptis
1,*,
Stelios Kazadzis
2,
Ilias Fountoulakis
3,4,
Kyriakoula Papachristopoulou
1,4,
Dimitra Kouklaki
1,
Basil E. Psiloglou
5,
Andreas Kazantzidis
6,
Charilaos Benetatos
1,
Nikolaos Papadimitriou
6 and
Kostas Eleftheratos
1,7
1
Department of Geology and Geoenvironment, National and Kapodistrian University of Athens, GR-15784 Athens, Greece
2
Physics and Meteorology Observatory of Davos, World Radiation Center (PMOD/WRC), CH-7260 Davos, Switzerland
3
Research Centre for Atmospheric Physics and Climatology, Academy of Athens, GR-11527 Athens, Greece
4
Institute for Astronomy, Astrophysics, Space Applications and Remote Sensing, National Observatory of Athens, GR-15236 Athens, Greece
5
Institute for Environmental Research & Sustainable Development, National Observatory of Athens, GR-15236 Athens, Greece
6
Physics Department, University of Patras, GR-26500 Patras, Greece
7
Biomedical Research Foundation, Academy of Athens, GR-11527 Athens, Greece
*
Author to whom correspondence should be addressed.
Energies 2023, 16(14), 5361; https://doi.org/10.3390/en16145361
Submission received: 21 June 2023 / Revised: 7 July 2023 / Accepted: 10 July 2023 / Published: 14 July 2023
(This article belongs to the Special Issue Review and Applications of Photovoltaic Power Forecasting)

Abstract

:
Energy nowcasting is a valuable asset in managing energy loads and having real-time information on solar irradiation availability. In this study, we evaluate the spectrally integrated outputs of the SENSE system for solar irradiance nowcasting for the period of the ASPIRE (atmospheric parameters affecting spectral solar irradiance and solar energy) campaign (December 2020–December 2021) held in Athens, Greece. For the needs of the campaign, several ground-based instruments were operating, including two pyranometers, a pyrheliometer, a cloud camera, a CIMEL sunphotometer, and a precision spectral radiometer (PSR). Global horizontal irradiance (GHI) estimations were more accurate than direct normal irradiance (DNI). SENSE estimations are provided every 15 min, but when comparing bigger time intervals (hours-days), the statistics improved. A dedicated assessment of the SENSE’s inputs is performed in respect to ground-based retrievals, considering cloud conditions (from a sky imager), AOD, and precipitable water vapor from AERONET. The factor that established the larger errors was the visibility of the solar disc, which cannot be defined by the available sources of model inputs. Additionally, there were discrepancies between the satellite estimation of the clouds and the ground picture, which caused deviations in results. AOD differences affected more the DNI.

1. Introduction

Energy needs of societies are steadily increasing, while an urgent need of transition from fossil fuels to renewable energy sources is ascertained in several studies and reports [1,2,3]. Affordable and clean energy is the 7th sustainable development goal of the United Nations Environment Programme by 2030. Solar energy offers a clean, abundant, and renewable energy source, capable of meeting a significant portion of the global energy demand. Moreover, the cost of solar energy has been significantly reduced over the years, making it an increasingly cost-effective option [4]. The integration of solar energy into the energy mix can lead to reduced reliance on fossil fuels, which can have significant environmental and economic benefits. Solar energy is one of the most safe and sustainable energy sources, and its use is expected to rise significantly over the next decades [5,6]. Energy demand in electricity networks has very specific patterns, showing a maximum in early morning hours and a secondary peak in evening hours during winter [7,8,9]. Solar energy on a cloudless day is maximized around local solar noon. In this context, solar energy forecasting and nowcasting are crucial parts for the administration of networks and routing of energy sources according to demand, and for planning for potential fluctuations in energy supply [10]. Additionally, as many countries trade energy-related assets in foreign exchange markets, the nowcasting/forecasting of solar energy becomes a valuable tool [11,12,13]. Therefore, solar energy nowcasting is a valuable asset which optimizes the deployment and operation of solar power plants, leading to increased energy efficiency and cost savings [14]. In addition, hourly solar energy estimation plays a critical role in ensuring a reliable and efficient grid operation [15].
Nowcasting models provide solar irradiance estimations in real or near real time, which is a key parameter in determining the energy output of photovoltaic systems. A variety of nowcasting models have been developed based on various data sources, including numerical weather prediction models, ground-based measurements, and satellite data [16]. Among these, satellite-based nowcasting algorithms have been shown to provide high accuracy and reliability due to their ability to provide continuous and global coverage [17]. Additionally, advancements in satellite technology have led to the development of new sensors and data processing techniques that can further improve the accuracy of solar energy nowcasting models [18,19]. Exploiting big data from earth observation (EO) techniques, mak it possible to produce solar nowcasts with numerous applications in different fields such as solar energy and health at high spatial and temporal resolutions [20,21].
The use of ground-based measurements is necessary for model validation, as they provide reliable and accurate data against which the model output can be compared. In particular, baseline surface radiation network (BSRN) stations have been widely used as reference stations for model validation due to their high-quality measurements and well-characterized data sets [20,22]. The spatial and temporal resolution of the models can also affect the output accuracy, with higher resolutions generally leading to better predictions [23]. Finally, the representativeness of the validation stations is also critical, as the accuracy of the models can vary depending on the location and their proximity to the solar plants [24].
The surface Solar Energy Nowcasting SystEm (SENSE) was developed as part of the Geo-Cradle project funded by the EU. The project was a collaborative effort between the Beyond Centre of EO Research and Satellite Remote Sensing at the National Observatory of Athens, Greece, and the Physics and Meteorological Observatory Davos World Radiation Center in Switzerland, and it has been operational since 2017 [20]. This system combines geophysical input parameters from satellite-based and model data sources and a radiative transfer model (RTM) to simulate the propagation of irradiance in the in the atmosphere. The inputs include the cloud optical thickness (COT) product in real time from the MSG satellite and aerosol optical depth (AOD) forecasts from the Copernicus Atmospheric Monitoring Service (CAMS) and enable real-time estimation of solar radiation. In order to provide nowcasting in reasonable time intervals, the system is optimized using precalculated surface solar radiation simulations, specifically using a look-up table (LUT) which is generated through radiative transfer modeling. Recently, modifications were introduced to the previews version of SENSE, resulting in a more improved system [25]. Specifically, the new upgraded version has the following changes in the model configuration, resulting in a fully physical model: (i) the use of a more detailed LUT to calculate clear sky GHI and DNI from the previous day using CAMS AOD forecasts and (ii) the use of multi-parametric equations (instead of neural network) to obtain the effect of clouds in real time from COT.
In this study, the updated model SENSE [25] is evaluated, using ground-based measurements, collected during the one year long ASPIRE campaign. Timeseries from cloud imager and sun-photometer are exploited to assess the differences between model and measurements. Finally, measurements from different instruments are used to evaluate the spectral performance of SENSE Datasets are presented in Section 2. In Section 3, we discuss the differences between SENSE and irradiance measurements at the ground, and we separate the cloudless conditions to assess the accuracy of clear sky conditions. Then, the model–measurement differences are discussed in respect to atmospheric conditions (aerosols, clouds, water vapor).

2. Data and Tools

2.1. SENSE

SENSE is an operational system that provides nowcasting of global horizontal irradiation (GHI) and direct normal irradiation (DNI) at 15-min intervals, for Europe, the Middle East, and North Africa, at high spatial resolution ~5 km [25]. SENSE is based on the equation of radiative transfer and the basics of the atmospheric physics and benefits from some speedup techniques in order to provide real time outputs. The system is based on RTM calculations, which are stored in the form of lookup tables (LUTs). These LUTs are used to estimate the clear sky GHI and DNI in advance (previous day), considering seven different inputs (7D LUTs with ~16 M combinations) and using linear interpolation in the seven dimensions of LUTs. Those seven different inputs (Table 1) are the sun’s position, the aerosol optical depth (AOD) forecasts and climatological values for aerosol optical properties, and atmospheric variables (surface albedo was set to 0.2). AOD forecast is retrieved from Copernicus Atmospheric Service (CAMS), which provides AOD at 550 nm at 1 h intervals. For the aerosol optical properties of Angstrom Exponent and SSA, climatological values for the city of Athens were utilized, derived from a 10-year AERONET climatology (Raptis et al., 2020) [26]. For PWV, values from the same climatology were utilized, while for the total ozone column, daily forecast from Tropospheric Emission Monitoring Internet Service (www.temis.nl, accessed on 10 June 2023) were used.
The clear sky GHI and DNI precalculated from the previous day are converted to all-skies values using the cloud information which is retrieved in real time by EUMETSAT’s Satellite Application Facilities of Nowcasting and Very Short Range Forecasting, NWC SAF software package using input from Spinning Enhanced Visible and InfraRed Imager (SEVIRI) instrument onboard Meteosat Second Generation (MSG) satellites every 15 min. Cloud optical thickness (COT) is extracted from this dataset and converted to cloud modification factor (CMF) using parametric equations, specific fo GHI and DNI [25]. The CMF is the ratio between the irradiances for all-sky (i.e., including the effect of clouds) and clear-sky (cloud-free) conditions, which is then applied to clear sky estimations to generate the final output of irradiance under any atmospheric condition. The LUTs used in SENSE include the full spectrum (i.e., 280–4000 nm), which allows to estimate radiometric quantities to narrower spectral regions. For the time-period of the ASPIRE campaign, and for the grid point that corresponds to the ASNOA station, the variables/spectral regions described in Table 2 were also produced from SENSE.

2.2. Ground Based Data

An intensive campaign was held in Athens, under the framework of the project ASPIRE, collecting atmospheric and solar radiation data from different instruments for a year. The site of focus during the campaign was the Actinometric Station of the National Observatory of Athens (ASNOA). ASNOA is located in the center of Athens, as illustrated in Figure 1 (38.00° N, 23.73° E, 110 m above mean sea level) and is locally surrounded by a green area having no collocated emission sources; however, it is still representative for the metropolitan Athens’ area [26]. The full list of instruments operating during the campaign can be found at the campaign’s website (https://aspire.geol.uoa.gr/instruments/, accessed on 10 June 2023). Data from these instruments are used to evaluate the performance of SENSE. More specifically, the ones used in the current study are presented below:

2.2.1. Solar Radiation Measurements

A precision solar spectroradiometer (PSR 007) has been installed at the ASNOA since November 2020. The PSR is a high-precision, state of the art spectroradiometer that is able to measure global and direct spectral solar irradiances in the range 300–1020 nm (at 1024 channels with a variant full width half maximum in the range of 2–5 nm). Measurements are performed using one spectrometer with two separate inputs for the direct and global irradiances. The sampling time can be adjusted according to the needs of the measurement. The uncertainty of measurements has been estimated to be less than 1% at visible wavelengths, less than 1.7% at the UVA, and more than 2% in UVB. More details for the technical characteristics of the PSR can be found in [27]. The PSR has been used for solar measurements but also for retrievals of atmospheric parameters such as columnar water vapor [28] and AOD [29].
Three on-site calibrations of the PSR, were performed during the ASPIRE campaign (20/4, 7/7, and 3/11, 2021) using a 200W Quartz Halogen lamp that is traceable to Physikalisch-Technische Bundesanstalt (PTB). Differences in the absolute response were below 0.3% for the 300–1020 nm integral and below 2% for individual channels at wavelengths longer than 400 nm. At wavelengths shorter than 400 nm, differences were larger due to the higher noise-to-signal ratio. The operating schedule of the instrument was set to altering cycles of global and direct irradiance measurements. The integration times for the recordings were changing depending on solar elevation (i.e., on solar irradiance levels). The signal of the direct sun measurements can change by a few orders of magnitude with respect to wavelength. Thus, two consecutive direct sun scans were performed each time, using different integration (i.e., sampling) times in order to ensure high accuracy at shorter wavelengths (longer integration times) and avoid saturation of the sensor at longer wavelengths (shorter integration times). In this study, we have used the spectrally integrated values for both variables as GHI_psr (for global horizontal irradiance) and DNI_psr (for direct normal irradiance) as well as the integral in the visible spectral region only (400–700 nm, GHI_vis).
Several broadband radiometers are operating at ASNOA. For this study, we used global horizontal irradiance in the range 285–2800 nm (hereinafter referred as GHI_tot) measured by an Eppley Precision Spectral Pyranometer (PSP). After performing dark-signal correction, measurement accuracy of this instrument is up to 2% [30]. A model-based correction for the angular response of the instrument was also applied [31]. Additionally, a CHP1 pyrheliometer, mounted on a SOLYS2 two-axis sun tracker with a pointing accuracy of less than 0.1 degrees, both developed by Kipp and Zonen, was operating during the campaign providing measurements of the integral of the direct normal irradiance at the spectral region of 200–4000 nm (DNI_tot). The solar pointing of the tracker and the leveling for all the instruments were checked daily.

2.2.2. Sky Images—Cloud Related Measurements

The Q24M Mobotix (MOBOTIX) All-Sky Imager (ASI) was installed at ASNOA for observing the cloud conditions in the areas during ASPIRE campaign, having a temporal resolution of 10 s. Such type of ASIs can be employed for performing cloud detection and characterization [32,33,34,35]. Cloud fraction and sun occlusion were derived on a 1 min frequency using appropriate software for processing the sky images.

2.2.3. Total Column Spectral Aerosol Optical Properties and Water Vapor

A CE318 CIMEL sun photometer with serial number 440 (CIMEL#440) was operating at the station during the campaign, as part of the ATHENS-NOA Aerosol Robotic Network (AERONET) [36] station. AOD at seven wavelengths was retrieved, at different solar zenith angles (SZA), alongside with total column precipitable water vapor (PWV). Level 2.0 data from Version 3 algorithm are used in this work, which provide the highest data quality [37].

2.3. Comparison Statistics

Various performance metrics are used to evaluate the accuracy of the nowcasting models like the mean bias error (MBE), root mean square error (RMSE), mean relative error (MRE), and R-squared (R2). For the present study, these metrics are used in respect to observed values, from the measurements, considered as the “reality”, in order to assess the model’s outputs.
MBE is calculated as:
MBE = 1 N 1 N (   x m o d , i x o b s , i )
where N is the number of data points, xobs,i is the ground-based measurement of variable x, and correspondingly, xmod,i is the modeled value of the same variable.
The MBE is a metric of the difference between the predicted and observed values, providing a measure of systematic errors in the model output. A positive MBE indicates an overprediction, while a negative MBE indicates an underprediction.
The RMSE is a metric of the magnitude of the errors, providing a measure of the overall accuracy of the forecast. It has been calculated as:
RMSE = 1 N 1 N (   x m o d , i x o b s , i ) 2
RMSE considers both the systematic and random errors in the forecast and is sensitive to outliers.
The MRE is a percentage measure that calculates the difference between the predicted and observed values divided by the observed value, providing a measure of the relative error in the prediction. MRE is calculated as:
MRE = 1 N 1 N (   x m o d , i x o b s , i ) < x o b s , i > 100 %
It is useful for comparing the accuracy of models on datasets like the solar irradiance, which changes a lot according to solar zenith angle (SZA) and spreads in a very wide range of values.
R2 is a metric of the goodness of fit of the model to the observed data. It is calculated as:
R 2 = 1 1 N (   x m o d , i x o b s , i ) 1 N (   x o b s , i < x o b s , i > )
where the <xobs,i> is the average value of the observation.
It ranges from 0 to 1, with a value of 1 indicating a perfect fit between the model and the observed data. R2 is used to determine the proportion of the variation of the data following the model fluctuation, which is higher the closest to 1.

3. Results

For having comparable data, all datasets were synchronized at the time steps of SENSE (every 15 min). For GHI from the pyranometer and cloud coverage from the sky camera, where measurements at one minute frequency are available, averages of ±3 min around SESNE timestamps were used. For PSR measurements, the nearest to SENSE time, is used, only if the distance is less than 5 min. If the sun was fully or partially occluded by clouds, then PSR measurements were used only when they were available for the exact minute of the SENSE outputs. Finally, for the less frequent AERONET data, aerosol parameters were interpolated, based on availability criteria; at least one level 1.5 data point in a ±30 min range.

3.1. Comparison Overview

An overview of the study results is first presented at the daily level. For this purpose, daily integrals of solar irradiance were used, as they represent the total energy available over a day. Due to solar irradiance diurnal cycle, if there are gaps in the timeseries, this variable would not be comparable among models and measurements. Thus, we used only days with less than five missing measured values of 15-min solar irradiance. Gaps were filled by linearly interpolating the two closest neighbors, before daily integration. Scatterplots of daily datasets are presented in Figure 2, and their statistics are shown in Table 2.
Comparison of daily global horizontal irradiation between the model and pyranometer measurements showed a very good agreement with an R2 value of 0.99 and a MRE of 0.3%. Very few differences were higher than 5% (only seven cases in the whole one-year dataset), indicating that the SENSE model is highly reliable at the daily level. These results are consistent with previous studies that have evaluated solar irradiance forecasting models using ground-based measurements [20].
As expected, when comparing the SENSE model with ground-based measurements of DNI, the agreement was relatively worse, with an R2 value of 0.95 and a MRE of 1.5%. Results showed an underestimation of modelled DNI for some cases due to the underestimation of cloudiness from the satellite product or due to spatial differences among the station measurement and the pixel-based SENSE retrieval. Overall, the results suggest that the SENSE model potential for use in solar energy forecasting applications, is very high, with reliable estimations of solar irradiance at the daily level.

3.2. Investigation of SENSE Accuracy and Limitations

3.2.1. Comparison between Synchronous SENSE and Measurement Data

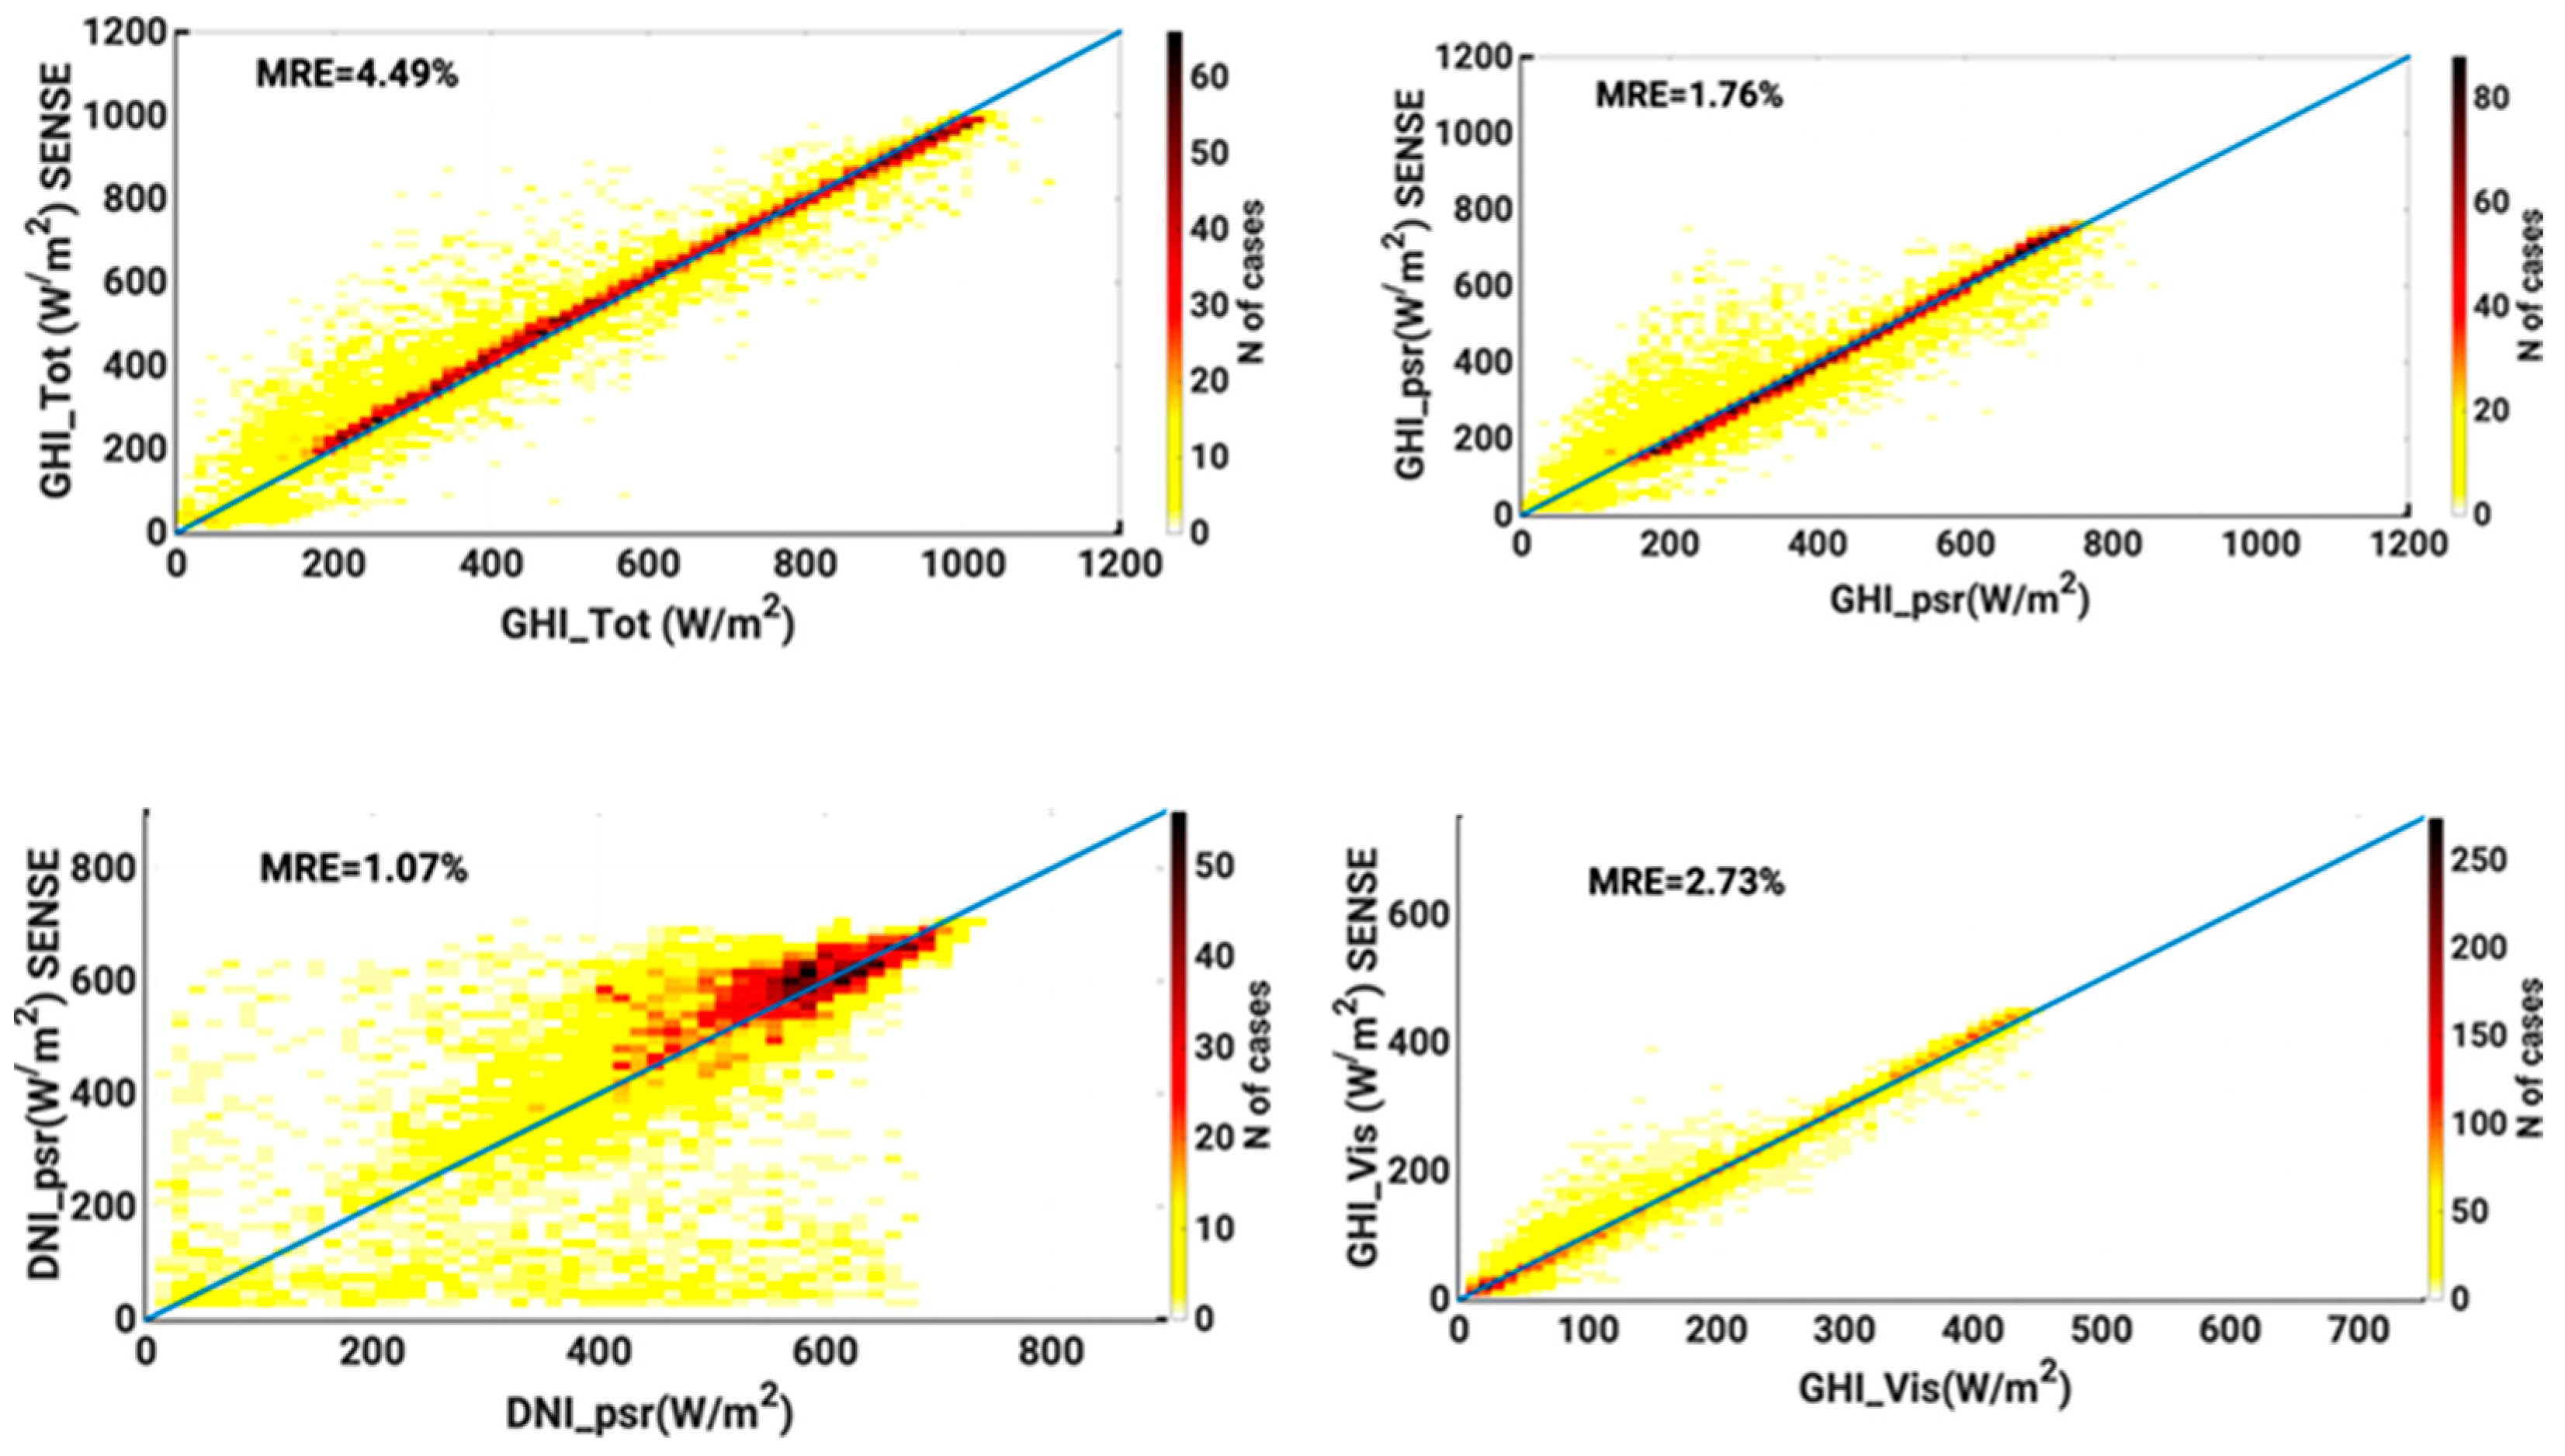
In Figure 3, we present the point by point (15-min intervals) comparison of SENSE outputs with ground-based measurements. We have selected to present them in form of density scatterplots because of the large populations of each pair (13.3–20.1 K of points range). All plots show a large proportion of data that are on very good agreement. In general, the agreement is better for GHI compared to the DNI component. The cause of this performance is that the DNI is more sensitive to AOD and clouds changes. Cases of high overestimation or underestimation of SENSE are visible when the actual cloud conditions are very different than the model input.
Corresponding statistics for these comparisons are shown in Table 3. In general, the best comparison statistics (for 15-min, hourly and daily quantities) have been derived for the GHI_vis, in terms of RMSE. The agreement between the model and the measurements is also good for GHI_psr and GHI_tot; however, the metrics become generally worse with the inclusion of longer wavelengths in the integrated quantity (i.e., worse for GHI_tot relative to GHI_psr). The comparison also gives better results for DNI_psr relative to DNI_tot. We can assume that parameterizations in SENSE gives better results for the visible (VIS) region relative to the solar (near) infrared (NIR). Thus, when comparing quantities that include longer wavelengths, the results become worse. Factors affecting these behaviors should be investigated in the direction of aerosols (where the 550 nm wavelength is used), of Water vapor (where climatological values are used), and less to clouds (which are almost spectrally flat). Furthermore, at shorter wavelengths, Rayleigh scattering by air molecules is stronger and thus, through multiple scattering, more photons reach the Earth surface after having interacted with clouds (i.e., clouds have a weaker impact), which, however, affects the GHI and not the DNI.
As the integration period increases (from 15-min values to daily integrals), the statistics of the results are impressively improved. For example, the R2 for the daily integrals exceeds 0.9 for all variables, even for DNI_tot which is 0.66 for the 15-min values. Our findings show that SENSE can simulate hourly and daily solar energy integrals with high accuracy. Nowcasting accuracy is, however, lower for the 15-min values. As discussed analytically in the following sections, this is mainly because the clouds’ effect on radiation estimated from MSG-SEVIRI cloud product represents the average impact of clouds in the ~5 × 5 km area viewed by the satellite sensor, which, especially under broken cloud conditions, is not representative for the instantaneous effect of cloudiness on the solar radiation that reaches the measurement site.
It should be highlighted that different applications would require specific accuracy at a desired time scale. For example, for applications like Virtual Net Metering of PV or even energy markets with daily prices, the accuracy achieved at the current version of SENSE is completely satisfactory. For energy markets with 3 h or 1 h ahead prices, the statistics are not as good, but it is still a useful tool. Larger differences, when point to point comparisons are made, could affect only specific users of the outputs, such as network operators that need to balance the power in real time. In the following sections, we focus on the point-to-point differences and the understanding of the physical processes that lead to these differences. Although, most users of the nowcasting model will not need this level of accuracy, it is the route to detect all the causes of discrepancies at the most detailed level, in order to plan enhanced future upgrades.

3.2.2. Assessment of Differences

a.
Overall differences
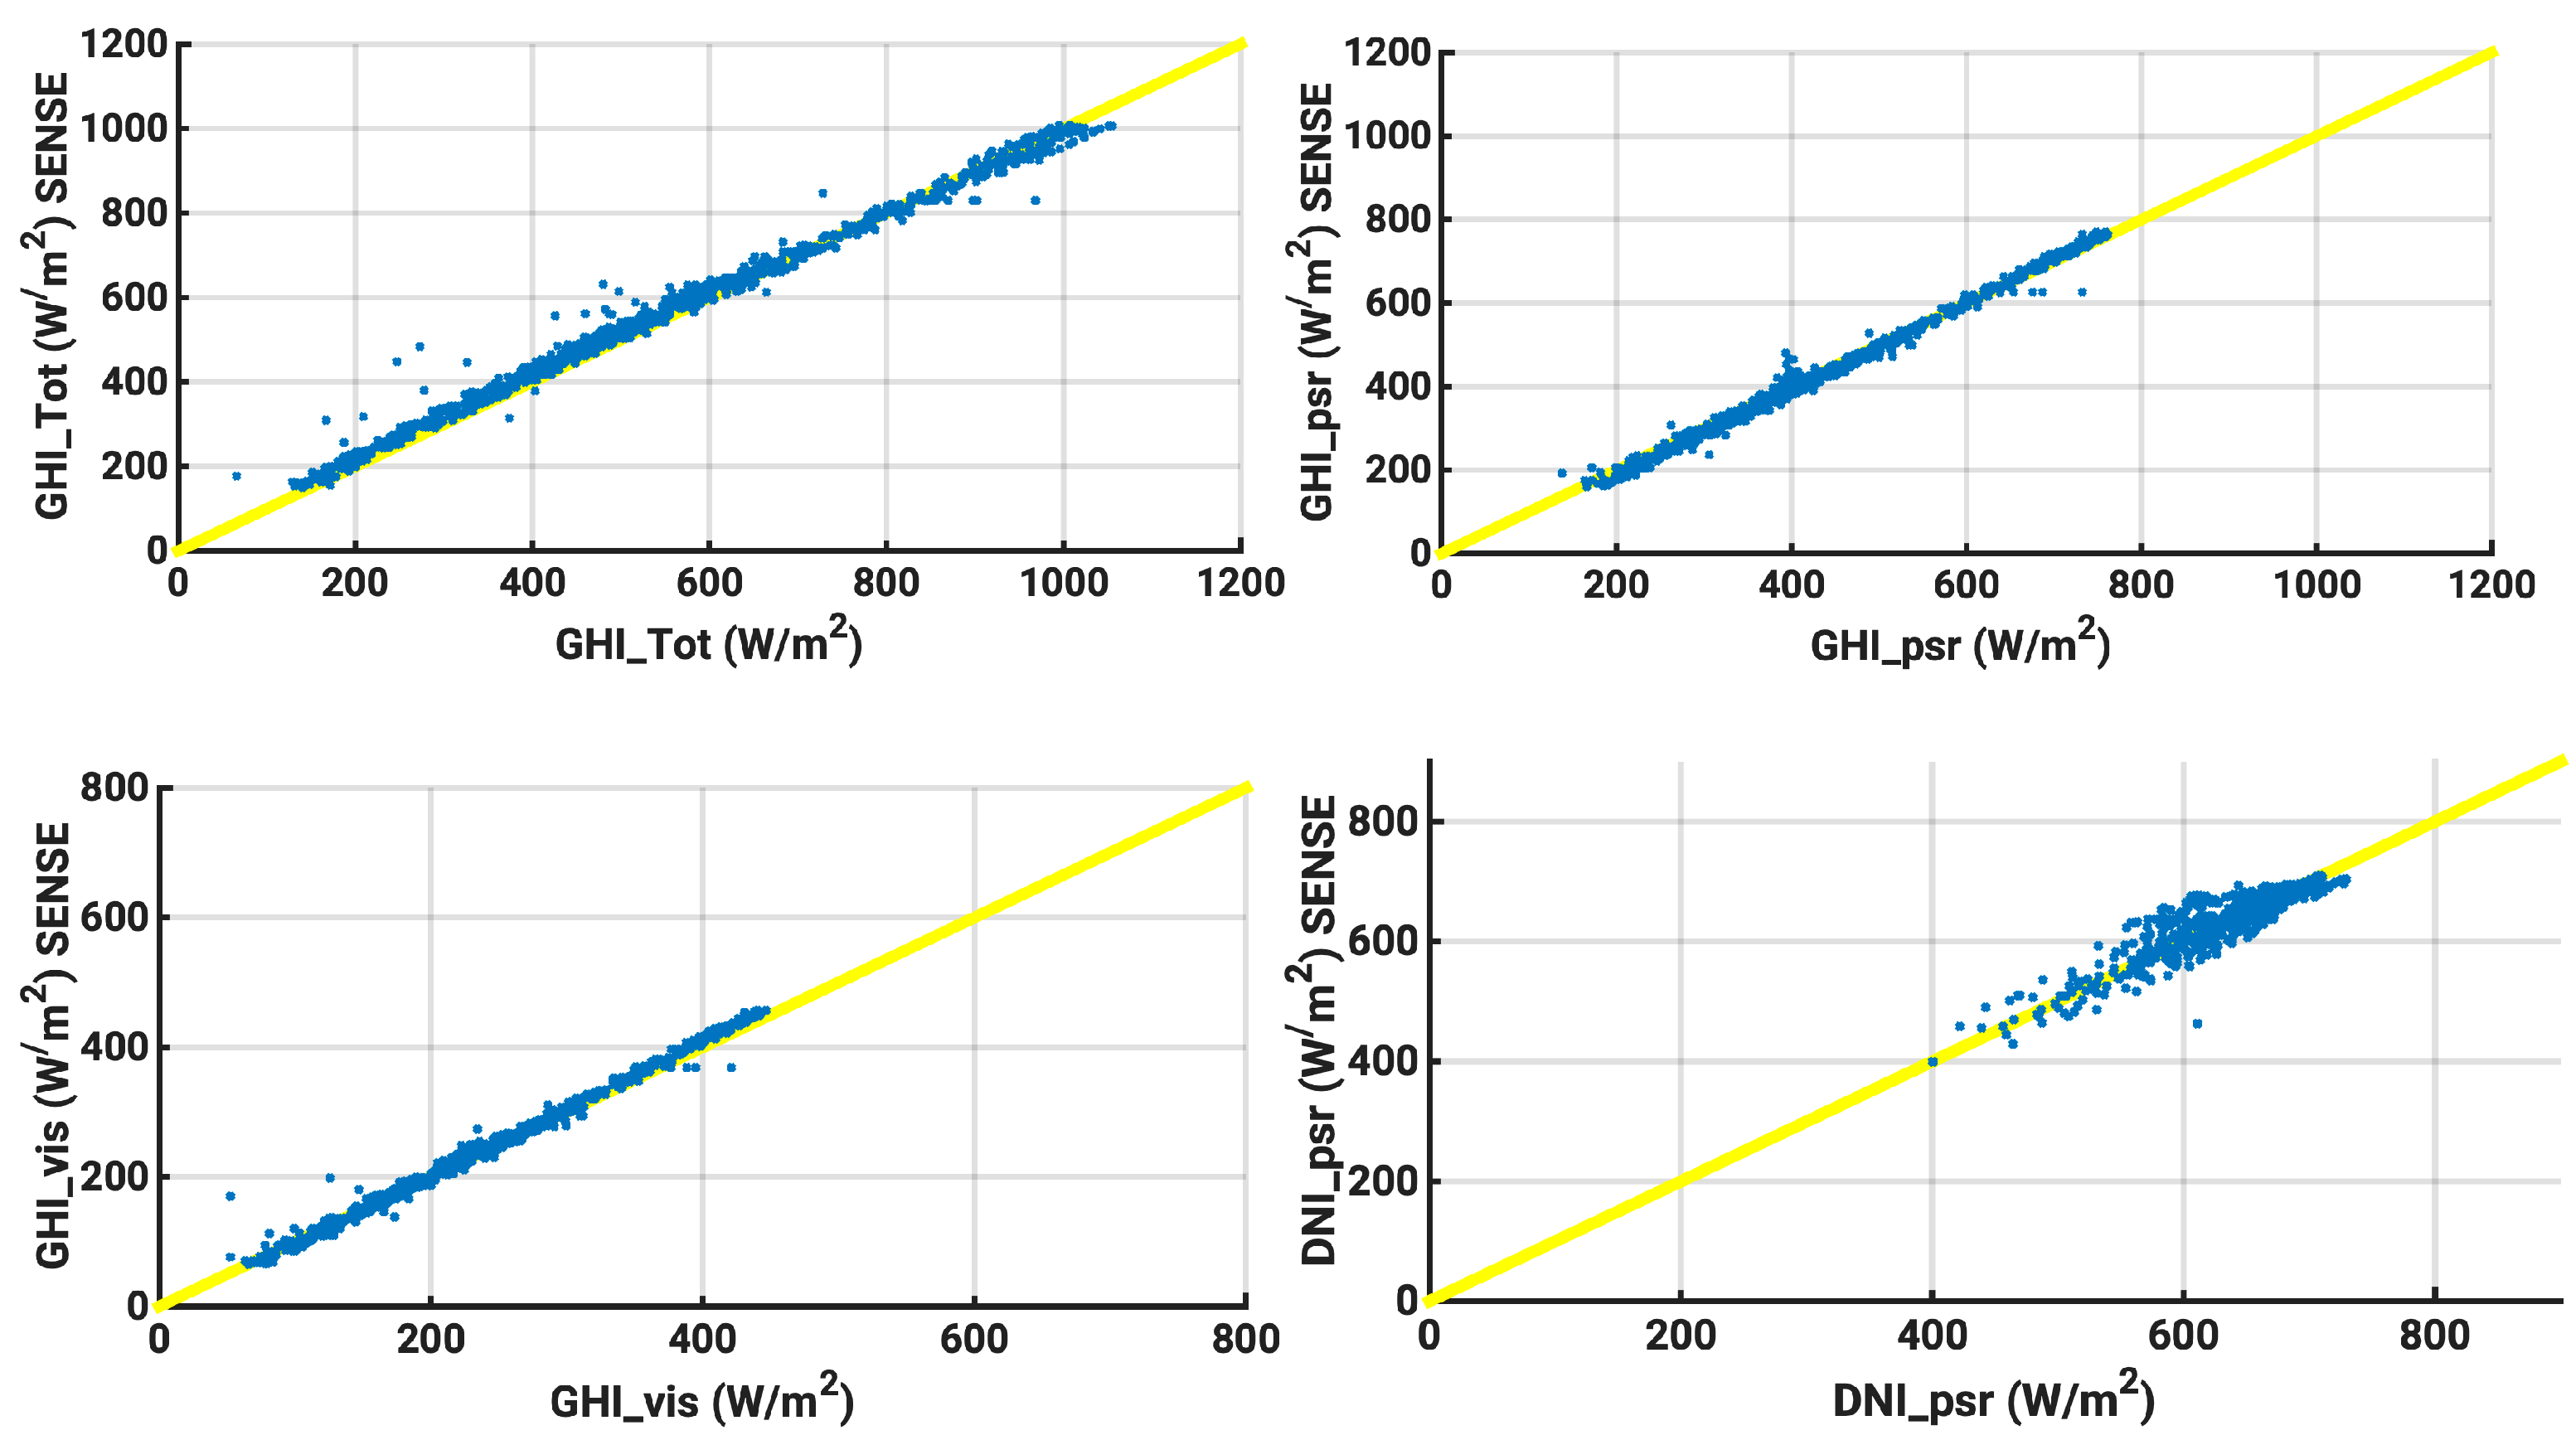
In order to assess the accuracy of the SENSE solar irradiance outputs, comparisons were made between the model estimations and ground-based measurements under specific conditions. In particular, we only compared data at timesteps when all sources agreed that the sky was clear, (with cloud coverage less than 13% according to sky imager, satellite COT less than 0.2, un-occluded sun disc, and AOD less than 0.1). Comparisons under such conditions can reveal systematic errors and discrepancies that are not due to atmospheric conditions. These comparisons are visualized in Figure 4.
The comparison for GHI showed very good agreement between the model outputs and ground-based measurements, with an R2 value of 0.99 for all variables. The differences were up to 2.1% for the pyranometer and even lower for the PSR. The highest agreement was observed for GHI at the visible range. Higher agreement is difficult to achieve, as it is in the order of instruments uncertainties. The biases recorded at clear conditions should be considered systematic, either as calibration differences or from other sources.
Differences between the SENSE outputs and ground-based measurements for DNI were higher than GHI, with an R2 value around 0.9. The PSR showed smaller biases compared to the pyrheliometer (Table 4). However, these comparisons are more difficult due to the fast-changing sun saturation and the imprecision of cloud input from satellite data to the model.
b.
aerosol effect
In order to make a valid comparison for AOD, we used the AOD at 500 nm and the 440–870 nm Ångstrom Exponent from AERONET, and calculated the AOD at 550 nm, i.e., the wavelength at which the forecasted AOD from CAMS that is used in SENSE is provided.
Since AERONET timeseries are not continuous, a consistent approach should be considered to compare results. The approach followed in this study was to create an AΕRONET AOD timeseries that is synchronous with the SENSE outputs (every 15 min), by interpolating/extrapolating the level 2.0 AERONET data, with an upper limit of three hours. This approach results in a database with gaps only when there are no real measurements for more than 3 h. The 3 h range has been selected based on the analysis of the short term variability of AOD, which is typically less than 10% in most cases [38,39], although in some cases it becomes more rapid due to meteorological conditions (changes in wind direction/speed, or precipitation) [40,41] or due to local emissions [42].
The comparison of AOD between the CAMS and AERONET is important for assessing the accuracy of SENSE inputs and outputs for cloudless moments. Figure 5 shows a good agreement between CAMS and AERONET AOD at 550 nm, with an MBE of 0.01 (so similar with AERONET AOD uncertainty) and a standard deviation (σ) of 0.09. A small percentage of cases show high differences between the two datasets, where CAMS underestimates by more than 0.2 in 0.9% of cases and overestimates by more than 0.2 in 1.6% of cases. These differences can be attributed to systematic errors in the CAMS model, as well as the uncertainties introduced by the temporal interpolation of AERONET AOD. Also, the 1-h time step of CAMS does not allow the capture of sudden changes in local emissions, which can affect AOD levels in the short term and usually cannot be forecasted. CAMS has shown to be reliable for AOD forecasting on a daily basis, with a mean absolute error of 0.009 and a RMSE of 0.144 for AOD at 550 nm [43].
In Figure 6, we present irradiance relative differences in respect to AOD differences. Only cases with no cloud presence as estimated by cloud camera (cloud coverage less than 0.13 and sun is visible) and the AERONET cloud flagging algorithm. For GHI the influence of AOD is low, which explains around a 5% difference for 0.1 change of AOD difference. While for DNI, the corresponding differences are 19% for 0.1 change of AOD. As shown in Figure 6, there is a spread of data points outside these ranges, which is explained either by the underestimation of cloud conditions by the sky imager or less by influence of other aerosol related variables. For DNI, there is a clear decreasing DNI difference with increasing AOD differences, as expected.
It should also be highlighted that for cases of extreme or unpredictable aerosol events, the AOD differences might be a lot higher, thus their propagation to estimated irradiance could be much more significant. During the ASPIRE campaign, there were some days with extreme wildfires in Greece, that were studied by Masoom et al. [44], when the decrease of GHI due to smoke was in the range of 10–20%. Another study [45] found that during in a very intense and rare dust event over Athens, the GHI decrease was 40–50% and DNI 80–90%. Hence, the extreme cases are the ones with the major effect of aerosol on the solar irradiance nowcasting.
c.
water vapor effect
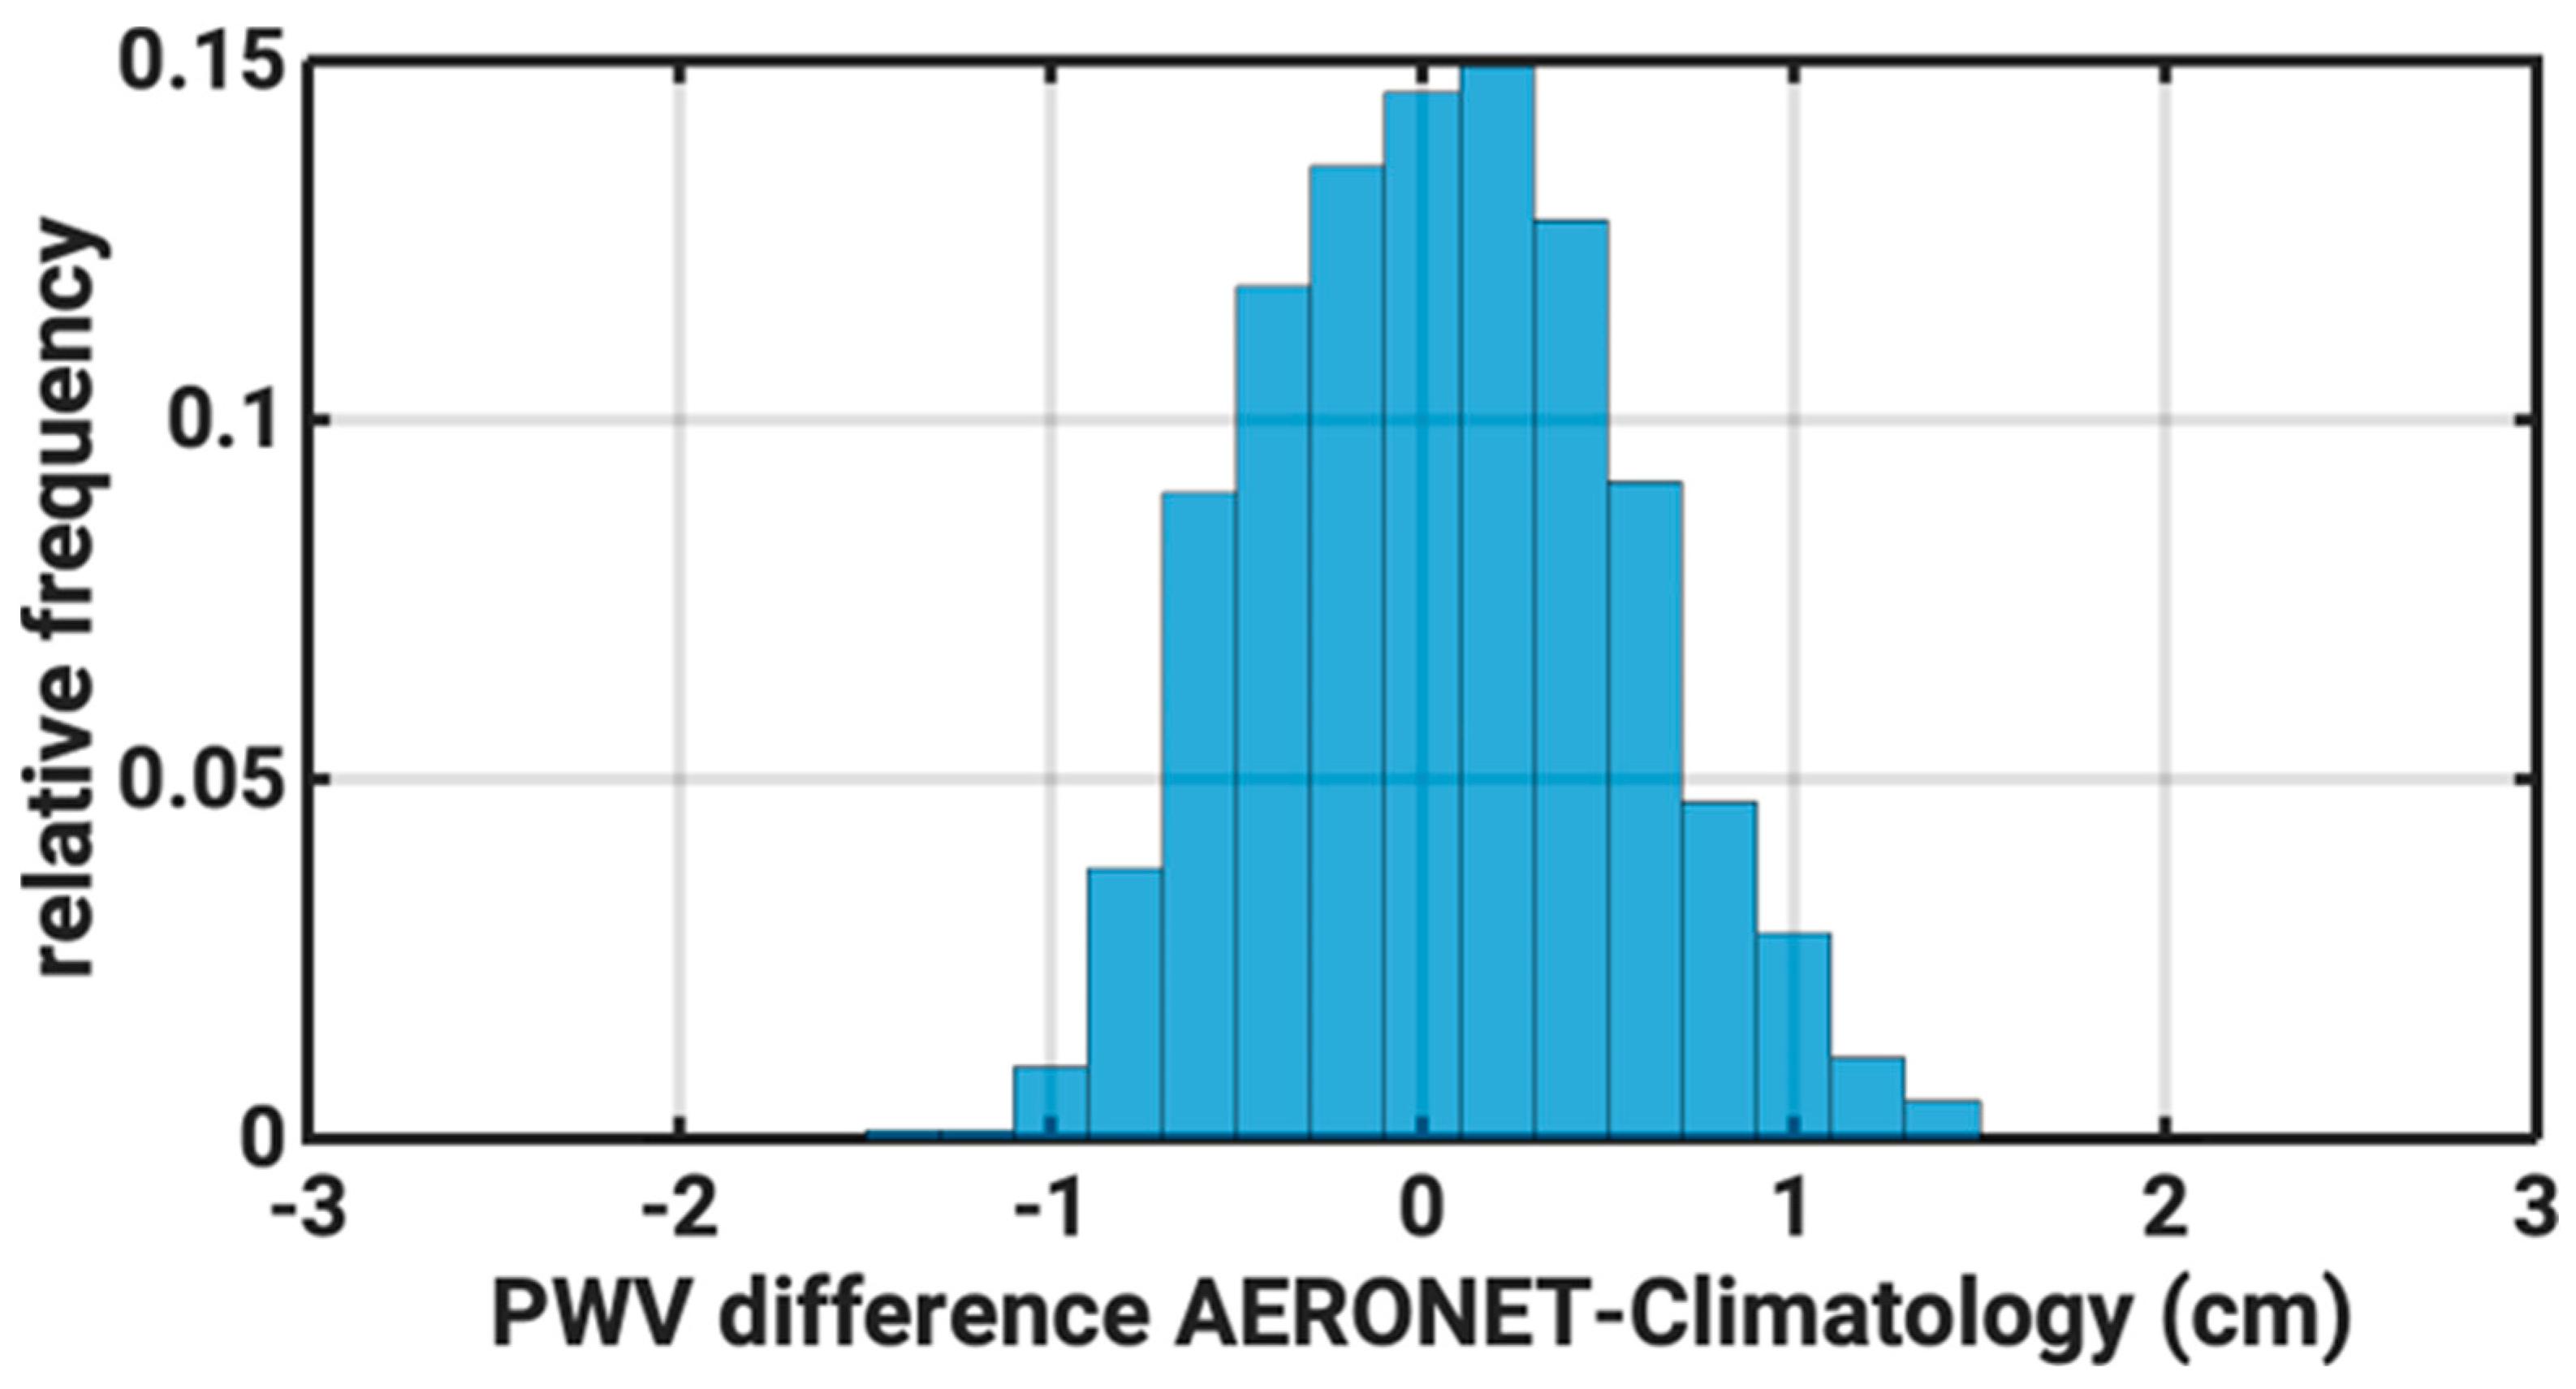
SENSE output was based on the PWV input provided by the AERONET monthly climatology of Athens [26]. Ιn the histogram in Figure 7, we show the absolute difference between the climatological PWV used in the model and the measured from AERONET level 2.0 dataset. In general, the differences between the datasets are low in most cases, but there are 21% of cases with absolute differences higher than 0.75 cm.
Although, limited literature is available about the influence of PWV on solar irradiance nowcasting, it is well accepted that water vapor has limited effects on DNI and GHI, even under arid (low PWV and high solar resource) conditions [46]. Recently, the PWV effect on GHI was estimated to range between −72 and −48 W/m2 near the equator, where humidity is higher, but was found less significant in areas like Greece [47]. Results obtained from the ASPIRE campaign are shown in Figure 8 in respect to PWV differences between the model and the climatology. As in the previous section, only data labeled as clear sky by all sources are used, in order to eliminate any cloud effects on the PWV assessment. Only data from broadband instruments are shown since PSR measures up to 1024 nm and is missing the NIR where the PWV influence is high. No clear pattern revealing the influence of PWV is evident in the results of our analysis. The sign of the effect is not clearly related to the sign of the PWV difference. The main source of this behavior is the seasonality of PWV linked to different atmospheric conditions each period.
d.
cloud effects
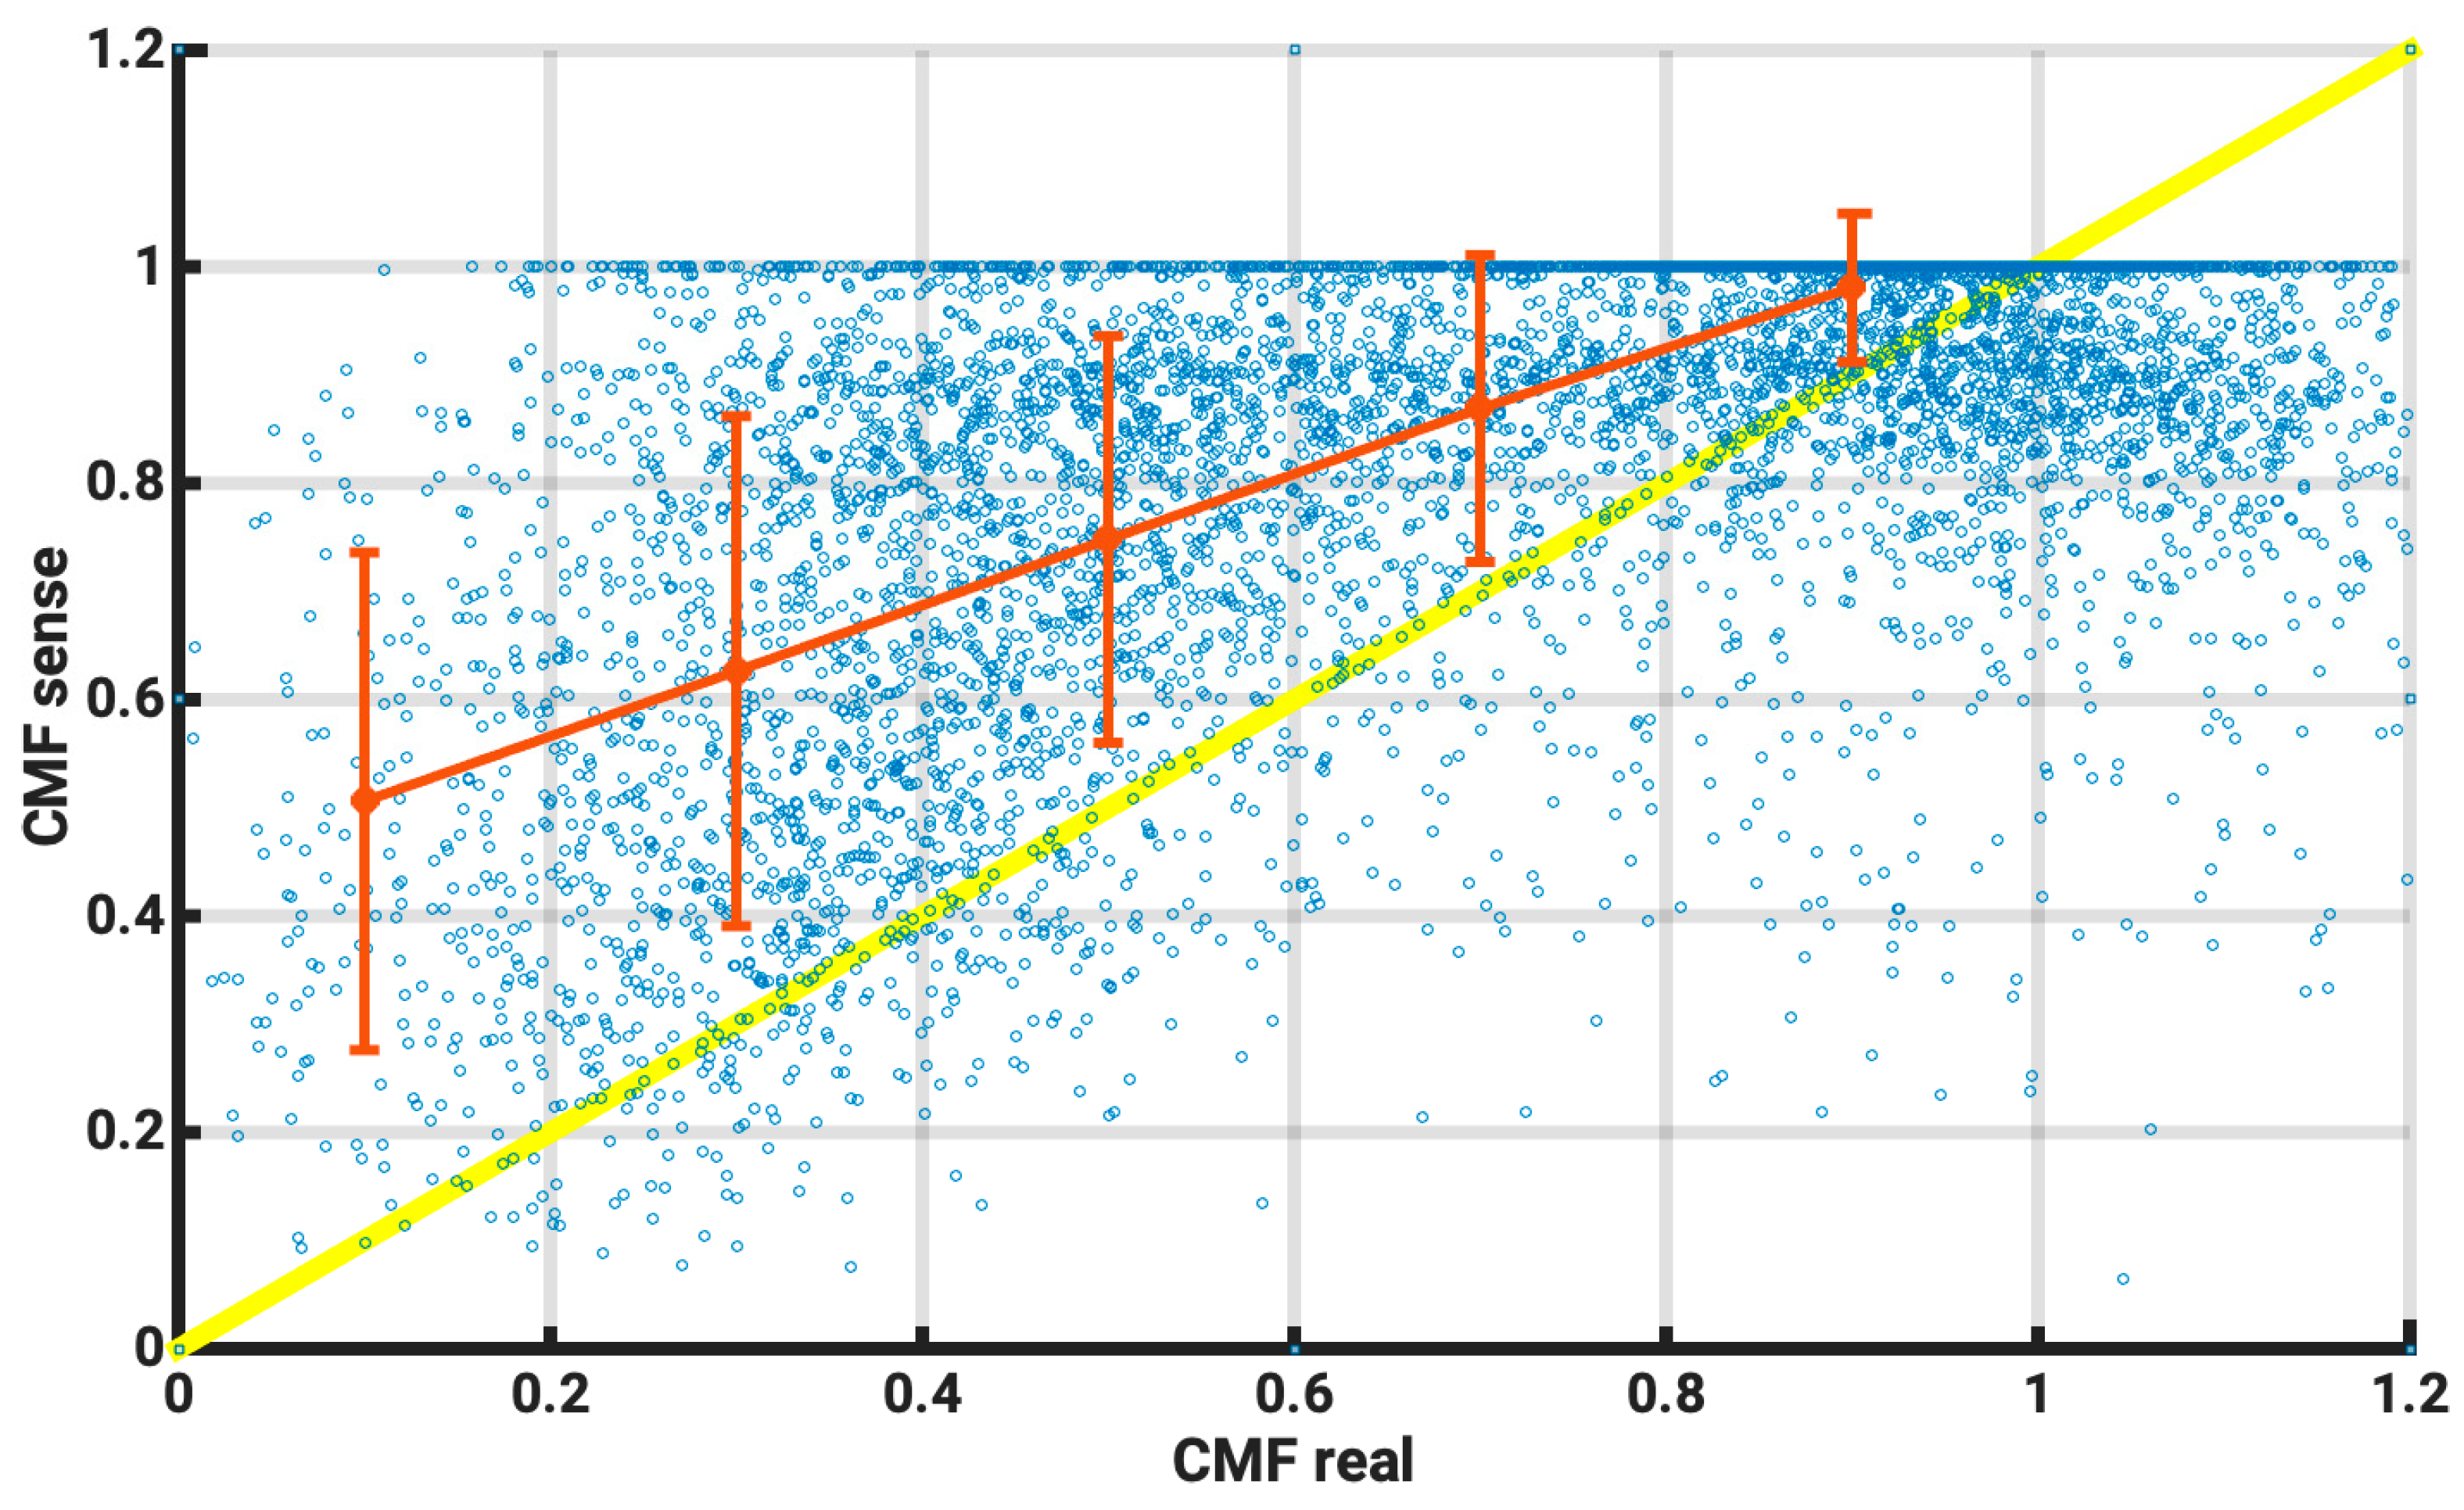
In order to evaluate the performance of SENSE under cloudy conditions, the real CMF was estimated, using pyranometer measurements. More specifically, it was calculated using Equation (5), as the ratio of measured GHI_Tot to theoretical GHI cloudless (clear-sky). For the clear-sky GHI, for every SENSE time step, radiative transfer model runs were performed, with COT set to 0, and forecasted CAMS AOD. Hence, this theoretical GHI, represents the aerosol conditions for cloudless skies, with the uncertainties of CAMS AOD product, described in the previous section.
CMF pyr = GHI meas GHI mod ( no   cloud ,   CAMS   AOD )
In Figure 9, the relation between the CMF_pyr and the CMF used in SENSE is shown. The results presented in Figure 9 explain most inconsistencies between the model and the measurements in cases with cloud presence. Real CMF could be higher than 1 in some cases (7.1% in our dataset). This could be caused either from real conditions, such as broken-cloud conditions with un-occluded solar disc, known as cloud enhancement. There are also cases, when forecasted CAMS AOD is higher than the real one, which causes an artificial CMF higher than 1. Figure 9 shows a systematic overestimation of the CMF used in SENSE compared with the pyranometer. This visualizes the inconsistency between the satellite COT, which is retrieved based on a wider pixel and is defined by the viewing geometry of the satellite and the actual cloud conditions as seen from the instrument on the ground. However, the propagation of these differences to actual irradiances is also defined by other factors. In many cloudy cases, GHI is already very low, and the deviations in the final results might be less important. For Athens, the CMF is between 0.8 and 1 for most cases. For these high CMF cases the agreement is relatively good.
In Figure 10, we present the CMF_pyr in relation to cloud coverage, separated according to sun obscurity as retrieved from the sky camera. The figure shows two distinctive branches. One for cases where the sun is visible from the point of view of the ground-based instrument, where CMF is higher than 0.8 for cloud coverage between 0% and 60% and between 0.6 and 0.7 for higher cloud fractions (blue line and shaded area), and one for the sun-obscured cases, where CMF is ~0.6 for 0% to 60% cloud fractions and 0.3 for higher ones (orange line and shaded area). Generally, cases of obscured sun are more dispersed to all conditions of cloud coverage, although the most frequent are at high cloud coverage. The most usual case is low cloud coverage and high CMF. As cloud coverage increases, more complex cloud scenes appear, where either the sun is visible or not, and result in different CMF. Also, cases of CMF higher than 1, where there are clouds and the sun is visible, exist frequently especially when cloud coverage is above 40%. In general, 63.8% of the data points show CMF > 0.8 simultaneously for pyranometer and satellite, which is the most common case, of almost clear sky for the area of Athens. This “division” of CMFs in the two branches using actual pyranometer data shows the difficulty in comparing satellite and ground-based measurements, as satellite-based CMF cannot capture if the sun is obscured or not.
Figure 11 shows CMF averages in different cloud fraction bins. Το understand the actual frequency of cases in all bins, we produced Figure 11. The figure shows the distribution of these cases for 12 months of measurements performed in Athens, at ASNOA station. Visible sun cases are found mainly when CMF is higher than 0.8, and almost never when CMF is lower than 0.5. For occluded conditions, CMF is very rarely above 0.8 and the majority of cases are at CMF lower than 0.6. These distributions should be considered, when looking at Figure 10 because the classes have very different populations of data.
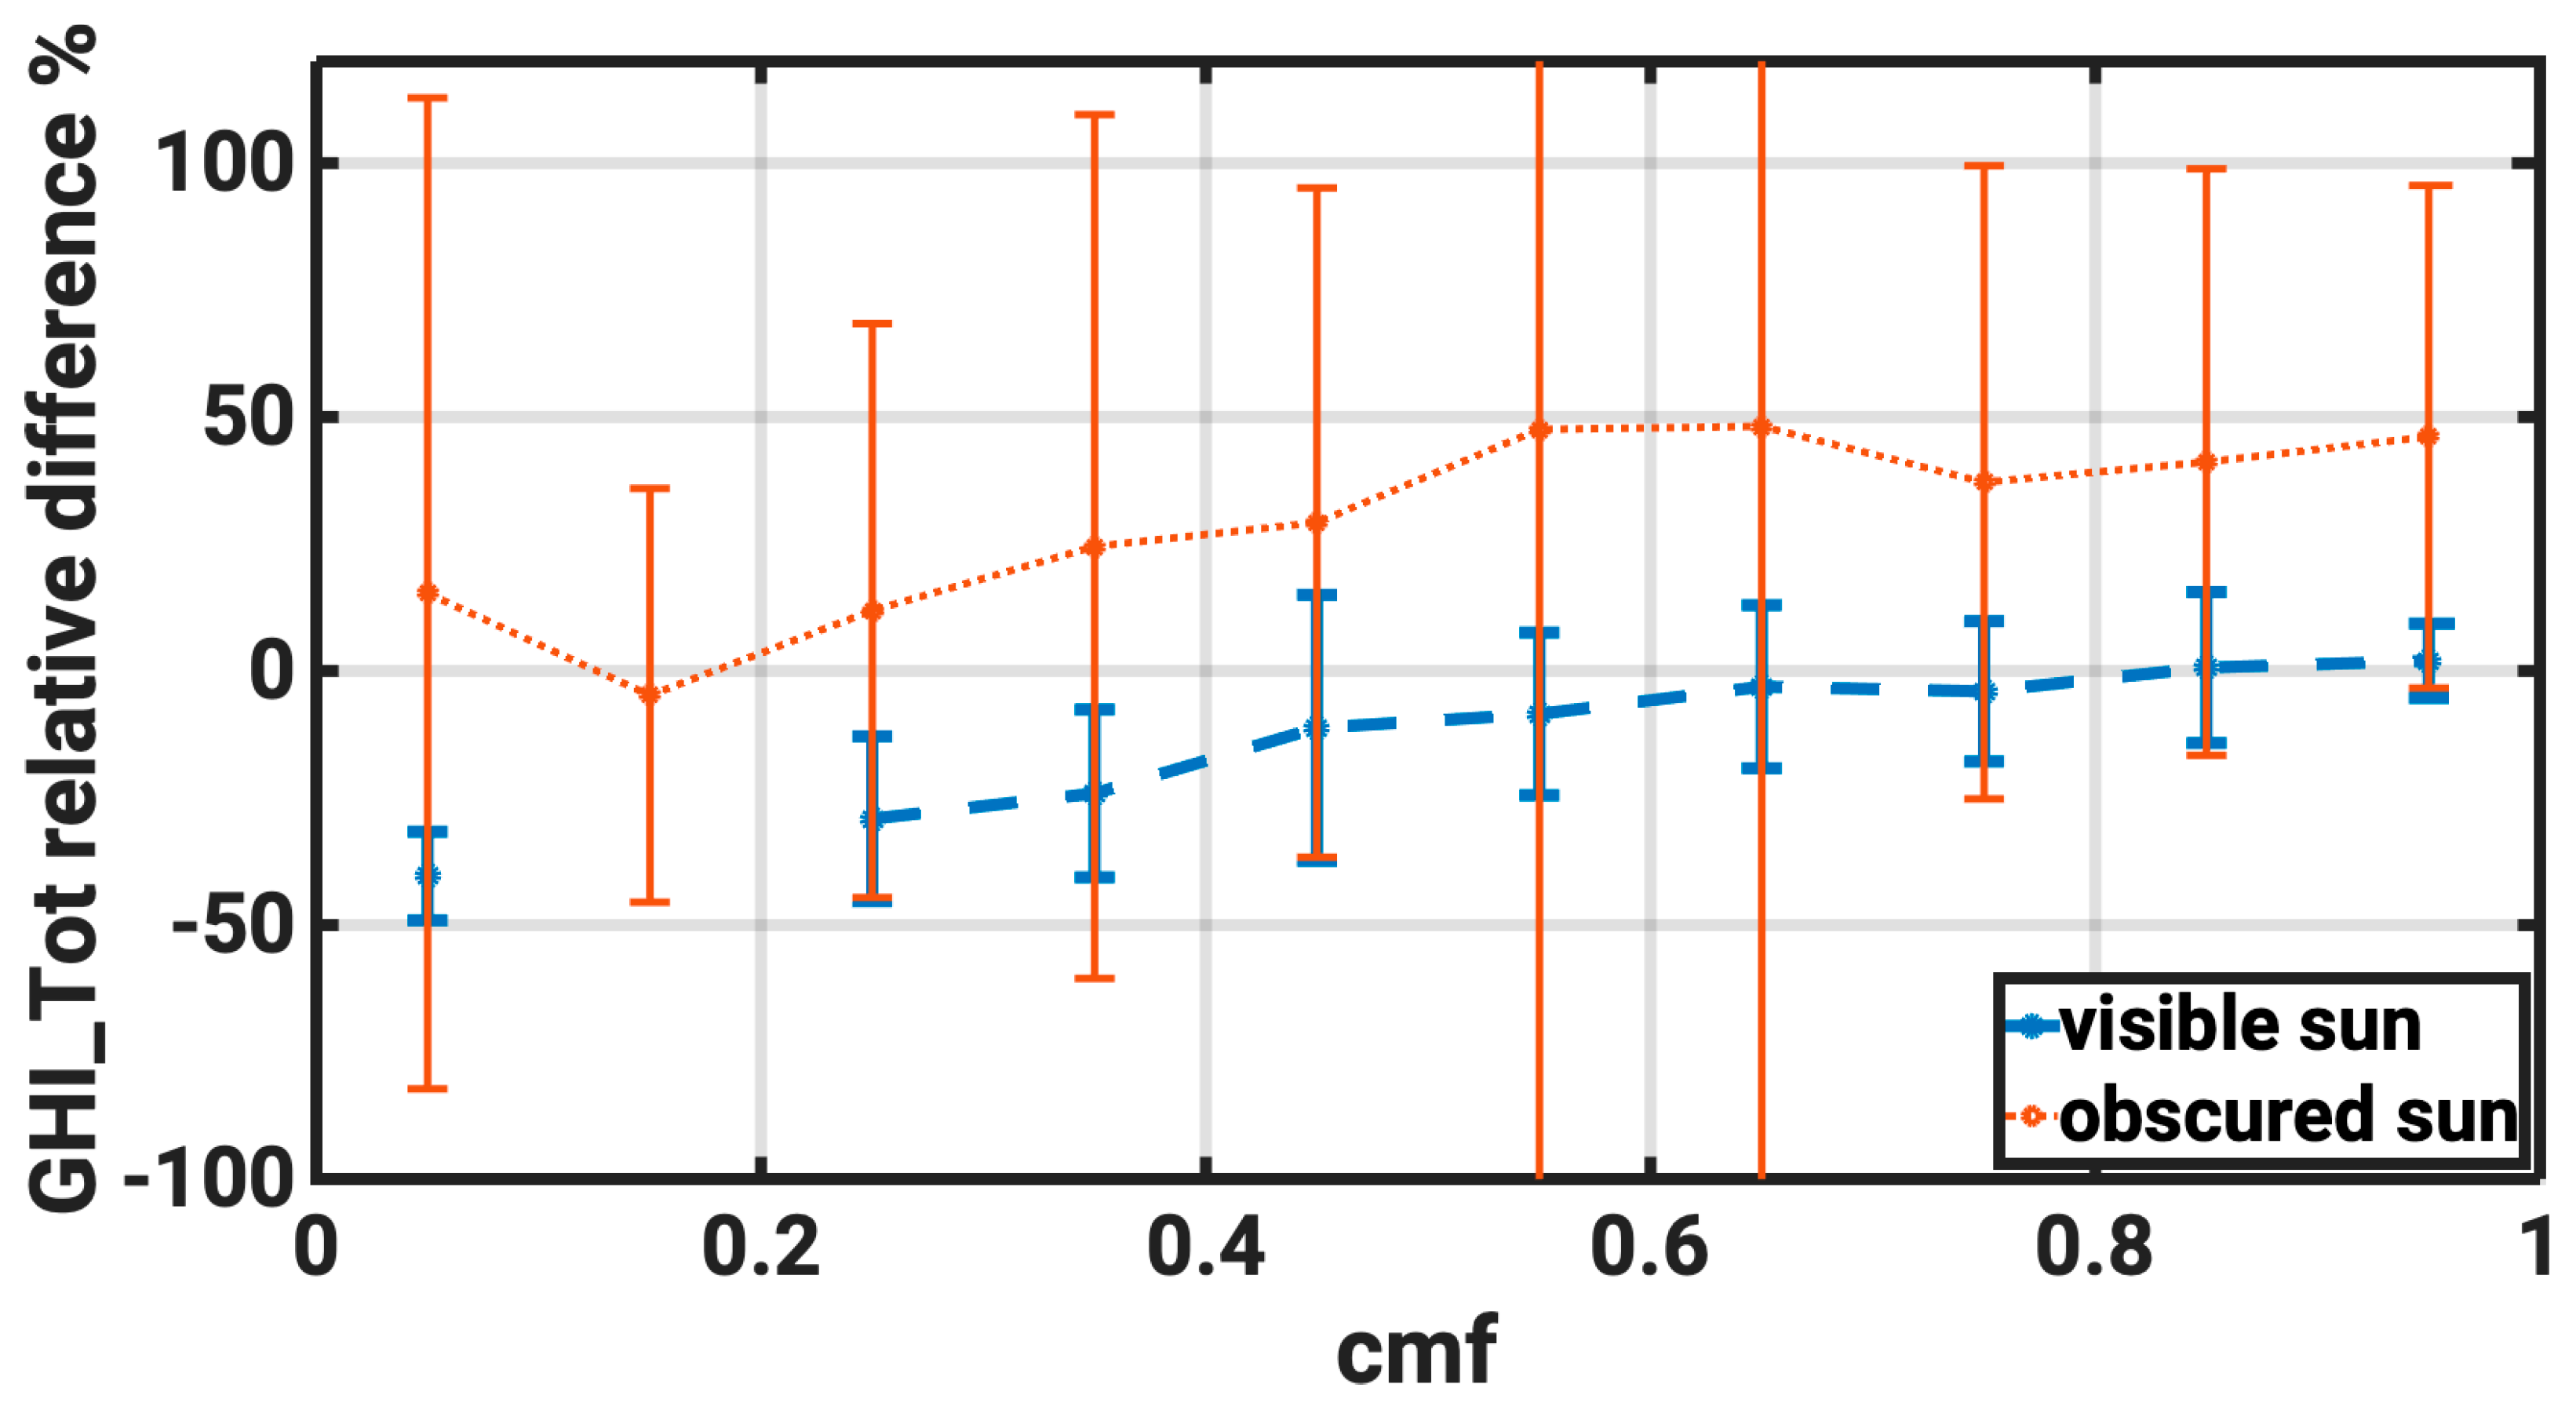
In Figure 12, we present the GHI_Tot relative difference in respect to the CMF again for un-occluded and occluded solar disc. This figure should be considered in respect to previous figures about the distributions of CMF in different conditions. The agreement between the two datasets is optimal for un-occluded solar disc and for high CMF (differences are lower than 4% for CMF > 0.7). Agreement becomes worse with decreasing CMF, although cases with un-occluded sun and lower CMF are less frequent. The largest differences appear for high CMF (>0.5) and occluded sun disc (i.e., when there are clouds “not seen” by the satellite sensor). Under such conditions, average differences are ~40%. As CMF decreases, the relative differences (for occluded solar disc) become smaller, although these cases generally correspond to very low irradiance conditions. While the sun is visible, SENSE underestimates at high cloud fractions, and when the sun is occluded, SENSE overestimates systematically as it does not “know” about sun obscurity and distributes the cloud optical thickness equally in the whole sky for both irradiances—as estimated for the whole pixel from the satellite. But in reality, the distribution is very different, direct irradiance is very low and GHI is dropping accordingly at these conditions.
To better understand the behavior at these different cases, we have separated the cases in four categories, using CMF_pyr and sun visibility. We named them as A when CMF is high and sun is visible, B when CMF is low and sun is not obscured, C when CMF is high but the sun is not visible, and D when CMF is low and sun is obscured. The threshold for high and low CMF was set to 0.5. Statistics for these conditions are shown in Table 5. The most frequent condition is A, when the statistics also show the best agreement. Also, condition D, shows good agreement. A and D are the conditions when the CMF and the sun coverage are in the same direction, thus SENSE performs very well. The other two conditions have large deviations, which are explained by the fact that the model estimates conditions different from reality. This is the main source of uncertainty in SENSE. The satellite sensor provides information for the average cloudiness conditions within a pixel with distinct dimensions (e.g., [48]). The satellite algorithm considers that clouds are evenly distributed within the pixel, and the CMF is calculated based on this assumption, which is not always accurate, especially under partially cloudy conditions. Even under cloudy conditions, the impact of cloudiness on surface solar irradiance is minor if the clouds are not in front of (or very close to) the solar disc (condition B). In contrast, the solar disc can be fully or partially covered by clouds when the average cloudiness in the pixel is very low (condition C). When solar elevation is low, the sun disc may be affected even by clouds that are in a nearby pixel, and not the one that contains the station. The condition B is not very frequent, but the condition C appears in 15% of cases.
However, these statistics are valid only for Athens and for the year of the campaign, and in terms of frequency among the cases, they provide a clear picture of the performance of SENSE under cloudy conditions. They also highlight the fact that the condition of solar disc coverage is the most important parameter for determining the incoming solar irradiance. In areas with more frequent cloudy conditions than Athens, the average agreement between SENSE and the measurements is expected to be worse due to this condition. With current state of the art satellite observations or model simulations, it is impossible to gain this piece of information. It can only be resolved locally; for example, with a sky camera on the site with a solar installation. Thus, this technological limitation, creates a boundary on the accuracy of SENSE.
SENSE uses a simplified approach for the calculation of the CMF from COT, which not discriminates between cloud types (e.g., ice or water clouds) for operational reasons. This configuration was found to affect 15.2% of the studied cases For 4.6% of the studied cases, the different cloud type would alter CMF by more than 0.5. A sensitivity test performed for these cases, and the differences in the estimated GHI_Tot were of the order of 30–50 W/m2. For a dataset that would take into consideration the cloud type, the statistics of GHI_Tot do not improve a lot—we found MBE = 19.7 and MRE = 4.3%, instead of 21 and 4.5%. Hence, the implementation of this information in future versions of SENSE could provide slightly better results, but the improvement would be still minor relative to the uncertainty due to the inaccurate description of the solar disc occlusion.

4. Conclusions

In this study, we explored uncertainties related with nowcasting evaluation using the intensive ASPIRE campaign with highly accurate solar and atmospheric measurements. More particularly for SENSE, valuable insights have been drawn on the SENSE inputs accuracy but also on the satellite based and ground-based comparison limitations. The uncertainty of the system was found to be lower than 4.5% in all cases, when 15 min outputs were compared. Daily level comparisons, provide even better agreement, with MRE at 0.3%.
The analysis showed a relatively good agreement between the estimated and measured irradiance values on 15 min time scale, that was even improved when analyzing hourly and daily integrals of solar GHI and DNI irradiances. However, the systematic model overestimation for cloudy conditions highlights the need for sun visibility information that cannot be provided from satellite data alone. The analysis also revealed some underestimation when there are clouds and the sun is visible, indicating that the system may need to account for scattered radiation from clouds. This highlights the importance of using ground-based measurements and advanced sky-imaging techniques to evaluate satellite cloud retrievals in solar energy nowcasting systems.
The impact of aerosols was found to be low, with AOD having a significant impact only when there are no clouds and in few cases with important CAMS-AERONET differences. Water vapor was found to have a very small impact on the results, mainly because it affects the infrared spectral region. This suggests that for further improvement, such systems need to incorporate more advanced techniques to account for the impact of aerosols and water vapor on the irradiance model’s outputs.
Despite these limitations, the evaluation of the SENSE system provides a promising framework for improving the accuracy of solar energy nowcasting. The system’s ability to accurately nowcast irradiance values can significantly improve the efficiency and reliability of solar energy systems, facilitating the integration of renewable energy into the network. Further research is needed to improve the accuracy of the system for cloudy conditions and to incorporate more advanced techniques to account for the impact of aerosols and water vapor on the irradiance estimates. It is of high importance to carefully select the validation sites to improve the accuracy of the nowcasts.
Overall, the present study demonstrated the importance of using ground-based measurements and advanced techniques for improving the evaluation of solar energy nowcasting systems. By improving the accuracy of these systems, we can facilitate the transition to a more sustainable and reliable energy future.

Author Contributions

Conceptualization, I.-P.R., S.K. and K.E.; methodology, I.-P.R., S.K., K.P. and N.P.; software, I.-P.R., C.B., N.P., K.P. and I.F.; validation I.-P.R. and I.F.; formal analysis, I.-P.R., I.F. and N.P.; investigation, I.-P.R., S.K., K.E., K.P., I.F.,D.K. and N.P.; resources, S.K., B.E.P., A.K. and C.B.; data curation, I.-P.R., S.K., D.K., I.F., B.E.P., A.K., C.B. and K.P.; writing—original draft preparation, I.-P.R.; writing—review and editing, I.-P.R., S.K., K.E., I.F.,K.P., A.K. and B.E.P.; visualization, I.-P.R.; supervision, S.K., K.E.; project administration, K.E.; funding acquisition, K.E. and S.K. All authors have read and agreed to the published version of the manuscript.

Funding

The study was funded by Hellenic Foundation for Research and Innovation (H.F.R.I.) under the “First Call for H.F.R.I. Research Projects to support Faculty members and Researchers and the procurement of high-cost research equipment grant” (Atmospheric parameters affecting Spectral solar IRradiance and solar Energy (ASPIRE), project number 300).

Data Availability Statement

All data collected during the ASPIRE campaign are available through the corresponding website (https://aspire.geol.uoa.gr/). For any details please contact K.E.

Acknowledgments

S.K., I.F. and K.P. acknowledge the European Commission project ‘EXCELSIOR’: ERATOSTHENES: Excellence Research Centre for Earth Surveillance and Space-Based Monitoring of the Environment (grant no. 857510) and S.K. the European Commission project EIFFEL (Revealing the Role of GEOSS as the Default Digital Portal for Building Climate Change Adaptation & Mitigation Applications) (grand no. 101003518).

Conflicts of Interest

The authors declare no conflict of interest. Funders had no role in the design of the study; in the collection, analyses, or interpretation of data; in the writing of the manuscript; or in the decision to publish the results.

References

  1. Malm, A. Fossil Capital: The Rise of Steam-Power and the Roots of Global Warming; Verso: London, UK, 2016; ISBN 978-1-78478-129-3. [Google Scholar]
  2. Kåberger, T. Progress of renewable electricity replacing fossil fuels. Glob. Energy Interconnect. 2018, 1, 48–52. [Google Scholar] [CrossRef]
  3. Shukla, P.R.; Skea, J.; Calvo Buendia, E.; Masson-Delmotte, V.; Pörtner, H.-O.; Roberts, D.; Zhai, P.; Slade, R.; Connors, S.; Van Diemen, R.; et al. IPCC, 2019: Climate Change and Land: An IPCC Special Report on Climate Change, Desertification, Land Degradation, Sustainable Land Management, Food Security, and Greenhouse Gas Fluxes in Terrestrial Ecosystems; Imperial College: London, UK, 2019. [Google Scholar]
  4. International Renewable Energy Agency (IRENA). Renewable Power Generation Costs in 2019; IRENA: Abu Dhabi, United Arab Emirates, 2020. [Google Scholar]
  5. REN21. Renewables 2023 Global Status Report collection, Renewables in Energy Demand; REN21 Secreatariat: Paris, France, 2023; ISBN 978-3-948393-07-6. [Google Scholar]
  6. IEA. Renewables 2019; IEA: Paris, France, 2019. [Google Scholar]
  7. Mulder, F.M. Implications of diurnal and seasonal variations in renewable energy generation for large scale energy storage. J. Renew. Sustain. Energy 2014, 6, 033105. [Google Scholar] [CrossRef] [Green Version]
  8. Kan, A.; Zeng, Y.; Meng, X.; Wang, D.; Xina, J.; Yang, X.; Tesren, L. The linkage between renewable energy potential and sustainable development: Understanding solar energy variability and photovoltaic power potential in Tibet, China. Sustain. Energy Technol. Assess. 2021, 48, 101551. [Google Scholar] [CrossRef]
  9. Denholm, P.; Brown, P.; Cole, W.; Mai, T.; Sergi, B.; Brown, M.; Jadun, P.; Ho, J.; Mayernik, J.; McMillan, C.; et al. Examining Supply-Side Options to Achieve 100% Clean Electricity by 2035; USDOE: Washington, DC, USA, 2022. [Google Scholar]
  10. Obiora, C.N.; Ali, A.; Hasan, A.N. Estimation of Hourly Global Solar Radiation Using Deep Learning Algorithms. In Proceedings of the 2020 11th International Renewable Energy Congress (IREC), Hammamet, Tunisia, 29–31 October 2020; IEEE: Hammamet, Tunisia, 2020; pp. 1–6. [Google Scholar]
  11. Voyant, C.; Motte, F.; Notton, G.; Fouilloy, A.; Nivet, M.-L.; Duchaud, J.-L. Prediction intervals for global solar irradiation forecasting using regression trees methods. Renew. Energy 2018, 126, 332–340. [Google Scholar] [CrossRef] [Green Version]
  12. Ayet, A.; Tandeo, P. Nowcasting solar irradiance using an analog method and geostationary satellite images. Sol. Energy 2018, 164, 301–315. [Google Scholar] [CrossRef] [Green Version]
  13. Juncklaus Martins, B.; Cerentini, A.; Mantelli, S.L.; Loureiro Chaves, T.Z.; Moreira Branco, N.; von Wangenheim, A.; Rüther, R.; Marian Arrais, J. Systematic review of nowcasting approaches for solar energy production based upon ground-based cloud imaging. Sol. Energy Adv. 2022, 2, 100019. [Google Scholar] [CrossRef]
  14. Ravi Kumar, K.; Krishna Chaitanya, N.V.V.; Sendhil Kumar, N. Solar thermal energy technologies and its applications for process heating and power generation—A review. J. Clean. Prod. 2021, 282, 125296. [Google Scholar] [CrossRef]
  15. Yang, D.; Wu, E.; Kleissl, J. Operational solar forecasting for the real-time market. Int. J. Forecast. 2019, 35, 1499–1519. [Google Scholar] [CrossRef]
  16. Krishnan, N.; Kumar, K.R.; Inda, C.S. How solar radiation forecasting impacts the utilization of solar energy: A critical review. J. Clean. Prod. 2023, 388, 135860. [Google Scholar] [CrossRef]
  17. Catalina, A.; Alaiz, C.M.; Dorronsoro, J.R. Combining Numerical Weather Predictions and Satellite Data for PV Energy Nowcasting. IEEE Trans. Sustain. Energy 2020, 11, 1930–1937. [Google Scholar] [CrossRef]
  18. Bright, J.M. Solcast: Validation of a satellite-derived solar irradiance dataset. Sol. Energy 2019, 189, 435–449. [Google Scholar] [CrossRef]
  19. Yang, D.; Bright, J.M. Worldwide validation of 8 satellite-derived and reanalysis solar radiation products: A preliminary evaluation and overall metrics for hourly data over 27 years. Sol. Energy 2020, 210, 3–19. [Google Scholar] [CrossRef]
  20. Kosmopoulos, P.G.; Kazadzis, S.; Taylor, M.; Raptis, P.I.; Keramitsoglou, I.; Kiranoudis, C.; Bais, A.F. Assessment of surface solar irradiance derived from real-time modelling techniques and verification with ground-based measurements. Atmos. Meas. Technol. 2018, 11, 907–924. [Google Scholar] [CrossRef] [Green Version]
  21. Kosmopoulos, P.; Kouroutsidis, D.; Papachristopoulou, K.; Raptis, P.I.; Masoom, A.; Saint-Drenan, Y.-M.; Blanc, P.; Kontoes, C.; Kazadzis, S. Short-Term Forecasting of Large-Scale Clouds Impact on Downwelling Surface Solar Irradiation. Energies 2020, 13, 6555. [Google Scholar] [CrossRef]
  22. Huld, T.; Müller, R.; Gambardella, A. A new solar radiation database for estimating PV performance in Europe and Africa. Sol. Energy 2012, 86, 1803–1815. [Google Scholar] [CrossRef]
  23. Wang, F.; Mi, Z.; Su, S.; Zhao, H. Short-Term Solar Irradiance Forecasting Model Based on Artificial Neural Network Using Statistical Feature Parameters. Energies 2012, 5, 1355–1370. [Google Scholar] [CrossRef] [Green Version]
  24. Masoom, A.; Kosmopoulos, P.; Bansal, A.; Gkikas, A.; Proestakis, E.; Kazadzis, S.; Amiridis, V. Forecasting dust impact on solar energy using remote sensing and modeling techniques. Sol. Energy 2021, 228, 317–332. [Google Scholar] [CrossRef]
  25. Papachristopoulou, K.; Fountoulakis, I.; Bais, A.F.; Psiloglou, B.E.; Papadimitriou, N.; Raptis, I.-P.; Kazantzidis, A.; Kontoes, C.; Hatzaki, M.; Kazadzis, S. Effects of clouds and aerosols on downwelling surface solar irradiance nowcasting and sort-term forecasting. Atmos. Meas. Tech. Discuss. 2023. [Google Scholar] [CrossRef]
  26. Raptis, I.-P.; Kazadzis, S.; Amiridis, V.; Gkikas, A.; Gerasopoulos, E.; Mihalopoulos, N. A Decade of Aerosol Optical Properties Measurements over Athens, Greece. Atmosphere 2020, 11, 154. [Google Scholar] [CrossRef] [Green Version]
  27. Gröbner, J.; Kouremeti, N. The Precision Solar Spectroradiometer (PSR) for direct solar irradiance measurements. Sol. Energy 2019, 185, 199–210. [Google Scholar] [CrossRef]
  28. Raptis, P.-I.; Kazadzis, S.; Gröbner, J.; Kouremeti, N.; Doppler, L.; Becker, R.; Helmis, C. Water vapour retrieval using the Precision Solar Spectroradiometer. Atmos. Meas. Techol. 2018, 11, 1143–1157. [Google Scholar] [CrossRef] [Green Version]
  29. Gröbner, J.; Kouremeti, N.; Hülsen, G.; Zuber, R.; Ribnitzky, M.; Nevas, S.; Sperfeld, P.; Schwind, K.; Schneider, P.; Kazadzis, S.; et al. Spectral Aerosol Optical Depth from Traceable Spectral Solar Irradiance Measurements to the SI; Aerosols/Remote Sensing/Validation and Intercomparisons; EGUsphere: Vienna, Austria, 2023. [Google Scholar]
  30. Hulstrom, R. Solar Resources; MIT Press: Cambridge, MA, USA, 2002. [Google Scholar]
  31. Gueymard, C.; Vignola, F. Determination of atmospheric turbidity from the diffuse-beam broadband irradiance ratio. Sol. Energy 1998, 63, 135–146. [Google Scholar] [CrossRef]
  32. Kazantzidis, A.; Tzoumanikas, P.; Bais, A.F.; Fotopoulos, S.; Economou, G. Cloud detection and classification with the use of whole-sky ground-based images. Atmos. Res. 2012, 113, 80–88. [Google Scholar] [CrossRef]
  33. Tzoumanikas, P.; Nikitidou, E.; Bais, A.F.; Kazantzidis, A. The effect of clouds on surface solar irradiance, based on data from an all-sky imaging system. Renew. Energy 2016, 95, 314–322. [Google Scholar] [CrossRef]
  34. Hasenbalg, M.; Kuhn, P.; Wilbert, S.; Nouri, B.; Kazantzidis, A. Benchmarking of six cloud segmentation algorithms for ground-based all-sky imagers. Sol. Energy 2020, 201, 596–614. [Google Scholar] [CrossRef]
  35. Tsourounis, D.; Kastaniotis, D.; Theoharatos, C.; Kazantzidis, A.; Economou, G. SIFT-CNN: When Convolutional Neural Networks Meet Dense SIFT Descriptors for Image and Sequence Classification. J. Imaging 2022, 8, 256. [Google Scholar] [CrossRef]
  36. Holben, B.N.; Eck, T.F.; Slutsker, I.; Tanré, D.; Buis, J.P.; Setzer, A.; Vermote, E.; Reagan, J.A.; Kaufman, Y.J.; Nakajima, T.; et al. AERONET—A Federated Instrument Network and Data Archive for Aerosol Characterization. Remote Sens. Environ. 1998, 66, 1–16. [Google Scholar] [CrossRef]
  37. Giles, D.M.; Sinyuk, A.; Sorokin, M.G.; Schafer, J.S.; Smirnov, A.; Slutsker, I.; Eck, T.F.; Holben, B.N.; Lewis, J.R.; Campbell, J.R.; et al. Advancements in the Aerosol Robotic Network (AERONET) Version 3 database—automated near-real-time quality control algorithm with improved cloud screening for Sun photometer aerosol optical depth (AOD) measurements. Atmos. Meas. Technol. 2019, 12, 169–209. [Google Scholar] [CrossRef] [Green Version]
  38. Smirnov, A.; Holben, B.N.; Eck, T.F.; Slutsker, I.; Chatenet, B.; Pinker, R.T. Diurnal variability of aerosol optical depth observed at AERONET (Aerosol Robotic Network) sites: Aerosol optical depth diurnal variability. Geophys. Res. Lett. 2002, 29, 30-1–30-34. [Google Scholar] [CrossRef]
  39. Carlton, A.G.; Turpin, B.J.; Altieri, K.E.; Seitzinger, S.; Reff, A.; Lim, H.-J.; Ervens, B. Atmospheric oxalic acid and SOA production from glyoxal: Results of aqueous photooxidation experiments. Atmos. Environ. 2007, 41, 7588–7602. [Google Scholar] [CrossRef]
  40. Molina, L.T.; Madronich, S.; Gaffney, J.S.; Apel, E.; de Foy, B.; Fast, J.; Ferrare, R.; Herndon, S.; Jimenez, J.L.; Lamb, B.; et al. An overview of the MILAGRO 2006 Campaign: Mexico City emissions and their transport and transformation. Atmos. Chem. Phys. 2010, 10, 8697–8760. [Google Scholar] [CrossRef] [Green Version]
  41. Shahid, I.; Shahid, M.Z.; Chen, Z.; Asif, Z. Long-Term Variability of Aerosol Concentrations and Optical Properties over the Indo-Gangetic Plain in South Asia. Atmosphere 2022, 13, 1266. [Google Scholar] [CrossRef]
  42. Zeng, L.; Huang, D.D.; Zhu, S.; Li, F.; Zhou, M.; Qiao, L.; Wang, Q.; Wang, Q.; Ma, Y.; Lou, S.; et al. The interplays among meteorology, source, and chemistry in high particulate matter pollution episodes in urban Shanghai, China. Sci. Total Environ. 2022, 853, 158347. [Google Scholar] [CrossRef] [PubMed]
  43. Gueymard, C.A.; Yang, D. Worldwide validation of CAMS and MERRA-2 reanalysis aerosol optical depth products using 15 years of AERONET observations. Atmos. Environ. 2020, 225, 117216. [Google Scholar] [CrossRef]
  44. Masoom, A.; Fountoulakis, I.; Kazadzis, S.; Raptis, I.-P.; Kampouri, A.; Psiloglou, B.; Kouklaki, D.; Papachristopoulou, K.; Marinou, E.; Solomos, S.; et al. Investigation of the Effects of the Greek Extreme Wildfires of August 2021 on Air Quality and Spectral Solar Irradiance; Aerosols/Field Measurements/Troposphere/Physics (Physical Properties and Processes); EGUsphere: Vienna, Austria, 2023. [Google Scholar]
  45. Kosmopoulos, P.G.; Kazadzis, S.; Taylor, M.; Athanasopoulou, E.; Speyer, O.; Raptis, P.I.; Marinou, E.; Proestakis, E.; Solomos, S.; Gerasopoulos, E.; et al. Dust impact on surface solar irradiance assessed with model simulations, satellite observations and ground-based measurements. Atmos. Meas. Technol. 2017, 10, 2435–2453. [Google Scholar] [CrossRef] [Green Version]
  46. Gueymard, C.A. Impact of on-site atmospheric water vapor estimation methods on the accuracy of local solar irradiance predictions. Sol. Energy 2014, 101, 74–82. [Google Scholar] [CrossRef]
  47. Salamalikis, V.; Vamvakas, I.; Gueymard, C.A.; Kazantzidis, A. Atmospheric water vapor radiative effects on shortwave radiation under clear skies: A global spatiotemporal analysis. Atmos. Res. 2021, 251, 105418. [Google Scholar] [CrossRef]
  48. Kazadzis, S.; Bais, A.; Balis, D.; Kouremeti, N.; Zempila, M.; Arola, A.; Giannakaki, E.; Amiridis, V.; Kazantzidis, A. Spatial and temporal UV irradiance and aerosol variability within the area of an OMI satellite pixel. Atmos. Chem. Phys. 2009, 9, 4593–4601. [Google Scholar] [CrossRef] [Green Version]
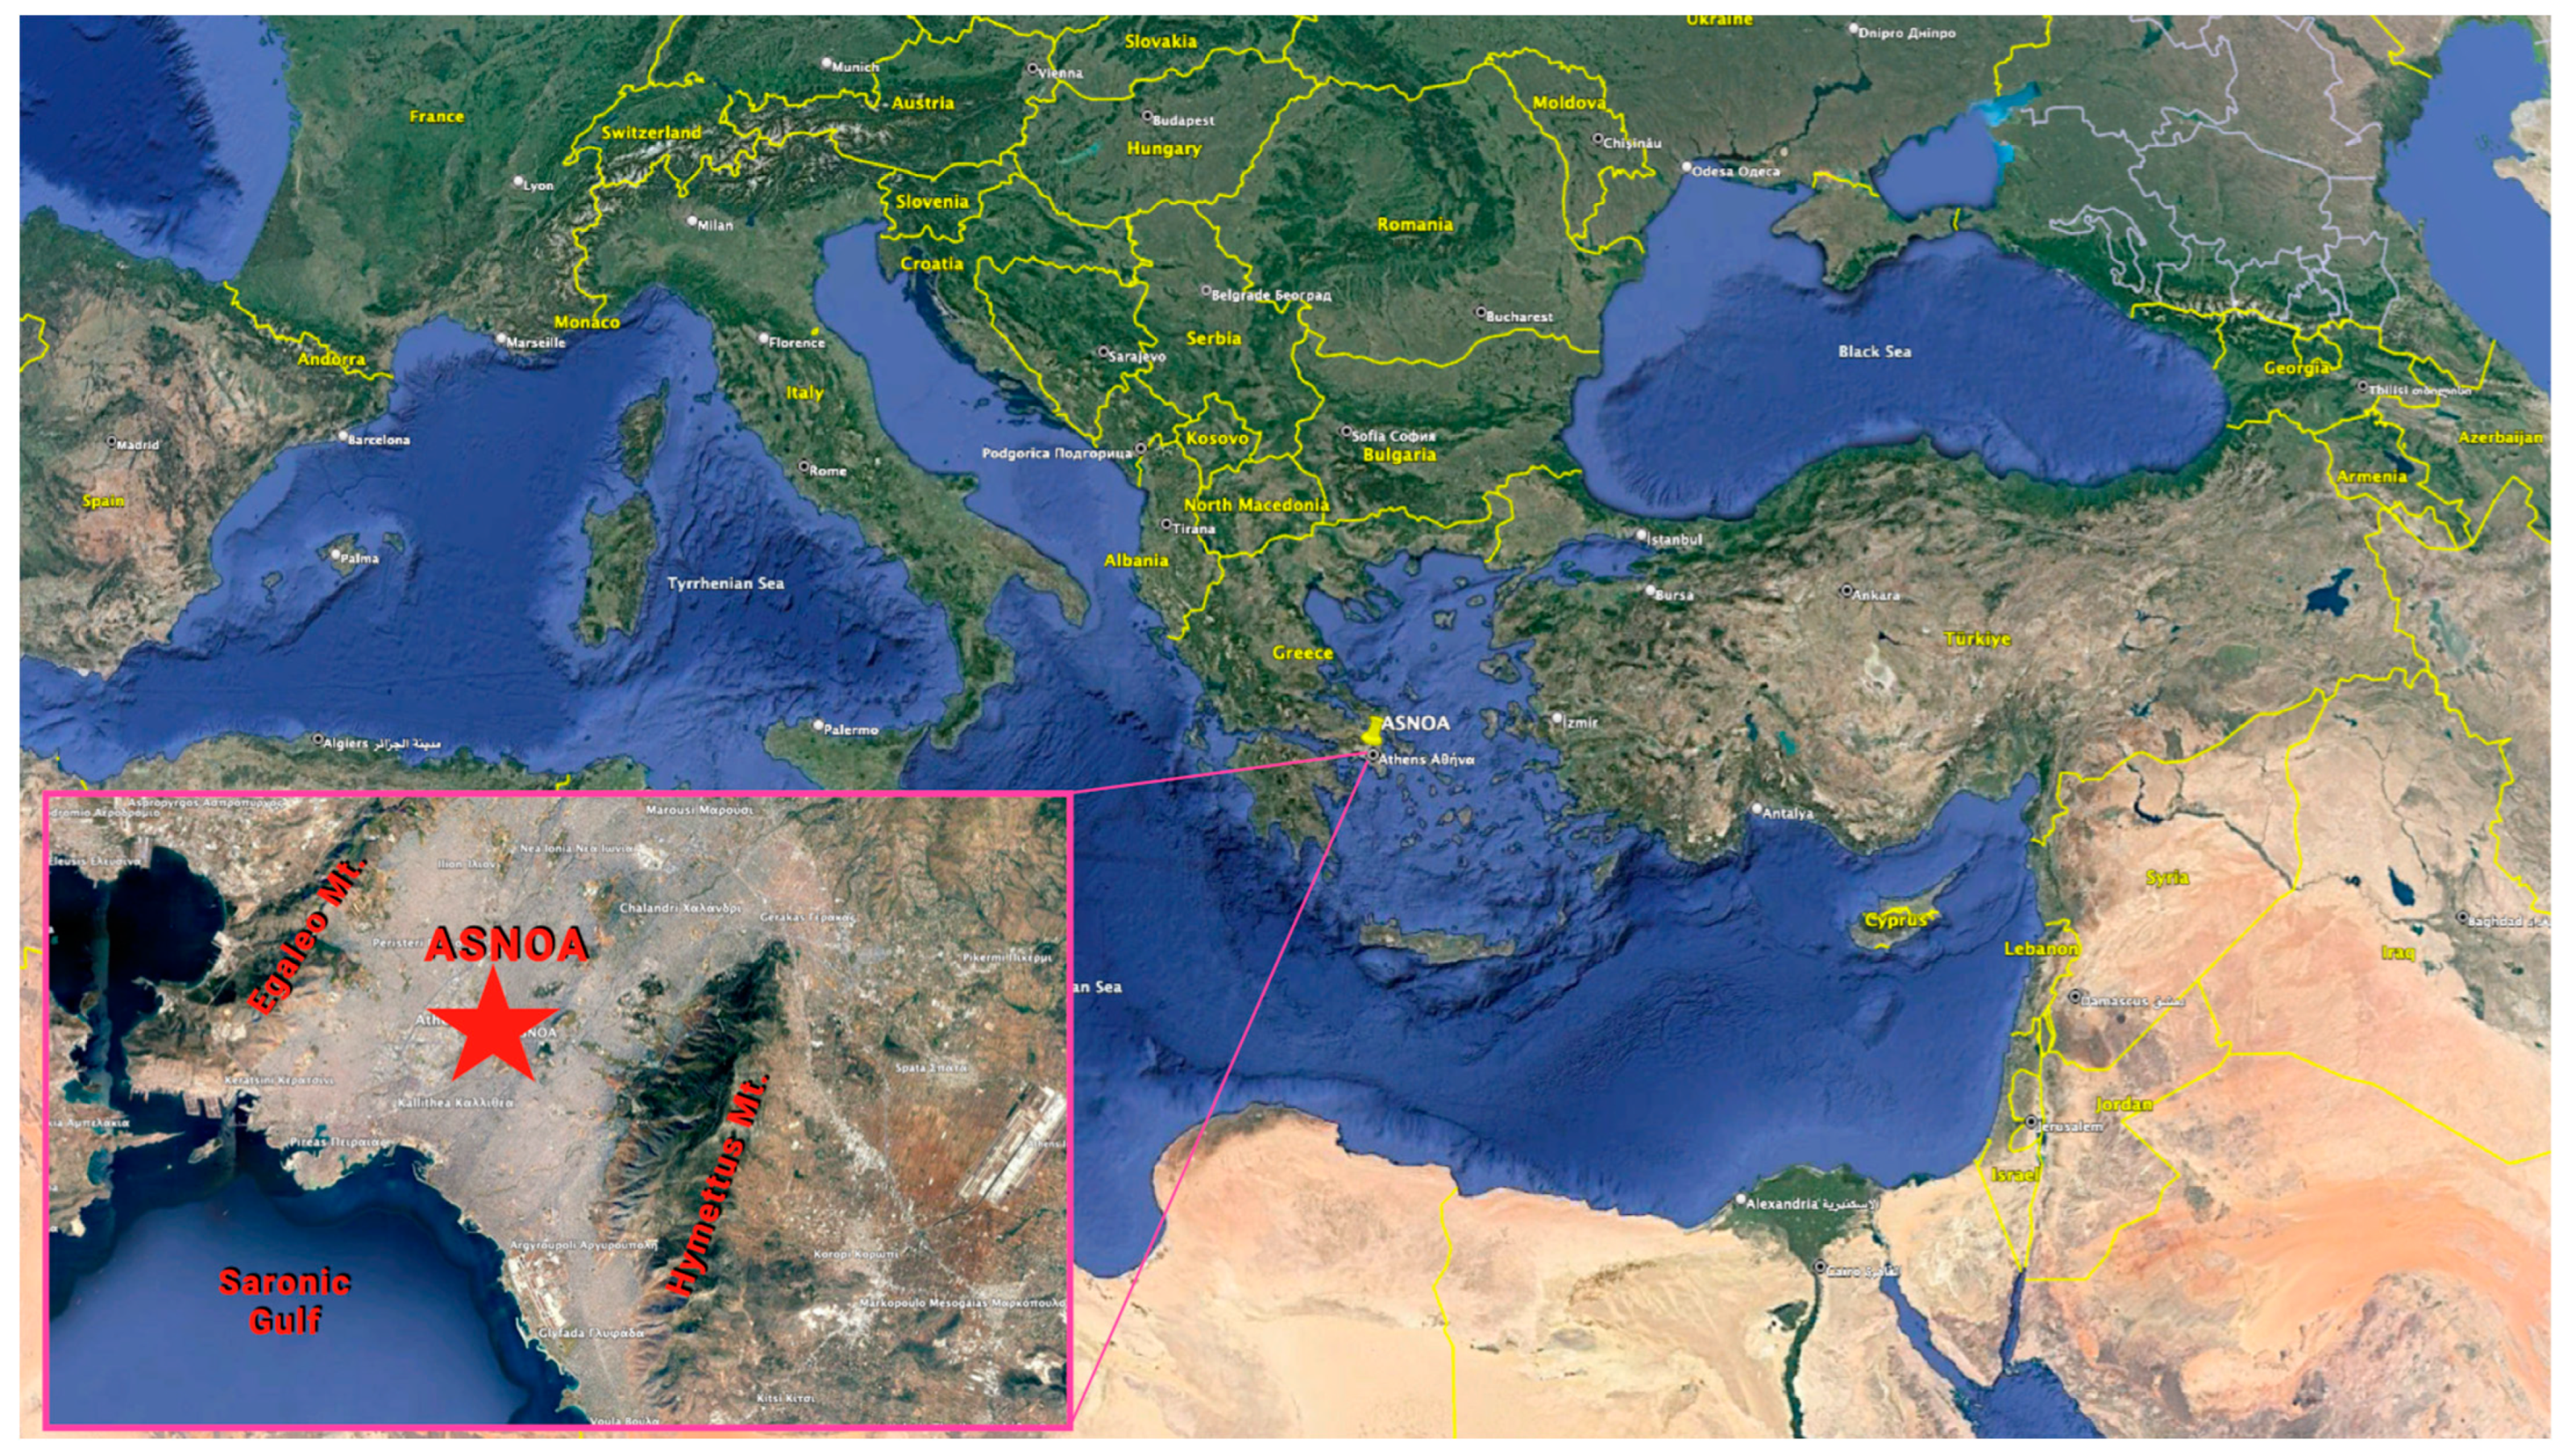
Figure 1. Map showing the exact location of ASNOA at the regional and city level (source: Google Earth Pro). This is the location of all ground-based measurements and the grid point (nearest) of SENSE output.
Energies 16 05361 g001
Figure 2. Scatterplots of daily integrated measurements of broadband instruments and SENSE output of GHI (left plot) and DNI (right plot). Yellow line represents 1-1.
Energies 16 05361 g002
Figure 3. Density scatterplots of SENSE outputsin respect to ground based measurements. Blue lines represent the 1-1. Upper left plot shows the GHI_tot estimation by SENSE in respect to recordings by pyranometer. Upper right plot shows the GHI_psr estimation by SENSE in respect to recordings by PSR. Lower left plot shows the DNI_psr estimation by SENSE in respect to recordings by PSR. Lower right plot shows the GHI_vis estimation by SENSE in respect to recordings by PSR.
Energies 16 05361 g003
Figure 4. Scatterplots of SENSE outputs in respect to ground-based measurements, only for cloudless, low aerosol load and un-occluded sun conditions. Upper left plot shows the GHI_tot by SENSE in respect to recordings by pyranometer. Upper right plot shows the GHI_psr by SENSE in respect to recordings by PSR. Lower left plot shows the GHI_vis by SENSE in respect to recordings by PSR. Lower right plot shows the DNI_prs by SENSE in respect to recordings by PSR.
Energies 16 05361 g004
Figure 5. Histogram of relative frequencies of differences between AERONET and CAMS AOD at 550 nm.
Energies 16 05361 g005
Figure 6. GHI_Tot and DNI_psr relative differences in respect to AOD differences, for cloudless conditions (cloud coverage <0.13 and un-occluded sun disc). Crosses represent the mean of each variable and the ±1σ range.
Energies 16 05361 g006
Figure 7. Histogram of relative frequencies of differences between AERONET measured and climatological PWV used in SENSE input.
Energies 16 05361 g007
Figure 8. GHI_tot and DNI_tot relative differences in respect to PWV differences, for cloudless conditions (cloud coverage < 0.13 and sun saturated). Crosses represent the mean of each variable and the ±1σ range.
Energies 16 05361 g008
Figure 9. CMF used in SENSE model compared with the real CMF recorded from the pyranometer. Yellow line represents 1-1. Red line represents the mean CMF sense and ±1σ for CMF real bins of 0.2 width.
Energies 16 05361 g009
Figure 10. CMF_pyr in relation to cloud coverage- retrieved from sky camera, for the whole period, separated according to sun saturation (blue for visible and red for obscured sun). Shaded areas represent the ±1σ range.
Energies 16 05361 g010
Figure 11. Relative frequency of CMF_pyr for visible and obscured sun conditions.
Energies 16 05361 g011
Figure 12. Relative difference of GHI_tot in respect to CMF bins, separated between cases with visible and obscured sun.
Energies 16 05361 g012
Table 1. Description of input parameters for SENSE.
Parameter Source
Solar Zenith Angle Calculated—15 min
Aerosol optical depth at 550 nm (AOD)CAMS forecast from the previous day—1 h
Single Scattering Albedo (SSA)Monthly Climatology
Angstrom exponent (AE)
Water Vapor (WV in cm)
Total Ozone Column (TOC in DU)TEMIS daily forecast
Surface albedo0.2
Cloud optical thickness (COT)MSG data from EUMETSAT NWC SAF
Table 2. Solar Irradiance related variables used for evaluating SENSE. Spectral range, measurement frequency and instrument used for each one is referred.
GHI_totGHI_psrGHI_visDNI_totDNI_psr
Spectral range285–2800 nm300–1020 nm400–700 nm200–4000 nm300–1020 nm
namePyranometer Eppley PSPPSRPSRPyrheliometer CHP1 PSR
frequency1 min~4 min~4 min1 min~4 min
Table 3. Statistics of comparisons between SENSE model output and ground based measurements (GHI and DNI), for different integration time and spectral regions.
GHI_totGHI_psrGHI_visDNI_totDNI_psr
Instant (W/m2)MBE21.03.32.6−2.00.3
(σ)(38.1)(33.3)(14.3)(75.4)(49.3)
MRE4.5%1.8%2.7%2.4%1.0%
RMSE56.242.122.499.162.4
R20.940.910.940.660.79
Hourly (W/m2)MBE17.00.42.4−5.50.4
(σ)(28.4)(18.4)(9.8)(61.2)(36.7)
MRE2.1%0.7% 0.4%0.9%0.4%
RMSE40.824.814.575.156.3
R20.960.960.960.760.80
Daily (kWh/m2)MBE−0.50.10.2−0.90.1
(σ)(0.7)(0.4)(0.4)(2.1)(1.3)
MRE0.3%0.2%0.5%1.5%0.3%
RMSE0.60.40.30.990.81
R20.990.990.990.950.91
Table 4. Statistics for SENSE outputs of all irradiance variables, only for cloudless, low aerosol load and non-occluded sun conditions.
GHI_totGHI_psrGHI_visDNI_totDNI_psr
MBE6.1−1.91.439.61.2
RMSE15.37.54.943.613.2
R20.990.990.990.920.90
MRE (%)1.9−0.91.05.00.45
Table 5. Statistics of GHI_tot comparisons between SENSE and measurements, separated at four different clusters, according to cloud conditions.
ΜΒΕRMSER2MRE (%)N of Data
A (sun/high CMF)4.49.10.991.410,680
B (sun/low CMF)−189.4225.20.51−21.1197
C (no sun/high CMF)145.8212.60.5542.92165
D (no sun/low CMF)7.817.50.9819.71177
Disclaimer/Publisher’s Note: The statements, opinions and data contained in all publications are solely those of the individual author(s) and contributor(s) and not of MDPI and/or the editor(s). MDPI and/or the editor(s) disclaim responsibility for any injury to people or property resulting from any ideas, methods, instructions or products referred to in the content.