1. Introduction
The incorporation of renewable energy sources and new elements into the energy distribution network signifies a significant challenge within the energy sector. Nevertheless, the introduction of smart grid technology has been identified as a promising resolution to many of these challenges. Smart grids integrate numerous intelligent devices allowing for dynamic load management, real-time monitoring of energy consumption, and energy storage system implementation. Through these functionalities, smart grid technology streamlines energy supply, thereby reducing transmission losses common in conventional one-way power supply systems. Furthermore, smart grid technology decentralizes power supply systems, potentially mitigating power outages during emergencies. Microgrids offer an efficient solution for integrating renewable energy and EVs; however, the amalgamation of these elements presents substantial challenges due to their unpredictable production and consumption patterns. As a result, it is crucial to develop coordinated EV charging strategies to minimize these uncertainties and optimize the usage of renewable energy sources [
1,
2].
1.1. Related Works
Employing renewable energy sources for EV charging has emerged as the most economically and environmentally sustainable approach [
3,
4]. Moreover, EVs can act as a reserve for renewable energy sources by storing excess energy, thereby enhancing their value within the power supply network (V2G) [
5,
6,
7,
8,
9,
10]. This capability makes them a crucial addition to the power supply network and a rapidly expanding area within the mechanical engineering industry. Research [
11] has scrutinized the conceptual design of charging systems that incorporate various cars into a single robust system, with an energy distribution algorithm guiding the energy capacity reservation for multiple cars. A similar approach is explored in [
12], where the authors focus on different charging modes based on the state of charge (SoC) of the battery and the current grid capacity, including the potential for bidirectional power flow between the grid and EVs. An alternative approach presented in [
13] investigates the proportionate distribution between renewable energy sources, EV charging stations, energy storage systems, and the sizing and localization of the entire system. In [
14], the primary objective was the coordination and management of EVs in conjunction with renewable energy sources and the distribution system.
Despite the rapid growth of EVs, their widespread adoption is hindered by limitations such as restricted travel distance, lengthy charging times, and infrastructure constraints [
15,
16,
17,
18,
19]. Increasing their market share requires a heightened public awareness of environmentally friendly transport alternatives, coupled with the reduction of social and territorial inequalities and controlled pricing [
20].
In conclusion, smart grid technology and microgrids are imperative for the effective integration of renewable energy and electric vehicles into the power supply network [
21]. While utilizing renewable energy sources for EV charging is an economical and environmentally friendly strategy, the energy storage capability of electric vehicles makes them an invaluable addition to the power supply network [
22]. However, challenges such as limited range, prolonged charging times, and infrastructure limitations must be surmounted to increase their market share [
23,
24].
1.2. Paper Contributions
This investigation seeks to delineate the impact of smart parking infrastructure on electrical power systems by examining the integration of electric vehicle (EV) charging stations. The evaluation of the ramifications of widespread EV charging stations employed real-world distribution network measurements, applying these data to an array of modeled scenarios which considered variable proportions of EV presence under specific conditions. This study’s scientific novelty resides in the rigorous analysis of EV charging station integration within various operational contexts, providing new insights into power system management.
The investigation encompassed four distinct scenarios designed to examine differing operational conditions. Each scenario was differentiated by the EV charging initiation period. In the first scenario, all EVs commenced charging between the hours of 07:00 and 10:00 and again between 17:00 and 22:00. Subsequent scenarios include: the second scenario, where EV charging primarily occurs during low-tariff periods; the third scenario, which allows a broad window for charging initiation; and the fourth scenario, where all EVs initiate charging concurrently. The scientific novelty of this paper lies in the unique insights provided by these scenarios, potentially paving the way to optimizing the EV charging process and enhancing smart parking system efficiency.
Furthermore, the study corroborates that, based on simulation results, smart parking represents a viable solution for utilities contending with the increasing prevalence of EV usage. It also highlights that the deployment of such technological solutions does not exert significant stress on the network, thereby potentially mitigating the need for costly renovations of low-voltage power lines.
Another scientific novelty of this paper is the proposition that the establishment of smart parking in areas with a high concentration of renewable energy sources could potentially yield positive impacts on the electrical grid. This could significantly reduce, if not eliminate, electrical flows from low- to medium-voltage networks. Moreover, the implementation of the vehicle-to-grid (V2G) system could provide utility companies with an additional source of reserve power, aiding in the management of peak loads and ensuring power supply during emergencies. This could potentially constitute an efficient method for harnessing the battery capacity of EVs, offering a cost-effective solution for power provision.
2. Development of a Simulation Model Using Computational Techniques
A parking facility designed exclusively for a corporation located in eastern Slovakia also allows public access during non-business hours. The top level of the parking structure will feature a steel frame supporting the installation of photovoltaic panels with a cumulative capacity of 140 kW.
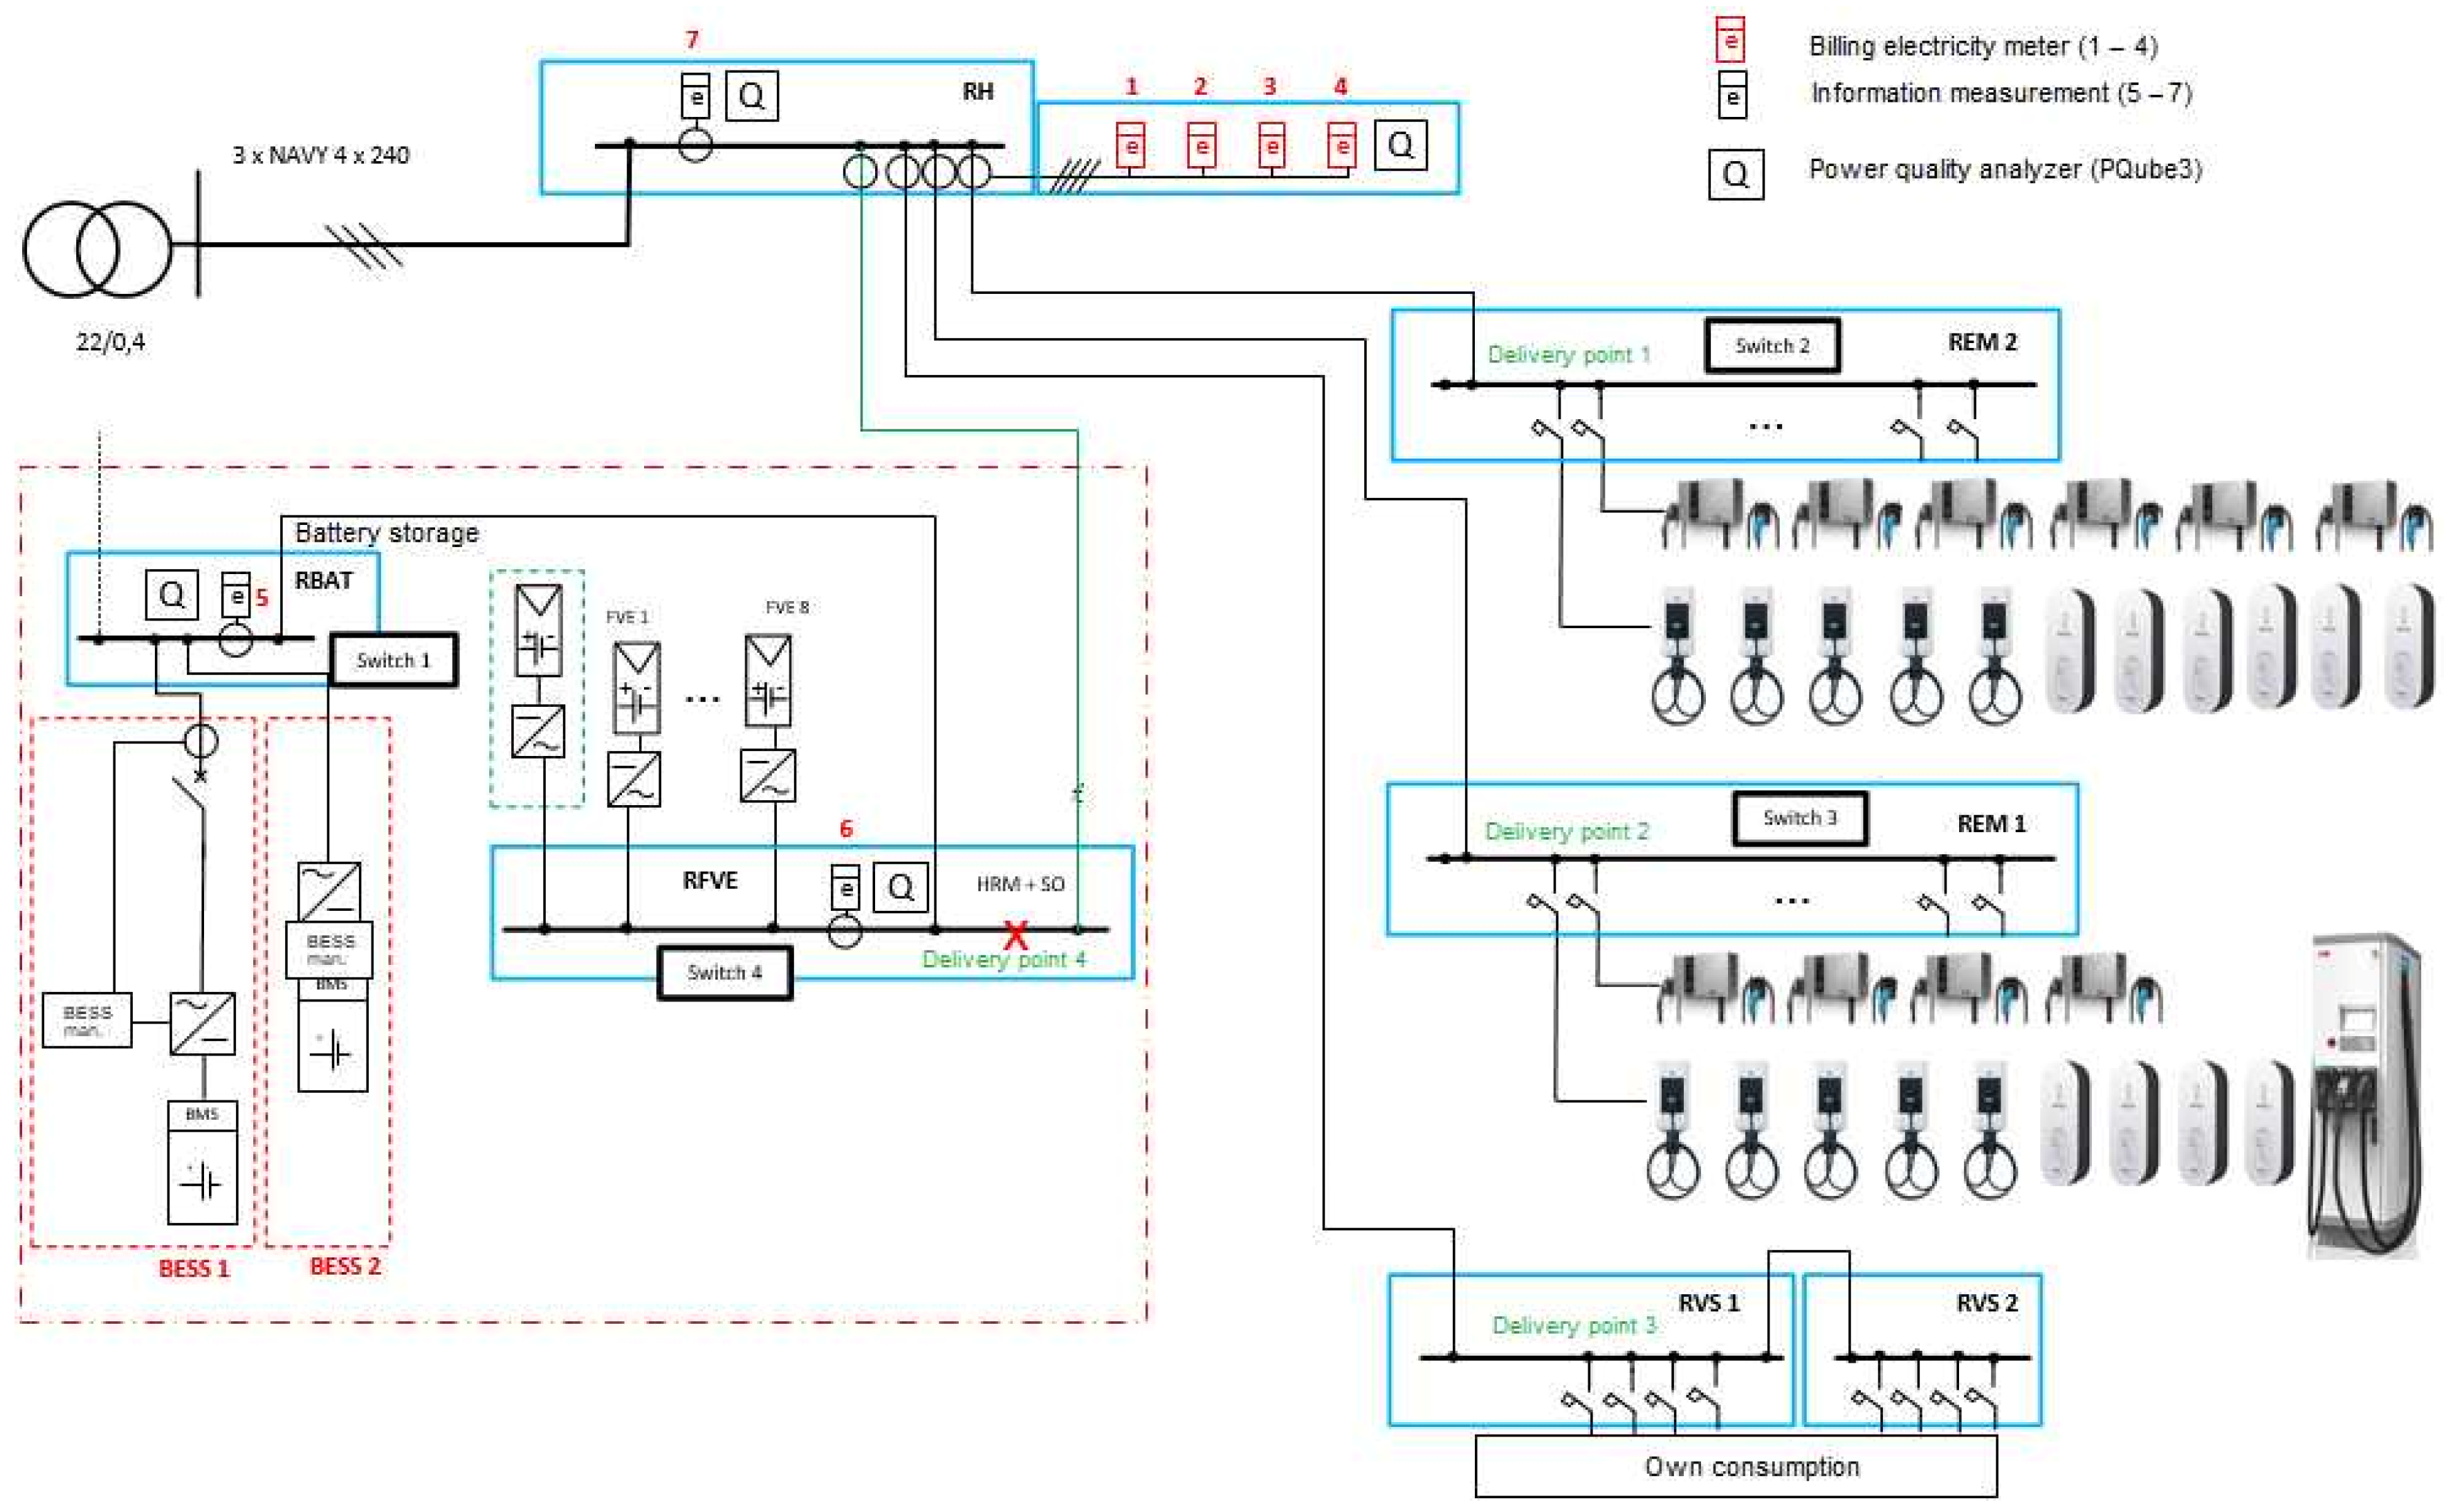
Figure 1 shows the visualization of the smart parking. The structural network of the parking garage is shown in
Figure 2. This endeavor seeks to harness solar energy to power the building, thus significantly reducing the facility’s carbon footprint. The solar panels, acting as a green energy source, will curtail the need for traditional electricity sources, thereby decreasing operational costs and fostering sustainability within the vicinity. Implementing renewable energy sources is a pivotal move in minimizing commercial buildings’ carbon footprint, thereby setting a precedent for future endeavors. Furthermore, this project is expected to bolster the company’s reputation as a green-conscious entity dedicated to sustainable practices. The photovoltaic installation serves not only as a power generator but also contributes to the aesthetic appeal of the building, underscoring the company’s commitment to sustainability. This initiative may inspire other businesses and individuals to invest in renewable energy sources, thereby promoting clean energy usage.
2.1. Electric Vehicles
To capture the operational nuances of a parking facility accurately, our research team incorporated six distinctive electric vehicle models into the simulation. This approach offers a comprehensive representation of diverse charging profiles, charging potentialities, and battery capacities. The rationale behind such a diverse selection lies in the unique technical specifications possessed by each electric vehicle model, significantly impacting charging durations and energy utilization.
Table 1 furnishes the specific technical parameters such as battery capacity, charging voltage, and charging speed for each EV model. With this diverse assortment of electric vehicle models, we endeavored to provide a holistic analysis of the parking facility’s energy demands and charging requisites. This methodology facilitates accurate prediction of the parking facility’s functionality under different scenarios, informing decisions regarding charging infrastructure and energy management strategies.
In instances where a 3-phase charging system charges an EV, it was observed that specific models like Volkswagen e-Golf and Škoda CITIGOe IV generate a load for only 2 out of 3 available phases. In contrast, models like Nissan Leaf, Renault Kangoo Maxi ZE, among others, create a load for a single phase. This variance in load generation can be attributed to the unique charging behavior of individual EVs. Consideration of this factor is pivotal during charging infrastructure design and implementation, as it influences the overall efficiency and efficacy of the charging process. Therefore, meticulous attention to the technical specifications and charging behavior of electric vehicles is recommended when designing charging systems, to ensure optimal performance and circumvent potential complications.
2.2. Electric Vehicle Charging Stations
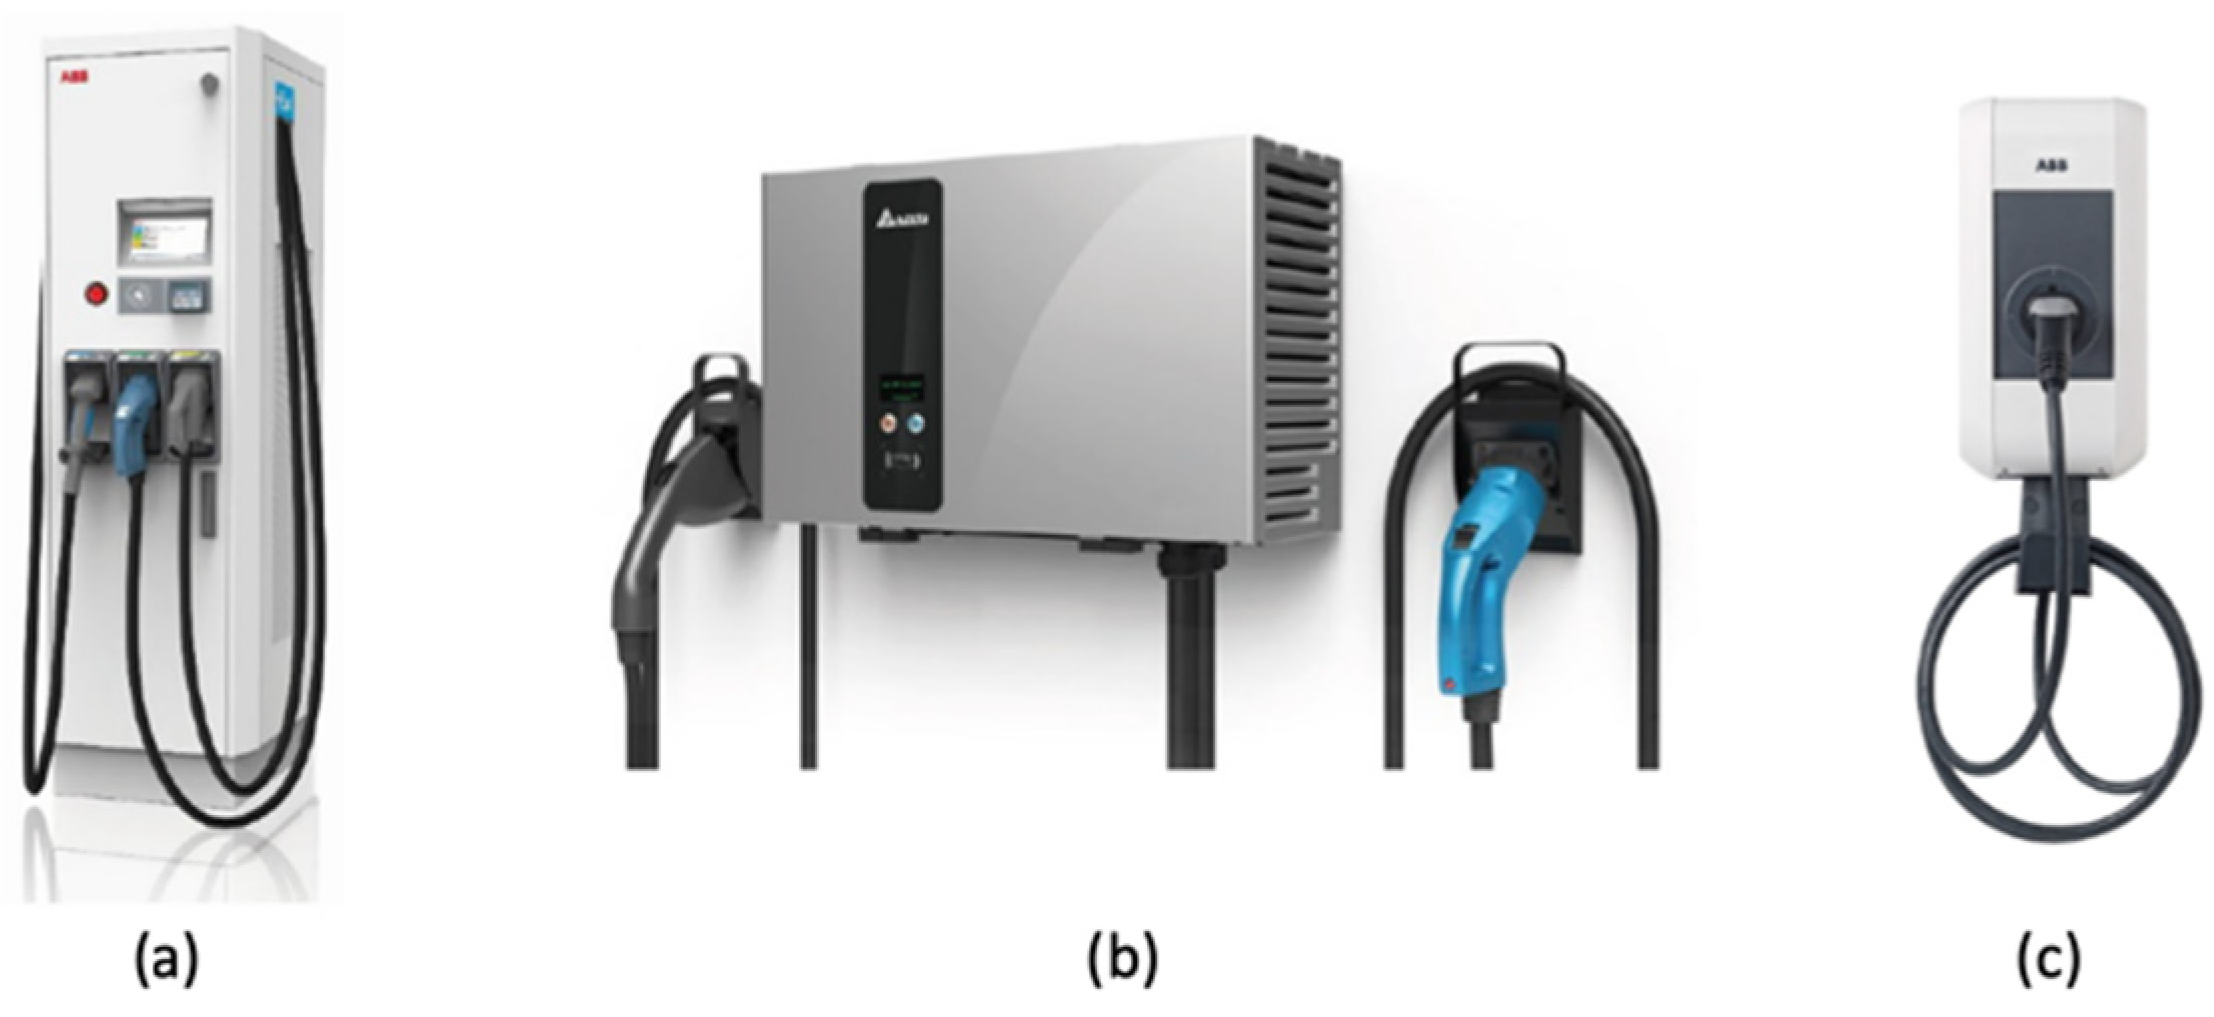
In order to replicate the functioning of the parking facility, a variety of electric vehicle charging equipment was selected for simulation, including AC 22 kW, DC 25 kW, and DC 50 kW chargers, see
Figure 3. These chargers were chosen due to their disparate charging speeds and power capacities.
Table 2 presents detailed information about the quantity and total power of each type of charger utilized. Additionally,
Table 3 outlines the crucial technical specifications of the selected charging equipment. The charger selection was driven by the objective of providing an inclusive and accurate portrayal of the charging equipment required for efficient parking facility operation. By simulating the usage of diverse chargers, we aimed to gain a comprehensive understanding of how these different charging systems would influence the overall functionality of the parking facility, including the availability of charging options for different types of electric vehicles.
2.3. Charging Characteristics
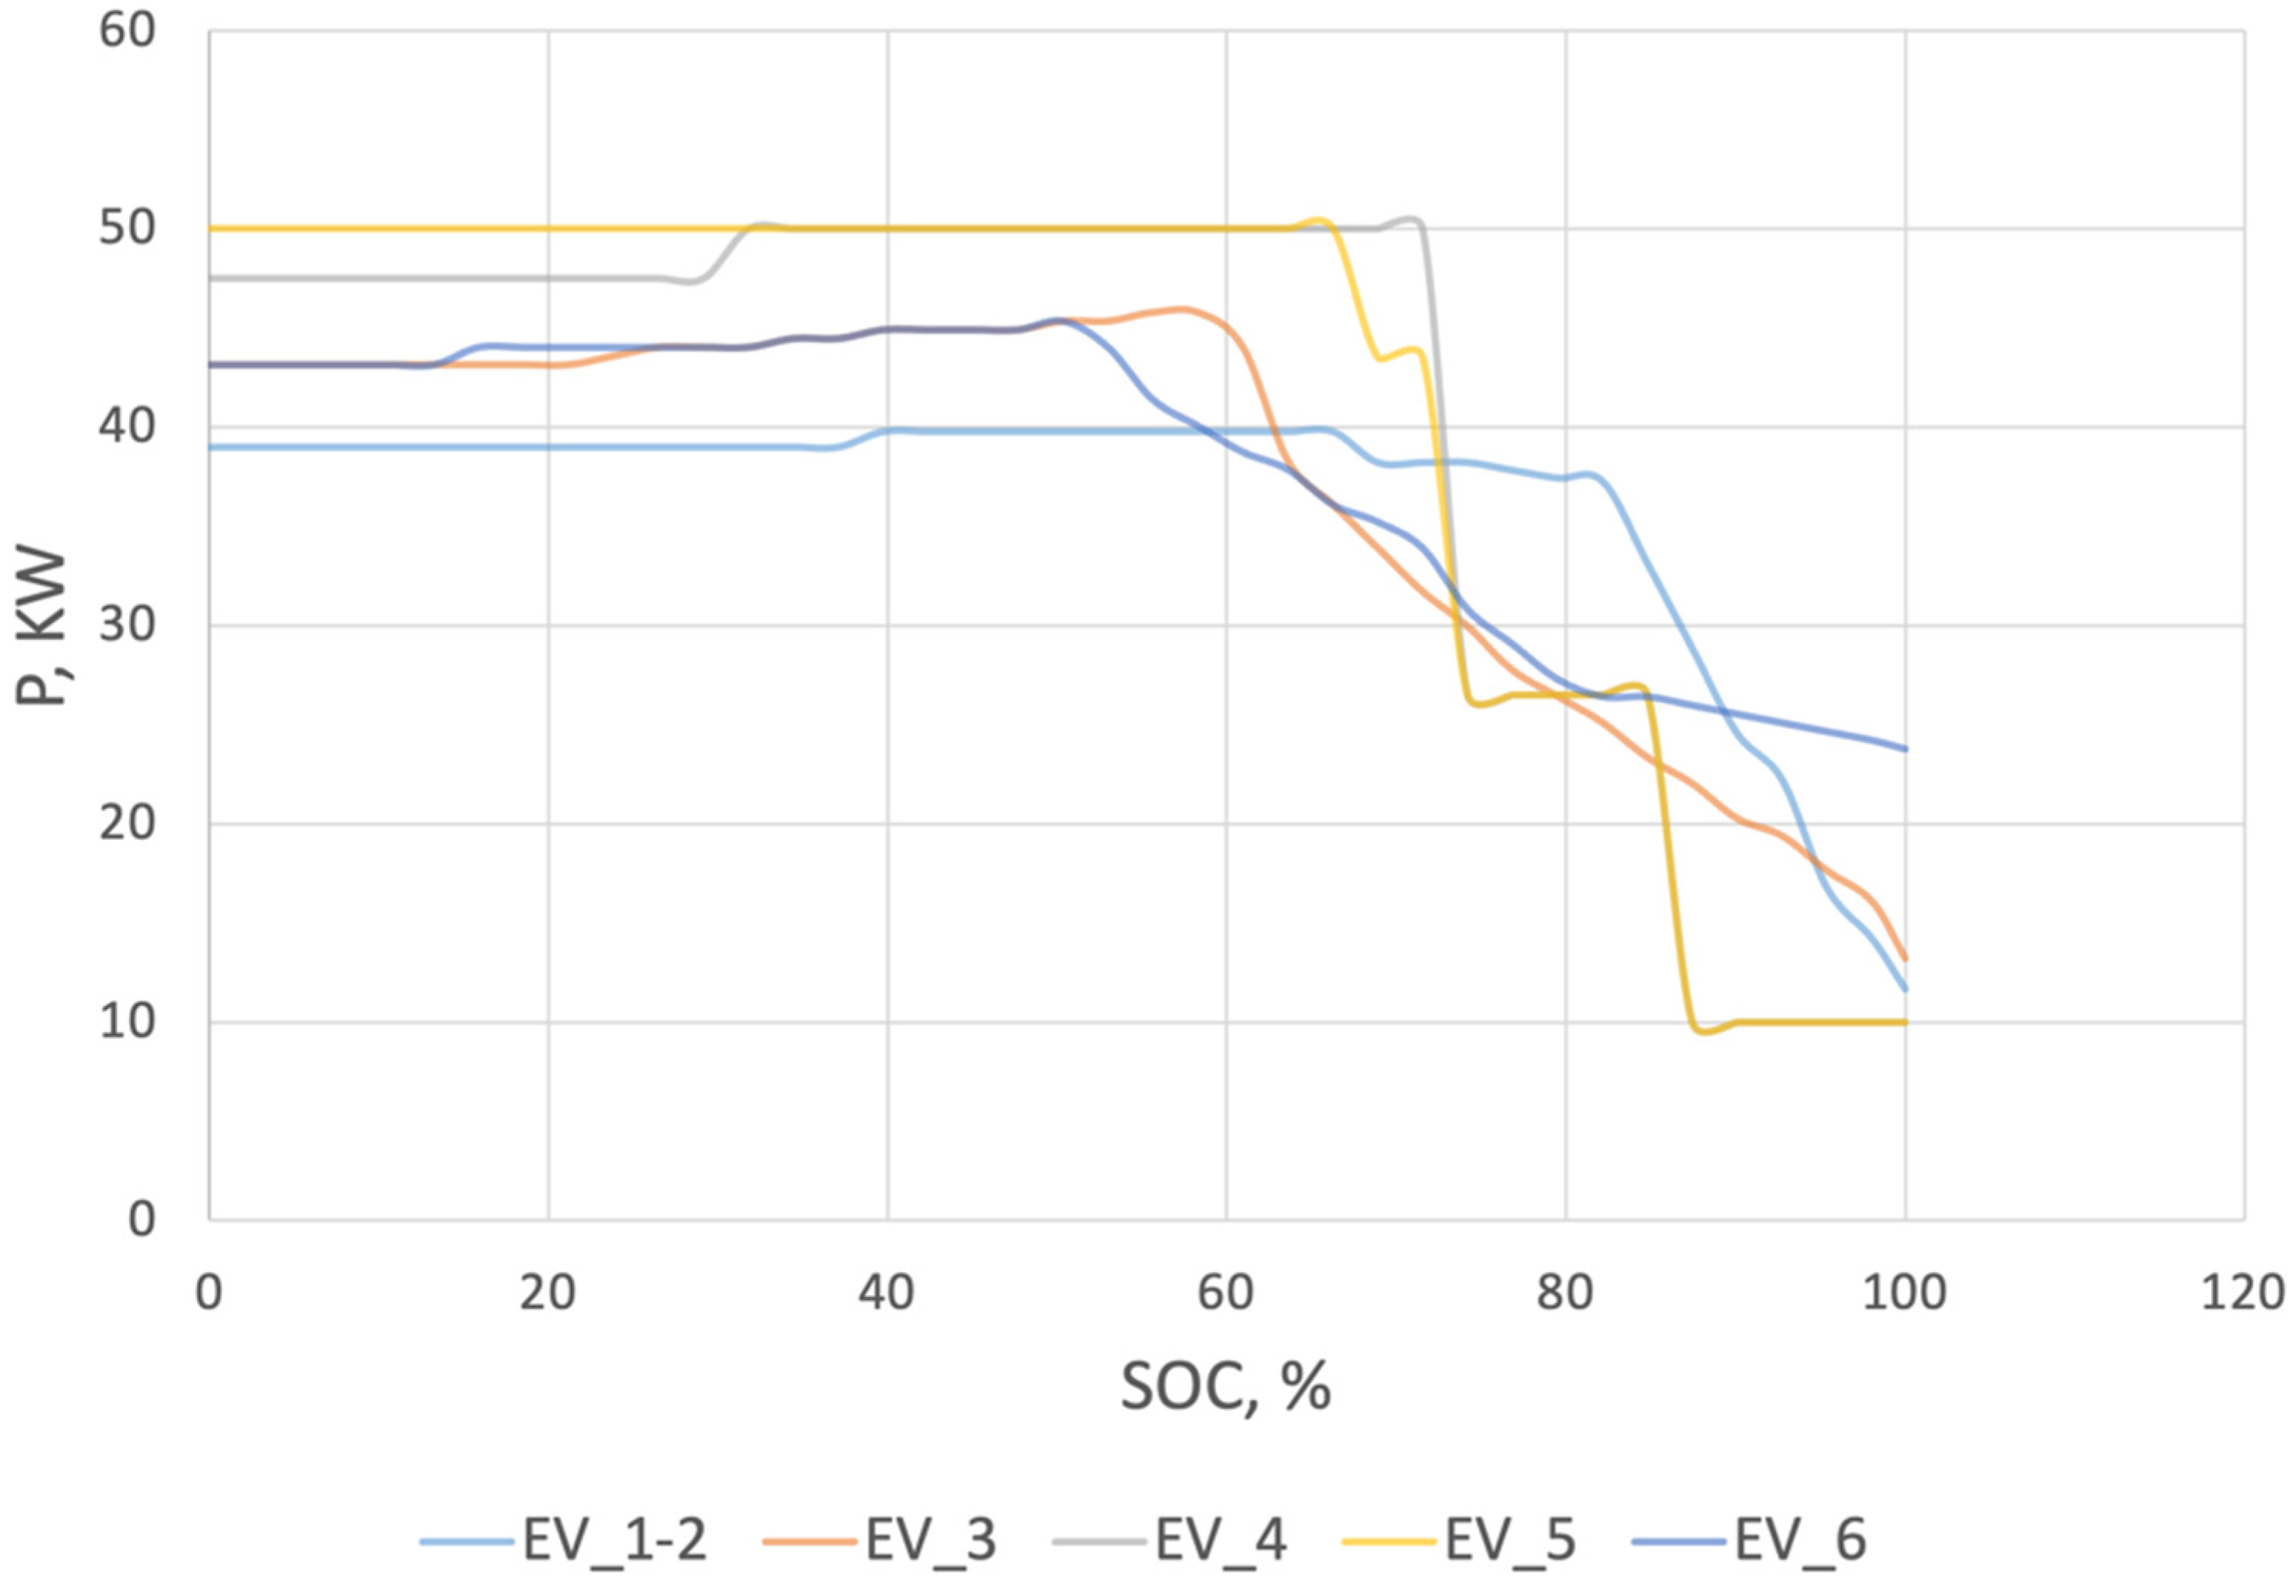
For a precise simulation of the electric vehicle charging process, it is crucial to factor in the variability in EV battery charging power. Addressing this complexity, this study employed the charging profiles of electric vehicles accessible in public databases like Fastned [
25,
26]. These profiles were instrumental in the formulation of the charging algorithms, visually represented in
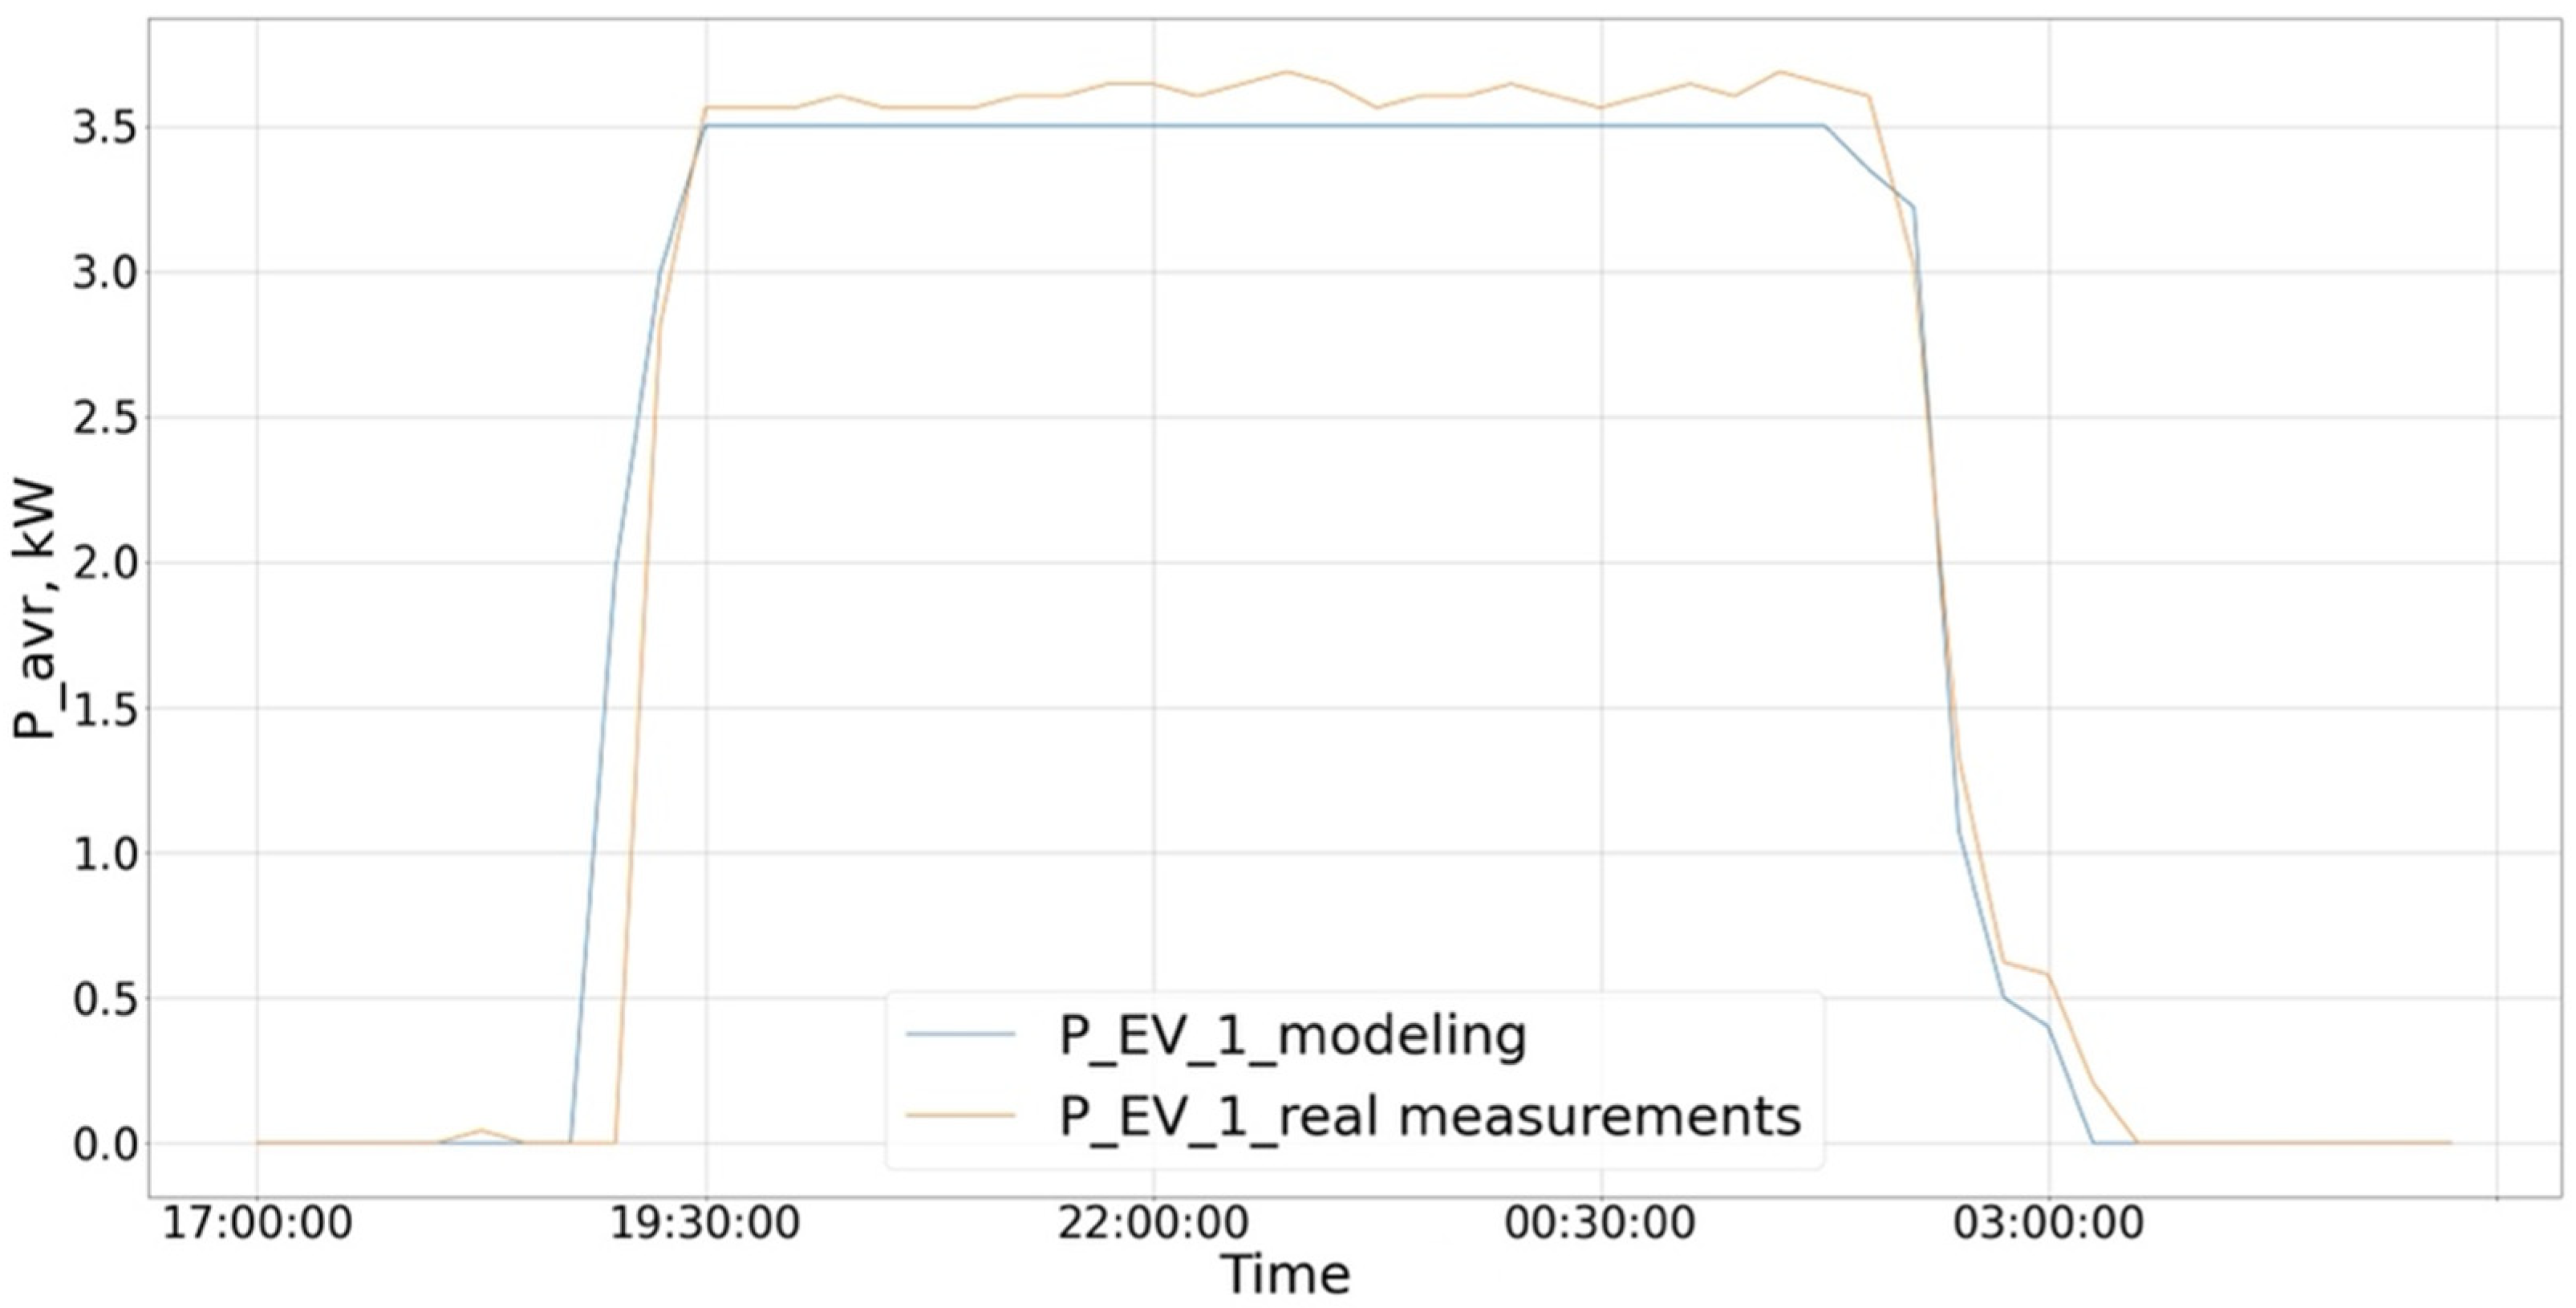
Figure 4. To guarantee algorithmic accuracy, measurements were also performed on an actual Volkswagen e-Golf electric car. These results were juxtaposed with the simulated charging profile, as illustrated in
Figure 5. The comparative analysis affirmed the algorithm’s precision in describing the authentic charging process. This method ensured that the simulation accurately encapsulates the charging behavior of tangible electric vehicles.
2.4. Parameters of Photovoltaics
To construct the algorithm, a solar panel from Solar Company, specifically the PV Solar Module MD P60PX 275 W (polycrystalline), was employed. Its technical specifications are enumerated below. It is anticipated that about 520 of these modules will be deployed in the parking lot, which amounts to a total power generation of 140 kW. The solar modules are divided into four groups, each yielding 35 kW of power.
Technical specifics for the PV Solar Module MD P60PX 275 W (polycrystalline) used for the algorithm are as follows [
30]:
Maximum power (Pmax): 275 W;
Voltage at maximum power (Vmpp): 31.4 V;
Current at maximum power (Impp): 8.76 A;
Open circuit voltage (Voc): 38.2 V;
Short circuit current (Isc): 9.25 A.
The photovoltaic modules are strategically placed on the top level of the parking house within a steel structure. These panels, doubling as roofing, can generate a cumulative electricity of 140 kW. This setup will empower the parking house to utilize solar power to cater to its electricity needs.
3. Establishing Charging Profiles for Electric Vehicles
To simulate a smart parking system, charging patterns of electric vehicles throughout the day serve as a critical factor. Two prevalent methodologies exist to scrutinize the traveling and charging behavior of a multitude of electric cars. The first involves thorough testing of electric vehicles, using the resultant data to predict energy consumption. The second relies on simulating the EV count and employing the model’s output as an estimate of EV energy utilization. In this method, two distinct approaches can be delineated: deterministic and stochastic modeling [
31]. Deterministic modeling does not account for random effects, while stochastic modeling handles probabilistic processes and occurrences by examining multiple implementations of random processes and estimating their average traits.
As the simulation of charging profiles for EVs entails numerous random variables like arrival/departure times at the parking lot, daily travel distance, car type, and charging commencement time, the stochastic modeling approach was adopted. This method has proven to be efficient in prior research [
32,
33,
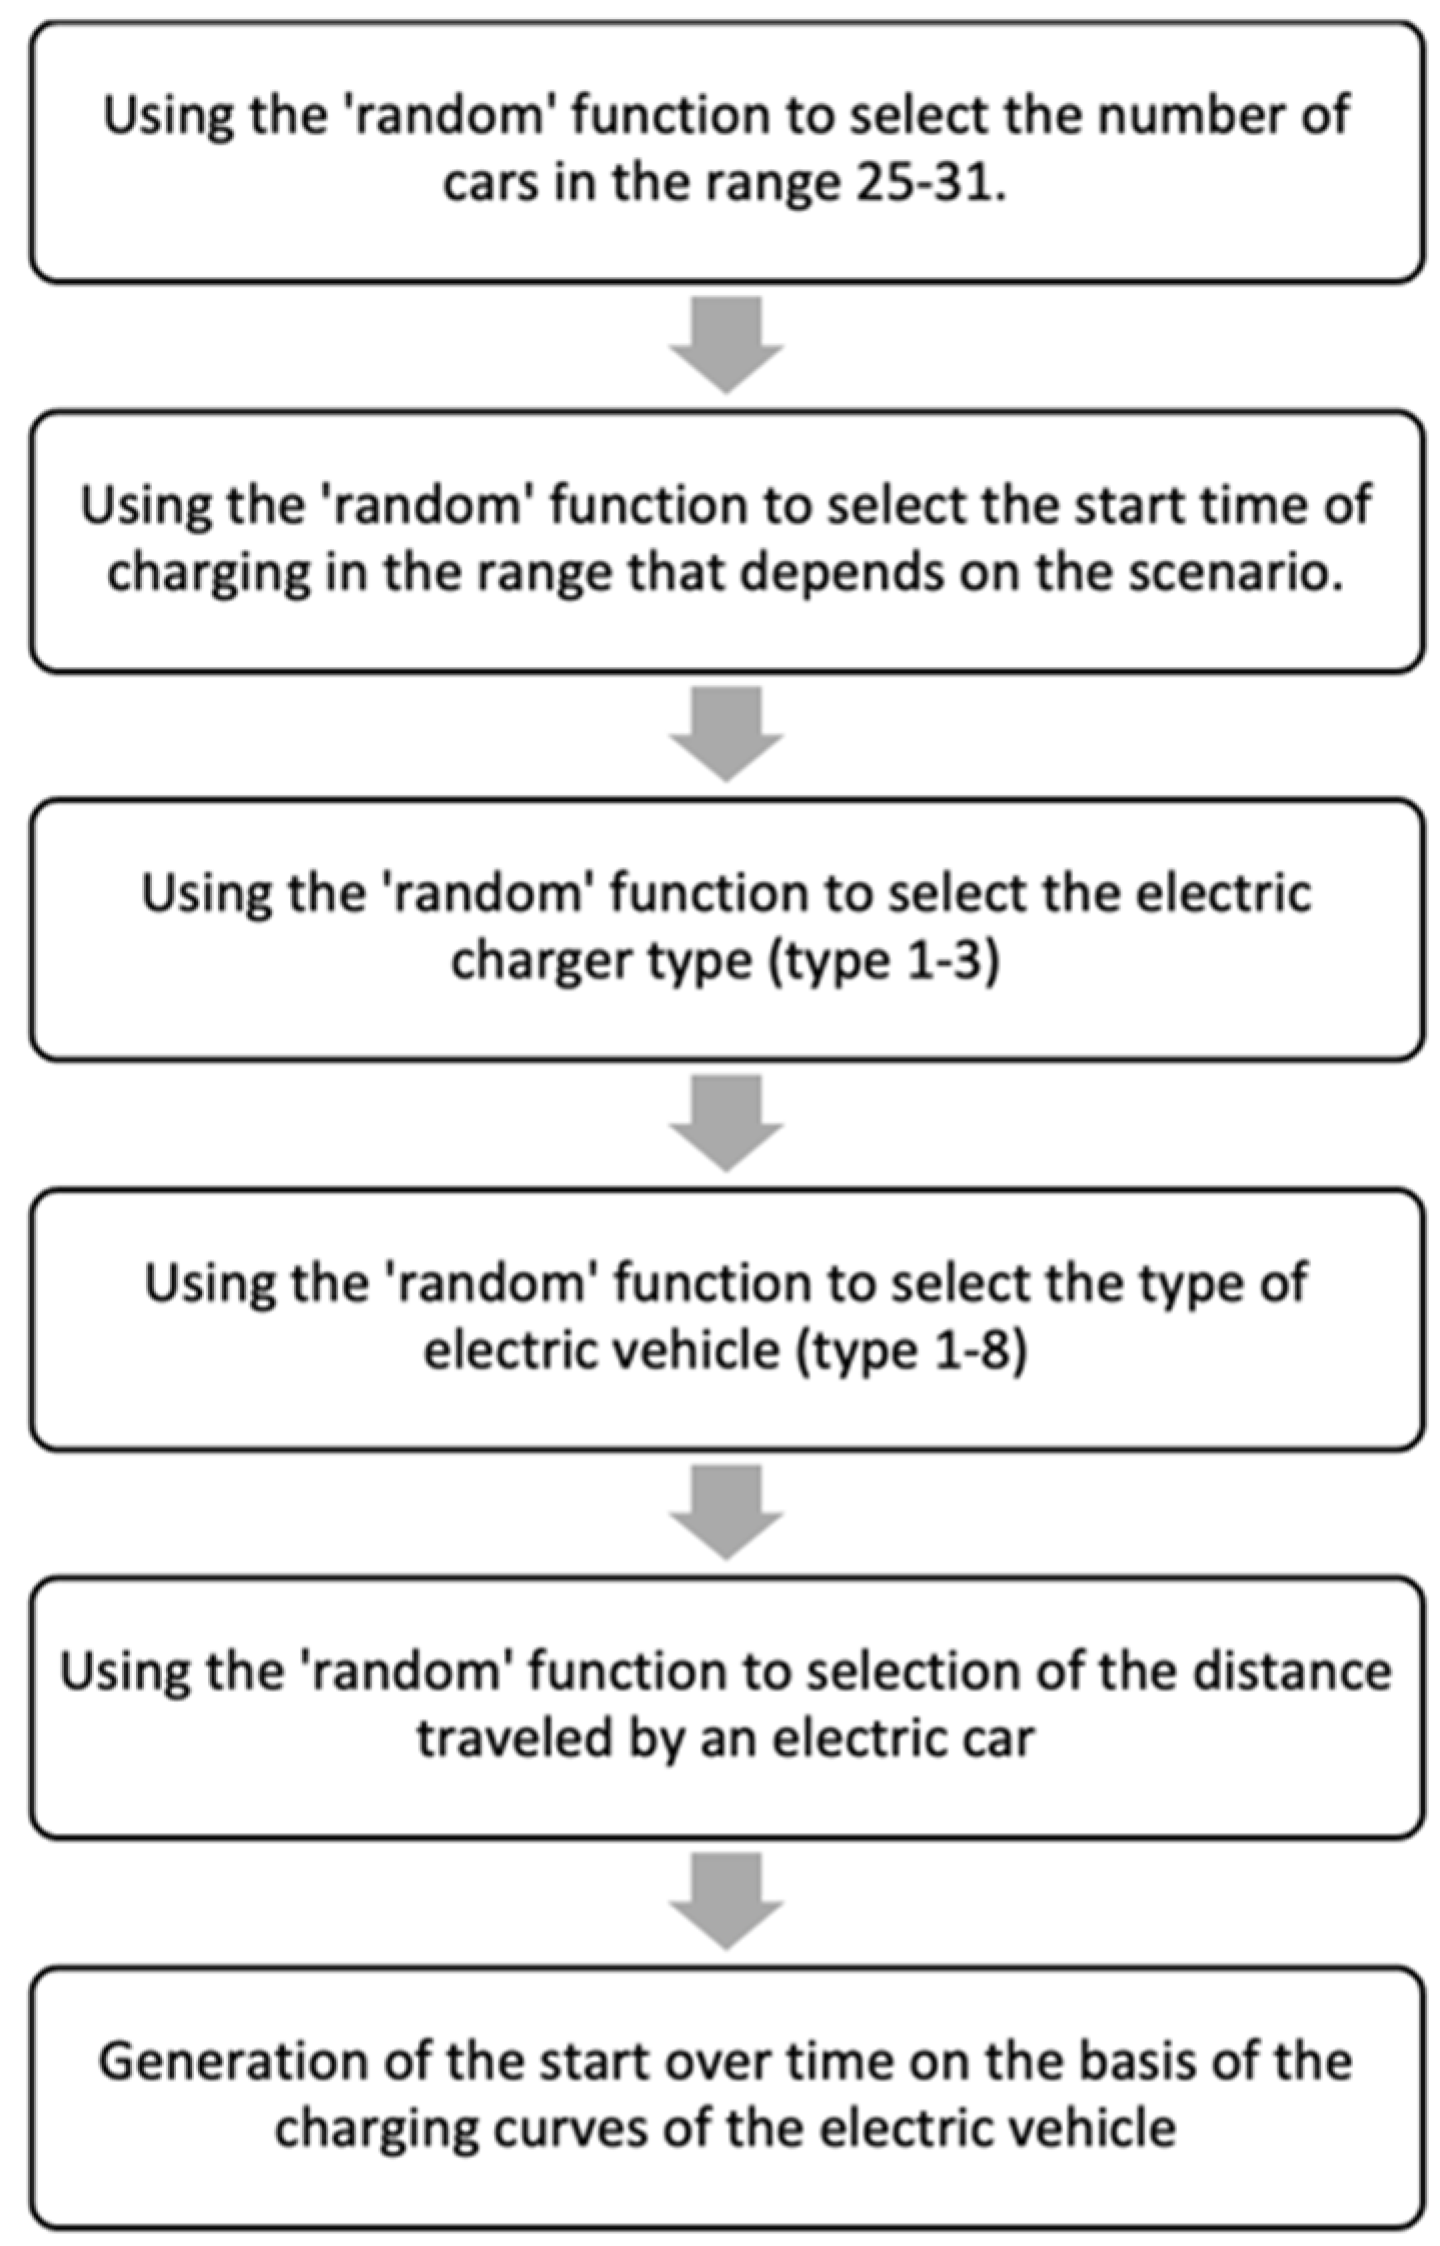
34]. To formulate charging profiles for EVs, a random number generator employing the Monte Carlo method was utilized to simulate random variables such as travel distance, EV type, charging start time, and type of electric charger.
Input data sourced from various research papers [
35,
36,
37,
38,
39,
40] served as a basis for this study. Based on this information, the daily travel distance of an electric car was projected to be between 20 and 40 km. The most probable charging commencement times were between 7:30 and 10:00 in the morning and between 16:30 and 21:30 in the evening.
Four distinct scenarios were conceived to analyze varying working conditions, with each differing in the charging start period. The data for these scenarios were gleaned from real measurements from a similar parking house. In scenario 1, all electric vehicles initiate charging between 7:00 and 10:00 in the morning and from 17:00 to 22:00 in the evening. The other scenarios include: scenario 2, where EVs charge predominantly during low-tariff periods; scenario 3, where EVs have a broad window to start charging; and scenario 4, where all EVs begin charging simultaneously. Detailed accounts of each scenario are provided in
Table 4. The findings from these scenarios can contribute to optimizing the charging process and enhancing the efficiency of the smart parking system.
Figure 6 presents the algorithmic schematic diagram designed to fabricate load profiles for electric vehicles.
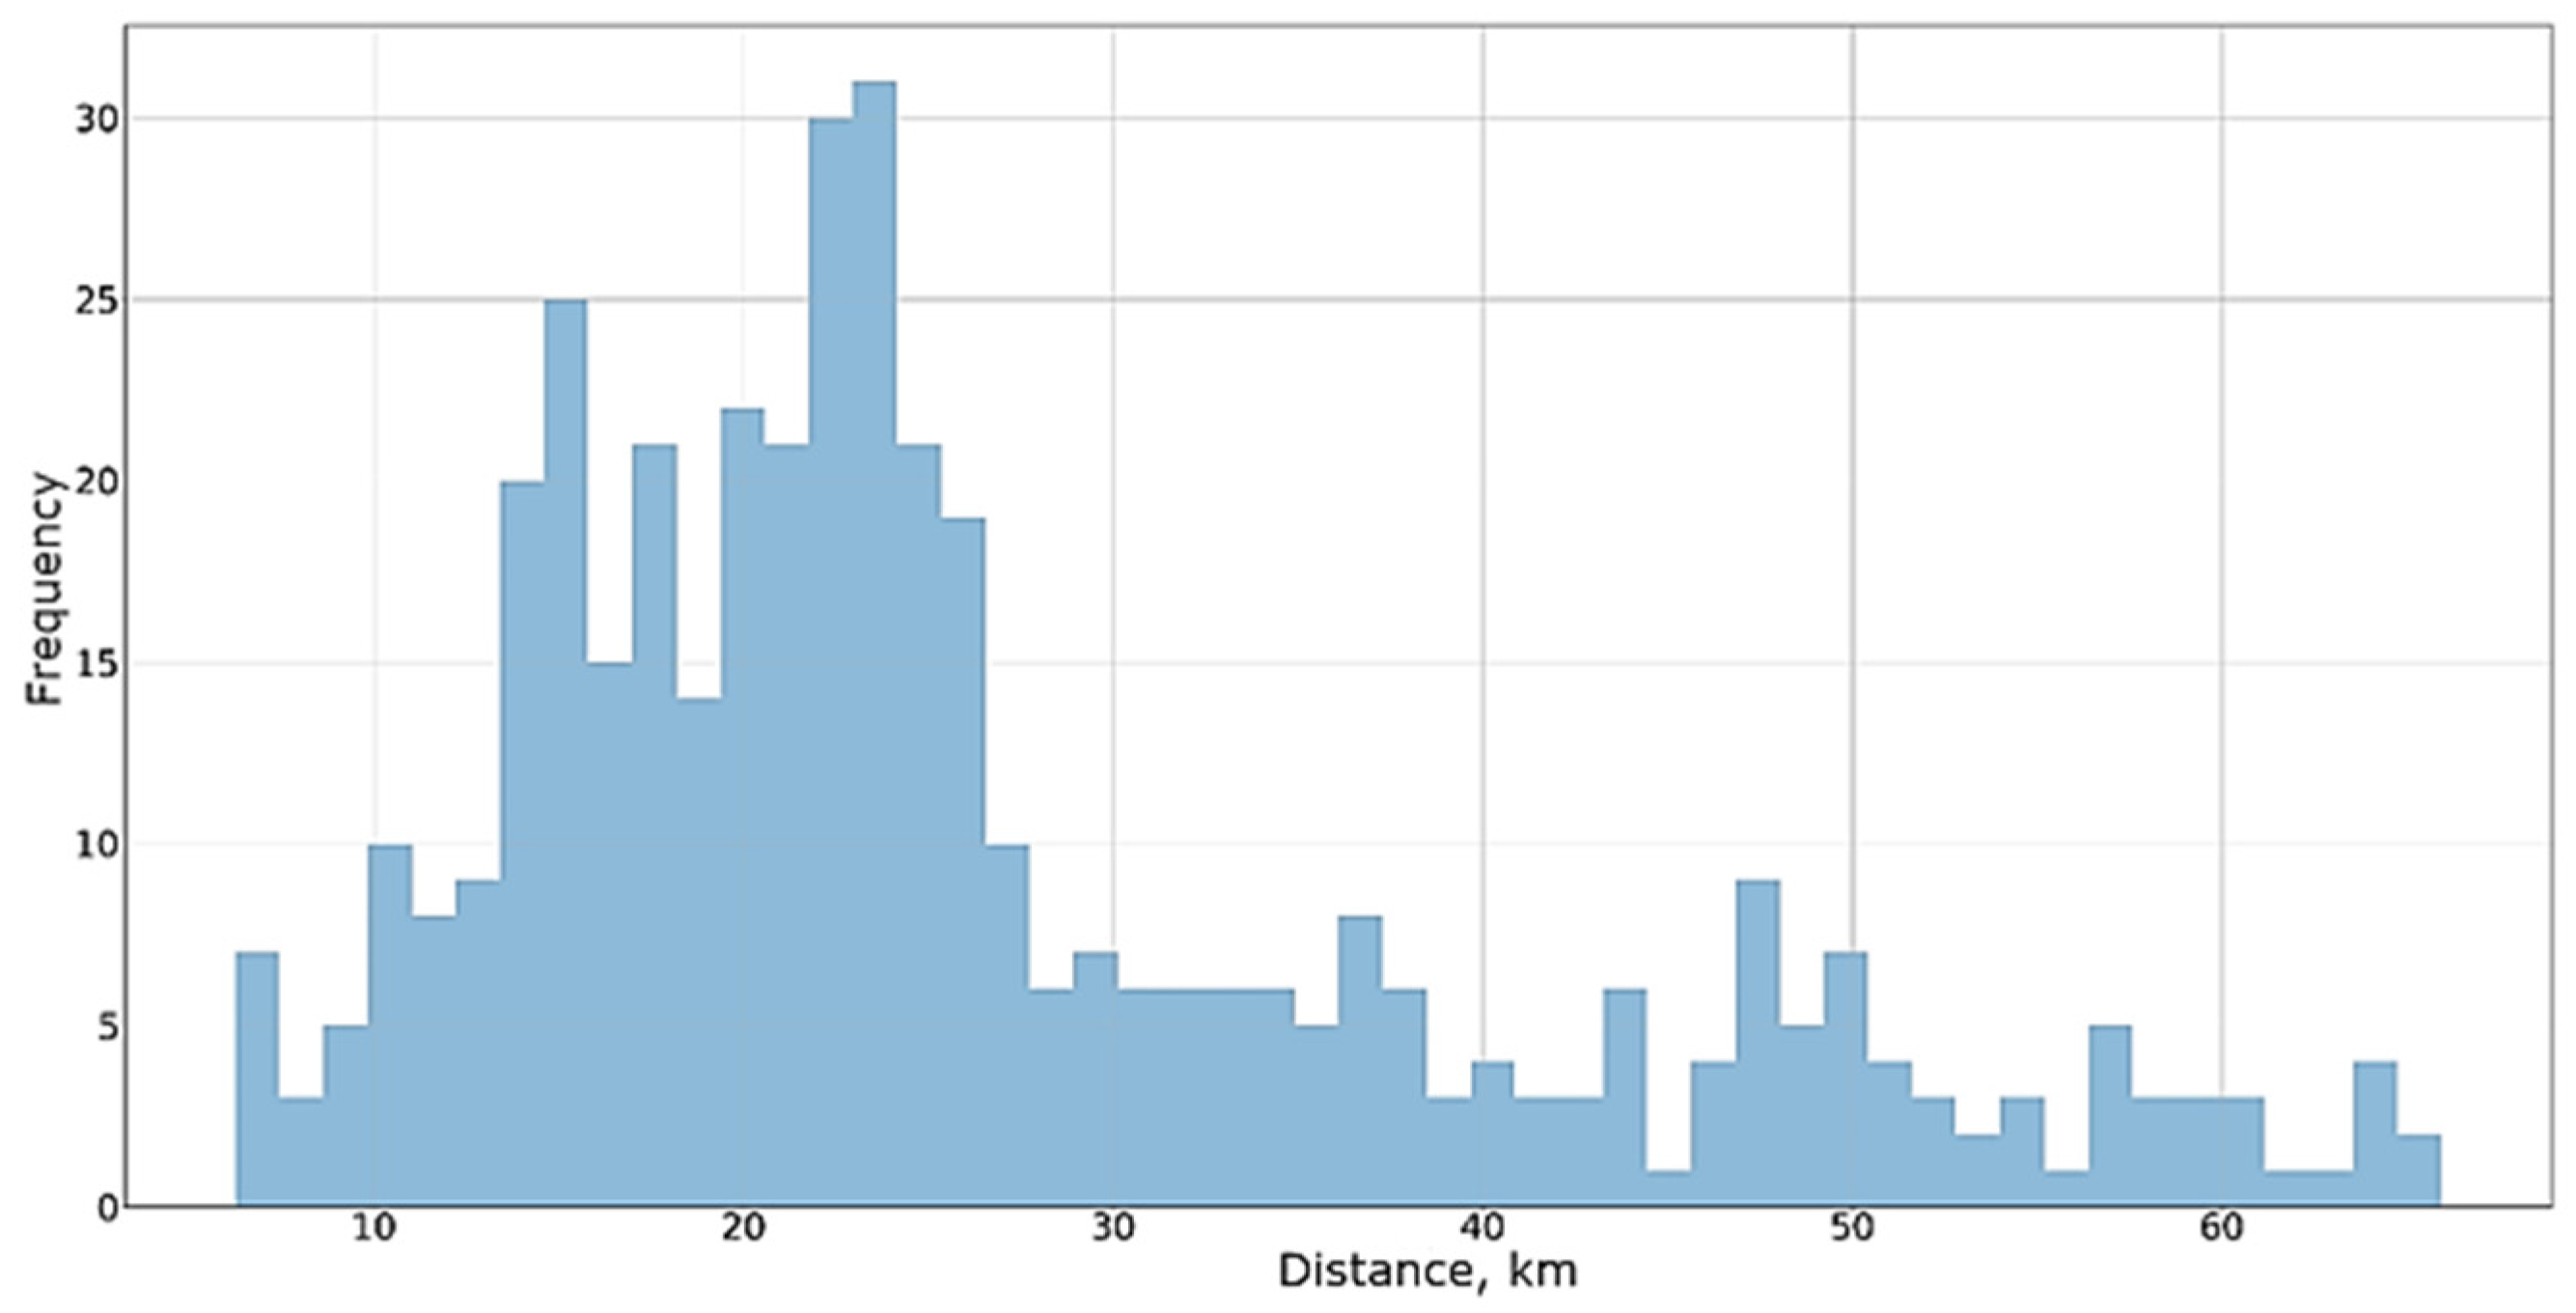
Figure 7 visualizes the outcome from the implemented algorithm, portraying the range distribution of an electric vehicle as it relates to the distance traversed.
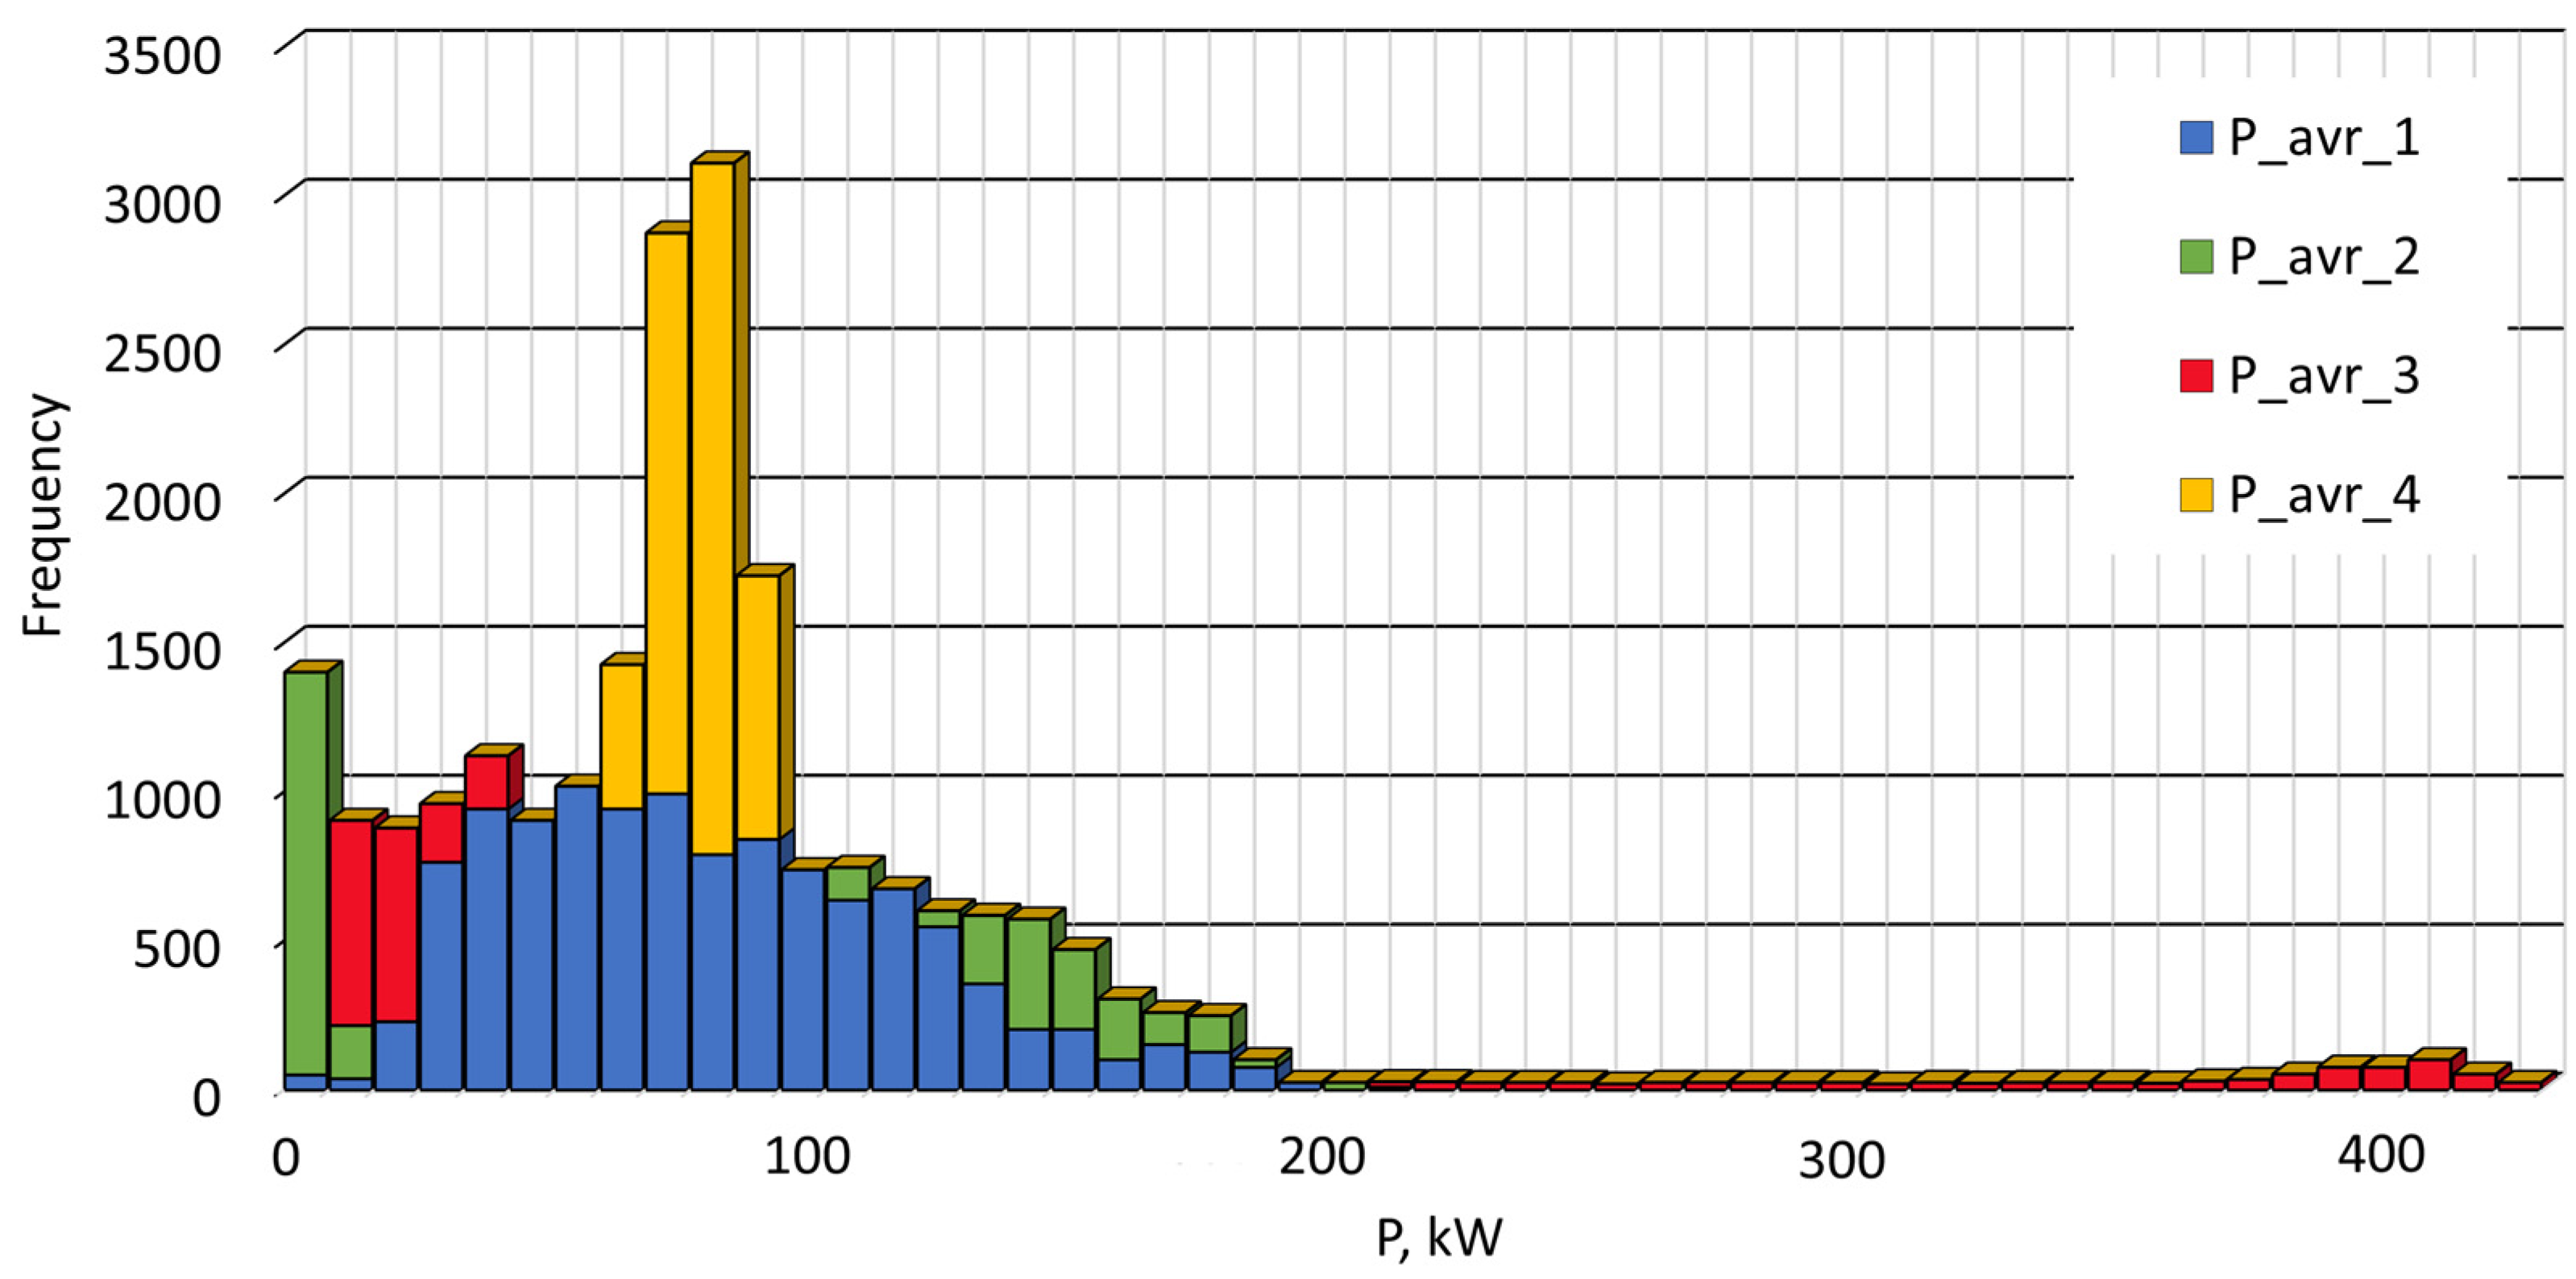
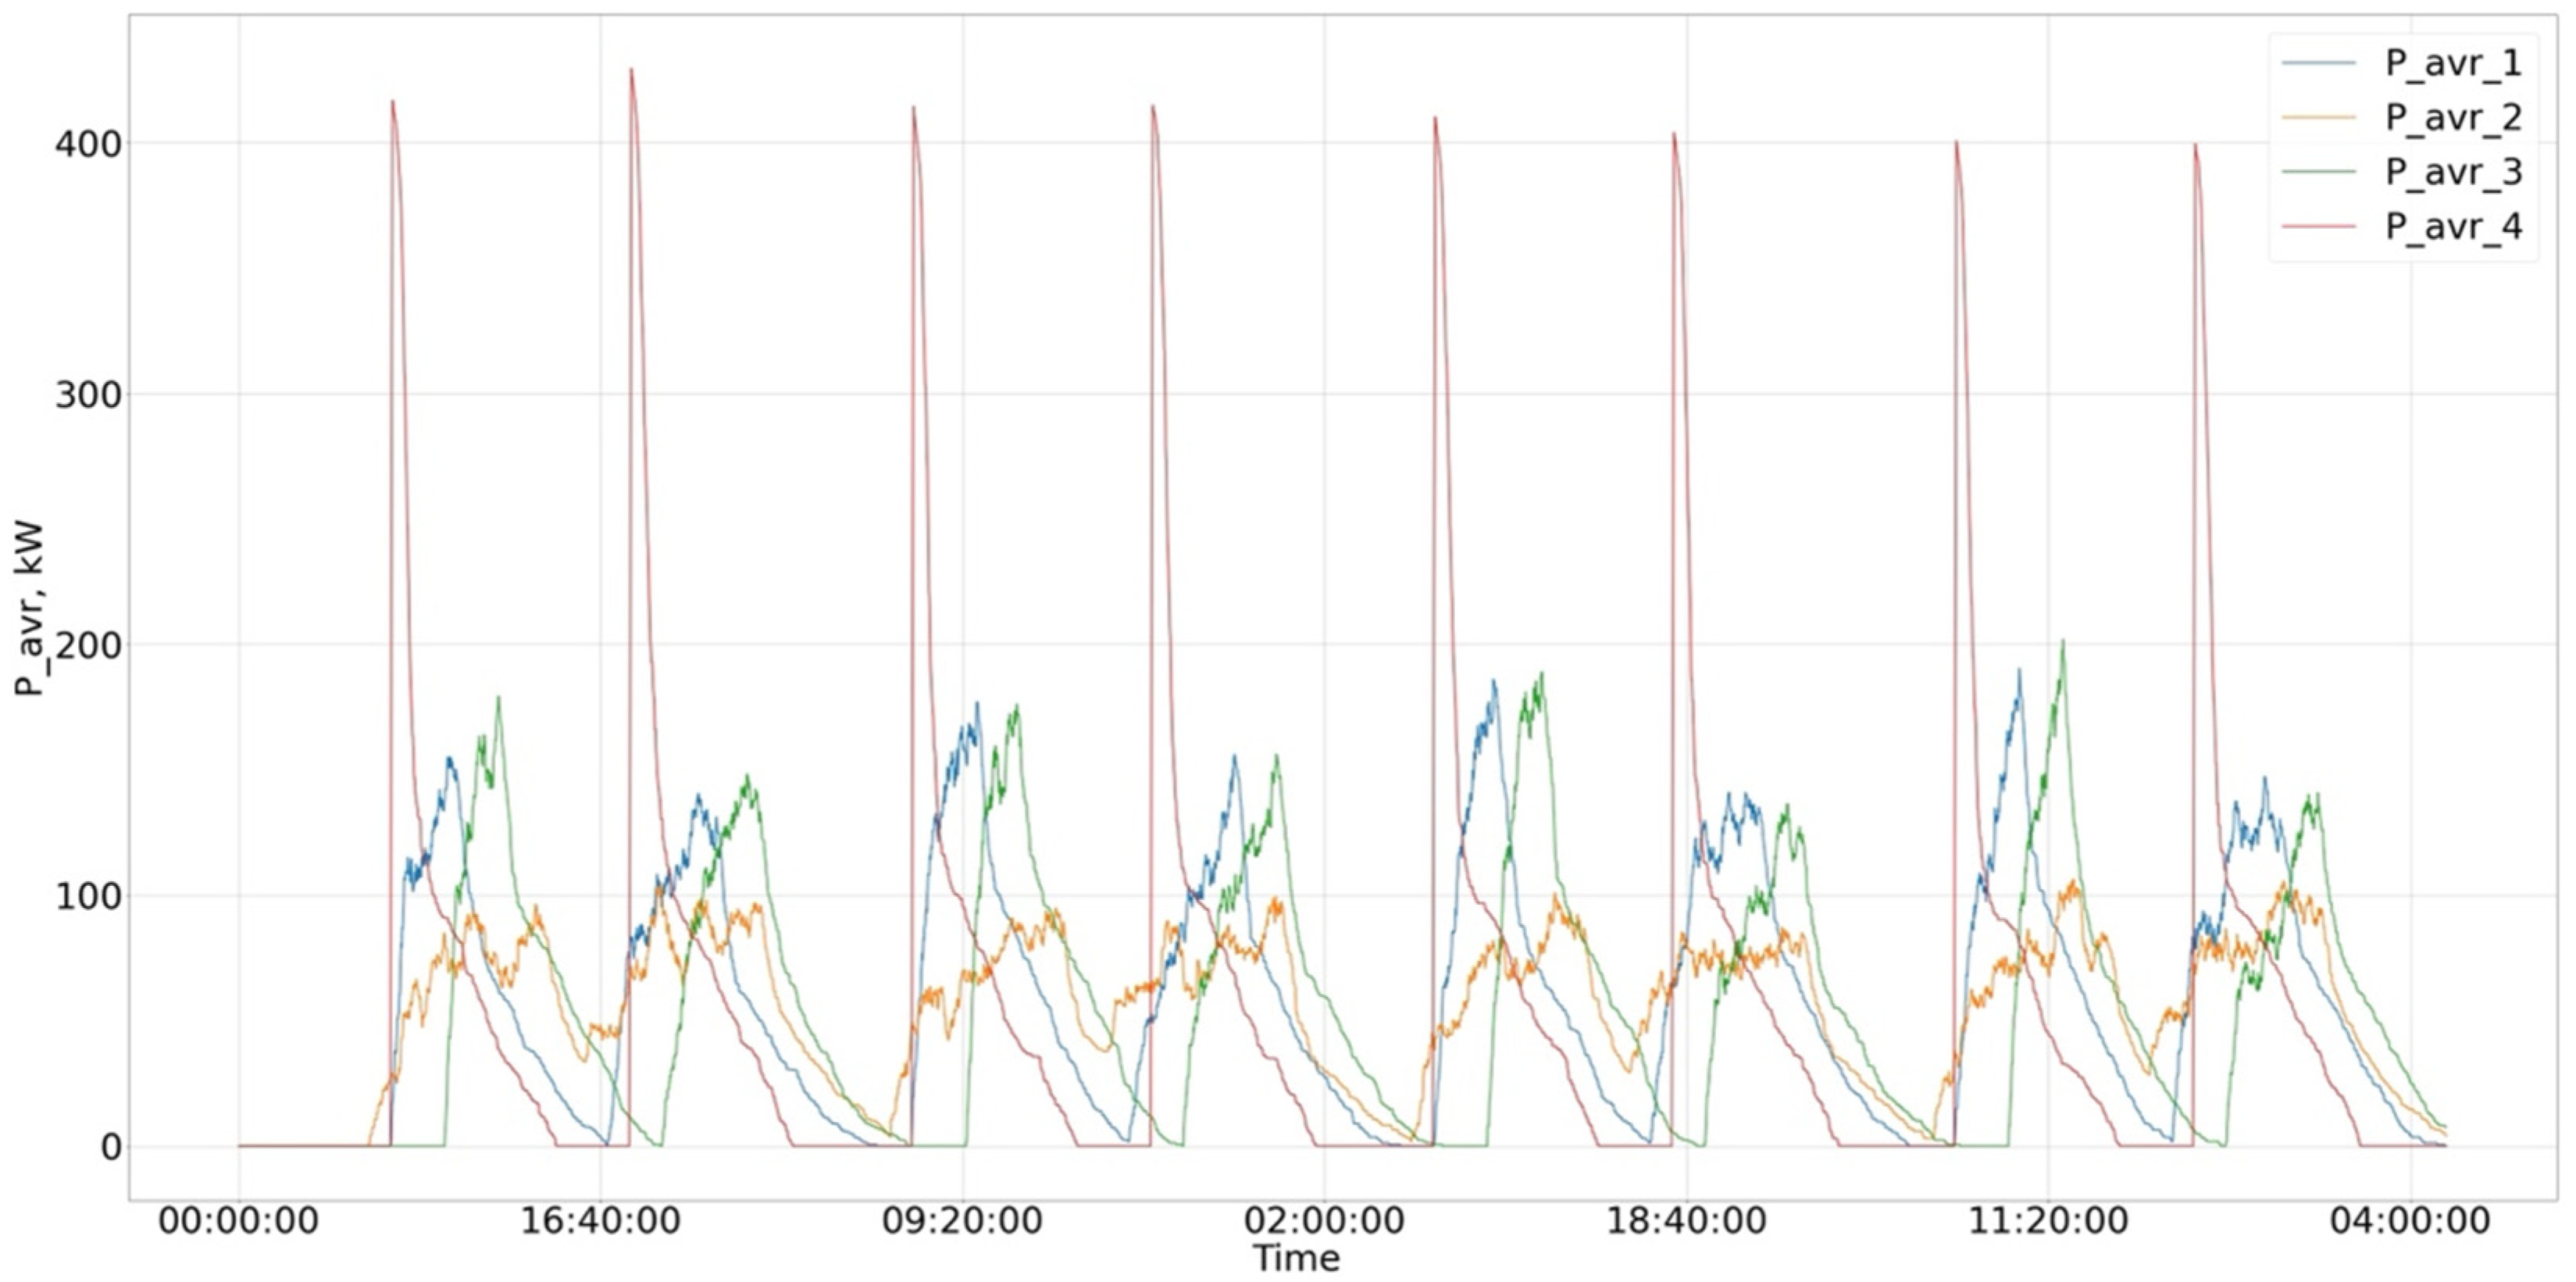
Figure 8 and
Figure 9 depict the distribution of load values across various scenarios. In scenario 4, where all electric vehicles initiate charging concurrently, the algorithm resulted in the most substantial load. This outcome is predictable as charging all vehicles simultaneously imposes a significant demand on the power grid. In contrast, the other scenarios displayed analogous load profiles, suggesting that staggering the charging times would yield a more balanced load distribution. Cumulatively, these analyses underscore the necessity of judicious scheduling for electric vehicle charging to prevent grid overloads, ensuring a reliable and stable power supply.
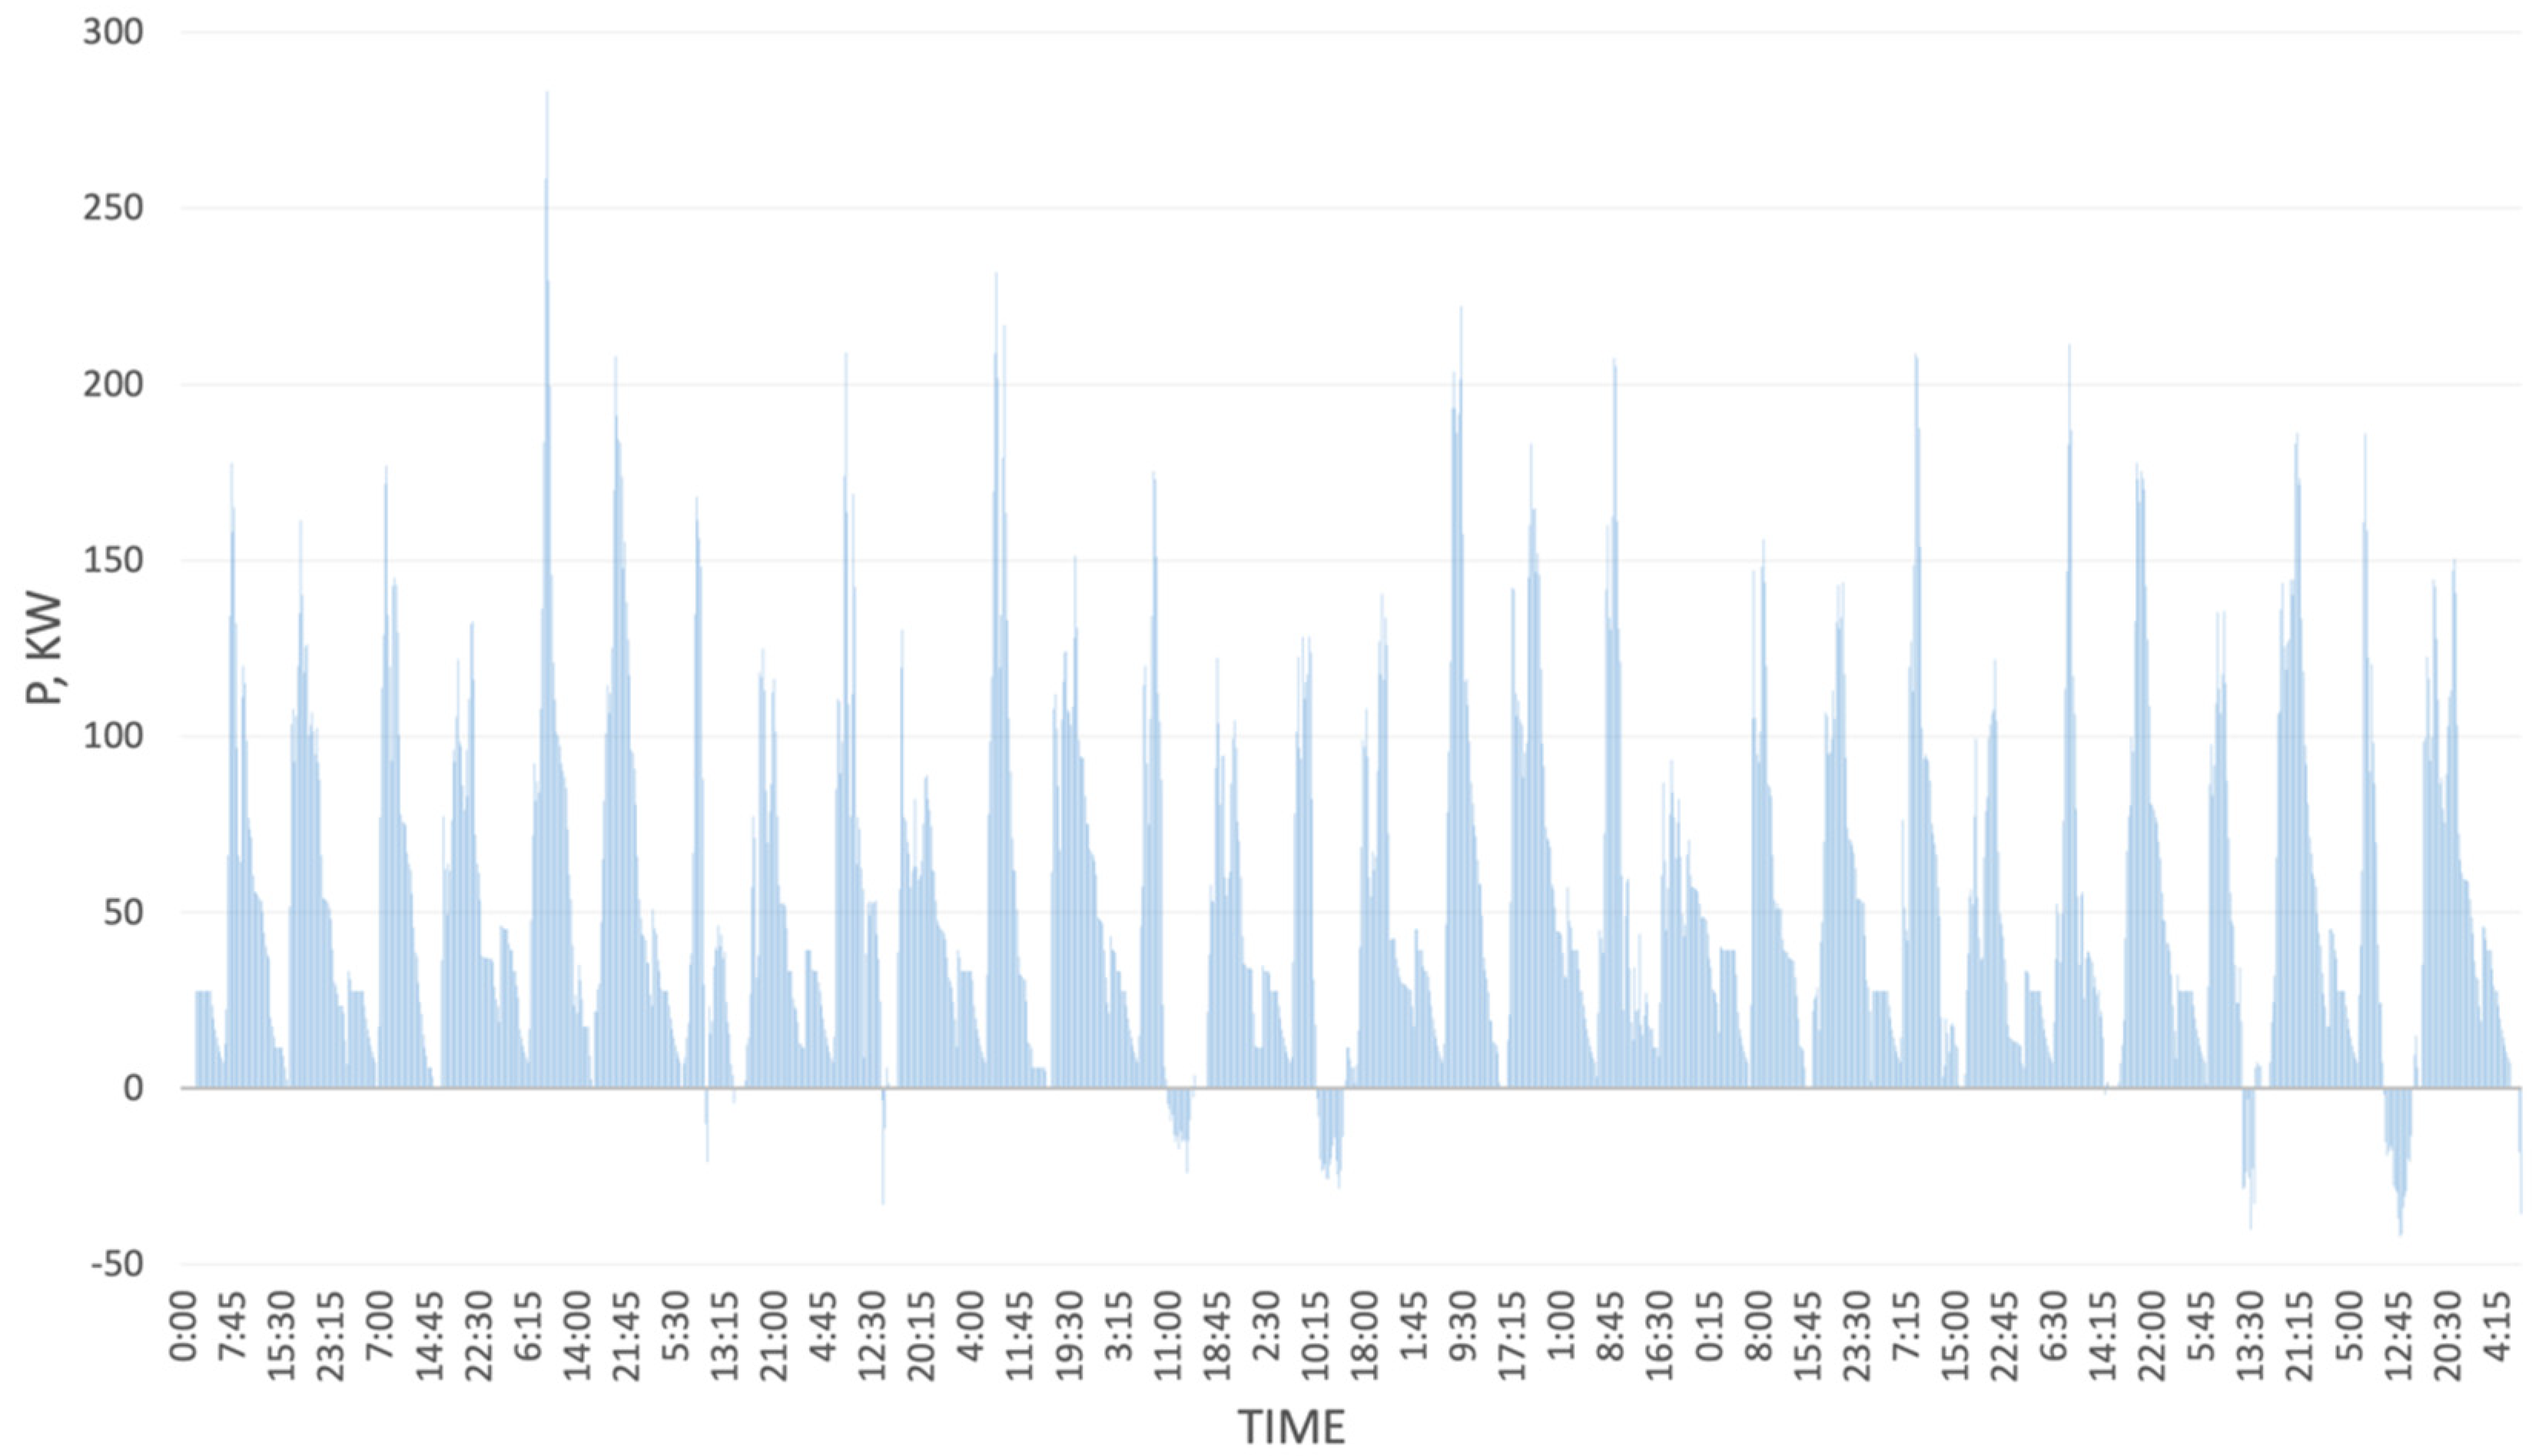
The graph in
Figure 10 illustrates the power load of a smart parking system under scenario 1. The graph’s negative values signify periods where the solar panels generate surplus energy beyond what is required to charge electric vehicles. To optimize energy consumption and minimize wastage, the incorporation of sophisticated management systems that can predict forthcoming weather conditions and calibrate energy generation and consumption is critical. These systems can manage energy supply to meet expected demand, avoiding unnecessary energy generation and thereby reducing environmental impact while enhancing cost-effectiveness.
To realize this, several advanced management systems, such as weather forecasting systems, energy storage systems, and energy management systems, can be utilized. These systems can synergistically forecast future energy demand and supply and optimize the energy distribution accordingly. By predicting future energy demand, it is feasible to tailor the energy supply to meet anticipated demand, thereby minimizing waste of surplus energy.
Energy storage systems can be deployed to store excess energy produced by solar panels during periods of low energy demand. This reserved energy can subsequently be used to power electric vehicle charging during periods of high energy demand, thereby reducing reliance on the electrical grid.
Furthermore, energy management systems can aid in optimizing energy consumption by regulating the charging of electric vehicles based on the availability of renewable energy sources. For instance, in the absence of solar energy, electric vehicles can be charged using energy from the grid during periods of low demand when electricity is less costly.
By integrating advanced management systems, the smart parking system can optimize energy consumption, curtail waste, and minimize environmental impact, all while improving its cost-effectiveness. This optimization will ultimately contribute to a more sustainable and efficient smart parking system.
4. Data Analysis and Discussion of Results
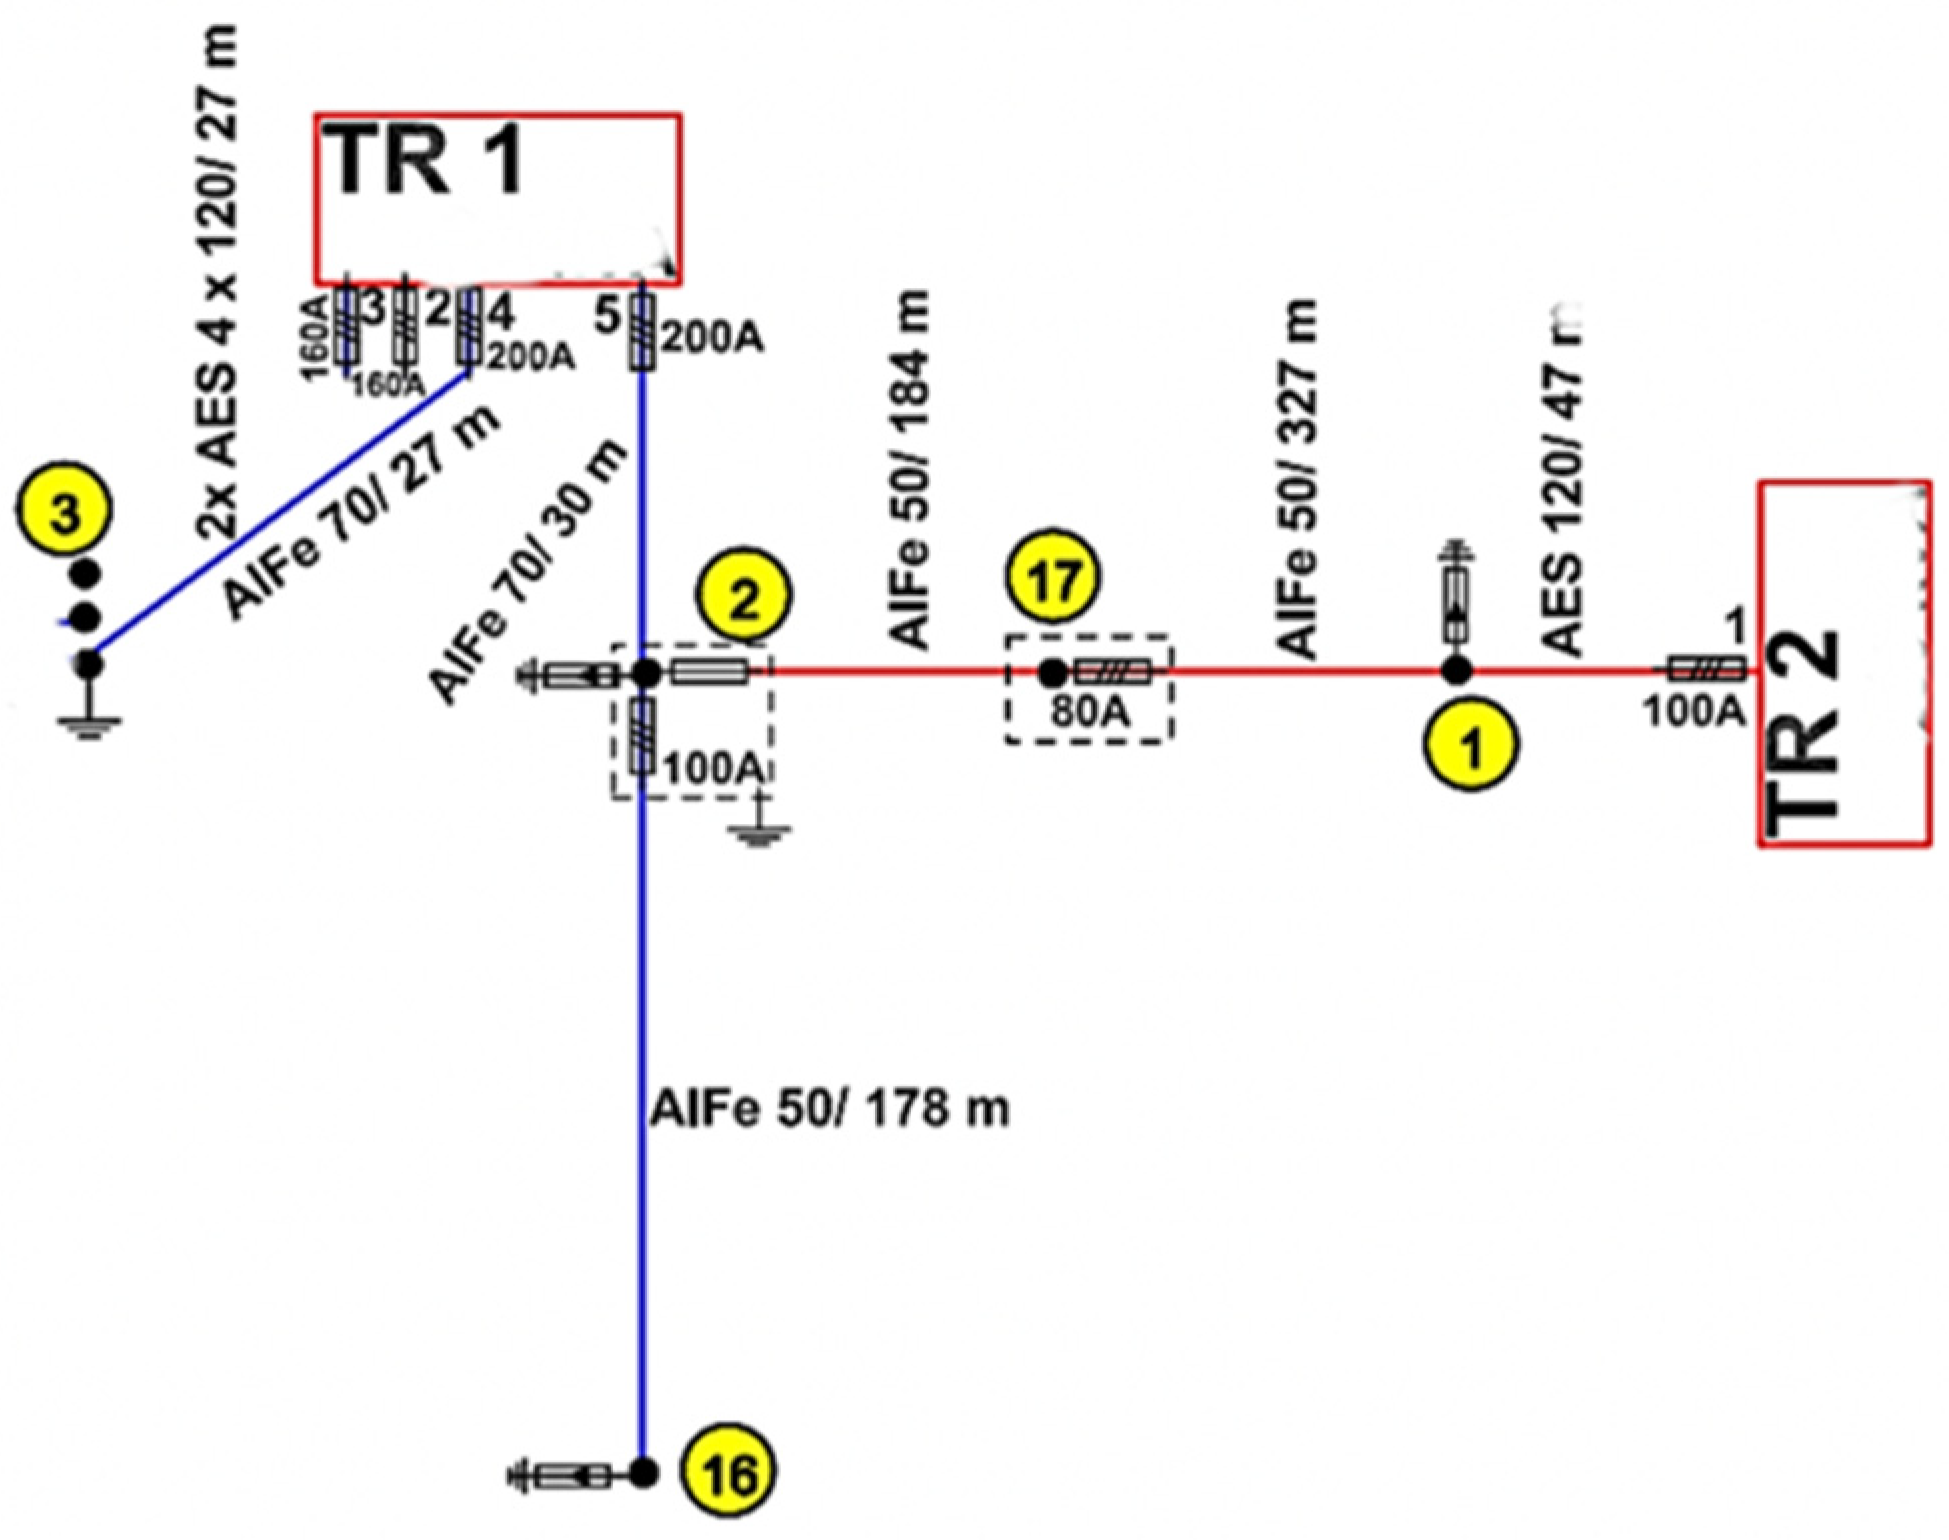
To assess the impact of integrating a smart parking system into the city’s electrical grid, a mathematical algorithm was formulated for a small grid segment comprising 70 private residences. A simplified model of this network segment is presented in
Figure 11. The Python programming language was utilized to develop the mathematical algorithm, employing the node voltage method to compute fundamental electrical parameters. Four distinctive scenarios were simulated to evaluate the effects of integrating smart parking and photovoltaic solar panels:
The network’s current state without modifications;
The current state with an integrated smart parking system;
The current state with 50% of houses equipped with 3.5 kW photovoltaic solar panels;
The current state with both photovoltaic solar panels and a smart parking system.
In summary, this study aimed to evaluate how the combination of a smart parking system and solar photovoltaic panels would affect a small city’s electrical grid network. To conduct this evaluation, a mathematical algorithm was developed using the Python programming language, and the node voltage method was employed to calculate fundamental electrical parameters. The study simulated four distinctive scenarios and evaluated their impacts.
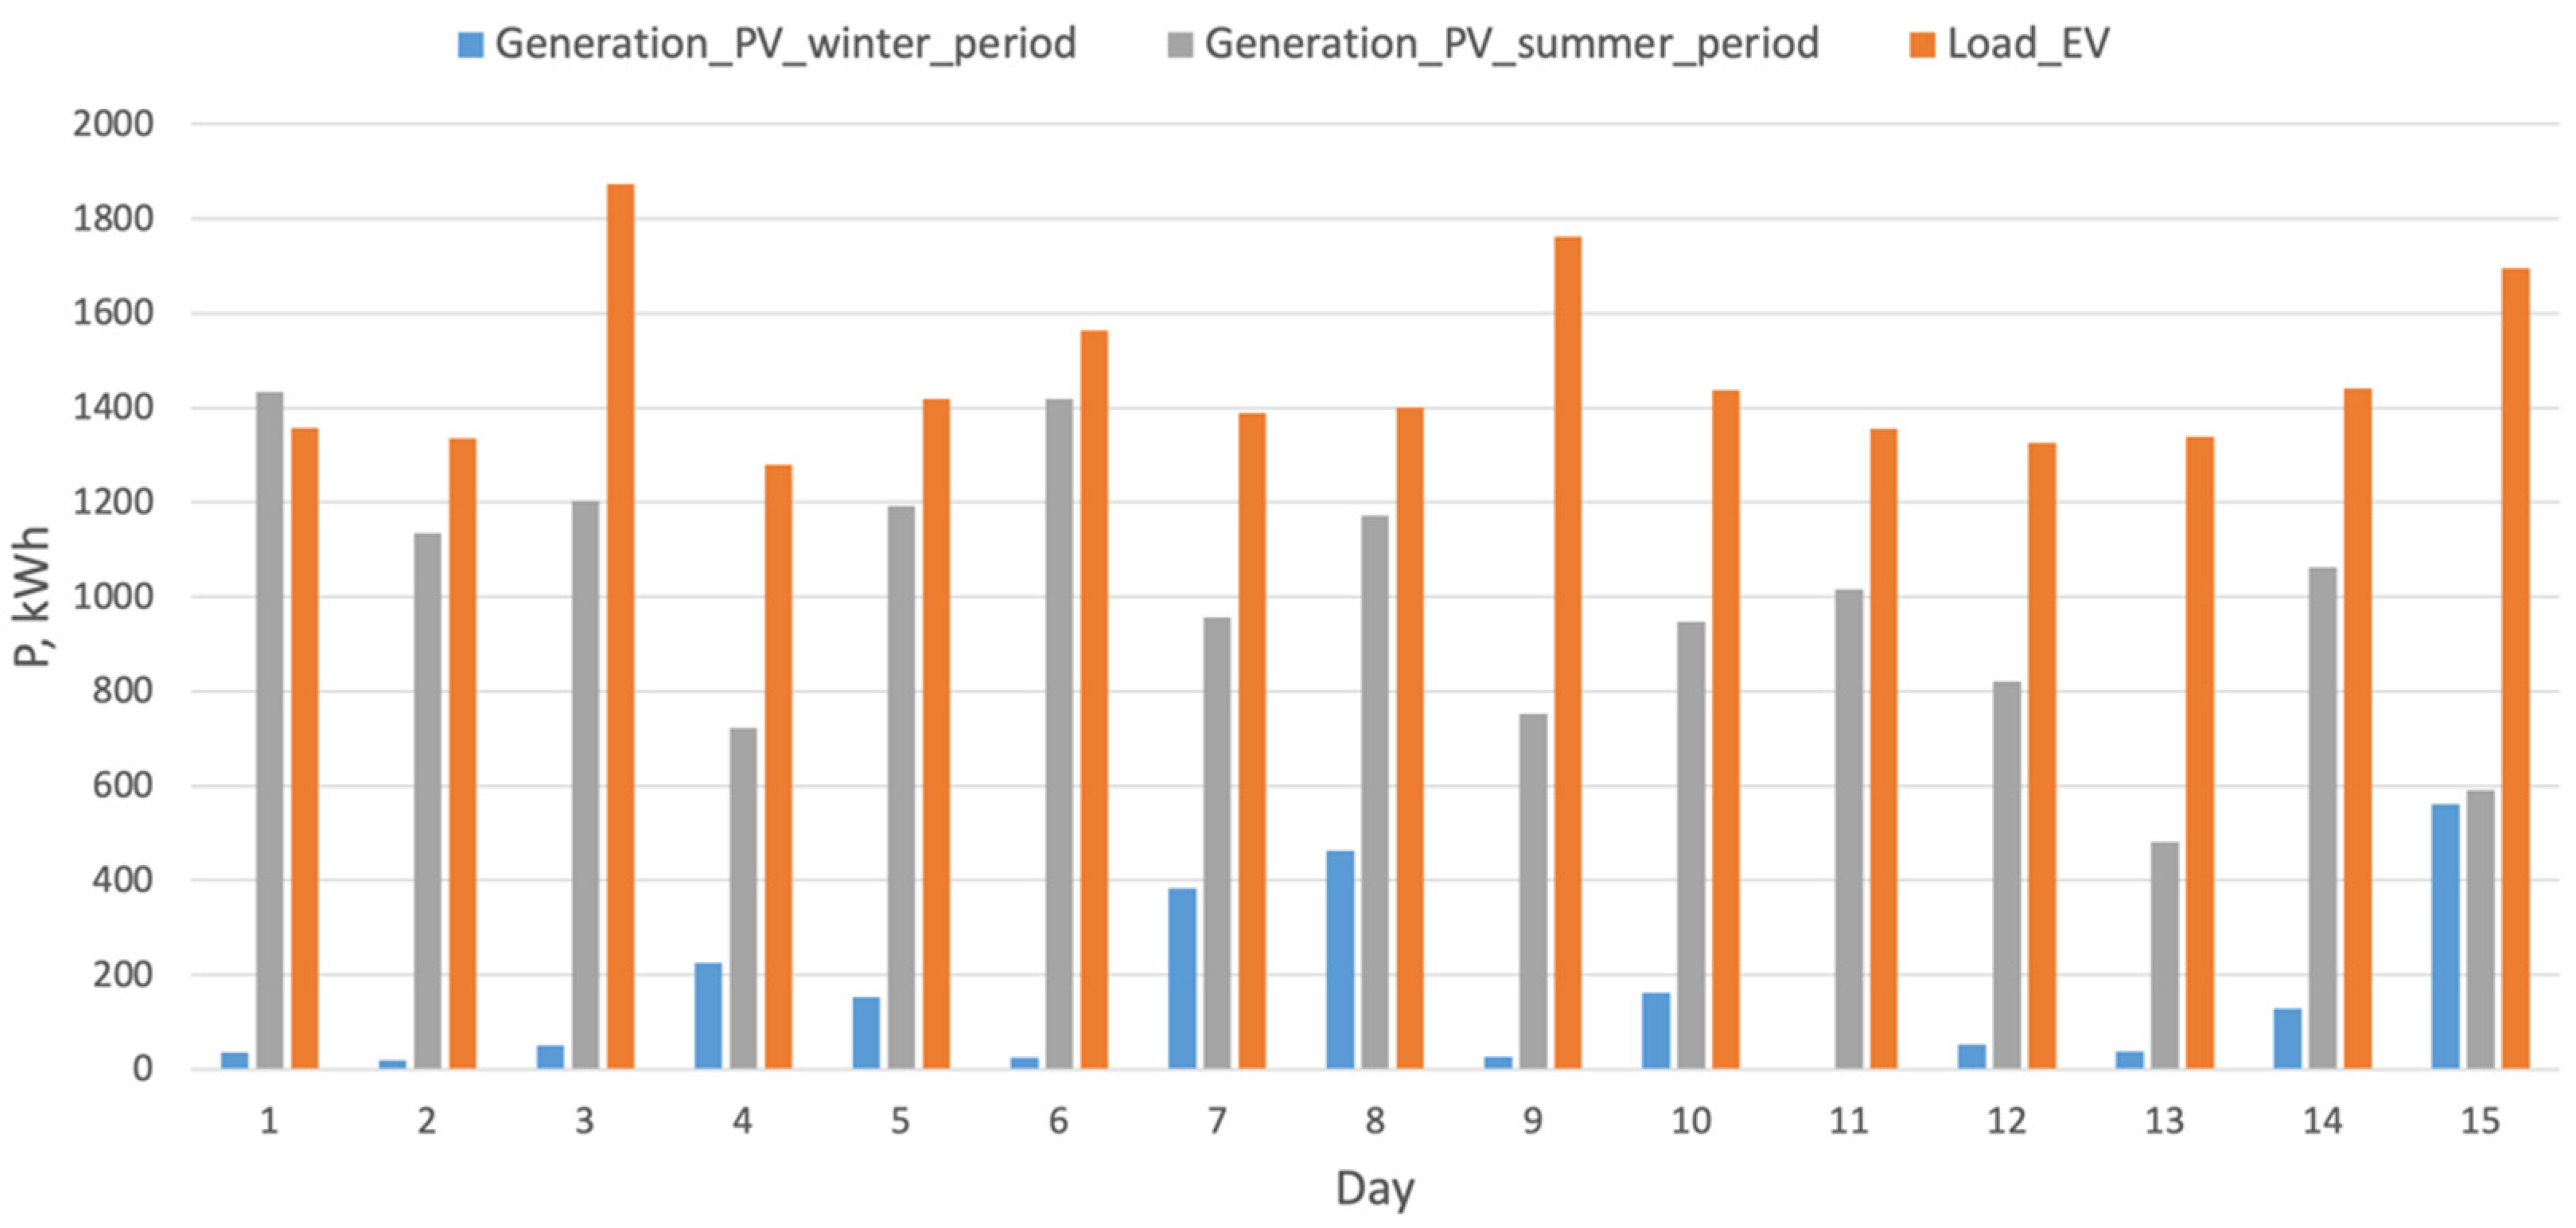
Figure 12 illustrates the total energy consumption and production throughout a simulated day, considering both winter and summer seasons. The data reveals that in most scenarios, the energy produced by the solar panels does not suffice to meet the smart parking system’s energy demands. This outcome suggests the necessity of exploring additional energy production and storage strategies to maximize the smart parking system’s effectiveness. Such strategies might include alternative renewable energy sources or energy storage systems that enable the preservation of excess energy for future use. To optimize the smart parking system’s performance and reduce grid dependence, it is essential to identify and implement consistent, reliable energy solutions to meet system demands. By doing so, the smart parking system can function more sustainably and efficiently, thereby minimizing environmental impact and enhancing economic viability.
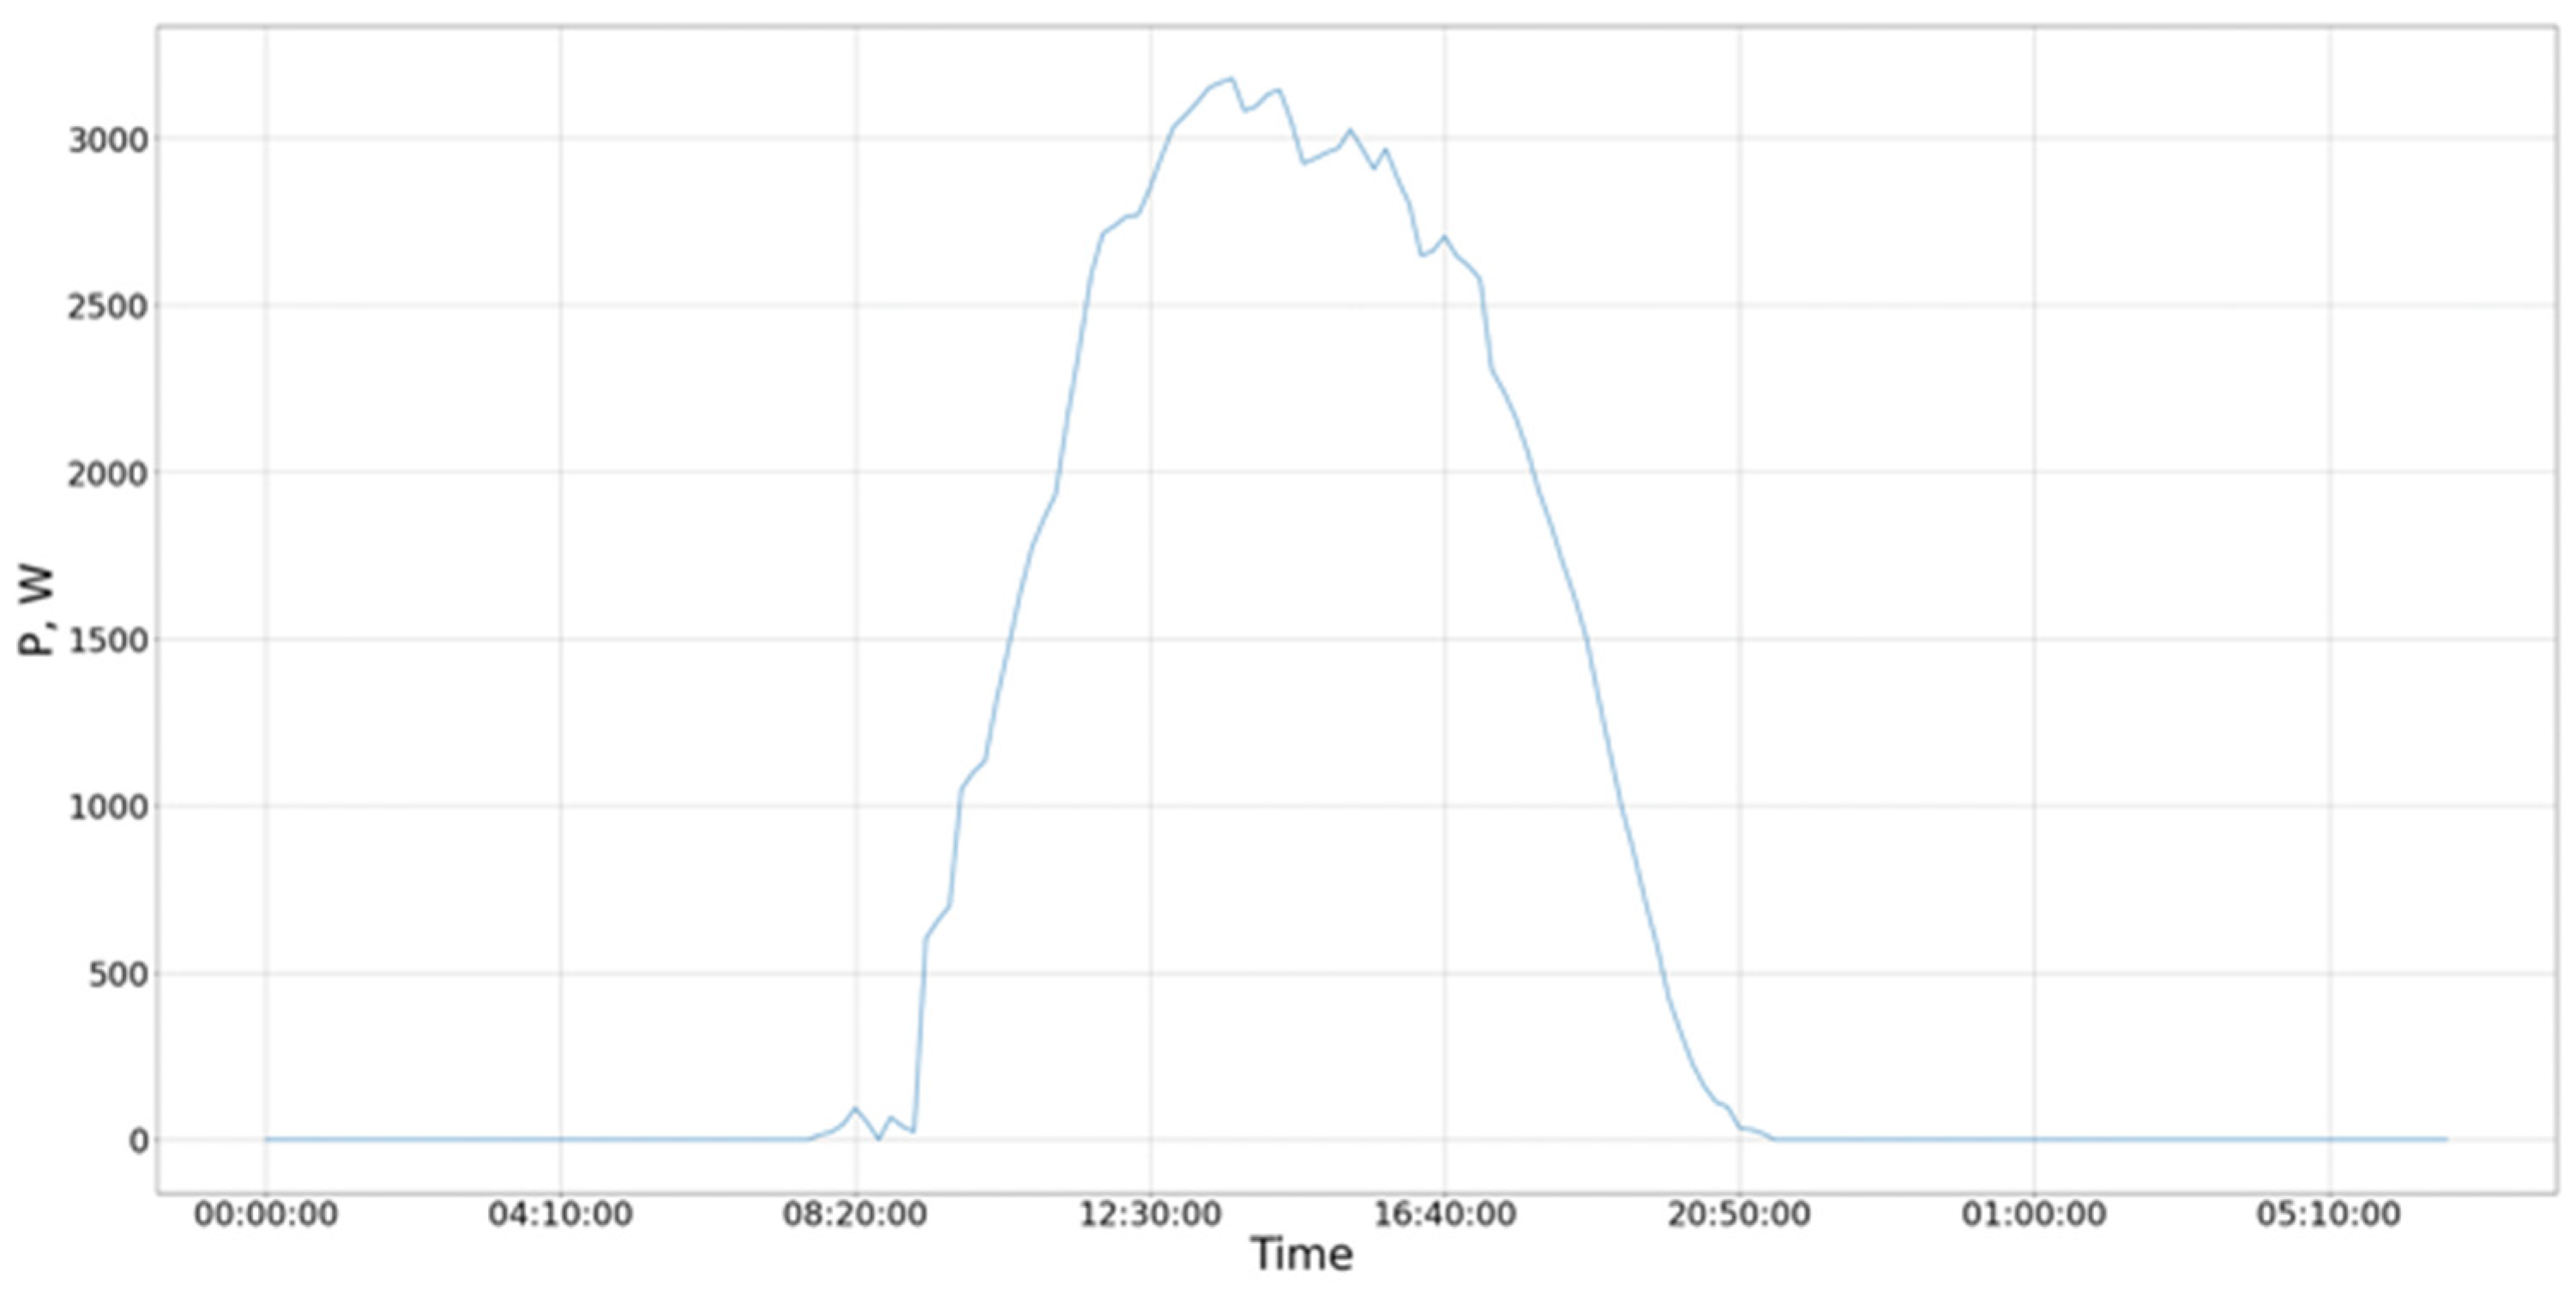
Figure 13 demonstrates the power generation graph for the photovoltaic solar panels on a sunny summer day, with scenario 1 adopted as the electric vehicle charging profile.
For assessing the smart parking system’s effectiveness, three key parameters were identified:
The average voltage level within the network;
The maximum current level within the network;
The coefficient of voltage imbalance in the network.
These parameters were chosen as they are critical indicators of overall network performance and stability. Analyzing these metrics can provide insight into the potential impacts of implementing a smart parking system on the electrical grid, thereby enabling the identification of potential areas of concern.
4.1. Network Voltage Analysis
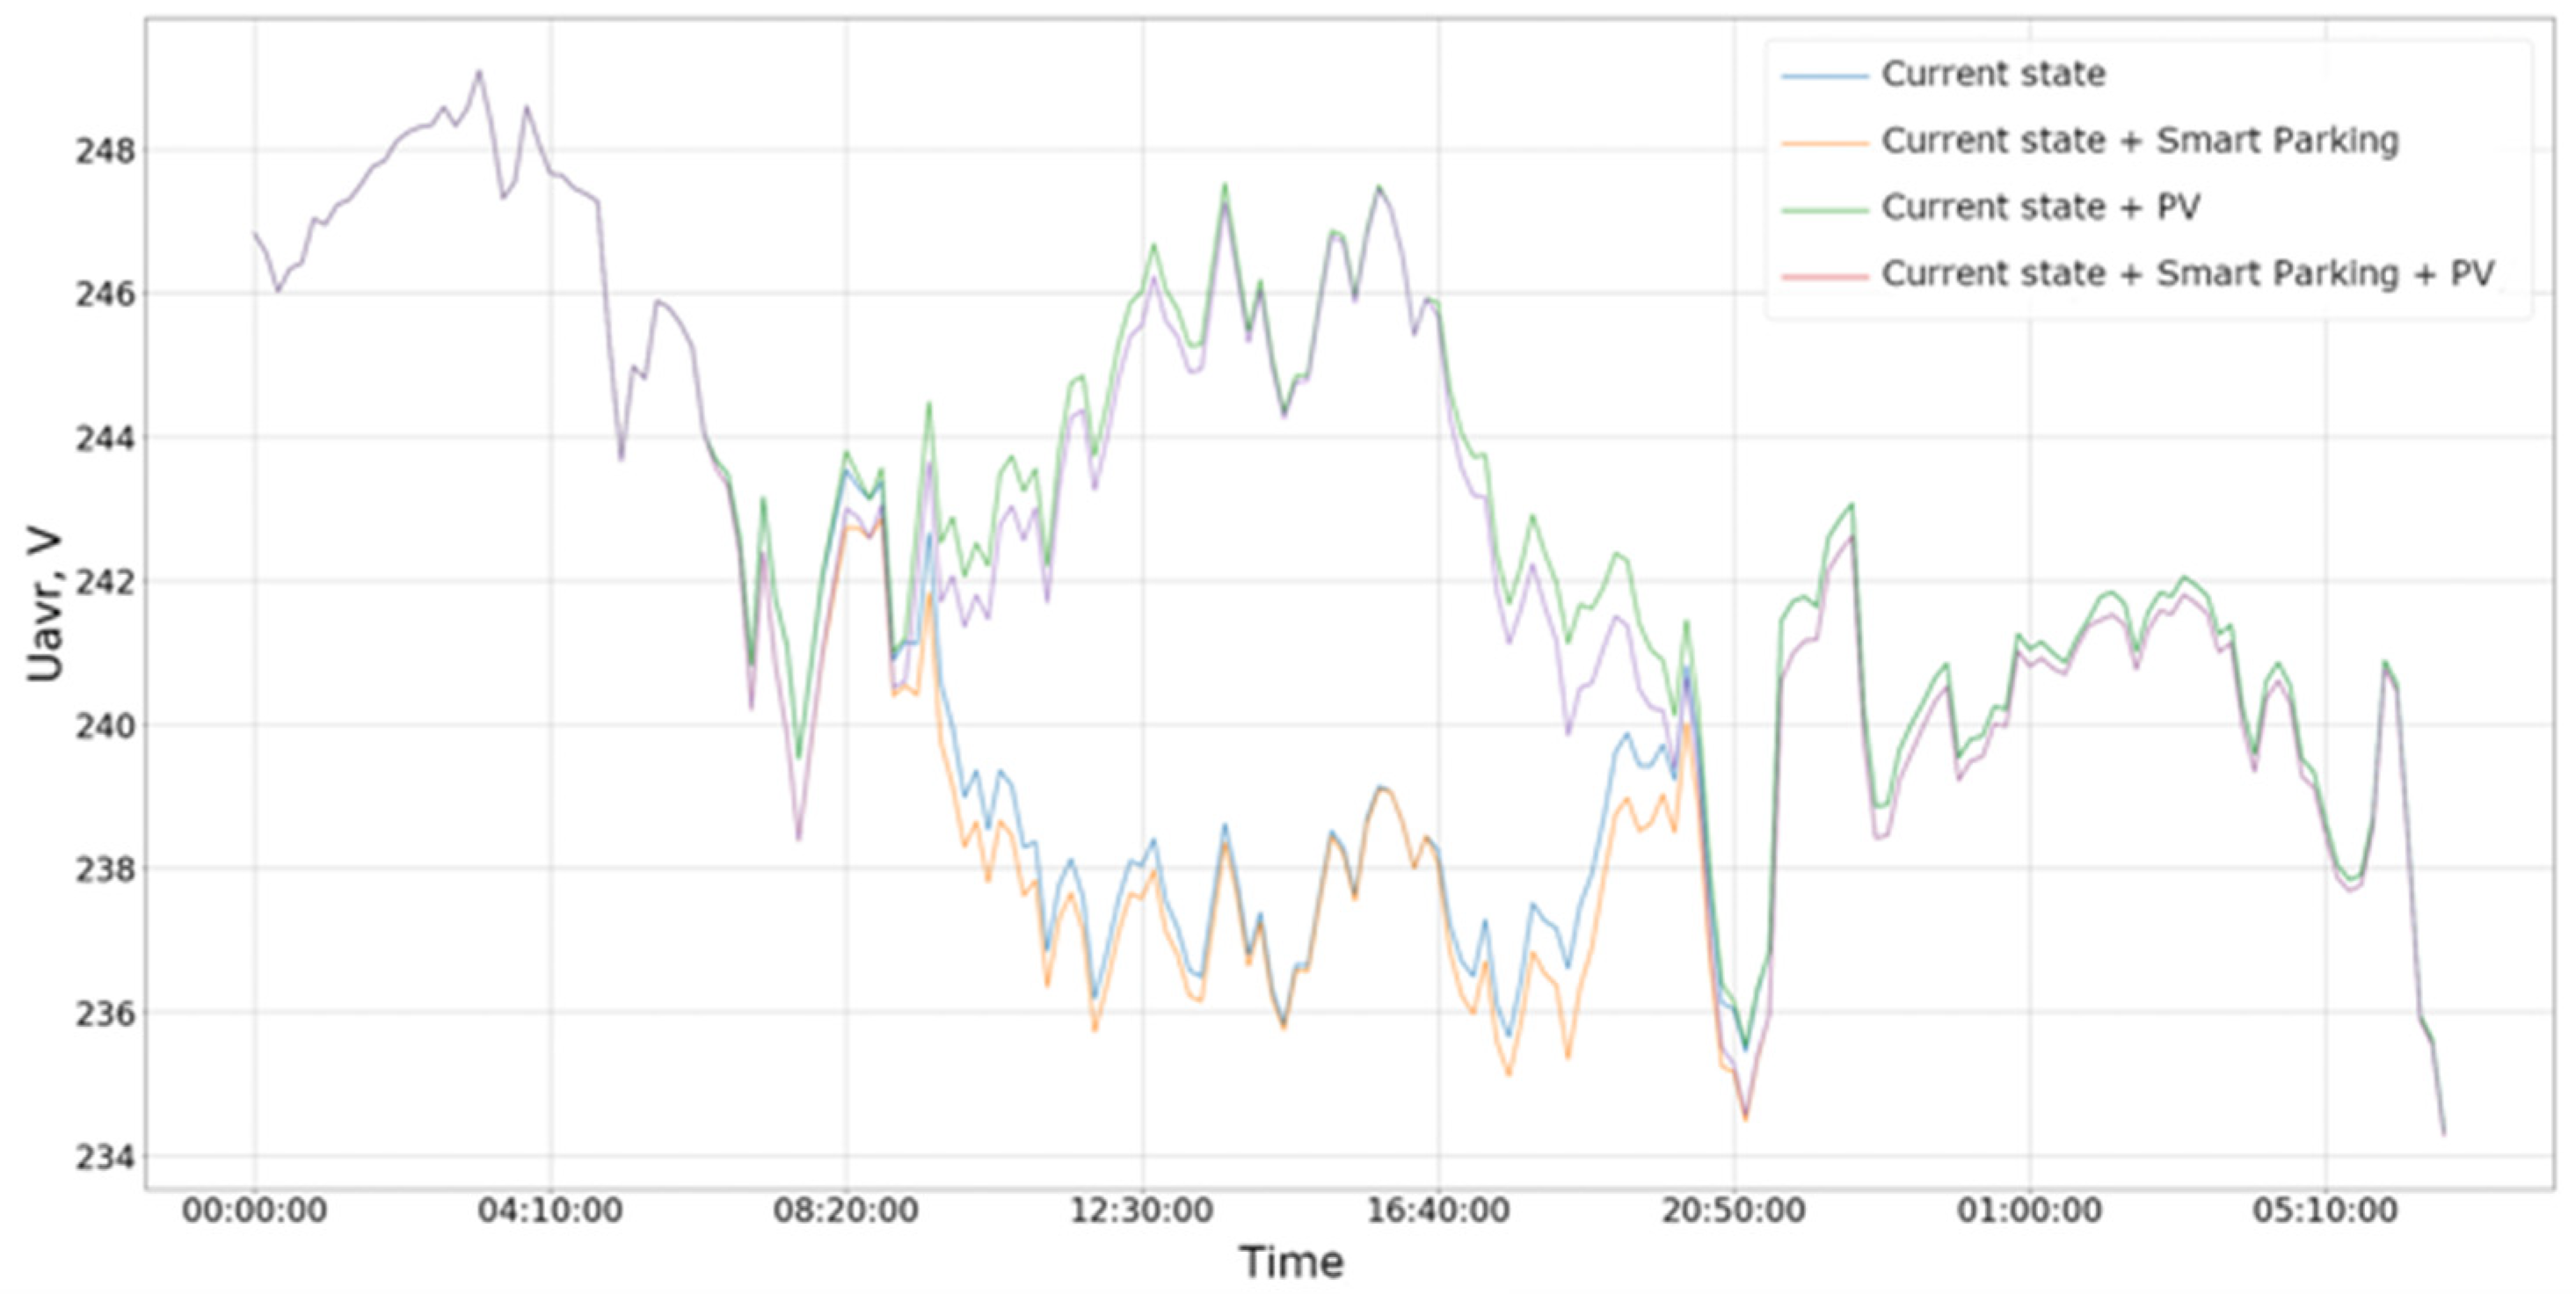
The network’s average voltage levels were analyzed to evaluate the smart parking system’s impact. The results, depicted in
Figure 14, indicate minimal impact on network voltage levels due to power generation from PVs and power consumption of EV in the parking house. However, installing a significant number of solar panels can lead to elevated voltage levels at specific grid nodes. The voltage increase is attributed to network current relief due to increased PV production, which reduces voltage drops in individual network branches. This surge in voltage levels can adversely affect the network’s performance and stability. Consequently, careful evaluation of the number and location of solar panels to be installed is crucial to maintain the network’s voltage levels within acceptable parameters.
4.2. Network Current Analysis
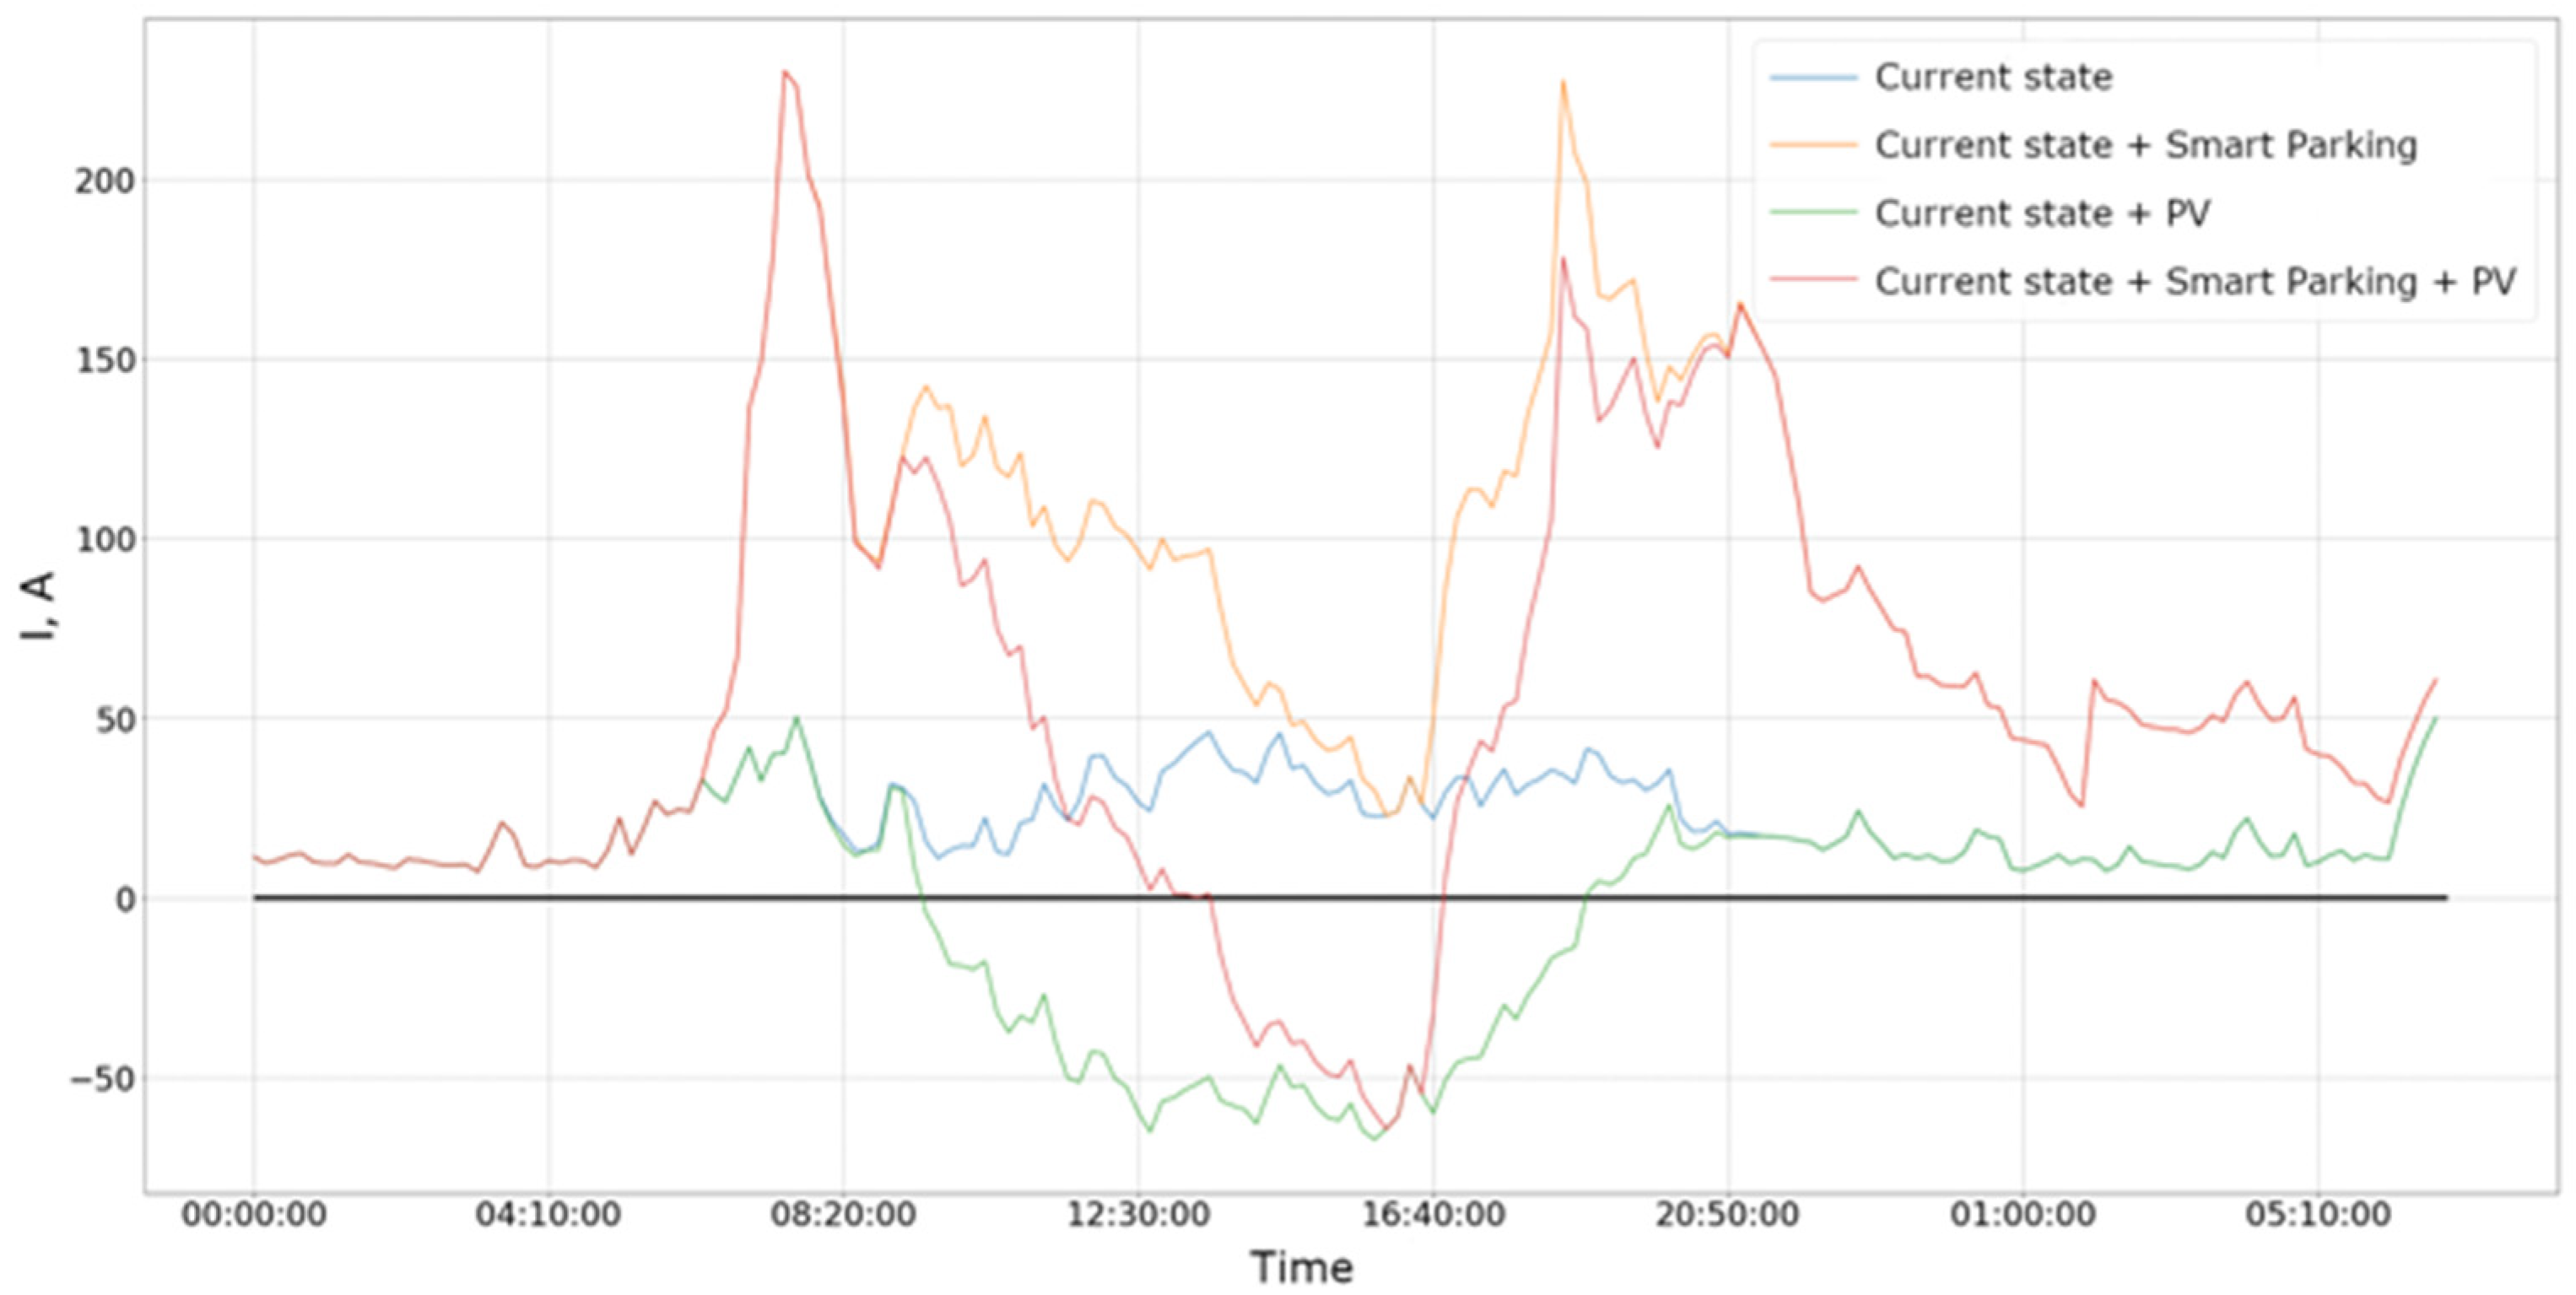
Figure 15 illustrates the maximum current values within the electrical network. From this graphical representation, it can be discerned that the introduction of a smart parking system noticeably escalates the load at specific network nodes. Nevertheless, since the parking facility is connected via independent lines, it does not induce any overloading within existing power lines. Consequently, it can be postulated that the integration of a smart parking system does not exert any detrimental impact on the network. It is, however, imperative to acknowledge that overloads may still transpire within the medium voltage network, which operates at 22 kV. This occurrence might necessitate the network operator to deploy new transformers or additional equipment to balance the load and avert overloads. It should be noted that the implementation of a real-time smart grid system that can monitor and manage the load could help mitigate overloads and ensure network stability. In totality, the analysis presented in
Figure 15 underscores the importance of meticulous planning and management when integrating new technologies that could influence the electrical network.
The installation of a significant number of solar panels may potentially exert a negative impact on the electrical grid due to the frequent generation of power surplus, which often surpasses the demand and subsequently permeates the medium voltage grid, potentially inducing overloads. However, the incorporation of smart parking facilities can attenuate the volume of excess energy intruding into the medium-voltage grid, thereby exerting a positive effect on the grid, particularly in regions densely populated with solar panels.
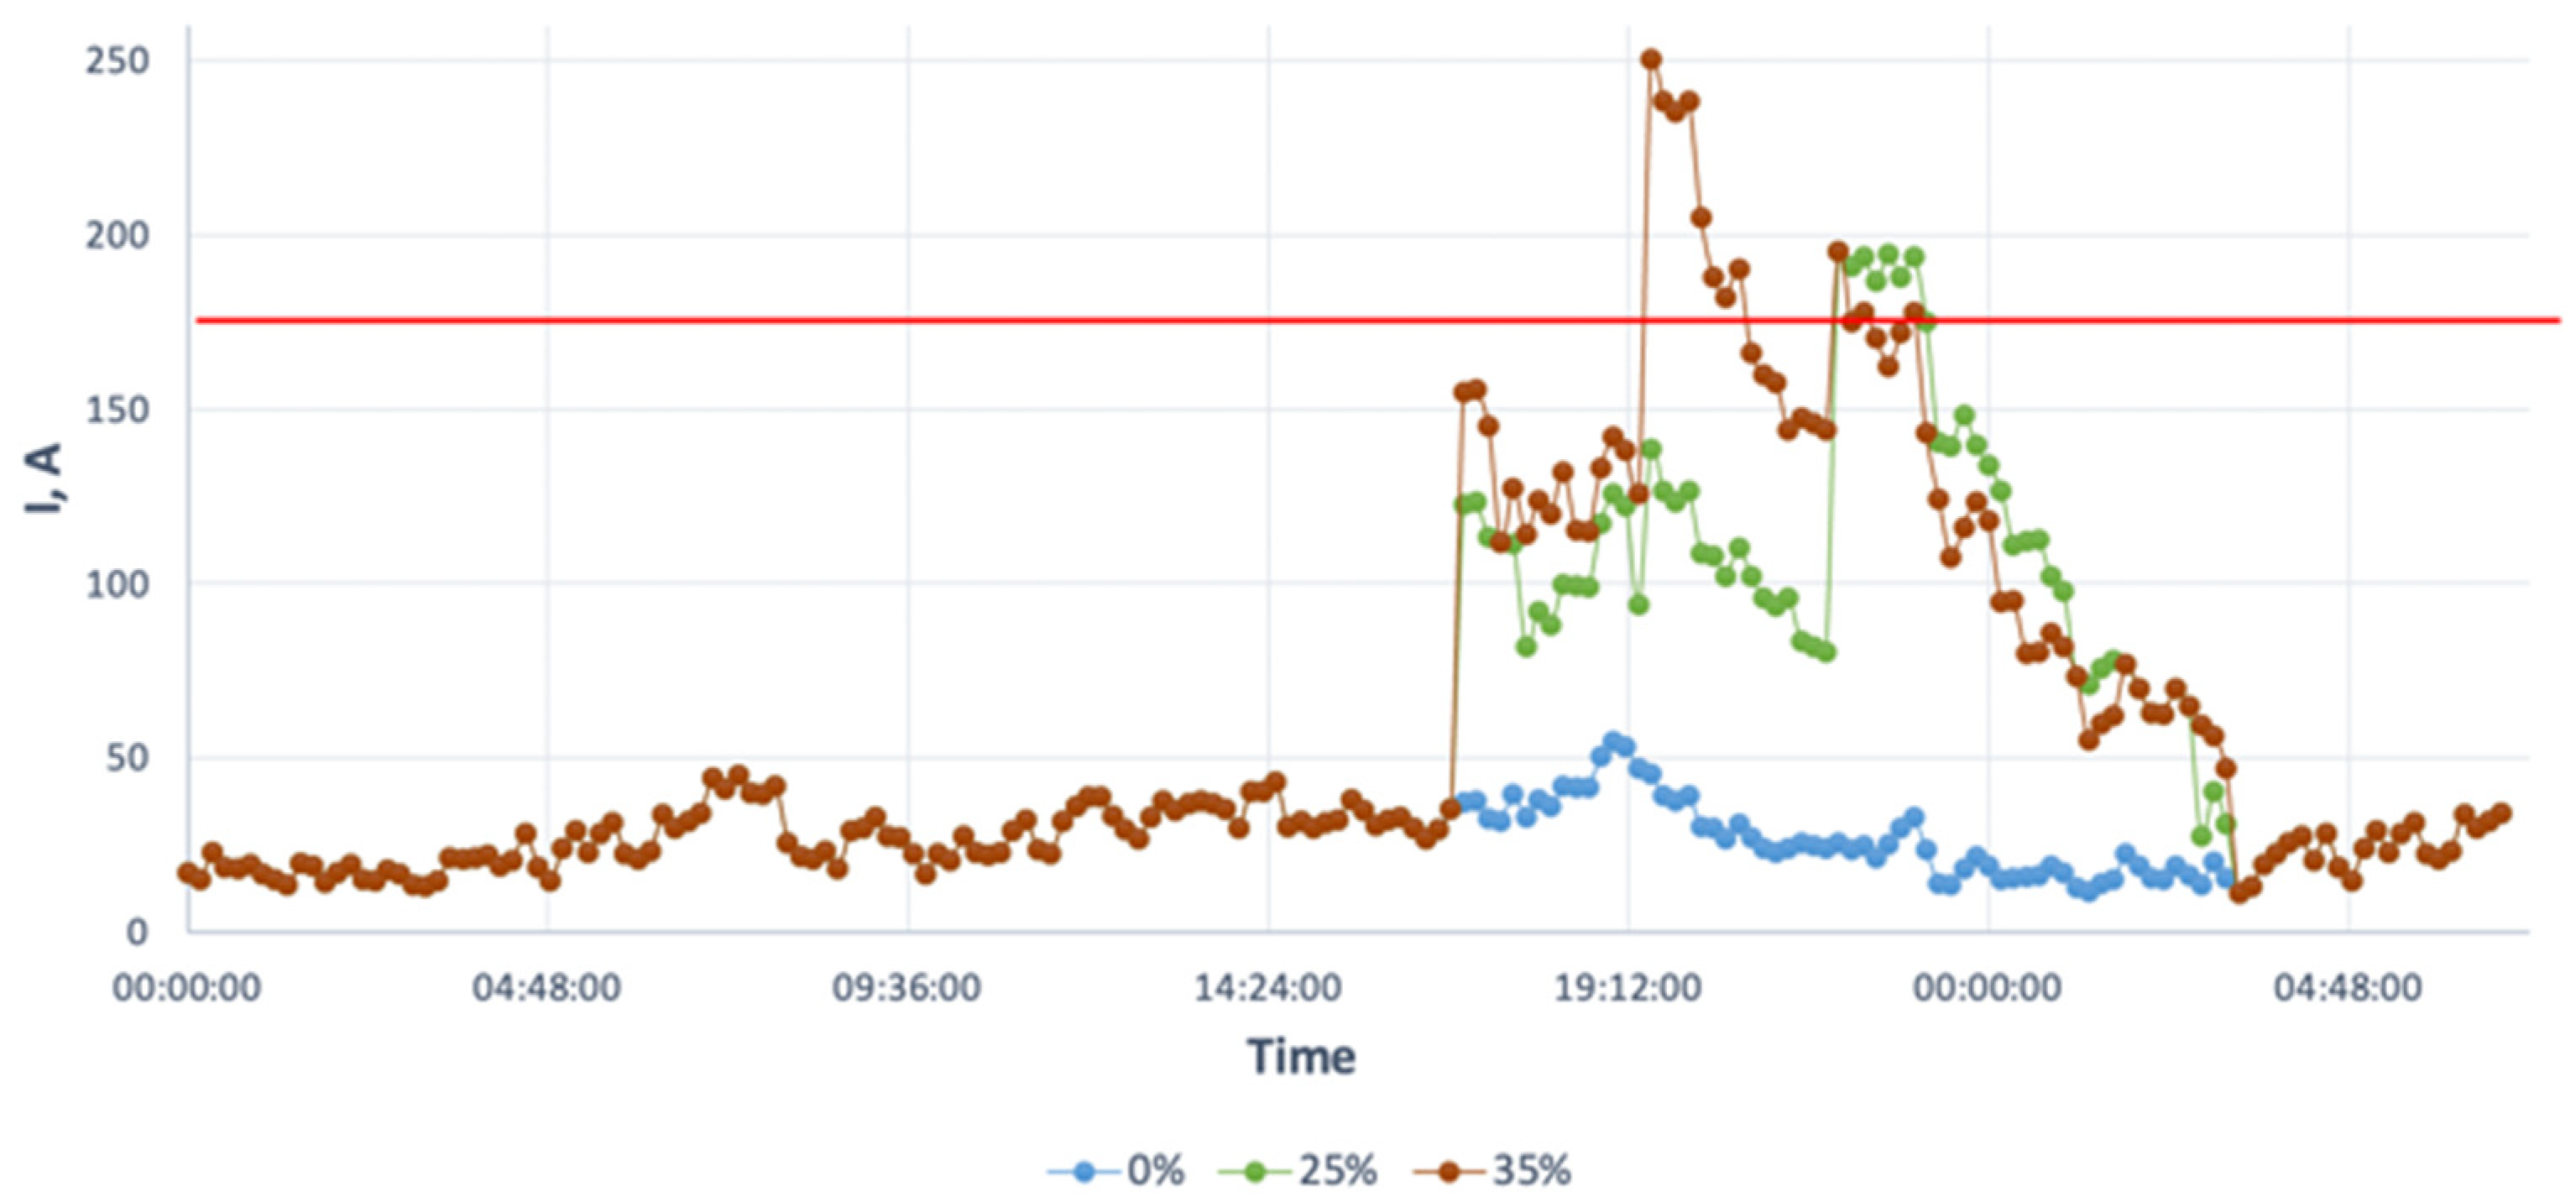
On the contrary, the installation of a multitude of decentralized charging stations could induce congestion on transmission lines, as illustrated in
Figure 16. Such congestion can occur when these charging stations generate high levels of demand, thereby surpassing the transmission lines’ load-bearing capacity. This overloading may result in power outages and other grid disturbances, culminating in service disruptions and potential safety risks. Therefore, during the planning and implementation of electric vehicle charging infrastructure and solar panels, the potential impacts on the electrical grid must be considered, and measures to prevent overloading and other negative effects must be instituted.
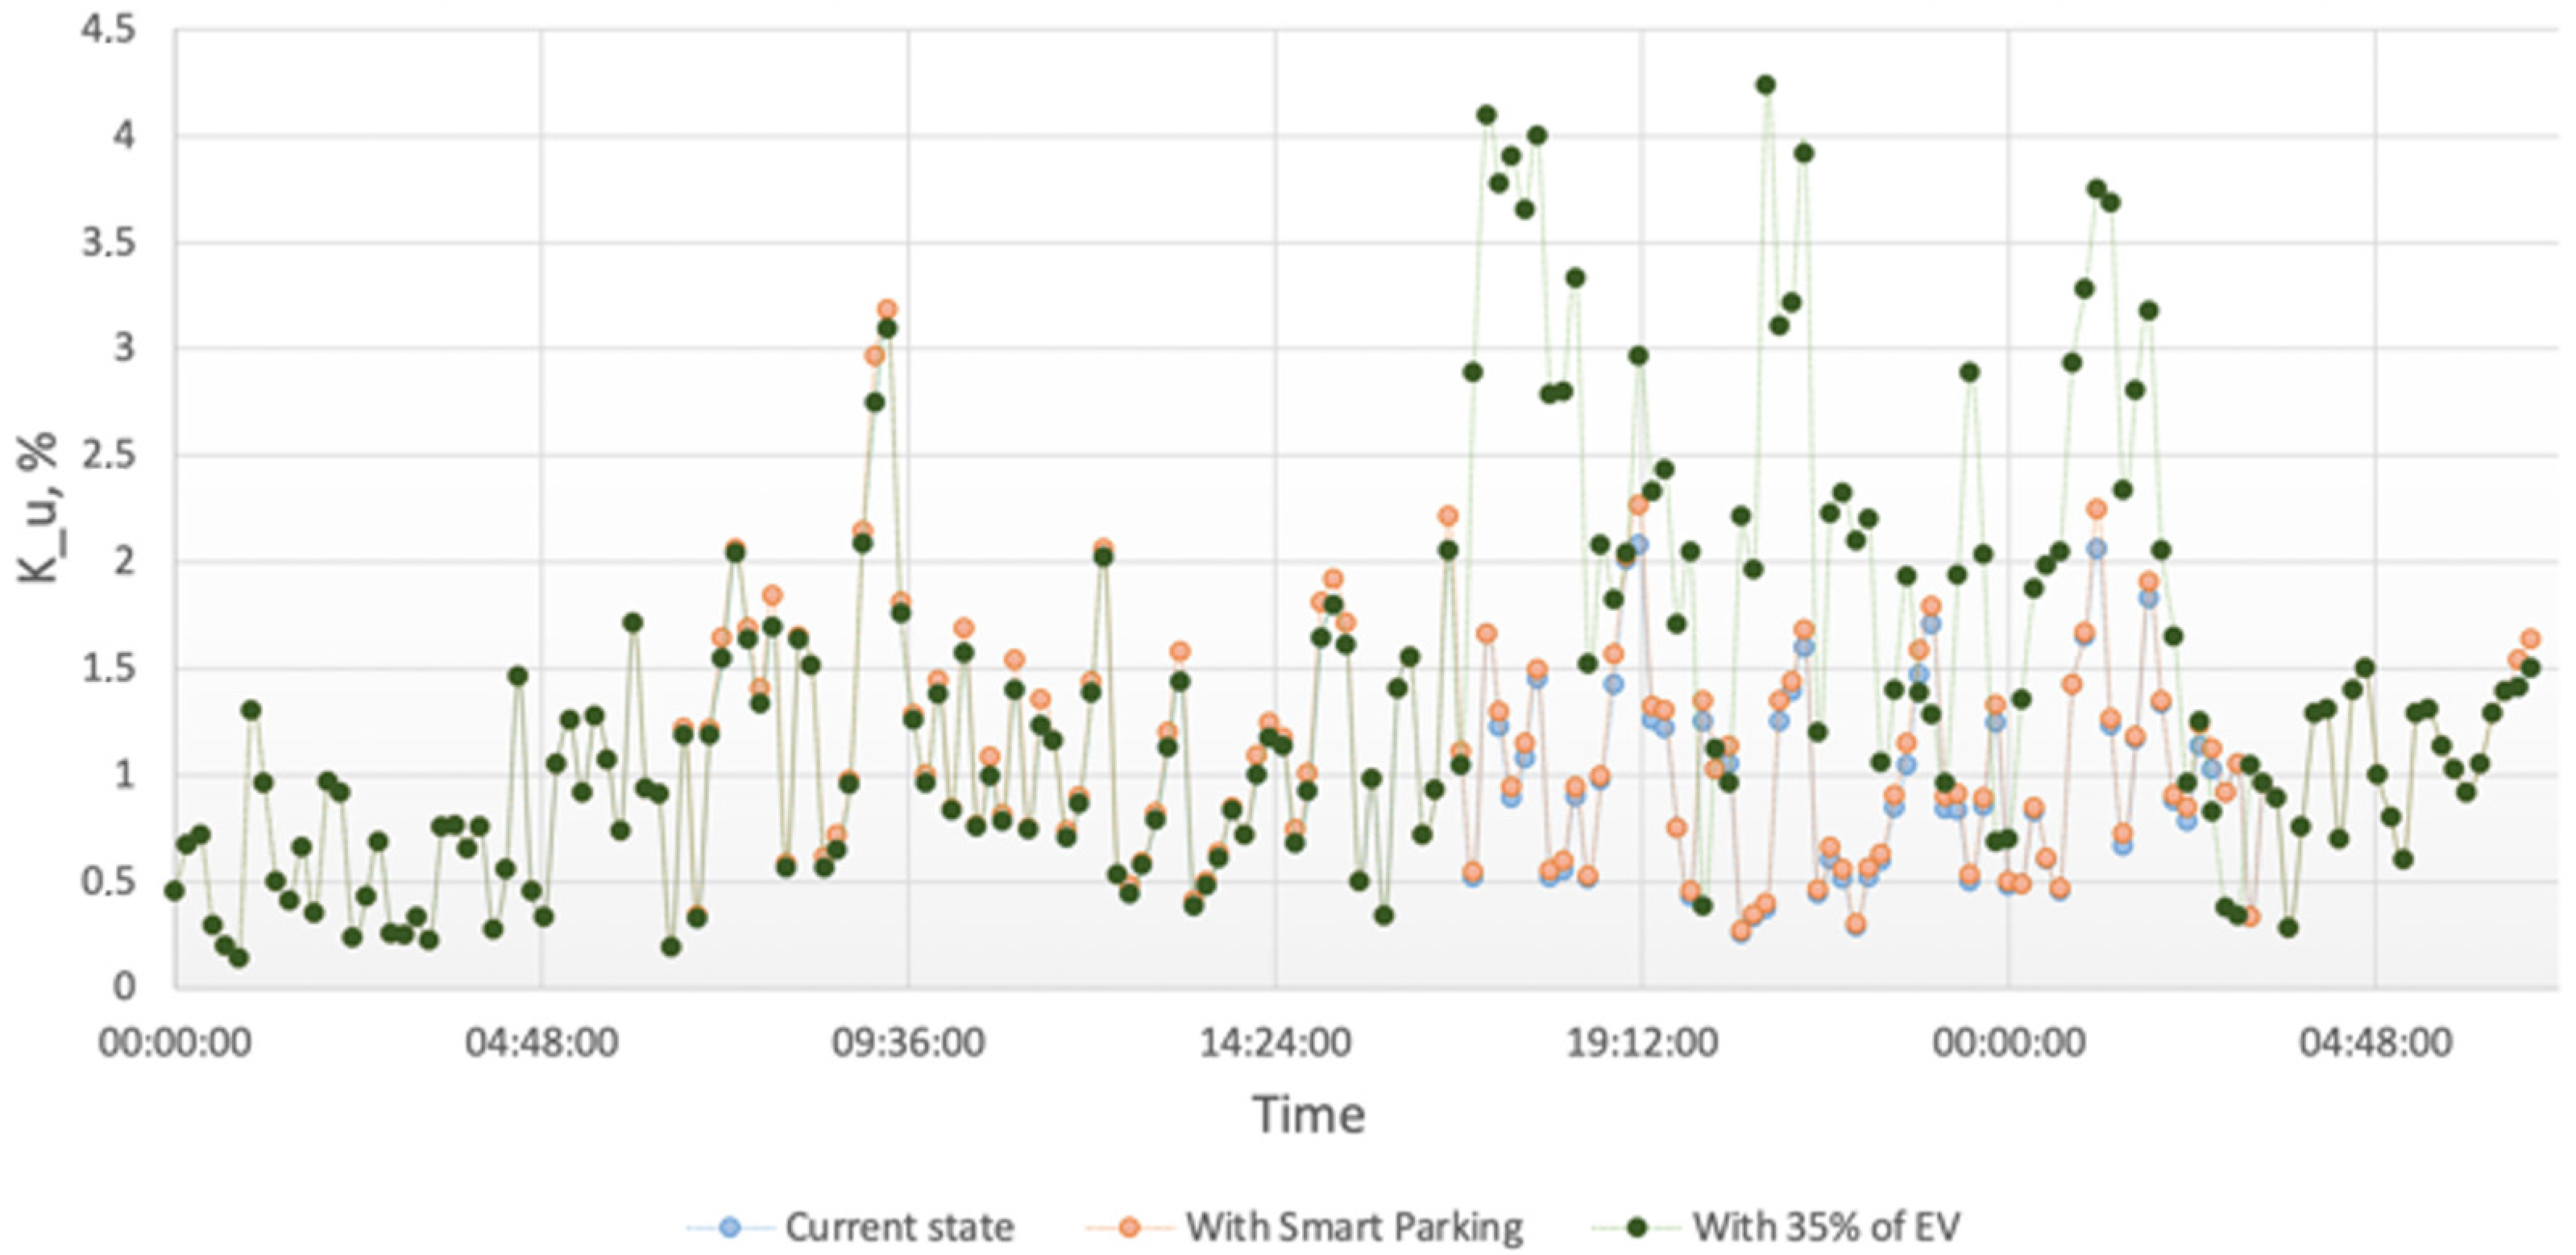
4.3. Network Voltage Imbalance Analysis
Figure 17 presents the voltage imbalance coefficient within the network. The figure demonstrates that the connection of smart parking exerts a negligible impact on the coefficient, largely due to the deployment of a three-phase phase control system designed to minimize asymmetry in electric charges. However, the installation of numerous decentralized charging stations without a control system significantly influences the coefficient. Notably, the graph does not account for the impact of PV panels. To alleviate the negative influence of PV panels, it is proposed to deploy three-phase solutions that would not adversely affect the grid.
5. Conclusions
The development of new technologies brings about changes in electrical networks. The findings presented in this study demonstrate that an increase in the number of electric vehicles precipitates a substantial escalation in the load on electrical networks. To address this issue, it is recommended to construct smart parking or equip existing parking with this technology. The implementation of smart parking solutions exerts a minimal impact on the network, thus obviating the necessity for reconstructing low-voltage power lines, which are often extensive. The construction of smart parking facilities in areas densely populated with renewable energy sources may potentially mitigate or even eliminate electricity flows from low-voltage to medium-voltage networks. Moreover, the deployment of a vehicle-to-grid (V2G) system could enable utility companies to utilize electric vehicles as a source of reserve power, thereby reducing peak loads and ensuring power supply in emergency situations.
The V2G system can afford utility companies an additional source of reserve power to manage peak loads and maintain power supply in emergency situations. This approach can effectively leverage the battery capacity of electric vehicles, providing a cost-effective power supply solution.
In conclusion, the findings of this study suggest that the implementation of smart parking and the V2G system could be advantageous for both utilities and the electrical grid. These solutions could assist in managing network load, reducing electricity flows from low-voltage to medium-voltage networks, and providing an additional source of reserve power for utilities. These solutions could play a pivotal role in ensuring the reliability and stability of the electrical grid as new technologies continue to proliferate.

