Article

Simulation Analysis of Electricity Demand and Supply in Japanese Communities Focusing on Solar PV, Battery Storage, and Electricity Trading

1
School of Environment and Society, Tokyo Institute of Technology, Tokyo 108-0023, Japan
2
NEC Corporation, Tokyo 108-8001, Japan
3
School of Engineering, The University of Tokyo, Tokyo 113-8656, Japan
*
Author to whom correspondence should be addressed.
Energies 2023, 16(13), 5137; https://doi.org/10.3390/en16135137
Submission received: 31 March 2023 / Revised: 27 June 2023 / Accepted: 30 June 2023 / Published: 3 July 2023
(This article belongs to the Special Issue Forecasting and Risk Management Techniques for Electricity Markets II)

Abstract

:
This study analyzes how the electricity demand and supply constitutions affect electricity independence and power trading within a community and between a community and a grid through simulation analysis. To that aim, we create a simulation model equipped with a community-building function and trading capability. We first construct a community consisting of various types of residential and industrial consumers, and renewable power plants deployed in the community. Residential and industrial consumers are characterized by a state of family/business and ownership and the use of energy equipment such as rooftop solar PV and stationary battery storage in their homes/offices. Consumers’ electricity demand is estimated from regression analyses using training data. Using the hypothetical community constructed for the analysis, the simulation model performs rule-based electricity trading and provides outputs comprising the total electricity demand in the community, the state of use of battery storage and solar PV, the trading volume, and the electricity independence rate of the community. From the simulation results, we discuss policy implications on the effective use of renewable energy and increasing electricity independence by fully utilizing battery and trading functions in a community.

1. Introduction

Awareness of risks related to climate change and global warming issues is increasing every year worldwide. The Paris Agreement was adopted in December 2015 at the United Nations (UN) Climate Change Conference (COP21) held in Paris and entered into force in November 2016. The long-term goal of the agreement is to hold “the increase in the global average temperature to well below 2 °C above pre-industrial levels” and pursue efforts “to limit the temperature increase to 1.5 °C above pre-industrial levels” (https://unfccc.int/event/cop-21, accessed on 25 March 2023). Since that, policymakers, corporate leaders, researchers, and society have recognized common concerns of climate change problems and the necessity of future carbon neutrality more than ever. In response, many countries stipulated carbon neutrality by 2050 in law or announced in public that should be achieved.
In Japan, former Prime Minister Suga declared Japan’s goal of becoming carbon neutral by 2050 in October 2020 in his policy speech, and in April 2021, he further announced at Japan’s Global Warming Prevention Headquarters and the Leaders’ Summit on Climate hosted by the United States, “Consistent with the 2050 goal, we aim to achieve an ambitious 46% reduction in greenhouse gas emissions in Fiscal Year (FY) 2030 from FY2013 levels. Furthermore, we will continue to take on the challenge of reaching the 50% mark.” Along with the carbon neutrality goal, the Japanese government is moving forward with green society initiatives through the advancement of innovation, energy policy, green growth strategy, the promotion of changes in lifestyle, regional decarbonization, sustainable finance, a reduction in food loss, and various related events (https://www.kantei.go.jp/jp/headline/tokushu/green.html, accessed on 25 March 2023).
To reduce greenhouse gas (GHG) emissions effectively in society, an increase in renewable energy sources such as solar photovoltaic (PV) and wind power generation is a promising measure [1]. In line with the global trend of decarbonization, Japan’s local governments are also interested in reducing GHG emissions. An example is the Tokyo Metropolitan Government (TMG), which established a program that requires certain small- and medium-sized new buildings, including houses, to ensure environmental performance and reinforces a green building program for new buildings, a local energy planning program, and an energy environment planning program to strengthen effective efforts to realize a decarbonized society [2]. These programs will start coming into effect from 1 April 2025, etc., and related rules and regulations will be developed at the same time. In particular, since the TMG is a leading example for all the other local governments in Japan, it is of interest as a policy guidance that newly built individual residential homes are required to install solar PV and battery facilities under certain conditions.
Meanwhile, we understand it is not straightforward to drastically increase solar PV and wind power generation because they suffer from intermittency due to the various weather conditions and would bring new challenges in transmission and distribution network operation [3,4]. To remedy the inconvenience, it is suggested to deploy and use batteries combined with this intermittent renewable generation as one of the promising measures. However, it has not been sufficiently discussed what capacities and combinations of these facilities should be deployed in communities that are characterized by different consumer compositions with different characteristics, preferences, and electricity demands for the sake of fully utilizing renewable energy resources. Under the consideration of the combined use of renewable energy sources and battery storage, it is critical to know what battery capacities should be installed and used in what ways [5]. Concretely, it is an essential task to examine how to use a battery in charging and discharging to respond to various changes in demand and supply conditions brought by different community settings. In particular, we emphasize a viewpoint of making the most effective use of renewable energy in a community. The goal of this study is to investigate and accumulate knowledge on an effective strategy of installation and a combination of energy facilities such as solar PV and batteries and the use of electricity trading from simulation results to achieve higher energy independence in a community.
The simulation-based analysis is a solid and useful measure that provides fundamental information to facilitate policy discussions on the electricity demand and supply of a community with the installation of distributed energy resources (DERs). The community is characterized by consumers and DERs, which would basically consist of residential and industrial consumers who hold various types of preferences on energy use, renewable power plants deployed in the community, solar PV facilities installed in residential homes and industrial offices, and the installation and use of battery storage. As a measure to increase the efficient use of DERs while keeping the balance of the power system in a community, peer-to-peer (P2P) electricity trading is of interest to researchers and practitioners. Indeed, the literature on P2P electricity trading has been gradually gaining attention in recent years. Previous studies on P2P electricity trading include [6,7,8,9,10,11,12,13,14,15,16,17,18,19,20,21,22,23,24,25,26,27,28,29,30,31] that investigated, e.g., the efficiency of power systems with DERs, the preferences of energy buyers and sellers and their matching mechanisms, the bidding strategies of prosumers and their influence on electricity trading with/without the use of storage capabilities, and a comprehensive survey of electricity trading and markets including P2P.
The literature, using the agent algorithm [6], examined a bidding agent in a P2P continuous electricity trading market. The agent optimizes and automatically performs electricity trading through bids based on electricity demand and generation forecasts, user preferences for renewable energy (renewable energy-oriented or economically oriented), and assets such as electric vehicles (EVs). As shown in the study, a simulation model approach is a promising tool to examine desirable conditions to effectively use PV generation and battery facilities. Therefore, we employ a similar approach and create a simulation model that is equipped with a flexible community-building capability comprising various consumers and generation facilities and an electricity trading function inside the community as well as between the community and the grid.
Using a hypothetical community with various characteristics created in the simulator, we investigate what combinations of solar PV generation and battery storage usage facilitate power trading for the efficient use of electricity in the community. The efficient use of energy improves the community’s energy independence by increasing the self-sufficiency of electricity consumption from renewable power produced in the community. Under the different prefixed conditions of a community, we can observe different patterns of trading that would occur, and thereby, we examine the impacts of different combinations of renewable energy generation, the status of battery holding, and the usage of the electricity trading between the community and the grid on the efficient use of energy.
On the other hand, this study significantly differs from [6] in that we employ a rule-based power allocation model incorporating the predetermined preferences of consumers. That is, the model in this study does not perform optimization calculations for each trading entity or agent (consumer); instead, the community manager performs the rule-based power allocation within the community or between the community and the grid, thus reducing the computation burden and allowing for power exchanges in a large-scale community. Thus, one of the key distinctions of our study lies in the scale of transactions we handle. Unlike existing studies [6], which focused on transactions among 5 users, this study significantly expands the scope by conducting transactions among more than 500 entities. Further, [7] tried to provide a comprehensive understanding of relevant consumer-centric electricity markets from a literature survey by classifying the P2P markets into a fully P2P market, a community-based market, and a hybrid P2P market. According to the classification of [7], the simulation model used in this study can be viewed as a community-based market if we define the community as the entity that establishes the rules for a rules-based transaction. The new contribution of this study in the community-based market approach is that we first incorporate consumers’ preferences into the electricity trading and allocation system among agents that implicitly influence agents’ trading behavior through the background principle applied to rule-based electricity trading. In addition, we use Japanese real data for parameter estimates. This study also stands out in its ability to generate a community’s power demand with simple parameter settings. This feature allows us to recreate a variety of communities in a simplified manner. The flexibility of our simulation model makes it a powerful tool for understanding and planning energy use in diverse community settings. These are the novel contributions of this study.
The remainder of this paper is organized as follows. Section 2 describes the framework and functions of the simulation model used in this study. Section 3 explains simulation cases with different settings and presents the computation results. Section 4 concludes this study and addresses the remaining issues and future extensions.

2. Framework of Simulation

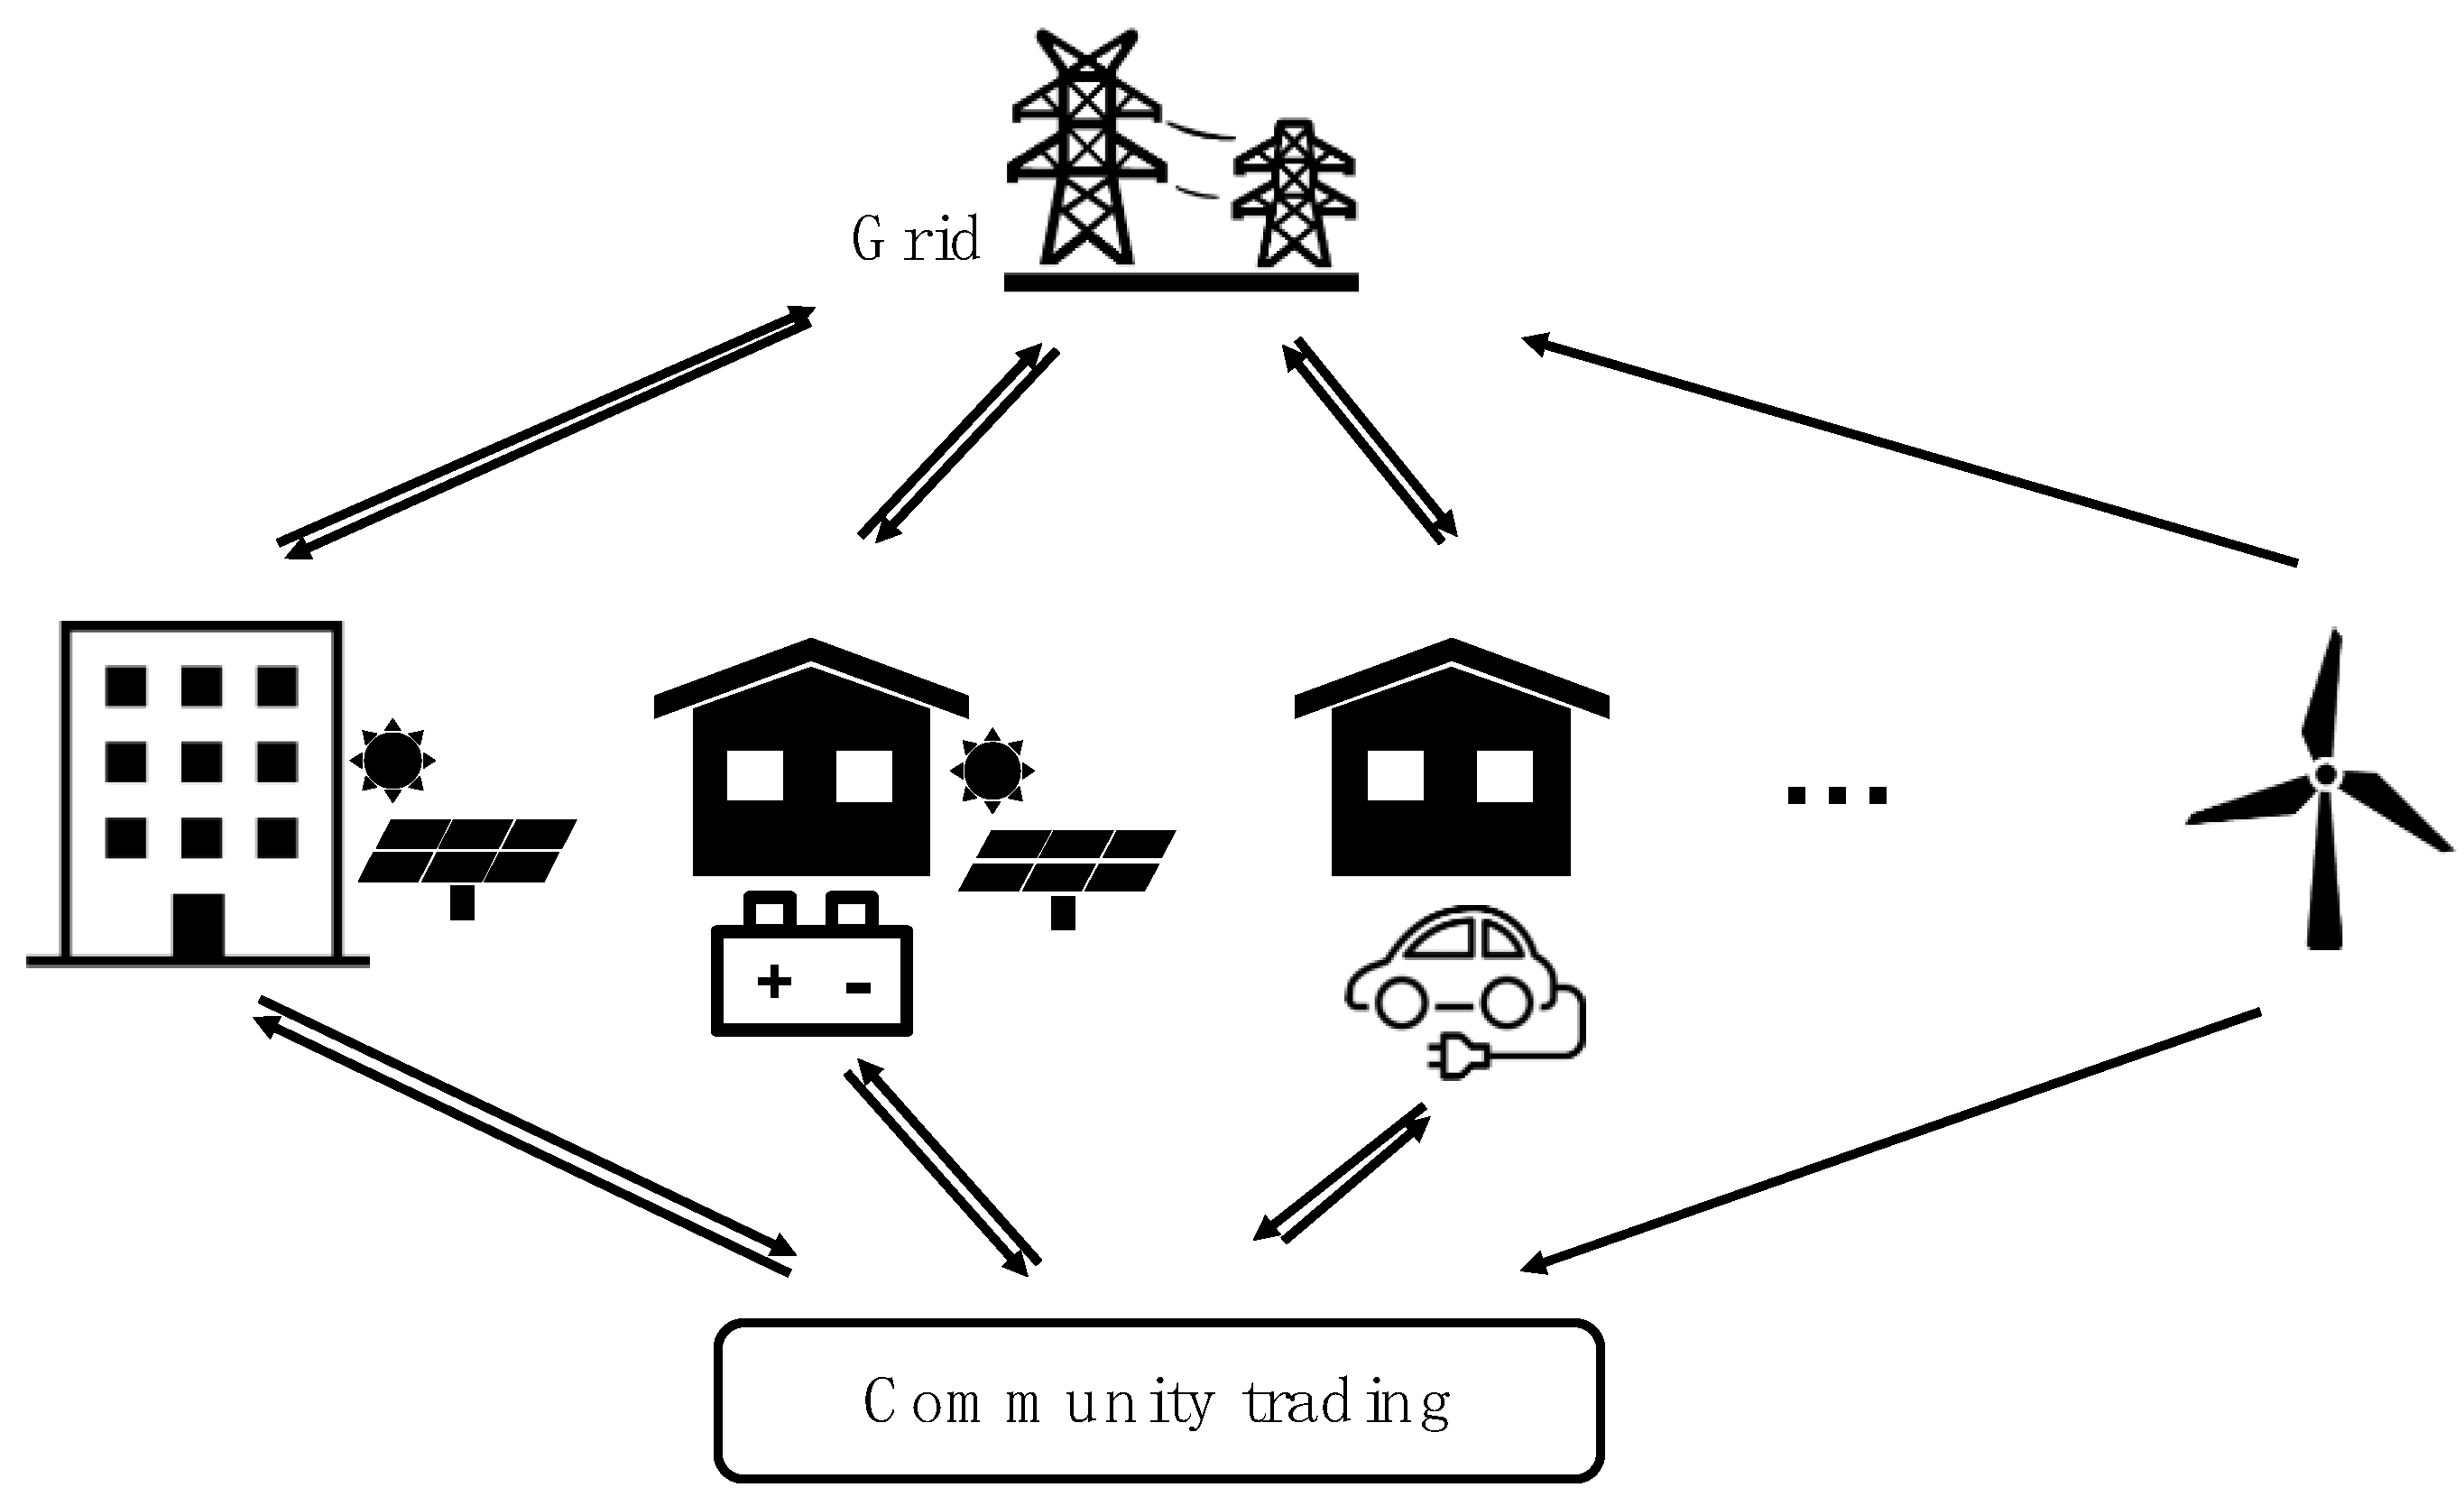
2.1. Brief Description of Simulation

As mentioned in Section 1, this study belongs to the community-based markets model. A unique characteristic that differentiates this study from other community-based market studies is that our model is equipped with internal (within a community) and external (between community and grid) trading functions particularly based on consumers’ preferences. Using the trading function and the battery operation, we examine the conditions of the community’s efficient electricity consumption that would lead to the community’s electricity independence or self-sufficiency.
Figure 1 depicts a brief overview of our simulation. This simulation aims to examine the conditions that lead to efficient power consumption in communities, including how to facilitate the use of EVs, batteries, and renewable power generation facilities owned by industries and households, and those installed in a community. Each household and industry holds three preferences regarding power consumption.
This simulation was created using Ubuntu 20.04LTS as the operating system, PostgreSQL 12 as the database, and Python 3.8.5 as the programming language. The data used in the simulation are listed in Table 1.

2.2. Community Generation

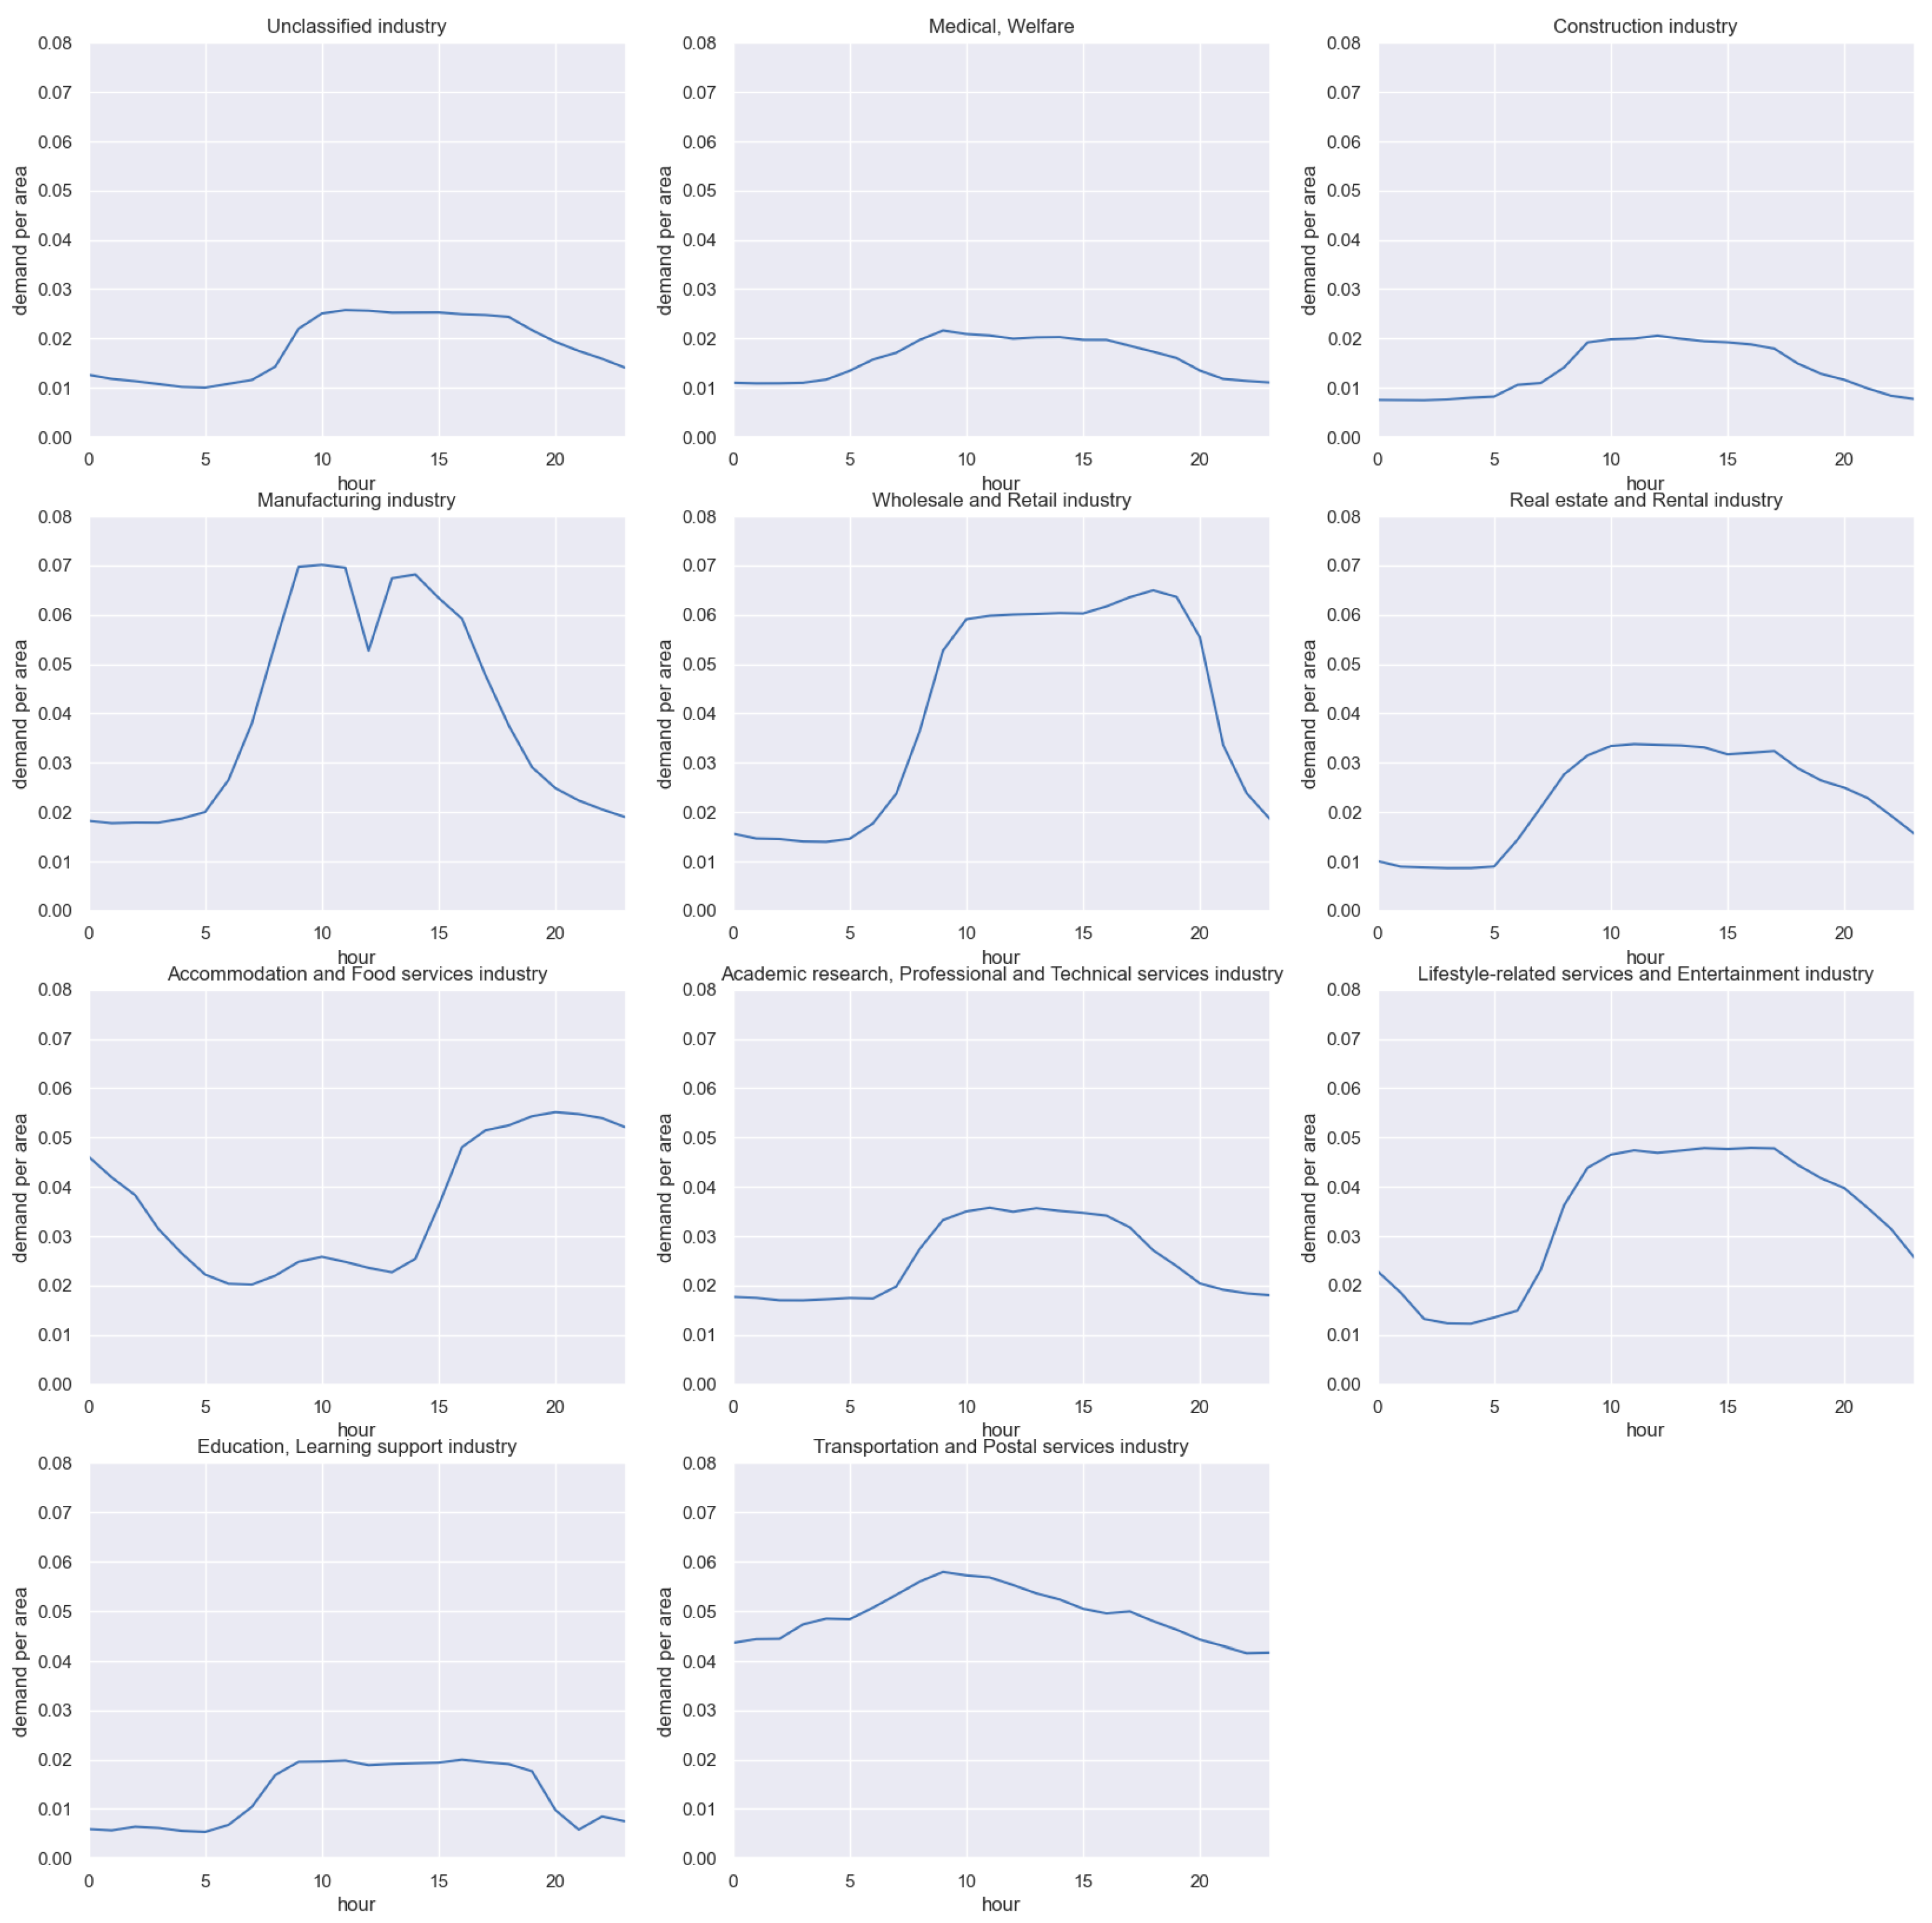
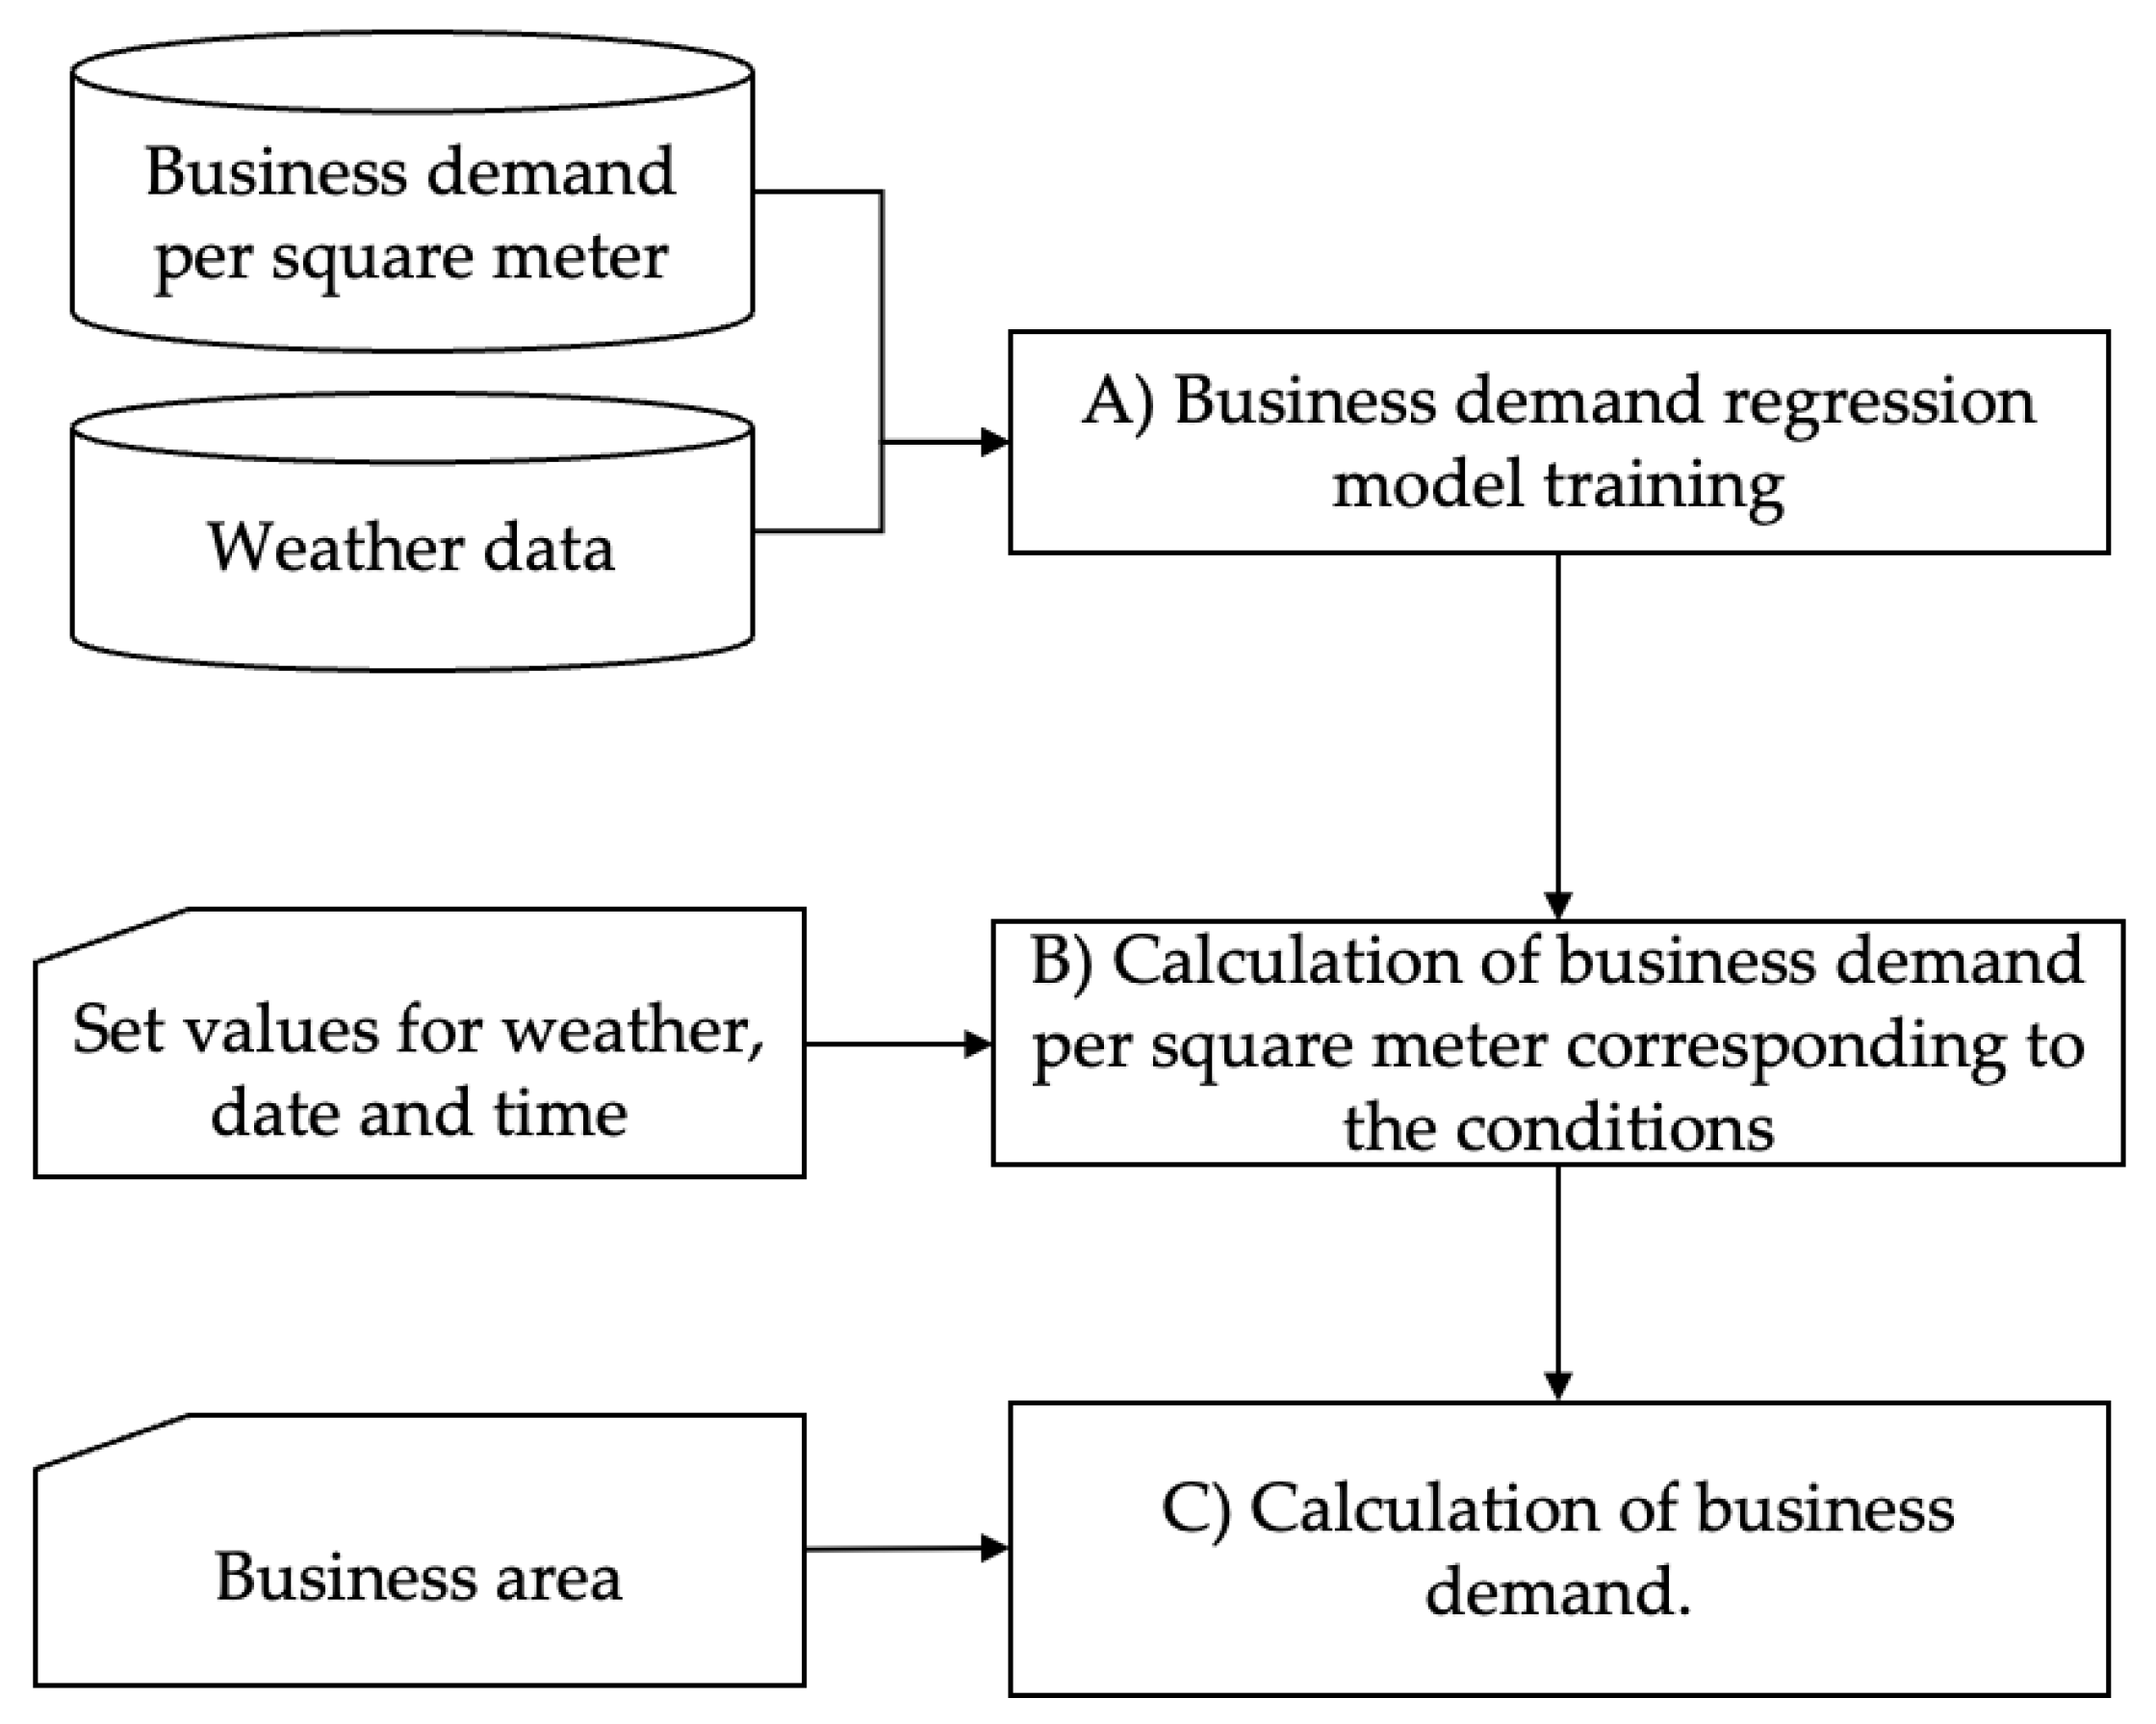
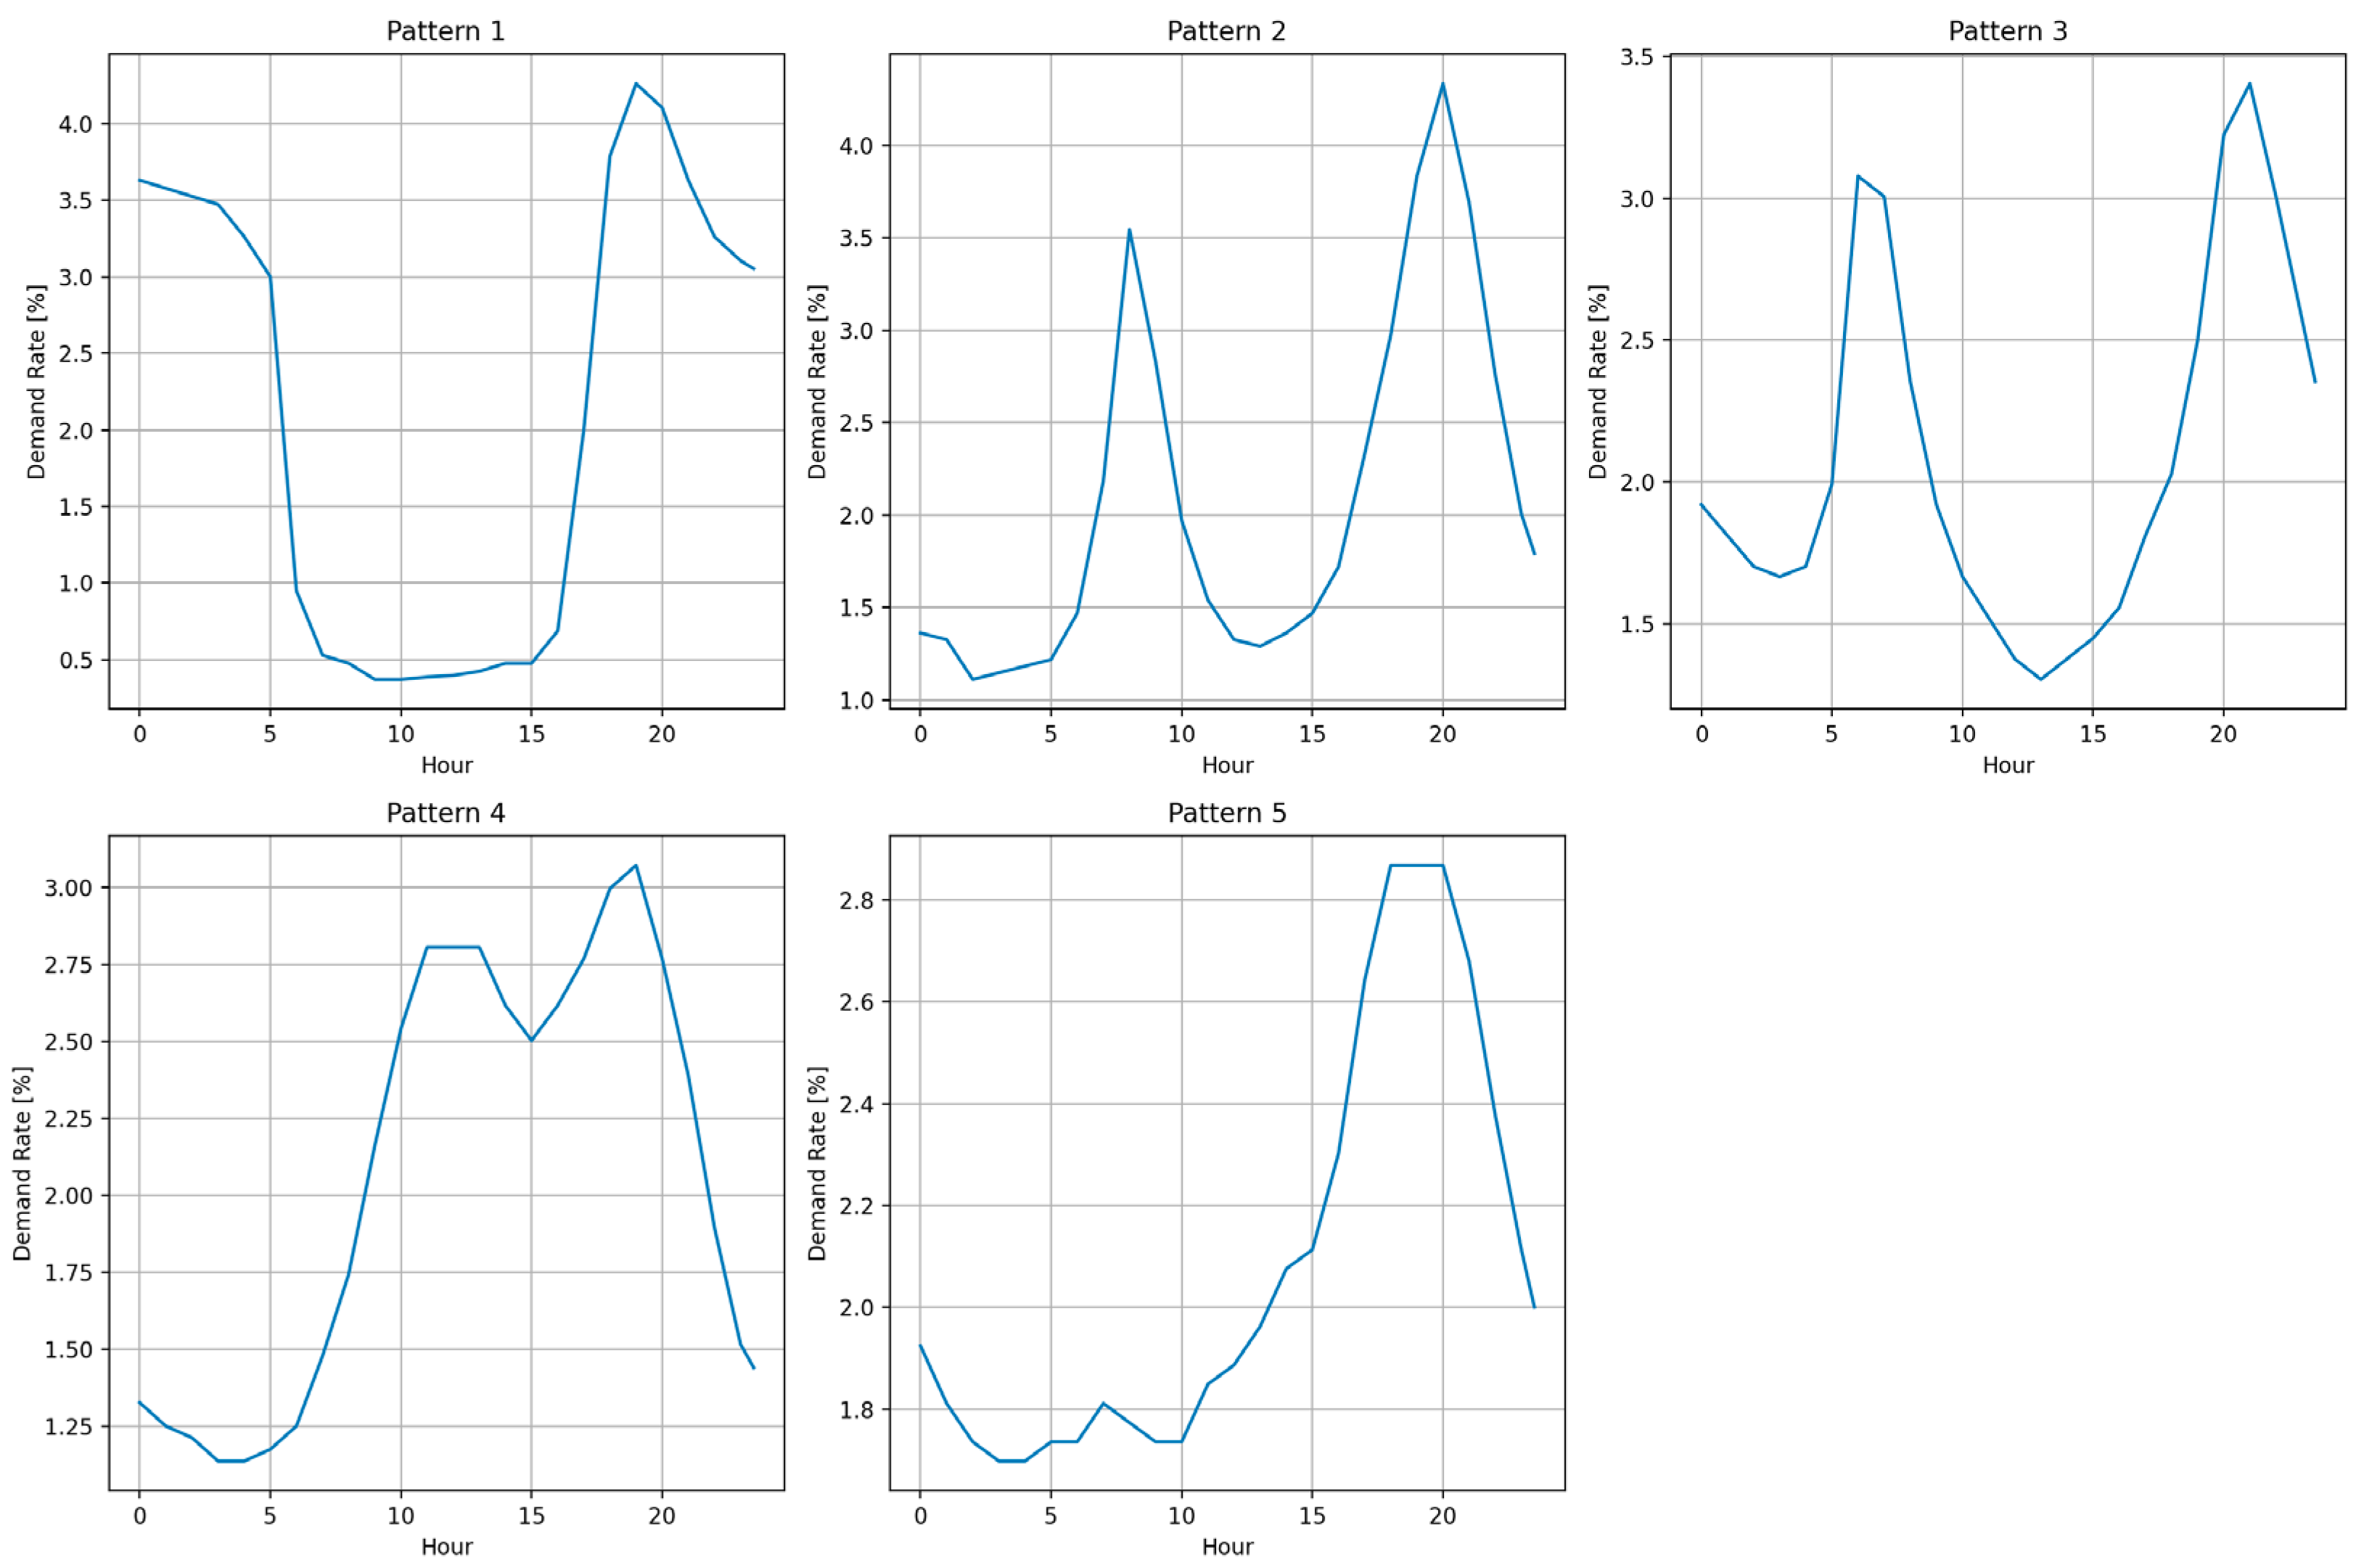
2.2.1. Business Demand Generation

The power demand of each business type (or industry type) is calculated as a product of the power demand per square meter (Figure 2) and the business area, as shown in Figure 3. The flow of the calculation is described as follows.
  • A model that reproduces the power consumption per square meter for each business type is trained by applying a random forest. The explanatory variables used in this study are as follows, from i to vii. The demand data are based on SII (sustainable open innovation initiative) data, and the model predicts the value of each business type per day.
  • Business type;
  • Day of the week;
  • Time;
  • Month;
  • Precipitation;
  • Temperature;
  • Humidity.
The data from SII used in this study include 11 different business types. Table 2 shows these 11 types.
  • The trained model is provided with weather data corresponding to the simulation target date to calculate the power consumption per square meter for each business type, considering the weather conditions. We provide the trained model with the weather data for the simulation target period as an input, and then we obtain the basic load curve for each business type as an output.
  • The power demand for each business is calculated by multiplying the basic load curve by the number of square meters of the business.

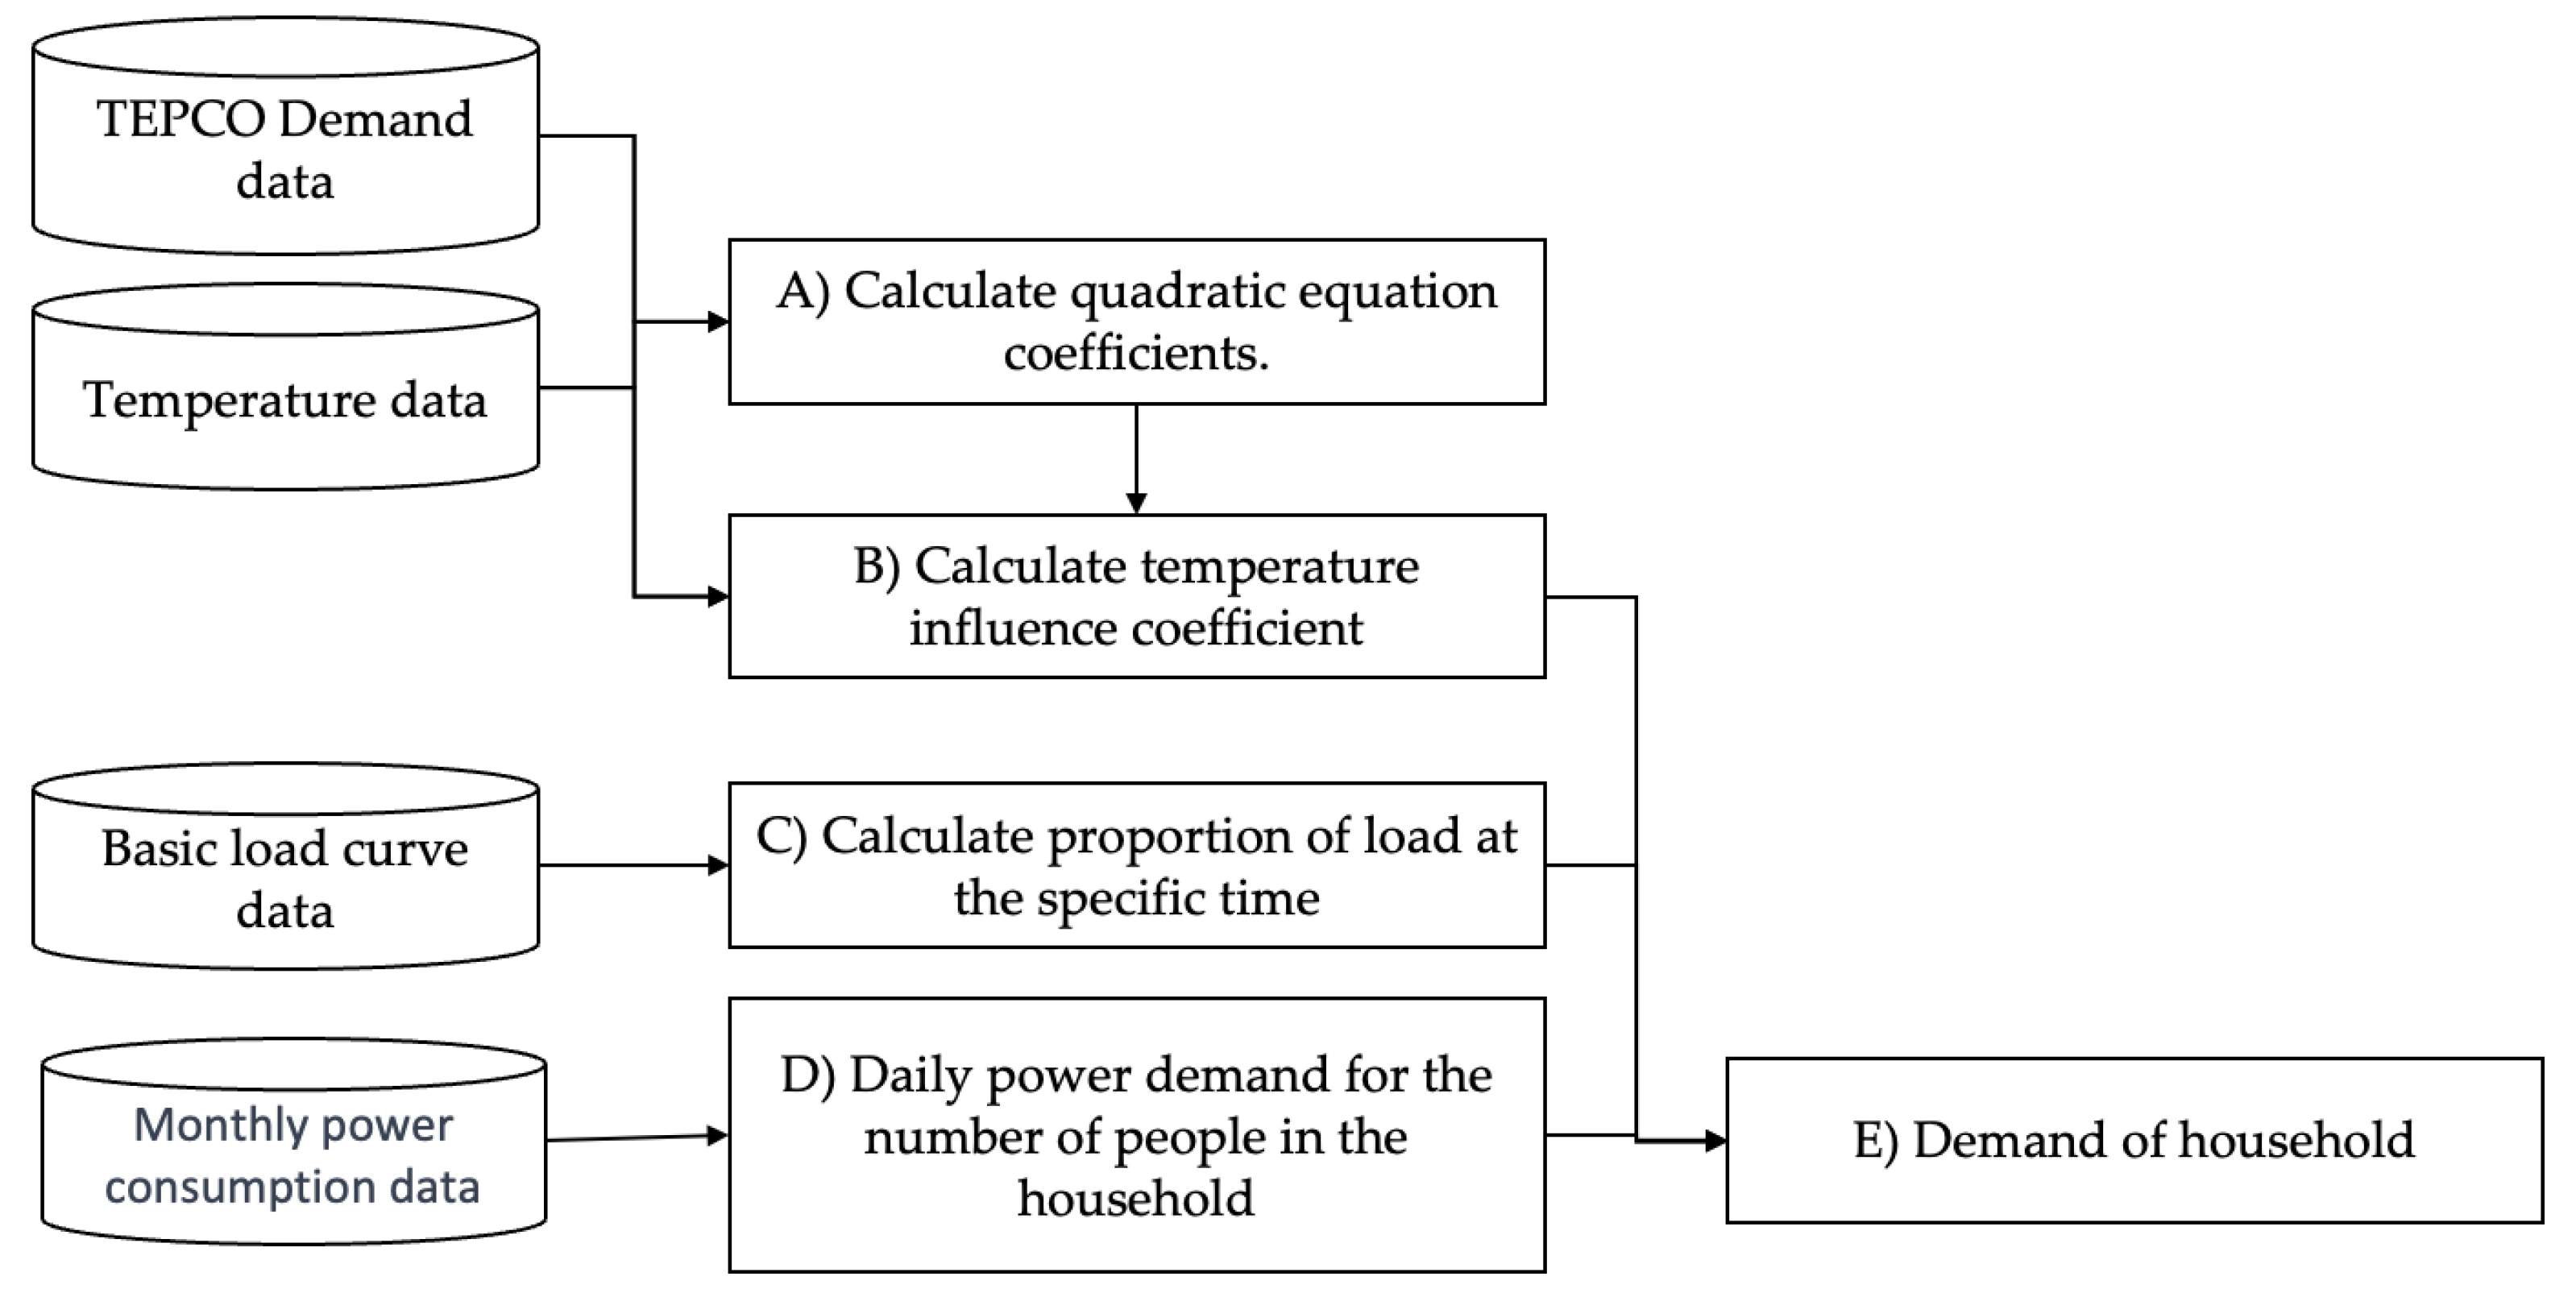
2.2.2. Household Demand Generation

The power demand is calculated by the product of the temperature influence coefficient, the proportion of the demand at the specified time within the basic load curve of one day, and the daily power demand for the number of people in the household (apartment/detached house). The flow of the calculation is shown in Figure 4.
  • Quadratic Equation Coefficient
We create a quadratic regression equation between power demand and temperature to calculate the coefficient for the difference in power demand due to temperature. Separate regression equations are created for weekdays/weekends and times, and the estimated coefficients are stored. Coefficients of the quadratic regression ( a ,   b ,   and   c in Equation (1)) are calculated using power demand and temperature (T) data in the Tokyo electric power area by the least squares method. The d p r e d is the estimated demand.
d p r e d = a T 2 + b T + c
  • Temperature Influence Coefficient
The temperature influence coefficient ( C T , m , t ) is calculated in Equation (2) from the estimated demand of the quadratic equation divided by the average demand ( d a v e , m , t ) for that month (m) and time (t).
C T , m , t = a T 2 + b T + c d a v e , m , t
Proportion of demand at the specified time within the basic load curve of one day
The basic load curve specifies the percentage of demand for a given time period (demand rate). In this case, five basic demand curves were established in Figure 5. Of these basic load curves, pattern 1 has low daytime demand, patterns 2 and 3 have high morning and evening demand, pattern 4 has high daytime demand, and pattern 5 is relatively flat.
The proportion of demand at the specified time of one day is calculated for each basic load curve. The shape of the load curve is based on the previous literature [36].
Daily power demand for the number of people in the household (apartment/detached house).
The average monthly power demand in Tokyo for apartments/detached houses and household sizes is converted into daily power demand values.

2.2.3. EV Travel Data Generation

This simulator employs a Python framework “emobpy” [37] to incorporate EV into the simulation model. However, in the present case study, EVs are not considered as industry/household assets. As such, a detailed explanation pertaining to consumers’ EV holding and use is omitted from this discussion but could be used for future extension of this study.

2.2.4. Solar Power Generation Data Generation

Solar power generation is calculated by multiplying the solar irradiance [kWh/m2] by a constant coefficient (PV_GENERATION_RATIO) and the system capacity. PV_GENERATION_RATIO is set to 0.75, which is a power generation of 1 kW solar panel per irradiance [kWh/m2]. We can set the number and the capacity of solar PV power generation plants depending on the assumptions of a community.

2.2.5. Wind Power Generation Data Generation
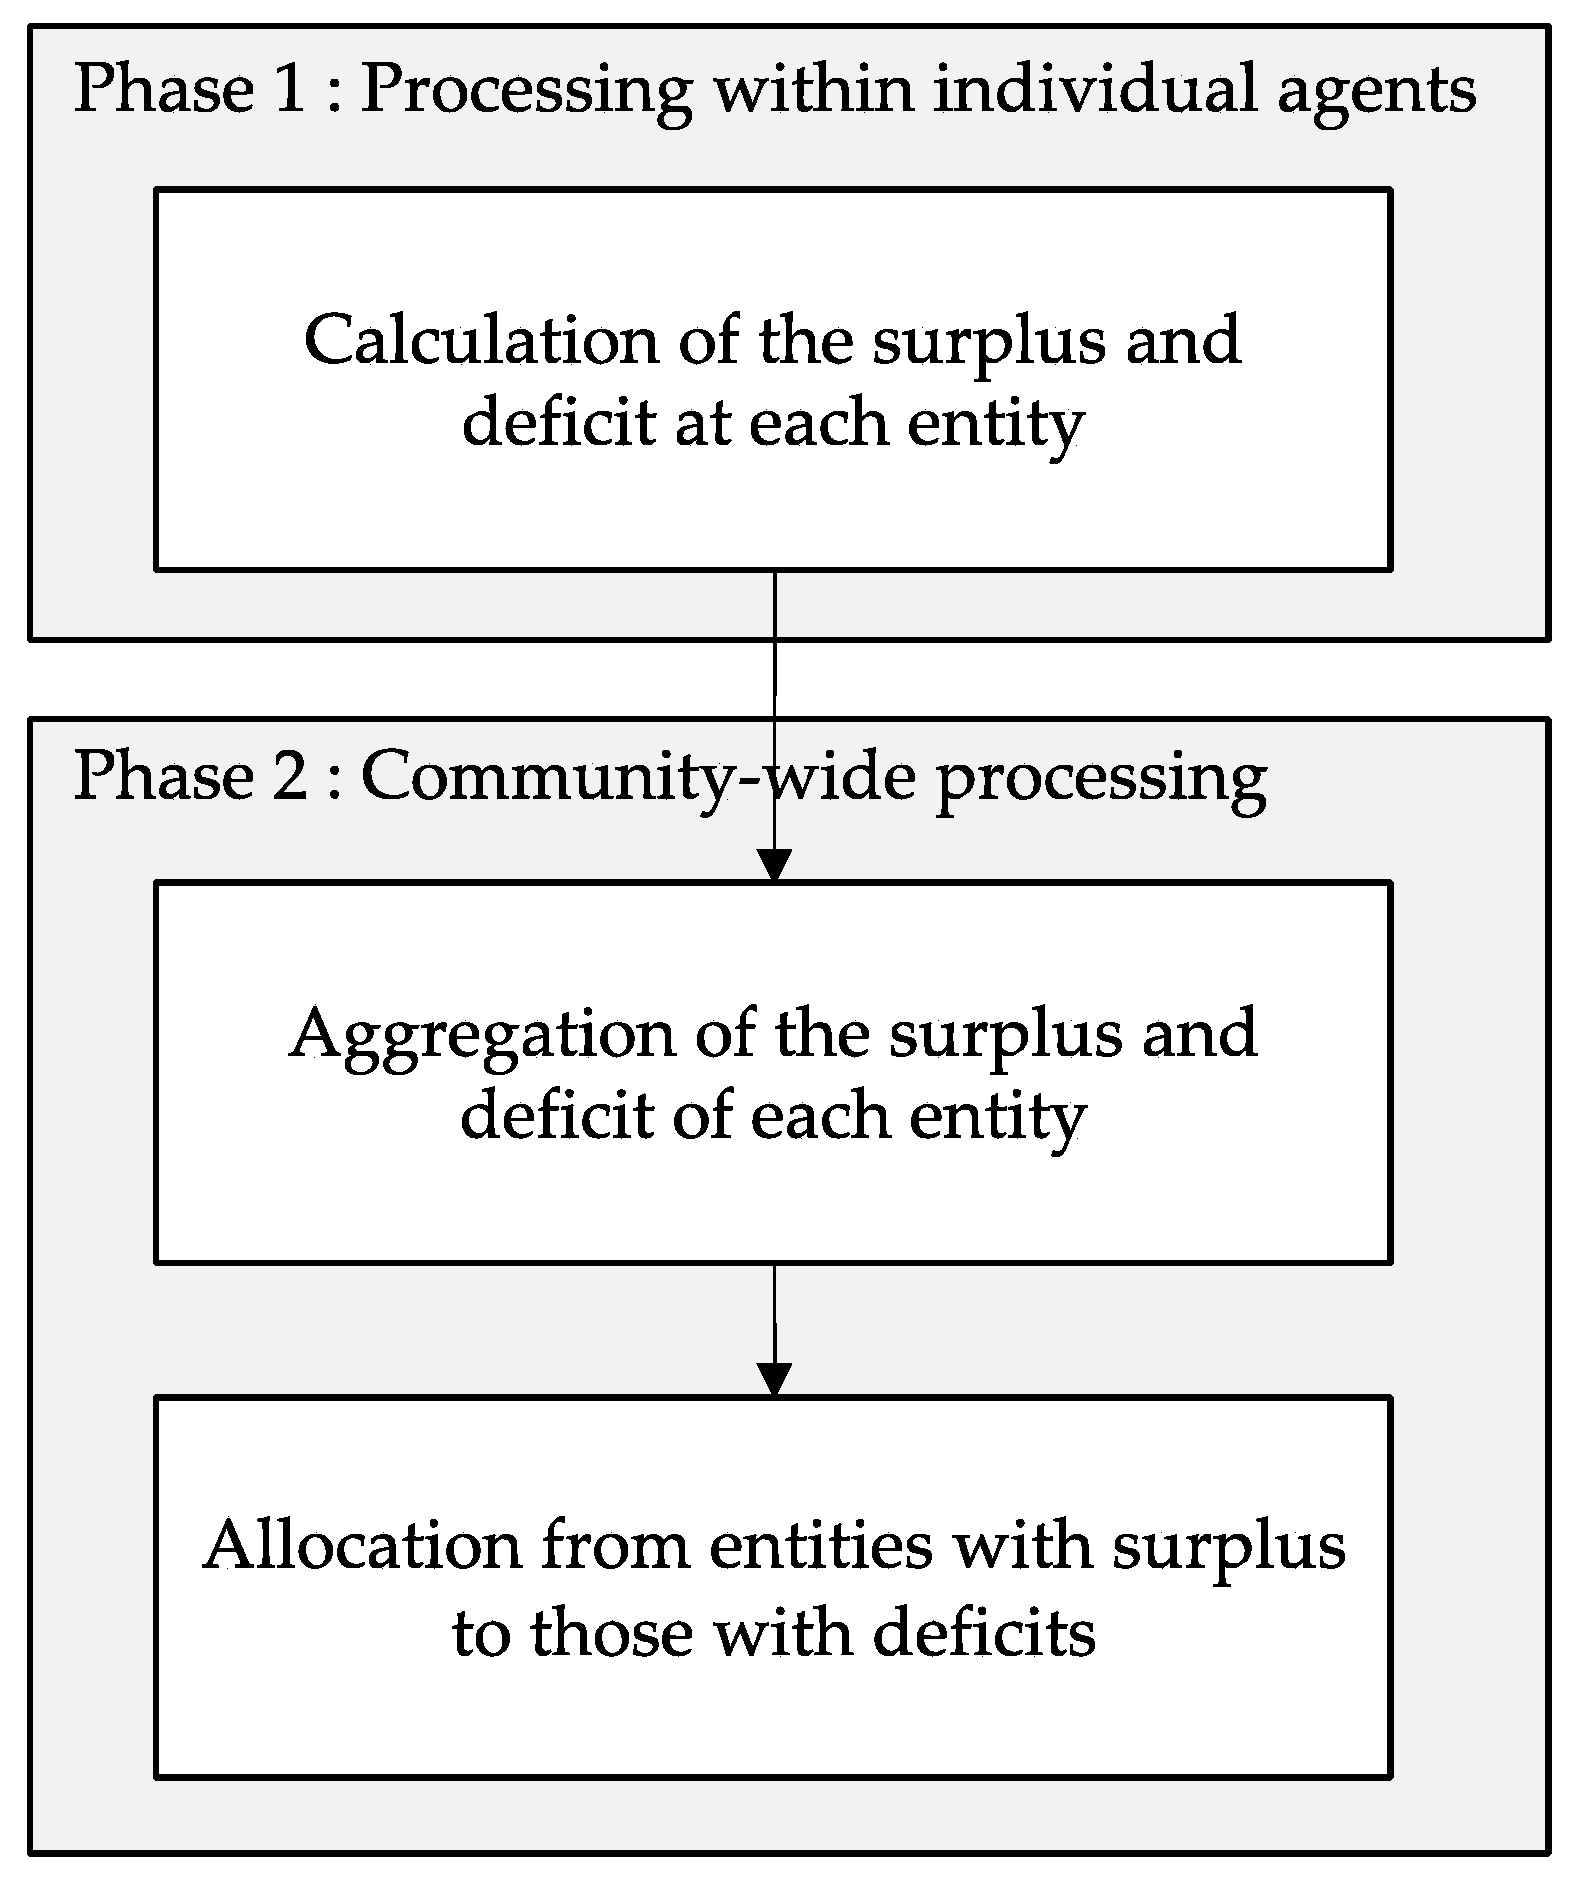
The wind power generation is calculated as a product of the wind speed, a constant coefficient, and the system capacity, ensuring that the maximum output is not exceeded: Min (maximum output, wind speed × coefficient × maximum output). We can set the number and the capacity of wind power generation plants depending on the assumptions of a community.

2.3. Power Trading

In this study, the electricity trading process is divided into two phases: Phase 1 and Phase 2. An overview of the power trading process is described in Figure 6. Initially, in Phase 1, the demand and generation within each entity are calculated, the amount of charging and discharging within each entity is temporarily determined, and the surplus and deficit at each entity are computed. Phase 2 is split into two parts. In the first part, the surplus and deficit of each entity are aggregated to compute the energy surplus or deficit for the community as a whole. In the next part, allocation from entities with surplus to those with deficits occurs, taking into account the preferences of the members and the charging and discharging of batteries.

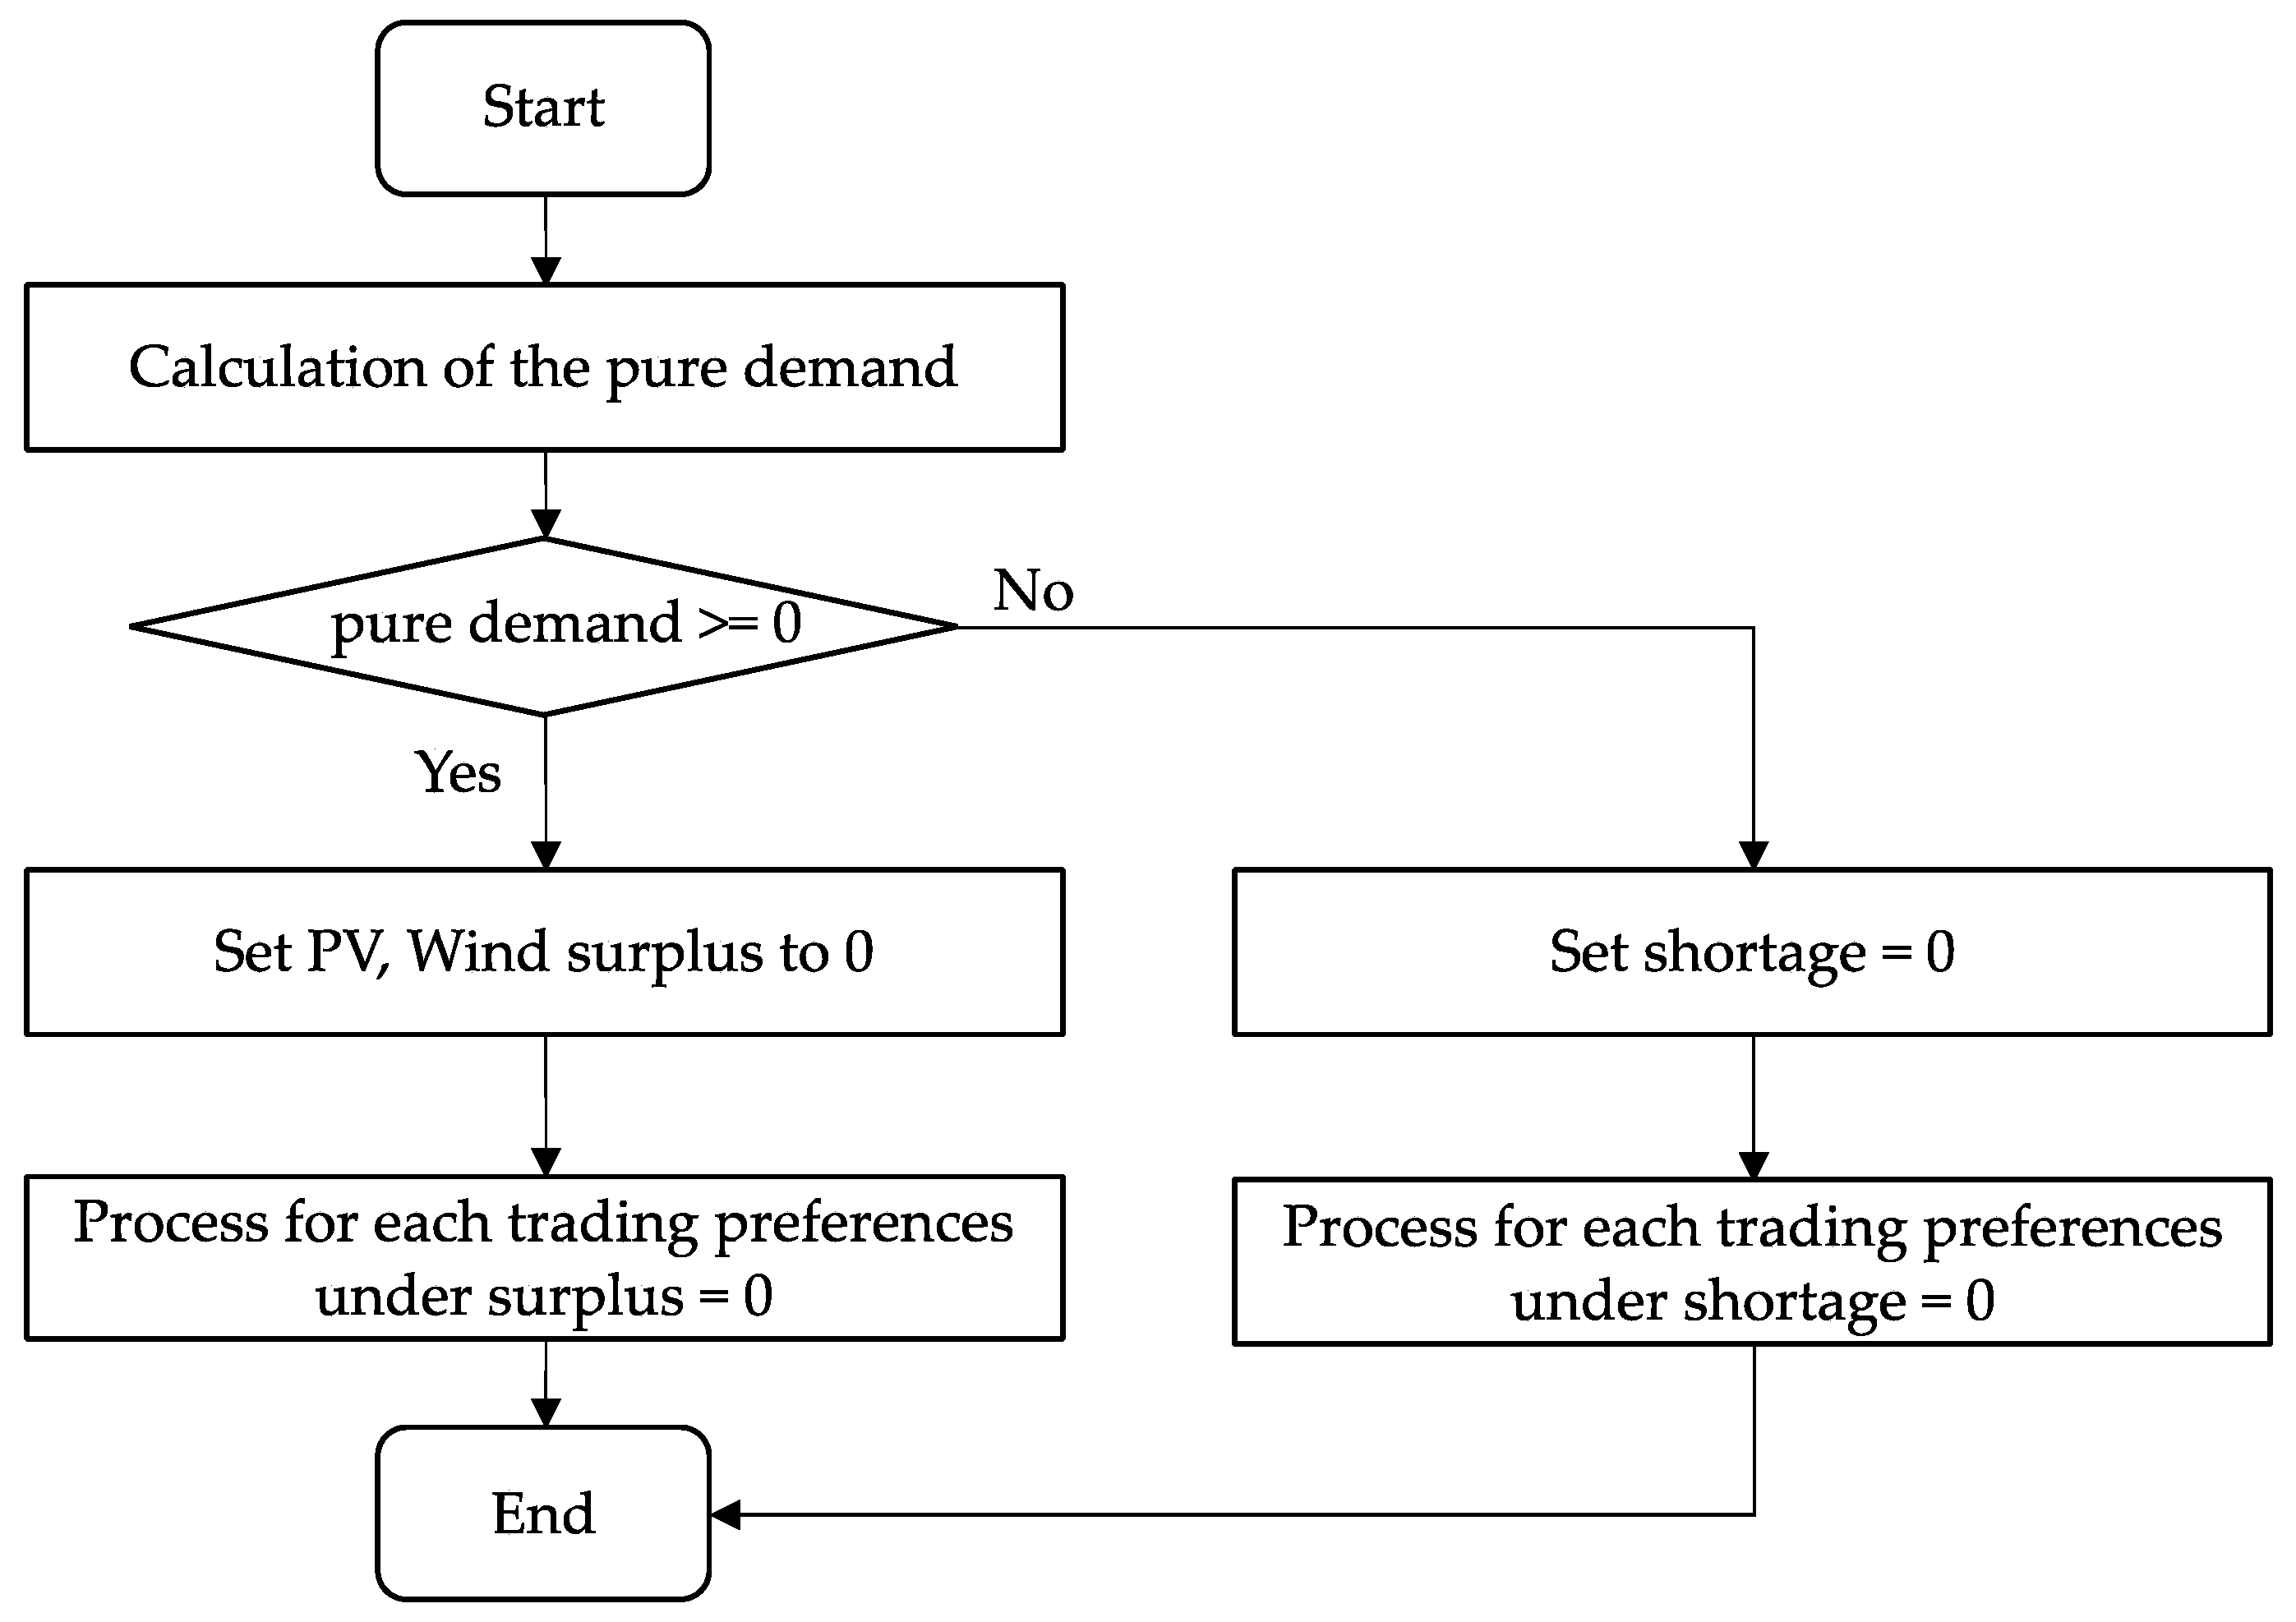
2.3.1. Phase 1: Processing within Individual Agents

The simulation model calculates the electricity surplus and deficit based on individual agent preferences. In particular, battery operation is influenced by agent preferences. For each entity, considering their preferences, the model calculates the surplus and shortage of electricity after performing battery charging and discharging operations. Table 3 describes the definitions of the variables used in the model, the summarized flow is described in Figure 7, and the detailed process of the consumers (individual agents) is shown in Table 4. In Figure 7, each “Process” step represents multiple actions including calculating, setting variables, checking conditions, etc. Due to the complexity and nested conditions of the pseudocode, it is challenging to represent everything accurately in a flowchart. To fully understand the logic, one needs to look into each “Process” step, where further decisions and actions are taken.

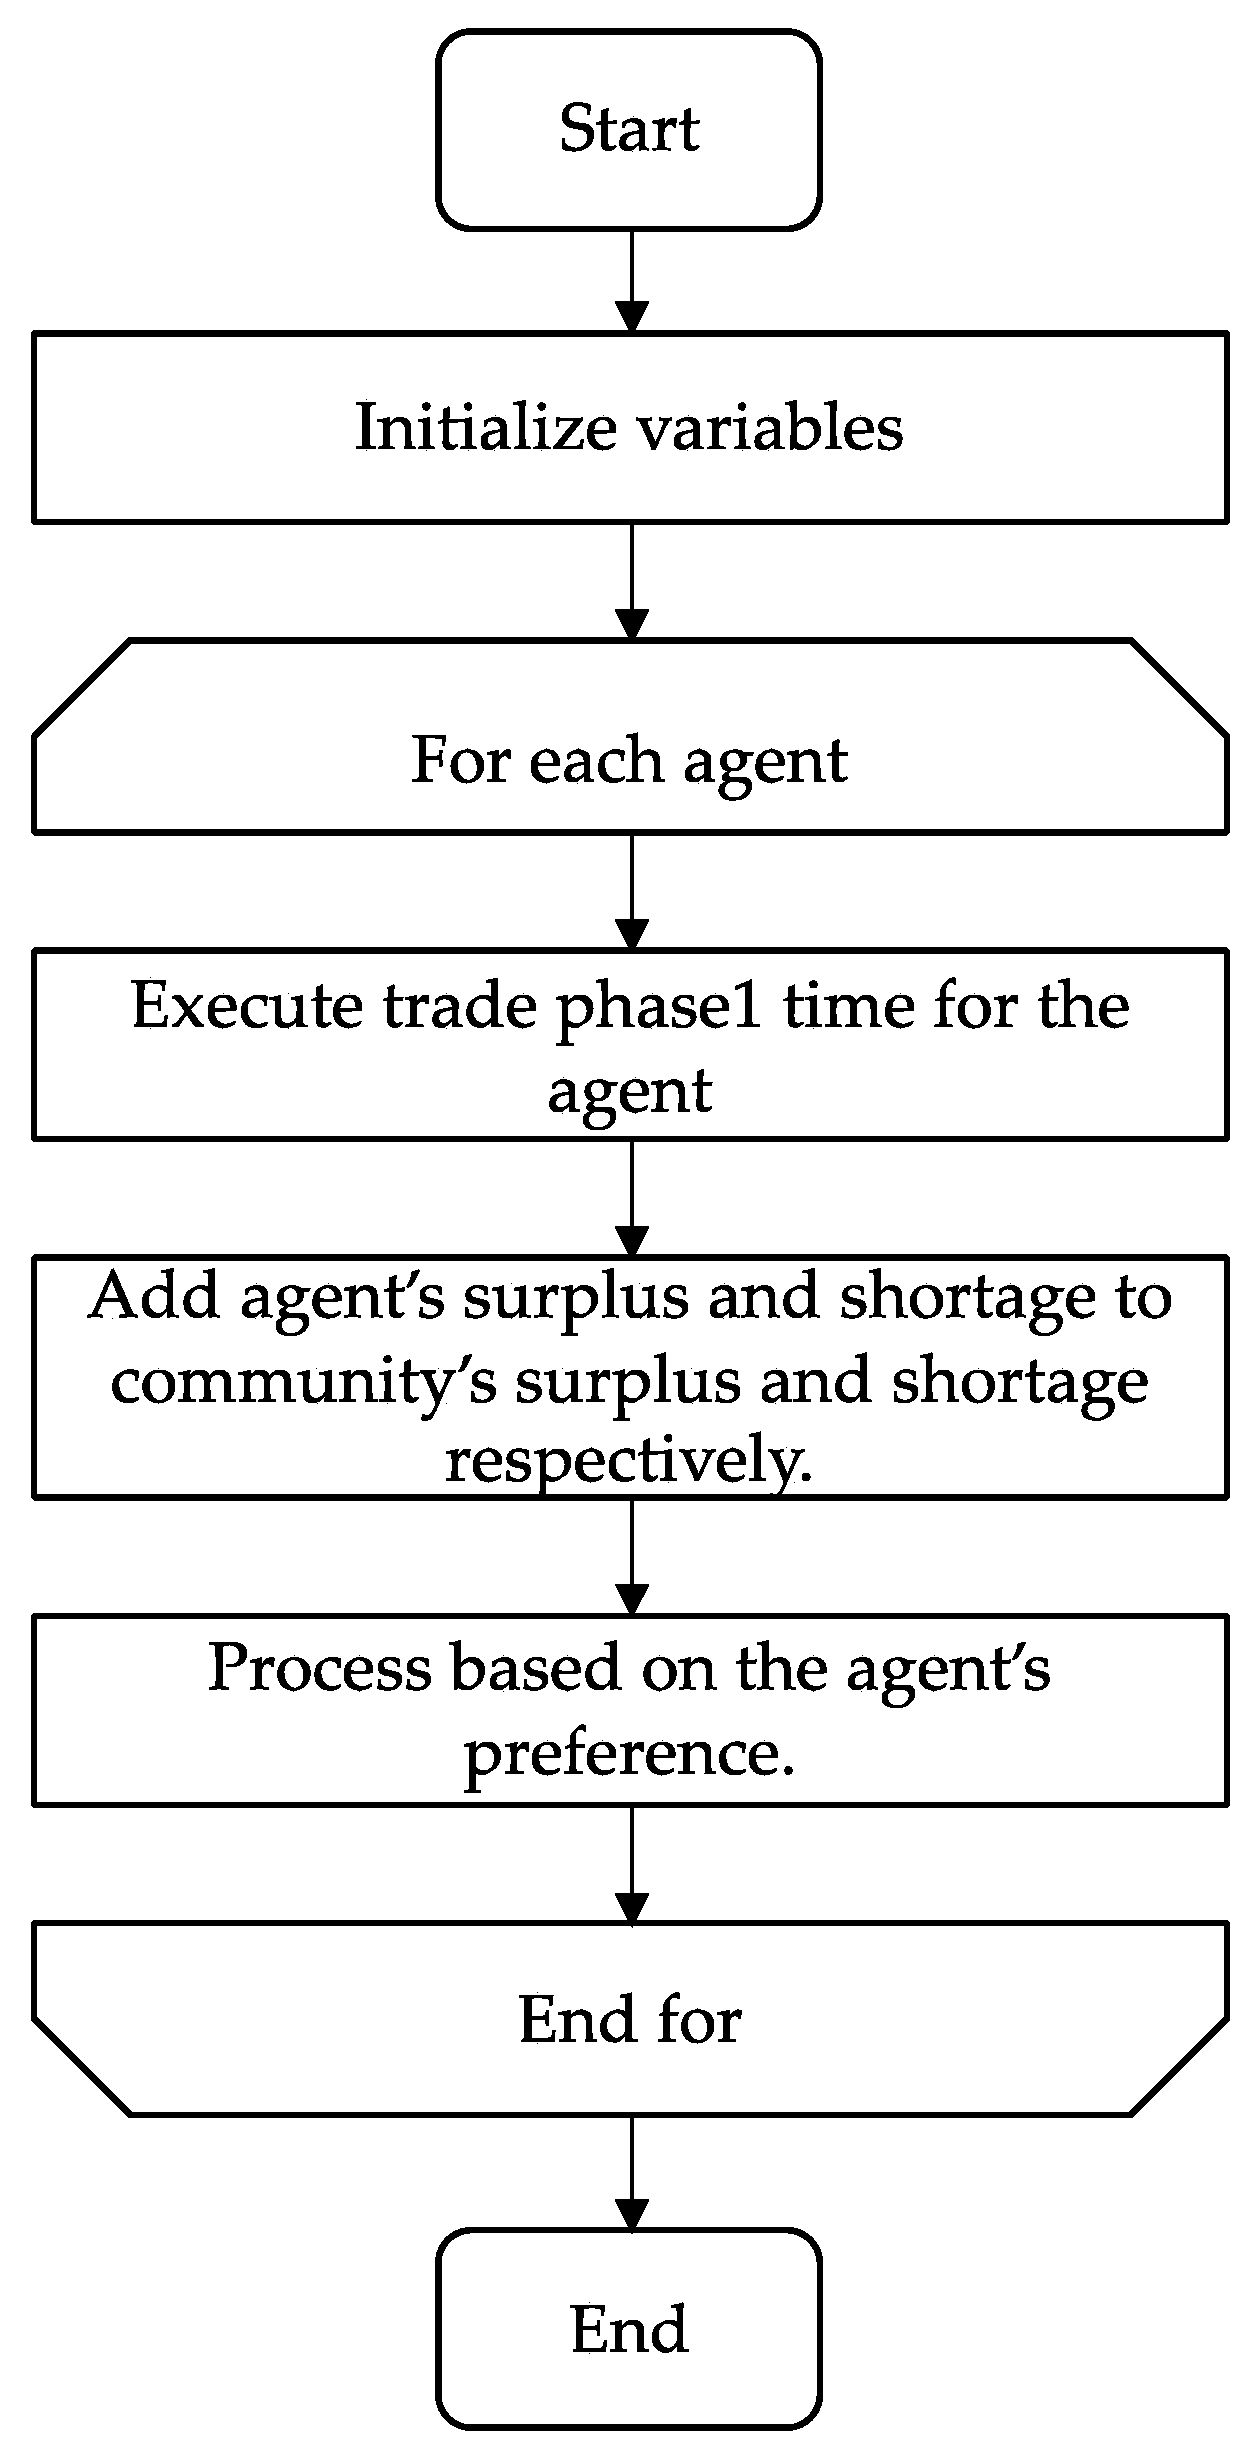
2.3.2. Phase 2: Community-Wide Processing

Phase 2: Community-wide processing aggregates individual agent surpluses and allocates electricity to agents who hold deficits based on their preferences. The distribution of surplus electricity within the community is determined by considering each agent’s preferences. Concretely, in order to determine the priority for allocating surplus renewable energy within the community, a price difference based on preference is set as described in Table 5. This ensures that individuals with a preference for renewable energy (renewable-oriented) can secure the community’s renewable energy by purchasing it at a higher price. Note that Table 5 is applicable only when the total demand of the community exceeds the total generation of the community. Otherwise, it is possible to purchase electricity at 21 JPY regardless of any preference type. These entities can also trade power with the grid. Table 6 presents the transaction prices with the power grid. The price of 22 JPY for grid power purchasing in Table 5 assumes the power purchased from outside the community where we assume most of the electricity is produced from conventional power plants such as fossil fuel and nuclear power plants.
Phase 2 of the process is bifurcated into two main parts. The initial part, as outlined in Table 7, involves the aggregation of surplus and shortage. This step calculates the total surplus and shortage for each community entity at every time interval, using the results derived from Phase 1. The subsequent part, detailed in Table 8, is the allocation of surplus. Here, the previously calculated surplus is distributed to entities that have shortages, in line with their individual preferences. Given the complexity of the entire process, a comprehensive description could be overwhelming. Therefore, we have simplified the process into pseudocode, presented in Table 7 and Table 8, to provide a more digestible overview.
For further clarity, we have also included Figure 8 and Figure 9. These figures offer abstracted flow diagrams of the processes described in Table 7 and Table 8, respectively. Note that these diagrams are simplified representations intended to aid understanding. For a more detailed understanding of the processes, we recommend referring directly to Table 7 and Table 8.

3. Simulation Cases and Results

3.1. Simulation Cases

First, we describe pre-specified conditions and parameters that characterize a community as follows.
The number of industry offices is 50, that of residential homes is 500, and that of community-deployed solar PVs is 4. Although the simulator can incorporate wind power generation plants, this study does not assume the community-deployed wind power generation in order to focus on solar PV generation.
Community solar PV plants: We assume two types of solar PV plants with different capacities, 100 kW (type 1) and 150 kW (type 2). The simulation model is able to set any ratios of these plants for analysis. This study’s case sets 0.3 for type 1 and 0.7 for type 2. Note that we assume there are no conventional power plants, such as fossil-fuel and nuclear power plants in a hypothetical community; however, we assume there are conventional power plants outside the community. Therefore, the electricity generated by conventional power plants comes into the community through the power grid.
Residential composition: [Residence 1] 0.5, [Residence 2] 0.1, [Residence 3] 0.2, [Residence 4] 0.2. Residence 1 assumes a one-person household living in an apartment complex, Residence 2 is a two-person household living in a detached house, Residence 3 is a three-person household living in an apartment complex, and Residence 4 is a four-person household living in a detached house. The demand levels depend on the types of residence as described in Section 2.2.2.
Industry composition: 0.1 for each industry from [Industry 1] to [Industry 10]. These industries are assumed from 1 to 10 as follows (see also Table 2): 1: real estate and goods-leasing business, 2: manufacturing industry, 3: lifestyle-related services and entertainment industry, 4: accommodation industry and food services industry, 5: construction industry, 6: education industry and learning support industry, 7: academic research, professional and technical services industry, 8: wholesale and retail industry, 9: transportation industry and postal industry, 10: medical care industry and welfare industry. Each industry is given electricity consumption per square meter of office (electricity intensity), which is used to derive electricity consumption by multiplying the office’s square meters as described in Section 2.2.1. This study’s case sets 200 m2 for industry 1 and 1000 m2 for the others.
Consumer preference: We assume three types of consumer preferences. Preference 1 characterizes a cost-oriented consumer, preference 2 is a renewable-oriented consumer, and preference 3 is a self-consumption-oriented consumer, as shown in Table 5. We assume these three types of consumers exist at the rate of 0.3, 0.2, and 0.5, for each.
Second, we classify the simulation cases into three categories, A to C, by degrees of solar PV capacity installed in homes and offices, with which three battery capacity levels are matched to form individual cases. We set the base case that assumes no PV and battery capacities. Based on that, category A is for large-size PV capacity installed in homes/offices, B is for medium-size, and C is for small-size. Each category is further extended to three cases depending on the battery capacity; large, medium, and small. It should be noted here that these sizes are invariantly applied both to home and office PVs and battery capacities in cases from A to C. They are summarized in Table 9.
Furthermore, to examine the impacts of a combination of larger battery capacity and smaller home PV size, we assume a case in which offices hold extra-large batteries and PVs with a capacity of 120 kW and 70 kW, respectively, and homes hold extra-small PVs with a capacity of 1 kW. We call this case D, which expands to D-1, D-2, and D-3 depending on the combined home battery sizes from small to large. Moreover, we conducted simulation analyses for different consumer preferences as in Table 5; cost-oriented (preference 1), renewable-oriented (preference 2), and self-consumption-oriented (preference 3) ones. These three types of preferences are also examined by simulations for each case in Table 9, referred to as A-1-1 (preference 1 for all home and office consumers), A-1-2 (preference 2 for all home and office consumers), and A-1-3 (preference 3 for all home and office consumers) for the A-1 case as an example. Three types of preferences are also applied to the D-series simulations.

3.2. Results

We present a summary of the simulation results in Table 10. The output measures from the simulation results listed in the table are described as follows.
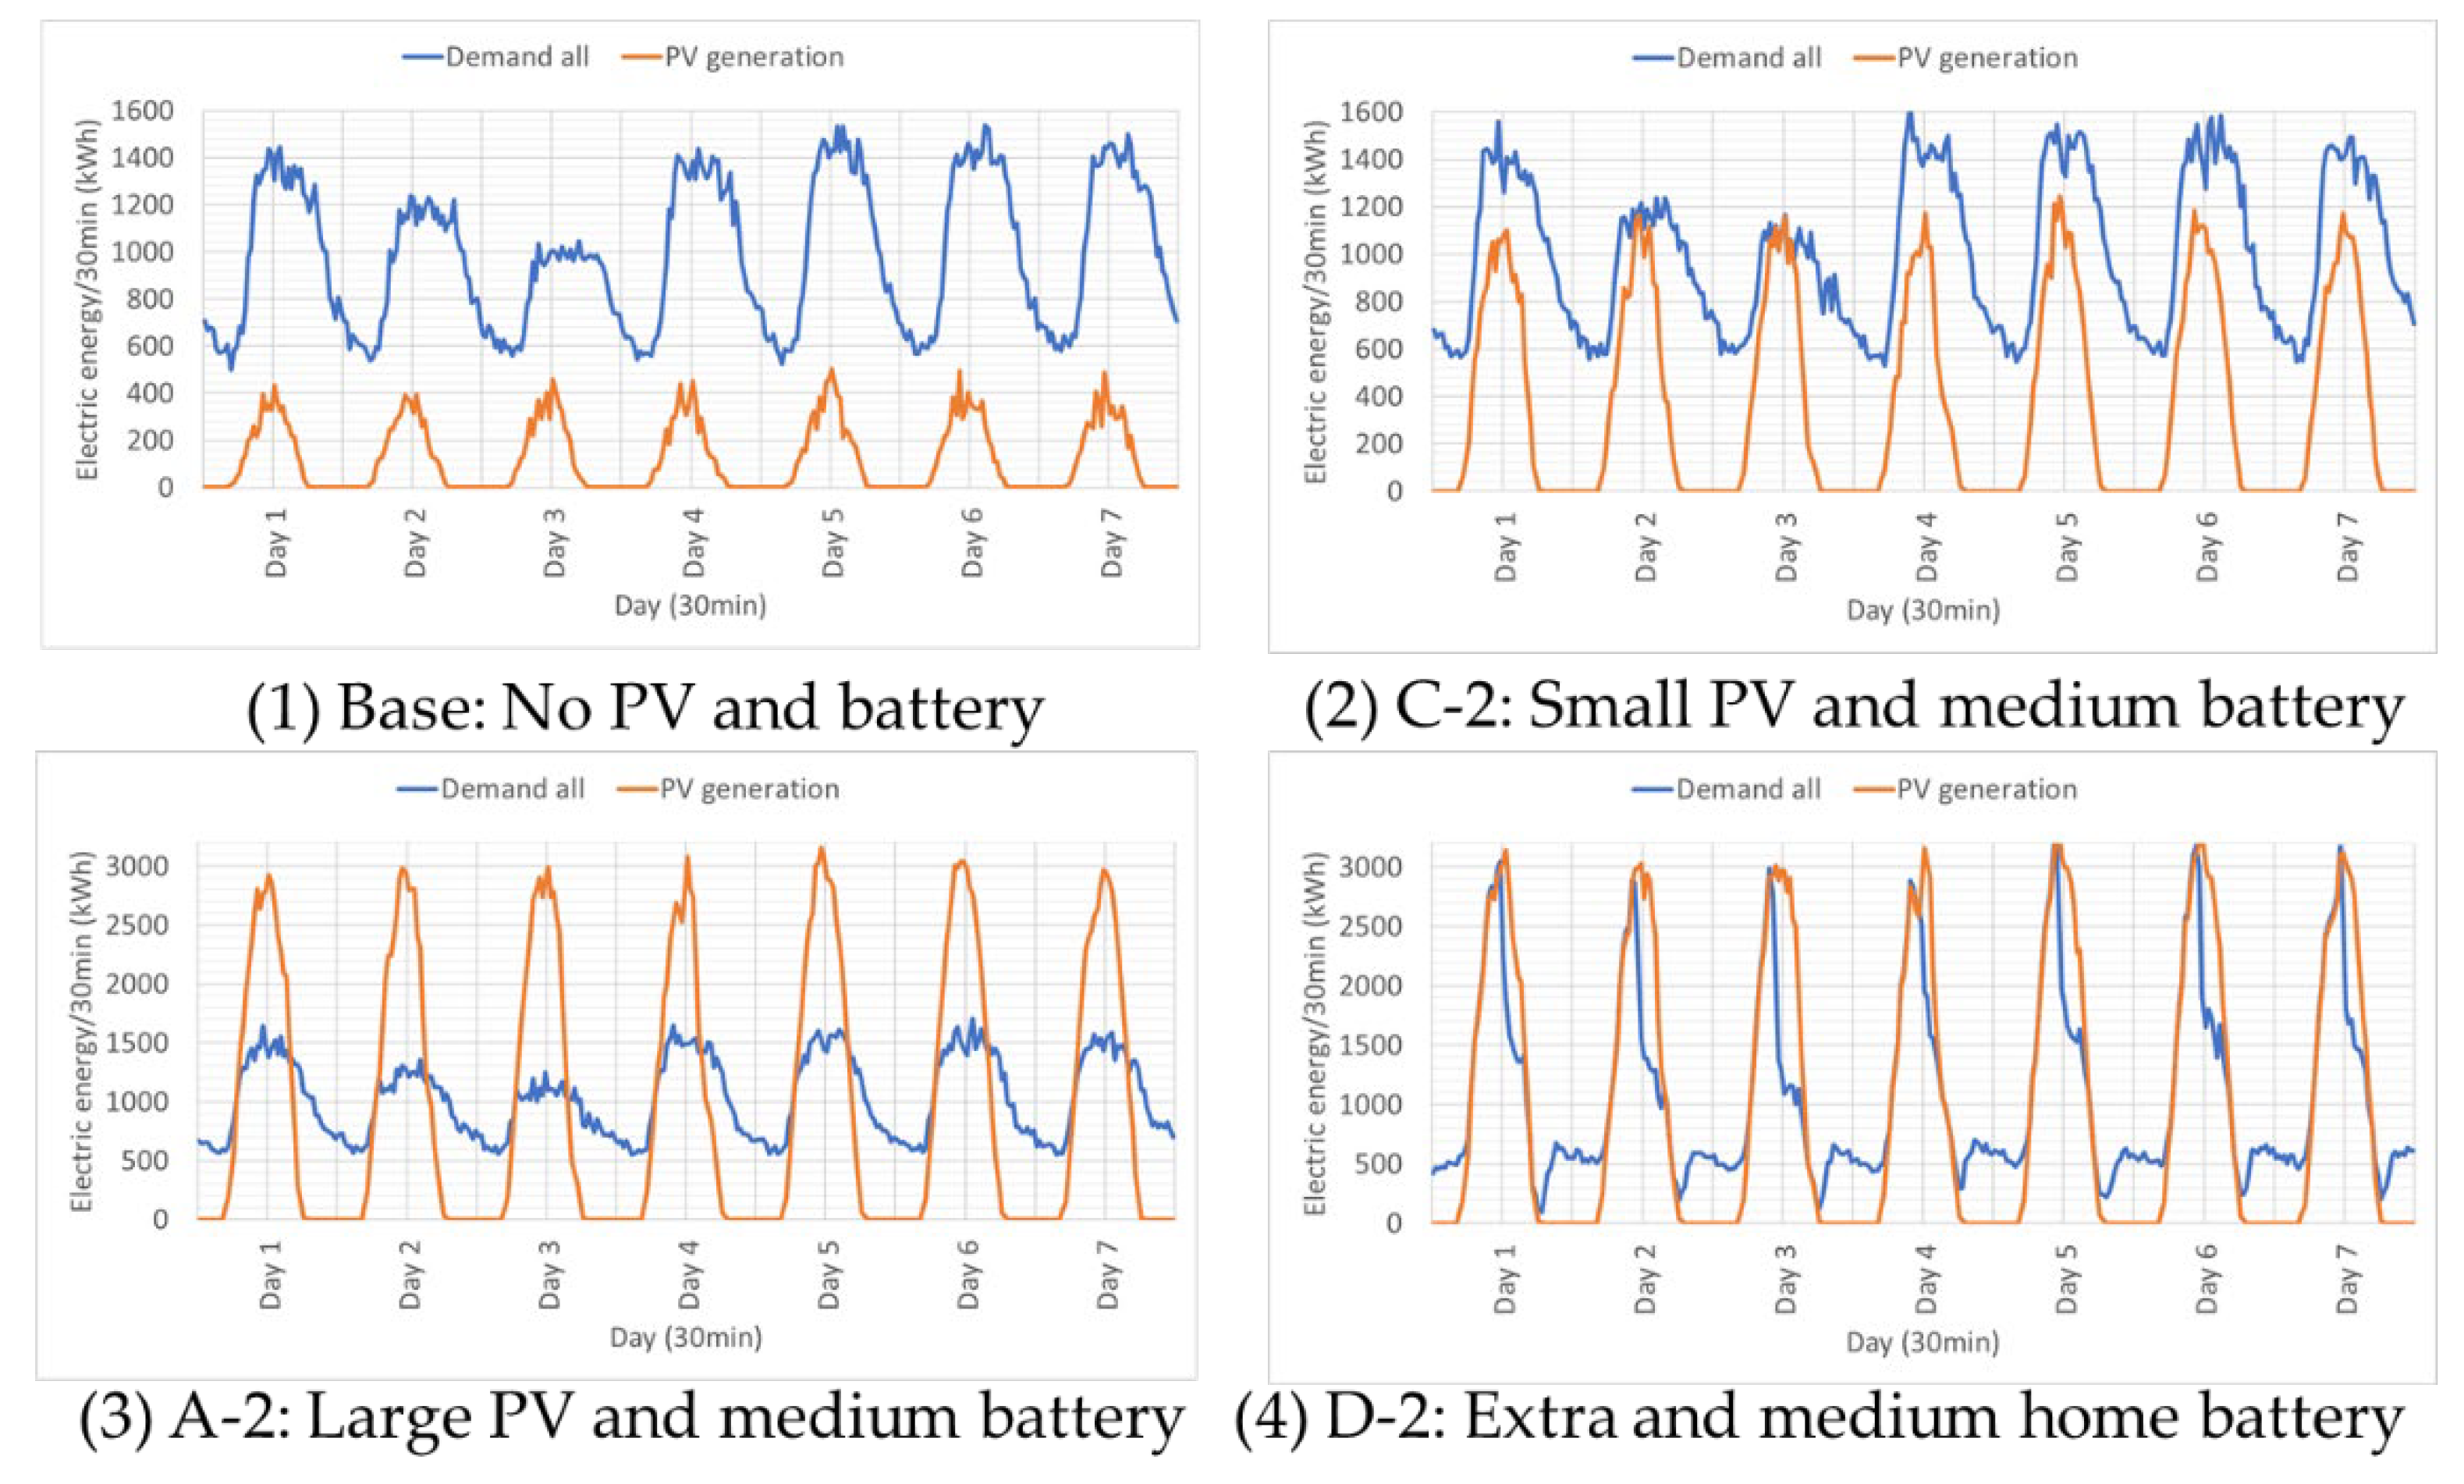
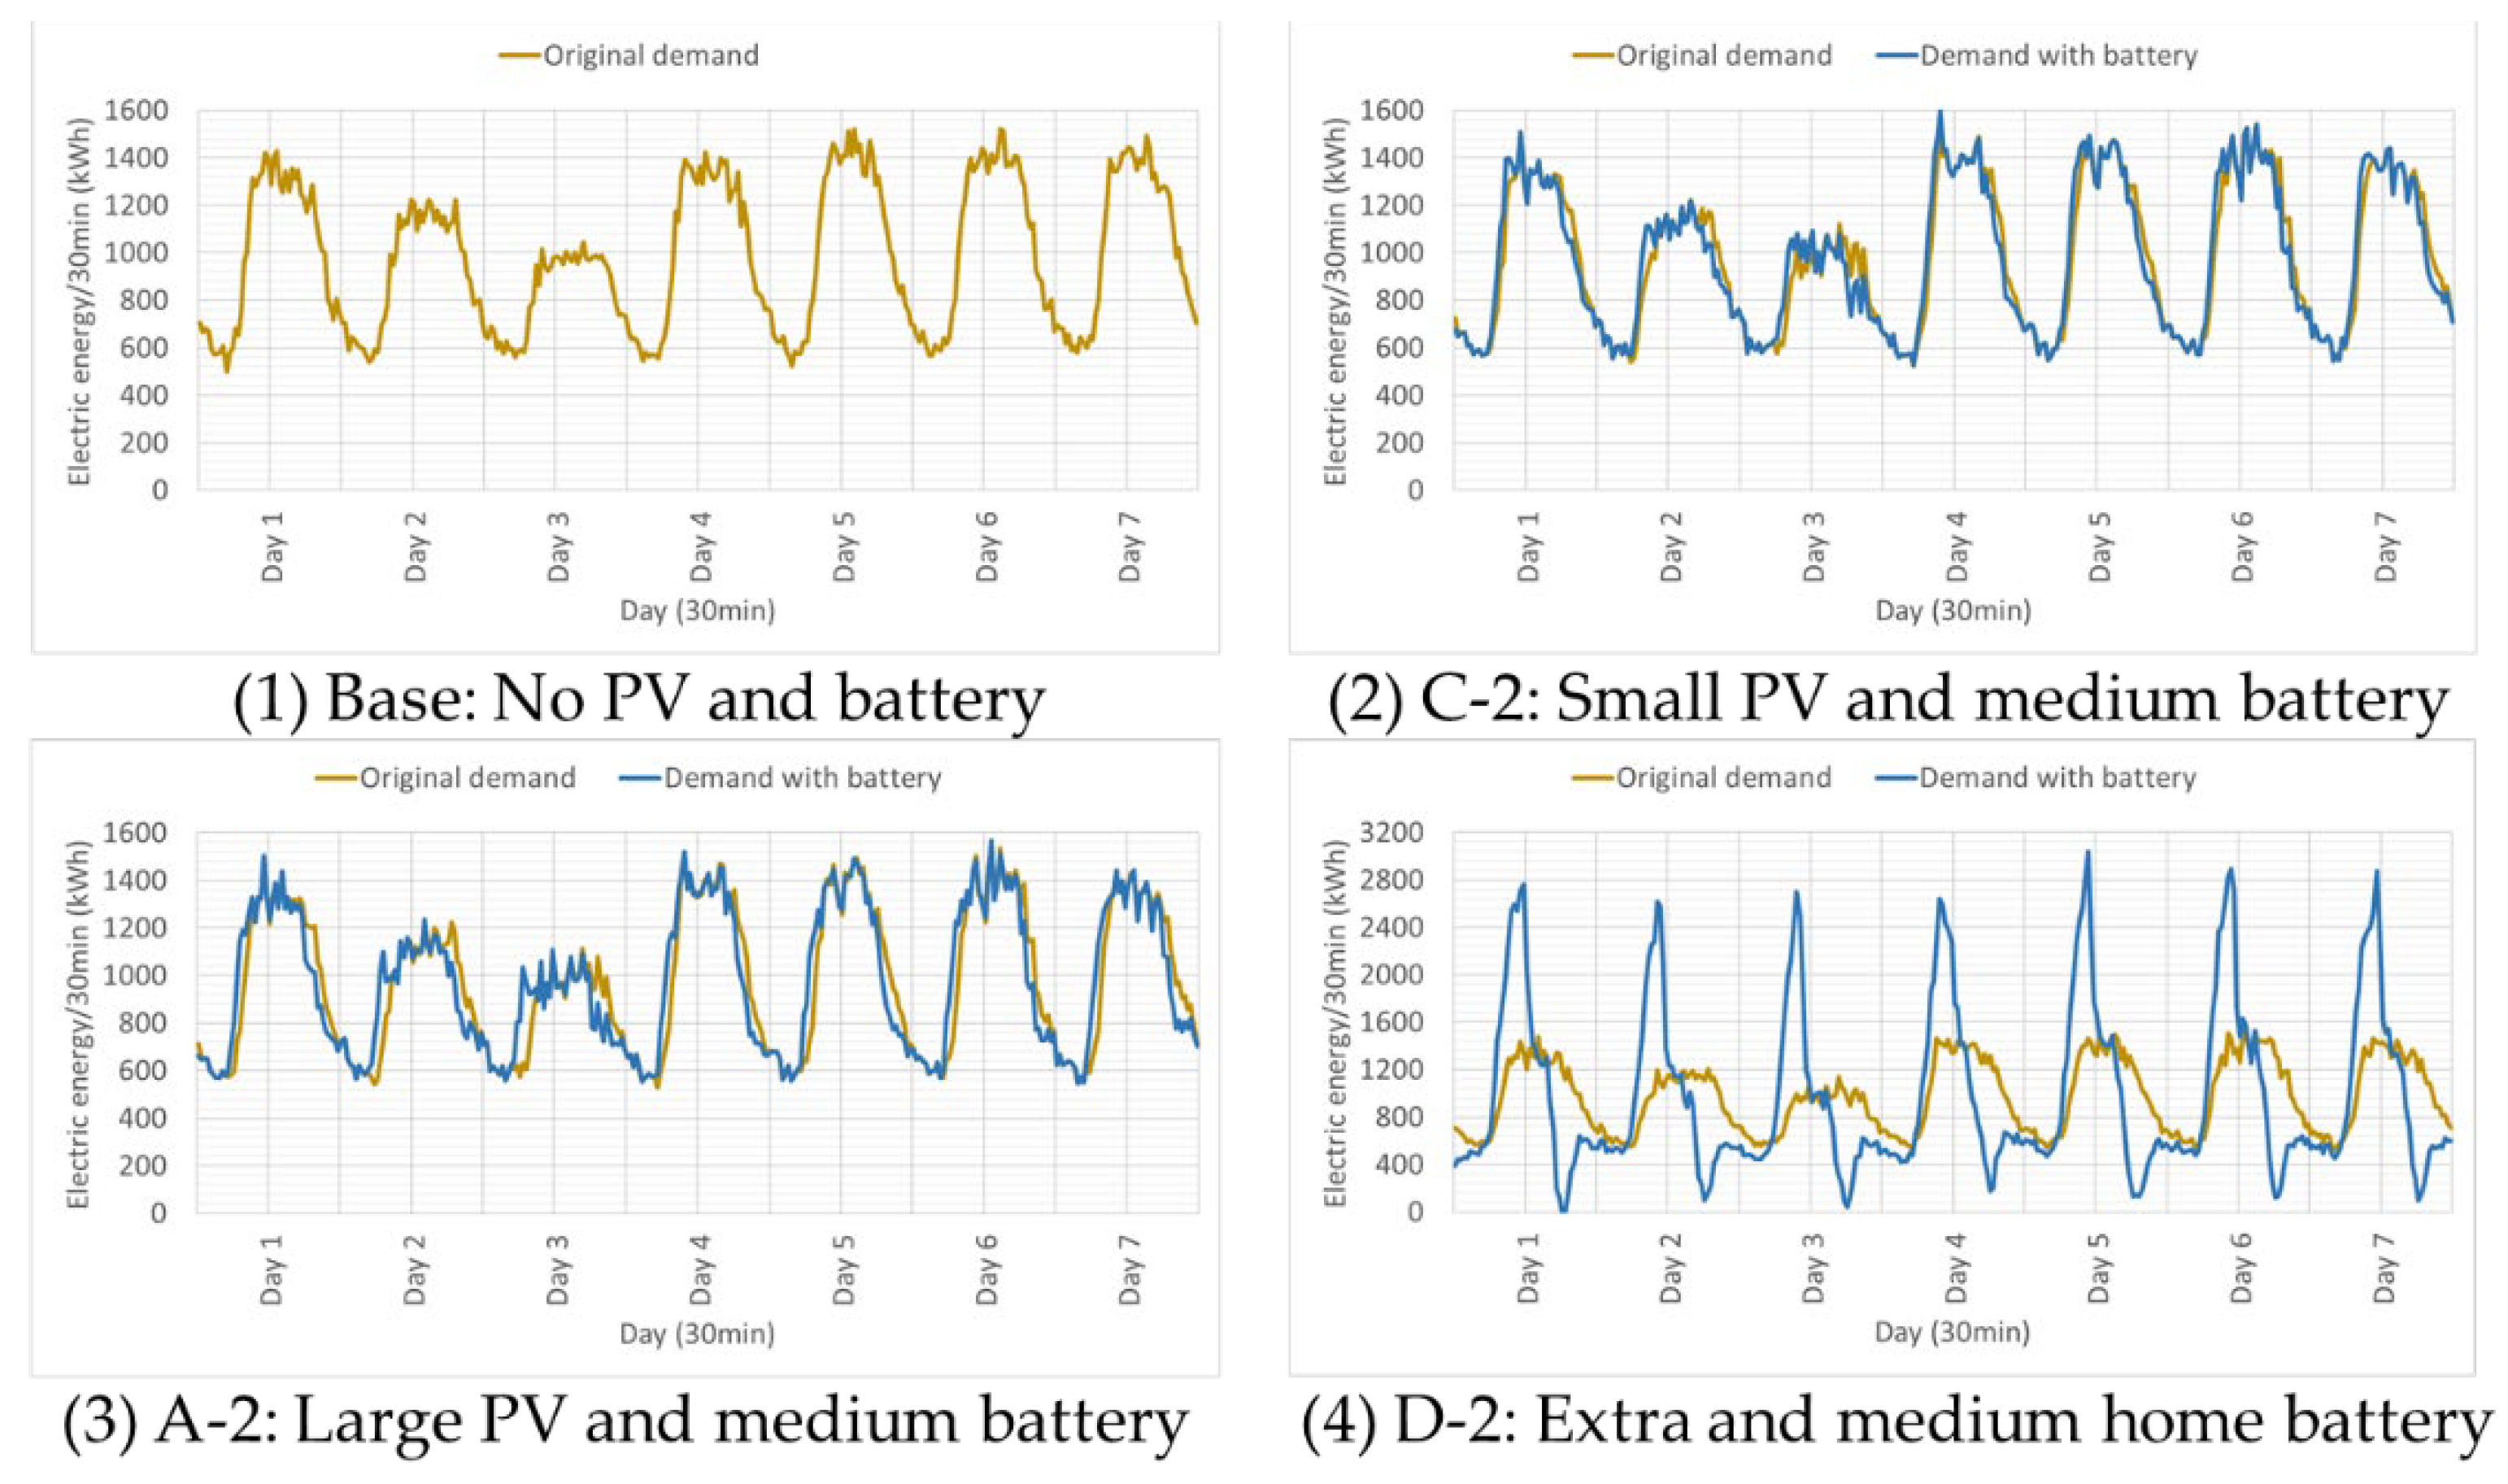
  • [Demand] is the total sum of consumed electricity by all homes and offices in the community (kWh).
  • [PV generation] is the total generated electricity by all solar PV generation facilities (community-deployed solar PV plants and consumer-owned solar PV facilities) in the community (kWh).
  • [Grid purchase amount] (kWh) is the total electricity that homes and offices purchase from the grid and use in the community.
  • [Grid purchase cost] (JPY) is an expenditure for the purchased electricity from the grid, which is calculated from the system average price multiplied by the [Grid purchase amount].
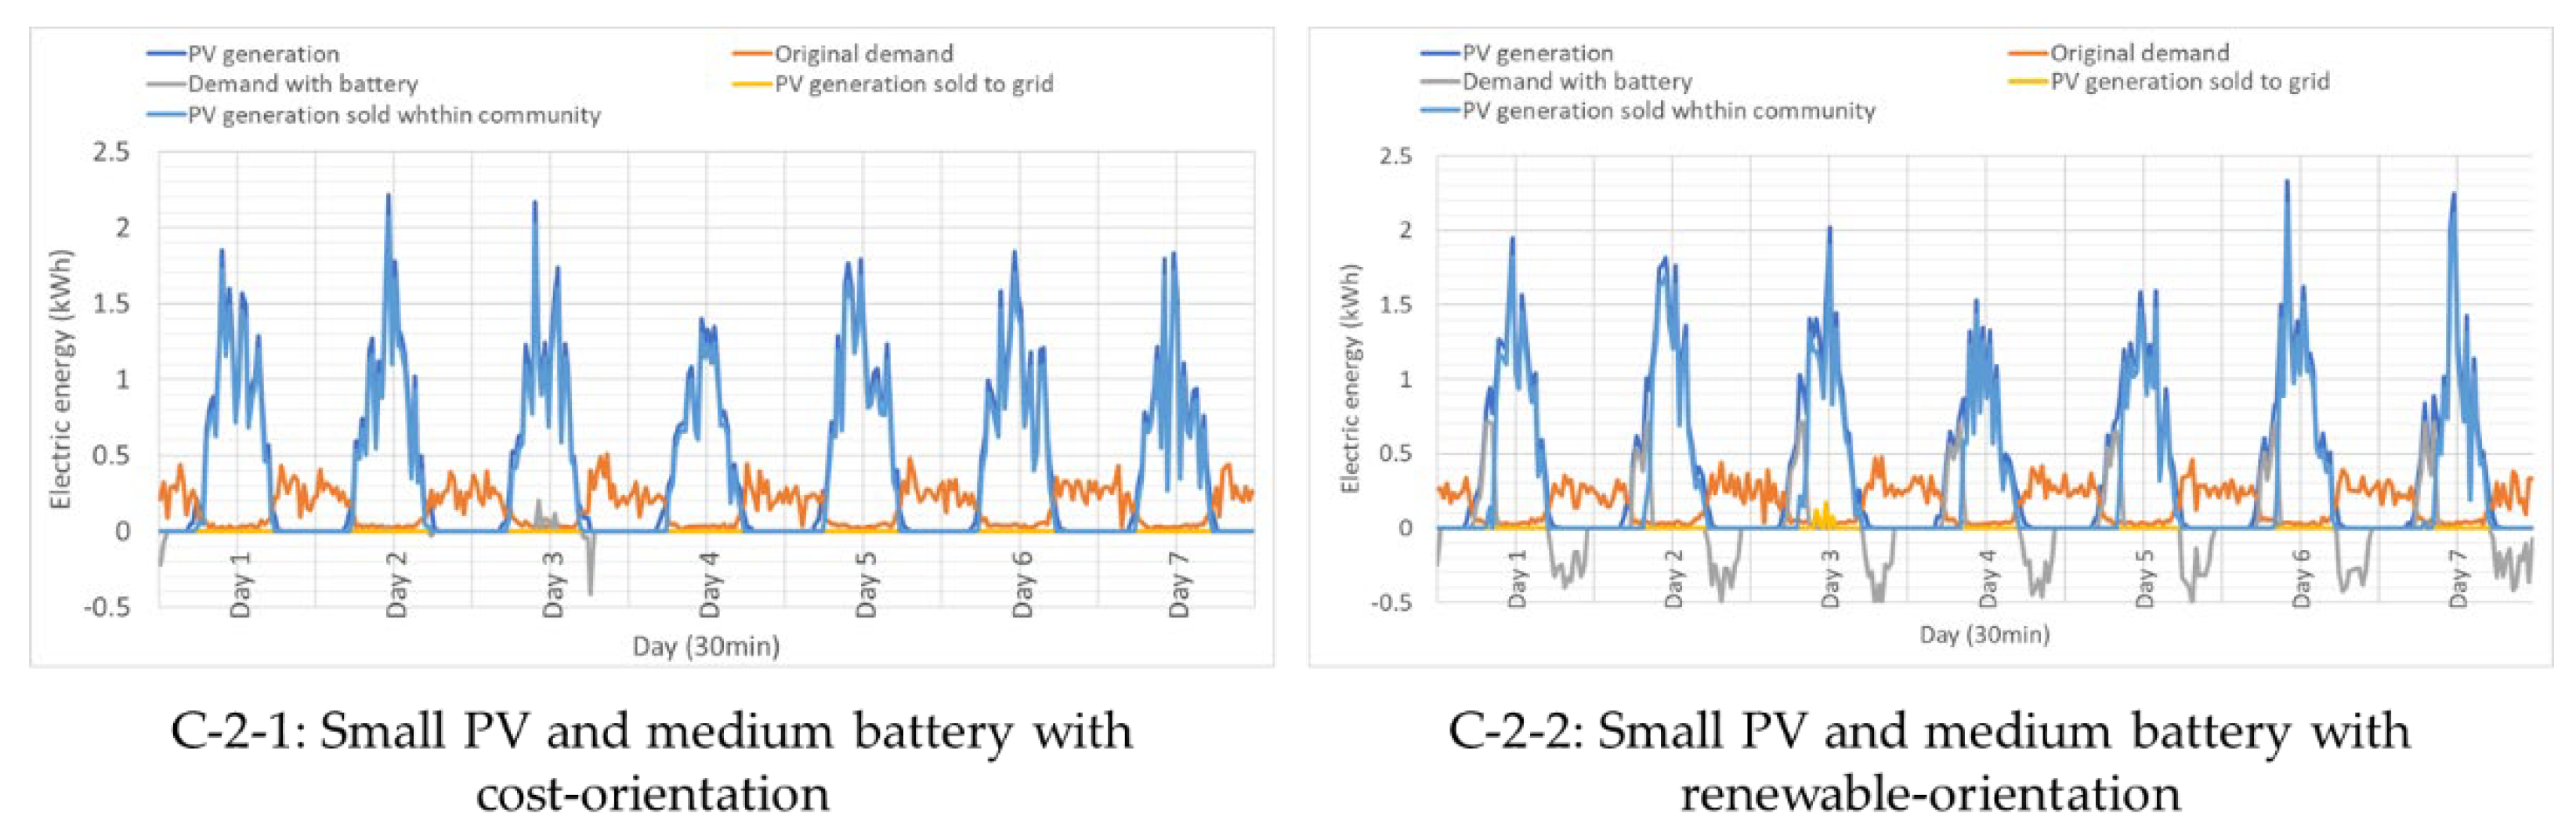
  • [Independence rate] (IndR) (%) is a ratio of community-deployed PV generation to community demand. It is calculated as {[Demand]–[Grid purchase amount] + battery net electricity storage}/{[Demand] + battery net electricity storage}. This is a focused core measure in this study because we consider that the higher the rate is, the higher the self-dependency on electricity in the community is achieved, which means being efficient in the use of renewable electricity in the community and also being resilient to critical events that would be caused by supply disruption of grid electricity.
  • [PV sell amount to grid] (kWh) is the total amount of electricity sold to the grid that is produced by community-deployed PV facilities.
  • [PV sell revenue to grid] (JPY) is revenue earned from electricity produced by community-deployed PVs and sold to the grid, which is calculated from the PV sell price multiplied by the [PV sell amount to grid].
  • [Battery capacity] (kWh) is the total capacity installed in the community.
  • [Battery loss] (kWh) is the total lost electricity due to the charge/discharge operation of the battery.
  • [Community PV trading amount] (kWh) is the total amount of electricity traded (sell/buy) in the community.
  • [Community PV trading revenue] (JPY) is revenue/cost earned/paid by electricity traded in the community.
  • [Trade rate] (%) is the ratio of community PV power trading to demand, which is calculated by [Community PV trading amount]/[Demand].
  • [Battery rate] (%) is the ratio of total battery charge amount to demand, which is calculated by total net electricity charge amount/[Demand].
  • [Battery operation rate] is the ratio of total battery charge amount to battery capacity.
From the simulation results in Table 10, this study points out six findings and discusses policy implications. First, the total demand for electricity in the community ranges around 338,000 kWh for all cases. This is found by the pre-defined conditions pertaining to the creation of the hypothetical community for the simulations. Although this study examines a limited number of combinations in Table 10 among electricity demand and supply, generation technologies, home- and industry-owned energy facilities, and their capacities, we can flexibly change those levels and combinations depending on what we want to analyze in various cases.
Second, looking into the core measure [Independence rate] (IndR), all cases are classified into four groups based on the degrees of IndR; (1) base case with 12% IndR, (2) a group with around 30% (C series), (3) a group with around 50% (A and B series), and (4) a group with around 70% (D series). The higher IndR indicates that the community is more electricity-independent from the power grid because the community can procure their consumed electricity in a manner that their electricity demand is fulfilled by solar PV generation installed in the community through plants and home/office facilities. The higher IndR of a community is consistent with the carbon-neutral status of the society because it indicates that the community fulfills a higher rate of its electricity demand from renewable electricity produced in the community. In addition, the lower percentage of the base case is reasonable because no PVs and battery storage are deployed in homes and offices in that case, so that they cannot generate and store electricity for their own convenience and efficient use. On the other hand, the D series assume offices hold a very large battery capacity (120 kW) and PV capacity (70 kW) and a very small PV capacity (1 kW) for homes compared with the other (A to C) simulation series, thereby they can efficiently consume generated electricity using battery storage options. This indicates offices significantly influence the efficient use of electricity because of the large size of capacities. This provides a practical implication to achieve higher IndR, which proposes prioritizing policy institutions that facilitate the large-scale installation of PV and battery assets for industries over homes with relatively small sizes and impacts.
Figure 10 depicts example patterns of demand (Demand all) and generation (PV generation) to represent four groups from (1) to (4) mentioned in the previous paragraph. It is noted that “Demand all” is a net amount that includes the charge/discharge amount. Figure 11 also shows example patterns in which “Original demand” and composite demand (Demand with battery) after adjusting battery charge/discharge amount are separately depicted. Note that “Demand all” in Figure 10 mostly corresponds to “Demand with battery” in Figure 11, although they are slightly different due to the existence of battery loss and conversion loss amounts.
Regarding Figure 10, panels (1) and (2) present insufficient solar PV generation compared to the demand, while panel (3) is the opposite in that the solar PV generation shows a large surplus compared to the demand. All of these are not desirable from the perspective of the efficient use of community-produced renewable electricity. On the other hand, the PV generation and demand are well matched in panel (4), receiving balancing benefits from the charge and discharge operations of batteries. Similarly, the active battery operations are also confirmed in Figure 11, panel (4), in which the shape of the original demand is very different from the composite demand (Demand with battery) after charge/discharge adjustments. In other words, the battery operation has been able to follow the demand changes to fill the gap between demand and supply, which consequently achieves the efficient use of electricity in the community.
Further to note, Figure 10 and Figure 11 indicate that a large amount of PV generation compared to the demand in the community is effective to increase IndR. This is presented with IndR levels that increase in the order of (1) < (2) < (3) < (4). In particular, sufficient and balanced PV generation to meet the whole community demand is beneficial for higher IndR as shown in (4) with the D-2 case. Concretely, when homes hold extra-small PV capacity and medium battery capacity, and offices hold extra-large PV capacity and extra-large battery capacity under the pre-defined conditions of this study, IndR is high enough to provide benefits for the whole community in a way that means that solar PV is efficiently used in the community. This is, again, to show that these combinations of facilities deployment are consistent with carbon neutrality because electricity generated by fossil fuel power plants is transmitted into the community only through trading imported from the grid in this study.
Third, related to the second finding, it is clearly presented that higher IndR for the D series is brought by the effective use of battery charge/discharge capability. Concretely, the [Battery rate] for D series ranges from 22% (D-1-1) to 27% (D-3-2, D-3-3), while those for the other series are lower, ranging from 0% (Base, C-1-1, C-2-1, C-3-1) to 5% (A-3, A-3-1, A-3-2, A-3-3, B-3, B-3-1, B-3-2, B-3-3). On the other hand, the [Trade rate] for the D series is relatively low compared to the other cases. Let us remind here that the [Battery rate] is the ratio of total battery charge amount to demand, and the [Trade rate] is the ratio of the community’s PV power trading amount to the demand. Thus, the combination of the higher [Battery rate] and the lower [Trade rate] as observed with the D series presents higher reliance on battery use for adjusting the electricity demand and supply and which leads to less use of power trading as an alternative measure. Both measures are consistent with reducing carbon dioxide emissions because they increase the efficient use of renewable electricity produced in the community.
Fourth, it is interesting to note that the [Battery operation rate] in Table 10 ranges over the high level of around six for almost all cases. The exceptions are C-1-1 (with 0.26), C-2-1 (with 0.18), and C-3-1 (with 0.13), which all assume consumers (homes and offices) hold small solar PV capacities and have preference 1 (cost orientation). It is reasonable to see these very small numbers in [Battery operation rate] in exceptional cases in the C series because this study assumes that cost-oriented consumers charge their batteries only when there is a surplus of generation in the community as a whole, and such a surplus situation is rare in the community settings in the C series under the provision of small solar PV capacities. In other words, since the PV generation capacities are very limited in these cases and consumers have a cost-oriented preference, they actually do not have any chances and proactive incentives to use the function of battery storage. Although the batteries do not operate very well in these exceptional cases, electricity is not sold to the grid because of internal community electricity sharing, so electricity is delivered where it is needed. In contrast, self-consumption-oriented and renewable-oriented types charge and discharge when there is a surplus or shortage within each agent (consumer). Thus, we understand battery operations are influenced by consumers’ preferences. These characteristics of active and effective battery usage are also presented when we compare C-2-1 and C-2-2 in Figure 12, for example, in which charge and discharge battery functions are evident in C-2-2 (see changes in “Demand with battery”) while that for C-2-1 is very limited in the simulation.
Fifth, differences in the three types of consumer preference do not significantly influence the simulation results. The exceptions are the differences in battery operations in the same cases addressed in the fourth finding, as depicted in Figure 12. This would suggest most combinations of solar PV and battery capacities under different consumer preferences work properly in effective electricity use in a community.
Sixth, the IndR for the A to C series is relatively low compared to the D series, as mentioned in the second finding. This lower IndR for A to C is attributed to the lower [Battery rate]. Meanwhile, the IndR for A to C is supported by a higher [Trade rate], which to some extent compensates for the lower [Battery rate]. For example, the IndR of A-3-1 is 58%, the [Trade rate] is 46%, and the [Battery rate] is 5%, while those of D-3-1 are 77%, 34%, and 25%, respectively. This comparison means the community’s internal and external power trading and the use of battery storage are alternative measures to increase the IndR for the community, although the battery seems to be a more powerful tool for this purpose. Therefore, promoting both battery use and power trading is the most desirable measure to achieve higher IndR, but in the case of the battery capacity not being enough for homes/offices to meet their demand under specific preferences, the electricity trading volume would naturally increase to compensate for the limited capacity of the battery storage. This result is interesting from a policy perspective that would suggest a combination of appropriate size of battery installation in homes/offices and conducting power trading as a supplemental tool to provide us with better performance for efficient energy use in a community.

4. Conclusions

This study aimed to examine how the electricity demand and supply constitutions affect a community’s electricity independence through the power trading within a community, as well as between a community and a power grid, using the simulation analysis. The demand and supply are influenced by the installation of renewable power plants, consumers’ energy facilities (solar PV and battery storage), and their preferences for energy use. For this purpose, we first constructed a hypothetical community consisting of various types of residential and industrial consumers, and renewable power plants focusing on solar PV generation. Residential and industry consumers were characterized by family/business size, the state of ownership, and the use of energy equipment, e.g., rooftop solar PV and battery storage in their homes/offices with various combinations and sizes. Once the community for the analysis was set for the analysis, this study performed the simulations equipped with the rule-based electricity trading capability and obtained outputs comprising total electricity demand in the community, the use statuses of battery storage and solar PVs, and electricity self-sufficiency represented by the IndR of the community. From the simulation results, this study summarized six findings. We suggested it can be effective to achieve higher electricity independence in a community by installing sufficient and balanced solar PV generation and battery storage capacities in combination with functions of power trading.
We note three limitations of this study that should be solved in future studies. First, this study examined a limited number of cases with respect to the constitution of a community, e.g., only incorporating solar PV as a source of generation and employing a fixed composition of different types of consumers. The other DERs, renewable power plants such as wind power generation, and different compositions of consumers can be investigated in the simulation. Second, although EVs are expected to function as battery storage and would provide flexible services to the power grid to arrange the demand and supply of electricity, this study did not include EVs in the simulation. These additional DERs and consumers’ compositions are already implemented in the simulation model but were not applied in this study. Third, this study used real data from a Japanese electric power company and weather information in a specific summer period. We can extend the application to other areas and periods, although we need to prepare data for the analysis. These extensions are future tasks of this study.

Author Contributions

Conceptualization, M.G., H.K. and D.S.; methodology, D.S. and H.K.; software, D.S., T.O. and H.K.; validation, M.G., H.K. and D.S.; formal analysis, M.G. and D.S.; investigation, M.G. and D.S.; resources, M.G.; data curation, D.S. and T.O.; writing—original draft preparation, M.G. and D.S.; writing—review and editing, M.G., H.K., D.S. and K.T.; visualization, M.G., H.K. and D.S.; supervision, M.G. and K.T.; project administration, M.G. and K.T.; funding acquisition, M.G. All authors have read and agreed to the published version of the manuscript.

Funding

This work was supported by a Grant-in-Aid of Tokyo Tech Academy of Energy and Informatics.

Data Availability Statement

The data used in this study are openly available in sources presented in Table 1.

Conflicts of Interest

The authors declare no conflict of interest.

References

  1. IEA. Energy Technology Perspectives 2023. Available online: https://iea.blob.core.windows.net/assets/a86b480e-2b03-4e25-bae1-da1395e0b620/EnergyTechnologyPerspectives2023.pdf (accessed on 25 March 2023).
  2. Tokyo Metropolitan Government. Ordinance Revision to Halve Carbon Emissions (Carbon Half) 2022. Available online: https://www.kankyo.metro.tokyo.lg.jp/en/climate/solar_portal/document.files/ordinance_revision.pdf (accessed on 25 March 2023).
  3. Helm, C.; Mier, M. Steering the energy transition in a world of intermittent electricity supply: Optimal subsidies and taxes for renewables and storage. J. Environ. Econ. Manag. 2021, 109, 102497. [Google Scholar] [CrossRef]
  4. Asiaban, S.; Kayedpour, N.; Samani, A.E.; Bozalakov, D.; De Kooning, J.D.M.; Crevecoeur, G.; Vandevelde, L. Wind and solar intermittency and the associated integration challenges: A comprehensive review including the status in the Belgian power system. Energies 2021, 14, 2630. [Google Scholar] [CrossRef]
  5. Le, T.S.; Nguyen, T.N.; Bui, D.K.; Ngo, T.D. Optimal sizing of renewable energy storage: A techno-economic analysis of hydrogen, battery and hybrid systems considering degradation and seasonal storage. Appl. Energy 2023, 336, 120817. [Google Scholar] [CrossRef]
  6. Sagawa, D.; Tanaka, K.; Ishida, F.; Saito, H.; Takenaga, N.; Nakamura, S.; Aoki, N.; Nameki, M.; Saegusa, K. Bidding agents for PV and electric vehicle-owning uses in the electricity P2P trading market. Energies 2021, 14, 8309. [Google Scholar] [CrossRef]
  7. Sousa, T.; Soares, T.; Pinson, P.; Moret, F.; Baroche, T.; Sorin, E. Peer-to-peer and community-based markets: A comprehensive review. Renew. Sustain. Energy Rev. 2019, 104, 367–378. [Google Scholar] [CrossRef] [Green Version]
  8. Abdella, J.; Shuaib, K. Peer to Peer Distributed Energy Trading in Smart Grids: A Survey. Energies 2018, 11, 1560. [Google Scholar] [CrossRef] [Green Version]
  9. Morstyn, T.; Teytelboym, A.; McCulloch, M.D. Bilateral Contract Networks for Peer-to-Peer Energy Trading. IEEE Trans. Smart Grid 2019, 10, 2026–2035. [Google Scholar] [CrossRef]
  10. Sorin, E.; Bobo, L.; Pinson, P. Consensus-Based Approach to Peer-to-Peer Electricity Markets with Product Differentiation. IEEE Trans. Power Syst. 2019, 34, 994–1004. [Google Scholar] [CrossRef] [Green Version]
  11. Mengelkamp, E.; Gärttner, J.; Rock, K.; Kessler, S.; Orsini, L.; Weinhardt, C. Designing microgrid energy markets: A case study: The Brooklyn Microgrid. Appl. Energy 2018, 210, 870–880. [Google Scholar] [CrossRef]
  12. Shrestha, A.; Bishwokarma, R.; Chapagain, A.; Banjara, S.; Aryal, S.; Mali, B.; Thapa, R.; Bista, D.; Hayes, B.P.; Papadakis, A.; et al. Peer-to-Peer Energy Trading in Micro/Mini-Grids for Local Energy Communities: A Review and Case Study of Nepal. IEEE Access 2019, 7, 131911–131928. [Google Scholar] [CrossRef]
  13. Liu, T.; Tan, X.; Sun, B.; Wu, Y.; Guan, X.; Tsang, D.H.K. Energy management of cooperative microgrids with P2P energy sharing in distribution networks. In Proceedings of the 2015 IEEE International Conference on Smart Grid Communications (SmartGridComm), Miami, FL, USA, 2–5 November 2015; pp. 410–415. [Google Scholar]
  14. Longo, A.; Markandya, A.; Petrucci, M. The internalization of externalities in the production of electricity: Willingness to pay for the attributes of a policy for renewable energy. Ecol. Econ. 2008, 67, 140–152. [Google Scholar] [CrossRef] [Green Version]
  15. Zori´c, J.; Hrovatin, N. Household willingness to pay for green electricity in Slovenia. Energy Policy 2012, 47, 180–187. [Google Scholar] [CrossRef]
  16. Tabi, A.; Hille, S.L.; Wüstenhagen, R. What makes people seal the green power deal?—Customer segmentation based on choice experiment in Germany. Ecol. Econ. 2014, 107, 206–215. [Google Scholar] [CrossRef]
  17. Dagher, L.; Harajli, H. Willingness to pay for green power in an unreliable electricity sector: Part 1. The case of the Lebanese residential sector. Renew. Sustain. Energy Rev. 2015, 50, 1634–1642. [Google Scholar] [CrossRef]
  18. Morstyn, T.; McCulloch, M.D. Multiclass Energy Management for Peer-to-Peer Energy Trading Driven by Prosumer Preferences. IEEE Trans. Power Syst. 2019, 34, 4005–4014. [Google Scholar] [CrossRef]
  19. Park, D.-H.; Park, J.-B.; Lee, K.Y.; Son, S.-Y.; Roh, J.H. A Bidding-Based Peer-to-Peer Energy Transaction Model Considering the Green Energy Preference in Virtual Energy Community. IEEE Access 2021, 9, 87410–87419. [Google Scholar] [CrossRef]
  20. Park, D.-H.; Park, Y.-G.; Roh, J.-H.; Lee, K.Y.; Park, J.-B. A Hierarchical Peer-to-Peer Energy Transaction Model Considering Prosumer’s Green Energy Preference. Int. J. Control. Autom. Syst. 2021, 19, 311–317. [Google Scholar] [CrossRef]
  21. Montakhabi, M.; Zobiri, F.; van der Graaf, S.; Deconinck, G.; Orlando, D.; Ballon, P.; Mustafa, M. An ecosystem view of peer-to-peer electricity trading: Scenario building by business model matrix to identify new roles. Energies 2021, 14, 4438. [Google Scholar] [CrossRef]
  22. Zepter, J.M.; Luth, A.; del Granado, P.C.; Egging, R. Prosumer integration in wholesale electricity markets: Synergies of peer-to-peer trade and residential storage. Energy Build. 2019, 184, 163–176. [Google Scholar] [CrossRef]
  23. Iria, J.; Soares, F.; Matos, M. Optimal bidding strategy for an aggregator of prosumers in energy and secondary reserve markets. Appl. Energy 2019, 238, 1361–1372. [Google Scholar] [CrossRef]
  24. Lee, J.; Cho, Y. Estimation of the usage fee for peer-to-peer electricity trading platform: The case of South Korea. Energy Policy 2020, 136, 111050. [Google Scholar] [CrossRef]
  25. Vagropoulos, S.I.; Bakirtzis, A. Optimal Bidding Strategy for Electric Vehicle Aggregators in Electricity Markets. IEEE Trans. Power Syst. 2013, 28, 4031–4041. [Google Scholar] [CrossRef]
  26. Capper, T.; Gorbatcheva, A.; Mustafa, M.; Bahloul, M.; Schwidtal, J.M.; Chitchyan, R.; Andoni, M.; Robu, V.; Montakhabi, M.; Scott, I.J.; et al. Peer-to-peer, community self-consumption, and transactive energy: A systematic literature review of local energy market models. Renew. Sustain. Energy Rev. 2022, 162, 112403. [Google Scholar] [CrossRef]
  27. Zhou, K.L.; Chong, J.; Lu, X.H.; Yang, S.L. Credit-based peer-to-peer electricity trading in energy blockchain environment. IEEE Trans. Smart Grid 2022, 13, 678–687. [Google Scholar] [CrossRef]
  28. Li, Z.G.; Chen, S.; Zhou, B.X. Electric vehicle peer-to-peer energy trading model based on SMES and blockchain. IEEE Trans. Appl. Supercond. 2021, 31, 5700804. [Google Scholar] [CrossRef]
  29. Reis, I.F.G.; Goncalves, I.; Lopes, M.A.R.; Antunes, C.H. Towards inclusive community-based energy markets: A multiagent framework. Appl. Energy 2022, 307, 118115. [Google Scholar] [CrossRef]
  30. Kim, S.J.; Chu, Y.O.; Kim, H.J.; Kim, H.T.; Moon, H.S.; Sung, J.H.; Yoon, Y.T.; Jin, Y.G. Analyzing various aspects of network losses in peer-to-peer electricity trading. Energies 2022, 15, 686. [Google Scholar] [CrossRef]
  31. Chung, M.H. Comparison of economic feasibility for efficient peer-to-peer electricity trading of PV-equipped residential house in Korea. Energies 2020, 13, 3568. [Google Scholar] [CrossRef]
  32. TEPCO Electricity Forecast. Available online: https://www.tepco.co.jp/forecast/html/download-j.html (accessed on 13 February 2023).
  33. Japan Meteorological Agency. Available online: https://www.data.jma.go.jp/gmd/risk/obsdl/index.php (accessed on 13 February 2023).
  34. Arpak Report. Available online: https://www.kankyo.metro.tokyo.lg.jp/climate/home/energy.files/syouhidoukouzittaityousa26honpen_3.pdf (accessed on 13 February 2023).
  35. Energy Management System Open Data. Available online: https://www.ems-opendata.jp/ (accessed on 13 February 2023).
  36. Kwac, J.; Flora, J.; Rajagopal, R. Household Energy Consumption Segmentation Using Hourly Data. IEEE Trans. Smart Grid 2014, 5, 420–430. [Google Scholar] [CrossRef]
  37. Gaete-Morales, C.; Kramer, H.; Schill, W.P. An open tool for creating battery-electric vehicle time series from empirical data, emobpy. Sci. Data 2021, 8, 152. [Google Scholar] [CrossRef]
Figure 1. Overview of the simulation.
Energies 16 05137 g001
Figure 2. Average demand per area (kWh/m2) for each business type.
Energies 16 05137 g002
Figure 3. Flow of Business Demand Calculation.
Energies 16 05137 g003
Figure 4. Flow of household demand calculation.
Energies 16 05137 g004
Figure 5. Basic load curves of households.
Energies 16 05137 g005
Figure 6. Overview of power trading process.
Energies 16 05137 g006
Figure 7. Abstracted flow of phase 1: calculation of surplus and shortage of electricity.
Energies 16 05137 g007
Figure 8. Abstracted flow of phase 2: process of the surplus and shortage aggregation.
Energies 16 05137 g008
Figure 9. Abstracted flow of phase 2: process of the surplus allocation.
Energies 16 05137 g009
Figure 10. Example patterns of demand and generation. Note: (a) See Table 10 for the corresponding example cases from (1)–(4). (b) The “Demand all” includes charge/discharge amount, battery loss, and conversion loss. (c) No PV in (1) indicates there is no home/office-installed solar PV, only community solar PV plants generate electricity. (d) Extra in (4) indicates extra-small PV for home and extra-large PV and battery for office.
Energies 16 05137 g010
Figure 11. Example patterns of demand and charge amounts. Note: (a) See Table 10 for the corresponding example cases from (1)–(4). (b) The “Original demand” is consumers’ electricity use volume, and “Demand with battery” includes charge/discharge amount, but battery loss and conversion loss are excluded. (c) Extra in (4) indicates extra-small PV for home and extra-large PV and battery for office.
Energies 16 05137 g011
Figure 12. Comparison between C-2-1 and C-2-2. Note: (a) See Table 9 and Table 10 for the corresponding example cases.
Energies 16 05137 g012
Table 1. List of data used for the simulation.
No.Data NameDescription
1Power Demand Data within Tokyo Electric Power Company JurisdictionHourly power demand data of Tokyo Electric Power Company in the past (FY2013). http://www.tepco.co.jp/forecast/html/download-j.html [32], accessed on 25 March 2023
2Actual Meteorological Information in Tokyo AreaPast meteorological information from the Japan Meteorological Agency. Meteorological elements include temperature, precipitation, humidity, wind speed, wind direction, and solar radiation. http://www.data.jma.go.jp/gmd/risk/obsdl/index.php [33], accessed on 25 March 2023
3Monthly Electricity Consumption by Household TypeTokyo Metropolitan Government, Report on the Actual Conditions of Energy Consumption Trends in Households (pp. 30–32). https://www.kankyo.metro.tokyo.lg.jp/climate/home/energy.files/syouhidoukouzittaityousa26honpen_3.pdf [34], accessed on 25 March 2023
4SII Power Demand Data of Businesses/Building Area and Attribute Data of BusinessesObtained from EMS OPENDATA of The Environmental Co-creation Initiative. https://www.ems-opendata.jp/ [35], accessed on 25 March 2023
Table 2. List of business types.
Unclassified industry
Medical, welfare
Construction industry
Manufacturing industry
Wholesale and retail industry
Real estate and rental industry
Accommodation and food services industry
Academic research, professional and technical services industry
Lifestyle-related services and entertainment industry
Education, learning support industry
Transportation and postal services industry
Table 3. Variable definitions.
Defined Variables (in Italics) DescriptionUnit
demandThe total energy demand.kWh
pv_generationThe energy generated from PV (photovoltaic) panels.kWh
pure_demandThe demand remaining after accounting for PV and wind generation.kWh
wind_generationThe energy generated from wind turbines.kWh
pv_surplusThe surplus energy generated from PV panels.kWh
wind_surplusThe surplus energy generated from wind turbines.kWh
trading_preferenceThe preference for energy trading strategy: self-consumption, renewable-oriented, or cost-priority.kWh
ev_dischargable_amountThe amount of energy that can be discharged from the EV.kWh
ev_socThe state of charge of the EV battery.kWh
shortageThe energy deficit that needs to be met after considering generation, battery discharge, and EV charging.kWh
ev_consumptionThe energy consumed by the EV.kWh
bat_dischargable_amountThe amount of energy that can be discharged from the battery.kWh
ev_chargable_amountThe amount of energy that can be charged to the EV.kWh
ev_soc_kwhThe state of charge of the EV battery in kilowatt-hours.kWh
bat_soc_kwhThe state of charge of the battery in kilowatt-hours.kWh
bat_chargable_amountThe amount of energy that can be charged to the battery.kWh
surplus_pv_allThe total surplus energy generated from PV panels across all agents.kWh
surplus_wind_allThe total surplus energy generated from wind turbines across all agents.kWh
shortage_allThe total energy deficit across all agents.kWh
shortage_all_re_preferenceThe total energy deficit for agents with a “Renewable-oriented” trading preference.kWh
shortage_all_self_consumingThe total energy deficit for agents with a “Self-consumption” trading preference.kWh
shortage_all_cost_priorityThe total energy deficit for agents with a “Cost-priority” trading preference.kWh
all_agent_listThe list of all agents participating in the energy trading system.-
Table 4. Pseudocode of Phase 1: Calculation of surplus and shortage of electricity.
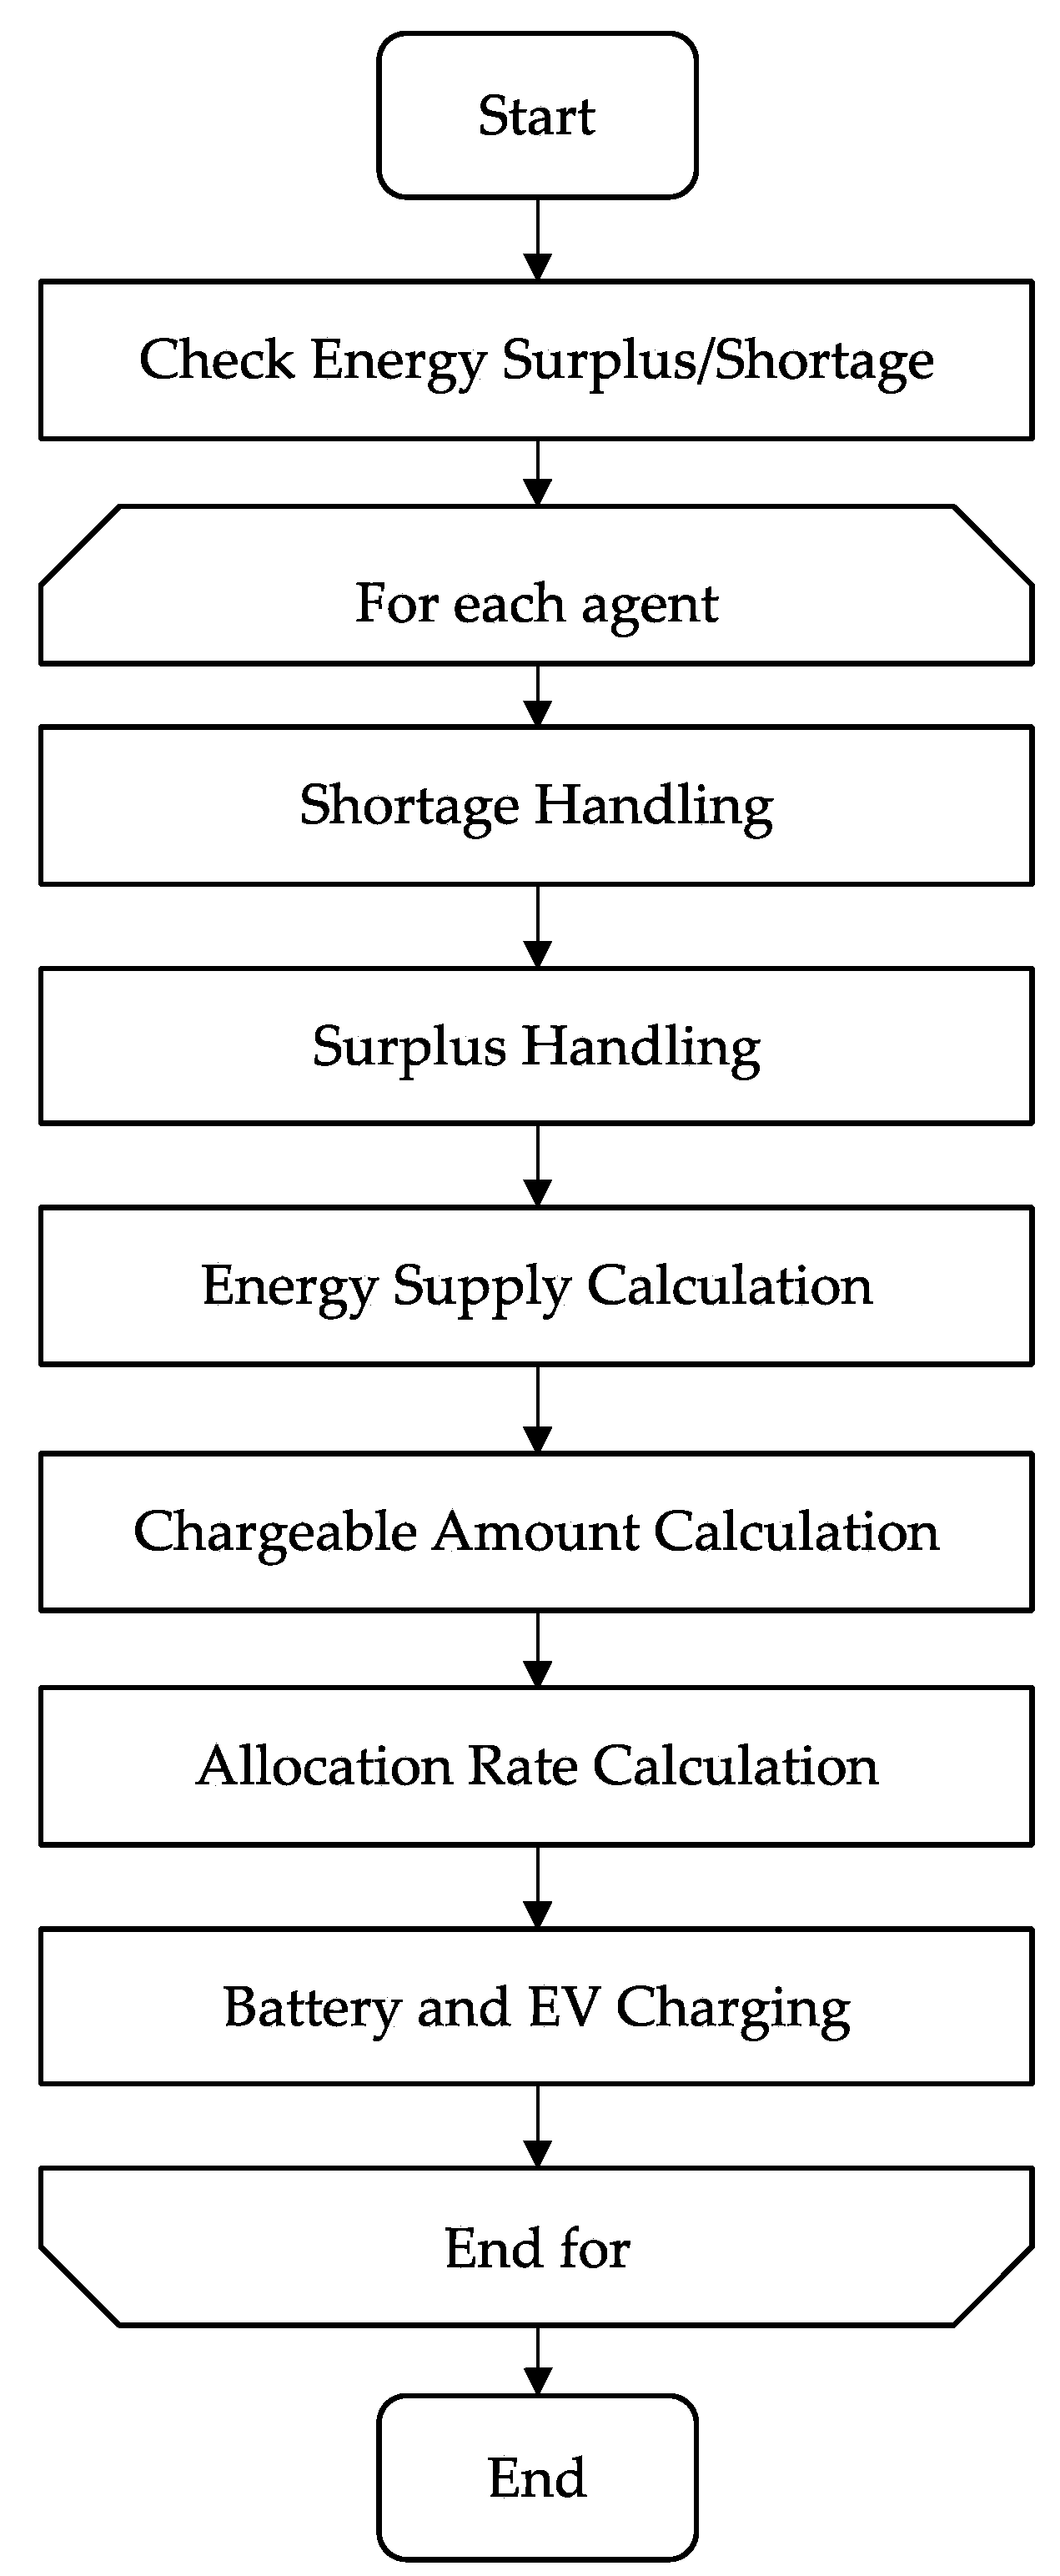
1. Calculate pure_demand: pure_demand = demand-pv_generation-wind_generation
2. If pure_demand >= 0 (generation does not cover consumption):
  2.1. Set pv_surplus = 0 and wind_surplus = 0
  2.2. If trading_preference in [“Self-consumption”, “Renewable-oriented”]:
    2.2.1. Discharge as much as possible from the battery
    2.2.2. If EV is at home base (discharging only possible during this time):
      2.2.2.1. If not owning an EV: set ev_dischargable_amount = 0
      2.2.2.2. Else, if owning an EV:
        2.2.2.2.1. Calculate EV state of charge
        2.2.2.2.2. If ev_soc <= 0.5: charge the EV
        2.2.2.2.3. Else, discharge the EV
      2.2.2.3. Calculate shortage
    2.2.3. Else, if EV is driving:
      2.2.3.1. Calculate EV consumption
      2.2.3.2. Calculate shortage (without considering ev_discharge_amount)
    2.2.4. Update battery state of charge
    2.2.5. Update EV state of charge
  2.3. ElseIf trading_preference is “Cost-priority”:
    2.3.1. Set bat_dischargable_amount = None (decide battery discharge in Phase 2 considering cost)
    2.3.2. If EV is at home base:
      2.3.2.1. If not owning an EV: set ev_soc = None and ev_chargable_amount = 0
      2.3.2.2. Else, if owning an EV:
        2.3.2.2.1. Calculate EV state of charge
        2.3.2.2.2. If ev_soc <= 0.5: charge the EV as much as possible
        2.3.2.2.3. Else: set ev_chargable_amount = None (decide EV discharge in Phase 2 considering cost)
      2.3.2.3. If ev_chargable_amount is not None: update shortage and ev_soc_kwh
      2.3.2.4. Else: set shortage = pure_demand
    2.3.3. Else, if EV is in use (driving):
      2.3.3.1. Calculate EV consumption
      2.3.3.2. Set shortage = pure_demand
3. Else (if the demand is fully met by generation):
  3.1. Set shortage = 0
  3.2. If trading_preference is “Self-consumption” or “Renewable-oriented”:
    3.2.1. Calculate battery charge amount
    3.2.2. If EV is at home base:
      3.2.2.1. Calculate EV charge amount
      3.2.2.2. Calculate PV surplus
    3.2.3. Else (if EV is in use):
      3.2.3.1. Calculate EV consumption
      3.2.3.2. Calculate PV surplus
    3.2.4. Update battery and EV state of charge:
      3.2.4.1. Update bat_soc_kwh
      3.2.4.2. Update ev_soc_kwh (assuming PHEV and running on gasoline if below 0)
    3.2.5. Set wind surplus: wind_surplus = wind_generation (all wind generation is surplus as it does not exist at household/business level)
  3.3. ElseIf trading_preference is “Cost-priority”:
    3.3.1. Calculate PV surplus
    3.3.2. Set wind surplus: wind_surplus = wind_generation (all wind generation is surplus as it does not exist at household/business level)
    3.3.3. Set bat_chargable_amount = None (decide to charge in Phase 2)
    3.3.4. If EV is at home base:
      3.3.4.1. If not owning an EV: set ev_soc = None and ev_chargable_amount = 0
      3.3.4.2. Else, if owning an EV:
        3.3.4.2.1. Calculate EV state of charge
        3.3.4.2.2. If ev_soc <= 0.5: charge the EV as much as possible
        3.3.4.2.3. Else: set ev_chargable_amount = None
    3.3.5. Else (if EV is in use):
      3.3.5.1. Calculate EV consumption
    3.3.6. If ev_chargable_amount is not None:
      3.3.6.1. Set shortage = max(ev_chargable_amount, 0)
      3.3.6.2. Update ev_soc_kwh
    3.3.7. Else:
      3.3.7.1. Set shortage = 0
Note: This study does not consider wind power generation and EV ownership and use in the community, although the simulator itself is capable of incorporating them for the analysis.
Table 5. Price table for each preference.
PreferencesType of GenerationsBuying Prices
Cost-orientedPV21
Renewable-orientedPV25
Self-consumption PV23
Note: Although the simulator can incorporate wind power generation plants as a community’s renewable power sources, this study focuses on solar PV generation and does not assume community-deployed wind power generation.
Table 6. Transaction price from the power grid.
TypePrices
Grid power purchasing22
PV sales to the grid15
Table 7. Process of the surplus and shortage aggregation.
  • Initialize surplus_pv_all, surplus_wind_all, shortage_all, shortage_all_re_preference, shortage_all_self_consuming, and shortage_all_cost_priority to 0
  • For each agent in all_agent_list:
    2.1.
    Execute trade_phase1_time (dt) for the agent
    2.2.
    Add agent’s pv_surplus to surplus_pv_all
    2.3.
    Add agent’s wind_surplus to surplus_wind_all
    2.4.
    Add agent’s shortage to shortage_all
    2.5.
    If agent’s trading_preference is “ Renewable-oriented”:
    2.5.1.
    Add agent’s shortage to shortage_all_re_preference
    2.6.
    ElseIf agent’s trading_preference is “Self-consumption”:
    2.6.1.
    Add agent’s shortage to shortage_all_self_consuming
    2.7.
    ElseIf agent’s trading_preference is “Cost-priority”:
    2.7.1.
    Add agent’s shortage to shortage_all_cost_priority
  • EndFor
Table 8. Process of the surplus allocation.
1. If there is no surplus PV and wind generation in the community and there is an overall shortage:
  1.1. For each agent in the community:
   1.1.1. Determine the agent’s shortage
   1.1.2. If the agent’s trading_preference is “Cost-oriented”:
     1.1.2.1. If there is a shortage:
       1.1.2.1.1. Discharge the battery up to its discharge speed or until the shortage is met
       1.1.2.1.2. If the agent’s EV is at home, discharge the EV up to its discharge speed or until the remaining shortage is met
       1.1.2.1.3. Update the agent’s battery and EV states of charge, and chargeable amounts
       1.1.2.1.4. Update the agent’s grid purchase amount, shortage, and community PV and wind purchase amount to zero
     1.1.2.2. If there is no shortage:
       1.1.2.2.1. Do not discharge the battery or EV
       1.1.2.2.2. Update the agent’s grid purchase amount, shortage, and community PV and wind purchase amount to zero
   1.1.3. If the agent’s trading_preference is “Self-consumption” or “Renewable-oriented”:
     1.1.3.1. Since these agents have already been discharged in phase 1, do not discharge them further
     1.1.3.2. Update the agent’s grid purchase amount to meet the shortage, and set the shortage, community PV, and community wind purchase amounts to zero
2. If there is surplus PV and wind generation in the community, but it is not sufficient to cover the needs of all agents:
  2.1. Calculate the pure_demand for all agents
  2.2. Allocate surplus PV and wind generation to agents based on their trading preferences:
   2.2.1. Calculate the amount of surplus PV and wind generation that can be allocated to each preference group (Renewable-oriented, Self-consumption, and Cost-oriented)
   2.2.2. Calculate the allocation rates for each preference group based on their shortages and surplus PV and wind generation
   2.2.3. For each agent in the community:
     2.2.3.1. Assign the allocation rate based on the agent’s trading preference
     2.2.3.2. Set the PV and wind prices based on the agent’s trading preference
     2.2.3.3. Update the agent’s shortage based on the allocated energy
     2.2.3.4. Determine the amount of energy supplied from PV and wind based on the surplus PV and wind generation
     2.2.3.5. If the agent’s trading_preference is “Cost-oriented”:
       2.2.3.5.1. Discharge the battery if it has not been discharged yet, and update the battery state of charge, shortage, and charge amount
       2.2.3.5.2. If the agent’s EV is at home and has not been discharged yet, discharge the EV, and update the EV state of charge, shortage, and charge amount
       2.2.3.5.3. Update the agent’s grid purchase amount to cover the remaining shortage, and set the shortage to zero.
3. If there is enough surplus PV and wind generation to cover the needs of all agents in the community:
  3.1. Satisfy the energy demands of all agents
  3.2. Calculate the amount of energy that can be absorbed by the batteries and EVs of all agents
  3.3. Set the PV and wind prices to the standard price
  3.4. Set the shortage to zero
  3.5. For each agent in the community:
   3.5.1. Calculate the supplied energy based on the agent’s shortage and surplus PV and wind generation
   3.5.2. Assign the energy supplied from PV and wind based on the surplus PV and wind generation
   3.5.3. Calculate the total chargeable amount for each agent’s battery and EV
   3.5.4. Update the total chargeable amount for all agents’ batteries and EVs
  3.6. Calculate the allocation rate for charging based on the total chargeable amount for all agents’ batteries and EVs and the remaining surplus energy
  3.7. For each agent in the community:
   3.7.1. Update the battery charged amount and calculate the chargeable amount for phase 2
   3.7.2. Calculate the amount of energy charged in phase 2 based on the allocation rate
   3.7.3. Update the battery state of charge (SOC) and total charge amount
   3.7.4. If the agent’s EV is at home, perform the same calculations for the EV
     3.7.4.1. Update the EV charged amount and calculate the chargeable amount for phase 2
     3.7.4.2. Calculate the amount of energy charged in phase 2 based on the allocation rate
     3.7.4.3. Update the EV state of charge (SOC) and total charge amount
   3.7.5. If the agent’s EV is not at home, set the charged amount in phase 2 to zero
   3.7.6. Allocate the energy charged in phase 2 to the community PV and wind generation based on the surplus PV and wind generation
Table 9. Description of simulation cases.
CasesHome/Office PV CapacityHome/Office Battery Capacity
BaseNoneNone
A-1LargeSmall
A-2LargeMedium
A-3LargeLarge
B-1MediumSmall
B-2MediumMedium
B-3MediumLarge
C-1SmallSmall
C-2SmallMedium
C-3SmallLarge
Home PVOffice PVHome BatteryOffice Battery
D-1Extra-smallExtra-largeSmallExtra-large
D-2Extra-smallExtra-largeMediumExtra-large
D-3Extra-smallExtra-largeLargeExtra-large
Note: (a) small, medium, and large for PV capacity for home and office indicate 2 kW, 5 kW, and 7 kW, while those for battery capacity for home and office indicate 1 kW, 1.5 kW, and 2 kW. (b) Extra-small for home PV capacity indicates 1 kW, extra-large office PV capacity is 70 kW, and extra-large office battery is 120 kW. The settings used in this simulation for the power plants can be freely changed depending on the assumptions of a community.
Table 10. Summary of simulation results.
CasesDemandPV GenerationGrid Purchase AmountGrid Purchase CostIndependence Rate (IndR)PV Sell Amount to GridPV Sell Revenue to GridBattery CapacityBattery LossCommunity PV Trading AmountCommunity PV Trading RevenueTrade RateBattery RateBattery Operation Rate
Base338,86241,025299,8896,597,55212%000038,974961,13212%0%-
A-1338,258326,796151,6403,336,08655%123,3541,850,3081100873141,3773,018,14042%2%7.49
A-1-1338,236325,007149,9003,297,79656%119,7611,796,4151100818148,0983,110,06544%2%7.00
A-1-2338,511325,007152,5493,356,07655%122,3791,835,6801100902138,5682,992,22141%3%7.75
A-1-3338,258325,007152,9963,365,91455%123,0771,846,1531100903137,8182,932,89541%3%7.76
A-2338,035326,796148,9143,276,10856%120,6331,809,50216501292141,6773,026,46542%4%7.38
A-2-1338,234325,0071461453,215,20057%115,6791,735,18416501227152,1803,195,78645%3%7.00
A-2-2338,376325,007150,4883,310,74455%120,2621,803,92516501342137,1882,961,46741%4%7.68
A-2-3338,201325,007150,8683,319,09655%120,8151,812,22616501343136,5832,908,50940%4%7.69
A-3338,173326,796145,5193,201,41357%116,8661,752,98622001723143,0233,054,79042%5%7.39
A-3-1338,248325,007142,4493,133,87058%111,6381,674,57022001636156,2233,280,67846%5%7.00
A-3-2338,369325,007148,2763,262,07256%1178671,768,00922001780136,0972,939,62440%5%7.64
A-3-3338,274325,007148,6603,270,52556%118,3401,775,09722001785135,5682,887,72740%5%7.66
B-1338,183245,077161,5153,553,33352%55,702835,5371100852138,5472,980,97241%2%7.31
B-1-1338,214243,485158,8113,493,85153%51,248768,7221100818146,3953,074,30143%2%7.00
B-1-2338,375243,485162,8313,582,29252%55,390830,8541100877135,2592,952,82640%2%7.52
B-1-3338,266243,485163,2133,590,69452%55,879838,1901100878134,7542,887,35940%2%7.53
B-2337,923245,077158,7363,492,19753%52,966794,49316501273138,8562,989,85441%4%7.28
B-2-1338,222243,485155,0403,410,88654%47,139707,08116501227150,5063,160,61844%3%7.00
B-2-2338,366243,485161,4113,551,05052%53,806807,08516501305133,3122,929,50639%4%7.46
B-2-3338,273243,485161,7863,559,29052%54,273814,08916501306132,8352,854,48739%4%7.47
B-3338,097245,077156,8863,451,49953%50,733760,99622001687138,5942,989,65141%5%7.23
B-3-1338,206243,485151,3663,330,04455%43,151647,26422001636154,4933,244,34346%5%7.00
B-3-2338,407243,485160,2533,525,57352%52,445786,67322001727131,1362,879,27939%5%7.41
B-3-3338,338243,485160,6953,535,29652%52,960794,39322001724130,6222,807,46239%5%7.39
C-1338,012122,498221,7884,879,32734%1121672110057289,7182,096,40527%2%4.82
C-1-1338,206121,201222,6124,897,46234%0011005793,6151,965,90728%0%0.26
C-1-2338,411121,201223,8064,923,73134%3284918110076586,1632,134,75625%2%6.53
C-1-3338,214121,201223,5564,918,23734%2754130110076586,2231,969,62425%2%6.53
C-2338,233122,498221,9004,881,80334%00165084587,3912,045,26126%2%4.75
C-2-1338,217121,201222,3744,892,23834%0016507193,6151,965,90728%0%0.18
C-2-2338,320121,201223,7854,923,26034%30045041650114182,6912,047,94824%3%6.49
C-2-3338,219121,201223,6314,919,88534%24937321650114082,7501,889,75124%3%6.49
C-3338,370122,498222,0154,884,34034%002200110184,9571,991,71225%3%4.63
C-3-1338,199121,201222,1084,886,38534%0022008593,6151,965,90728%0%0.13
C-3-2338309121,201223,7604,922,72034%19329022200151479,3081,963,31823%4%6.46
C-3-3338,206121,201223,6144,919,51234%15323012200151279,3501,813,43223%4%6.45
D-1338,548338,04790,4201,989,24373%66,119991,79013,000854273,6571,554,80422%24%6.24
D-1-1338278336,84984,0611,849,34875%58,148872,22513,0008010108,2522,273,28732%22%5.85
D-1-2338,371336,84996,5842,124,84971%71,7981,076,96713,000891449,0161,039,40314%25%6.52
D-1-3338,306336,84996,4842,122,64071%71,7311,075,97113,000894549,0321,034,84914%25%6.54
D-2338,455338,04787,1221,916,67574%62,739941,08213,500888875,3761,590,74422%25%6.25
D-2-1338,262336,84980,6761,774,87276%54,480817,20113,5008382111,9192,350,29133%24%5.89
D-2-2338,371336,84993,3642,054,00672%68,4551,026,82813,500926949,4721,048,98815%26%6.52
D-2-3338,276336,84993,1952,050,29772%68,3851,025,77513,500927649,5031,044,74315%26%6.53
D-3338,494338,04783,9441,846,76975%59,332889,98514,000923477,4811,635,09623%26%6.26
D-3-1338,328336,84977,3741,702,23277%50,811762,16414,0008754115,5752,427,08134%25%5.93
D-3-2338,447336,84989,8711,977,15573%64,730970,94614,000962250,8881,078,72715%27%6.53
D-3-3338,288336,84990,0741,981,63773%65,122976,83014,000961150,5371,066,46915%27%6.52
Disclaimer/Publisher’s Note: The statements, opinions and data contained in all publications are solely those of the individual author(s) and contributor(s) and not of MDPI and/or the editor(s). MDPI and/or the editor(s) disclaim responsibility for any injury to people or property resulting from any ideas, methods, instructions or products referred to in the content.

