Article

Modified Particle Swarm Optimization Based Powertrain Energy Management for Range Extended Electric Vehicle

1
Cummins, Inc., CTC, Columbus, IN 47201, USA
2
Department of Mechanical and Energy Engineering, Indiana University Purdue University Indianapolis (IUPUI), Indianapolis, IN 46202, USA
*
Author to whom correspondence should be addressed.
Energies 2023, 16(13), 5082; https://doi.org/10.3390/en16135082
Submission received: 2 April 2023 / Revised: 17 June 2023 / Accepted: 20 June 2023 / Published: 30 June 2023
(This article belongs to the Section E: Electric Vehicles)

Abstract

:
The efficiency of hybrid electric powertrains is heavily dependent on energy and power management strategies, which are sensitive to the dynamics of the powertrain components that they use. In this study, a Modified Particle Swarm Optimization (Modified PSO) methodology, which incorporates novel concepts such as the Vector Particle concept and the Seeded Particle concept, has been developed to minimize the fuel consumption and NOx emissions for an extended-range electric vehicle (EREV). An optimization problem is formulated such that the battery state of charge (SOC) trajectory over the entire driving cycle, a vector of size 50, is to be optimized via a control lever consisting of 50 engine/generator speed points spread over the same 2 h cycle. Thus, the vector particle consisted of the battery SOC trajectory, having 50 elements, and 50 engine/generator speed points, resulting in a 100-D optimization problem. To improve the convergence of the vector particle PSO, the concept of seeding the vector particles was introduced. Additionally, further improvements were accomplished by adapting the Time-Varying Acceleration Coefficients (TVAC) PSO and Frankenstein’s PSO features to the vector particles. The MATLAB/SIMULINK platform was used to validate the developed commercial vehicle hybrid powertrain model against a similar ADVISOR powertrain model using a standard rule-based PMS algorithm. The validated model was then used for the simulation of the developed, modified PSO algorithms through a multi-objective optimization strategy using a weighted sum fitness function. Simulation results show that a fuel consumption reduction of 12% and a NOx emission reduction of 35% were achieved individually by deploying the developed algorithms. When the multi-objective optimization was applied, a simultaneous reduction of 9.4% fuel consumption and 7.9% NOx emission was achieved when compared to the baseline model with the rule-based PMS algorithm.

1. Introduction

The growing global concern over climate change has spurred efforts towards developing and researching Hybrid Electric Vehicles (HEVs) as a means of promoting energy efficiency, environmental sustainability, and the reduction of air pollution. Notably, recent progress has been made in improving the energy density of batteries and enhancing the efficiency of HEVs’ architectures, particularly the series and parallel architectures. While the series architecture prioritizes the use of batteries as the primary energy source, the parallel architecture adopts a more conventional approach, with battery power only employed as necessary based on control mechanisms [1,2]. These advancements hold significant promise for advancing the sustainable mobility agenda.
The series HEV runs on battery power and, if needed, generator power. The battery is generally charged on the fly by the engine/generator and through regenerative braking. The power requirement for commercial vehicles such as heavy-duty trucks is comparatively high, and this necessitates a large battery energy storage capacity. Such a massive battery cannot be charged purely by regenerative braking and/or the engine as an auxiliary power source. The Plug-in Hybrid Electric Vehicle (PHEV) powertrain which allows batteries to be charged externally using electricity from the grid is a more appropriate choice in such applications where the engine and regenerative braking work as range extenders. These vehicles are sometimes called Range Extended Electric Vehicles (REEVs). This study focuses on building a reverse-looking model of the REEV and developing an optimal energy management strategy for PMS to minimize both fuel consumption and NOx emissions.
The optimal energy management of a REEV mainly falls into two categories: 1. Online Optimization, which pertains to PMS’s real-time decision-making, and, 2. Offline Optimization, which focuses on a specific driving schedule to develop a general concept for formulating rule-based strategies [3]. Different approaches can be adapted to solve the online control strategy optimization problem of energy and emissions management in hybrid electric vehicles, including Particle Swarm Optimization [4], Genetic Algorithm [5,6], Dynamic Programming [7,8], Model Predict Control [9,10], Pseudo-Spectral Optimal Control [11], minimum principle [12], and fuzzy logic [13]. Yao et al. [14] discussed an adaptive equivalent fuel consumption minimization strategy (A-ECMS) for real-time optimal control of a REEV. Their work showed a maximum of 3% improvement against the numerical method (shooting method). Moura et al. [15] proposed a stochastic dynamic programming model which blends engine and battery power in a manner that improves engine efficiency and reduces total charge sustenance time. The researchers tested the performance of their model using different drive cycles and found varied improvements against the conventional charge depletion and the charge sustenance (CDCS) strategy—the notable fuel economy improvements being 11.8% improvement in 4xSC03 (the maximum improvement) and 8.7% improvement in HWFET. Li et al. [16] presented a dynamic programming and pseudo-spectral optimal control (PSOC) based energy management optimization problem. The authors proposed two types of tracking strategies: strategy one determines the target speed according to the optimal efficiency curve, and the other strategy targets different power zones based on an efficiency map, and the engine works at a certain speed to avoid frequent engine speed changes. Sorrentino et al. [17] assessed the performance of a rule-based control strategy for a series of hybrid vehicles by comparing it with a Genetic Algorithm-based optimization. Zhang et al. [18] proposed a trajectory optimization-based engine multi-operating-point control strategy where a combined cost map including fuel consumption rate, CO, HC, and NOx emissions is developed, and then an improved genetic algorithm is employed to optimize the engine trajectory. Their strategy resulted in reducing fuel consumption, NOx, HC, and CO emissions by 9.2%, 5.7%, 8.1%, and 11.5%, respectively. Zhao et al. [19] proposed a fuzzy-logic-based adaptive PID control algorithm to optimize the overshoot of speed and torque, fuel consumption, and exhaust emissions of REEVs. While the proposed algorithm resulted in a fuel consumption reduction of 2.1% in experimental runs and 0.5% in simulation, NOx emissions increased as a tradeoff. Wang et al. [20] proposed an integrated control method based on different optimization strategies for the auxiliary power unit’s (APU) on/off system and energy management optimization for REEVs using the Elitist Nondominated Sorting Genetic Algorithm (NSGA-II) for control parameter determination and urea injection to solve an ammonia leakage issue raised due to frequent start–stop characteristics of the APU. Caux et al. [21] and Hegazy and Van Mierlo [22] developed control strategies for power management by using Particle Swarm Optimization for Fuel Cell/Battery HEVs. While the former study discusses the feasibility of using PSO in developing an efficient control strategy for the Hybrid Electric Vehicle, the latter one demonstrated significant improvement in hydrogen (fuel) consumption. However, emissions control was not a focus of either of these studies.
Based on the review of the mentioned and the additionally existent literature, the scope of this study is defined. To ensure the desired performance of the real-time PMS, it is necessary to develop a baseline, rule-based strategy which adds a constraint on the developed strategy that is fixated on a particular driving schedule. Since the rule-based strategy can only provide suboptimal performance, an offline optimal control strategy is developed for a fixed driving schedule consisting of both city and highway driving behavior in this study. To solve this optimal control problem, it is necessary to treat the behavior of the REEV for the entire driving schedule as a whole. This leads to a challenge of trajectory optimization where the PMS strategy for an entire drive cycle is one single control variable, leading to a vector optimization problem. It is generally termed ‘time-based vector optimization’. Many developments are being made in the field of vector optimization; however, we propose vector-based Particle Swarm Optimization (PSO) algorithm to solve the challenge of trajectory optimization, which is a novel methodology. Furthermore, a few other modifications are suggested to the PSO to overcome the challenges associated with the vector PSO algorithm. Fuel consumption and NOx production by the REEV engine are both dependent on the engine performance which is dictated by the PMS. Hence, as a part of PMS optimization, the proposed strategy also performs multi-objective optimization (MOO) to simultaneously minimize both fuel consumption and NOx production for the REEV powertrain utilizing the innovative vector-PSO algorithm.
While Mehdizadeh et al. [23] demonstrated that the performance of a PSO algorithm can be improved by seeding the initial swarm with the result of a fuzzy c-Means (FCM) algorithm, our proposed PMS differs from that approach as it utilizes seeded PSO with vector optimization, along with the combination of Time-Varying Acceleration Coefficients (TVAC) PSO and Frankenstein’s PSO, to achieve the optimal performance of the system.
In the recent work on intrusion detection system using data collected from Internet of Things (IoT), they utilized Reptile Search Algorithm (RSA) to improve the performance of the detection system by selecting only the most important features extracted using a CNN model (Convolutional Neural Network) [24]. While there are some similarities between PSO and RSA algorithms, RSA is subject to slow convergence speed, high computational complexity, and local minima trapping. Thus, a modified PSO algorithm was deemed more appropriate to be developed in this study.

2. Materials and Methods

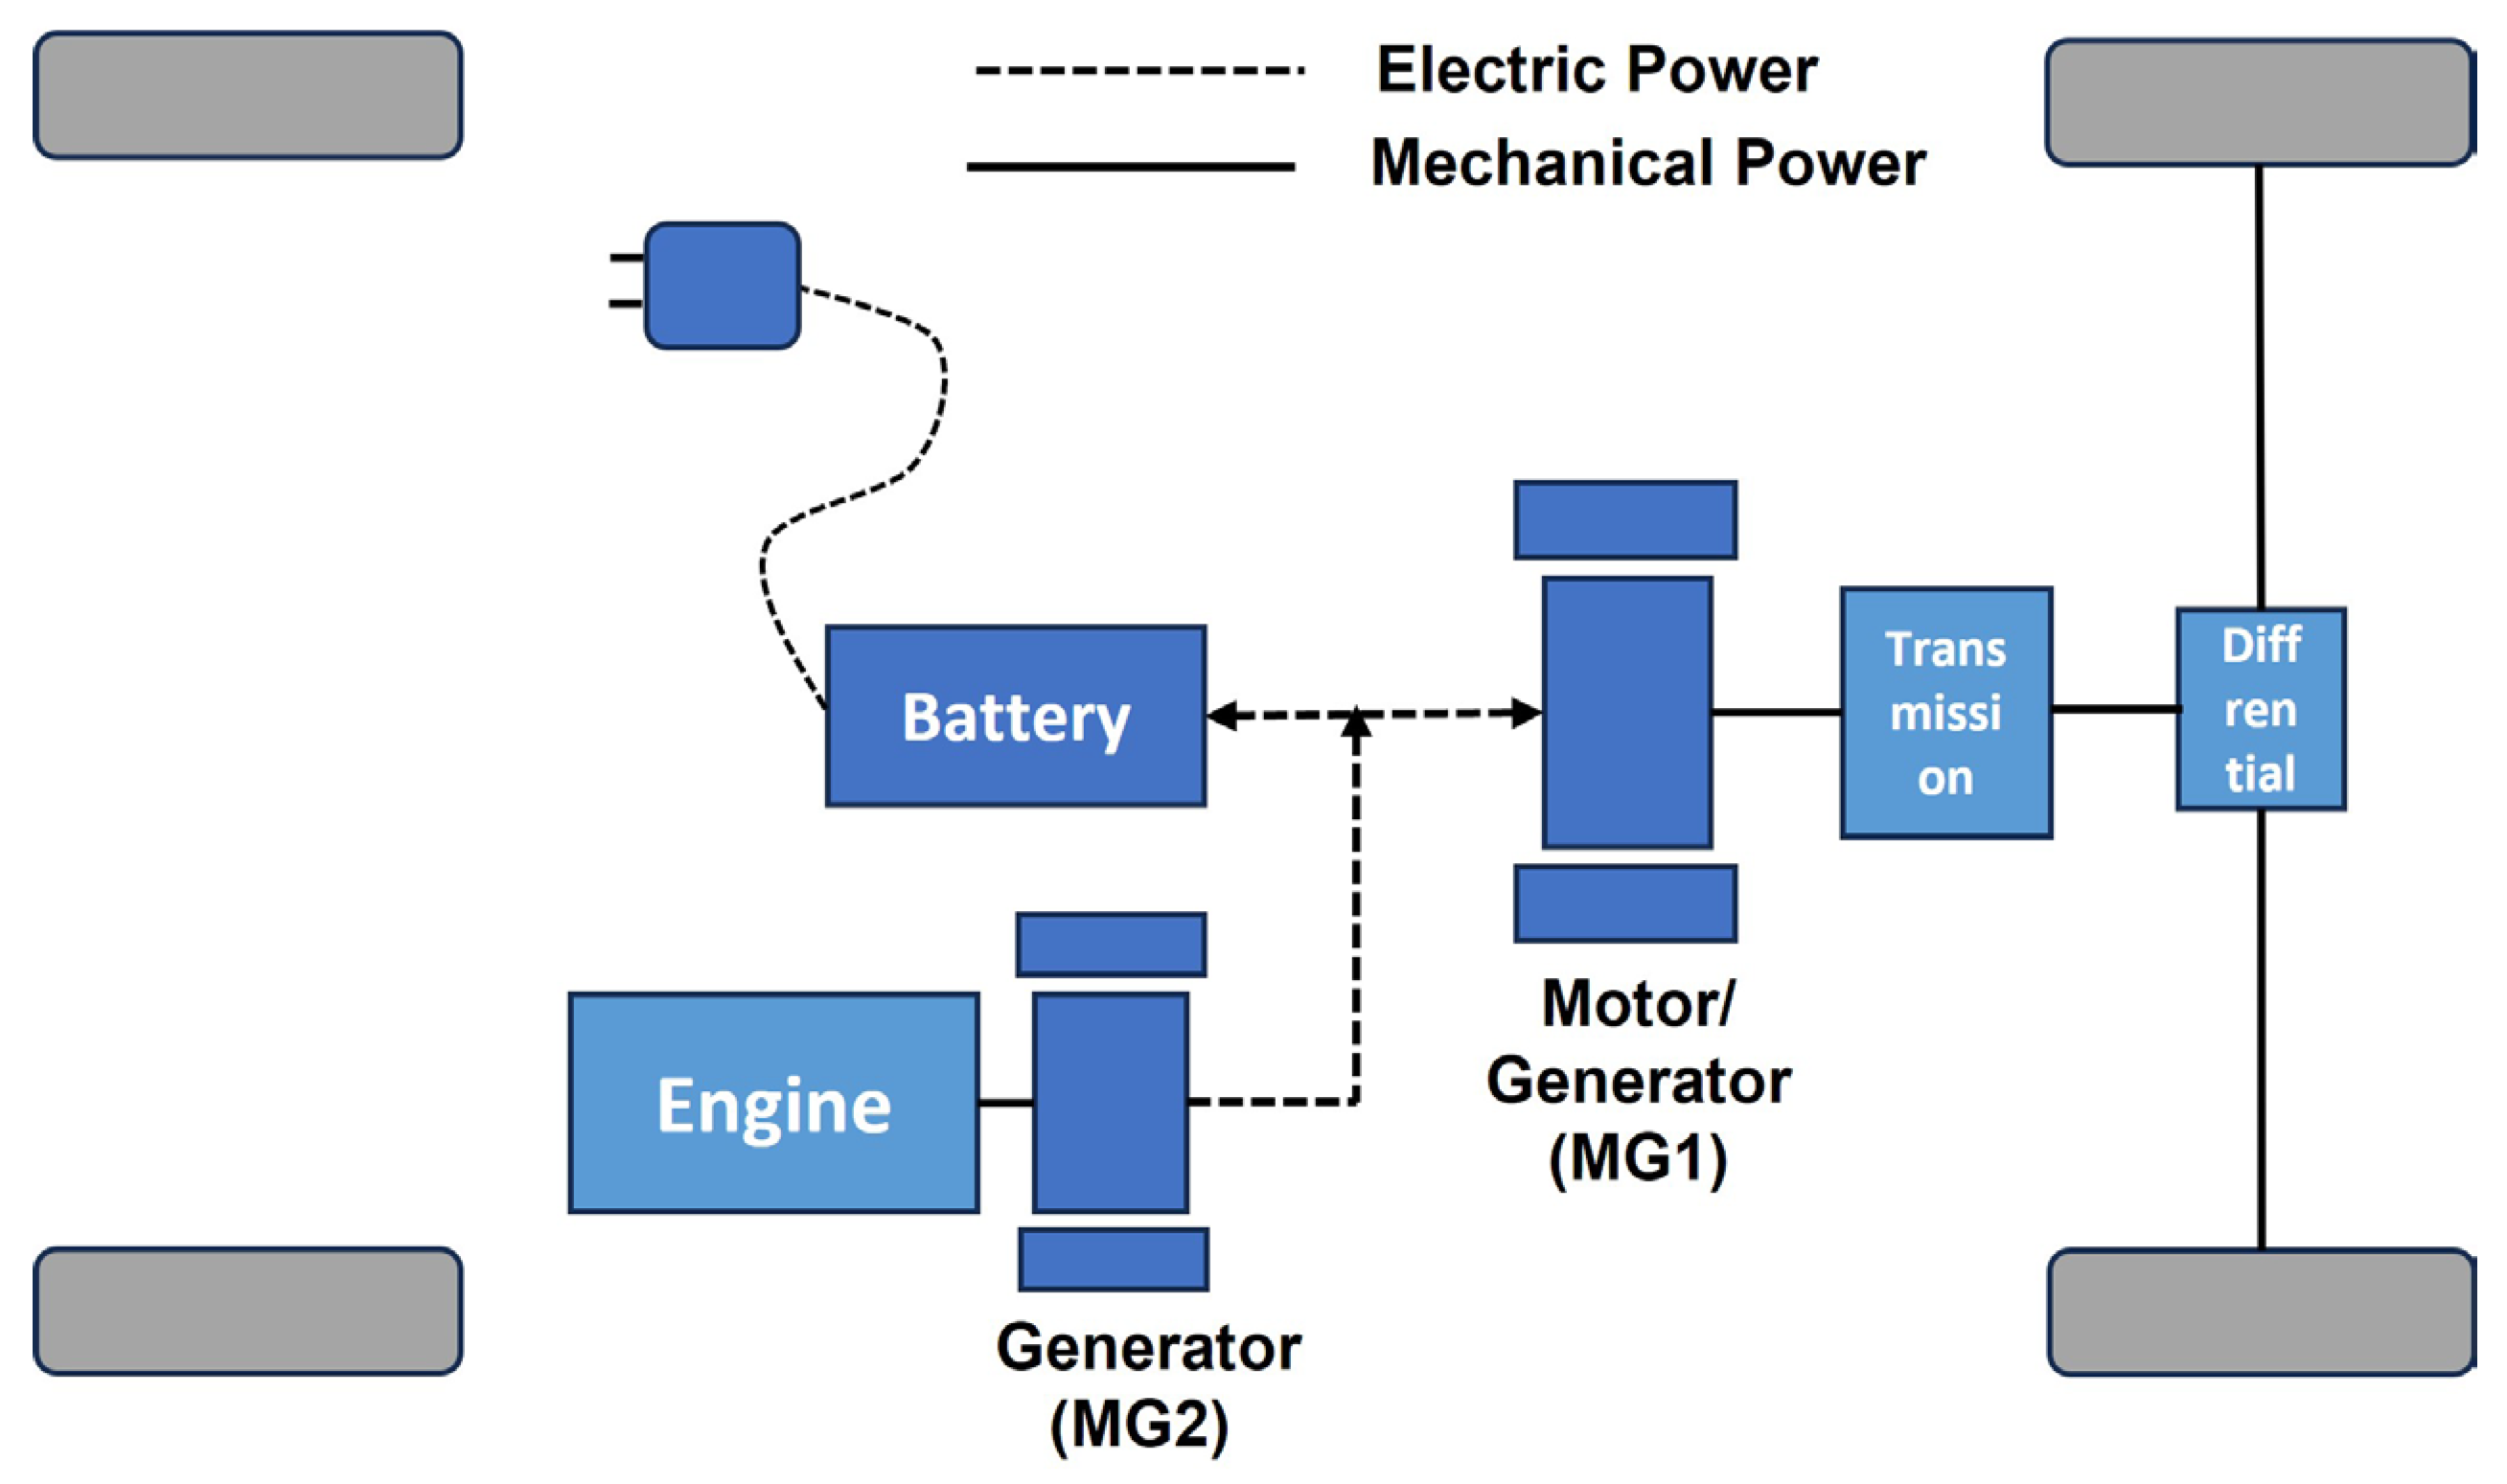
In this study, a full-vehicle model for a Range Extended Electric Vehicle (REEV) was developed. Figure 1 shows the REEV’s powertrain architecture used for this model. In the architecture, the engine is mechanically disconnected from the drivetrain. The vehicle is propelled by an electric motor (MG1), powered by a battery, and the engine/generator (MG2) is used to charge the battery when commanded by the Power Management System (PMS). The engine/generator is also used in conjunction with the battery to power the electric motor when the vehicle power demand is high. This yields the equation:
P B a t t = P e n g P v e h r e q
P v e h r e q is known from the drive cycle and the vehicle model. The power required by the battery, P B a t t is a function of battery State of Charge (SOC) and P e n g depends on the running speed and the torque of the engine. The optimizer is deployed to manage the PMS consisting of battery SOC and engine running speed as control variables to minimize fuel consumption of and the NOx emission of the engine during the drive cycle. It is important to note that the NOx values measured in this study are engine-out NOx values and without treatment from any other systems.
Figure 1. Range Extended Electric Vehicle’s (REEV) powertrain architecture.
Energies 16 05082 g001

2.1. Model Development

Different approaches, such as kinematic, quasi-static, and dynamic modelling, can be used to model a drivetrain [2]. However, this model is also to be used to evaluate the fitness function and will result in high computational requirements if its level of complexity is not optimized. Therefore, a simple kinematic approach is taken while developing the model. This approach uses a reversed-looking methodology to determine the engine outputs statistically depending on the vehicle performance for a set of drive cycles. Figure 2 demonstrates this approach in a flow diagram.
For simplicity, it is assumed that the direction of motion of the vehicle is longitudinal, and resistive forces F r s   include grade Resistance F g   , rolling resistance F r   and aerodynamic drag F a   . The total tractive effort at the road-tire contact interface, F t , needed is the sum of propulsion force F d   and the resistive forces. The torque τ w o   and speed ω w o requirement at the wheel can then be calculated as follows:
F t = F d   + F r s  
F r s   = F a   + F r   + F g  
τ w o   = r w   × F t
ω w o = v r w  
where r w   is the radius of the wheel and v is the velocity of the vehicle.
For this model, all the powertrain components are considered rigid. Frictional and thermal losses are ignored for the sake of simplicity. Hence, the output of one subsystem can be considered equal to the input of the next subsystem shown in Figure 2. With the torque and speed required at the contact patch known, the next subsystems can be modeled such as the REEV drivetrain. Single-gear transmission is assumed in this architecture since the vehicle is solely driven by the motor, eliminating the requirement of multi-gear transmission [25]. However, the component inertias are considered, as they are a major factor affecting the accuracy of the model.
For the wheel, the relationships among input wheel speed ω w i , required wheel torque τ w i   , output wheel speed ω w o , output wheel torque τ w o   , output speed and output torques of final drive, ω f d o   and τ f d o   can be written as follows. The torque equation includes the inertia of the wheel j w .
ω w i = ω w o
τ w i   = τ w o   + j w d ω w i d t
τ f d o   = τ w i  
ω f d o   = ω w i  
Similarly for the final drive, the equations relating the input and output speeds, ω f d i and ω f d o , and torques of final drive, τ f d i   and τ f d o   , and the speed and torque of gearbox output ω g b o   , τ g b o   are shown below.
ω f d i = ω f d o × i f d
τ f d i   = τ f d o   i f d + j f d d ω f d i d t
τ g b o   = τ f d i  
ω g b o   = ω f d i  
where i f d represents the final drive gear ratio. For the gearbox, the equations relating the speed and torque of the gearbox input ω g b i , τ g b i   to the speed and torque of the motor-generator MG1 ω m g 1   , τ m g 1   and the rest of the system are as follows:
ω g b i = ω g b o × i g b
τ g b i   = τ g b o   i g b + j g b d ω g b i d t
τ m g 1   = τ g b i  
ω m g 1   = ω g b i  
where the subscript i indicates the inputs and o indicates the outputs. The symbol j represents the polar moment of inertia of a subsystem, i g b represents the gear ratio at the gearbox.
These sets of equations establish the relation between the vehicle’s required performance and the requirement from the actuator of the powertrain which is the motor/generator. It is important to note that MG1 is the only actuator that can be used for regenerative braking as it is mechanically connected to the vehicle drivetrain and the wheels allowing for braking energy to be used for the regeneration by MG1. On the other hand, the other actuator (MG2) is connected to the engine output shaft and mechanically disconnected from the drivetrain/wheels which inhibits its capability of receiving energy from the vehicle’s braking action. While modeling the motor/generator, conversion efficiency maps were used to relate torque, speed, and power based on test data. The torque and speed values are limited to the rated values τ m g 1 _ a c t   , ω m g 1 _ a c t   of motor/generator (MG1). The electrical power produced by MG1 P m g 1 e l e c is a function of the rated torque and speed values of MG1. The following equations are used to determine these variables:
τ m g 1 _ a c t   = τ m g 1   + j m g 1 d ω m g 1 _ a c t d t
ω m g 1 _ a c t   = ω m g 1
P m g 1 e l e c = f τ m g 1 a c t ,   ω m g 1 a c t
A statistical approach was used to model the engine. Look-up tables producing the fuel rate m ˙ f and NOx flow rate m ˙ N O x based on the current engine speed ω e n g and torque τ e n g as inputs were utilized. The flow rates m f ˙ and m N O x ˙   are integrated in turn over the duration of drive cycle time to find cumulative outputs. These values provide the total cost outputs m f and m N O x from the model.
m ˙ f = f τ e n g ,   ω e n g
m ˙ N O x = f τ e n g ,   ω e n g
m f = m f ˙   d t
m N O x = m N O x ˙   d t
Running torque and speed values of engine depend on the required torque τ e n g _ r e q and speed   ω e n g _ r e q from the engine which is a function of PMS commanding battery charging event while executing the drive cycle. Considering the inertia effect, the required values can be determined from the following equations:
τ e n g   = τ e n g _ r e q + j e n g d ω e n g d t
ω e n g   = ω e n g _ r e q
where j e n g is the engine’s mass moment of inertia.
Generator MG2 is responsible for converting the required engine power to electrical power P m g 2 e l e c . Although it is modeled in a similar fashion to MG1, it is only utilized for unidirectional energy flow since it is connected directly to the engine output shaft. The power provided by MG2 is limited by the maximum rated current it can handle. Moreover, as this model is battery-centric, the effect of inertia is reversed in the case of MG2, leading to following set of equations for torque and speed of MG2, τ m g 2    and ω m g 2   , the rated torque and speed of MG2, τ m g 2 _ a c t   and ω m g 2 _ a c t , and electrical power P m g 2 e l e c
τ m g 2   = τ e n g  
ω m g 2   = ω e n g  
τ m g 2 _ a c t   = τ m g 2 j m g 2 d ω m g 2 _ a c t d t
ω m g 2 _ a c t = ω m g 2
P m g 2 e l e c = f τ m g 2 _ a c t ,   ω m g 2 _ a c t
A comparatively simple battery modeling approach is used for the battery of this REEV where Coulomb Counting method with Peukert’s Law is used in this study [26]. The total power flow to and from the battery depends on the power given and taken from MG1 and MG2. Sign conventions are maintained where power taken from the battery is positive and power given to the battery is negative. The model yields the following set of equations.
P b a t t = P m g 1 e l e c + P m g 2 e l e c
d i d t = P b a t t v o c
v o c ˙ = d i d t × r
Δ s o c b a t t = 1 q d i d t
where v o c is the battery voltage, i is the current flow, r is the internal resistance and q is the capacity of the battery, and Δ s o c b a t t is the change in the battery SOC in time.
The equations mentioned above establish the relationship between all the subcomponents of a hybrid electric vehicle (REEV) and their power flow. In order to implement the optimal control via the Power Management System (PMS), the developed powertrain model must receive a control input from the optimizer. Particle Swarm Optimization (PSO) allows the optimizer to gain intelligence about the model without delving into its sublevels, making a sophisticated control approach for PMS unnecessary. Instead, a simple thresholding approach is used where, if the desired State of Charge (SOC) provided by the optimizer (SOCpso) is higher than the battery SOC level (SOCbatt), the engine is turned on at an adequate torque level to compensate for the difference, otherwise, it remains off. It only makes sure that whenever the instantaneous SOC of the battery SOCbatt, falls below the target battery SOC from the PMS, SOCpso, the engine is turned on to compensate the difference providing the power Peng to battery in order to reach the SOCpso depending on the bus voltage voc. Furthermore, depending on the target engine speed specified by the PMS ωpso, the required torque from the engine τeng can also be determined. It is assumed that EMS ensures that the engine speed ωeng is maintained at the speed specified by PMS ωpso. For the other condition where the instantaneous battery SOC is already higher or equal to the target battery SOC from PMS, the engine is kept off, which means, the required power from engine is set to 0. This in turn ensures that the fuel consumption and NOx emission at that particular timestep is 0. This approach can be mathematically modeled as:
F o r ,     s o c p s o > s o c b a t t
s o c c o m p = s o c p s o s o c b a t t
ω e n g _ r e q = ω p s o
P e n g = s o c c o m p × q × v o c
τ e n g _ r e q = P e n g ω e n g _ r e q
F o r ,     s o c p s o   s o c b a t t
τ e n g _ r e q = 0
ω e n g _ r e q = 0
The total fuel consumption m f and NOx emission m N O x of the system over the driving schedule can be minimized by following the proposed reverse-looking approach through utilizing s o c p s o and ω p s o as control levers and computing the costs via Equations (20)–(24). While Equations (21) and (23) are used for the fuel consumption minimization, Equations (22) and (24) are used for NOx optimization.

2.2. Model Validation and Comparison

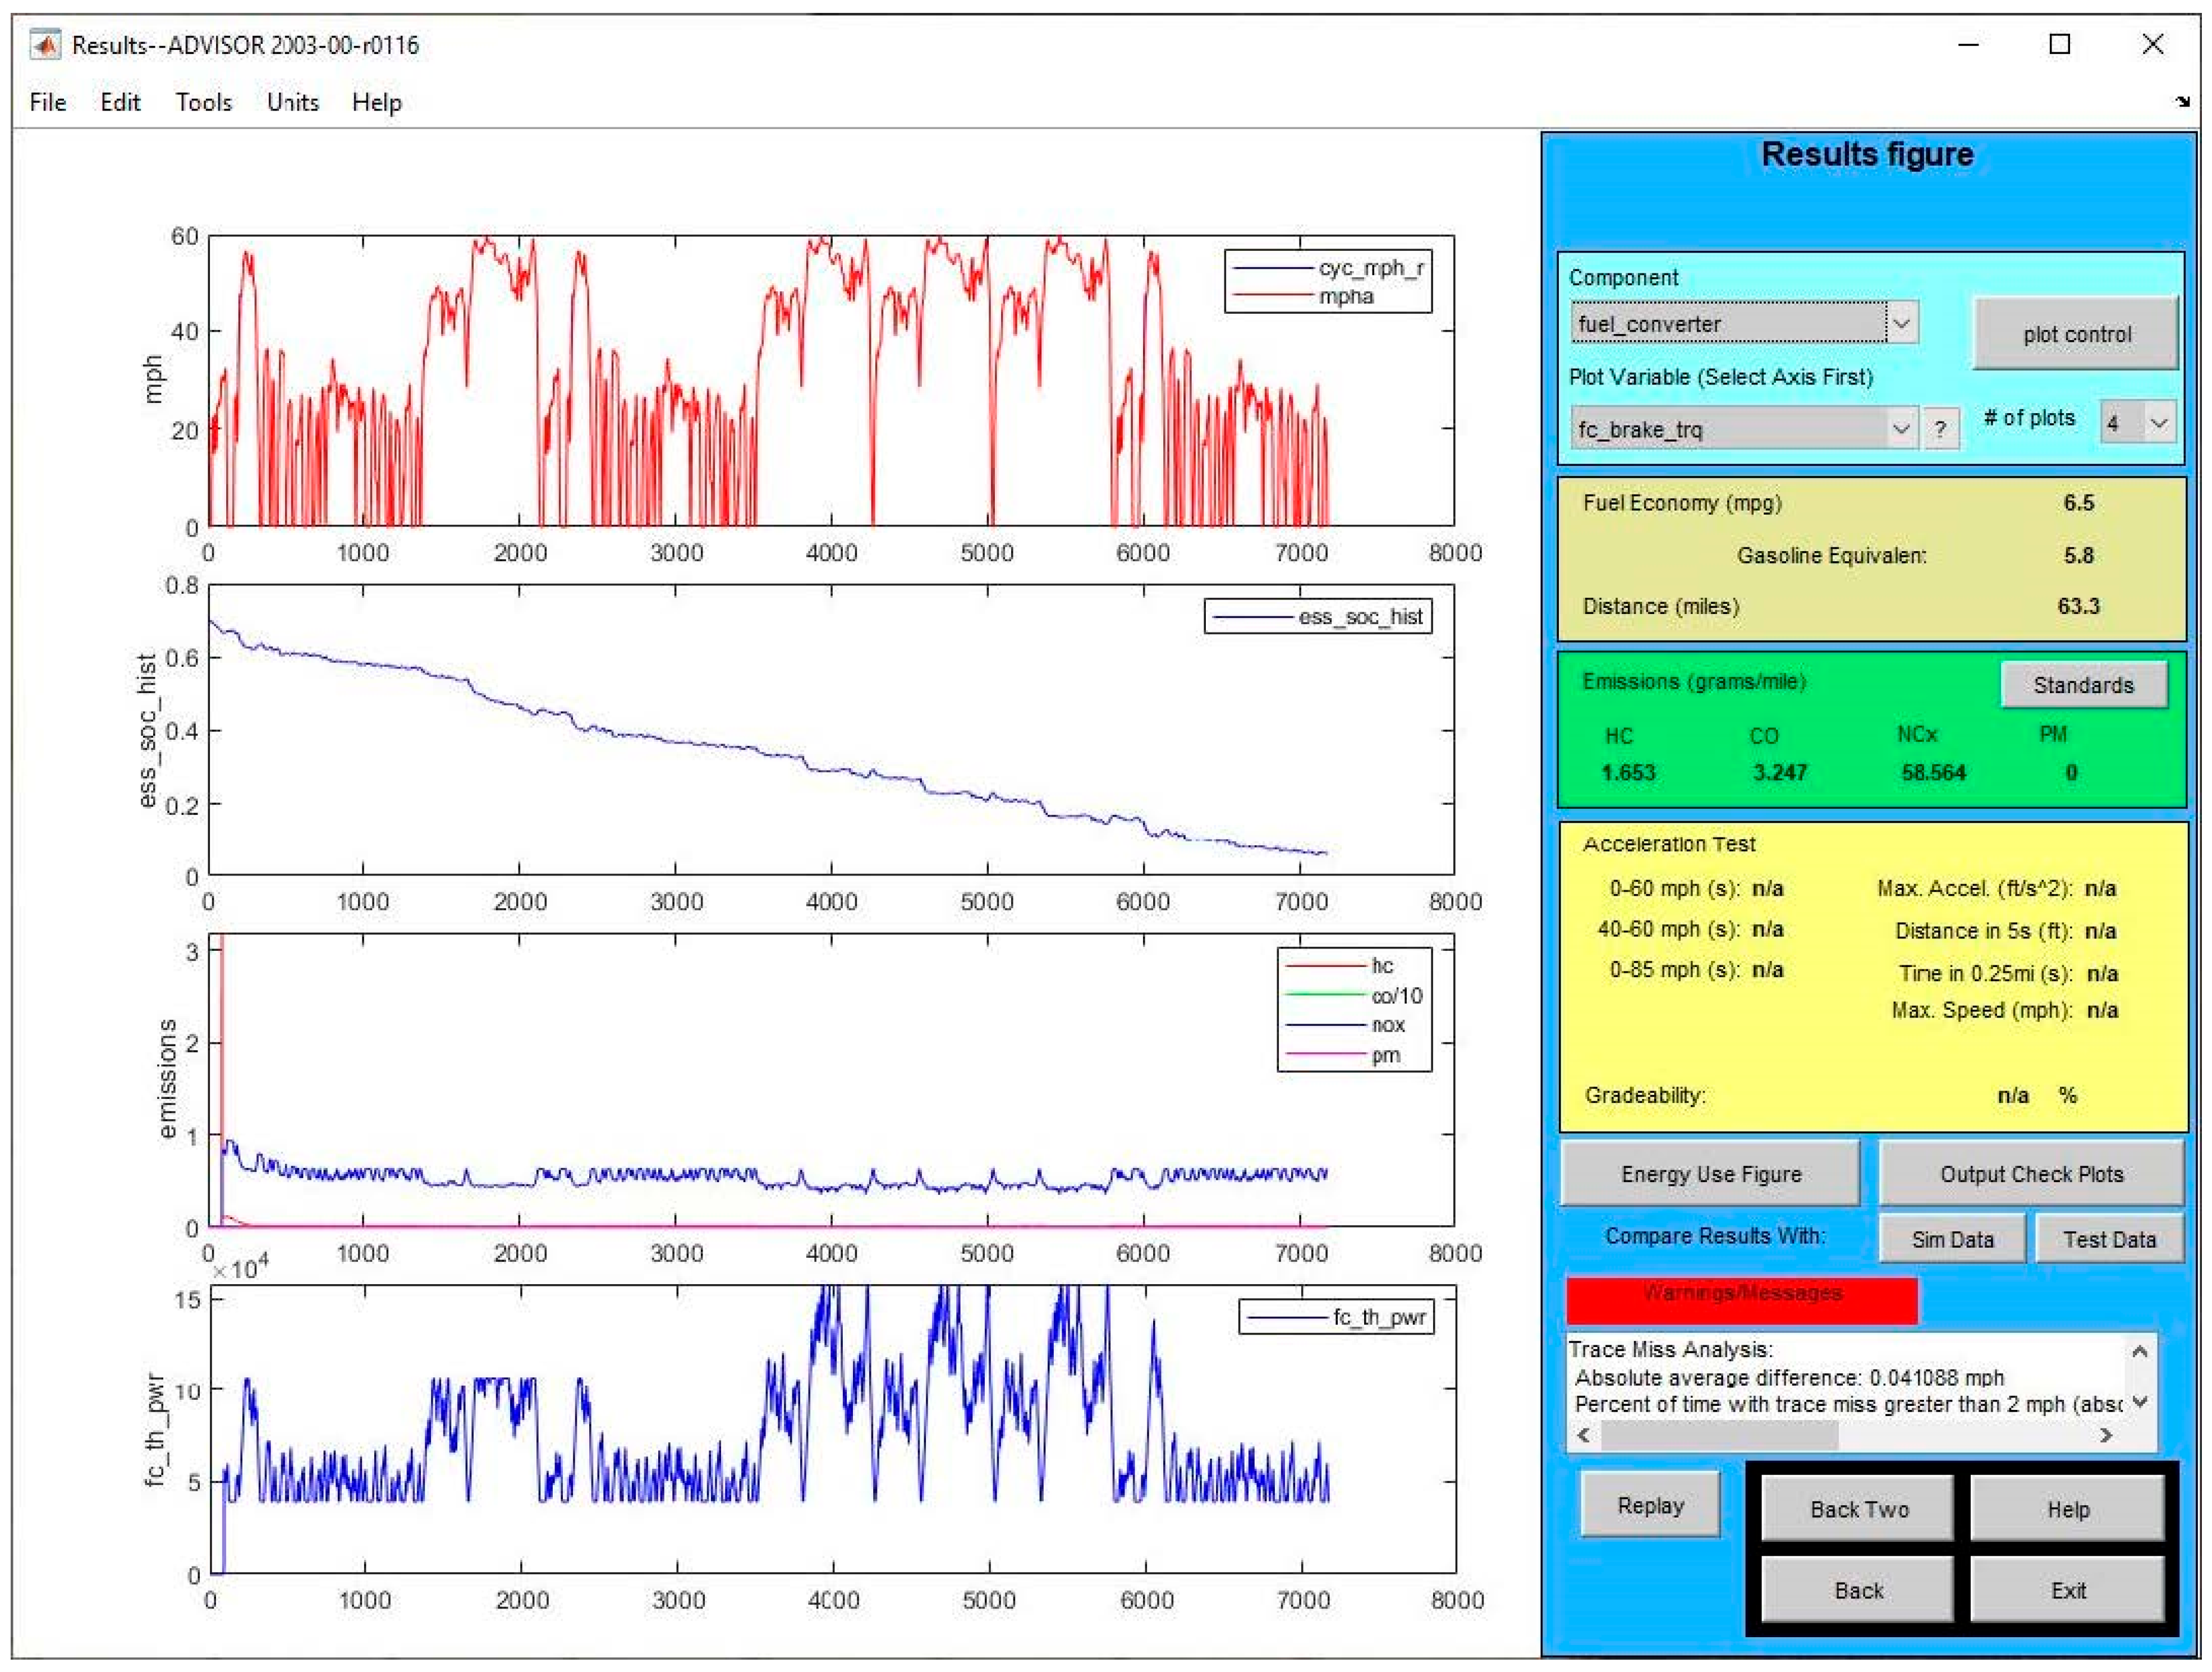
The developed model was validated against a simulation made on National Renewable Energy Laboratory’s (NREL) Advanced Vehicle Simulator (ADVISOR) [27], with the parameters set by the data available from the simulator. ADVISOR is a software with a graphical user interface (GUI) containing a number of vehicle powertrain models, data, and script files that are used in MATLAB and SIMULINK environment to simulate the behavior of various conventional, hybrid-electric, or electric vehicle powertrains. Powertrain parameters such as engine efficiency maps and fuel/NOx flow rate maps are also built into this software. For a given powertrain, the inputs would be the driving schedule, road grades, simulation end time, etc., while the outputs would include fuel efficiency (MPG), NOx, and other emissions, etc. The control parameters are generally engine power command, motor power command, etc., which are generated by the power management system (PMS). ADVISOR also has a set of REEV models pre-established. However, ADVISOR is focused on accuracy in vehicle simulation, and thus it is less compatible with external optimizers. Secondly, it does not let the user modify control strategy to a great extent in order to optimize the control strategy. For an optimizer to be deployed for specific purposes such as this study, the model needs to be tweaked to establish the relationship between desired control variables and cost outputs. Further, ADVISOR model offers increased level of complexity while capturing system dynamics making it computationally expensive. Despite the aforementioned issues, the proposed model can be validated against ADVISOR simulation output to make sure that the validated model could be used for energy optimization purposes.
The drive cycle used to simulate the behavior of both the proposed REEV model and the ADVISOR model, which is shown in Figure 3. An approximately 2-h long drive cycle was created comprising adequate amounts of city and highway driving. UDDS and HWFET cycles are used for city and highway driving, respectively. A combination of these two with multiple instances is created using ADVISOR’s trip building function.
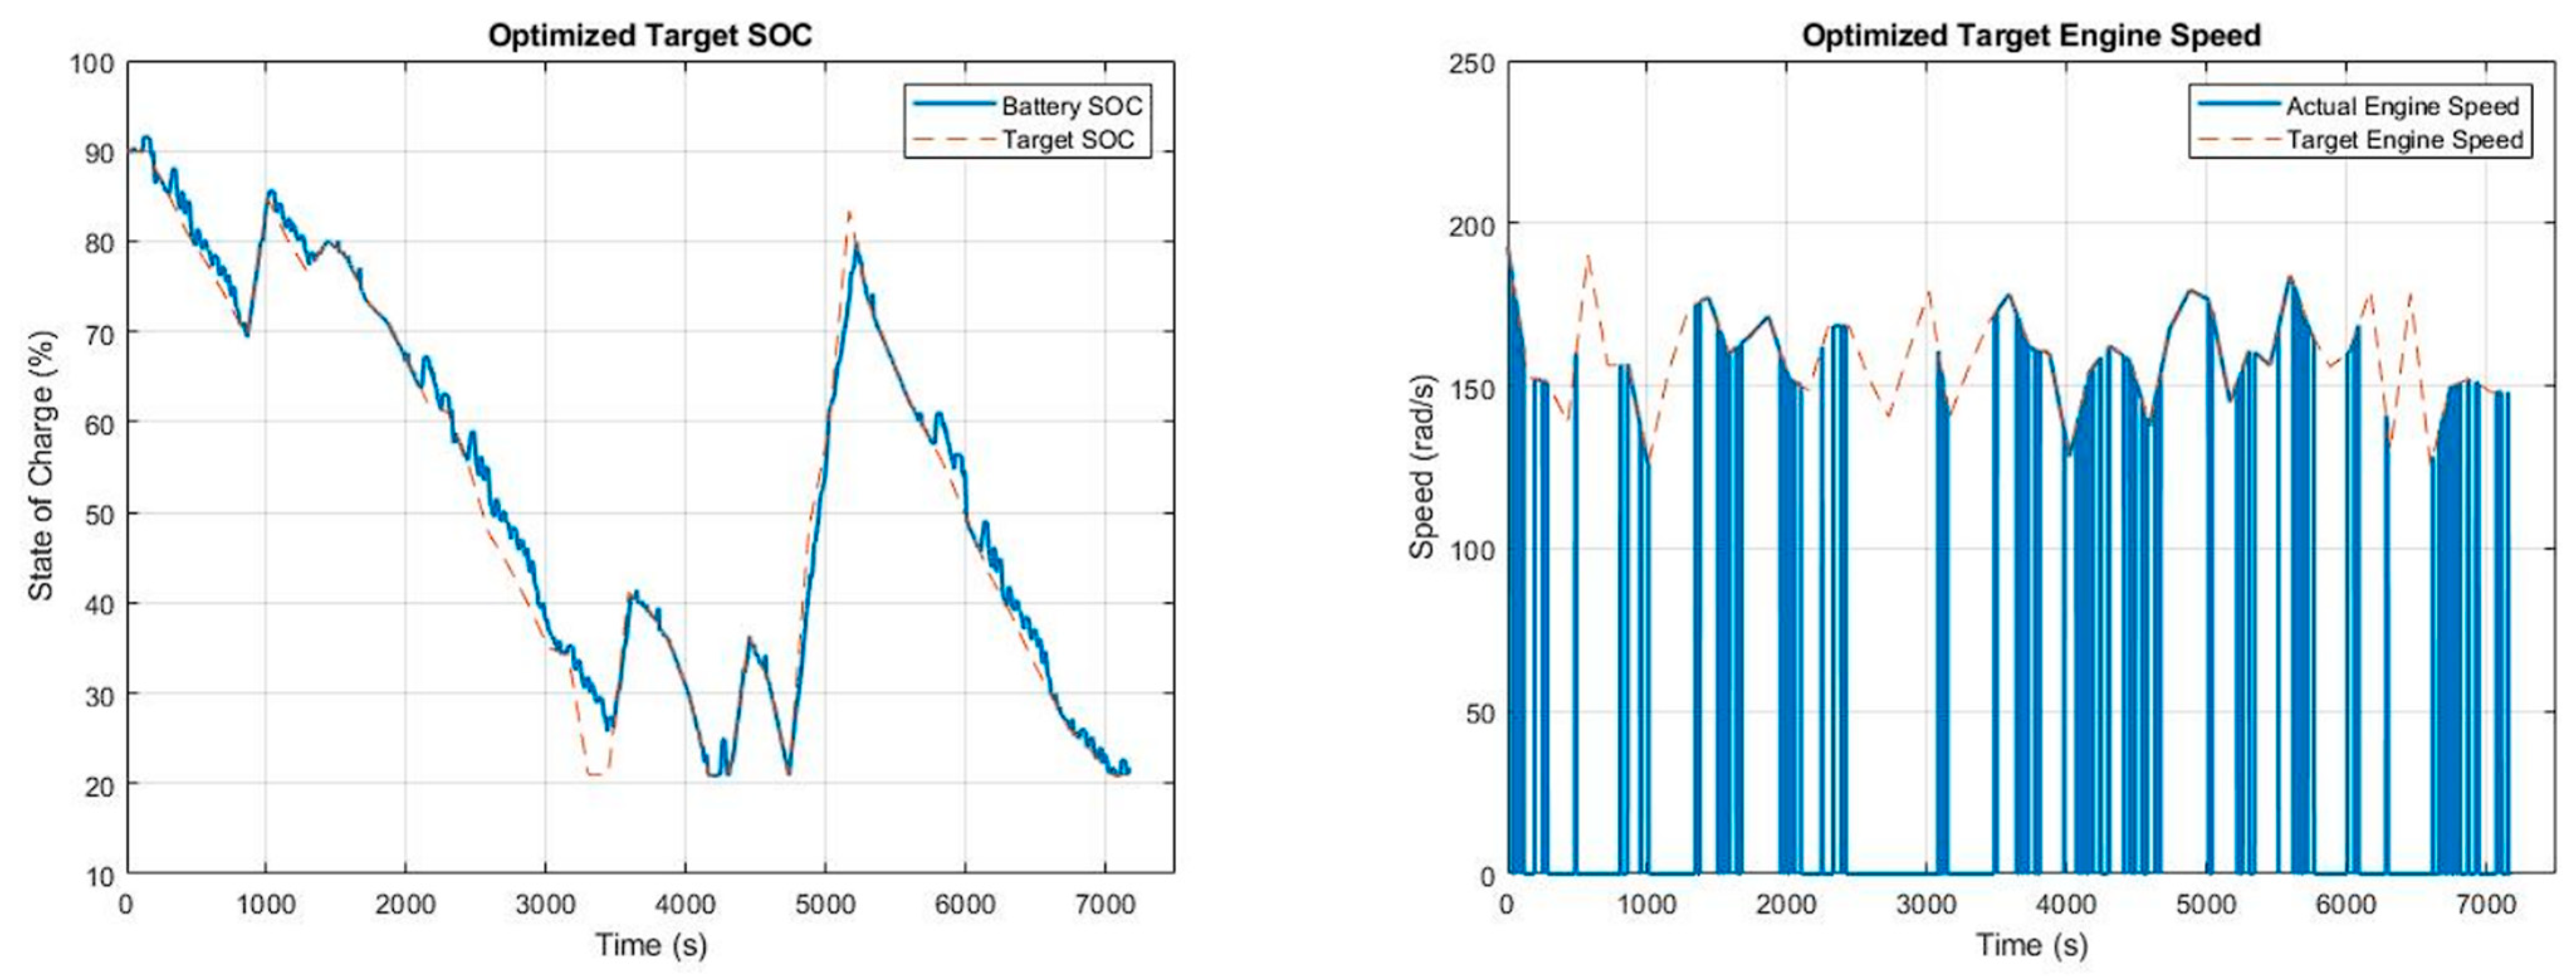
In our model validation approach, a reference battery SOC trajectory appropriate for the above drive cycle is used that the REEV must try to maintain. This battery target SOC is based on a priori knowledge of the distance to be traveled, road grades, and drive cycle shown in Figure 3. The constantly decreasing reference SOC trajectory is aimed at utilizing the stored battery energy fully for the trip, which would result in fully depleted SOC at the end of the trip. It is expected that the engine fuel consumption will be minimized when the battery stored energy is fully utilized during the road trip. The principal objective of optimal energy management is then translated as to optimize this SOC target trajectory through the proposed PSO algorithm which would offer minimum fuel consumption and minimum NOx output in a weighted sum fashion. Whenever the battery SOC falls below the target SOC, the engine operates and charges the battery to the target SOC, thus it continues to follow a SOC from 70% to 10% in a course of 7000 s.
For both the proposed model and the ADVISOR model, a similar battery target SOC trajectory was used for validation purposes. ADVISOR uses predefined power management strategy to simulate the behavior of a vehicle with given parameters. Hence, a similar PMS equivalent to the one used by ADVISOR was provided to the proposed model to verify if the model would show similar outputs as the ADVISOR model. The results are shown in Figure 3 and Figure 4. It is evident from Figure 3 that the target SOC is closely followed by battery SOC output from the proposed REEV model with good accuracy which is achieved through the PMS implemented. Whenever the battery SOC falls below the target SOC, the engine ramps up and charges the battery to achieve the target SOC, thus it continues to follow a SOC from 70% to 10% in a course of 7000 s. A similar output was obtained from the ADVISOR model as illustrated in Figure 4.
It can be observed that both the proposed model and the ADVISOR model provided similar outputs for the given drive cycle. Results from the simulation run yielded a fuel consumption of 23.6 L and NOx emission of 1292 g for proposed model, as opposed to 36.82 L fuel consumption and 3707 g NOx emission for ADVISOR model. The differences in output are due to the differences in model design as well as the simplification of the model. Furthermore, the control strategy for both these models is not identical, causing deviation in the produced respective outputs. It is important to note that the aim of this study is to perform trajectory optimization effectively for the given model. Hence the deployment model can be acceptable if the followed trend by both of the models is similar. We will use the output of the developed model as the baseline figures.

2.3. Modified Particle Swarm Optimization

In the classical PSO [28] algorithm, the positions and the velocities for the next iteration are updated using the following equations.
v i k + 1 = w v i k + c 1 r 1 g b k x i k + c 2 r 2 p b i k x i k
x i k + 1 = x i k + v i k + 1
where,
  • v i is the velocity of i th particle,
  • x i is position of i th particle,
  • k is the index of iteration,
  • p b i k is personal best of particle i found till iteration k ,
  • g b k is global best of the swarm found till iteration k ,
  • w is Inertia Coefficient,
  • c 2 is Cognitive Coefficient,
  • c 1 is Social Coefficient,
  • r 1   r 2 are random numbers in range [0, 1].
However, in our proposed modified PSO algorithm, several modifications are made. The classical PSO has several limitations: (i) it lacks prior intelligence of particles causing the initial particles to be placed at random positions which can result in the algorithm taking longer timespan to converge, particularly in high-dimensional search spaces. Furthermore, the learning complexity increases significantly with the number of dimensions in the search space, as the number of particles required to obtain good coverage of the search space grows exponentially with the number of dimensions. Additionally, there are chances that the solution will get stuck on a local minima.
To overcome these limitations, we have introduced the notion of Seeded PSO where a priori knowledge of speed and power points (vector particles) for a desired SOC trajectory (from experimental data) are used as the seed vector particle. The seeded-PSO algorithm allowed the optimizer to converge on the optimal SOC trajectory faster.
Another modification that we proposed to the classical PSO algorithm is the idea of the vector particle. Since the whole SOC trajectory is to be optimized, the two control signals (namely, MG2 speed and power) must each be a set of values covering the whole travel time in each iteration. We chose 50 element time variant signals for each of these two control variables, termed as vector particles, which constituted a 100D problem for the optimizer. This significantly increased the complexity of the problem since each vector particle (engine speed points and engine power points for the entire SOC trajectory) was of size 50. Thus, the number of vector particles was limited for computational efficiency. Figure 5 illustrates the flowchart of the modified PSO algorithm.
Although the Seeded PSO is aimed at biasing the optimizer towards a certain potentially optimum plausible solution during initialization, the effectiveness of this approach is dependent on the degree to which the optimizer is skewed towards the correct direction. Otherwise, use of this method may lead the optimizer towards a locally found optimum relatively far from the global optimum, defeating the purpose of the modification. Specifically, the modification is made to incorporate the biasing towards the potentially optimal solution as follows:
Set k = 0. For i = 1, …, n, generate initial random position vectors x i 0 and the corresponding velocity vectors v i 0 , of dimension d and set p b i 0 = x i 0 . For i = 1, …, m, set, x i 0 = X i and v i 0 = V i , where X and V are m number of known seed (vector) particles of dimension d. Then, Set g b 0 = a r g m i n x x 1 0 , , x n 0 f x .
Instead of random initialization of the particles, the Seeded PSO suggests replacing a few of them with a small number of “Seeds”, which are already known to be near optimal solutions, and they could be used as the guide to the swarm at early stages. In similar fashion the initial velocities of the added positions also could be predetermined. This suggested variation of PSO specifically targets one of the challenges faced by the basic PSO arising due to a very large number of dimensions. As the number of dimensions of the positions for each particle increases the level of complexity which swarm must intellectually learn, it is difficult to keep the acceptable resolution of said dimensions while forcing the optimizer to converge. This causes a very high risk of getting stuck at potential local minimum rather than advancing toward the global optimum or being confused by the frequently found local optimums resulting in longer convergence time due to discontinuities in the objective function. Given that seeding can help the PSO overcome its drawback against higher number of dimensions to optimize, it also possesses risk if not used appropriately. However, it is important to understand that seeding the PSO possesses potential risk of misleading the swarm at the initiation which will slow down the convergence even more as the swarm will need a greater number of iterations to self-correct itself or will result in converging on local optimum by overlooking the global optimum in the process. It is also worth mentioning that this method can only be used when the provided seeds to the PSO are validated by assessing against the fitness function or are obtained by experimental data of the modeled system a priori.
A couple of other modifications to the algorithm are also made to enhance its performance and enable control over the behavior of the swarm through the optimization process. These modifications include TVAC PSO [29] and Frankenstein’s Constricted PSO [30]. Frankenstein’s PSO allows users to limit the learning rate and control the step size of the iterative process by constraining the velocity with a factor called the constriction factor k .
k = 2 2 2 4
Where ,   = c 1 + c 2   and   > 4 .                            
TVAC stands for Time Varying Acceleration Coefficients. This variation allows the PSO algorithm to make the coefficients dynamic instead of keeping them constant throughout the optimization. TVAC PSO allows for dynamic control of the swarm’s exploitative and explorative behavior.
c 1 = g k
c 2   = h k
where, k is the iteration number, g is a linear function with a positive slope and h is a similar function of negative slope. In this study, each particle corresponds to a particular battery SOC and engine speed trajectories as its position. Each of these particles are iterated to find the optimal PMS producing minimum fuel consumption and NOx emission individually. The PSO coefficients are tuned by constriction factors by closely observing the behavior after reducing the learning rate. The social coefficient is chosen to increase from 0 to 2 linearly and cognitive coefficient was decreased from 2 to 0 logarithmically using TVAC PSO. This allows for exploration around the proximity of the initial particles at earlier stages of optimization before moving towards the global best as quick as possible. The system is seeded based on prior knowledge for faster convergence.

2.4. Multi-Objective Optimization by Pareto Optimality

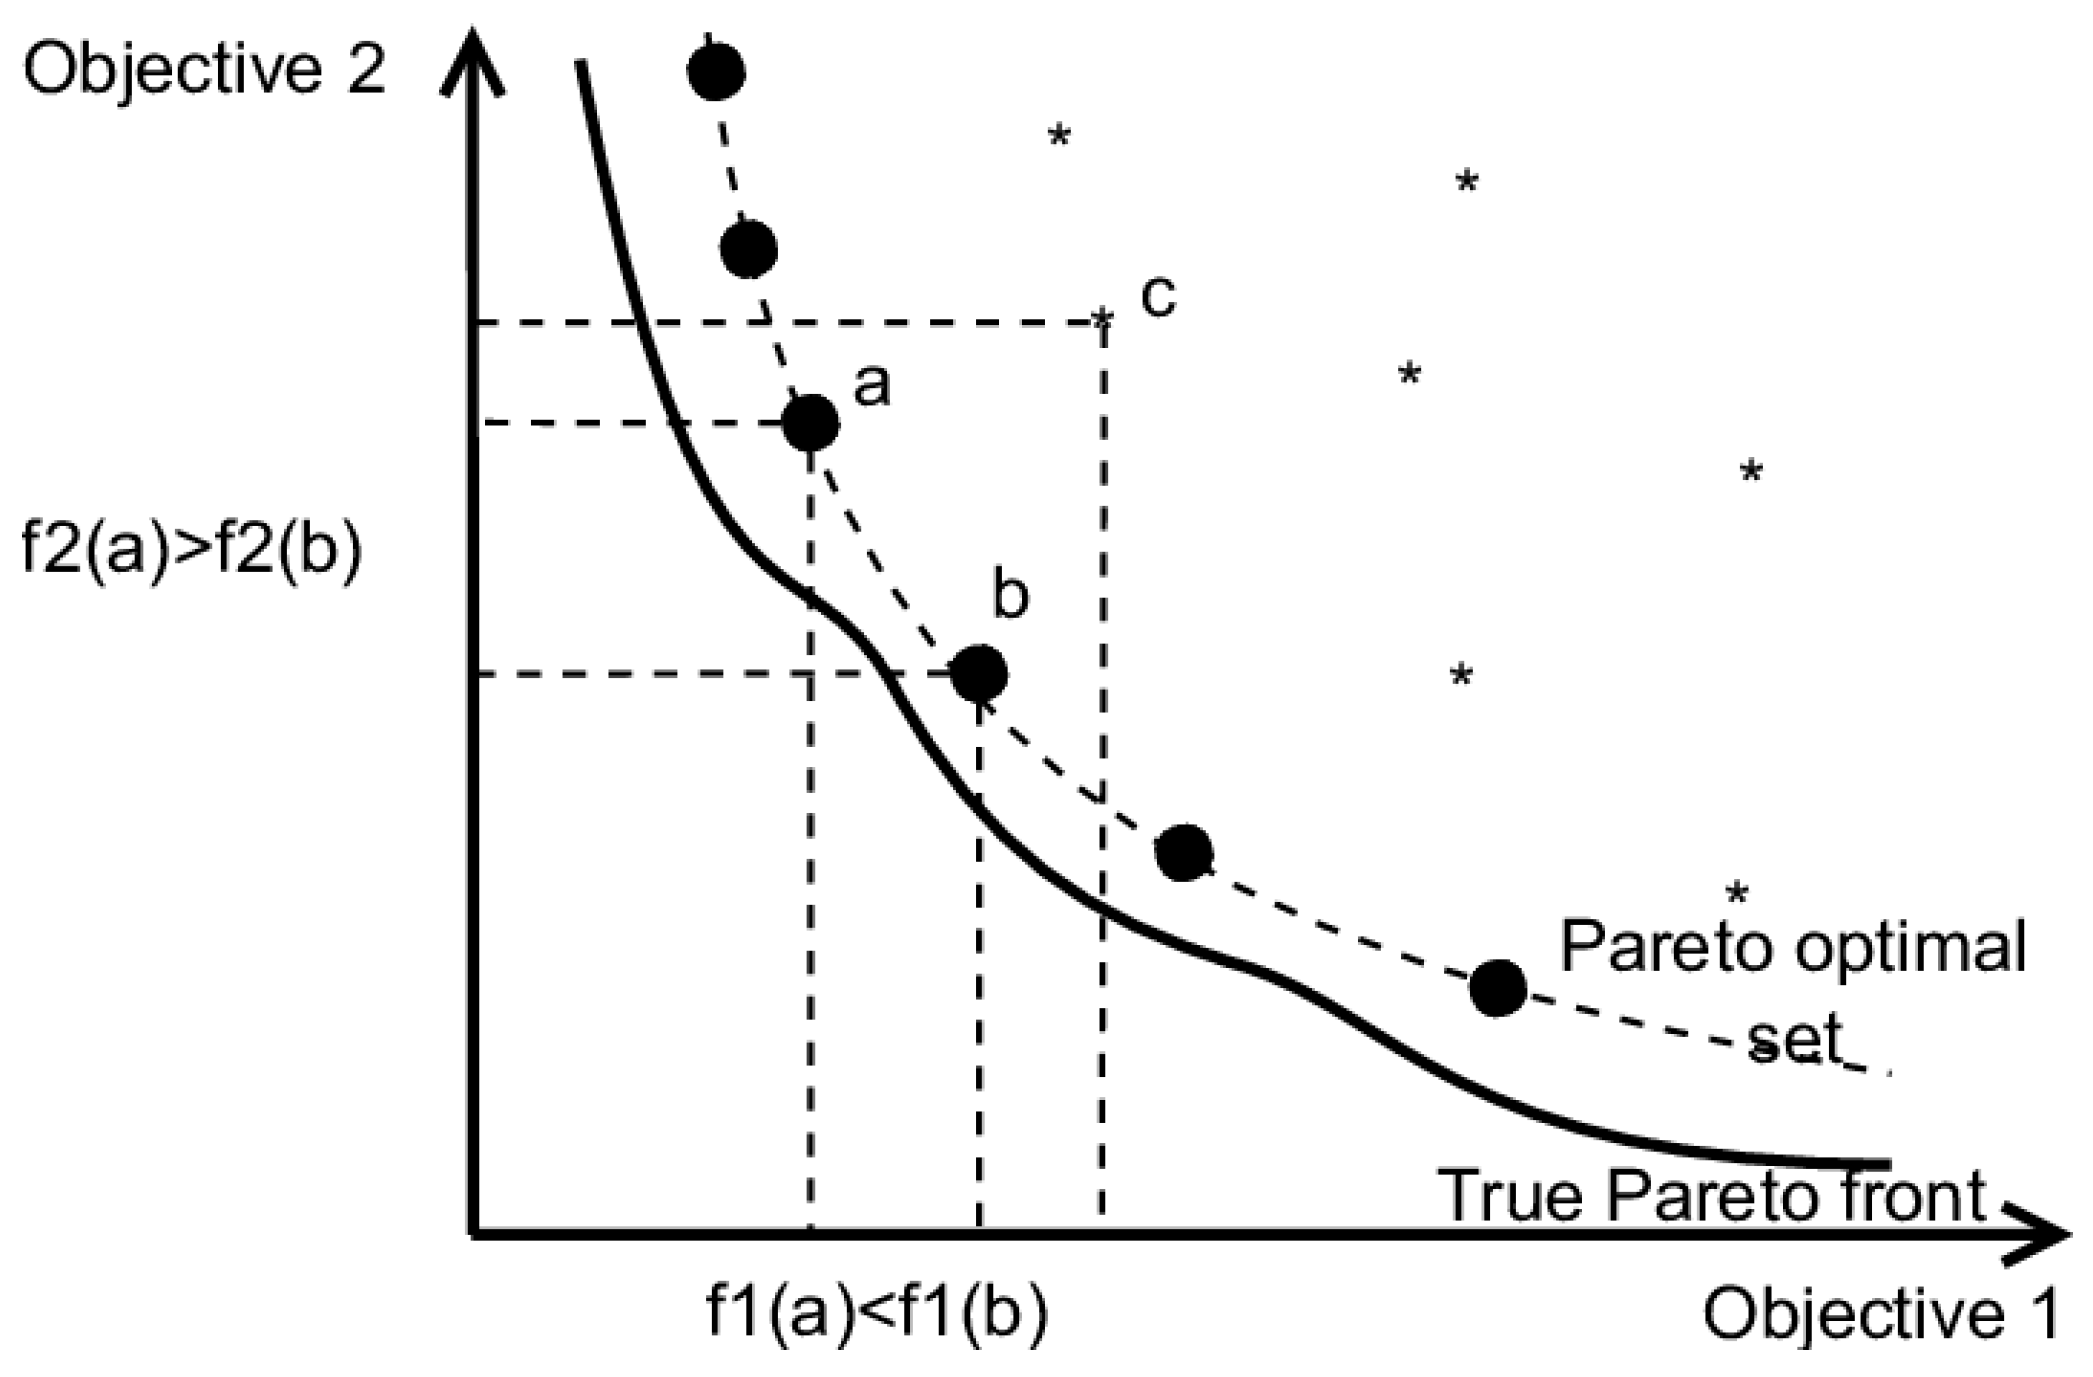
One trivial requirement of PSO is that the fitness or cost output from the objective function needs to be a positive scalar value. Hence, by default the optimizer can optimize only one cost at a time. In our case, it is either NOx production or fuel consumption. To minimize both costs, a multi-objective optimization formulation is needed where the objective function containing both the costs can be transformed to produce a single scalar value. This can be done through pareto optimality [31]. It can be assumed that no set global best solution can be found from multi-objective optimization, but a set of plausible solutions can be found where each point in this set corresponds to a different trade-off between the objectives. The concept of pareto optimality can be defined as “A point, x ∗ ∈ X, is Pareto optimal if and only if there does not exist another point, x ∈ X, such that F(x) ≤ F(x∗) and Fi (x) < Fi(x∗) for at least one other function”. This set is termed as pareto front and can be understood from Figure 6. Each solution in the pareto front is called a non-dominated solution whereas all the others are termed dominated solutions. The non-dominated solutions in the pareto front can be defined as solutions besides which there is no other solution that improves one cost without the detriment in other. Hence, the pareto front can be looked at as a trade-off curve between the costs which need to be considered while performing multi-objective optimization as every solution in the set is non-dominated and hold the best plausible solution for the respective trade-off.
The weighted sum method of multi-objective optimization compiles all the costs needed to be considered while optimizing the given function in one positive scalar value by assigning numerical weight to each cost. Mathematically it is expressed as:
C f = i = 1 n w i f i x 1 ,   ,   x j
where,
  • C f is the cumulative cost,
  • i is the identifier of the cost,
  • n is the total number of costs,
  • w i is the numerical weight of ith cost,
  • f i is the function for ith cost,
  • x i is the ith control variable,
  • j is the total number of control variables.
The multi-objective optimization problem we are trying to solve is as follows,
M i n i m i z e   C f = { w 1 f m f ω p s o ,   S O C p s o + w 2 f m N O x ω p s o ,   S O C p s o }   d t
Subject to the following constraints:
ω e n g _ m i n ω p s o ω e n g _ m a x S O C m i n S O C p s o S O C m a x 0 τ e n g τ e n g _ m a x 0 ω m g 1 ω m g 1 _ m a x τ m g 1 _ max _ n e g τ m g 1 τ m g 1 _ max _ p o s 0 ω m g 2 ω m g 2 _ m a x 0 τ m g 2 τ m g 2 _ m a x
where the relationship of ωpso and SOCpso with desired ωeng and τeng are provided in Equations (36)–(41). The modified PSO algorithm is then updated with the multi-objective fitness function and the associated constraints (49) and (50) in order to solve the multi-objective optimization problem with different combinations of the weights w1 and w2.

3. Results

First the PMS was optimized separately for individual cost output of fuel consumption and the NOx emissions from the engine. The same drive cycle shown in Figure 3 was used in this simulation study. The swarm movement of battery SOC and engine speed trajectories of the proposed system before and after convergence of the modified PSO-based PMS simulation is shown in Figure 7. Figure 7a shows 30 vector particles with their initial positions for SOC and engine speed trajectories. As mentioned earlier they are time-based vectors, SOC being a trajectory and engine speed being a bounded vector. Both of them together are one particle. As the simulation of the proposed model was run with the modified PSO algorithm, these particles eventually converged after a number of iterations and the converged SOC trajectory and engine speed vector are shown in Figure 7b. The results of the optimal PMS control strategy and subsystem outputs are discussed in detail in the following section.

3.1. Minimization of Fuel Consumption

Figure 8 shows the optimal control strategy for PMS minimizing fuel consumption. Through urban driving, the optimizer is attempting to drive the vehicle with intermittent power supply from the engine. The optimizer ensures vehicle performance by making sure that the battery has enough SOC to handle the stop-and-go operations. In the case of highway driving, where there is more cruising, the optimizer uses the engine’s efficient region to produce power and charge the battery using the least amount of fuel, while satisfying the output requirements. This allows the fuel consumption to be reduced by restricting engine run time to the minimum requirement and the engine speeds to be at the efficient BSFC points with respect to the torque requirements. The model also turns off the engine whenever the target engine speed falls below its lower threshold. Figure 9 shows the performance of the engine by overlaying engine running points through the drive cycle, over the BSFC contour plot of the engine.
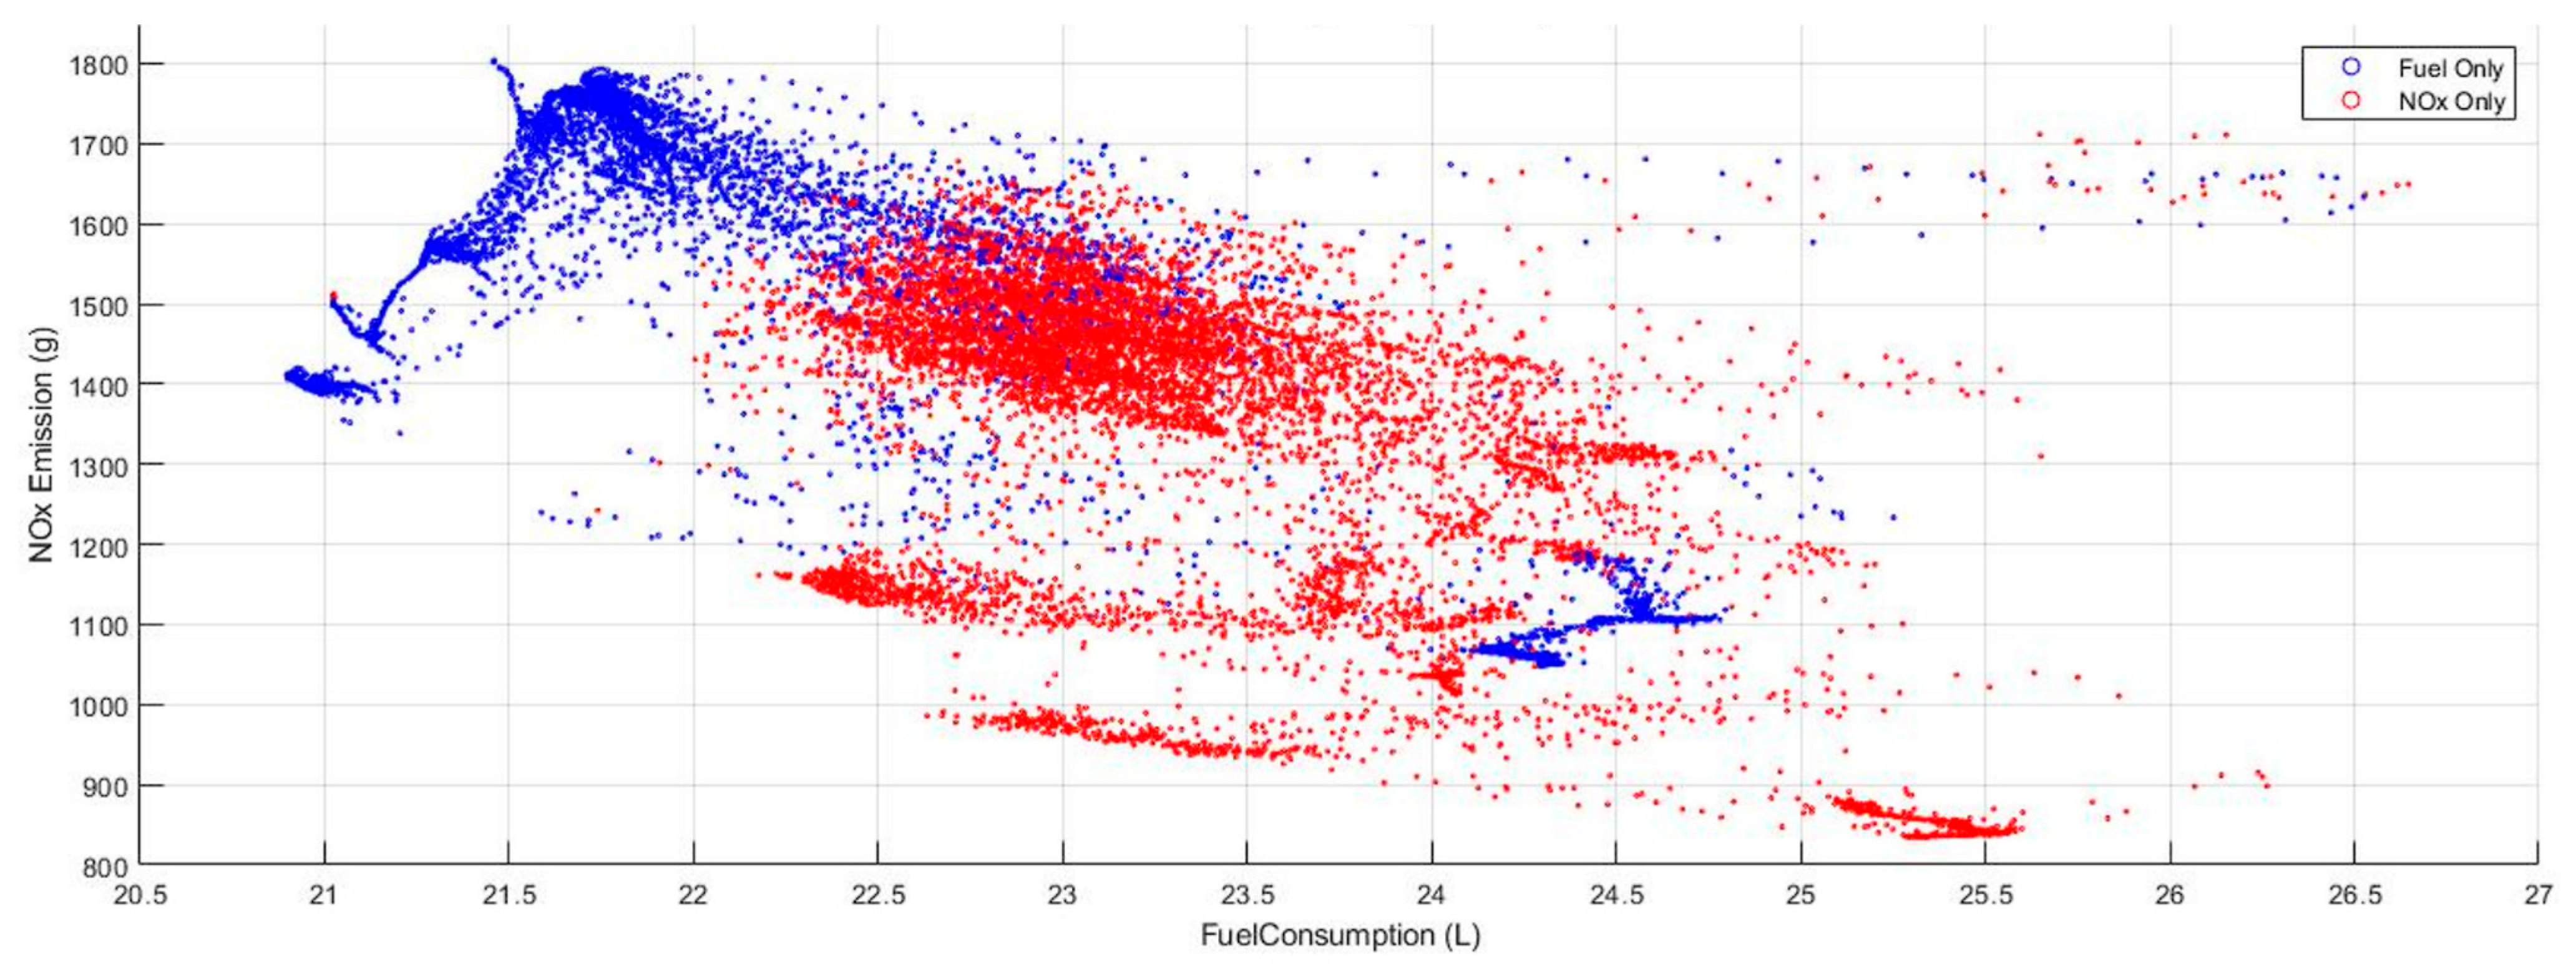
The minimum achieved fuel consumption value was 20.89 L for the given drive cycle which results in a 12% reduction when compared to baseline results. However, as a trade-off, the NOx output was found to be 1411.12 g, which represents a 9% increase in NOx production when compared to the baseline.

3.2. Minimization of NOx Emission

The optimal control strategy for PMS minimizing the NOx emission is shown in Figure 10. The optimizer is trying to deep cycle the battery to minimize the NOx emissions. The efficient region for production of NOx for the chosen engine lies near higher speed and torque range which can be observed in Figure 11. Whenever the engine is turned on, it is majorly run at higher torque and speed values. It can be observed that engine is commanded by the optimizer to run for long period of time with high speed and torque when charging of the battery is necessary, on the other hand when the battery SOC is sufficiently increased, the engine is turned off and the vehicle is running majorly on the battery to reduce the emissions.
For the given drive cycle, the minimum achieved NOx emission value was found to be 832 g which results in 35% reduction compared to the baseline results. However, with this PMS, fuel output was found to be 25.33 L resulting in a 21% increase in fuel consumption with respect to control.

3.3. Optimizing Both Fuel Cost and NOx Emissions

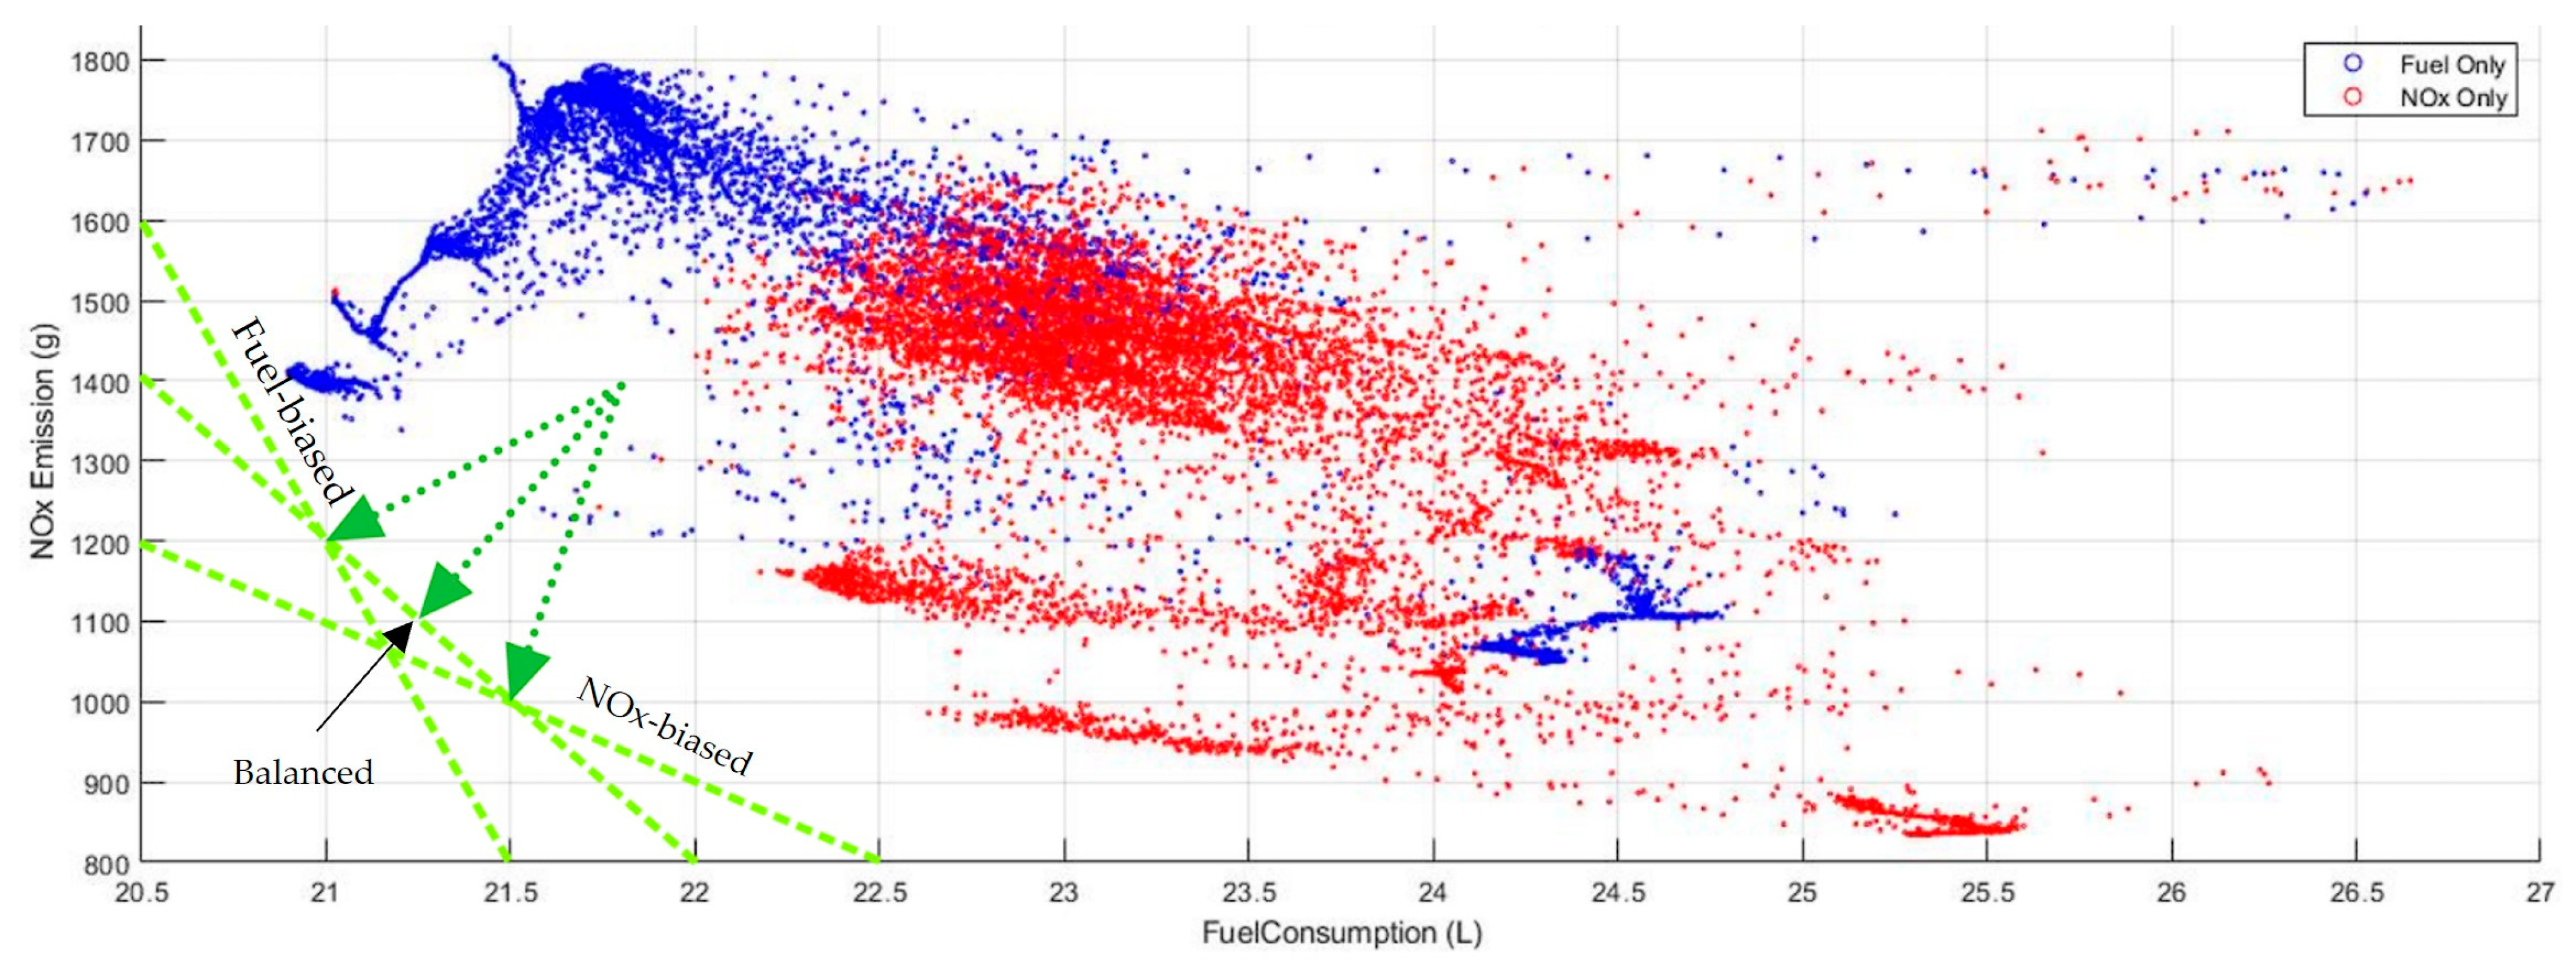
Figure 12 shows a pareto front of fuel consumption-vs-NOx emissions plot based on the data discussed in earlier sections. It can be observed from the pareto front that the optimizer was trying to guide the optimization in the direction perpendicular to the respective objectives. Figure 12 shows that while trying to optimize the fuel consumption the NOx values are completely ignored, and the optimizer is trying to proceed towards the control variables providing lower fuel consumption values and vice versa. This only focuses on two directions which are perpendicular to respective axes. To understand the trade-off curve better, it is necessary to perform a multi-objective optimization with tuned weights which will guide the optimizer in desired direction by adequately biasing the respective costs and considering them simultaneously. Figure 13 demonstrates the axes and the directions with which the optimizer is desired to be skewed. Three probable scenarios were selected for desired skewness: balanced, fuel-biased, and NOx-biased outputs.
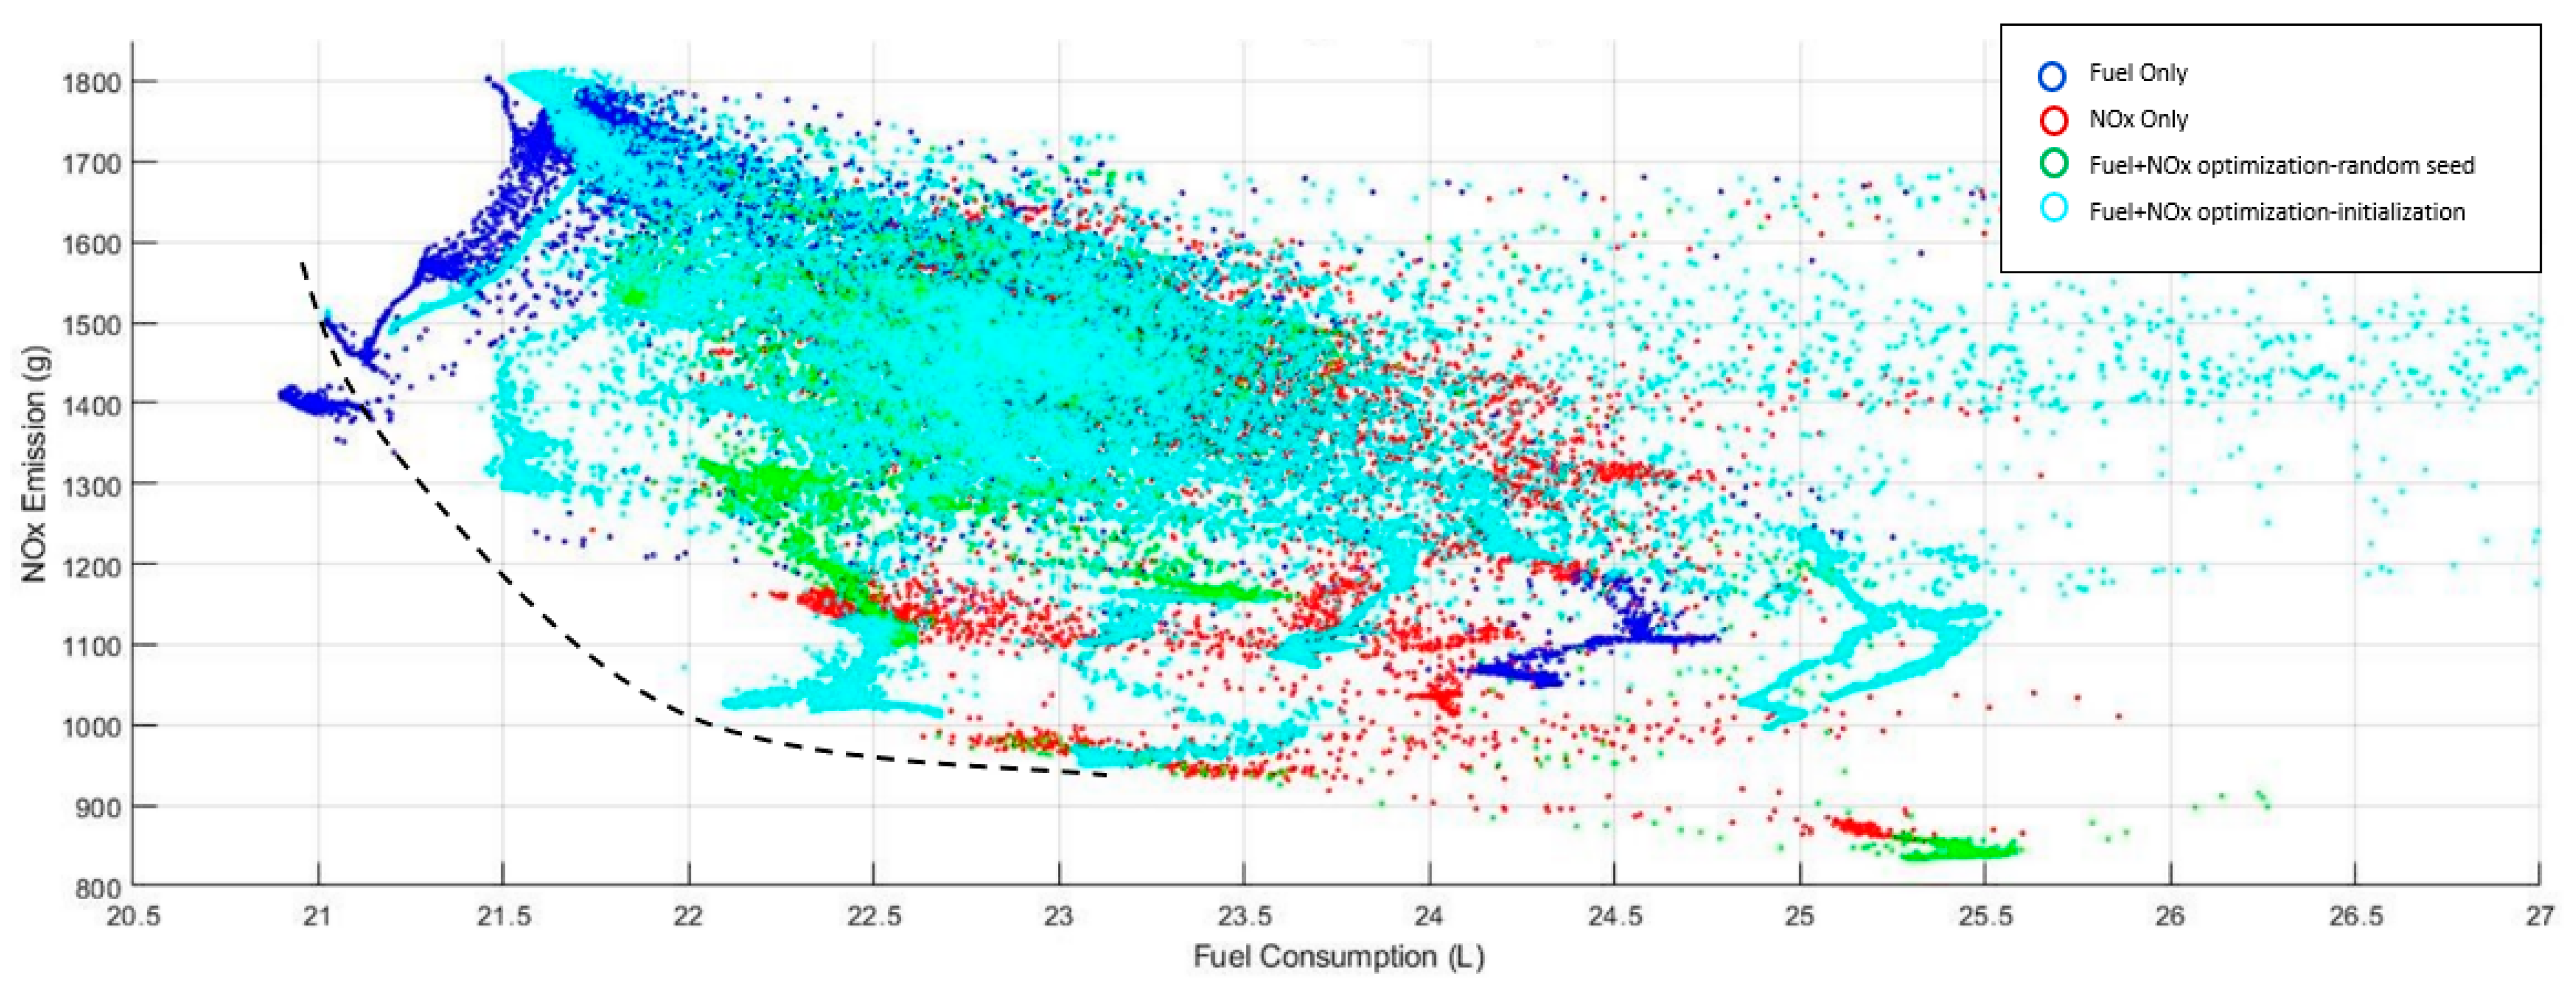
To optimize for both the outcomes of fuel consumption and NOx emissions minimization, different weights are set to the objectives. Table 1 shows the weights of the objective functions to demonstrate different optimizations. It is to be mentioned that the weights are calculated from the intersecting points of the desired pareto front and the axes of the plot in Figure 13. For a balanced outcome, weight for fuel consumption minimization was set to 100 whereas NOx minimization was set to 1. Initializations were done by providing seeds based on prior knowledge where engine speeds are constant at efficient regions and target SOC trajectory is set to discharge constantly from maximum to minimum. The resultant pareto front is presented in Figure 14, where light blue dots represent the results of multi-objective optimization. With a balanced weight bias on both the objectives fuel consumption of 22.15 L and NOx emission of 1025.27 g was achieved, which are 9.4% reduction in terms of fuel consumption and 7.9% reduction for NOx emissions, respectively.

4. Discussion

This study presents a modified PSO algorithm that incorporates Vector PSO, Seeded PSO, Frankenstein’s PSO, and TVAC PSO to optimize the reduction of fuel consumption and NOx emissions simultaneously for a REEV powertrain. The NOx emissions are a crucial environmental issue, but targeting this parameter alone leads to an increased fuel consumption, as observed in our study where a 35% reduction in NOx emissions could be achieved but with a 21% increase in fuel consumption. Similarly, optimizing fuel consumption alone resulted in a 12% reduction, but with a 9% increase in NOx emissions.
To resolve the conflicting behavior, multi-objective optimization is necessary, which is achieved through pareto optimality. The methodology of modified PSO and pareto optimality could effectively optimize fuel efficiency while simultaneously reducing NOx emissions, resulting in a 9.4% reduction in fuel consumption and a 7.9% improvement in NOx emissions.
The developed methodology is not only restricted to the application of PMS of REEVs but rather is open to any model-based fitness functions to be optimized. Moreover, the methodology allows to optimize a time-based vector as a single control input to the system. This could be useful in the calibration process of most Single-Input–Single-Output (SISO) and Multi-Input–Single-Output (MISO) systems.
Indeed, there are some limitations which can be overcome in future attempts. This study was limited to being validated against simulation data. Although, the developed model was validated against ADVISOR, it was not validated against already established rule-based methods. More comprehensive research could be carried out by comparing the results obtained for a system with existent data performing on known rule-based strategies. The focus of this study was mainly on the development of a generic optimizer which can optimize time-based vectors along with bounded vectors as control variables to any model-based fitness function. As a result, it was deployed on a relatively less complex model of REEV powertrain. The optimizer developed above can be deployed on a model being increasingly complex, capturing dynamics of a power train with more accuracy. The methodology developed in this study to optimize model-based systems allows users to change model parameters externally. Hence, a simple set of optimization runs can be carried out to compare results of optimal strategies obtained for various combinations of powertrain components and their parameters to ease the process of component selection and sizing of REEV/HEV powertrains. Use of the Multi-Objective Genetic Algorithm and MiniMax approaches can also benefit in solving the MOO problem discussed in this study. Additionally, Extremum Seeking algorithms can also be investigated to further improve the convergence to global optimal solution.

5. Conclusions

In this study, a mathematical model for a hybrid powertrain of the Range Extended Electric vehicle (REEV) was developed and later optimized using a modified Particle Swarm Optimization (PSO) to simultaneously reduce fuel consumption and NOx emissions via battery SOC trajectory optimization for the entire driving cycle. The proposed modified PSO algorithm was developed by integrating vector PSO, Seeded PSO, TVAC PSO, and Frankenstein’s PSO to improve the robustness and convergence of the PMS algorithm. The proposed REEV model was validated against a similar commercial vehicle ADVISOR model using a standard rule-based PMS which served as the baseline model to compare it with. The validated REEV model was then simulated with the modified PSO-based PMS which resulted in fuel savings of about 12% and NOx reduction of 35% when controlled separately. By applying a weighted-sum, multi-objective optimization strategy, a balanced weight bias on both the objectives resulted in a fuel consumption of 22.15 L and NOx emissions of 1025.27 g, showing a simultaneous 9.4% improvement in fuel consumption and 7.9% in NOx emissions.

Author Contributions

Conceptualization, S.A. and B.S.; methodology, B.S. and O.P.; software, O.P. and B.S.; validation, O.P., B.S. and S.A.; formal analysis, B.S.; investigation, S.A.; resources, S.A.; data curation, O.P. and B.S.; writing—original draft preparation, O.P., B.S. and S.A.; writing—review and editing, A.R.; visualization, O.P. and A.R.; supervision, S.A.; project administration, S.A.; funding acquisition, S.A. All authors have read and agreed to the published version of the manuscript.

Funding

This work has been partially supported by a research grant from Cummins, Inc., Columbus, IN, USA.

Data Availability Statement

The research data is subject to confidentiality based on a research agreement between the sponsor and the university.

Acknowledgments

The authors want to thank Gary Salemme, Director, Cummins, Inc. for his active support and sponsorship of the project that led to this work.

Conflicts of Interest

The authors declare no conflict of interest. The funders had no role in the design of the study; in the collection, analyses, or interpretation of data; in the writing of the manuscript; or in the decision to publish the results.

References

  1. Singh, K.V.; Bansal, H.O.; Singh, D. A comprehensive review on hybrid electric vehicles: Architectures and components. J. Mod. Transp. 2019, 27, 77–107. [Google Scholar] [CrossRef] [Green Version]
  2. Enang, W.; Bannister, C. Modelling and control of hybrid electric vehicles (A comprehensive review). Renew. Sustain. Energy Rev. 2017, 74, 1210–1239. [Google Scholar] [CrossRef] [Green Version]
  3. Wirasingha, S.G.; Emadi, A. Classification and Review of Control Strategies for Plug-In Hybrid Electric Vehicles. IEEE Trans. Veh. Technol. 2011, 60, 111–122. [Google Scholar] [CrossRef]
  4. Chen, S.-Y.; Hung, Y.-H.; Wu, C.-H.; Huang, S.-T. Optimal energy management of a hybrid electric powertrain system using improved particle swarm optimization. Appl. Energy 2015, 160, 132–145. [Google Scholar] [CrossRef]
  5. Arabali, A.; Ghofrani, M.; Etezadi-Amoli, M.; Fadali, M.S.; Baghzouz, Y. Genetic-Algorithm-Based Optimization Approach for Energy Management. IEEE Trans. Power Deliv. 2012, 28, 162–170. [Google Scholar] [CrossRef]
  6. Chen, Z.; Mi, C.C.; Xiong, R.; Xu, J.; You, C. Energy management of a power-split plug-in hybrid electric vehicle based on genetic algorithm and quadratic programming. J. Power Sources 2014, 248, 416–426. [Google Scholar] [CrossRef]
  7. Lin, C.-C.; Peng, H.; Grizzle, J.W.; Kang, J.-M. Power management strategy for a parallel hybrid electric truck. IEEE Trans. Control Syst. Technol. 2003, 11, 839–849. [Google Scholar] [CrossRef] [Green Version]
  8. Brahma, A.; Guezennec, Y.; Rizzoni, G. Optimal energy management in series hybrid electric vehicles. In Proceedings of the 2000 American Control Conference, Chicago, IL, USA, 28–30 June 2000; ACC (IEEE Cat. No. 00CH36334). Volume 1, pp. 60–64. [Google Scholar]
  9. Borhan, H.; Vahidi, A.; Phillips, A.M.; Kuang, M.L.; Kolmanovsky, I.V.; Di Cairano, S. MPC-Based Energy Management of a Power-Split Hybrid Electric Vehicle. IEEE Trans. Control Syst. Technol. 2012, 20, 593–603. [Google Scholar] [CrossRef]
  10. Kim, N.; Cha, S.; Peng, H. Optimal Control of Hybrid Electric Vehicles Based on Pontryagin’s Minimum Principle. IEEE Trans. Control Syst. Technol. 2011, 19, 1279–1287. [Google Scholar] [CrossRef] [Green Version]
  11. Serrao, L.; Onori, S.; Rizzoni, G. A Comparative Analysis of Energy Management Strategies for Hybrid Electric Vehicles. J. Dyn. Syst. Meas. Control 2011, 133, 031012. [Google Scholar] [CrossRef] [Green Version]
  12. Serrao, L.; Rizzoni, G. Optimal control of power split for a hybrid electric refuse vehicle. In Proceedings of the 2008 American Control Conference, Seattle, WA, USA, 11–13 June 2008; pp. 4498–4503. [Google Scholar]
  13. Liu, H.; Lei, Y.; Fu, Y.; Li, X. A novel hybrid-point-line energy management strategy based on multi-objective optimization for range-extended electric vehicle. Energy 2022, 247, 123357. [Google Scholar] [CrossRef]
  14. Yao, M.; Zhu, B.; Zhang, N. Adaptive real-time optimal control for energy management strategy of extended range electric vehicle. Energy Convers. Manag. 2021, 234, 113874. [Google Scholar] [CrossRef]
  15. Moura, S.J.; Fathy, H.K.; Callaway, D.S.; Stein, J.L. A Stochastic Optimal Control Approach for Power Management in Plug-In Hybrid Electric Vehicles. IEEE Trans. Control Syst. Technol. 2011, 19, 545–555. [Google Scholar] [CrossRef] [Green Version]
  16. Li, J.; Wang, Y.; Chen, J.; Zhang, X. Study on energy management strategy and dynamic modeling for auxiliary power units in range-extended electric vehicles. Appl. Energy 2017, 194, 363–375. [Google Scholar] [CrossRef]
  17. Sorrentino, M.; Rizzo, G.; Arsie, I. Analysis of a rule-based control strategy for on-board energy management of series hybrid vehicles. Control Eng. Pract. 2011, 19, 1433–1441. [Google Scholar] [CrossRef]
  18. Zhang, X.; Wu, Z.; Hu, X.; Qian, W.; Li, Z. Trajectory Optimization-Based Auxiliary Power Unit Control Strategy for an Extended Range Electric Vehicle. IEEE Trans. Veh. Technol. 2017, 66, 10866–10874. [Google Scholar] [CrossRef]
  19. Zhao, K.; Lou, D.; Zhang, Y.; Fang, L. Optimization and Realization of the Coordination Control Strategy for Extended Range Electric Vehicle. Machines 2022, 10, 297. [Google Scholar] [CrossRef]
  20. Wang, Y.; Lou, D.; Xu, N.; Fang, L.; Tan, P. Energy management and emission control for range extended electric vehicles. Energy 2021, 236, 121370. [Google Scholar] [CrossRef]
  21. Caux, S.; Wanderley-Honda, D.; Hissel, D.; Fadel, M. On-line energy management for HEV based on Particle Swarm Optimization. In Proceedings of the 2010 IEEE Vehicle Power and Propulsion Conference, Lille, France, 1–3 September 2010; pp. 1–7. [Google Scholar]
  22. Hegazy, O.; Van Mierlo, J. Optimal power management and powertrain components sizing of fuel cell/battery hybrid electric vehicles based on particle swarm optimisation. Int. J. Veh. Des. 2012, 58, 200–222. [Google Scholar] [CrossRef]
  23. Mehdizadeh, E.; Soheil, S.-N.; Tavakkoli-Moghaddam, R. Optimization of fuzzy clustering criteria by a hybrid PSO and fuzzy c-means clustering algorithm. Iran. J. Fuzzy Syst. 2008, 5, 1–14. [Google Scholar]
  24. Dahou, A.; Elaziz, M.A.; Chelloug, S.A.; Awadallah, M.A.; Al-Betar, M.A.; Al-qaness, M.A.; Forestiero, A. Intrusion Detection System for IoT Based on Deep Learning and Modified Reptile Search Algorithm. Comput. Intell. Neurosci. 2022, 2022, 6473507. [Google Scholar] [CrossRef] [PubMed]
  25. Ehsani, M.; Gao, Y.; Longo, S.; Ebrahimi, K. Modern Electric, Hybrid Electric, and Fuel Cell Vehicles, 3rd ed.; CRC Press: Boca Raton, FL, USA, 2018; ISBN 978-0-429-50488-4. [Google Scholar]
  26. Xie, J.; Ma, J.; Bai, K. Enhanced Coulomb Counting Method for State-of-Charge Estimation of Lithium-ion Batteries based on Peukert’s Law and Coulombic Efficiency. J. Power Electron. 2018, 18, 910–922. [Google Scholar] [CrossRef]
  27. Booker, A.; Haraldsson, K.; Hendricks, T.; Johnson, V.; Kelly, K.; Kramer, B.; Markel, T.; O’Keefe, M.; Sprik, S.; Wipke, K.; et al. ADVISOR Advanced Vehicle Simulator. Available online: https://adv-vehicle-sim.sourceforge.net/ (accessed on 13 March 2023).
  28. Kennedy, J.; Eberhart, R. Particle swarm optimization. In Proceedings of the ICNN’95—International Conference on Neural Networks, Perth, Australia, 27 November–1 December 1995; Volume 4, pp. 1942–1948. [Google Scholar]
  29. Ratnaweera, A.; Halgamuge, S.K.; Watson, H.C. Self-organizing hierarchical particle swarm optimizer with time-varying acceleration coefficients. IEEE Trans. Evol. Comput. 2004, 8, 240–255. [Google Scholar] [CrossRef]
  30. De Oca, M.A.M.; Stützle, T.; Birattari, M.; Dorigo, M. Frankenstein’s PSO: An Engineered Composite Particle Swarm Optimization Algorithm; Technical Report TR/IRIDIA/2007-006; IRIDIA, CoDE; Université Libre de Bruxelles: Brussels, Belgium, 2007. [Google Scholar]
  31. Pareto, V. Ophelimity in nonclosed cycles. In Giornale degli Economisti; Preferences, Utility, and Demand; Kirman, A.P., Chipman, J.S., Eds.; Springer: Berlin/Heidelberg, Germany, 1906; pp. 370–385. [Google Scholar]
  32. Calborean, H.; Jahr, R.; Ungerer, T.; Vintan, L. Optimizing a superscalar system using multi-objective design space exploration. In Proceedings of the 18th International Conference on Control Systems and Computer Science (CSCS), Bucharest, Romania, 24–27 May 2011; Editura Politehnica Press: Bucharest, Romania, 2011; Volume 1, pp. 339–346. [Google Scholar]
Figure 2. Reversed-looking approach on vehicle subsystems.
Energies 16 05082 g002
Figure 3. The output of the developed model.: drive cycle, battery SOC, and engine speed.
Energies 16 05082 g003
Figure 4. The output from the ADVISOR model: drive cycle, battery SOC, emissions, and engine power.
Energies 16 05082 g004
Figure 5. Flow diagram of Particle Swarm Optimization Algorithm.
Energies 16 05082 g005
Figure 6. Pareto front approximation and the true pareto front. Points a and b belong to the pareto front approximation because they are nondominated (none of them is better than the other on both objectives). Point c is dominated by both point a and b [32].
Energies 16 05082 g006
Figure 7. Swarm movement of the proposed system for 30 vector particles, indicated by the colored lines. (a) Initial positions; (b) Converged position.
Energies 16 05082 g007
Figure 8. Optimal PMS for Fuel Consumption Minimization: SOC Tracking (left) and Engine Speed Tracking (right).
Energies 16 05082 g008
Figure 9. Engine Performance with Fuel Minimization: BSFC Performance (left) and BSNOx Performance (right).
Energies 16 05082 g009
Figure 10. Optimal PMS for NOx Emissions Minimization: SOC Tracking (left) and Engine Speed Tracking (right).
Energies 16 05082 g010
Figure 11. Engine Performance with NOx Minimization: BSFC Performance (left) and BSNOx Performance (right).
Energies 16 05082 g011
Figure 12. Pareto Front Plot for Single Objective Optimization results.
Energies 16 05082 g012
Figure 13. Axes for directions of Multi-Objective Optimization.
Energies 16 05082 g013
Figure 14. Pareto Front Plot for Multi-Object Optimization Results.
Energies 16 05082 g014
Table 1. Weights of Objective Functions.
Obj. FunctionFuel OnlyFuel HeavyBalancedNOx HeavyNOx Only
WeightsActualNorm.ActualNorm.ActualNorm.ActualNorm.ActualNorm.
Fuel113000.9971000.9933.330.9700
NOx0010.00310.0110.0311
Disclaimer/Publisher’s Note: The statements, opinions and data contained in all publications are solely those of the individual author(s) and contributor(s) and not of MDPI and/or the editor(s). MDPI and/or the editor(s) disclaim responsibility for any injury to people or property resulting from any ideas, methods, instructions or products referred to in the content.