Article

Analysis of the Energy and Economic Effects of Green Remodeling for Old Buildings: A Case Study of Public Daycare Centers in South Korea

1
Department of Architectural Engineering, Pusan National University, 2 Busandaehak-ro 63, Geomjeong-gu, Busan 46241, Republic of Korea
2
Research Institute of Industrial Technology, Pusan National University, 2 Busandaehak-ro 63, Geomjeong-gu, Busan 46241, Republic of Korea
*
Author to whom correspondence should be addressed.
Energies 2023, 16(13), 4961; https://doi.org/10.3390/en16134961
Submission received: 16 May 2023 / Revised: 17 June 2023 / Accepted: 19 June 2023 / Published: 26 June 2023
(This article belongs to the Special Issue Renewable Energy Systems for Sustainable Buildings)

Abstract

:
In South Korea, green remodeling policies have been promoted to improve the energy performance of buildings, especially old buildings. Moreover, simultaneous improvement of both energy and structural performance has emerged as an important issue. Although several proposals have been made by different governments for the improvement of energy and structural performance, most were related to technological development or construction methods. Therefore, to simultaneously improve the energy and structural performance of old buildings, in this study, we performed an analysis to evaluate the feasibility of improvement based on an actual case of green remodeling of an old building. In addition, the expected social effects were analyzed by examining the effect of fiscal expenditure on employment, considering personnel and operating expenses. As a result, primary energy consumption was reduced by approximately ≥48% after green remodeling, and CO2 emissions during the building operation stage were reduced by approximately ≥46%. When green remodeling and structural retrofitting were performed concurrently, the construction cost was reduced by approximately ≥27% when overlapping items in the construction schedule were optimized. These findings are relevant to the setting of goals and the establishment of strategies during green remodeling and structural retrofitting of old buildings.

1. Introduction

1.1. Background and Objectives of the Study

Sustained efforts have been made to reduce global greenhouse gas (GHG) emissions. These include the adoption of the “Glasgow Climate Pact” proposed at COP26 in the UN Climate Change Conference, the announcement of targets for the reduction of GHG emissions, and investment in decarbonization by governments and private participants of member states, with a growing emphasis on global efforts to respond to climate change [1]. Consistent with these efforts, major countries have established plans for key areas as a step toward the goal of carbon neutrality by 2050, as summarized in Table 1 [2,3,4,5,6,7,8]. Among the plans proposed by individual major countries presented in Table 1, global governments aim to achieve carbon neutrality in the building sector by reducing CO2 emissions and increasing economic growth by enhancing the energy efficiency of buildings and the utilization of renewable energy.
According to the EU Commission, buildings account for 40% of the total energy consumption and 36% of the total GHG emissions. Therefore, the EU increasingly emphasized renovating (energy renovation) old buildings in addition to improving the energy efficiency of new buildings to achieve their targets related to the reduction of GHG emissions [9]. The International Energy Agency (IEA) established a carbon neutrality roadmap for achieving climate change, which emphasizes net-zero emissions by 2050. The roadmap for carbon neutrality in the building sector is as follows: (1) All new buildings must be on track to achieve carbon neutrality by 2030; (2) energy efficiency will be improved by remodeling more than 50% of the existing buildings by 2040; and (3) carbon neutrality will be achieved in more than 85% of all buildings [10,11]. South Korea has set a target to reduce GHG emissions by 32.7% in the building sector by 2030 in its “Basic Plan for Climate Change Action” policy [12]. Table 2 and Figure 1 show the percentage distribution of the building’s age for residential and non-residential buildings in the EU and South Korea [13,14].
Based on the distribution of buildings by building age in the EU, it was determined that residential buildings tended to be older than non-residential buildings. In addition, buildings older than 30 years account for more than 50% of all buildings, which is a high proportion. However, in South Korea, the buildings categorized by age show a uniform distribution regardless of use, whereas, as in the case of buildings in the EU, those older than 20 years account for a very high proportion. Therefore, improving the energy efficiency of old buildings plays a major role in reducing GHG emissions. In the case of South Korea, the carbon neutrality plan was established to achieve reducing GHG emissions by focusing on improving energy efficiency for new buildings. However, considering the proportion of old buildings, achieving the target of GHG emission reduction by implementing changes only in new buildings will be difficult. Therefore, for new buildings, the Zero-Energy Building (ZEB) policy via the integration of renewable energy has been implemented. In the case of old buildings, policies that focus on the improvement of energy performance by introducing technologies in the areas of insulation performance, airtightness, and high-efficiency equipment are being implemented. As part of policy efforts, the South Korean government promoted the Green New Deal 2.0 policy in 2021. The major selected projects included the green remodeling of old buildings, the use of green energy, and sustainable transportation [15]. Among these projects, green remodeling facilitates the enhancement of energy performance by servicing buildings older than 15 years using high-performance insulation and high-efficiency equipment, with public buildings and the underprivileged as priority targets [16]. However, green remodeling may incur high initial costs when high insulation performance and high-efficiency equipment are used to replace worn-out equipment in old buildings, which may hinder the active implementation and progress of the projects. Therefore, the South Korean government has introduced policies to provide further support, such as the provision of financial aid to partially defray construction costs, low-interest loans, and technical support. In addition, projects have been undertaken to promote green modeling in the private sector. This is a program in which the government subsidizes part of the interest of loans for construction related to the improvement of energy efficiency [17].
As previously indicated, interest in energy retrofitting of old buildings is mainly focused on policy aspects or studies on economic feasibility, primarily considering the improvement in energy efficiency. Gram-Hanssen analyzed the expected effect of improved energy performance after the renovation of old detached housing in Denmark and proposed policy measures to promote energy renovation in the country [18]. Tajani et al. analyzed the impact of energy renovation of general commercial or office buildings on the real estate market in terms of economic feasibility before and after improvement [19]. Farahani et al. proposed an optimization design plan for cost–energy efficiency options to improve the energy efficiency of multifamily housing; they also proposed renovation and maintenance plans for components of the building envelope (windows, facades, and roofs) [20]. Alabid et al. reviewed the energy retrofitting-related policies of old buildings currently adopted in the UK to reduce GHG emissions and recommended the implementation of various policies and standards to achieve improvement in stages [21]. Oliveira et al. evaluated the technical and environmental performance of structural options based on an environmental impact assessment of several categories of structural retrofitting of old buildings [22]. Vita et al. examined the possibility of improving energy efficiency (U-value) using reinforcing materials in the seismic retrofitting of masonry walls for historical stone buildings in Italy [23]. Meanwhile, previous studies have investigated various aspects of energy retrofitting and conducted life cycle analysis (LCA). Shaikh et al. developed an optimized and cost-effective strategy for energy retrofitting, specifically targeting building envelope energy systems [24]. Toosi et al. conducted a literature review on life cycle sustainability assessment (LCSA) in the context of building energy retrofits. Adopting the LCSA approach, our study aims to comprehensively analyze the costs and benefits of energy retrofit projects throughout the building’s life cycle [25]. Zhao et al. examined the advantages of energy retrofitting compared to cost benefits, focusing on residential buildings certified under green home standards in the United States [26]. Prabatha et al. proposed a framework that offers optimal incentives for different design schemes to encourage energy retrofitting in old buildings [27]. Additionally, Gabrielli et al. analyzed sources of uncertainty and risk management techniques in the context of sustainable real estate development, particularly focusing on energy efficiency improvements in Northern Italy using Monte Carlo and sensitivity analysis methods [28]. Furthermore, researchers in South Korea conducted various studies to promote green remodeling projects, but most of them focused on the effect of improving the energy performance of existing old buildings [29,30,31,32].
However, in actual green remodeling, the planning of the scope of the work and the quantitative evaluation of the effect of energy performance improvement via systematic investigation and evaluation of the existing buildings are imperative, rather than a simple replacement of insulation materials, heat source equipment, and ventilation systems of aging buildings. The structural stability as well as the environmental and energy performance of old buildings must be improved. The recent trend of earthquake patterns in South Korea has demonstrated a rapid increase since the early 2000s, and the number of earthquakes in the previous five years was approximately 418 [33]. Therefore, South Korea has been increasingly emphasizing seismic retrofitting of public buildings constructed before 2009 according to the current laws related to building safety [34]. If techniques that facilitate the improvement of energy performance in addition to seismic retrofitting can be implemented, this will allow for the reduction of the construction period and improve the economic feasibility of the project. However, there are no studies on the effect of the concurrent implementation of green remodeling and structural retrofitting on the improvement of energy performance and the enhancement of the economic value of old buildings.
Therefore, to investigate the simultaneous improvement of energy and structural performance of old buildings, in the present study, we performed a feasibility study on old daycare centers in South Korea. The effect of energy performance improvement was quantitatively analyzed before and after the improvement. In addition, to analyze the effect of the concurrent implementation of green remodeling and seismic retrofitting for improved structural stability, the processes were analyzed from the architectural planning stage to the construction/operation stage. Furthermore, a comparative analysis of the construction cost was performed to estimate the economic effect. Finally, the CO2 emission reduction associated with the green remodeling in the building operation stage was calculated, and the macroeconomic feasibility was examined by evaluating the effects of improvement in comprehensive performance.

1.2. Methods

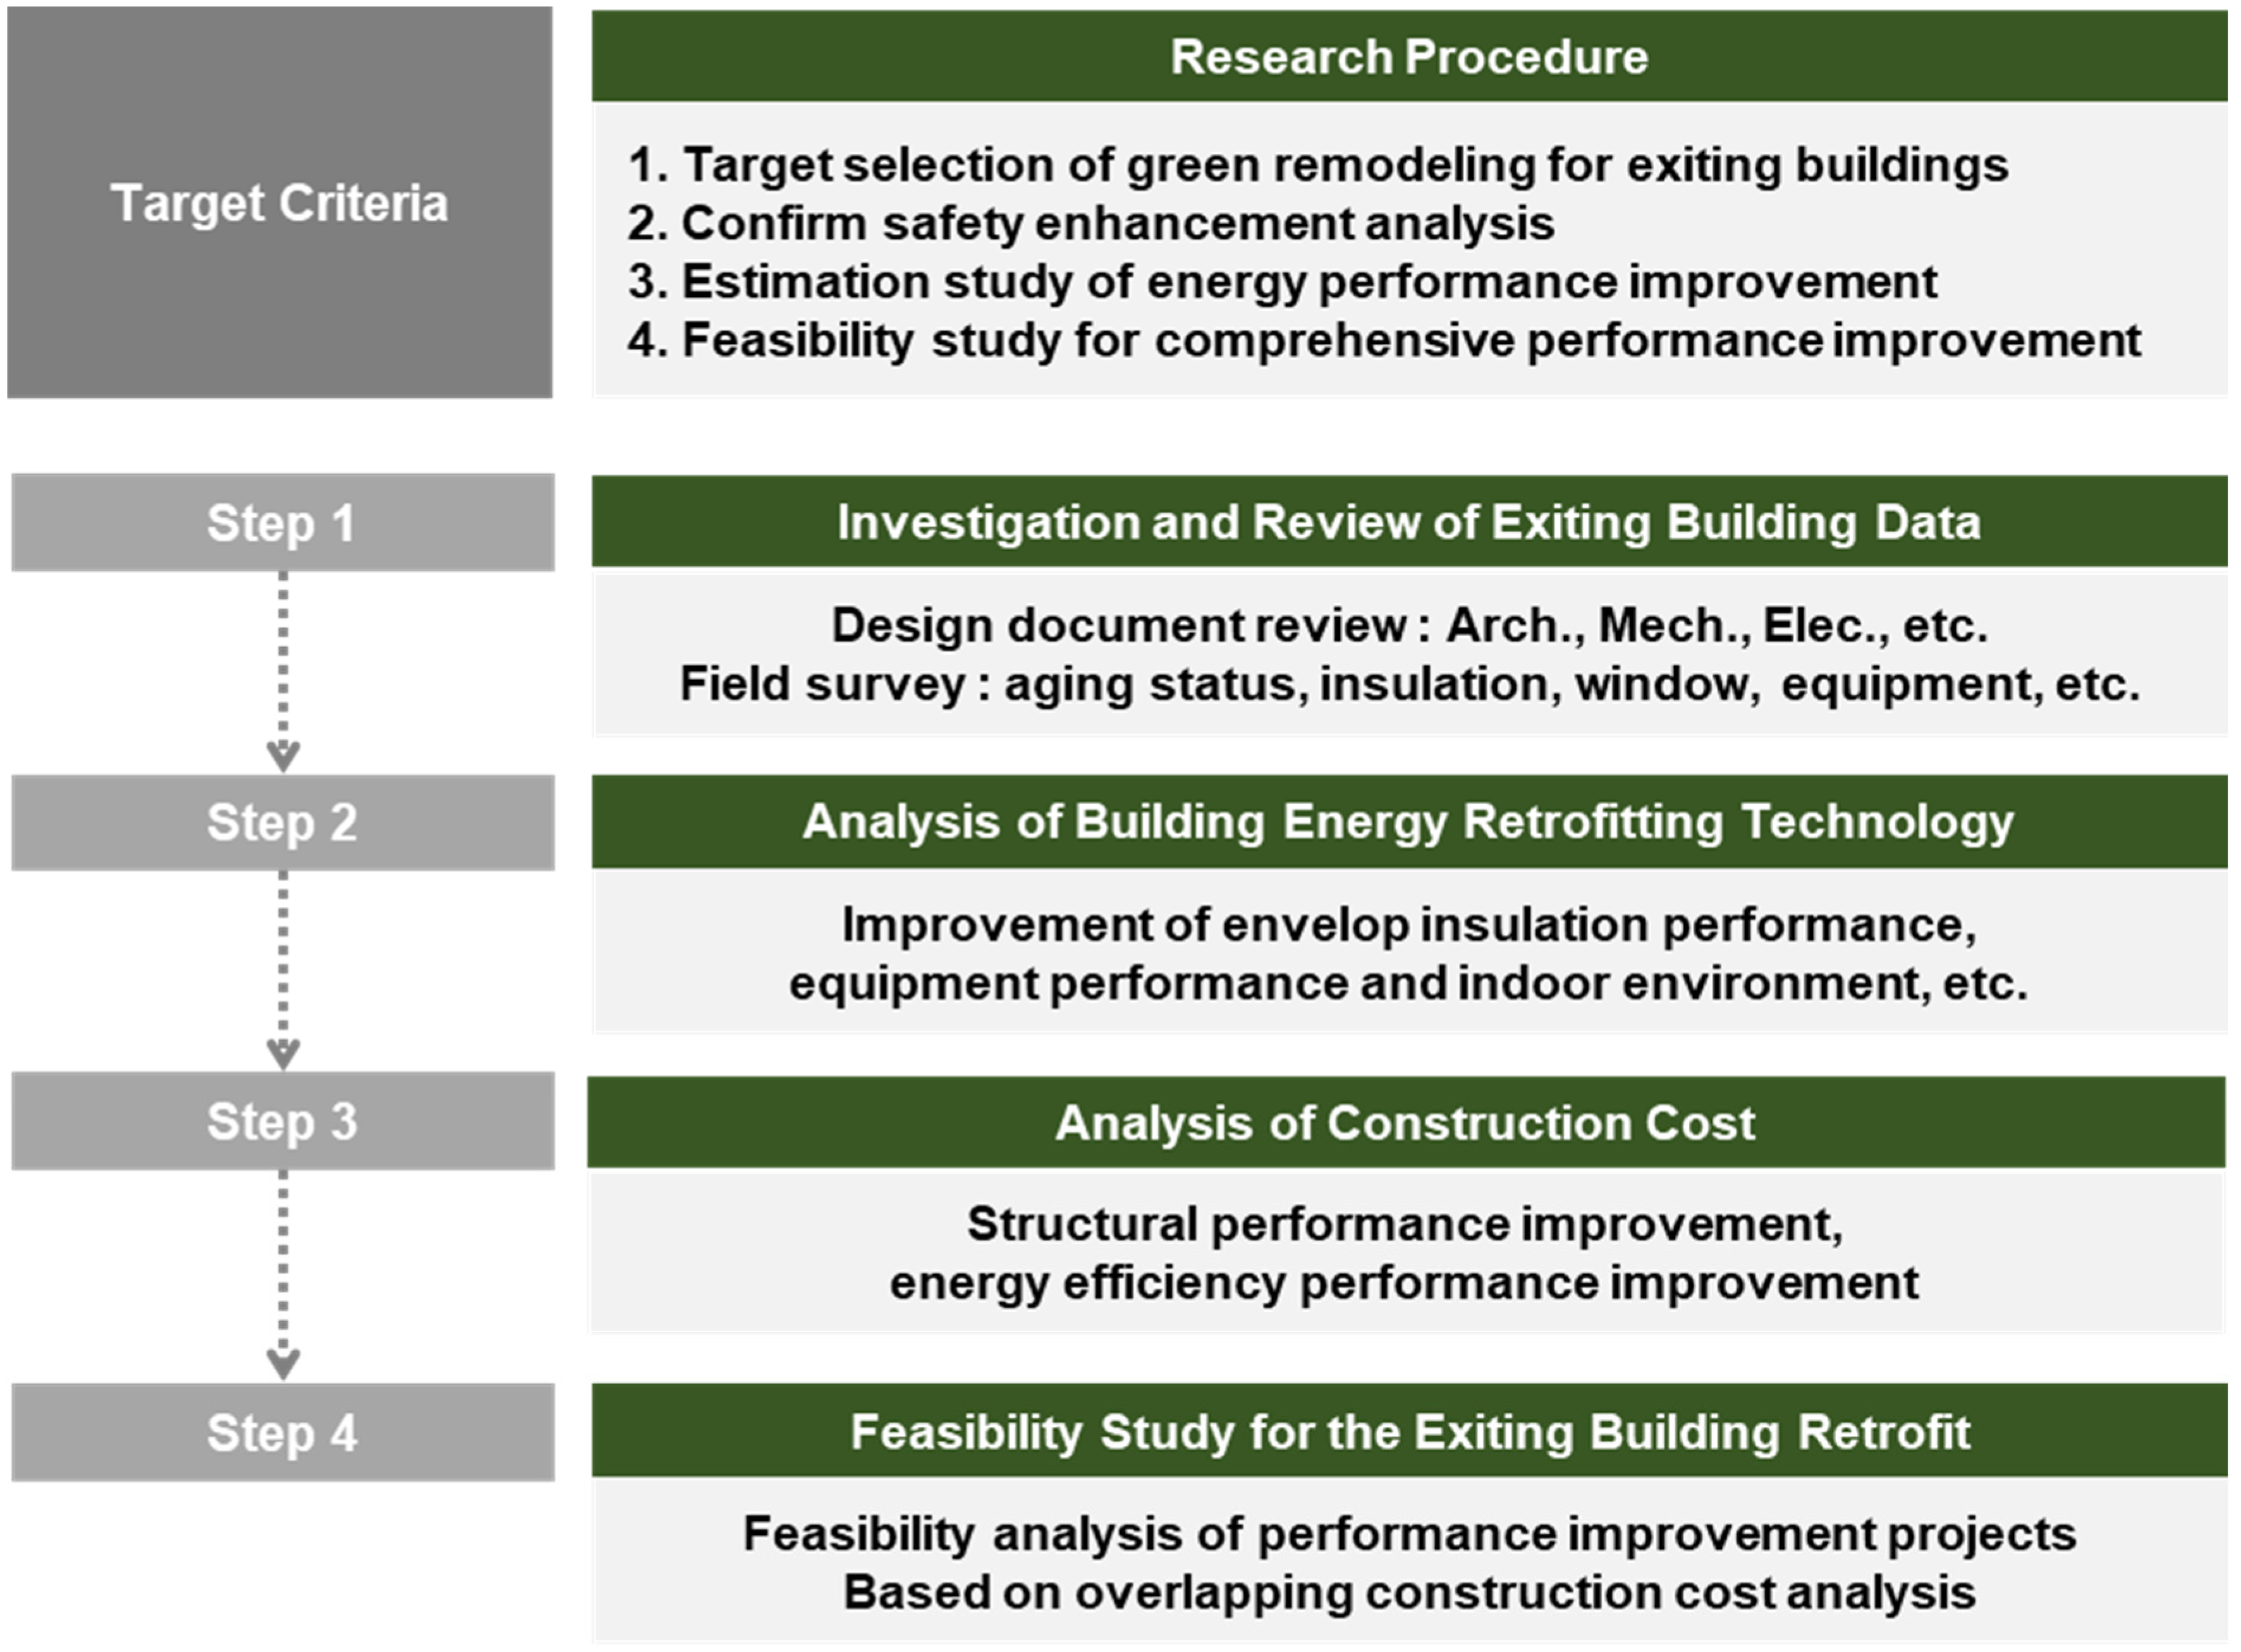
In this study, for concurrent green remodeling and improving the structural performance of an old building, overlapping processes and cost savings were analyzed during the process of construction. The analysis was performed to evaluate whether the building of interest satisfies the requirements for target performance according to the South Korean seismic design standard and whether structural retrofitting is necessary [35]. The necessity of structural retrofitting was examined based on a nonlinear static analysis method (Pushover). Based on the analysis, the vertical load-bearing capacity and the performance level of individual members were determined to deteriorate, indicating the necessity of structural retrofitting of the building [34]. Therefore, energy savings and CO2 emission reduction were quantitatively determined before and after improvement when green remodeling was implemented in the target building in this study. In addition, by analyzing the expected economic and social outcomes of concurrent green remodeling and structural retrofitting of an old building, the feasibility of improvement in comprehensive performance was evaluated. The research procedure, which is outlined in Figure 2, is as follows: (1) review of the status of the building of interest, (2) analysis of the energy performance improvement plan, (3) analysis of the operating expense for each project, and (4) feasibility study of the comprehensive performance improvement project.

2. Green Remodeling Planning

2.1. Overview of Green Remodeling

Currently, out of 7.28 million buildings in South Korea, the number of buildings older than 15 years is more than 5.42 million [14]. This implies that achieving national carbon neutrality targets is difficult only via the implementation of the ZEB policy for new buildings. Therefore, improving the energy efficiency of old buildings plays a major role in achieving carbon neutrality in the building sector. In South Korea, if remodeling generally refers to the replacement of the interior and exterior of old buildings, green remodeling indicates an improvement in energy performance and a reduction in GHG emissions via technological advancement in the passive and active design of buildings. The names of this type of remodeling project vary and include energy retrofitting, energy renovation, and energy revolution; however, in the present study, we adopted a unified notation of green remodeling (GR).
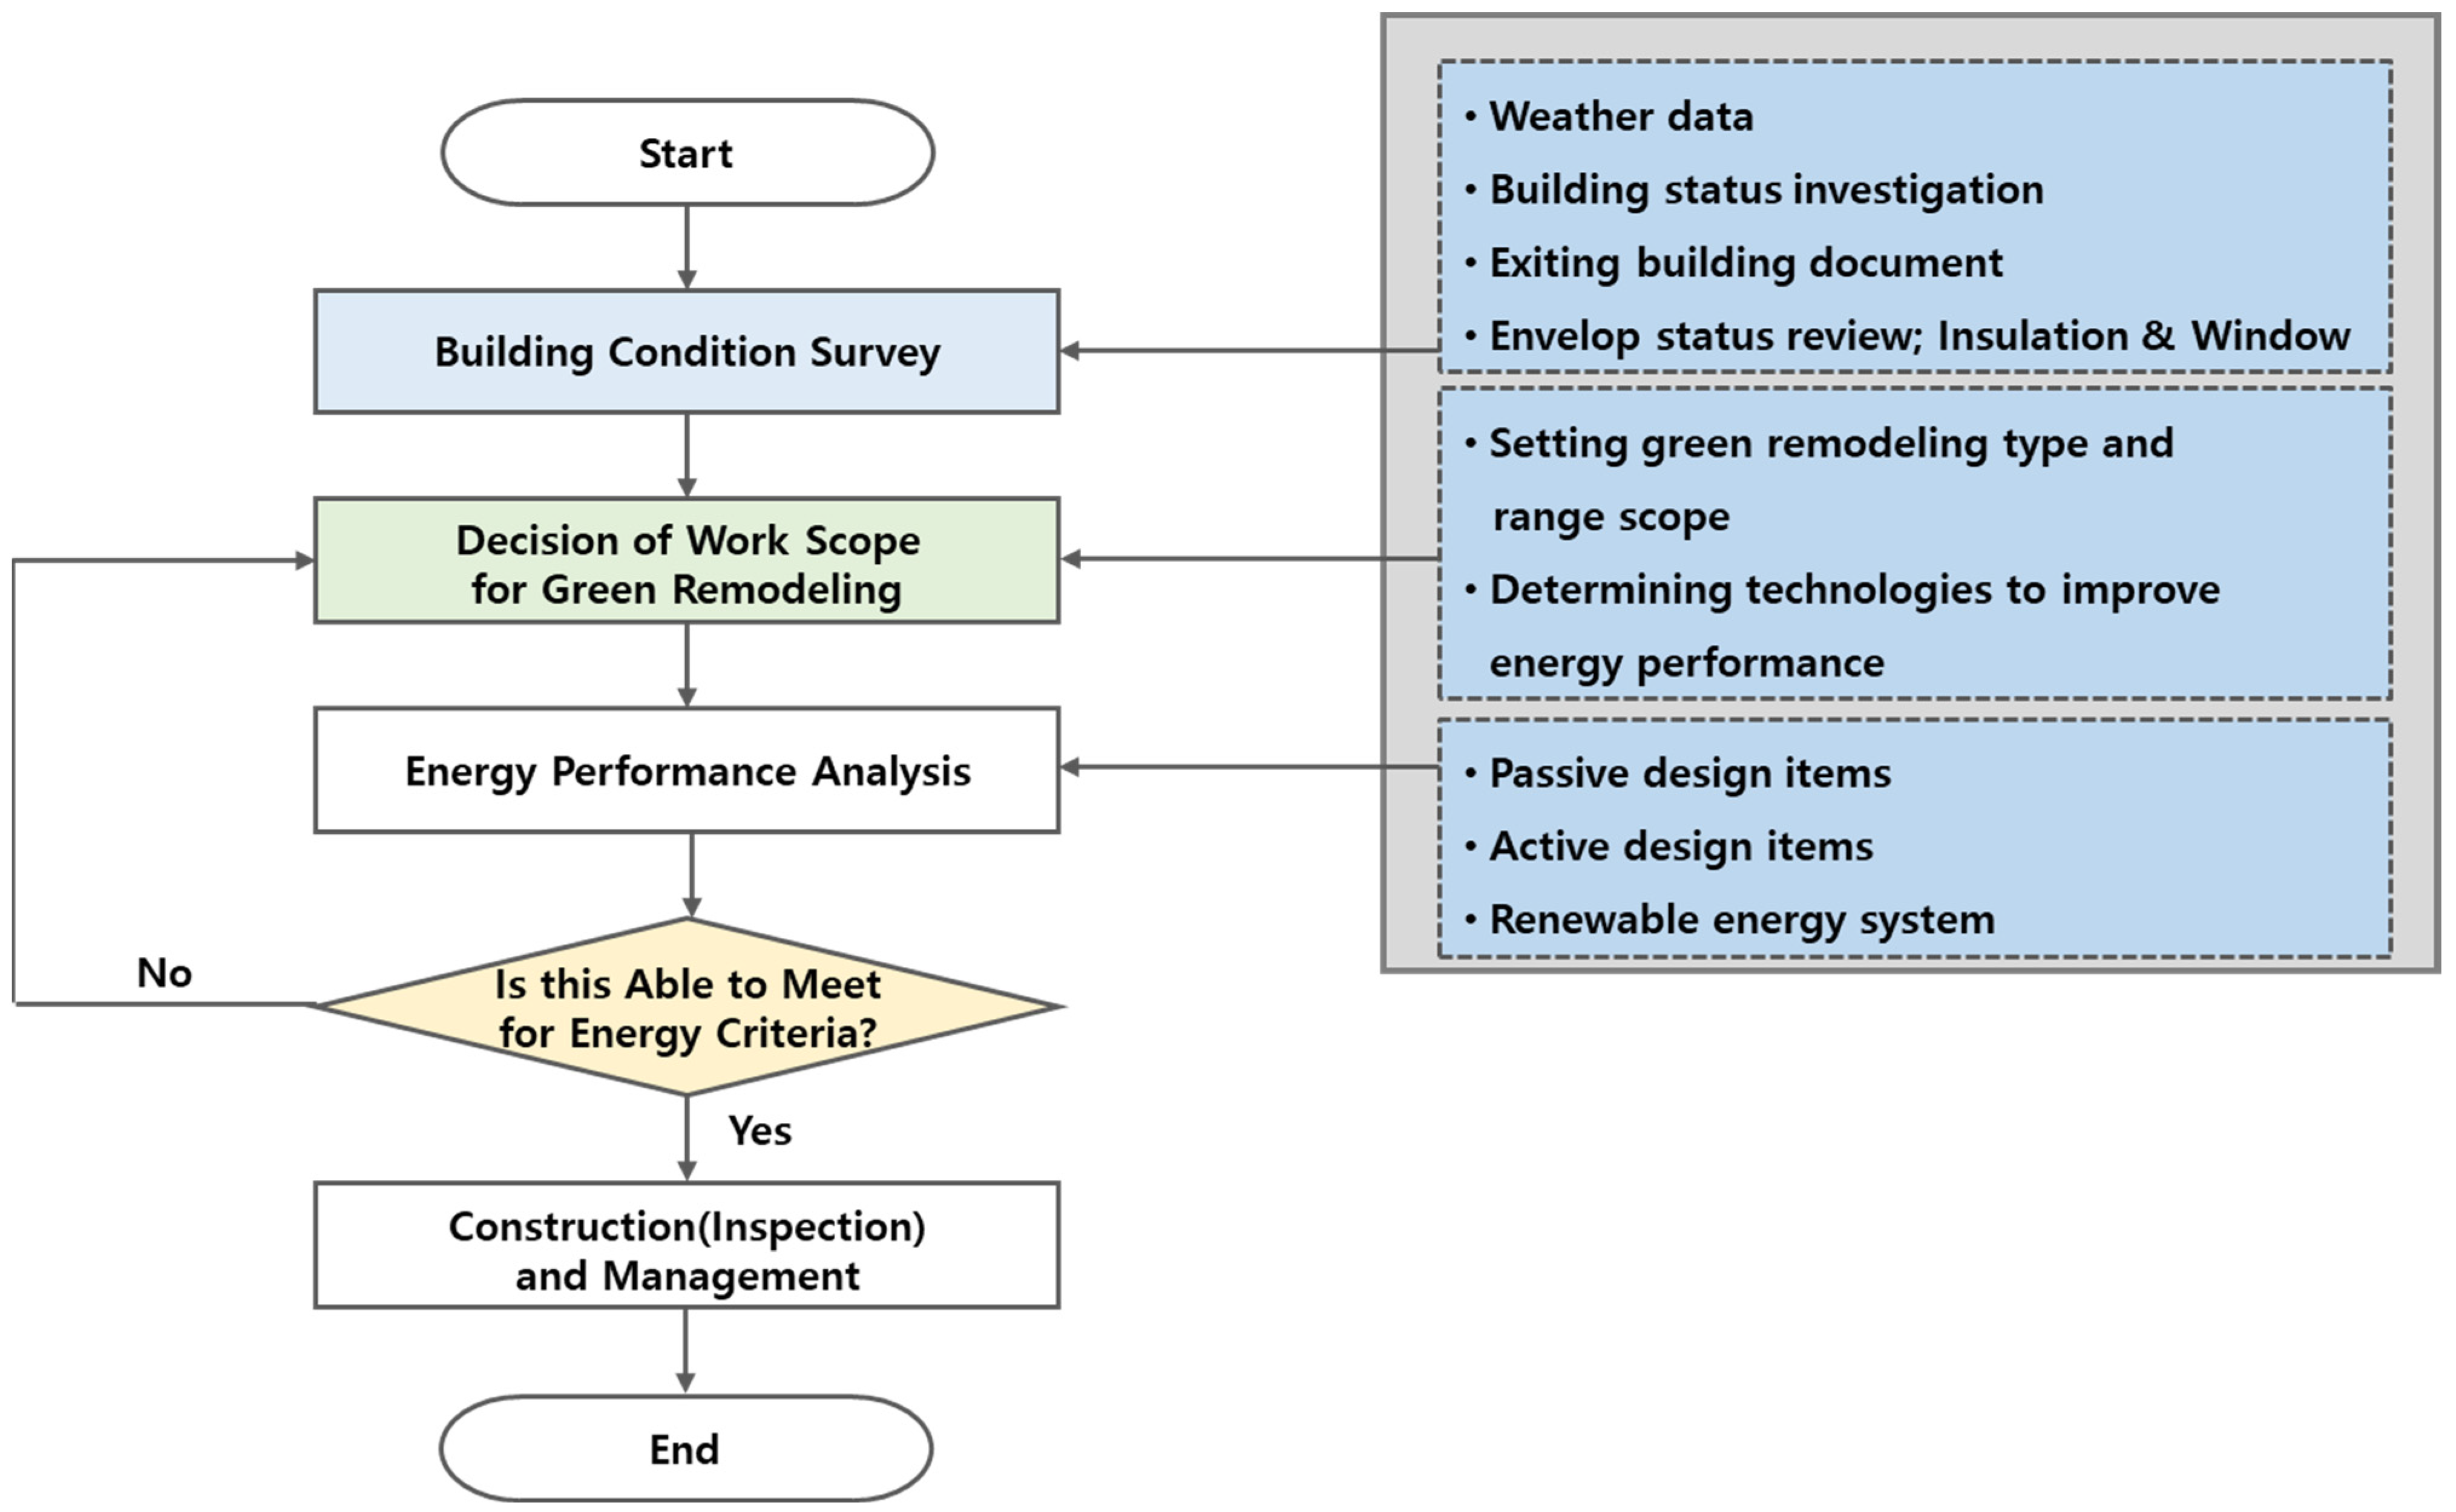
The process of GR primarily consists of conception, planning, design, construction, and operation/maintenance, and details of the process are illustrated in Figure 3.
GR projects have been consistently implemented since 2014 to improve the energy performance and indoor environment of buildings constructed before 1 January 2012. To encourage active participation of the private sector, the public sector has taken the initiative, and the buildings that have been prioritized as part of the GR projects include daycare centers, public health centers, and public hospitals. The results of implementing GR projects by sector (public/private) in South Korea up to August 2020 are shown in Figure 4 [17].
Table 3 shows the GR support items in the public sector. The South Korean government classifies the areas of support by item to define the scope of GR. In this case, the applicability of the support items classified as mandatory or the selected items can be determined according to the field conditions of the building.

2.2. Study Area

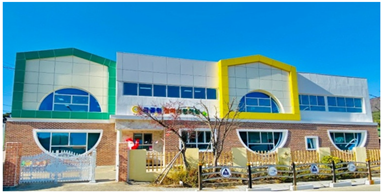
The building that was analyzed in this study was a two-story public nursery school located in Gijang-gun, Busan. The building’s construction was completed in 1997 and is an old facility that was built more than 20 years ago. Thus, the building required structural retrofitting and GR. A summary of the target building information is presented in Table 4. Based on a review of the design documents and field surveys of the building, we determined that there was substantial degradation of the insulation performance compared with the current standards owing to the aging of the insulation materials and windows. In addition, the thermal performance of the building was also degraded owing to the absence of air-conditioning systems in some rooms and the aging of the heating equipment. Moreover, the environment of occupants was poor owing to the absence of ventilation systems. Therefore, to improve the energy performance of the target building, improvement plans were divided into passive and active design plans.

2.3. Passive Improvement Items

For passive performance improvement of the target building, the exterior insulation, low-E double-glazed glass, and airtightness were adopted. The insulation material used in the building was expanded polystyrene (EPS), with a thickness of 100 mm for the walls, 60 mm for the roof, and 40 mm for the floor. Polyurethane insulation (PUR) was added to the existing structure to improve energy performance, with 50 mm for the outer walls and 120 mm for the floor. The roof material was replaced with glass wool (40 K) of 180 mm after removing the ceiling in some rooms. For the windows, double-glazed glass units were replaced with 28 mm low-E double-glazed glass units to improve their insulation performance. In addition, to improve the structural performance, the seismic performance was improved by using a steel frame on the left side and some parts of the facade. Figure 5 shows the locations of GR and structural reinforcement. Table 5 shows the major items that were updated as part of the passive improvement before and after GR.

2.4. Active Improvement Items

The heat source systems in the building consisted of equipment that used electricity. Two 2700 L electric boilers were used for heating, one 500 L electric boiler was used to produce hot water, and 17.9 kW electric heat pumps (EHPs) were used for cooling. The systems used for heating were more than 10 years old. Therefore, the existing electric boiler for heating was replaced with a 100 kW condensing gas boiler. In addition, a high-efficiency boiler with grade 1 energy consumption efficiency according to the South Korean legislative standard was installed as a replacement for the condensing gas boiler. For the electric water heater, the existing boiler was used, and an EHP was installed in the rooms without air-conditioning systems. The average COP of the building’s cooling equipment increased from 3.06 before the improvement to 3.38 afterward. A ventilation system was not installed; thus, it was not possible to perform ventilation measures other than those of natural ventilation. The absence of ventilation equipment resulted in a poor indoor environment for children, who were the major occupants of the building and who are sensitive to air quality. However, owing to the low ceiling height of the building, it was not possible to allocate space for the installation of ventilation equipment. For the lighting, as light-emitting diodes (LEDs) were already installed, this was not changed. Table 6 shows the items used for improving active performance.

2.5. Results of Green Remodeling

For the target building of this study, the plan for GR involved improving the insulation and airtightness performance and enhancing the energy efficiency by replacing the heat source system. After the implementation of GR, analysis was performed using ECO2, a simulation software that was designated by the government for a quantitative evaluation of actual energy savings. ECO2 is a simulation software for performing numerical analyses that was implemented based on ISO 13790 and DIN V 18599 [36,37], which analyzes the energy demand and consumption of heating, cooling, hot water, lighting, ventilation, and renewable energy. The equations used to calculate the cooling/heating energy demand, that is, (1) and (2), in ISO 13790 are shown below. In Equations (1) and (2), the total heat transfer ( Q H , h t , Q C , h t ) indicates the heat transfer through the building envelope and ventilation, and the total heat gain ( Q H , g n , Q C , g n ) indicates the internal heat generation and solar heat gain.
Equations (3)–(9) are used for calculating the effective heat gain factor ( η H , g n ) to obtain the heating energy demand, and Equations (10)–(14) are used for calculating the effective heat gain factor ( η C , l s ) to determine the cooling energy demand.
Q H , n d = Q H , h t η H , g n Q H , g n
Q C , n d = Q C , g n η C , l s Q C , h t
γ H = Q H , g n Q H , h t
i f [ γ H > 0 , γ H 1 : η H , g n = 1 γ H a H 1 γ H a H + 1 ]
i f [ γ H = 1 : η H , g n = a H a H + 1 ]
i f [ γ H < 0 : η H , g n = 1 / γ H ]
a H = a H , 0 + τ τ H , 0
τ = C m 3600 × H t , r + H v e
C m = ( k j × A j )
γ c = Q C , g n Q C , j t
i f [ γ C > 0 , γ C 1 : η C , l s = 1 γ C a C 1 γ C ( a C + 1 ) ]
i f [ γ C = 1 : η C , l s = 1 ]
a C = a C , 0 + τ τ C , 0
τ = C m 3600 × C t , r + C v e
The conditions for the meteorological data were collected from 66 regions in South Korea using the monthly average ambient temperature and (horizontal) global irradiation calculated based on the meteorological data for a typical meteorological year. The results of the energy performance analysis before and after GR were compared by applying the values for non-residential sectors of the building energy efficiency certification (BEEC) standards of South Korea. The BEEC standards are outlined in Table 7, and the primary energy factor (PEF) for conversion from energy consumption to primary energy consumption is shown in Table 8.
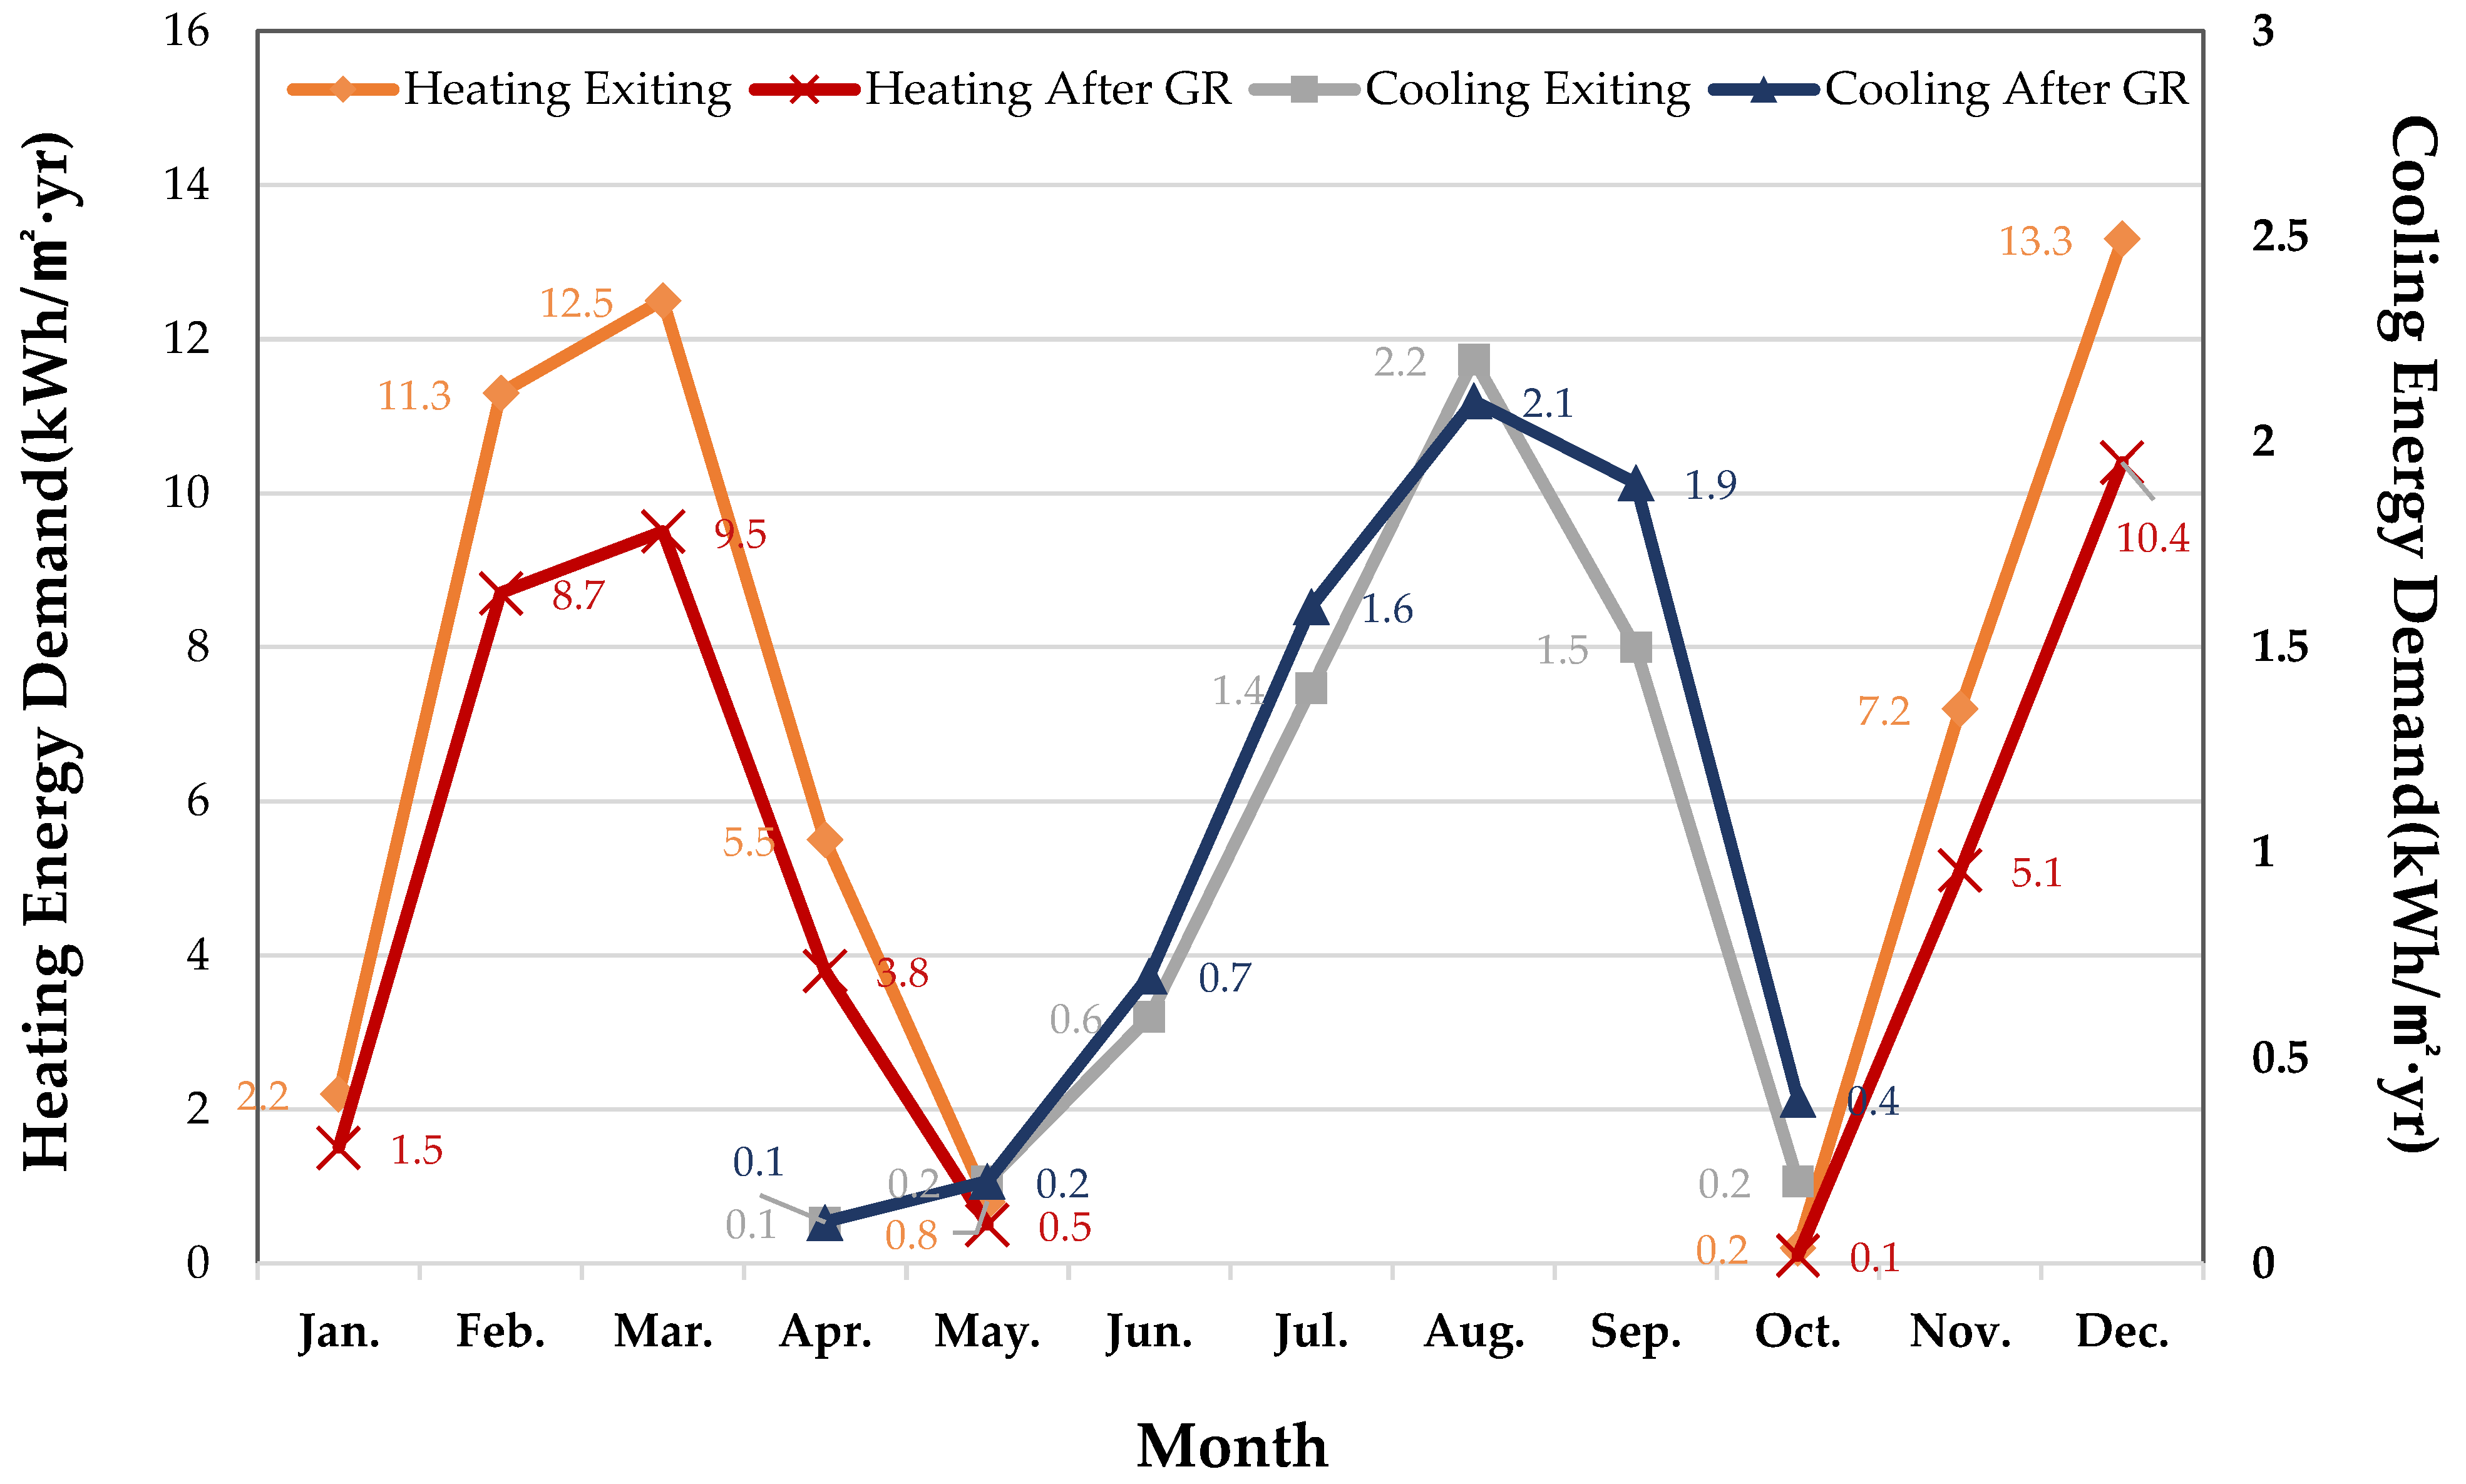
For the analysis of energy performance, the conditions in the simulation were set to reflect the location and architectural details of the target building. The climatic conditions were set to Busan City, where the building was located, and the use of the building was set to an educational facility. Ventilation and renewable systems, which were excluded from the GR items of the target building, were also excluded in the energy performance analysis. The results for the monthly cooling/heating energy demand analysis after energy performance improvement are shown in Figure 6. Compared with the existing building with passive performance improvement, the heating energy demand was reduced by 24.8%, but the cooling energy demand increased by 12.5%. We determined that, when the insulation performance of the windows was improved, the SHGC increased from 0.28 before improvement to 0.34 afterward, indicating an increase in the cooling load owing to an increase in the solar heat gain. Table 9 presents the results of a comprehensive analysis of the energy performance before and after the improvement. The PEC value ranged from 248.5 kWh/m2·yr before improvement to 128.9 kWh/m2·yr afterward, indicating a reduction of approximately ≥48%. In addition, during heating, the electric boiler equipment was replaced with a condensing gas boiler, and the energy conversion factor changed from 2.75 (electricity) to 1.10 (gas). Therefore, we determined that the PEC of heating can be reduced by approximately ≥70%. However, in the case of cooling, energy consumption increased slightly compared with that before the improvement. We found that energy consumption increased owing to the installed air-conditioning system that was used to improve the quality of the occupant’s environment. For hot water and lighting, the results of the analysis were the same, as they reflected the existing building plan without modification. Figure 7 shows the results of the energy performance evaluation after GR. The results confirmed that the energy performance improved by five levels from grade 4 before the improvement to grade 1+ after the improvement.
An assessment of the costs incurred during the building operation stage was conducted based on the results of the energy consumption analysis. Before the implementation of GR, the building relied on electricity as its energy source. In contrast, after GR, a boiler utilizing city gas was installed for heating, while electricity remained as the energy source for non-heating systems. Table 10 presents the consumption of each energy source before and after GR.
The cost associated with each energy source was analyzed by applying the unit prices specified in Table 11.
To determine the basic electricity rate, the total load and operation period of the facility were taken as 50 kW and 20 days/mth, respectively. The analysis revealed a reduction of approximately 33% in energy operation costs following the implementation of GR. The energy operating costs of the target building before and after GR are listed in Table 12.
The values of CO2 emissions in the building operation stage were derived based on the numerical analysis of energy consumption using a simulation. The equation for calculating CO2 emissions in the building operation stage is as follows (see Equation (15) below):
C O 2 e m i s s i o n = ( P E C × C O 2 e m i s s i o n s f a c t o r )
Table 13 shows the results of the analysis on changes in CO2 emissions. The values of CO2 emissions were calculated by applying the CO2 emission factor of each energy source to the primary energy consumption. In this case, the CO2 emission factor of each energy source was 0.2020 kg/kWh for liquefied natural gas (LNG) and 0.4691 kg/kWh for electric power.
Figure 8 shows the results of changes in CO2 emissions analysis. CO2 emissions were reduced by more than 46% from 42.4 kg/m2·yr before improvement to 22.6 kg/m2·yr after improvement. In particular, given that the heating source was changed from electricity to gas, more than 68% of CO2 emissions were reduced.
In this study, energy analysis was conducted on the carbon emissions at the operating stage. Therefore, in order to analyze the carbon emission reduction considering both the construction stage and the operation stage of GR, the embodied carbon (EC) according to the GR construction material was analyzed. Table 14 lists the additional carbon emissions obtained from construction materials by considering EC coefficients during the GR construction phase. EC emissions were calculated using the following equation [38], and the carbon emissions obtained from GR construction materials are referred to data [39,40]:
(1) EC emissions = volume of construction materials × density × EC coefficient
As a result, EC was calculated to be 8375 kgCO2eq during GR construction, but the carbon emissions reduction in the building operation stage by improving energy performance was 8283 kgCO2eq. Assuming that the remaining building lifespan after energy retrofitting is 30 years [41], the total reduction in carbon emissions in the building operation stage was 248,490 kgCO2eq. Therefore, considering the EC emissions of GR construction materials, it was confirmed that carbon emissions were reduced by 240 tonCO2eq during the building operation period.

3. Feasibility Analysis of the Comprehensive Building Retrofitting Project

3.1. Analysis Procedure and Methods

The procedure and method used for the feasibility analysis of the comprehensive retrofitting project are shown in Figure 9. This involved the establishment of respective plans for improving the structural performance and GR of the target building, analysis of the results of improvement plans, examination of the cost-saving plan for overlapping construction items, and the performance of feasibility analysis of the comprehensive performance improvement.
In this case, the construction cost of each process refers to the amount quoted by the construction company. The construction cost of each process included the cost of the demolition of old buildings, the cost of finishing materials, etc., and the costs associated with the labor force. Based on the results of the analysis of construction costs, overlapping items were derived to analyze the feasibility of the concurrent implementation of structural retrofitting and GR.

3.2. Total Construction Cost Analysis

Regarding the construction cost, estimates were received by the construction companies in charge of each process. Based on an examination of the structural performance of the target building, we determined that steel frame reinforcement was required on the left side and a part of the front façade of the first floor, and the construction cost of this work was analyzed. The calculation results of the construction cost for structural retrofitting are presented in Table 15.
Regarding the construction cost of the structural retrofitting project, the cost of structural steel framing accounted for approximately 57% of the total cost, indicating the largest proportion among the different items. The production cost of construction for the structural retrofitting project is presented in Table 16, which was 23.8 million KRW in total, considering all the indirect costs.
Regarding the construction cost associated with GR, based on Section 3, the estimates were calculated by considering the construction and equipment. The estimation results of the construction cost are presented in Table 17, and the total construction cost was 110 million KRW.
In the total GR process costs, passive items account for 38.4%, and active items account for 29.4%. In addition, the construction cost of the temporary work, which was not related to the improvement of direct energy performance, accounted for 9.4%, a higher proportion compared with that of other individual processes. The cost of GR, including indirect costs, amounted to a total of 206.6 million KRW, as shown in Table 18. Among the construction costs, the majority of the cost of the structural work was associated with the finishing materials of the building; however, for GR, the cost was primarily related to interior work and equipment installation. This accounted for a significant proportion, apart from the finishing materials. Therefore, the production cost of construction was approximately 8.7 times higher for GR compared with that for structural retrofitting.

3.3. Results of the Feasibility Analysis

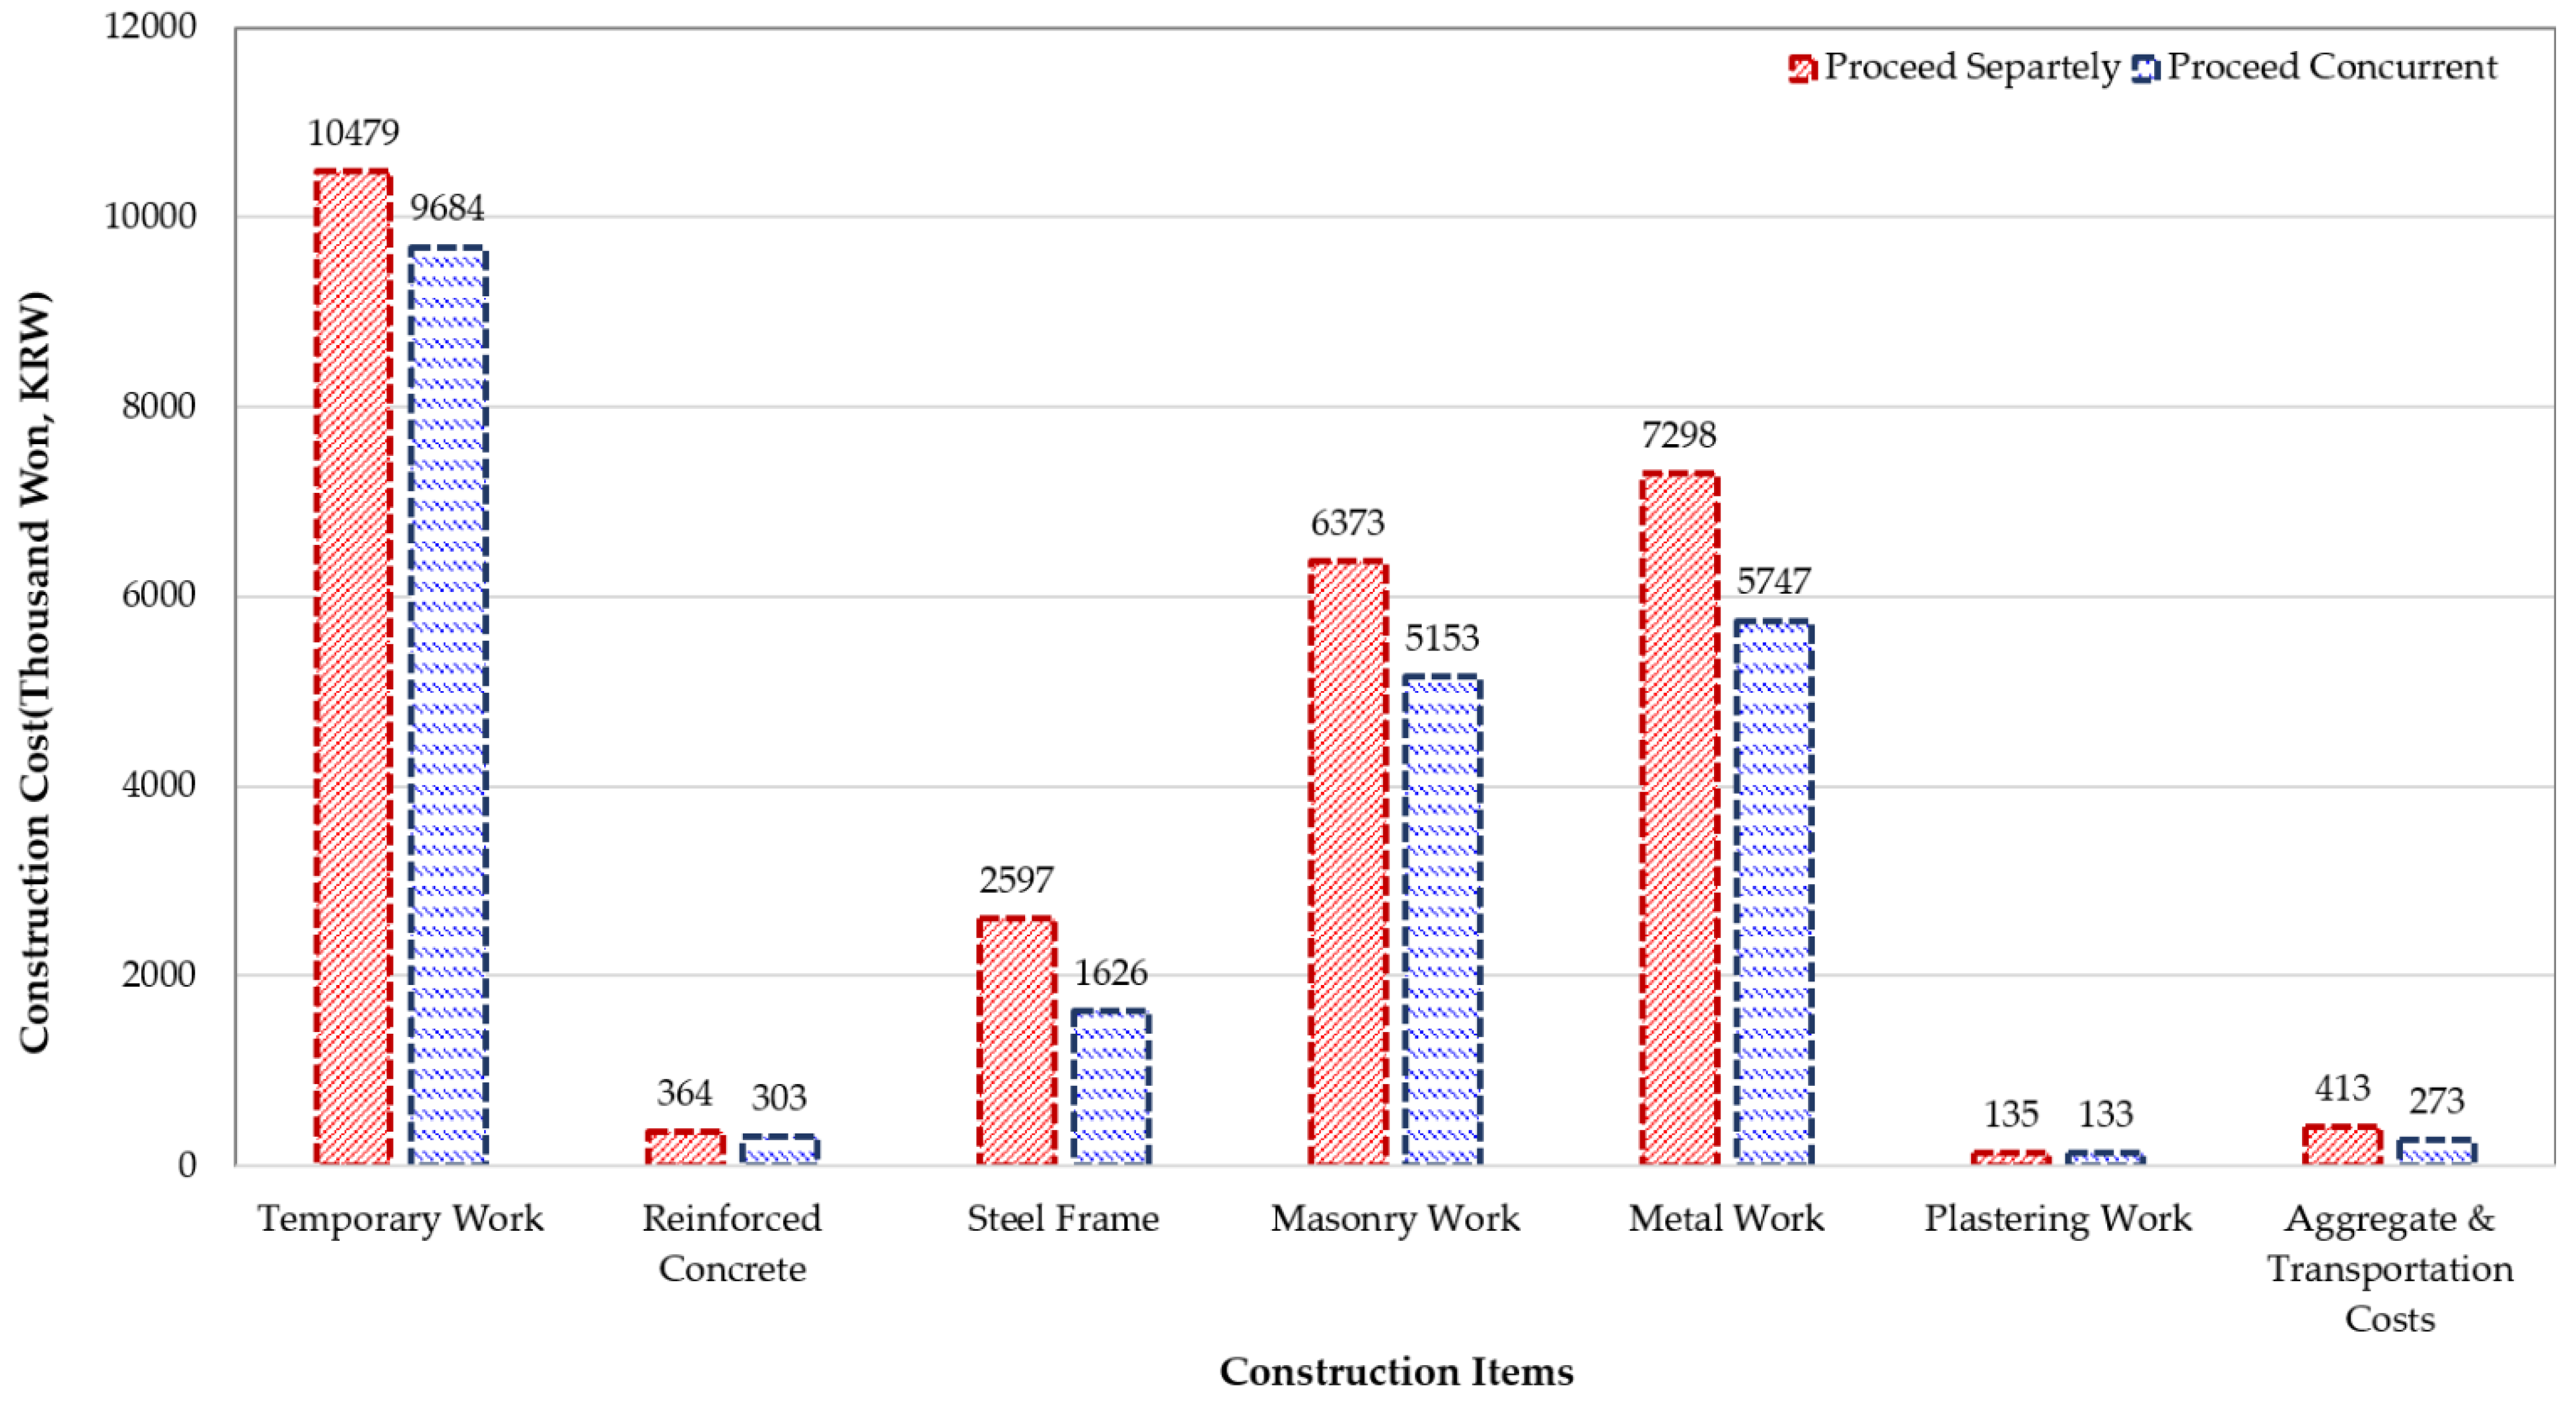
The cost analysis for overlapping items was performed for structural retrofitting and GR of the target building. Table 19 and Figure 10 show the construction cost, considering the items of overlapping processes. Regarding the construction cost of overlapping processes in structural retrofitting and GR, the material cost was optimized to 100%, and the labor cost was optimized to 50% to perform the cost analysis. As a result, for the two different performance improvement projects, the construction cost was reduced by more than 17% and by 32.7% and 25.7%, respectively, for metal and masonry work, which are passive improvement items. Considering the ratio of cost savings based on the construction items, the ratio of construction cost reduction for the structural steel framing item was high at 37.4%; however, this high ratio was attributed to considerable savings in the labor cost when skilled workers were required compared with other construction items and savings in the overhead.
Table 20 outlines the results of analyzing the construction cost savings for structural retrofitting. By excluding overlapping items during performance improvement, the savings in the expenses required for structural retrofitting, including all indirect costs, were reduced by approximately ≥30%.
Table 21 shows the results of re-estimating the production cost of construction when structural retrofitting and GR are performed concurrently in the target building. When each performance improvement project proceeded separately, the total construction cost was 230.5 million KRW; however, when performed simultaneously, the total construction cost was 223.3 million KRW, indicating a cost saving of more than 3%.
Table 22 shows the result of the analysis of the expected cost based on process optimization for the structural retrofitting and GR processes. We found that the production cost of construction was reduced by a total of 7.4 million KRW when the labor cost was reduced by 100%, owing to process optimization. This is an additional saving of approximately ≥55% compared with the existing level of cost savings.
To conduct a comprehensive cost–benefit analysis of GR construction, it is essential to consider both the initial investment cost and the cost savings resulting from improvements in energy performance. However, obtaining an accurate estimate for the construction cost before improvement is not feasible. Therefore, calculations were based on data available in Korea’s “Public Building Construction Cost Guidelines” for facilities for the elderly. Table 23 shows the construction cost per gross floor area of such facilities.
Consequently, the total construction cost before improvement was estimated to be 1663 million won, whereas the total construction cost after improvement, including the construction cost before improvement and the expenses associated with implementing the improvement plan, amounted to 1887 million won. To conduct the cost–benefit analysis, the real discount rate was calculated considering the current fixed deposit interest and inflation rates in Korea. The estimated real discount rate was 0.19%. The equation for calculating the real discount rate is as follows (see Equation (16) below):
I r = 1 + I n 1 + F 1
The cost–benefit analysis, considering the real discount rate and incorporating both construction and operation costs, was conducted separately for the periods before and after the comprehensive performance improvement. Table 24 lists the costs incurred over a 10-year period prior to and following the comprehensive performance improvement. Based on the results being 0.89, this indicates that the construction costs for improvement surpassed the reduction in operating costs.
The cost–benefit analysis conducted in this study did not consider the financial or loan support provided by the Korean government. Therefore, if the Korean government were to implement systematic incentives for GR, it is expected that the economic benefits of GR could outweigh the investment costs. Furthermore, the adoption of institutional incentives should be actively considered to enhance the energy performance of old buildings and effectively achieve the target reduction in GHG emissions.

3.4. Economic Effects of Green Remodeling on South Korea

To further promote GR, the expected social effect as well as the expected economic outcome associated with the reduction of construction costs should be analyzed, and the results can serve as basic reference data for policy decision making. Therefore, in this study, we analyzed savings in budget expenditure and the expected social effect of job creation owing to the GR of a daycare center built in South Korea.
Table 25 shows the number of daycare centers by type in South Korea from 2018 to 2020 [42]. In 2020, there were a total of 35,352 daycare center facilities in South Korea, of which 4958 were national/public daycare centers. Among these, for buildings subject to structural retrofitting and GR, the proportion of non-residential buildings in South Korea that are at least 20 years old is presented in Table 2. The data were analyzed to determine the expected economic effect. Table 26 shows the results of estimating the cost required for separate or concurrent structural retrofitting and GR. The results of the analysis showed that national/public daycare centers could save approximately 16.6 billion KRW. When the GR target was expanded to include daycare centers nationwide, the total cost saving amounted to 118 billion KRW.
The expected social effect of comprehensive retrofitting was analyzed for 2310 national/public daycare centers in South Korea. For the expected social effect, the fiscal expenditure on employment was analyzed, considering personnel and operating expenses. For the expected outcome of personnel expense, the total amount was obtained by adding the labor cost and overhead to the construction cost for GR, as shown in Table 27. For the expected outcome associated with the operating expense, the remaining amount excluding the personnel expense items shown in Table 28 was utilized to estimate the value. The equation for calculating the effect of employment was derived based on the following equations:
(1) Effect of fiscal expenditure on employment = Personnel expense employment effect + Operating expense employment effect
(2) Personnel expense employment effect = Amount of expenditure in personnel expense/Annual average wage in the construction industry
(3) Operating expense employment effect = Amount of expenditure in operating expense × Employment inducement coefficient for an item of expenditure in construction
Personnel expense expenditure by industry = Labor cost + Overhead cost
Annual average wage in the construction industry [43]: 49.73 million KRW/person
Employment inducement coefficient for an item of expenditure in construction [43]: 80 million/person
The results of the analysis based on the equations for calculating the employment effect are shown in Table 28. The employment effect was estimated to be approximately ≥3800 persons in the personnel expense category and approximately ≥2500 persons in the operating expense category. In addition, the employment effect for the total fiscal expenditure was approximately ≥6500 persons. The analysis was performed only on national/public daycare centers, which account for 14% of the total daycare centers nationwide. Therefore, if the performance improvement projects are expanded to daycare centers nationwide, the fiscal expenditure on the employment effect is expected to increase to approximately ≥49,000 persons. We considered that the findings will contribute to green growth as reference data for achieving carbon neutrality, which is a requirement of the global environment and the Green New Deal project proposed by the South Korean government, and the expansion of green architecture to various facilities in the country.

4. Conclusions

In this study, we investigated the effect of simultaneous improvement of energy and structural performance of old buildings. In this regard, a feasibility analysis was performed based on an actual GR case. During the energy performance enhancement of the building under investigation, the operational stage witnessed a reduction of over 19.8 kg/m2·yr in CO2 emissions. Moreover, when both energy and structural performance were improved simultaneously, construction costs decreased by up to 7.4 million won. These findings indicate that promoting comprehensive performance improvements in daycare centers across Korea could yield an employment effect of over 49 thousand individuals. Consequently, this underscores the necessity for Korean public institution officials to prioritize comprehensive performance enhancements while formulating business plans for improving the performance of older buildings. Such considerations are vital for achieving Korea’s carbon-neutral goals and meeting societal expectations regarding new avenues for growth. The results of this study are summarized as follows:
(1) In the case of GR, a performance improvement was achieved for passive and active designs, which were designated as mandatory. In terms of passive items, insulation performance was improved by the addition of insulation materials and the replacement of windows. In terms of active items, the electric boiler was replaced with a condensing gas boiler, and an EHP of 16 kW was incorporated for cooling. However, the average COP of the heating system improved from 3.06 to 3.38 after the improvement.
(2) The results showed that the heating energy demand decreased by 24.8%, but the cooling energy demand increased by 12.5%. Our analysis revealed that, as the SHGC value of the window improved after GR, the cooling energy demand also increased, owing to an increase in the solar heat gain during summer. The PEC reduced by approximately ≥48%. This was because of a decrease in the PEF attributed to the change in the heating energy source from electricity to gas. CO2 emissions in the building operation stage were reduced by more than 46% after GR. Considering the EC emissions of materials used in green remodeling construction, the total carbon reduction at the operating stage for 30 years is 240 tonCO2eq.
(3) The analysis revealed that a total of seven items overlapped in the process of GR and structural retrofitting involving the demolition of the building’s envelope and reinforcement of the old building. Thus, we determined that a construction cost saving of approximately ≥17% was achieved when structural retrofitting and GR of the target building were concurrently executed. When the labor cost of overlapping items was reduced by 100% via process optimization, the construction cost was reduced by more than 27%. These results confirmed that there was a considerable difference in total cost savings depending on the status of optimization between the processes in structural retrofitting and GR.
(4) We showed that more than 118 billion KRW of public spending could be saved annually if GR and structural retrofitting are simultaneously performed. Based on the analysis of the fiscal expenditure of national/public daycare centers, we found that direct and indirect employment of more than 6900 persons can be achieved.
In this study, the analysis was performed on one daycare center in terms of concurrent performance improvement of an old building; therefore, the application of these findings is limited to all old buildings in South Korea in terms of the feasibility of improving the comprehensive performance. However, the findings of this study emphasize the requirement of policy implementation regarding the simultaneous improvement of energy and structural performance. In addition, since 2016, the average frequency of earthquakes in South Korea has increased by more than four times, further emphasizing the necessity of structural retrofitting of old buildings. In addition, there have been growing concerns over increasing energy prices owing to uncertainty in the supply and demand of energy following the Russia–Ukraine crisis. Therefore, the aforementioned circumstances may advance the implementation of policies that mandate the concurrent improvement of the energy and structural performance of old buildings. For more generalized applications of GR, an analysis of concurrent performance improvement may be investigated for other types of facilities. The findings may serve as a useful reference for achieving carbon neutrality and sustainable growth.

Author Contributions

Writing—original draft, J.-H.C.; software, S.B.; data curation, J.-H.C.; writing—review and editing, Y.N.; supervision, Y.N. All authors have read and agreed to the published version of the manuscript.

Funding

This work was supported by the National Research Foundation of Korea (NRF) grant funded by the Korea government (MSIT) (NRF-2022R1A4A1026503).

Data Availability Statement

Not applicable.

Conflicts of Interest

The authors declare no conflict of interest.

Nomenclature

Symbol and units
Q H , n d Heating energy demand for continuous heating, MJ
Q H , h t Total heat transfer in heating operation, MJ
η H , g n Effective heat gain factor in heating operation
Q H , g n Total heat gain in heating operation, MJ
Q C , n d Cooling energy demand in continuous cooling, MJ
Q C , g n Total heat gain in cooling operation, MJ
η C , l s Effective heat gain factor in cooling operation
Q C , h t Total heat transfer in cooling operation, MJ
γ H Thermal equilibrium ratio in heating mode
a H Coefficient according to the time constant, τ H
a H , 0 Reference coefficient
τ Time constant of building zone, h
C m Total heat capacity of building elements in direct contact with indoor air, J/K
k j Heat capacity per unit area of building element j, J/m2K
A j Area of building element j, m2
γ C Thermal equilibrium ratio in cooling mode
a C Coefficient according to the time constant, τ C
I r Real discount rate
I n Fixed deposit rate
F Inflation rate
Acronyms and Abbreviations
COP26The 26th Conference of the Parties
IEAInternational Energy Agency
ZEBZero-Energy Building
EPSExpanded polystyrene insulation
PURPolyurethane insulation
SHGCSolar heat gain coefficient
EHPElectric heat pump
LEDLight-emitting diode
BEECBuilding energy efficiency certification
COPCoefficient of performance
PECPrimary energy consumption
ECEmbodied carbon

References

  1. COP26 of United Nation. Available online: https://www.un.org/en/climatechange/cop26 (accessed on 31 October 2021).
  2. A European Green Deal. Available online: https://commission.europa.eu/strategy-and-policy/priorities-2019-2024/european-green-deal_en (accessed on 11 December 2019).
  3. Climate Action Plan 2050. Principles and Goals of the German Government’s Climate Policy. 2016. Available online: https://www.bmuv.de/en/ (accessed on 11 November 2016).
  4. Clean Energy For All. Available online: https://www.whitehouse.gov/cleanenergy/ (accessed on 27 January 2021).
  5. Clean Energy. Available online: https://www.energy.gov/clean-energy (accessed on 25 February 2021).
  6. Climate Change. Available online: https://www.meti.go.jp/english/policy/energy_environment/global_warming/index.html (accessed on 25 December 2020).
  7. An Energy Sector Road Map to Carbon Neutrality in China. Available online: https://www.iea.org/reports/an-energy-sector-roadmap-to-carbon-neutrality-in-china (accessed on 29 September 2021).
  8. Climate Change Act 2008. Available online: https://www.legislation.gov.uk/ukpga/2008/27/contents (accessed on 26 November 2008).
  9. EU Commission. Energy Efficient Buildings. Available online: https://commission.europa.eu/news/focus-energy-efficiency-buildings-2020-02-17_en (accessed on 17 February 2020).
  10. Net Zero by 2050. A Roadmap for the Global Energy Sector. Available online: https://www.iea.org/reports/net-zero-by-2050 (accessed on 18 May 2021).
  11. The Critical Role of Buildings. Perspectives for the Clean Energy Transition. Available online: https://www.iea.org/reports/the-critical-role-of-buildings (accessed on 24 April 2019).
  12. MOE in Korea. 2nd Plan for Climate Change Action. Available online: https://www.me.go.kr/home/web/policy_data/read.do?menuId=10259&seq=7394 (accessed on 13 October 2019).
  13. European Commission. Buildings Factsheet. Available online: https://ec.europa.eu/energy/eu-buildings-factsheets_en (accessed on 22 April 2020).
  14. MOLIT in Korea. Statistics on Buildings. Available online: http://www.molit.go.kr/USR/NEWS/m_71/dtl.jsp?lcmspage=1&id=95085286 (accessed on 18 June 2023).
  15. MOCST in Korea. Korea Green New Deal 2.0. Available online: https://www.korea.kr/special/policyCurationView.do?newsId=148874860#sitemap-layer (accessed on 30 September 2021).
  16. MOLIT in Korea. Green Buildings Construction Support Act. Available online: https://www.law.go.kr/ (accessed on 25 March 2022).
  17. Green-Remodeling Center of MOLIT. Available online: https://www.greenremodeling.or.kr/ (accessed on 18 June 2023).
  18. Gram-Hanssen, K. Existing buildings–Users, renovations and energy policy. Renew. Energy 2014, 61, 136–140. [Google Scholar] [CrossRef]
  19. Tajani, F.; Morano, P.; Di Liddo, F.; Doko, E. A model for the assessment of the economic benefits associated with energy retrofitting interventions: An application to existing buildings in the Italian territory. Appl. Sci. 2022, 12, 3385. [Google Scholar] [CrossRef]
  20. Farahani, A.; Wallbaum, A.; Dalenbäck, J.O. The importance of life-cycle based planning in maintenance and energy renovation of multifamily buildings. Sustain. Cities Soc. 2019, 44, 715–725. [Google Scholar] [CrossRef]
  21. Alabid, J.; Bennadji, A.; Seddiki, M. A review on the energy retrofit policies and improvements of the UK existing buildings, challenges and benefits. Renew. Sustain. Energy Rev. 2022, 159, 112161. [Google Scholar] [CrossRef]
  22. Oliveira, R.A.F.; Lopes, J.P.; Abreu, M.I. Sustainability perspective to support decision making in structural retrofitting of buildings: A case study. Systems 2021, 9, 78. [Google Scholar] [CrossRef]
  23. De Vita, M.; Mannella, A.; Sabino, A.; Marchetti, A. Seismic retrofit measures for masonry walls of historical buildings, from an energy saving perspective. Sustainability 2018, 18, 984. [Google Scholar] [CrossRef] [Green Version]
  24. Shaikh, P.H.; Shaikh, F.; Sahito, A.A.; Uqaili, M.A.; Umrani, Z. Chapter 9—An overview of the challenges for cost-effective and energy-efficient retrofits of the existing building stock. In Materials, Technologies, Optimization and Case Studies; Woodhead Publishing: Cambridge, UK, 2017; pp. 257–278. [Google Scholar]
  25. Toosi, H.A.; Lavagna, M.; Leonforte, F.; Pero, C.D.; Aste, N. Life cycle sustainability assessment in building energy retrofitting; A review. Sustain. Cities Soc. 2020, 60, 102248. [Google Scholar] [CrossRef]
  26. Zaho, D.; Mo, Y. Construction cost decomposition of residential building energy retrofit. Buildings 2023, 13, 1363. [Google Scholar] [CrossRef]
  27. Prabatha, T.; Hewage, K.; Sadiq, R. An incentives planning framework for residential energy retrofits: A life cycle thinking-based analysis under uncertainty. Sustainability 2023, 15, 5479. [Google Scholar] [CrossRef]
  28. Gabrielli, L.; Ruggeri, A.G.; Scarpa, M. Roadmap to a sustainable energy system: Is uncertainty a major barrier to investments for building energy retrofit projects in wide city compartments? Energies 2023, 16, 4261. [Google Scholar] [CrossRef]
  29. Kim, J.; Nam, S.; Lee, D. Current status of old housing for low-income elderly households in Seoul and green remodeling support Plan: Economic analysis considering the social cost of green remodeling. Buildings 2022, 12, 29. [Google Scholar] [CrossRef]
  30. Jun, Y.-J.; Ahn, S.-H.; Park, K.-S. Improvement effect of green remodeling and building value assessment criteria for aging public buildings. Energies 2021, 14, 1200. [Google Scholar] [CrossRef]
  31. Han, D.; Yoon, S. An analysis of energy saving effect of deteriorated detached house through green remodeling-Focusing on Nam-gu, Busan. J. Archit. Inst. Korea 2021, 37, 145–154. [Google Scholar]
  32. Woo, S.; Lee, S. An analysis of energy saving effect of green remodeling in public buildings for net-zero. J. KIEAE 2022, 2022, 19–26. [Google Scholar] [CrossRef]
  33. Korea Meteorological Administration. Available online: https://www.weather.go.kr/w/eqk-vol/search/korea.do?schOption=&xls=0&startTm=2018-01-01&endTm=2022-12-31&startSize=2&endSize=&startLat=&endLat=&startLon=&endLon=&lat=&lon=&dist=&keyword=&dpType=m3 (accessed on 18 June 2023).
  34. MOIS in Korea. Act on the Preparation for Earthquakes and Volcanic Eruptions. Available online: https://elaw.klri.re.kr/eng_mobile/viewer.do?hseq=55641&type=part&key=12 (accessed on 9 June 2020).
  35. Ahn, C.; Kim, M. Revitalizing the comprehensive performance improvement of existing buildings through green remodeling service. Mag. SAREK 2021, 50, 16–25. [Google Scholar]
  36. ISO 13790:2008; Energy Performance of Buildings—Calculation of Energy Use for Space Heating and Cooling. International Organization for Standardization: Geneva, Switzerland, 2008.
  37. DIN 18559:2018-09; Energy Efficiency of Buildings —Calculation of the Net, Final and Primary Energy Demand for Heating, Cooling, Ventilation, Domestic Hot Water and Lighting. Deutsche Industric Normen: Berlin, Germany, 2018.
  38. Moncaster, A.M.; Symons, K.E. A method and tool for ‘cradle to grave’ embodied carbon and energy impacts of UK buildings in compliance with the new TC350 standards. Energy Build. 2013, 66, 514–523. [Google Scholar] [CrossRef] [Green Version]
  39. Hammond, G.; Jones, C. Embodied Carbon: The Inventory of Carbon and Energy (ICE). In A BSRIA Guide; 2011; pp. 10–24. Available online: http://www.emccement.com/pdf/Full-BSRIA-ICE-guide.pdf (accessed on 18 June 2023).
  40. KEITI in Korea. Korea LCI DB. Available online: https://www.greenproduct.go.kr/epd/lci/lciDb.do (accessed on 18 June 2023).
  41. Shadram, F.; Bhattacharjee, S.; Lidelöw, S.; Mukkavaara, J.; Olofsson, T. Exploring the trade-off in life cycle energy of building retrofit through optimization. Appl. Energy 2020, 269, 115083. [Google Scholar] [CrossRef]
  42. MOHW. Child Care Statistics (2020). Available online: https://www.index.go.kr/unity/potal/main/EachDtlPageDetail.do?idx_cd=1583 (accessed on 31 March 2022).
  43. KRILA in Korea. Review and Feasibility Study Manual for Local Financial Investment Projects (2022). Available online: https://limac.krila.re.kr/instruction/manual/13?keyword=&page=1 (accessed on 13 September 2022).
Figure 1. Percentage distribution of the building’s age categorized by building type in the EU and South Korea.
Energies 16 04961 g001
Figure 2. Overview of the research procedure.
Energies 16 04961 g002
Figure 3. Process of green remodeling.
Energies 16 04961 g003
Figure 4. Results for green remodeling in Korea.
Energies 16 04961 g004
Figure 5. Floor plan.
Energies 16 04961 g005aEnergies 16 04961 g005b
Figure 6. Results of the analysis of the annual energy demand.
Energies 16 04961 g006
Figure 7. Results of the analysis of primary energy consumption.
Energies 16 04961 g007
Figure 8. Results of changes in CO2 emissions analysis.
Energies 16 04961 g008
Figure 9. Procedures and methods of the feasibility analysis.
Energies 16 04961 g009
Figure 10. Comparison of the construction cost based on structural performance improvement and green remodeling.
Energies 16 04961 g010
Table 1. Global carbon neutrality plans.
DivisionPolicyTargetMain Items
EUGreen DealCarbon adjustment mechanism
(Carbon-neutral and growth strategy)
Industry decarbonization, renewable energy, building energy improvement and renovation, sustainable and smart mobility, and zero-pollution plan
GermanyClimate Action Plan Compliance with the national and EU targets and net-zero GHG emissions by 2050Increasing renewable energy,
electric mobility and infrastructure improvement, and building energy improvement and renovation
AmericaClean Energy RevolutionCarbon neutralization for the entire economyBuilding energy, renewable energy, electric power storage and grid, low-carbon transport, green hydrogen, and zero-carbon power generation
JapanDecarbonization PlanDecarbonization through green growthRenewable energy, energy storage system, green mobility, green hydrogen, and zero-carbon power generation
ChinaZero-Carbon ChinaGreen recovery and low-carbon economic transformationRenewable energy, energy-saving systems,
fossil fuel to power conversion, and energy efficiency improvement
EnglandClimate Change ActRealization of carbon neutrality through decarbonization of energy systemsRenewable energy, green hydrogen,
nuclear energy, low-carbon transport,
building energy, and sustainability
Table 2. Percentage distribution of the building’s age by building type in the EU and South Korea.
DivisionEURepublic of Korea
Residential BuildingsNon-Residential BuildingsResidential BuildingsNon-Residential Buildings
Less than 10 years12.0%11.0%24.1%26.4%
More than 10 to less than 20 years16.0%17.0%27.0%27.1%
More than 20 to less than 30 years6.0%15.0%29.0%27.9%
More than 30 years66.0%57.0%19.9%18.7%
Table 3. Green remodeling support items in the public sector.
DivisionGreen Remodeling Criteria
Mandatory item1. High-efficiency item: Window (door) and insulation
2. Equipment: Heat recovery system and high-efficiency heating, ventilation and air-conditioning (HVAC) system
3. Building energy management system
Selective item1. Cool roof, awning, electric water heater, and smart air shower
Additional support item1. Demolition and waste disposal of the existing construction work
2. Construction costs or sharing due to the replacement of heat sources, etc.
Table 4. Building summary.
Before Green RemodelingAfter Green Remodeling
Energies 16 04961 i001Energies 16 04961 i002
LocationCheolma-myeon, Gijang-gun, Busan, Republic of Korea
Year of Construction1997
TypePublic nursery school
Lot Area401.00 m2
Gross Area418.35 m2
Number of Floors2F
Table 5. Energy improvement materials used for the passive design.
DivisionExisting ItemImprovement Item
Wall and floor EPS insulation (0.043 W/m2·K)PUR insulation (0.024 W/m2·K)
RoofEPS insulation (0.043 W/m2·K)Glass wool (0.035 W/m2·K)
Window18 mm double-glazed glass
(4.0 W/m2·K; SHGC 0.28)
28 mm low-E double-glazed glass
(2.3 W/m2·K; SHGC 0.34)
Table 6. Energy improvement materials for the active design.
SystemExisting ItemImprovement Item
EquipmentCapacityQuantityEfficiencyEquipmentCapacityQuantityEfficiency
HeatingElectric boiler2700 L2 EA100%Condensing gas boiler50 kW2 EA91%
Hot waterElectric water heater500 L1 EA100%Electric water heater500 L1 EA100%
CoolingEHPTotal 17.90 kW8 EACOP 3.06EHPTotal
33.90 kW
9 EACOP 3.38
LightLED lighting1F: 3.99 W/m2; 2F: 2.30 W/m2LED lighting1F: 3.99 W/m2; 2F: 2.30 W/m2
Table 7. BEEC standards of South Korea.
DivisionPrimary Energy Consumption (kWh/m2·yr)
Residential Building (X)Non-Residential Building (Y)
1+++X < 60Y < 80
1++60 ≦ X < 9080 ≦ Y < 140
1+90 ≦ X < 120140 ≦ Y < 200
1120 ≦ X < 150200 ≦ Y < 260
2150 ≦ X < 190260 ≦ Y < 320
3190 ≦ X < 230320 ≦ Y < 380
4230 ≦ X < 270380 ≦ Y < 450
5270 ≦ X < 320450 ≦ Y < 520
Table 8. PEF of the energy source.
DivisionFuel (Gas)Electricity
PEF1.102.75
Table 9. Analysis results of the energy demand and consumption.
DivisionHeatingCoolingHot WaterLightingTotal
Energy demand
(kWh/m2·yr)
Before GR52.86.26.14.669.7
After GR39.77.06.14.657.4
Energy Consumption
(kWh/m2·yr)
Before GR56.91.622.24.685.3
After GR45.01.822.24.673.6
Primary Energy Consumption
(kWh/m2·yr)
Before GR170.64.460.912.6248.5
After GR50.64.860.912.6128.9
Primary Energy Consumption
for BEEC Grade
(kWh/m2·yr)
Before GR318.48.274.417.3418.3
After GR95.39.174.417.6196.4
Table 10. Consumption of each energy source.
DivisionEnergy Consumption (kWh/m2·yr)
Fuel (Gas)ElectricityTotal
Before GR-85.385.3
After GR45.028.673.6
Table 11. Cost of each energy source.
DivisionFuel CostElectricity Cost
Base CostUsed Cost
Applied amount6.8822 KRW/kWh5230 KRW/kW69.93 KRW/kWh
Table 12. Results of the analysis of energy operation costs.
DivisionFuel Used Cost (KRW)Electricity Cost (KRW)Total (KRW)
Base CostUsed Cost
Before GR [A]-2,024,5162,180,0834,204,600
After GR [B]113,1832,024,516730,9542,755,470
Cost saved [A − B]−113,183-1,449,1291,335,947
Table 13. Results of the analysis on changes in CO2 emissions.
DivisionCO2 Emissions during the Building Operational Phase (kg/m2·yr)
HeatingCoolingHot WaterLightingTotal
Before GR29.10.710.42.242.4
After GR9.30.810.42.122.6
Table 14. Additional carbon emissions obtained from green remodeling in the construction phase.
DivisionVolume of the Construction Materials (m3)Density
(kg/m3)
EC Coefficient
(kgCO2eq/kg)
EC
(kgCO2eq)
Concrete2.024000.107514
Brick6.916000.2402631
Tile0.322000.480267
InsulationPUR4.0354.260601
Glass wool4.9481.350315
Plasterboard0.110000.390-
Window2.824500.5904047
Total20.9--8375
Table 15. Results of the estimation of construction costs for structural performance improvement.
Construction ItemsMaterial Cost (Korean Won [KRW])Labor Cost (KRW)Overhead (KRW)Total (KRW)Construction Cost (%)
Temporary work416,578756,256-1,172,8347.26%
Reinforced concrete73,54046,192923120,6550.75%
Steel frame4,608,3293,673,126871,8669,153,32156.67%
Masonry work1,329,9752,032,01739,0393,401,03121.06%
Metal work1,025,7681,016,45532,5442,074,76712.85%
Plastering work-3265-32650.02%
Aggregate and transportation costs85,853-139,325225,1781.39%
Total7,540,0437,527,3111,083,69716,151,051100.00%
Table 16. Production cost of construction for structural performance improvement.
ItemsMaterial Cost (KRW)Labor Cost (KRW)Overhead (KRW)Administrative Cost, etc. (KRW)Total (KRW)
Production cost of construction7,540,0438,129,4953,023,4815,121,98123,815,000
Table 17. Results of the estimation of the construction cost for green remodeling.
Construction ItemsMaterial Cost (KRW)Labor Cost (KRW)Overhead (KRW)Total (KRW)Construction Cost (%)
Common temporary work
(Container office installation)
--1,427,4661,427,4661.30%
Temporary work
(Scaffolding work, etc.)
2,952,2447,351,938921610,313,3989.37%
Reinforced concrete work
(Concrete pouring, etc.)
147,08093,9621878242,9200.22%
Structural steel framing work (Structural installation, etc.)830,538975,161178,6101,984,3091.80%
Masonry work
(Brick masonry installation)
2,657,9374,320,53986,1647,064,6406.42%
Tile work (Tile installation)81,576519,56312,870614,0090.56%
Carpentry work
(Formwork, etc.)
9,419,0502,041,09289,38011,549,52210.49%
Waterproofing work1,703,8303,363,20534,2205,101,2554.63%
Roof installation work
(Panel installation, etc.)
40433446638140.00%
Metal work13,945,6113,517,720112,48317,575,81415.96%
Plastering work-2,305,42341,6442,347,0672.13%
Windows (glass) work10,184,1843,094,394492213,283,50012.07%
Painting work106,305498,6842478607,4670.55%
Demolition work−1,387,8134,651,92118,8403,282,9482.98%
Aggregate and transportation
(Coarse aggregates transportation)
414,541-273,245687,7860.62%
Other work1,630,000--1,630,0001.48%
Equipment installations work (EHP, Boiler, etc.)13,520,21918,319,335538,23632,377,79029.41%
Equipment materials
(Pipe, valve, etc.)
12,264,000--12,264,00011.14%
Total56,205,70651,056,2812,831,718110,093,705100.00%
Table 18. Production cost of green remodeling construction.
ItemsMaterial Cost
(KRW)
Labor Cost
(KRW)
Overhead
(KRW)
Administrative Cost, etc. (KRW)Total
(KRW)
Production cost of construction 56,205,70655,140,78320,651,14774,693,364206,691,000
Table 19. Comparison results of the construction cost based on structural performance improvement and green remodeling items.
Construction Items Total Construction Cost for Separate Construction
(KRW) [A]
Total Construction Cost for Concurrent Proceeding of
Construction
(KRW) [B]
Ratio of Cost
Savings by
Construction Item
[1 − B/A]
Cost Savings by Construction Item
(KRW) [A − B]
Total Ratio of Savings
Temporary work10,479,1049,684,3987.6%794,70616.8%
Reinforced concrete363,575303,24816.6%60,3281.3%
Steel frame2,597,1791,625,83837.4%971,34220.5%
Masonry work6,372,5515,152,72919.1%1,219,82325.7%
Metal work7,298,2445,746,70521.3%1,551,54032.7%
Plastering work134,785133,1531.2%16330.0%
Aggregate and
transportation costs
412,570273,24533.8%139,3252.9%
Total27,658,00822,919,31417.1%4,738,695100.0%
Table 20. Analysis results of construction cost savings for structural performance improvement.
DivisionExisting Cost of Structural Retrofitting
(KRW)
Cost after Excluding Overlapping Items with Green Remodeling (KRW)Total Cost Savings
(KRW)
Ratio of Cost Savings
Production cost of construction23,815,00016,646,6937,168,30730.1%
Table 21. Results of construction cost estimation for comprehensive retrofit projects.
DivisionProduction Cost of Green Remodeling Construction
(KRW)
Production Cost of Structural Retrofitting
(KRW)
Total
(KRW)
Ratio of Cost Savings
[1 − B/A]
Performance improvement projectsSeparation of construction 206,691,00023,815,000230,506,000 [A]3.11%
Concurrent construction206,691,00016,646,693223,337,693 [B]
Table 22. Analysis of the maximum cost savings by process optimization.
Construction Items50% Saving of the Labor Cost
[A] (KRW)
With Process Optimization (100% Saving)
[B] (KRW)
Additional Expected Cost Savings
[B − A] (KRW)
Temporary work794,7061,172,834378,128
Reinforced concrete60,32883,88523,558
Steel frame971,3421,663,744692,403
Masonry work1,219,8232,235,8311,016,009
Metal work1,551,5402,059,767508,228
Plastering work163332651633
Aggregate and
transportation costs
139,325139,325-
Total4,738,6957,358,6512,619,957
Table 23. Public building construction cost for facilities for the elderly in South Korea.
DivisionConstruction Cost (Thousand KRW)
Floor Area (X) < 5000 m23976
5000 m2 ≦ X < 8000 m23912
8000 m2 ≦ X < 10,000 m23820
X > 10,000 m23765
Average3841
Table 24. Results of the cost–benefit analysis.
YearConsumption Cost
(Thousand KRW)
GR Cost Saving
(Thousand KRW) [B − A]
B/C Results after 10 Years [A/B]
Before GR [A]After GR [B]
01,663,000 1,886,000 223,000 0.89
11,667,416 1,888,921 221,505
21,671,730 1,891,775 220,045
31,675,944 1,894,563 218,618
41,680,062 1,897,286 217,225
51,684,084 1,899,947 215,863
61,688,014 1,902,547 214,533
71,691,853 1,905,086 213,233
81,695,603 1,907,567 211,964
91,699,267 1,909,991 210,724
101,702,847 1,912,359 209,512
Table 25. Number of daycare centers based on the type of daycare center from 2018 to 2020.
Types of Daycare Centers201820192020
National/public360243244958
Social welfare foundation137713431316
Incorporated/unincorporated organization, etc.748707671
Private13,51812,56811,510
Home-based18,65117,11715,529
Cooperative164159152
Workplace111111531216
Total39,17137,37135,352
Table 26. Analysis of savings when improving the comprehensive performance of daycare centers subject to green remodeling.
Types of
Daycare Centers
Number of
Daycare Centers as of 2020
Number of
Buildings Subject to Green
Remodeling
Construction Cost (100 million KRW)
Separation of
Construction
Concurrent
Proceeding of
Construction
Cost Savings of Comprehensive Performance
Improvement
National/public49582310 5326 5160 166
Social welfare foundation1316613 1414 1370 44
Corporation, etc.671313 721 698 22
Private11,5105364 12,364 11,979 384
Home-based15,5297237 16,681 16,162 519
Cooperative15271 163 158 5
Workplace1216567 1306 1266 41
Total35,35216,474 37,974 36,793 1181
Table 27. Construction cost of green remodeling.
DivisionConstruction Cost (KRW)
Net construction costMaterial cost61,930,153
Labor cost60,441,224
Overhead cost22,745,228
Administrative and other costs78,221,088
Total construction cost223,337,693
Table 28. Expected social effect of green remodeling.
DivisionConstruction Cost (KRW)Expenditure
(100 million KRW)
CoefficientEmployment Effect (Person)
Personnel expense employment effect83,186,45219220.49733865
Operating expense employment effect140,151,24132380.80002590
Fiscal expenditure on employment effect223,337,6935160-6455
Disclaimer/Publisher’s Note: The statements, opinions and data contained in all publications are solely those of the individual author(s) and contributor(s) and not of MDPI and/or the editor(s). MDPI and/or the editor(s) disclaim responsibility for any injury to people or property resulting from any ideas, methods, instructions or products referred to in the content.