Abstract
An integrated numerical model that describes the operation of a renewable-energy-based system for a building’s heating, cooling, and domestic hot water needs is described in this study. The examined energy system includes a vapor compression multi-source heat pump, PVT collectors, borehole thermal energy storage, and water tanks. Energy balance equations for the collectors and the tanks are coupled with correlations for the heat pump and the piping losses within a thermal network approach. The non-linear system of equations that arises is solved by employing in-house software developed in Python v. 3.7.3. The performance of the numerical tool is validated against measurements collected during the pilot operation of such a system installed in Athens (Greece) for two 5-day periods (summer and winter). It is shown that the proposed model can predict, both qualitatively and quantitatively, the building’s energy system performance, whereas limited deviations from the experimental findings are mostly observed when highly transient phenomena occur. The numerical tool is designed with flexibility in mind and can be easily adapted to accommodate additional energy-system configurations and operational modes. Thus, it can be utilized as a supporting decision tool for new energy systems’ designs and the optimization of existing ones.
1. Introduction
The building sector is a major contributor to energy consumption and greenhouse gas (GHG) emissions, accounting for approximately 40% (around 640 Mton/y) of the primary energy consumption [1] and 25% of the final energy consumption in the European Union (EU) [2]. In addition, buildings are responsible for approximately 36% of EU GHG emissions [3], while the same percentage on a global scale is about 39% [4]. Space heating (SH), space cooling (SC), and domestic hot water (DHW) account for about 75% of all energy use in building stock, with a significant share of this total energy being used for SH and DHW (>20%); total consumption reaches almost 3900 TWh/y [5]. This energy demand is largely met by fossil-fuel-fired boilers, and only 16% is supplied by renewable energy sources [6]. For that reason, the EU has set ambitious energy and climate targets, collectively known as the “2030 Climate and Energy Framework”, with its main objectives being to reduce GHG emissions by 40% compared to 1990 levels, reach a 32% share of renewable energy sources in final energy consumption, and improve energy efficiency by 32.5% [1]. Thus, improvement of energy efficiency and the use of renewable energy sources in buildings are promoted by launching various initiatives, funding programs, and regulations, such as the Energy Performance of Buildings Directive (EPBD).
Heat-pump technology progressively decreases the carbon footprint even further when employing new low Global Warming Potential (GWP) refrigerants, such as natural refrigerants and new generation hydrofluoroolefins (HFOs) with a GWP even lower than 10 [7,8]. By combining heat pumps with other renewable energy sources, such as solar or geothermal energy [9], builders can further increase the coefficient of performance (COP) and reduce running costs, accelerating the switch to clean technologies that reduce fossil fuel consumption and pave the way for carbon neutrality.
The performance of residential energy systems that combine heat pumps with solar energy have been experimentally assessed in several cases. For instance, Fu et al. [10] designed and constructed a photovoltaic (PV) solar-assisted heat-pump (SAHP)/heat-pipe system capable of operating in three different modes, i.e., heat-pipe, solar-assisted HP, and air-source HP, depending on the available solar radiation. The system was tested under the weather conditions of Hong Kong and demonstrated the positive effect of its solar components in overall efficiency. This was also the case with a SAHP system for residential heating in cold climates tested in Erzurum [11]. The system included flat-plate solar collectors, a sensible thermal energy storage tank, and a liquid-to-liquid vapor compression HP. The direct integration of photovoltaic—thermal (PVT) collectors with a vapor compression HP was also experimentally studied [12,13]. The findings showed increased average COP for this system and improved photovoltaic efficiency.
Ground source heat pumps (GSHP) exploit thermal energy stored in the ground and provide highly efficient space heating and cooling due to the relatively constant ground temperature. These systems frequently complement solar energy systems to address the high intermittency of the latter and increase the renewable energy share in buildings, which is an active research field with promising results. In this context, most experimental studies utilize a combination of solar thermal collectors, a GSHP, ground heat exchangers (GHEs), and in some cases, thermal energy storage tanks to meet the heating, cooling, and DHW demands of residential buildings. Many different operational modes of such energy systems have been investigated. In most of the studies, the ground was the main source/sink of the HP that provided space heating/cooling. On the contrary, the solar heat was managed in various ways; it was directed to tanks for DHW production [14] or for energy storage [15], it was used simultaneously with the ground as source for the HP [16], or it was injected to the ground via GHEs for soil temperature recovery and/or solar collectors’ overheating protection [16,17].
The performance of energy systems for buildings that combine heat pumps with renewable energy sources has also been investigated numerically. Simulations can be performed to calculate a variety of quantities and evaluate different energy systems. They have been used indicatively to compare different configurations of SAHPs with storage technologies with respect to high self-consumption of solar energy and minimum system energy demand and installation cost [18], as well as examine the combination of an air–to-water heat pump with PV, PVT, and ST collectors for DHW production with different tapping profiles and configurations [19]. Moreover, three integrated concepts of an air source heat pump with solar thermal collectors for space heating and hot water in London (UK) were also investigated numerically for a single-family house [20], whereby the use of solar thermal collectors with biomass boilers that were integrated with a reversible heat pump/ORC system to support the electricity production when running at combined heat and power mode was assessed [21]. Likewise, the operation of GSHPs with solar energy systems for heating and hot water production in a building in Beijing was simulated and its performance over a 20-year period was investigated [22,23]. Different combinations of a solar-assisted GSHP, including direct expansion (DX) and indirect expansion systems (IDX), for heating, cooling, and DHW needs of a 100 m2 house in Tabriz were also simulated [24]. All the abovementioned studies utilized commercial software (TRNSYS) to model the various energy systems. A study based on artificial neural networks (ANNs) and conventional on-off control strategies performed dynamic simulations in TRNSYS regarding a combination of a GSHP and PVT collectors for the heating and cooling of a single house in Ottawa [25]. Finally, Yang et al. [26], using control-volume method, TDMA, and line iteration algorithms, conducted simulations for the performance evaluation of a solar-assisted GSHP system, considering various operation modes.
The current work presents an integrated numerical model that describes an alternative configuration of a renewable energy-based system for heating, cooling, and DHW production in buildings, as well as its validation. The energy system, which includes a multi-source vapor compression heat pump, PVT collectors, borehole thermal energy storage (BTES), and water tanks for thermal energy storage, is particularly flexible, as it allows for quick adjustments of operational parameters and the heat sources/sinks of the heat pump to maximize its performance based on the system status in each timestep. The non-linear system of equations with dynamic effects that arises is solved by employing in-house software developed in Python v 3.7.3. The integrated numerical model is validated via comparisons against experimental data collected during the pilot operation of such an energy system, which was developed and commissioned in Athens (Greece) to cover the heating and cooling demand and the DHW needs of a 103 m2 building. Comparisons have been performed for two 5-day periods, one in summer, and a second in winter. The proposed numerical tool, designed with long-term flexibility in mind, allows for simple inclusion/exclusion of system components in simulations and easy integration of new or updated models for individual components written in Python, handles any timeframe, and computes a variety of quantities useful for the evaluation of an energy system. Thus, it is particularly suitable for examining in detail the dynamic processes and sizing parameters of various systems concepts and setups, and can be utilized as a supporting decision tool for new energy systems’ designs and the optimization of existing ones.
2. Pilot System Description
A renewable energy-based system has been developed and installed for providing heating and cooling in a single-floor building with a surface area of 103 m2. The installation’s location is on the NCSRD campus in Athens, Greece. The complete system, with all its functionalities, was commissioned at the beginning of 2022, and afterwards it was set into operation. Except for providing heating and cooling to the four fan coils of the building, the DHW consumption was emulated based on a predefined 24-h profile. The energy system is illustrated in Figure 1, with most of its components (e.g., water tanks, air coils, and pumps) installed outdoors, and the rest installed indoors in the containerized control room.
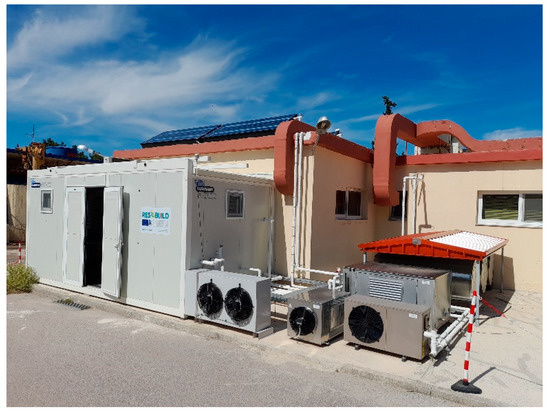
Figure 1.
The installed energy system with outdoor components and its containerized control room.
A multi-source heat pump is the key system component; it can select a different source/sink in order to increase its performance. This selection is accomplished with several three-way valves at the water and refrigerant sides. PVT collectors are included in the system, and ones that produce both heat and electricity and were installed on the building’s rooftop. This heat is used to charge either the DHW tank or the solar buffer, with the latter kept at a lower temperature (below 25 °C), favoring PVT efficiency. This buffer is one of the heat sources of the heat pump, together with a virtual BTES field that resembles a ground heat exchanger. BTES is emulated with a 400-L tank, which is heated or cooled with an air-source heat pump to keep its temperature constant and equal to 18 °C, which is the typical underground temperature at a depth of 80 m in Athens.
There are two heat sinks for the heat pump in heating mode, selected with a three-way valve at the condenser side for charging: (1) a 300-L DHW vertical tank (stratified), or (2) a 400-L horizontal space buffer tank that serves the building’s load.
Overall, the possible sources of the heat pump in heating mode are: (1) heat from the solar buffer, (2) heat from the BTES, and (3) heat from the ambient air. While in cooling mode, the heat sinks are either the BTES or the ambient air.
The system diagram is shown in Figure 2 in heating and cooling modes, indicating typical temperature levels as well as the piping connections and the valves that adjust the operation of the different components for higher flexibility. A brief description of the system’s components and main parameters is given next, while further details can be found in Refs. [9,27].
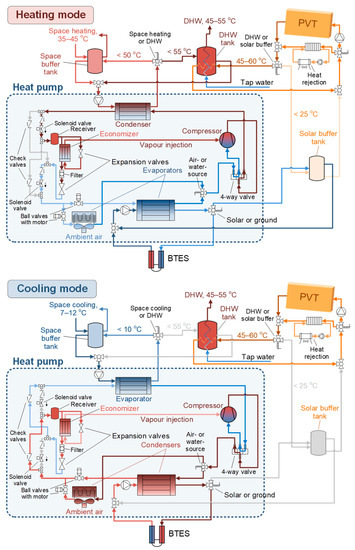
Figure 2.
System layout in heating (top) and cooling (bottom) modes, indicating the main components and valves for flexibility.
2.1. Heat Pump
A vapor compression heat pump is used with a vapor-injection scroll compressor. The evaporator and condenser are both plate heat exchangers, with an additional air coil to allow the air-source/sink operation. The heating capacity is up to about 15 kW and a four-way valve combined with another set of valves are employed to reverse the refrigerant flow from heating to cooling and vice versa (see Figure 2). The refrigerant is an HFO blend, R454C, with a GWP of 148 and zero ODP. A 1.5-L receiver is placed after the set of valves for reversing the economizer flow, and the heat pump is charged with almost 5 kg of refrigerant. The scroll compressor with an economizer port (displacement of 11.7 m3 · h−1 at 50 Hz) is suitable for the standard refrigerant R407C. However, R454C has also been tested, showing a similar performance, and its use has been favored [27]. The superheat of the refrigerant at the suction and economizer line is fixed at 7 K with two electronic expansion valves; the water flow rate at the two HEXs is fixed at a level equal to around 1.65 m3 · h−1.
The installed heat pump in the control room is shown in Figure 3, next to its electric/control panel that handles and logs all the measurements. The DHW tank is shown at the left part, connected with the heat pump condenser.
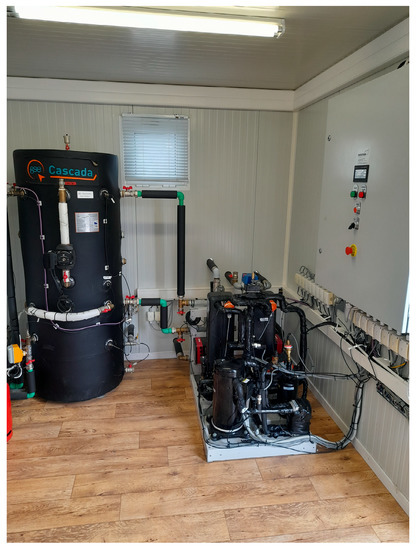
Figure 3.
Heat pump and its electric/control panel in the control room next to the DHW tank.
2.2. PVT Collectors
There are four PVT collectors on the building’s rooftop, installed in two parallel loops (each loop has two collectors in-series), and at a tilt of 31° with a zero azimuth (facing towards the south). The electrical and thermal capacity of each collector is 250 and 1250 W, respectively, and its surface is 2.15 m2. A Wilo pump circulates the water/glycol mixture (concentration of 40% by volume) with a flow rate of about 300 L/h, which slightly varies with temperature. This pump is activated once the temperature difference between the inlet and the outlet from the collectors is more than 1 K. The entire piping circuit of the collectors is made from stainless steel to avoid the corrosion of the aluminum receiver. A solar heat rejection unit equipped with a dry-cooler is placed in a parallel loop to avoid over-heating, and is engaged with a three-way valve once the collector outlet temperature exceeds 85 °C. Further details of the PVT collector and its characterization are provided in Refs. [27,28,29].
2.3. BTES
The ground heat exchanger of a BTES field is emulated with the use of a horizontal 400-L tank. In heating mode, heat is extracted from this tank to resemble the actual process in a BTES that would act as a heat source to the heat pump. The result is a reduction of the tank’s temperature, and then an air-source heat pump operates in heating mode to keep its temperature within the fixed temperature of 18 °C. The reverse process is followed in cooling mode, when heat is injected to this tank.
2.4. Water Tanks
There are three water tanks (excluding the one emulating the BTES) in the system. Two of them can be charged by the PVT collectors via an immersed solar coil: (1) a stratified DHW tank (300-L), and (2) a horizontal solar buffer tank (400-L). The latter is kept at a much lower temperature, acting as a heat source for the heat pump. The DHW tank can also be charged by the heat pump to keep it at a high enough temperature to allow for adequate heating of the hot water. The third tank has a volume of 400-L (identical to the BTES tank), and it serves the heating and cooling loads of the building. It is kept within the required temperature set-points, allowing it to fluctuate in heating mode between 40–46 °C (heat sink of the heat pump condenser) and in cooling mode between 9–12 °C (heat source of the heat pump evaporator).
The DHW tank is shown in Figure 3 (installed indoors), while all others are outdoors and depicted in Figure 4. They are covered with a metal shading to reduce heat gains during summer, which is especially important for the space buffer, which is kept at a temperature below 12 °C.
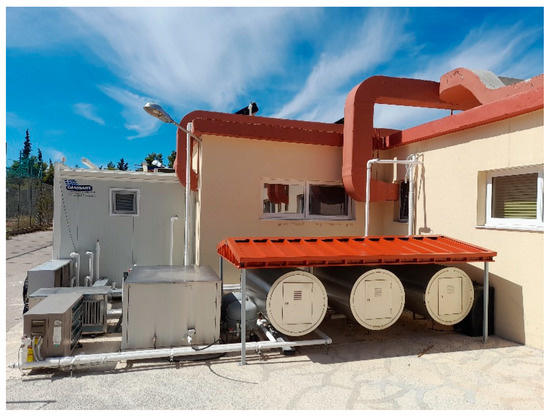
Figure 4.
Outdoor horizontal water tanks under the shade. From left to right: virtual BTES, solar buffer, and space buffer tank.
2.5. Heating and Cooling Demand
There are four fan coils in the four main rooms of the building, each one operated according to its own thermostat and temperature set-point. These set-points vary between day and night, allowing the room temperature to fluctuate within the boundaries shown in Table 1.

Table 1.
Allowed temperature fluctuations based on the room set-points of the building in heating and cooling modes.
The thermostat of each fan coil monitors the room temperature, and in cases where heating or cooling is needed, the circulating water pump increases its speed and flow rate. Therefore, there are four flow-rate steps from the space buffer tank to the fan coils, according to the number of fan coils requesting heating or cooling, from around 1 m3 · h−1 for a single fan coil’s operation up to 2 m3 · h−1, when all four are active.
2.6. Hot Water Demand
As previously mentioned, the same tapping profile is followed every day, according to the EN16147:2017 standard for water heaters, hot water storage appliances, and water heating systems [30]. The medium (“M”) profile of this standard has been used with a hot water demand of 5.845 kWh/day, defining a 24-h tapping profile. This profile is adjusted for the location and per individual months to account for the variations of tap water temperatures across the seasons [31], with the lowest in August (4.58 kWh/day) and the highest in February (6.83 kWh/day).
This profile was then implemented by opening an electronic valve to allow the flow of tap water for specific time periods, resulting in a constant flow rate during those moments. In total, 33 min of tapping are used, which are spread across the day [27], with each tapping cycle lasting 2–4 min.
2.7. Sensors
The system’s operation is monitored by several sensors that measure temperature, pressure, flow rate, power, and solar radiation components. All measurements are logged each minute in the PLC unit of the heat pump, which is equipped with analog-to-digital cards with inputs from the sensors. All sensors, together with their accuracy, are described in Table 2.

Table 2.
Sensors and their accuracy.
The processing of the measured values allows for the extraction of the fluids’ properties and the determination of the thermal flows of the different components. Since large parts of the system are installed outdoors, the circuits are long, since they all go through the pumping box, which houses the water circulators and several three-way valves (see Figure 4, box at the left of the virtual BTES tank); additional temperature sensors have been installed at the beginning and end of the piping lines to measure any water temperature differences. These differences define the heat losses (or heat gains in case of cooling) across the circuit, which become important for some lines even if all piping is well insulated. This process has been followed for all lines, including the circuit of the collectors, in which the largest temperature differences occur.
3. Model Description
In this section the numerical model for all system components, namely, the PVT collectors, the water tanks, and the multi-source heat pump, is described. The main assumptions of the integrated model are that the heat pump operates at steady state without considering its warm-up period, there are no transient terms in the equations that describe the piping losses, and the solar and space buffer tanks are modeled by a single-volume approach (non-stratified).
3.1. Heat Pump
The heat pump has been tested at steady-state conditions and under different heat-source and sink temperatures (both water and ambient air) to extract its performance at various operating conditions [8]. The next step was to apply the equation-fit approach suggested in IEA-SHC-Task 44 [32], identifying the independent variables in a regression analysis. Only two such variables have been concluded, in order to allow a direct integration of this model in the system’s model. Polynomial correlations of different degrees were then developed as functions of the water or air temperature at the evaporator and condenser sides of the heat pump. Although non-linear correlations are slightly more accurate than the linear ones, the latter have been preferred, given that they enhance the stability and the convergence rate of the model.
The heating capacity and COP of the heat pump for heating mode are given next for the water-source (Equations (1) and (2)) and air-source (Equations (3) and (4)) operations, as a function of the outlet water temperature at the condenser and the inlet temperature at the evaporator. The range of validity for heating (with water or air) is: outlet water temperature from the condenser (Tcd,out), 30–60 °C; inlet water temperature to the evaporator (Tev,in), 5–25 °C; and inlet air temperature to the evaporator (Tair,in), 0–30 °C.
Water-source
Air-source
The cooling capacity and COP of the heat pump for cooling mode are given next for water-sink (Equations (5) and (6)) and air-sink (Equations (7) and (8)) operations, as a function of the outlet water temperature at the evaporator and the inlet temperature at the condenser. For cooling (with water or air), the range of validity is: inlet water temperature to the condenser (), 16–40 °C; outlet water temperature from the evaporator (), 3–15 °C; and inlet air temperature to the condenser (Tair,in), 18–40 °C.
Water-sink
Air-sink
The electricity consumption is then calculated from these correlations, which corresponds to the compressor’s electricity demand. The auxiliaries’ power consumption is then added (e.g., water-pumps and fans), which is approximately constant when the heat pump operates (about 230 W). Total power consumption is referred to as the system electricity consumption.
3.2. PVT Collectors
The unsteady heat gain equation, as given by Equation (9), is used to model the PVT collectors [33]. The unsteady term allows for better modeling of heat and electricity production over time, including the low-solar-radiation periods when there is no solar fluid circulation, but a small amount of electricity is still produced.
In Equation (9), is the mean solar fluid temperature in the PVT collector, , are the inlet and outlet fluid temperatures from the collectors, respectively, is the time-step, is the mass flow rate of the water/glycol mixture, and cp,sol is its specific heat capacity. Moreover, is the total PVT collector surface (i.e., 4 collectors with a surface area of each), and is the total effective thermal capacity of the 4 collectors. In the right-hand side of Equation (9), is the heat gain per m2 of the collector given by Equation (10):
where and are the beam (direct) and diffuse radiation components on the tilted collector surface, respectively, is the thermal incidence angle modifier, and is the ambient temperature (outdoor). The thermal efficiency coefficients and correspond to heat acquisition by beam and diffuse irradiation, respectively. These coefficients and the thermal loss parameters, and , are characteristic of the collector and obtained during outdoor testing; they are given in Table 3.

Table 3.
PVT collectors—Efficiency parameters.
The nominal (DC) electrical production per m2 of the PVT collector is given by Equation (11):
where is the standard temperature at test conditions, and are the electrical efficiency coefficients that correspond to electrical production by beam and diffuse irradiation, respectively, is the temperature loss coefficient as given in Table 3, and is the electrical incidence angle modifier.
However, the actual electrical production provided to the AC grid is lower, due to the losses of the solar inverter. This is expressed through the efficiency of the inverter , which was estimated as being equal to 0.95 by matching the calculated with the measured values over a long period during the commissioning phase. Thus, the electrical production per of the PVT collector injected to the grid is given by .
The water/glycol mixture circulating in the PVT circuit has a concentration of glycol of 40% by vol., with anticorrosive additives to protect the aluminum receiver of the PVT collector. The mixture properties (density and specific heat capacity) are given as a function of concentration and temperature, from the available dataset provided by the supplier [34]. Further details of the collector, with its individual performance parameters and modeling features, are provided in Refs. [35,36].
3.3. Water Tanks
3.3.1. Buffer Water Tanks
The modeling approach of the two buffer water tanks is kept simple, since their temperature range is limited, due to the small variation between the inlet and outlet temperatures of the water flows. This makes it possible to model these tanks as a single-volume tank, assuming the same water temperature within the whole tank. This temperature is calculated based on a heat-source and sink approach, considering the heat losses to the ambient. The overall energy balance within each tank of this type is given by Equation (12):
where is the total water mass in the tank, is the water specific heat capacity, and are the (uniform) water temperatures within the BWT in the current and previous timestep, respectively, and are the heat source and sink, respectively, and is the coefficient of the heat losses through the outer surface of the tank.
The expressions for and , as well as the calculation of for the solar and space buffer water tanks, are given next.
Solar Buffer Tank
The solar BWT is charged with low-temperature heat from the collectors, and provides heat to the evaporator of the heat pump. The heat input and output are given by Equations (13) and (14), respectively:
where and are the temperature of the solar fluid in and out the solar coil, respectively, and the temperature of the water from and to the HP evaporator, respectively, and is the mass flow rate of water through the evaporator. In this case, the solar fluid delivers heat to the tank through a coil with efficiency , as given by Equation (15) [37]:
In this case, the temperature of the water flowing to the evaporator is , where and are the temperatures of the solar buffer tank in the current and previous timestep, respectively.
Space Buffer Tank
During winter, the space buffer water tank is coupled with the condenser of the heat pump to store the hot water and be able to supply the space heating network. The heat input and output in the heating mode are provided by Equations (16) and (17), respectively:
where and are the temperature of the water from and to the HP condenser, respectively, is the mass flow rate of water through the condenser, and the temperature of the water to and from the space, respectively, and is the mass flow rate of water to the fan coils of the building.
During summer, the same tank is supplied with chilled water by the heat pump evaporator to be kept cold and cover space-cooling demand. The heat input and output in cooling mode are provided by Equations (18) and (19), respectively:
where and the temperature of the water from and to the evaporator, respectively.
In both cases, the temperature of the water running from the space buffer tank to the heat pump (i.e., to the condenser in winter and to the evaporator during summer) is , whereas the temperature of the water flowing to the fan coils is given by . In these equations, and are the temperatures of the space buffer tank in the current and previous timestep, respectively.
3.3.2. Domestic Hot Water Tank
To account for stratification effects, the DHW tank is modeled by dividing it in a finite number of volumes along its axis, with each volume being characterized by its stored water temperature, [38,39]. Heat transfer occurs between the water volumes, as well as between the stored water and the solar immersed heat exchanger, if present at the specific volume. Moreover, heat is delivered in the tank from the heat pump, while it is rejected by the external heat exchanger that produces the DHW. Additionally, when there is flow of condenser water and/or DHW demand, heat is delivered from the upper to the lower volumes of the tank due to recirculation inside the tank. Ambient heat losses are also included. Considering all these heat and mass transfer processes, the 1-D energy balance applied on the -th volume ( in total) for the stored water is given by Equation (20):
The terms at the right-hand side describe the several instances of heat transfer between the stored water of the -th volume and the solar IHX, the heat pump, the cold-water external heat exchanger, the internal recirculation, the losses to the (indoor) environment, and the heat transfer due to conduction to the previous volume; the description is to , and to the next one, to , respectively. In Equation (20), is the indoor temperature, and the hot-water heat demand.
The parameters ,, and in the above equation indicate the presence/contribution, or not, of the PVT, cold/tap water, heat pump, and recirculation in the energy balance of the -th volume. The value of depends on the height of the solar coil, whereas the values for and depend on the position of the inlet and outlet of the external coil and the heat pump, respectively. The value of is related to the operation of the condenser and the external heat exchanger (EHX) for DHW production, and the position of the inlet and outlet of the latter.
The term is the total heat transfer coefficient of the -th volume, in order to account for the heat losses to the ambient, with being the surface area in contact with the tank walls, and the area of the tank’s cross-section. In addition, the parameter is the effective thermal conductivity, which equals that of the water (i.e., ) if , whereas it assumes very high values (i.e., ) if to account for buoyancy effects. The coefficients and in the previous- and next-volume terms of Equation (20) indicate whether there is a previous/next volume to the current -th volume. If this is true, they are equal to unity, otherwise they are zero and the corresponding term is eliminated. Finally, is the distance of the centers of two consecutive volumes, whereas is the mass of the water in the -th volume.
Based on the geometry of the tank and some test simulations, it was decided to use the computational volumes (CVs) shown in Figure 5 to model the DHW tank of the system. The water from the condenser enters the tank at (5) and exits at (6); thus, and . The solar immersed heat exchanger is contained entirely in CV2, so and . The tank water enters the external IHX at (3) and returns at (4), thus and . As the opening (3) is near the CV0-CV1 boundary, in the recirculation term of Equation (20) is replaced with the mean temperature of these two CVs, i.e., . For DHW production, tap water enters the external IHX at (1) and exits at (2). The necessary heat to cover the DHW demand is removed primarily from CV0 and the remainder from CV1; thus, and , whereas the bottom two CVs are not involved in this process, i.e., . Finally, for the specific tank discretization, the previous- and next-term coefficients are , , and , , respectively.
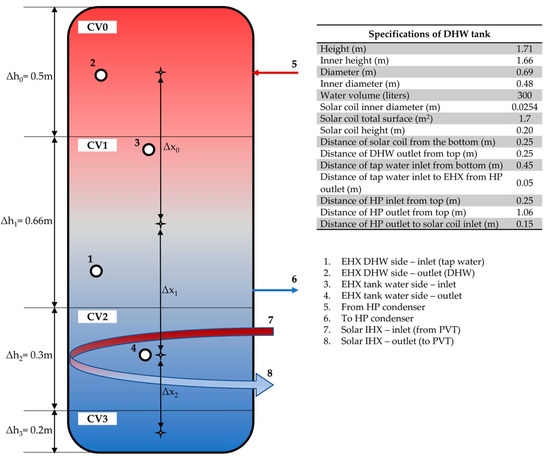
Figure 5.
Sketch of the computational volumes and geometric specifications of the DHW tank.
As the solar IHX is fully contained in CV2, the energy balance of the solar fluid within the immersed heat exchanger is given by Equation (21):
where , are the temperatures of the solar fluid at the inlet (7) and the outlet (8) of the solar IHX, respectively, whereas is the average solar IHX temperature. Moreover, is the mass of the solar fluid in the solar IHX, whereas is the total heat transfer coefficient of the solar IHX.
The temperature of the DHW at the outlet of the external heat exchanger (2) is connected to the temperature of the water at the top of the tank (CV0) through Equation (22) (temperatures in K):
This correlation has been obtained, while tuning the PID controller of the DHW recirculation pump, by setting a target outlet flow temperature of 45 °C and a dT of 1 K. Several measurements have been processed based on many tapping periods, and a fitting process determined for this type of correlation, one that expresses the outlet tap water temperature as a linear function of only one volume temperature close to the temperature sensor.
3.3.3. Calibration of Water Tanks’ Parameters
Total Heat Transfer Coefficient
When a buffer tank is neither charged nor in use, i.e., , Equation (12) is simplified and describes only the tank’s heat loss to the environment and can be used to estimate the overall heat loss coefficient, . This is achieved by minimizing the error between the simulated, , and the measured tank temperature, . The normalized root mean square error () is used for these calculations, as defined by Equation (23):
where is the root mean square error and the mean observable tank temperature. In these equations, is the deviation at timestep k, and N the total number of timesteps used for error calculation.
Using this approach, the overall heat transfer coefficient was estimated for all tanks, working with appropriate experimental measurements, i.e., when each tank was inert during the following periods: (a) solar buffer tank, 4 June 2022 and 5 June 2022; (b) space buffer tank, 17 September 2022 and 18 September 2022; and (c) DHW tank, 13 September 2022 to 20 September 2022. As shown in Figure 6, the normalized root mean square error becomes minimum for equal to , for the solar and the space buffer tank, respectively, and equal to for the DHW tank.
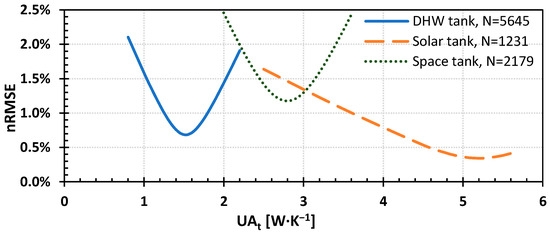
Figure 6.
Normalized RMSE vs. for DHW (continuous), solar buffer (dashed), and space buffer (dotted) tanks.
It should be noted that only the temperature at the top of the tank (CV0) was used for the estimation of its , in order to minimize the effect of the solar coil when the tank was inert, and that the same value of the total heat transfer coefficient () was then used for all four CVs of the tank.
Solar Coil Effectiveness (Solar Buffer Tank)
The effectiveness of the solar coil, (Equation (15)), which was immersed in the solar buffer, was estimated by minimizing the absolute relative error between the calculated thermal energy delivered to the tank by the PVT () and the experimental one () at the same period (Equation (24)).
Outdoor temperature, solar fluid flow rate, and the temperature of the solar fluid when entering the solar buffer coil () were used as inputs to solve the system of equations that describes the solar buffer charging by the PVT. By applying this model for the measurements obtained on 4 June 2022, between 09:30 and 15:00 (continuous charging) for different , the absolute relative error for PVT thermal energy delivered to this tank was then calculated. As shown in Figure 7, this error becomes minimum at (). It is noted that the normalized root-mean-squared errors are less than 1.4% for the various calculated temperatures (i.e., solar coil out and solar buffer temperatures).
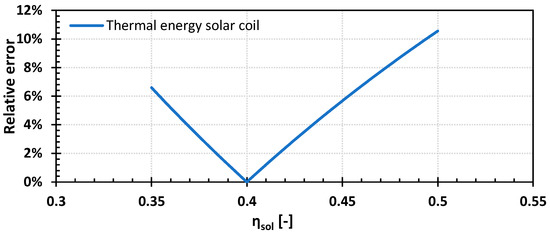
Figure 7.
Relative error (absolute) of thermal energy from PVT delivered in the solar buffer tank vs. the effectiveness of the solar coil, .
Solar Immersed Heat Exchanger Heat Transfer Coefficient (DHW Tank)
Similarly to the methodology used for the solar coil of the solar buffer tank, measurements of solar fluid flow rate and its temperature at the inlet of the solar IHX and DHW demand were used as inputs to solve the system of equations that describes the DHW tank operation between the 15th and 18th of September 2022 for different heat transfer coefficients of the solar IHX, (Equations (20) and (21)), and calculate the absolute relative error for PVT thermal energy delivered to the tank through the solar IHX (Equation (24)). As shown in Figure 8, this error becomes minimum at (). The corresponding relative error for the thermal energy absorbed by the DHW is 3.7%. Moreover, the root-mean-squared relative errors are less than 6.1% for the calculated temperatures (i.e., solar IHX out, DHW tank bottom and buffer, DHW outlet).
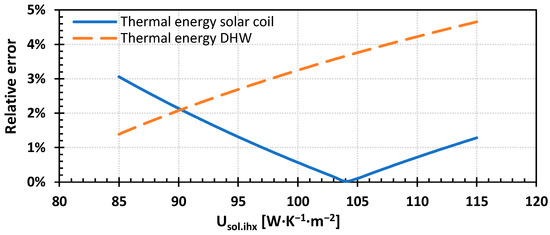
Figure 8.
Relative errors (absolute) of thermal energy from PVT delivered in the DHW tank (continuous) and absorbed by the DHW (dotted) vs. heat transfer coefficient of the solar IHX, .
3.4. Connection/Piping Heat Losses
Experimental observation showed that in some piping lines of the installation, there were significant heat losses. These heat losses were modelled using experimentally derived linear correlations between the involved quantities. In particular, the heat losses from the outlet of the PVT to the inlet of the solar IHX of the DHW tank are expressed as a temperature difference given by Equation (25):
whereas the heat losses/temperature difference in the reverse route, i.e., from the outlet of the solar IHX of the DHW tank to the inlet of the PVT, are given by Equation (26):
Similarly, the losses from the outlet of the PVT to the inlet of the solar coil in the solar buffer tank are given by Equation (27):
Moreover, the heat losses from the outlet of the HP, which is in the containerized control room, to the space buffer tank, which is outdoors, are described by Equation (28):
All other connection/piping losses were found negligible. Finally, the above correlations have been obtained by processing many measurements during steady-state operation, neglecting any transient term and the piping temperature itself.
3.5. Numerical Tool
Equations (1)–(10), (12)–(22) and (25)–(28) define each component of the building’s energy system. To solve the non-linear system of equations which describe the integrated energy system, a numerical tool developed in Python based on a thermal energy networks approach was employed. In short, the tool needs input parameters that describe the sizing and operation of the components, data regarding local solar irradiation, ambient (outdoor) and tap water temperatures, and the building’s DHW and heating/cooling demand. The time-dependent temperatures for all system components are calculated for all timesteps. This in turn allows for the subsequent calculation of a wide variety of quantities that can be used to assess the system’s operation and performance; heat and electricity produced by the PVT, the capacity of the HP, and its electricity consumption so the straightforward estimation of the COP, heat flows in each tank etc. are defined in the desired timeframe (e.g., per timestep, per day, or a specific period of interest).
At the core of its operation is the definition of flags that are based on the operational setpoints and regulate the energy flows within the system in every timestep. There are three types of flags: (a) a flag that controls whether the HP is needed to charge the DHW tank (which has priority), the space buffer tank, or if it was not needed at the specific timestep; (b) a flag that indicates the HP source (or sink, in cooling mode) when it operates, i.e., the BTES, solar buffer tank, or air (in this order); and (c) a flag that controls whether the heat generated by the PVT is directed to the solar buffer, the DHW tank, or rejected to the ambient. Further details of the numerical tool, such as the necessary inputs (e.g., weather data) can be found in Ref. [9].
Finally, the same tool can be also used for sizing purposes, except when from system simulations, as well as for investigating a variety of configurations with different components, especially when the system’s operation is flexible, based on either rule-based control or an even more advanced control. This feature distinguishes it from commercial software, such as TRNSYS, with similar functions, making it a valuable numerical platform for further research or even system design.
4. Results
Data collected during the Athens pilot system testing were used to validate the integrated numerical model for the whole energy system. Two 5-day periods were used for comparison: one during summer, and one during winter. The summer dataset corresponds to measurements from 5 August 2022 to 9 August 2022, when there was demand for DHW and space cooling. The winter dataset corresponds to measurements from 31 December 2022 to 4 January 2023, when there was demand for DHW and space heating.
Measurements of outdoor and tap water temperatures, total and diffuse irradiation, space heating/cooling demand, and DHW demand were used as input data for the simulations and the components’ temperatures were obtained with a 1-min timestep. The model prioritized DHW demand over space heating/cooling demand to regulate the heat pump supply on each timestep. The temperature setpoints for each component of the Athens pilot energy system were set to the same values as in the actual control of the system (space buffer tank allowed to fluctuate between 40–46 °C for heating, 9–12 °C for cooling and 44–50 °C for DHW tank). Next, the simulation results were compared against the test data for both periods.
4.1. Daily Variations
4.1.1. Summer Period: 5 August 2022 to 9 August 2022
Time variation of PVT heat production over the 5-day summer period is shown in Figure 9, as calculated by the measurements and the model. The comparison shows a consistently higher peak heat production in the simulations during midday, when the solar irradiation was the highest. Excluding the midday spikes, the measured daily peak PVT heat was ~2.3 kW, whereas the corresponding calculated value was ~2.6 kW, i.e., 13% higher. This could be attributed to the fact that the model does not consider losses due to dust accumulated on the PVT collector’s surface.
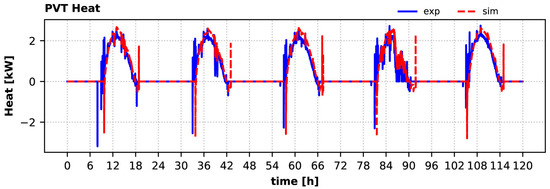
Figure 9.
Heat produced by PVT collectors during the summer period: experiment vs. simulation.
Moreover, the strong dynamic phenomena that occur early in the morning and in the afternoon, when the solar pump starts and stops operating, respectively, are captured by the model. Especially during start-up (at around 08:00 local time), the collectors start producing heat, but due to the losses in the piping, some heat is removed from the DHW (negative values), causing the controller to force the pump to stop. The same effect is also observed in the afternoon, but is much weaker, since the piping is already at a high temperature.
The accurate modeling of these dynamic phenomena requires the use of the transient term of Equation (9), as well as consideration of the piping losses between the components. Both features are included in the model, calculating with a sufficient accuracy all phenomena, as observed in Figure 10, which shows the comparison of the inlet and outlet collector temperatures with the measured values during the day, with the higher fluctuations of solar radiation due to clouds. The relative error for the maximum inlet collector temperature is 4.6% (71.9 °C calculated against 68.8 °C measured), whereas the corresponding error for the outlet collector temperature is 5.9% (78.8 °C calculated against 74.4 °C measured). However, the relative error of the maximum outlet–inlet temperature difference, i.e., , is only 2.4%.
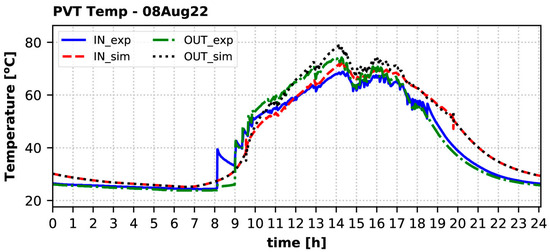
Figure 10.
Temperature of the solar fluid at the inlet (IN) and the outlet (OUT) of the PVT collectors on 8 August 2022: experiment vs. simulation.
During the period that the collectors were active and continually produced heat (from around 08:00 until 14:30), there was a very good match of the inlet and outlet collector temperatures. After that due to clouds, the solar pump started and stopped very frequently, because it was not possible to keep a steady heat production at such a high temperature of more than 65 °C.
Concerning the direction of the solar flow, the calculations showed that the heat produced by the PVT in summer was directed entirely to the DHW tank, which agrees with the experimental data. However, the midday higher heat production resulted in higher temperatures of the DHW tank (i.e., temperatures of the top water volume (CV0) in Figure 5) in these hours, as demonstrated in Figure 11. The relative error for the daily maximum DHW tank temperature varies from 2.4% (4th day) to 5.7% (5th day), whereas the corresponding error for daily average tank temperature varies from −3% (4th day) to 1.2% (2nd day). The heat provided by the collectors was sufficient to keep the DHW tank hot enough to cover the DHW’s demand without the need of additional heat from the heat pump, as was observed in the experiments. The same holds for the simulation, except as to the early morning hours of 9 August 2022, when the HP had to operate to charge the DHW tank for a few minutes (the previous day was cloudy, reducing the heat production of the collectors), before the collectors started to charge the tank.
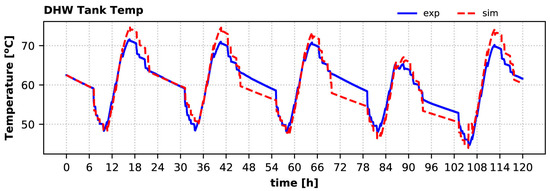
Figure 11.
DHW tank temperature (top) during the summer period: experiment vs. simulation.
During the summer period, there was a significant amount of space cooling demand. The HP evaporator removed heat from the space buffer tank (maintaining its temperature within the setpoints) from which cold water was running in the fan coils of the building according to the signals from four controllable thermostats placed in each main room. In Figure 12, the heat removed by the evaporator (EV) from the space buffer tank is given. The model results are in good agreement with the experimental measurements. Excluding the measured negative flows, the measured mean heat absorbed by the evaporator was ~10.9 kW, whereas the calculated value is ~10.4 kW, i.e., 4.6% lower. It is notable that the negative values of heat based on the measurements were during the start-up phase, when the (outdoor) piping was still warm.
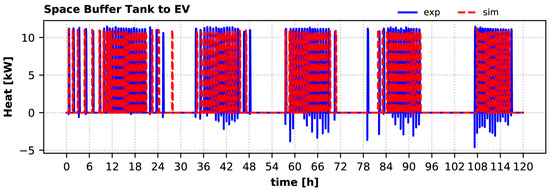
Figure 12.
Heat removed from the space buffer tank by the HP evaporator’s variation during the summer period: experiment vs. simulation.
The temperature variation of the space buffer tank temperature during the summer period is well within the setpoints and in agreement with the test results, as shown in Figure 13. The calculated average daily tank temperature is ~3% lower than the measured one. Moreover, the timing of heat pump operation matches the tested system operation with minor variations. A small overshoot of the measured tank temperature above 12 °C was due to the start-up delay of the heat pump of around 2 min. Such a delay is not included in the system model, which engages the heat pump operation the next timestep after the tank temperature is above the maximum setpoint.
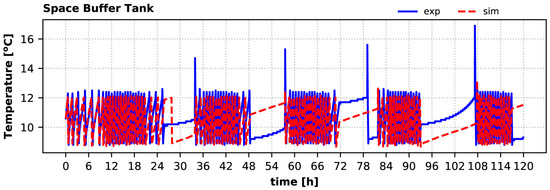
Figure 13.
Space buffer tank temperature variation during the summer period: experiment vs. simulation.
4.1.2. Winter Period: 31 December 2022 to 4 January 2023
The calculated variation of PVT heat production over the 5-day winter period is in very good agreement with the experimentally measured one as shown in Figure 14, similarly to the summer period case. During this period the measured peak heat production varied from 2.2 kW (second day) to 2.7 kW (third day). The highest relative error for peak heat production was 5.1% during the second day, when solar irradiation variance was high. The model predicts that this heat should always be delivered to the solar buffer tank, as was the case during testing. Moreover, the model predicts that the solar pump should start operating about 1 h before the actual system, but in that case, it could not keep a positive temperature difference, leading to the removal of a small amount of heat from the tank (negative heat value).
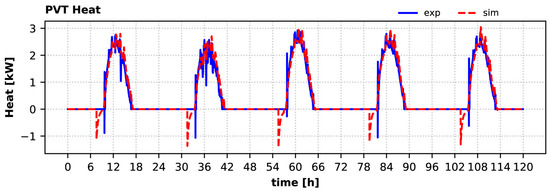
Figure 14.
Heat produced by the PVT during the winter period: experiment vs. simulation.
The stronger dynamic phenomena were observed during the second day of this period, when it was partially cloudy after early noon, showing the start-up phase more clearly in Figure 15. The measured maximum inlet collector temperature was 29.7 °C, whereas the calculated is 31.4 °C (relative error 8.2%). The corresponding values are 37 °C and 39.6 °C for the measured and calculated maximum outlet temperatures, respectively (relative error 6.9%). The relative error of the maximum outlet–inlet temperature difference is 7.7%. The temperature calculations lead to some preheating of the collector fluid to 12 °C by 08:30, exploiting some heat of the solar buffer, while the solar pump is predicted to maintain the heat production after 09:40, as aligned with the measured data.
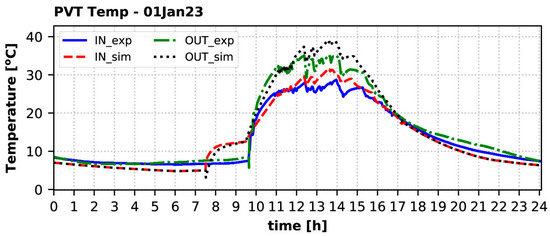
Figure 15.
Temperature of the solar fluid at the inlet (IN) and the outlet (OUT) of the PVT collectors on 1 January 2023: experiment vs. simulation.
The outcome is that the calculated solar buffer tank temperature closely follows the measured one (Figure 16) and the tank during noon was highly charged (with a maximum of 25 °C). The relative error for the maximum tank temperature varies from −1.3% (5th day) to 6.5% (3rd day), whereas the corresponding error for the average daily tank temperature is up to 2% (2nd day). This allows for occasional use of this tank, instead of BTES, as the heat source for the heat pump, to improve the COP and increase the heating capacity. This fact was also experimentally observed.
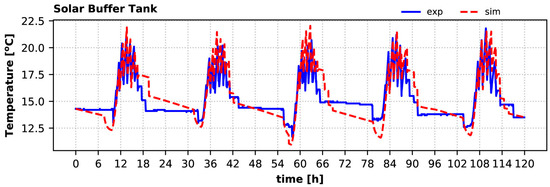
Figure 16.
Solar buffer tank temperature variation during the winter period: experiment vs. simulation.
During this 5-day winter period, the experimental observations showed that the collectors did not provide any heat to the DHW tank; thus, the heat pump was needed to keep the tank within the appropriate temperature range for DHW production. This was also perfectly aligned with the findings of the simulation. Time variation of the heat provided by the HP condenser to the DHW tank over the 5-day winter period is shown in Figure 17 as experimentally measured and calculated by the model. The calculated heat when the HP charges the DHW tank agrees with the measurements, however the model predicts fewer timesteps in which the DHW tank needs additional heat from the HP and at different times. The measured mean heat delivered to the tank by the condenser is ~14.7 kW, whereas the calculated is ~15.3 kW, i.e., 4.1% higher.
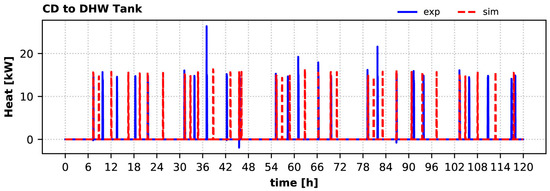
Figure 17.
Heat provided by the HP condenser to the DHW tank during the winter period: experiment vs. simulation.
Calculated and experimental hot water tank temperatures are given in Figure 18. The sharp increases of this temperature correspond to the HP condenser’s operation for charging this tank. Although the calculated buffer temperature variation does not coincide with the experimental, it is kept well within the setpoints (allowing a small overshoot beyond the 50 °C threshold, since the flag is set at the beginning of each timestep), and the tank fully covers the DHW demand during winter. The calculated daily maximum DHW tank temperature is up to 1.9% lower than the measured value (second day), whereas the relative error for the daily average tank temperature varies from −0.2% (first day) to 2.6% (second day).
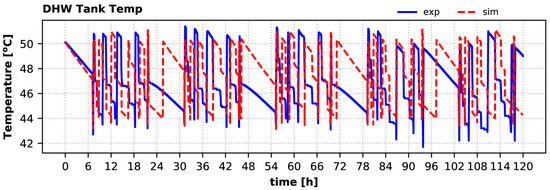
Figure 18.
Domestic hot water tank buffer temperature variation over the winter: experiment vs. simulation.
When the DHW tank does not need additional heat, the HP condenser provides heat to the space buffer tank for the system (if requested) to also cover the building’s heat demand in the winter period. The charging process of the space buffer tank by the heat pump is shown in Figure 19. The model estimations agree well with the experimental observations. The calculated mean heat delivered to the space buffer tank by the condenser is up to 2.7% lower than the measured one (14.2 kW calculated against 14.6 kW measured, third and fourth days) Once again, the negative heat values are caused during start-up, when the return piping is still cold.
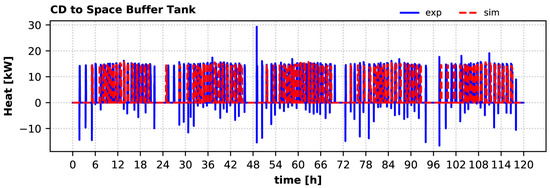
Figure 19.
Heat provided by the HP condenser to the space buffer tank during the winter period: experiment vs. simulation.
The heat provided by the heat pump during this period is adequate to always maintain the space buffer tank temperature within the setpoints and in good agreement with the corresponding measured temperature (Figure 20). The daily average tank temperature relative error varies from −1.5% (first day) to 0.4% (fifth day). Space heating demand is covered fully during the winter period, and this was confirmed by the model, as well.
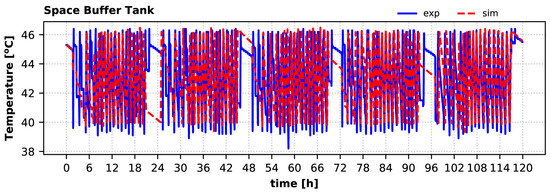
Figure 20.
Space buffer tank temperature variation during the winter period: experiment vs. simulation.
4.2. Cumulative Daily Energy
4.2.1. Summer Period: 5 August 2022 to 9 August 2022
The calculated daily thermal energy and electricity produced by the PVT collectors are given in Figure 21 for the summer period, as against the experimentally derived ones. Simulation consistently overestimates PVT production by 5–14% for thermal energy (the highest divergence occurring on 8 August 2022, when there were few clouds and perhaps the diffuse radiation impacted this more) and by 10–11% for electricity. This overestimation could be attributed with a high degree of confidence to the dust on the PVT collectors, which is not considered in the model. However, the effect of dust on performance is being examined at the moment, and it could be included in a future version of the model.
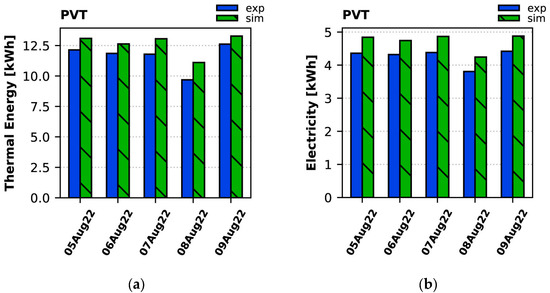
Figure 21.
Daily production of (a) thermal energy and (b) electricity by the PVT collectors during the summer period: experiment vs. simulation.
The daily thermal energy removed by the heat pump from the space buffer tank for cooling and the total electricity consumption of the HP (i.e., HP compressor and auxiliaries’ consumption) are given in Figure 22 for the summer period. The model calculates higher thermal energy absorption for all days, as compared to the experiment, by 5–13%, whereas the calculated electricity consumption agrees well with the measured one (varies by −3 to 5%).
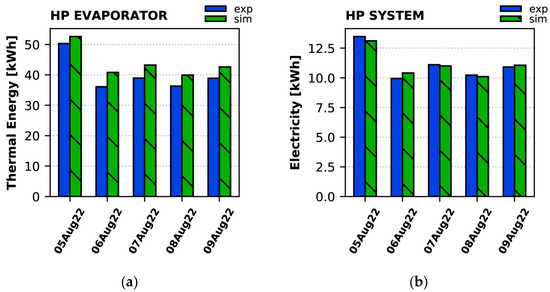
Figure 22.
Daily (a) heat removed by the HP evaporator, and (b) total electricity consumption of the HP during the summer period: experiment vs. simulation.
4.2.2. Winter Period: 31 December 2022 to 4 January 2023
In Figure 23 the calculated daily thermal energy and electricity produced by the PVT collectors are given for the winter period against the experimentally derived ones. Simulation consistently overestimates PVT production by up to 6% for thermal energy and by 17–18% for electricity, in the same way as in the summer period.
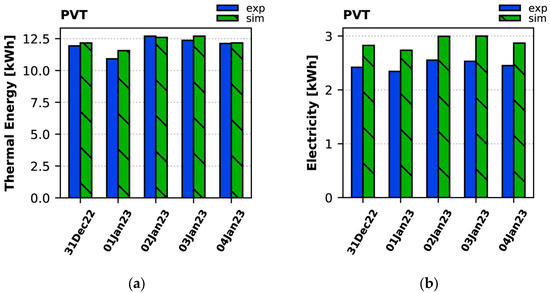
Figure 23.
Daily production of (a) thermal energy and (b) electricity by the PVT collectors during the winter period: experiment vs. simulation.
The daily thermal energy provided by the heat pump and its total electricity consumption (i.e., HP compressor and auxiliaries consumption) are given in Figure 24. The model calculates lower thermal energy production for all days, as compared to the tests, by up to 5%, whereas the calculated electricity consumption is up to 10% lower than the measured one.
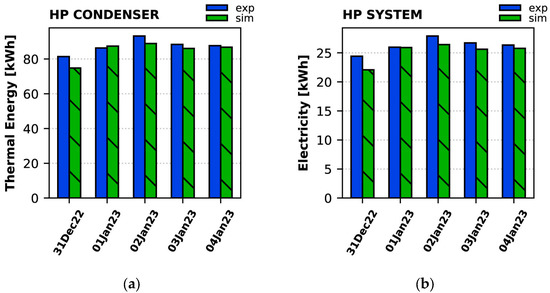
Figure 24.
Daily (a) production of thermal energy by the heat pump, and (b) total electricity consumption of the HP during the winter period: experiment vs. simulation.
5. Discussion
In Table 4 an overview of the integrated energy system model performance for the Athens pilot operation is shown. The total thermal energy from PVT collectors and HP to the tanks, the electricity produced by the collectors and consumed by the HP, and the average COP are given for both examined periods (summer and winter). Moreover, the system’s self-consumption, that is, the share of the produced electricity consumed to cover energy needs on site, and the renewable energy share, i.e., the contribution of renewable energy to the total energy demand, are included.

Table 4.
Overview of the integrated energy system model performance (HP duty is negative for cooling).
The model estimates 8.7% and 1.9% higher PVT thermal energy production and 10.7% and 17.2% higher electricity production than the experimental ones during summer and winter periods, respectively, as discussed in the previous sections. The variation of the simulated performance is introduced due to the unsteady effects during the start-up operation in the morning, when the solar pump is switched on, and there is a chance that it will stop operating if there is not a positive temperature difference (i.e., negative heat gain from the collector). This is the case when the stainless steel piping is still cold, and a significant amount of heat is used to warm up the circuit. Periods of clouds throughout the day can also result in transient phenomena because of sharp fluctuations in solar fluid flow rate. Aside from that, dust accumulated on the glazing could have a small impact, since the collectors are not cleaned every day, in an attempt to approach the operation of a real system. The collectors supply only the DHW tank in the summer period and only the solar buffer tank in the winter period; however these tanks receive lower amounts of heat due to connection/piping losses. These piping losses also have an important effect on the charging process of the space buffer by the heat pump.
The relative error of the calculated to the measured HP heat absorbed by the space buffer tank during summer is equal to 2.3%, whereas during winter, values equal −3% and −4.3% for the HP heat supplied to the space buffer tank and the DHW tank, respectively. Moreover, the relative error for the compressor’s electricity consumption is equal to 2.5% in summer and −3.3% in winter. The corresponding error for the total HP electricity consumption equals 0% in summer and −4.2% in winter. These small variations on both heat and electricity are highly relevant to the start-up phase of the heat pump, when its inverter gradually increases the frequency up to 35 Hz, operating at that speed for some seconds and then accelerating to 50 Hz. On the other hand, the model considers that the heat pump operates at once at 50 Hz, with this transient phase not accounted for.
The deviation of the COP during summer is related only to the inaccuracy of the heat loss calculations, which greatly affects the charging process of the space buffer. The temperature correlations that describe these losses (or gains) have been developed based on measurements at steady-state operation, without including any transient term. Moreover, heat removed from the space buffer tank was about the same, indicating the reliability of the model for such demanding simulation tasks.
In addition, the calculated self-consumption was found to be 13% lower than the experimental in both seasons, as the model predicts that the HP would operate slightly less, compared to the experimental findings. On the other hand, the renewable energy share as calculated from the model is in good agreement with the one estimated from the measurements in both periods. The high values of this share indicate that the potential of the integrated system to decarbonize the energy use in buildings is significant and could have been even higher in cases in which more collectors, or even PV panels, had been included. This would also increase the self-consumption indicator during both periods.
6. Conclusions
A numerical model has been developed to simulate the operation and performance of an experimental energy system for a small building in Athens, Greece. The numerical model combines the energy balance equations for the PVT collectors and the water tanks with correlations for the heat pump operation and the piping losses. The corresponding integrated numerical tool in Python requires several input parameters: building’s space heating/cooling demand and DHW needs, location-specific solar irradiation and outdoor temperature data, and sizing and operating parameters. The components’ sizing is included in the software through a variety of parameters, e.g., tank volumes, external surface areas, and PVT collectors’ surface area for the sizing, and specifications such as heat transfer coefficient for the tanks’ outer wall or the immersed heat exchangers, and glycol concentration in the solar fluid. Such parameters can be given by the manufacturer, obtained experimentally, found in the literature, or by a combination of these. Moreover, operational parameters are mostly introduced by imposing constraints on the operation of the different components. The key operational parameters are those that control in each timestep the operation of the heat pump and the selection of its source/sink (i.e., ground, solar buffer tank, or air), and the direction of the PVT flow (i.e., solar buffer tank or DHW tank). The model parameters have been fine-tuned to account for the components used in the experimental renewable energy-based energy system, and the rule-based control features have been aligned with the actual control settings.
The software was designed with long-term flexibility in mind: easy inclusion/exclusion of system components, ease of components’ equations’ updates/changes, inputs all assigned to changeable parameters that are controlled by the user in a simple input file, ability to handle any timeframe (e.g., a day, months, or years), and ability easily to calculate a variety of quantities during post-processing (power, efficiencies, stored thermal energy, COP, etc.) at each time-step or over a time period of interest. The type and extent of changes in the numerical tool needed to simulate a different building and/or energy system depend on what kind of changes in the building’s energy system will be applied. For example, different space heating/cooling demands can be easily accommodated by using a scaling factor for the heat pump output and/or changing the size of the space buffer tank. Providing local solar irradiation and outdoor temperature data, simulations for different locations can be performed. The effect of PVT collectors’ surface area is studied easily by increasing or decreasing the number of collectors through the corresponding parameter in the input file. The same can be done for all sizing parameters of the energy system components, such as the tank volume. The operation of the system is managed by a Python module that incorporates the control features of the energy system as desired. Through this module, implementation of different operational modes or configurations can be as simple as changing an input parameter that indicates if, e.g., BTES or the solar buffer tank are considered in the simulation or not, and/or changing the temperature limits of the tanks (i.e., set-points). Finally, it is also straightforward for a Python user to update the heat pump’s correlations if an entirely new one needs to be numerically tested. All these characteristics render the numerical tool especially useful for conducting parametric studies, e.g., for system design, components’ sizing, and control testing for maximization of self-consumption and/or renewable energy share depending on a building’s DHW and heating/cooling demands and location. Such a numerical tool can be a valuable support decision tool in practice. It can be used for extensive and in-depth analysis of a building’s energy system prior to construction for evidence-based case-specific design and implementation. It can also be applied to existing energy systems to identify problematic areas and indicate solutions to increase their efficiency.
Overall, the simulation results show that the developed model can predict, both qualitatively and quantitatively, the building’s energy-system performance, as well as the operating modes that have been followed per period and during the day. The deviations of the calculations compared with the measured values are less than 5–10% in most of the cases, and could have been even lower in cases in which the PV inverter’s efficiency has been fine-tuned for the specific periods (around 0.85 would eliminate any PV electricity difference). This efficiency indicator has been calibrated under the early stages of operation (equal to 0.95), whereas the two testing periods were many months after that. The various deviations from the experimental findings, mostly of the thermal energy flows, which are especially prominent early in the morning when the system operation starts (e.g., solar pump running, adjustment of room setpoint requesting more heating or cooling), are mostly because of the highly transient phenomena that the model now treats with a simple approach (e.g., piping losses), but efforts are being made to incorporate these factors once a reliable model becomes available and generalized for various installations. Moreover, the discrepancies in PVT performance attributed to the accumulation of dust on the collectors will also be studied in future works. Efforts will also be made to replace the DHW and the connection/piping heat losses correlations with the appropriate equations which describe the physical phenomena involved.
Author Contributions
Conceptualization, methodology, software, validation, writing—original draft preparation, review and editing, M.P.; validation, writing—original draft preparation, review and editing, G.K.; validation, writing—original draft preparation, G.M. All authors have read and agreed to the published version of the manuscript.
Funding
This research was funded by the RES4BUILD project (Renewables for Clean Energy Buildings in a Future Power System)—Horizon 2020 program, Grant Agreement no. 814865.
Data Availability Statement
The data presented in this study are openly available in Zenodo at https://doi.org/10.5281/zenodo.8012958 (accessed on 7 June 2023).
Conflicts of Interest
The authors declare no conflict of interest. The funders had no role in the design of the study; in the collection, analyses, or interpretation of data; in the writing of the manuscript; or in the decision to publish the results.
References
- European Environment Agency. EEA Report No10/2022. Trends and Projections in Europe 2022. Available online: https://www.eea.europa.eu/publications/trends-and-projections-in-europe-2022 (accessed on 11 May 2023).
- Bertoldi, P.; Diluiso, F.; Castellazzi, L.; Labanca, N.; Serrenho, T. Energy Consumption and Energy Efficiency Trends in the EU-28 2000–2015; JRC Report; European Commission: Brussels, Belgium, 2018. [Google Scholar]
- European Environment Agency. EEA Report No 6/2019. Annual European Union Greenhouse Gas Inventory 1990–2017 and In-ventory Report 2019 (EEA Report No 6/2019). Available online: https://www.eea.europa.eu/publications/european-union-greenhouse-gas-inventory-2019/download (accessed on 11 May 2023).
- Ahmed Ali, K.; Ahmad, M.I.; Yusup, Y. Issues, Impacts, and Mitigations of Carbon Dioxide Emissions in the Building Sector. Sustainability 2020, 12, 7427. [Google Scholar] [CrossRef]
- Pezzutto, S.; Croce, S.; Zambotti, S.; Kranzl, L.; Novelli, A.; Zambelli, P. Assessment of the Space Heating and Domestic Hot Water Market in Europe—Open Data and Results. Energies 2019, 12, 1760. [Google Scholar] [CrossRef]
- Marina, G.; Cyril, R.-L.; Uwe, G.; Vincent, A. Efficient District Heating and Cooling Markets in the EU: Case Studies Analysis, Replicable Key Success Factors and Potential Policy Implications; Publications Office of the European Union: Luxembourg, 2016. [Google Scholar]
- Meramveliotakis, G.; Kosmadakis, G.; Karellas, S. Methods based on a semi-empirical model for simulating scroll compressors with HFC and HFO refrigerants. Open Res. Eur. 2022, 1, 148. [Google Scholar] [CrossRef]
- Meramveliotakis, G.; Kosmadakis, G.; Karellas, S. Identifying the performance and losses of a scroll compressor with vapour injection and R1234ze(E). Open Res. Eur. 2022, 2, 49. [Google Scholar] [CrossRef]
- Pilou, M.; Kosmadakis, G.; Meramveliotakis, G.; Krikas, A. Towards a 100% renewable energy share for heating and cooling in office buildings with solar and geothermal energy. Sol. Energy Adv. 2022, 2, 100020. [Google Scholar] [CrossRef]
- Fu, H.D.; Pei, G.; Ji, J.; Long, H.; Zhang, T.; Chow, T.T. Experimental study of a photovoltaic solar-assisted heat-pump/heat-pipe system. Appl. Therm. Eng. 2012, 40, 343–350. [Google Scholar] [CrossRef]
- Bakirci, K.; Yuksel, B. Experimental thermal performance of a solar source heat-pump system for residential heating in cold climate region. Appl. Therm. Eng. 2011, 31, 1508–1518. [Google Scholar] [CrossRef]
- Ji, J.; Pei, G.; Chow, T.; Liu, K.; He, H.; Lu, J.; Han, C. Experimental study of photovoltaic solar assisted heat pump system. Sol. Energy 2008, 82, 43–52. [Google Scholar] [CrossRef]
- Xu, G.; Zhang, X.; Deng, S. Experimental study on the operating characteristics of a novel low-concentrating solar photovoltaic/thermal integrated heat pump water heating system. Appl. Therm. Eng. 2011, 31, 3689–3695. [Google Scholar] [CrossRef]
- Trillat-Berdal, V.; Souyri, B.; Fraisse, G. Experimental study of a ground-coupled heat pump combined with thermal solar collectors. Energy Build. 2006, 38, 1477–1484. [Google Scholar] [CrossRef]
- Wang, X.; Zheng, M.; Zhang, W.; Zhang, S.; Yang, T. Experimental study of a solar-assisted ground-coupled heat pump system with solar seasonal thermal storage in severe cold areas. Energy Build. 2010, 42, 2104–2110. [Google Scholar] [CrossRef]
- Yang, W.; Sun, L.; Chen, Y. Experimental investigations of the performance of a solar-ground source heat pump system operated in heating modes. Energy Build. 2015, 89, 97–111. [Google Scholar] [CrossRef]
- Dai, L.; Li, S.; DuanMu, L.; Li, X.; Shang, Y.; Dong, M. Experimental performance analysis of a solar assisted ground source heat pump system under different heating operation modes. Appl. Therm. Eng. 2015, 75, 325–333. [Google Scholar] [CrossRef]
- Pinamonti, M.; Baggio, P. Energy and economic optimization of solar-assisted heat pump systems with storage technologies for heating and cooling in residential buildings. Renew. Energy 2020, 157, 90–99. [Google Scholar] [CrossRef]
- Martorana, F.; Bonomolo, M.; Leone, G.; Monteleone, F.; Zizzo, G.; Beccali, M. Solar-assisted heat pumps systems for domestic hot water production in small energy communities. Sol. Energy 2021, 217, 113–133. [Google Scholar] [CrossRef]
- Yang, L.W.; Hua, N.; Pu, J.H.; Xia, Y.; Zhou, W.B.; Xu, R.J.; Yang, T.; Belyayev, Y.; Wang, H.S. Analysis of operation performance of three indirect expansion solar assisted air source heat pumps for domestic heating. Energy Convers. Manag. 2022, 252, 115061. [Google Scholar] [CrossRef]
- Palomba, V.; Borri, E.; Charalampidis, A.; Frazzica, A.; Karellas, S.; Cabeza, L.F. An Innovative Solar-Biomass Energy System to Increase the Share of Renewables in Office Buildings. Energies 2021, 14, 914. [Google Scholar] [CrossRef]
- Chen, X.; Yang, H. Performance analysis of a proposed solar assisted ground coupled heat pump system. Appl. Energy 2012, 97, 888–896. [Google Scholar] [CrossRef]
- Xi, C.; Lin, L.; Hongxing, Y. Long term operation of a solar assisted ground coupled heat pump system for space heating and domestic hot water. Energy Build. 2011, 43, 1835–1844. [Google Scholar] [CrossRef]
- Nouri, G.; Noorollahi, Y.; Yousefi, H. Designing and optimization of solar assisted ground source heat pump system to supply heating, cooling and hot water demands. Geothermics 2019, 82, 212–231. [Google Scholar] [CrossRef]
- Entchev, E.; Yang, L.; Ghorab, M.; Rosato, A.; Sibilio, S. Energy, economic and environmental performance simulation of a hybrid renewable microgeneration system with neural network predictive control. Alex. Eng. J. 2018, 57, 455–473. [Google Scholar] [CrossRef]
- Yang, W.B.; Shi, M.H.; Dong, H. Numerical simulation of the performance of a solar-earth source heat pump system. Appl. Therm. Eng. 2006, 26, 2367–2376. [Google Scholar] [CrossRef]
- Meramveliotakis, G.; Kosmadakis, G.; Pilou, M.; Karellas, S. Testing a Flexible Configuration of a Solar-Assisted Heat Pump with PVT Collectors for Domestic Hot Water Production. In Proceedings of the EuroSun 2022—ISES and IEA SHC Conference on Solar Energy for Buildings and Industry, Kassel, Germany, 25–29 September 2022. [Google Scholar]
- Hosouli, S.; Cabral, D.; Gomes, J.; Kosmadakis, G.; Mathioulakis, E.; Mohammadi, H.; Loris, A.; Naidoo, A. Performance Assessment of Concentrated Photovoltaic Thermal (CPVT) Solar Collector at Different Locations. In Proceedings of the SWC 2021: ISES Solar World Congress, Virtual, 25–29 October 2021. [Google Scholar] [CrossRef]
- Hosouli, S.; Gomes, J.; Talha Jahangir, M.; Pius, G. Performance Evaluation of Novel Concentrating Photovoltaic Thermal Solar Collector under Quasi-Dynamic Conditions. Solar 2023, 3, 195–212. [Google Scholar] [CrossRef]
- Directive 2009/125/EC of the European Parliament and of the Council with Regard to Ecodesign Requirements for Water Heaters and Hot Water Storage Tanks, EU Regul. No 814/2013. Available online: https://eur-lex.europa.eu/eli/reg/2013/814/2017-01-09 (accessed on 2 August 2013).
- Pilou, M.; Kosmadakis, G.; Meramveliotakis, G.; Krikas, A. Renewable Energy Based Systems with Heat Pumps for Supplying Heating and Cooling in Residential Buildings. In Proceedings of the 34th International Conference on Efficiency Cost, Optimization, Simulation and Environmental Impact of Energy Systems—ECOS2021, Taormina, Italy, 27 June–2 July 2021. [Google Scholar]
- Carbonell Sánchez, D.; Cadafalch Rabasa, J.; Pärlisch, P.; Consul Serracanta, R. Numerical analysis of heat pumps models: Comparative study between equation-fit and refrigerant cycle based models. In Proceedings of the Solar Energy for a Brighter Future: Book of Proceedings: EuroSun 2012, Rijeka, Croatia, 18–20 September 2012. [Google Scholar]
- Carbonell, D.; Cadafalch, J.; Consul, R. Dynamic modelling of flat plate solar collectors. Analysis and validation under thermosyphon conditions. Sol. Energy 2013, 89, 100–112. [Google Scholar] [CrossRef]
- Tyfocor, Tyfocor L Technical Information. Available online: https://tyfo.de/downloads/TYFOCOR-L_en_TI.pdf (accessed on 11 May 2023).
- Gomes, J.; Diwan, L.; Bernardo, R.; Karlsson, B. Minimizing the impact of shading at oblique solar angles in a fully enclosed asymmetric concentrating PVT collector. Energy Procedia 2014, 57, 2176–2185. [Google Scholar] [CrossRef]
- Ricardo, B. Measurements of the Electrical Incidence Angle Modifiers of an Asymmetrical Photovoltaic/Thermal Compound Parabolic Concentrating-Collector. Engineering 2013, 5, 37–43. [Google Scholar] [CrossRef]
- Cadafalch, J.; Carbonell, D.; Consul, R.; Ruiz, R. Modelling of storage tanks with immersed heat exchangers. Sol. Energy 2015, 112, 154–162. [Google Scholar] [CrossRef]
- Raccanello, J.; Rech, S.; Lazzaretto, A. Simplified dynamic modeling of single-tank thermal energy storage systems. Energy 2019, 182, 1154–1172. [Google Scholar] [CrossRef]
- Rahman, A.; Smith, A.D.; Fumo, N. Performance modeling and parametric study of a stratified water thermal storage tank. Appl. Therm. Eng. 2016, 100, 668–679. [Google Scholar] [CrossRef]
Disclaimer/Publisher’s Note: The statements, opinions and data contained in all publications are solely those of the individual author(s) and contributor(s) and not of MDPI and/or the editor(s). MDPI and/or the editor(s) disclaim responsibility for any injury to people or property resulting from any ideas, methods, instructions or products referred to in the content. |
© 2023 by the authors. Licensee MDPI, Basel, Switzerland. This article is an open access article distributed under the terms and conditions of the Creative Commons Attribution (CC BY) license (https://creativecommons.org/licenses/by/4.0/).