Article

Impedance Spectroscopy Analysis of Perovskite Solar Cell Stability

by
Ilaria Matacena
1,*,
Pierluigi Guerriero
1,*,
Laura Lancellotti
2,
Brigida Alfano
2,
Antonella De Maria
2,
Vera La Ferrara
2,
Lucia V. Mercaldo
2,
Maria Lucia Miglietta
2,
Tiziana Polichetti
2,
Gabriella Rametta
2,
Gennaro V. Sannino
2,
Paola Delli Veneri
2 and
Santolo Daliento
1
1
Department of Electrical Engineering and Information Technology, University of Naples Federico II, 80125 Naples, Italy
2
ENEA Portici Research Center, 80055 Portici, Italy
*
Authors to whom correspondence should be addressed.
Energies 2023, 16(13), 4951; https://doi.org/10.3390/en16134951
Submission received: 15 March 2023 / Revised: 19 May 2023 / Accepted: 20 June 2023 / Published: 26 June 2023
(This article belongs to the Special Issue Advances on Solar Energy and Photovoltaic Devices)

Abstract

:
The aim of this work is to investigate the degradation of perovskite solar cells (PSCs) by means of impedance spectroscopy, a highly sensitive characterization technique used to establish the electrical response of a device in a nondestructive manner. In this paper, PSCs with two different electron transport layers (ETLs) are studied: PSCs with undoped SnO2 as an ETL are compared to PSCs with an ETL composed of graphene-doped SnO2 (G-SnO2). Experimental data were collected immediately after fabrication and after one week, monitoring both impedance spectroscopy and dark current-voltage (I-V) curves. It was observed that, in the case of the undoped PSCs, the degradation of the solar cells affected both the AC behavior of the devices, modifying the associated Nyquist plots, and the DC behavior, observable from the dark I-V measurements. Conversely, the solar cells with G-SnO2 showed no variation. Considering the Nyquist plots, a quantitative analysis was performed by comparing the parameters of a proper equivalent circuit model. The results were coherent with those achieved in the DC analysis, thus proving that the analysis of impedance spectra, supported with dark I-V curves, allows one to gain a deeper knowledge of the degradation phenomena of perovskite solar cells. This study opens the door for further improvement of these devices through a better understanding of their electrical behavior.

1. Introduction

Perovskite solar cells (PSCs) have been deeply and widely investigated during the last decade in consideration of their fast development, relatively easy fabrication procedures, and the rapid recorded increases in their conversion efficiency [1]. High performance, accompanied by potentially low production costs, has established this technology as one of the most promising in the photovoltaic panorama. This dominating role has been achieved due to the intrinsic properties of perovskite materials. They indeed exhibit a high absorption coefficient [2], a tunable bandgap [3] and high carrier diffusion length [4]. Moreover, these materials not only allow for ambipolar carrier transport [5], but they also enable high mobility for both electrons and holes [6].
Nevertheless, this emerging technology is affected by issues such as hysteresis and degradation. The latter plays a key role in the stability of PSCs, and its origin should be investigated in order to find ways to mitigate these issues and eventually achieve products with a long lifetime. Some authors found the cause of degradation in material changes due to external factors (humidity, heat exposure, etc.) [7,8,9]. Other works found the reason for degradation to be the internal phenomena due to the material chemical composition [10,11].
In addition, as has been found for all technologies, the interfaces existing in solar cells are of paramount importance for their overall performance [12,13,14,15,16,17,18,19,20]. Moreover, the properties of such interfaces are fundamental for solar cell stability. In the PSC structure, the main interfaces are represented by those formed between the perovskite absorber and the two transport layers: the one responsible for electron extraction (ETL) and the one related to hole transport (HTL). It has been reported that the ETL and, in a more general sense, the perovskite/ETL interface play a crucial role in solar cell performance improvement [21]. Electrically, ETLs should provide a good energy-level alignment for efficient electron transfer while blocking holes and a high electron mobility to guarantee electron transport. High transmittance is also desired to minimize the optical losses.
In detail, ETLs are often formed from a SnO2 layer which is deposited by means of low-temperature processes [22]. These procedures may induce a high trap density in the SnO2 [23] and involve degradation of the perovskite/ETL interface quality [24]. Therefore, different strategies have been employed to enhance the interface quality. For instance, Zhao et al. [25] and Choi et al. [26] proposed the use of zwitterion-modified SnO2 films to improve the efficiency and stability of the devices through the simultaneous passivation of the SnO2 and perovskite layers. Doping the ETL with metals such as antimony (Sb), lithium (Li), Niobium (Nb) or other materials is another common and effective approach used to reduce defects and enhance the charge transfer ability [27]. Among the different studies, some highlight the beneficial role of graphene as a dopant in SnO2 [28,29,30,31,32]. The principal advantage of graphene is its capacity to improve the intrinsic semiconducting properties of the ETL and to alter its surface and volume morphologies in a beneficial manner. The incorporation of graphene into the SnO2 matrix is an effective strategy to simultaneously enhance the electron mobility and carrier extraction ability and suppress the interfacial charge recombination mainly for the graphene passivation effect of the surface defects of SnO2 [22,23].
From a structural point of view graphene nano-platelets provides segregated trap states in SnO2, which accumulate large, isolated concentrations of free electrons, thereby acting as localized reservoirs that avoid the recombination and facilitate the efficient transport of electrons. In regard to ageing, the hydrophobicity of graphene is the main factor enabling it to retard the degradation of the perovskite and to improve the device’s stability [17,18] without the need for any low-humid-air and vacuum storage, which, indeed, is required in the case of undoped ETL [33].
The present work aimed to investigate the behavior of n-i-p PSCs with a triple-cation mixed-halide absorber over time, embedding graphene nanoplatelets in the SnO2 ETL versus reference cells by simply employing SnO2. For this purpose, the PSC behavior was monitored over time by means of impedance spectroscopy (IS) analysis. Such an AC technique allows one to gain a better understanding of the physical phenomena taking place in the solar cell by only accessing the external terminals. Indeed, it has been shown that this method results in a non-destructive technique [34] which is highly suitable for the investigation of solar cells’ performance [35,36,37,38] as well as the study of their degradation [39,40,41,42,43]. The characterization of different layers in the structure is of foremost importance in the study of the overall solar cell behavior. Thus, the use of a frequency domain technique, such as IS, is fundamental for the decoupling of the numerous processes related to the various interfaces in a solar cell. However, to interpret the impedance data, a reliable model should be identified in order to associate the physical phenomena with the frequency behavior. According to the literature, several circuit parameters have been proposed [44,45,46,47,48]. Adopting the most appropriate configuration is sometimes complex, since it affects the parameters evaluated from the impedance data. Another concern when performing such an analysis is the fulfillment of the following three requirements [49]: (1) causality, (2) linearity and (3) stability. The former means that the measured output is only due to the applied input stimulus, shielding the device under testing from external perturbations. Linearity can be ensured by applying an AC signal that is high enough to generate a noise-free signal but, at the same time, small enough to perform small-signal analysis [50]. Finally, during the measurement, the sample should be stable. To this end, it is good practice to reduce the measurement time as much as possible. Here, the IS analysis was complemented with the DC analysis of dark current-voltage (I-V) curves over time, finally obtaining indications of the beneficial role of graphene in the SnO2 for solar cell stability.
The processing of the considered solar cells and the used materials are presented in Section 2. The impedance data acquired over time from the PSCs with and without graphene nanoplatelets are presented in Section 3. A study of the time constants employed is also provided, considering their trend over time. In the same section, a DC analysis of the current-voltage curves over time for the considered structures is described. The results arising from both the AC and DC analyses are discussed. Conclusions are then drawn in Section 4.

2. Materials and Methods

2.1. Materials

SnO2 colloid precursor (tin(IV) oxide 15% H2O colloidal dispersion), PbI2 (≥99.999, ultradry) and PbBr2 (≥99.998) were obtained from Alfa Aesar; CsI (≥99.999, anhydrous) and acetonitrile (ACN) were obtained from Acros Organics; and N,N-dymethylformammide (DMF), dimethylsulfoxide (DMSO), formamidium iodide (FAI), methylammonium bromide (MaBr, ≥99%, anydrous), Spiro-OMETAD, Chlorobenzene (CB), 4-tert-butylpyridine (TBPy), Bis(trifluoromethane)sulfonimide lithium salt (Li-TFSI) and FK 209 Co(III) TFSI salt were purchased from sigma Aldrich/Merck. Natural graphite flakes were received from the NGS Naturgraphit GmbH Winner Company. i-Propyl alcohol (IPA, RS for HPLC- Isocratic grade) was purchased from Carlo Erba. Ultrapure water was obtained with a Type 1 (Ultrapure) Milli-Q system. All chemicals were used without further purification. We used 2 × 2 cm2 glass ITO substrates received from Kintec (1 Ω sq−1).
The graphene was obtained via the exfoliation of graphite flakes in a hydro-alcoholic mixture [28]. More specifically, natural graphite flakes were dispersed in H2O/IPA, 7:1 v/v, with an initial concentration of 1 mg/mL. The dispersion was treated in an ultrasonic bath for 48 h. The non-exfoliated solid residue was removed via centrifugation at 1000 rpm for 45 min and the top half of the supernatant suspension of graphene was collected.

2.2. Device Fabrication

The perovskite solar cells were built on glass substrates coated with patterned ITO, in accordance with the procedure described in a previous work [33]. The n-i-p architecture was considered with the glass/ITO/ETL/perovskite-absorber/HTL/Au layer sequence, using SnO2 or graphene-doped SnO2 as the ETL (for the reference and modified devices, respectively), Pb-based triple-cation (Cs, FA = formamidinium, MA = methylammonium) mixed-halide (I, Br) perovskite as the absorber, and Spiro-OMeTAD as the HTL.
Before the deposition of the ETL, a UV–ozone treatment was carried out to increase the wettability of the substrate.
In total, 1 mL of commercial SnO2 dispersion was added to 5 mL of deionized water or was added to 4.5 mL of water and 0.5 mL of graphene suspension. These suspensions were used to realize two series of samples with two different ETLs via spin coating (6000 rpm—6000 rpm/s—50 s). The substrates were annealed at 100 °C for approximately 5 min and at 150 °C for 1 h. The batches were prepared on the same day to maintain similar environmental conditions.
The perovskite film was deposited via spin coating in a glove box with nitrogen following the one-step anti-solvent procedure. The perovskite precursor solution was prepared by mixing PbI2 (1.10 M), PbBr2 (0.22 M), FAI (1.05 M, formamidinium iodide), and MABr (0.20 M, methyl ammonium bromide) in DMF:DMSO (4:1, v/v) and adding a 1.50 M solution of CsI in DMSO to obtain molar ratio of 5%. Chlorobenzene (CBZ) was chosen as an anti-solvent and added to the substrate a few seconds before the end of the spin-coating process. The samples were annealed at 100 °C for one hour.
The Spiro-OMeTAD was then applied to the perovskite layer via spin coating in a nitrogen-filled glove box. The Spiro-OMeTAD solution in CBZ was previously doped with 4-t-butylpyridine, a Li-TFSI solution and an FK 209 Co (III) TFSI solution. The solar cells were finally completed by evaporating the gold electrodes (80 nm). More details about fabrication of all the layers can be found in [33].

2.3. Characterization

The experimental setup used to collect impedance data was composed of a Solartron 1260 Impedance Analyzer and a Solartron 1296 Dielectric Interface. During the impedance spectroscopy analysis, the exploited frequency was swept from 1 MHz to 100 mHz by means of a logarithmic sweep. The amplitude of the stimulus, i.e., the superimposed AC signal, was chosen to be equal to 100 mV. The DC bias was swept from −0.2 V to 1 V. The impedance data were plotted in the form of a Nyquist plot. Such plots represent the real part of the complex impedance on the x-axis and the imaginary part on the y-axis. Each point on these curves is acquired for a certain frequency, while each curve is collected for a given DC bias.
Illuminated current-voltage characteristics were carried out at AM1.5G by exposing the solar cells in ambient air in a class AAA dual-lamp solar simulator (WACOM, model WXS-155S-L2) equipped with a 1000 W xenon lamp and a 400 W halogen lamp. The irradiated area was ~0.1 cm2, defined by applying a shadow mask aligned to the cell area. The external voltage was applied while recording the generated photocurrent using a Source Measure Unit (Keithley, Model 2651A). Further details can be found in [51]. To perform the dark I-V curve measurements, the devices were placed in a darkened box, and data were collected by means of a Keithley 236 Source Measure Unit. The voltage spanned from −0.5 V to 1.5 V in steps of 5 mV. The time delay between consecutive points was set to 300 ms.

3. Results

The solar cells’ photovoltaic parameters, measured after fabrication, were very similar for the two types of solar cells, which showed a slight difference in open circuit voltage with values of 1051 mV for the modified device (PSC with G-SnO2) and 1033 mV for the reference device (PSC with undoped SnO2), a short circuit current density of 20 mA/cm2, FF of around 73% and a power conversion efficiency of around 15%. Although PSCs are prone to degradation, over the time scale of 1 week, no significant effect was observed on the current-voltage characteristics under illumination for either type of device. Instead, differences were already observed with the IS and I-V characterizations in the dark.
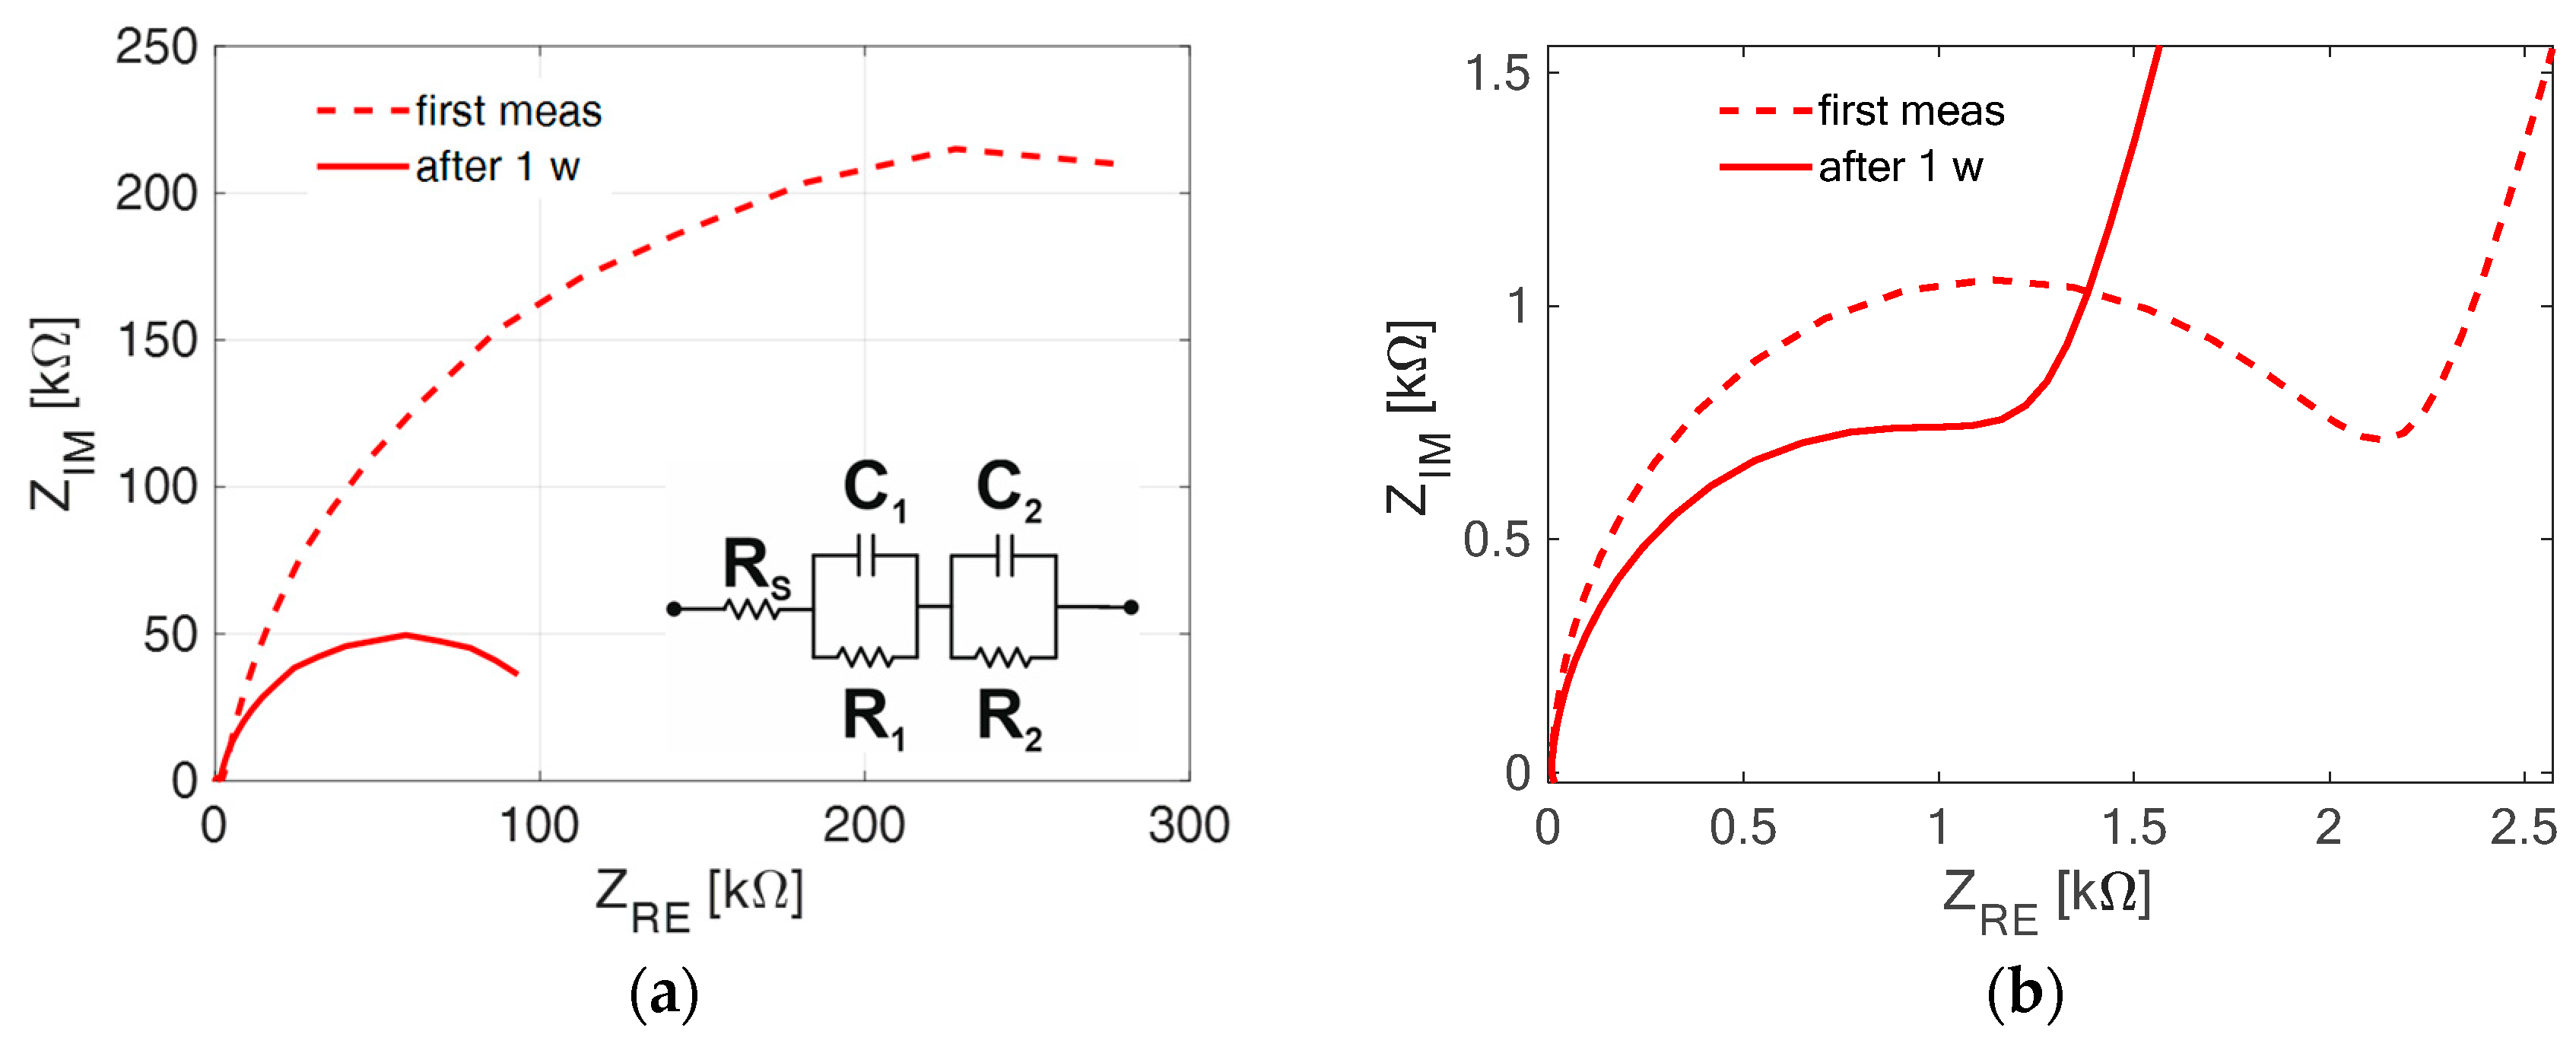
As regards the IS characterization, we report the Nyquist plots acquired at only one of the DC values taken into account, which is VDC = 0.4 V. These graphs are reported for the modified device in Figure 1 and the reference device in Figure 2. In the mentioned figures, we report the data collected after fabrication (dashed line) and the data acquired after one week (full line). If Figure 1 is considered, it can be seen that the modified device trend did not significantly changed over 1 week. In this plot, the circumference with a larger radius is related to the medium-low-frequency range (in this particular case, the mentioned range is [600 Hz, 100 mHz]), while the circumference with a smaller radius corresponds to the high-frequency range. In more detail, a zoom of the high-frequency circle is given in Figure 1b. Interpretating the Nyquist graphs in terms of an equivalent electrical circuit is of great help for understanding the phenomena arising in the device of interest. The extracted configuration can provide insight into the physics of the structure. On the one hand, it is possible to represent each interface as an RC pair, i.e., the parallel of a series and a capacitance. On the other hand, each semi-circumference in the Nyquist plot can be described in terms of lumped electrical parameters with an RC pair. Moreover, the shift from the origin on the x-axis is equal to the series resistance [52]. Thus, considering the case of modified device (Figure 1), the equivalent circuit (inset in Figure 1a) is composed of two RC pairs and a series resistance. This suggests that two interfaces dominate the AC behavior of the device under testing. Another outcome is that both these semi-circumferences exhibit the same trend over time, implying that the performance of the modified device was not modified in the period considered. The proposed analysis was also performed on the reference device. In Figure 2, we find the Nyquist plots collected for the reference device just after fabrication (dashed line) and one week later (full line). In Figure 2, there are two circles arising in the Nyquist plot, similar to the previous case. Thus, for the reference device, too, the AC behavior of the cell can be described in terms of an equivalent circuit as two RC pairs and a series resistance, as shown in the inset in Figure 2a. The equivalent circuit models are able to describe the behavior of the devices under testing in all the frequency ranges considered. Even if the Nyquist plot arising from the reference device has the shape of two semicircles, the graph is significantly different over time, showing a drastically smaller semicircle at both high and low frequencies. Therefore, the change in the impedance data suggests that the behavior of the reference device changed over the measured period. This change over time can be quantified by evaluating the modification of the time constants, τ. The time constants we introduced are parameters associated with the RC pairs of the equivalent circuit of the perovskite solar cell. Some ambiguity exists in the literature regarding the unequivocal assignment of the circuit elements to a precise location in the device or to a physical phenomenon for a perovskite solar cell. In fact, the physics of these cells is, to a large extent, determined by the motion of large numbers of slow-moving ion vacancies and is thus markedly different to that of other photovoltaic devices. In perovskite solar cells, distinct physical phenomena may occur on the same time scales and can be modeled with an RC element. The equivalent circuit we introduced could not be completed or represent all possible processes in a perovskite solar cell, but it is the simplest circuit that is able to model the AC dark behavior of our device. In our analysis, two different time constants could be evaluated since, in both cases, two RC pairs could be identified in the equivalent circuit extracted from the IS data. In detail, one of the time constants is associated with the physical mechanisms existing at a low frequency, τLF, while the other is related to the phenomena arising at a high frequency, τHF. These parameters can be evaluated as follows:
τ H F = R H F C H F
and
τ L F = R L F C L F
At the point where ZIM reaches its maximum, the following equation can be written:
τ ω = 1
where ω = 2πfMAX.
Hence, in our case study, applying the previous equations to the two frequency ranges, the following equations can be written:
τ H F ω H F = 1 τ L F ω L F = 1
The time constants evaluated for the considered PSCs are presented in Table 1. The values extracted for the modified device over time are very similar, while this is not the case for the reference device, since the time constants are definitely reduced after one week. Over this time, the resistance, RHF, associated with the high-frequency RC pair, becomes lower. This change involves a modification in the associated time constant, τHF, which specifically diminishes. A similar conclusion can be drawn for the reference device if the low-frequency range is considered and τLF appears lower after one week. Evaluating the time constants allows us to confirm that the reference device’s behavior at both low and high frequencies noticeably changes over the considered period. Moreover, this modification seems to be caused by recombination occurring in the low- and high-frequency ranges, which becomes more evident over time. In order to support the last statement, the dark current-voltage curves were acquired and evaluated over time for the two considered structures. The I-V curves were collected after device fabrication over one week. Semilogarithmic plots of the acquired data are presented for the modified device and the reference device in Figure 3 and Figure 4, respectively.
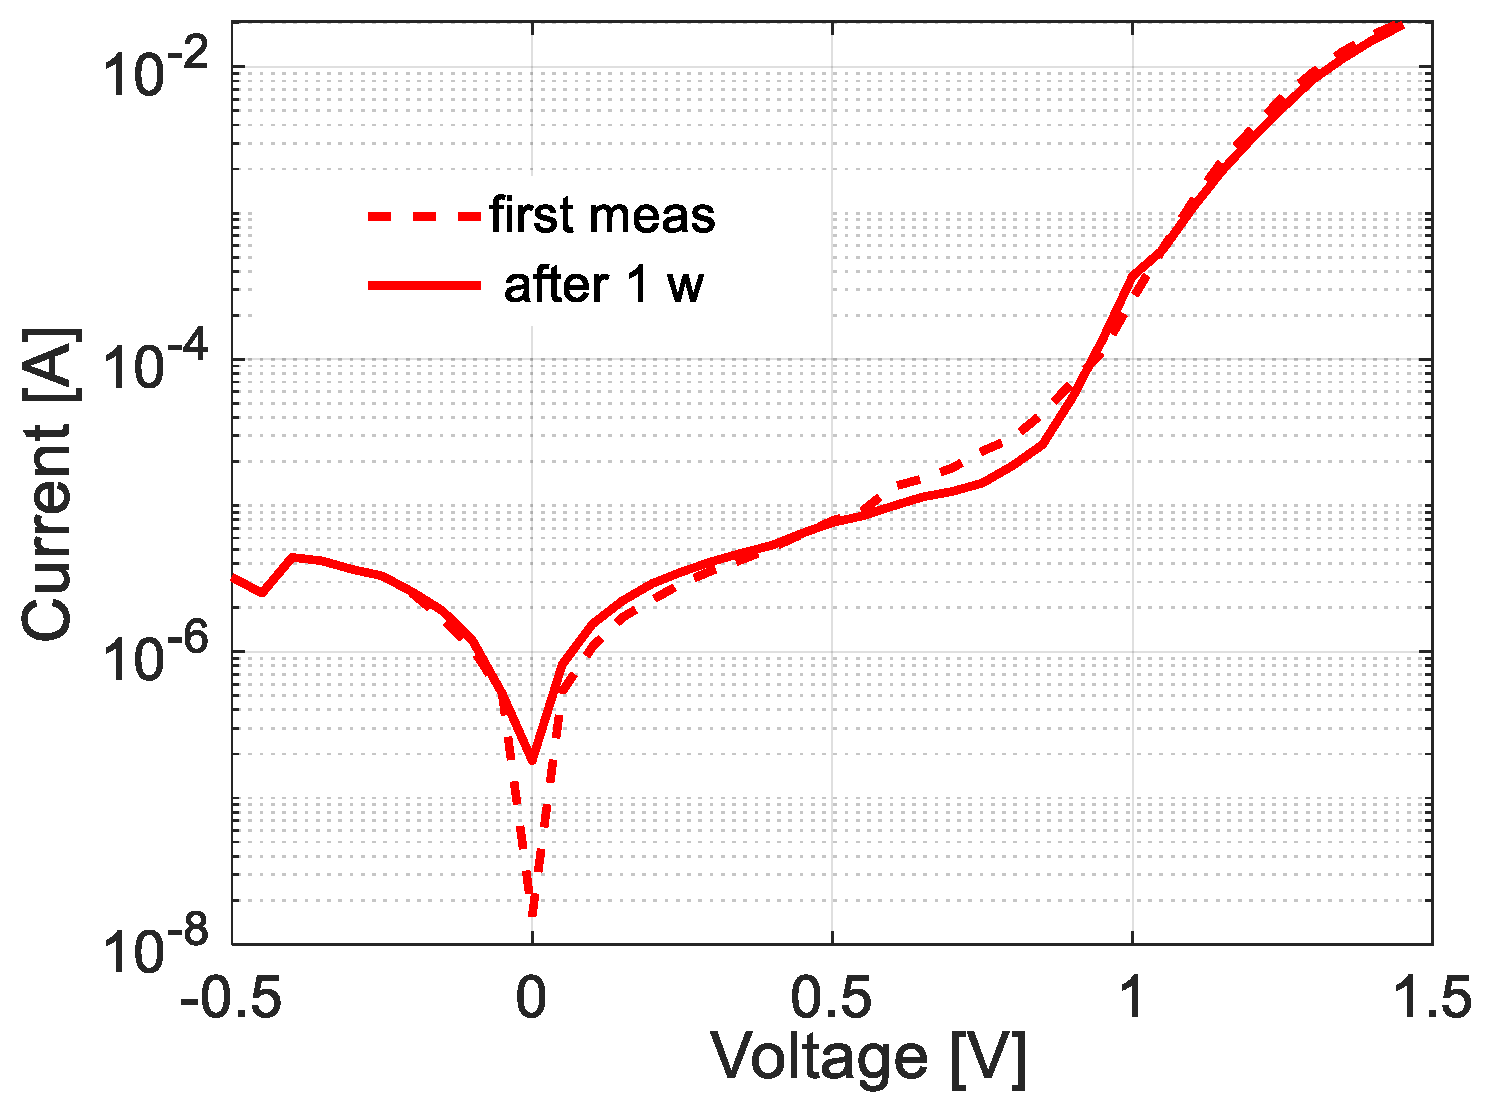
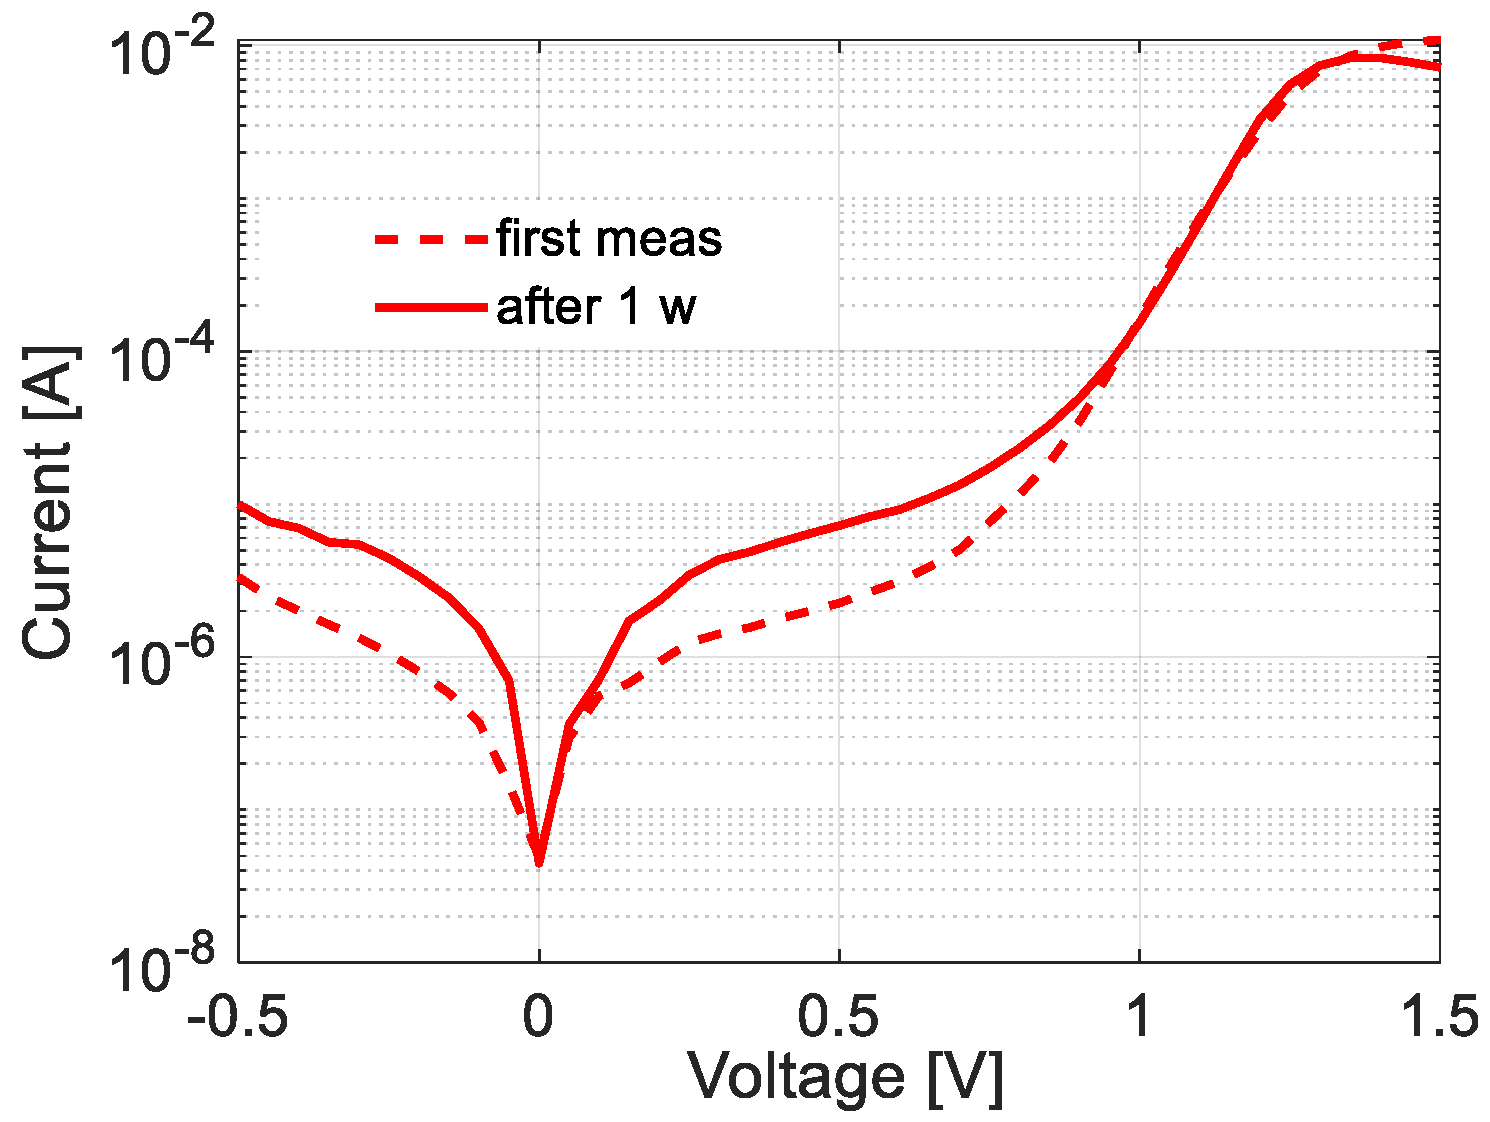
In the forward bias current-voltage curve, two regions can be identified depending on the different physical mechanisms dominating the device behavior: the low- and the high-forward-bias regions. In the latter, the solar cell current is dominated by series resistance, resulting in a linear trend of the current. On the other hand, the behavior in low forward bias is more complex, since the current is the result of two different phenomena taking place in the same voltage range: the recombination mechanisms and the effect of the shunt resistance. The latter can be identified as the principal phenomena if the slope of the I-V curve is symmetrical around zero voltage. Considering the I-V curves of the modified device, in Figure 3, it can be seen that the curves’ trend does not change over time. On the other hand, the current curves arising from the reference device, in Figure 4, have a differing trend over one week. Moreover, the difference between the curves over time stands in the low-forward-bias region. Indeed, the two curves differ at a low forward voltage, while they begin to overlie as the voltage increases, i.e., for a voltage higher than 0.9 V in the case of Figure 4. Thus, the trend arising from these curves suggests that phenomena responsible for the change in the reference device over time are mainly visible when the applied voltage is low. Furthermore, the phenomena responsible for the high-forward-bias behavior are unchanged in this span of time. This means that the change in the modified device’s behavior can mainly be ascribed to a change in the shunt resistance or to an increase in the recombination phenomena. Since the I-V curves collected do not exhibit any symmetrical trend over 0 V, the change in the current behavior must be due to recombination phenomena. These mechanisms seem to dominate the performance of the reference device, while this is not the case for the modified device. The presented results were obtained from all 10 of the samples considered in this study.

4. Conclusions

In this work, by means of impedance spectroscopy, we revealed the beneficial effect of graphene nanoplatelets included in SnO2-based ETLs in terms of the stability of PSCs. In more detail, two structures were taken into account in this study: a perovskite solar cell with graphene nanoplatelets embedded in a SnO2 ETL and another perovskite solar cell with a SnO2 ETL alone. Nyquist plots were collected over the considered time for both structures, and an equivalent circuit was extracted. This configuration was able to describe the AC behavior of the considered structure in all the frequency ranges considered. Starting from the lumped parameters of the equivalent circuit, the time constants related to the different frequency ranges were extracted and evaluated. The study allowed us to confirm that the solar cell with graphene nanoplatelets in the SnO2 ETL did not vary its behavior during the considered time period. This was the result of the comparison of both the impedance graphs and the time constants extracted. On the other hand, the other cells showed a noticeable variation in the impedance curve, which also involved great variation in the time constants evaluated. Such variation seemed to be due to the increase in recombination phenomena. In order to justify such a hypothesis, the I-V curves of both cells were evaluated over the same span of time. From these curves, it was confirmed that the behavior of the perovskite solar cells with graphene nanoplatelets in the SnO2 ETL did not vary much over one week. On the other hand, the other solar cell’s trend clearly varied in the considered time frame. The cause of this change in the I-V curve can be found in the increase in the recombination processes taking place in the structure.
Interestingly, the IS and I-V characteristics in dark conditions revealed a different evolution in the presence/absence of graphene nanoplatelets on a short time scale (1 week), whereas the photovoltaic parameters remained unchanged for both types of devices. This result stresses the strength of impedance spectroscopy (AC technique) and I-V curves (DC analysis) obtained in the dark for the investigation of PSC degradation. Such techniques appear to be more sensitive to cell variation while also being unaffected by the possible issues often encountered with PSC characterization under simulated sunlight [51]. For the present case, the data from the AC and DC analyses suggest that embedding graphene nanoplatelets in SnO2 has a beneficial effect on the degradation of PSCs, inhibiting the increase in recombination mechanisms at the perovskite/ETL interface.

Author Contributions

Conceptualization, I.M.; funding acquisition, P.D.V. and S.D.; methodology, I.M.; resources, L.L., B.A., A.D.M., V.L.F., L.V.M., G.V.S., M.L.M., T.P. and G.R.; supervision, P.D.V. and S.D.; writing—original draft, I.M., P.G., L.L. and M.L.M.; writing—review and editing, I.M., P.G., L.L., L.V.M., M.L.M., G.V.S. and S.D. All authors have read and agreed to the published version of the manuscript.

Funding

This work has been supported by MUR, Italy funds in the frame of PRIN 2020—“A Holistic Moni-toring and Diagnostic Tool for Photovoltaic Generators (HOTSPHOT)” project (CUP: E63C2001116000). By the Italian Ministry of Environment and Energy Security in the framework of the Operating Agreement with ENEA for Research on the Electric System.

Data Availability Statement

Data presented in this work are available on request from the corresponding author.

Conflicts of Interest

The authors declare no conflict of interest.

References

  1. Green, M.A.; Dunlop, E.D.; Hohl-Ebinger, J.; Yoshita, M.; Kopidakis, N.; Hao, X. Solar cell efficiency tables (Version 58). Prog. Photovolt. Res. Appl. 2021, 29, 657–667. [Google Scholar] [CrossRef]
  2. De Wolf, S.; Holovsky, J.; Moon, S.J.; Loper, P.; Niesen, B.; Ledinsky, M.; Haug, F.-J.; Yum, J.-H.; Ballif, C. Organometallic halide perovskites: Sharp optical absorption edge and its relation to photovoltaic performance. J. Phys. Chem. Lett. 2014, 5, 1035–1039. [Google Scholar] [CrossRef]
  3. Noh, J.H.; Im, S.H.; Heo, J.H.; Mandal, T.N.; Seok, S.I. Chemical management for colorful, efficient, and stable inorganic–organic hybrid nanostructured solar cells. Nano Lett. 2013, 13, 1764–1769. [Google Scholar] [CrossRef]
  4. Dong, Q.; Fang, Y.; Shao, Y.; Mulligan, P.; Qiu, J.; Cao, L.; Huang, J. Electron-hole diffusion lengths > 175 μm in solution-grown CH3NH3PbI3 single crystals. Science 2015, 347, 967–970. [Google Scholar] [CrossRef] [Green Version]
  5. Chen, Y.; Peng, J.; Su, D.; Chen, X.; Liang, Z. Efficient and balanced charge transport revealed in planar perovskite solar cells. ACS Appl. Mater. Interfaces 2015, 7, 4471–4475. [Google Scholar] [CrossRef]
  6. Wehrenfennig, C.; Eperon, G.E.; Johnston, M.B.; Snaith, H.J.; Herz, L.M. High charge carrier mobilities and lifetimes in organolead trihalide perovskites. Adv. Mater. 2014, 26, 1584–1589. [Google Scholar] [CrossRef] [Green Version]
  7. Berhe, T.A.; Su, W.N.; Chen, C.H.; Pan, C.J.; Cheng, J.H.; Chen, H.M.; Tsai, M.-C.; Chen, L.-Y.; Dubale, A.A.; Hwang, B.J. Organometal halide perovskite solar cells: Degradation and stability. Energy Environ. Sci. 2016, 9, 323–356. [Google Scholar] [CrossRef]
  8. Boyd, C.C.; Cheacharoen, R.; Leijtens, T.; McGehee, M.D. Understanding degradation mechanisms and improving stability of perovskite photovoltaics. Chem. Rev. 2018, 119, 3418–3451. [Google Scholar] [CrossRef]
  9. Dunfield, S.P.; Bliss, L.; Zhang, F.; Luther, J.M.; Zhu, K.; van Hest, M.F.; Reese, M.O.; Berry, J.J. From defects to degradation: A mechanistic understanding of degradation in perovskite solar cell devices and modules. Adv. Energy Mater. 2020, 10, 1904054. [Google Scholar] [CrossRef]
  10. Ahn, N.; Kwak, K.; Jang, M.S.; Yoon, H.; Lee, B.Y.; Lee, J.K.; Pikhitsa, P.V.; Byun, J.; Choi, M. Trapped charge-driven degradation of perovskite solar cells. Nat. Commun. 2016, 7, 13422. [Google Scholar] [CrossRef] [Green Version]
  11. Baiatu, T.; Rainer, W.; Karl-Heinz, H. DC electrical degradation of perovskite-type titanates: III, a model of the mechanism. J. Am. Ceram. Soc. 1990, 73, 1663–1673. [Google Scholar] [CrossRef]
  12. Khezami, L.; Al Megbel, A.O.; Jemai, A.B.; Rabha, M.B. Theoretical and experimental analysis on effect of porous silicon surface treatment in multicrystalline silicon solar cells. Appl. Surf. Sci. 2015, 353, 106–111. [Google Scholar] [CrossRef]
  13. Rabha, M.B.; Khezami, L.; Jemai, A.B.; Alhathlool, R.; Ajbar, A. Surface passivation of silicon nanowires based metal nano-particle assisted chemical etching for photovoltaic applications. J. Cryst. Growth 2017, 462, 35–40. [Google Scholar] [CrossRef]
  14. Mercaldo, L.V.; Bobeico, E.; De Maria, A.; Della Noce, M.; Ferrara, M.; La Ferrara, V.; Lancellotti, L.; Rametta, G.; Sannino, G.V.; Delli Veneri, P.; et al. Monolithic Perovskite/Silicon-Heterojunction Tandem Solar Cells with Nanocrystalline Si/SiOx Tunnel Junction. Energies 2021, 14, 7684. [Google Scholar] [CrossRef]
  15. Mercaldo, L.V.; Bobeico, E.; Usatii, I.; Della Noce, M.; Lancellotti, L.; Serenelli, L.; Izzi, M.; Tucci, M.; Veneri, P.D. Potentials of mixed-phase doped layers in p-type Si hetero-junction solar cells with ZnO:Al. Sol. Energy Mater. Sol. Cells 2017, 168, 113–121. [Google Scholar] [CrossRef]
  16. Matacena, I.; Guerriero, P.; Lancellotti, L.; Bobeico, E.; Lisi, N.; Chierchia, R.; Veneri, P.D.; Daliento, S. Forward bias capacitance investigation as a powerful tool to monitor graphene/silicon interfaces. Sol. Energy 2021, 226, 1–8. [Google Scholar] [CrossRef]
  17. Matacena, I.; Maresca, L.; Riccio, M.; Irace, A.; Breglio, G.; Castellazzi, A.; Daliento, S. SiC/SiO2 interface traps effect on SiC MOSFETs Gate capacitance with biased Drain. In Proceedings of the 2022 IEEE International Symposium on the Physical and Failure Analysis of Integrated Circuits (IPFA), IEEE, Singapore, 18–20 July 2022. [Google Scholar]
  18. Maresca, L.; Matacena, I.; Riccio, M.; Irace, A.; Breglio, G.; Daliento, S. TCAD model calibration for the SiC/SiO2 interface trap distribution of a planar SiC MOSFET. In Proceedings of the 2020 IEEE Workshop on Wide Bandgap Power Devices and Applications in Asia (WiPDA Asia), IEEE, Suita, Japan, 23–28 September 2020. [Google Scholar]
  19. Matacena, I.; Maresca, L.; Riccio, M.; Irace, A.; Breglio, G.; Daliento, S. Evaluation of Interface Traps Type, Energy Level and Density of SiC MOSFETs by Means of CV Curves TCAD Simulations. Mater. Sci. Forum 2020, 1004, 608–613. [Google Scholar] [CrossRef]
  20. Lancellotti, L.; Lisi, N.; Veneri, P.D.; Bobeico, E.; Matacena, I.; Guerriero, P. Graphene-on-Silicon solar cells with graphite contacts. In Proceedings of the 2019 International Conference on Clean Electrical Power (ICCEP), IEEE, Otranto, Italy, 2–4 July 2019. [Google Scholar]
  21. Noh MF, M.; Teh, C.H.; Daik, R.; Lim, E.L.; Yap, C.C.; Ibrahim, M.A.; Ludin, N.A.; Yusoff, A.R.B.M.; Jang, J.; Teridi, M.A.M. The architecture of the electron transport layer for a perovskite solar cell. J. Mater. Chem. C 2018, 6, 682–712. [Google Scholar]
  22. Bai, Y.; Fang, Y.; Deng, Y.; Wang, Q.; Zhao, J.; Zheng, X.; Zhang, Y.; Huang, J. Low temperature solution-processed Sb: SnO2 nanocrystals for efficient planar perovskite solar cells. ChemSusChem 2016, 9, 2686–2691. [Google Scholar] [CrossRef] [Green Version]
  23. Godinho, K.G.; Walsh, A.; Watson, G.W. Energetic and electronic structure analysis of intrinsic defects in SnO2. J. Phys. Chem. C 2009, 113, 439–448. [Google Scholar] [CrossRef]
  24. Zuo, L.; Chen, Q.; De Marco, N.; Hsieh, Y.T.; Chen, H.; Sun, P.; Chang, S.-Y.; Zhao, H.; Dong, S.; Yang, Y. Tailoring the interfacial chemical interaction for high-efficiency perovskite solar cells. Nano Lett. 2017, 17, 269–275. [Google Scholar] [CrossRef]
  25. Zhao, X.; Dong, J.; Wu, D.; Zhou, J.; Feng, J.; Yao, Y.; Xu, C.Y.; Yang, X.; Tang, X.; Song, Q. Efficient and Stable Perovskite Solar Cells Achieved by Using Bifunctional Interfacial Materials to Modify SnO2 and MAPbI3–xClx Simultaneously. ACS Appl. Energy Mater. 2021, 4, 3794–3802. [Google Scholar] [CrossRef]
  26. Choi, K.; Lee, J.; Kim, H.I.; Park, C.W.; Kim, G.W.; Choi, H.; Park, S.; Park, S.A.; Park, T. Thermally stable, planar hybrid perovskite solar cells with high efficiency. Energy Environ. Sci. 2018, 11, 3238–3247. [Google Scholar] [CrossRef]
  27. Uddin, A.; Yi, H. Progress and challenges of SnO2 electron transport layer for perovskite solar cells: A critical review. Sol. RRL 2022, 6, 2100983. [Google Scholar] [CrossRef]
  28. Dai, X.; Koshy, P.; Sorrell, C.C.; Lim, J.; Yun, J.S. Focussed Review of Utilization of Graphene-Based Materials in Electron Transport Layer in Halide Perovskite Solar Cells: Materials-Based Issues. Energies 2020, 13, 6335. [Google Scholar] [CrossRef]
  29. Sidhik, S.; Panikar, S.S.; Pérez, C.R.; Luke, T.L.; Carriles, R.; Carrera, S.C.; De la Rosa, E. Interfacial engineering of TiO2 by graphene nanoplatelets for high-efficiency hysteresis-free perovskite solar cells. ACS Sustain. Chem. Eng. 2018, 6, 15391–15401. [Google Scholar] [CrossRef]
  30. Shen, D.; Zhang, W.; Xie, F.; Li, Y.; Abate, A.; Wei, M. Graphene quantum dots decorated TiO2 mesoporous film as an efficient electron transport layer for high-performance perovskite solar cells. J. Power Sources 2018, 402, 320–326. [Google Scholar] [CrossRef]
  31. Dadashbeik, M.; Fathi, D.; Eskandari, M. Design and simulation of perovskite solar cells based on graphene and TiO2/graphene nanocomposite as electron transport layer. Sol. Energy 2020, 207, 917–924. [Google Scholar] [CrossRef]
  32. Tavakoli, M.M.; Tavakoli, R.; Yadav, P.; Kong, J. A graphene/ZnO electron transfer layer together with perovskite passivation enables highly efficient and stable perovskite solar cells. J. Mater. Chem. A 2019, 7, 679–686. [Google Scholar] [CrossRef] [Green Version]
  33. La Ferrara, V.; De Maria, A.; Rametta, G.; Veneri, P.D. The effect of storage cycle on improvement in the photovoltaic parameters of planar triple cation perovskite solar cells. Mater. Adv. 2021, 2, 5396–5405. [Google Scholar] [CrossRef]
  34. Macdonald, J.R. Impedance spectroscopy. Ann. Biomed. Eng. 1992, 20, 289–305. [Google Scholar] [CrossRef]
  35. Yadav, P.; Pandey, K.; Bhatt, V.; Kumar, M.; Kim, J. Critical aspects of impedance spectroscopy in silicon solar cell characterization: A review. Renew. Sustain. Energy Rev. 2017, 76, 1562–1578. [Google Scholar] [CrossRef]
  36. Sacco, A. Electrochemical impedance spectroscopy: Fundamentals and application in dye-sensitized solar cells. Renew. Sustain. Energy Rev. 2017, 79, 814–829. [Google Scholar] [CrossRef]
  37. Matacena, I.; Lancellotti, L.; Lisi, N.; Delli Veneri, P.; Guerriero, P.; Daliento, S. Impedance spectroscopy for the characterization of the all-carbon graphene-based solar cell. Energies 2020, 13, 1908. [Google Scholar] [CrossRef] [Green Version]
  38. Mora-Sero, I.; Garcia-Belmonte, G.; Boix, P.P.; Vazquez, M.A.; Bisquert, J. Impedance spectroscopy characterisation of highly efficient silicon solar cells under different light illumination intensities. Energy Environ. Sci. 2009, 2, 678–686. [Google Scholar] [CrossRef]
  39. Sharma, D.K.; Pareek, K.; Chowdhury, A. Investigation of solar cell degradation using electrochemical impedance spectroscopy. Int. J. Energy Res. 2020, 44, 8730–8739. [Google Scholar] [CrossRef]
  40. Arredondo, B.; Martín-López, M.B.; Romero, B.; Vergaz, R.; Romero-Gomez, P.; Martorell, J. Monitoring degradation mechanisms in PTB7: PC71BM photovoltaic cells by means of impedance spectroscopy. Sol. Energy Mater. Sol. Cells 2016, 144, 422–428. [Google Scholar] [CrossRef] [Green Version]
  41. Gupta, S.K.; Pali, L.S.; Garg, A. Impedance spectroscopy on degradation analysis of polymer/fullerene solar cells. Sol. Energy 2019, 178, 133–141. [Google Scholar] [CrossRef]
  42. Katayama, N.; Osawa, S.; Matsumoto, S.; Nakano, T.; Sugiyama, M. Degradation and fault diagnosis of photovoltaic cells using impedance spectroscopy. Sol. Energy Mater. Sol. Cells 2019, 194, 130–136. [Google Scholar] [CrossRef]
  43. Osorio, E.; Sánchez, J.G.; Acquaroli, L.N.; Pacio, M.; Ferré-Borrull, J.; Pallarès, J.; Marsal, L.F. Degradation analysis of encapsulated and nonencapsulated TiO2/PTB7: PC70BM/V2O5 solar cells under ambient conditions via impedance spectroscopy. ACS Omega 2017, 2, 3091–3097. [Google Scholar] [CrossRef] [Green Version]
  44. Pascoe, A.R.; Duffy, N.W.; Scully, A.D.; Huang, F.; Cheng, Y.-B. Insights into Planar CH3NH3PbI3 Perovskite Solar Cells Using Impedance Spectroscopy. J. Phys. Chem. C 2015, 119, 4444–4453. [Google Scholar] [CrossRef]
  45. Pockett, A.; Eperon, G.E.; Peltola, T.; Snaith, H.J.; Walker, A.; Peter, L.M.; Cameron, P.J. Characterization of Planar Lead Halide Perovskite Solar Cells by Impedance Spectroscopy, Open-Circuit Photovoltage Decay, and Intensity-Modulated Photovoltage/Photocurrent Spectroscopy. J. Phys. Chem. C 2015, 119, 3456–3465. [Google Scholar] [CrossRef] [Green Version]
  46. Guerrero, A.; Garcia-Belmonte, G.; Mora-Sero, I.; Bisquert, J.; Kang, Y.S.; Jacobsson, T.J.; Correa-Baena, J.-P.; Hagfeldt, A. Properties of Contact and Bulk Impedances in Hybrid Lead Halide Perovskite Solar Cells Including Inductive Loop Elements. J. Phys. Chem. C 2016, 120, 8023–8032. [Google Scholar] [CrossRef] [Green Version]
  47. Todinova, A.; Idígoras, J.; Salado, M.; Kazim, S.; Anta, J.A. Universal Features of Electron Dynamics in Solar Cells with TiO2 Contact: From Dye Solar Cells to Perovskite Solar Cells. J. Phys. Chem. Lett. 2015, 6, 3923–3930. [Google Scholar] [CrossRef]
  48. Bisquert, J.; Bertoluzzi, L.; Mora-Sero, I.; Garcia-Belmonte, G. Theory of Impedance and Capacitance Spectroscopy of Solar Cells with Dielectric Relaxation, Drift-Diffusion Transport, and Recombination. J. Phys. Chem. C 2014, 118, 18983–18991. [Google Scholar] [CrossRef]
  49. Pitarch-Tena, D.; Ngo, T.T.; Vallés-Pelarda, M.; Pauporté, T.; Mora-Seró, I. Impedance spectroscopy measurements in perovskite solar cells: Device stability and noise reduction. ACS Energy Lett. 2018, 3, 1044–1048. [Google Scholar] [CrossRef] [Green Version]
  50. Fabregat-Santiago, F.; Garcia-Belmonte, G.; Mora-Seró, I.; Bisquert, J. Characterization of Nanostructured Hybrid and Organic Solar Cells by Impedance Spectroscopy. Phys. Chem. Chem. Phys. 2011, 13, 9083–9118. [Google Scholar] [CrossRef]
  51. Mercaldo, L.V.; Bobeico, E.; De Maria, A.; Della Noce, M.; Ferrara, M.; Lancellotti, L.; Romano, A.; Sannino, G.V.; Nasti, G.; Delli Veneri, P.; et al. Procedure Based on External Quantum Efficiency for Reliable Characterization of Perovskite Solar Cells. Energy Technol. 2022, 10, 2200748. [Google Scholar] [CrossRef]
  52. Matacena, I. Equivalent circuit extraction procedure from Nyquist plots for graphene-silicon solar cells. In Proceedings of the 2019 15th Conference on Ph.D. Research in Microelectronics and Electronics (PRIME), IEEE, Lausanne, Switzerland, 15–18 July 2019. [Google Scholar]
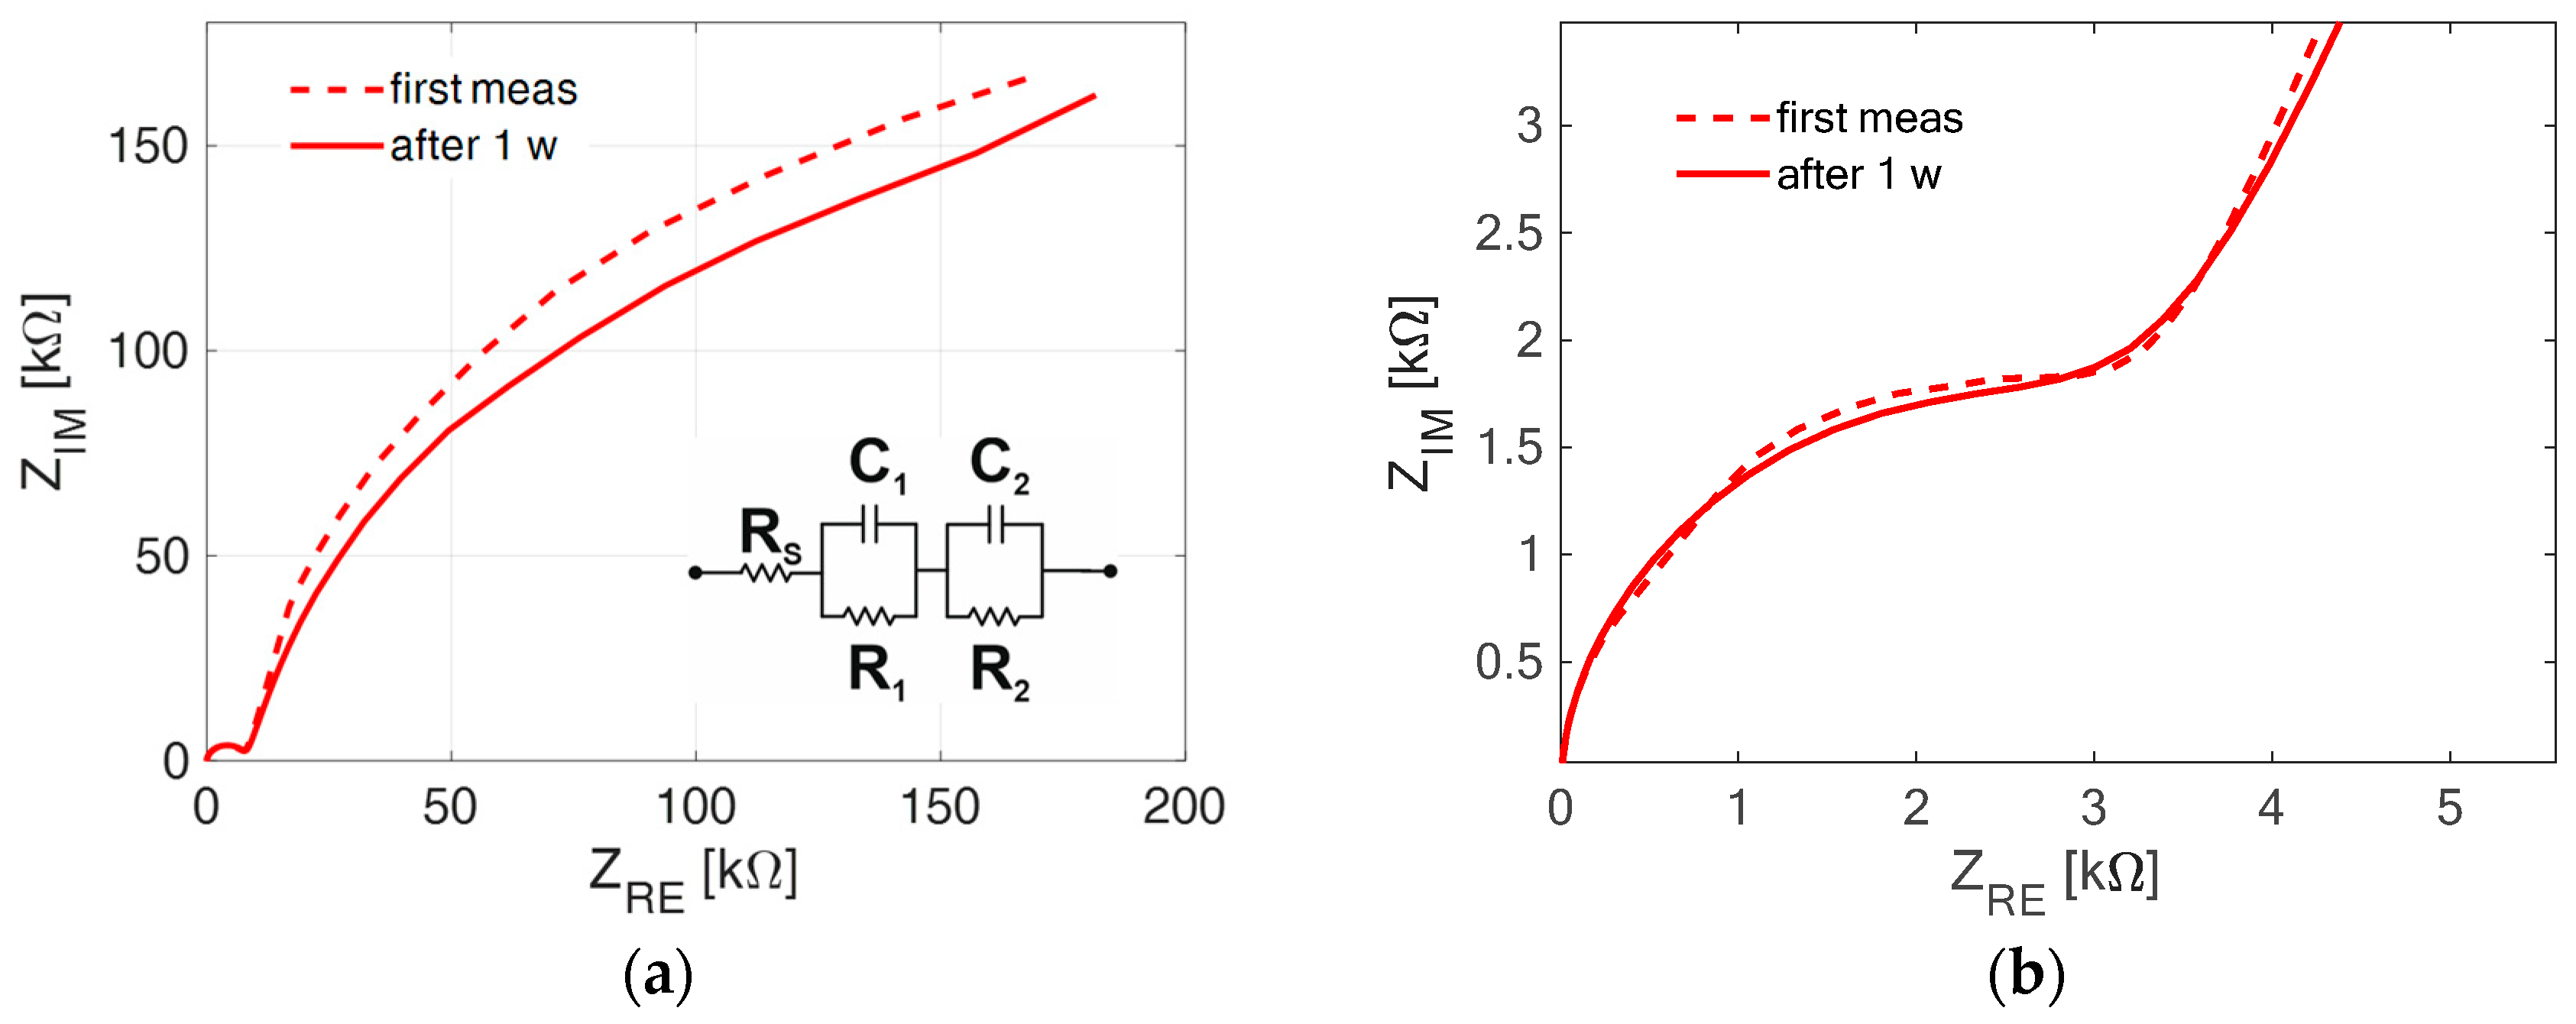
Figure 1. Nyquist plots obtained for the modified device (a) in all the frequency ranges and (b) in the high-frequency range. Inset in (a) represents the equivalent circuit configuration.
Energies 16 04951 g001
Figure 2. Nyquist plots obtained for the reference device (a) in all the frequency ranges and (b) in the high-frequency range. Inset in (a) represents the equivalent circuit configuration.
Energies 16 04951 g002
Figure 3. I-V curves obtained for the modified device as fabricated (dashed line) and after 1 week (line).
Energies 16 04951 g003
Figure 4. I-V curves obtained for the reference device as fabricated (dashed line) and after 1 week (line).
Energies 16 04951 g004
Table 1. Time constants obtained via impedance spectroscopy.
Modified DeviceReference Device
first measurement
τLF_ [s]2.518
τHF_ [s]1·10−34·10−4
after 1 week
τLF_ [s]2.501
τHF_ [s]0.9·10−31.6·10−4
Disclaimer/Publisher’s Note: The statements, opinions and data contained in all publications are solely those of the individual author(s) and contributor(s) and not of MDPI and/or the editor(s). MDPI and/or the editor(s) disclaim responsibility for any injury to people or property resulting from any ideas, methods, instructions or products referred to in the content.