Abstract
Solid biofuels, including wood chips, are still the most important feedstock in the structure of primary energy production from renewable energy sources. Wood chips are derived mainly from forests and the wood industry, including sawmills. However, the considerable diversity of chipper types results in great differences in their final production efficiency. The objective of this study was to analyze and evaluate the efficiency of three mobile chippers used in wood chip production by determining their throughput rate, diesel fuel and energy consumption, cost of chipping and greenhouse gas emission, as well as the quality of the chips. By far shortest time (0.82 min. Mg−1) of producing 1 Mg of wood chips was found for the Albach 565 kW chipper. Moreover, the mean time needed for the production of 1 Mg of chips with a chipper of the same make but with a smaller engine (Albach 515 kW) was 8.8% longer. This time was 284.9% longer than when the Bruks chipper was used. However, the highest mean effectiveness of diesel fuel use (expressed as the lowest diesel fuel consumption of 1.41 dm3 Mg−1), the lowest energy consumption (52.02 MJ Mg−1), the lowest cost of diesel fuel use (2.28 € Mg−1) and the lowest GHG emission (4.27 kg Mg−1 CO2eq) in wood chip production were determined for the Albach 515 kW chipper. In contrast, the poorest parameters were determined for the Bruks chipper.
1. Introduction
The European Union’s reliance on external fossil fuel suppliers has always been very high, as the EU imports nearly three-fifths of all the energy it needs. Moreover, none of the EU countries is self-sufficient in satisfying its energy needs. Poland’s reliance on external fossil fuel energy source supplies is also increasing rapidly; it had grown to nearly 43% by 2020 [1]. Therefore, independence on external energy feedstock supplied is the fundamental challenge for the whole EU. Increased use of renewable energy sources (RES) is seen as one of the solutions promoted in the EU. The mean share of energy from RES in the EU increased from 16.0% to 21.8% between 2012 and 2021 [2]. Sweden was the leader among the EU countries, with its index in those years being 49.4% and 62.6%, respectively. The share of energy from RES in Poland in those years was much lower—10.9% and 15.6%, respectively. Solid biofuels (including wood chips, briquette and pellets) are the major energy source in the structure of primary energy production from RES, accounting for 40% in the EU and as much as 70% in Poland [3]. Solid biomass used for energy generation is derived mainly from forests, the wood industry and agriculture, including from production residues from the food industry [4,5,6,7,8,9] and from established perennial industrial crop (PIC) plantations [10,11,12,13,14,15].
Among the biomass sources mentioned above, forests and the wood processing industry are the major sources of woody biomass as production residues, e.g., twigs, slabs, shavings, sawdust, bark, etc. This is one of the consequences of the fact that the sawn timber production cycle leaves residue at logging sites and after primary processing, and over 63% of wood residue comes from sawmills [16,17,18]. Sawmill production residue can account for approximately 55% of the log charge [19], which obviously depends on the log diameter, the sawing pattern, workers’ experience, etc. [20]. Sawmill residue can be used in the production of chipboards, fiberboards, paper pulp, cardboard, boxes, litter for farm animals or compost [21,22,23]. Moreover, such residue is used in the power industry [24], and it accounts for the greatest portion of solid biomass used in combined heat and power plants and heat-generating plants, mainly as wood chips [7]. Therefore, the demand for wood chips is increasing steadily [25,26], and they have become the most commonly used solid biofuel, along with pellets [27]. Chips are produced by chipping slabs and edgings, which are not large enough for sawn timber [28], but they can also be produced from freshly felled logs [29] or solid wood [30], which are not suitable for other, more valuable uses.
In order to avoid competition for land between food production and biofuel production, support is growing for an increase in the share of non-cultivated materials [31]. Therefore, it is becoming increasingly important to study the issue of wood residues, including wood chips. However, wood chips can be produced from sawmill residue with various stationary chippers powered by electricity or mobile ones powered by liquid fuels, mainly diesel oil. Such chippers can be driven by a tractor’s power take-off, or they can have their own engines [32,33]. This latter option—mobile chippers equipped with diesel engines—ensures the highest flexibility in wood chip production logistics. However, due to a considerable diversity in engine types, power output and torque, they differ with respect to the ultimate wood chip production efficiency.
Therefore, detailed research of various types of mobile chippers used in wood chip production from sawmill residue aimed at evaluating the process efficiency and the product’s thermophysical and chemical properties is very important from a scientific and practical perspective. This will help to focus on the connection between the actions taken in wood chip production factories and the effects of such actions, which, in turn, will affect the further efficiency and justifiability of wood chip use as energy feedstock. Detailed data on the efficiency of wood chip production with various chippers is important, e.g., for decisions concerning logistics and production methods and for the assessment of costs and energy input, which would affect further outcomes of renewable energy production.
Therefore, the objective of this study was to analyze and evaluate the operational efficiency of three mobile chippers used in wood chip production by determining: (1) chipper throughput rate; (2) diesel fuel and energy consumption; (3) chipping cost; (4) greenhouse gas emission; and (5) the thermophysical properties and elemental composition of the chips produced.
2. Materials and Methods
2.1. Study Object
Sawmill residue in the form of non-debarked slabs, produced by cutting pinewood (Pinus sylvestris L.) logs, was the study material. P. sylvestris is a common species, both in Poland and in Europe and one of the most important from the economic perspective [34,35,36,37]. It is widely used in the production of sawn timber, cellulosic pulp, furniture production and the construction industry, and its production residue is used as solid biofuel in bioenergy generation [37]. Non-debarked slabs were stored in a sawmill for about two weeks and subsequently transported to a hardened concrete yard at Quercus sp. z o.o., situated in the north-east of Poland (GPS 53.6315, 20.7641), where wood chip production was studied [38]. The slabs were stored in the yard in 2–4 m high heaps for approximately three weeks. The shape and dimensions of the slabs varied, and their length ranged from 3.5 to 4.5 m. The width ranged from 3 to over 20 cm, and the thickness from 1 to 8 cm (Figure 1).
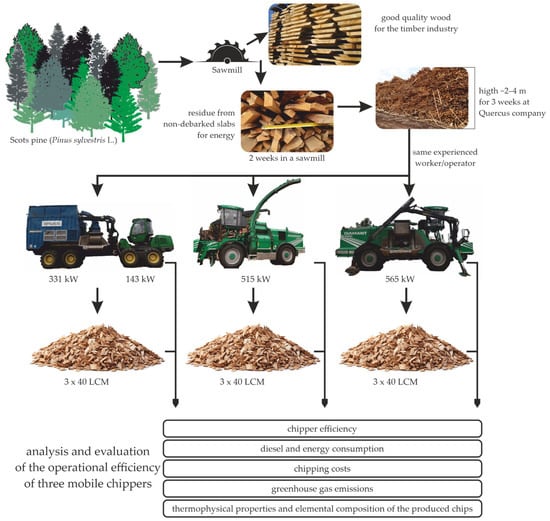
Figure 1.
The technological process of wood chip production tests.
2.2. Chippers and Chipping Tests
Quercus sp. z o.o. was established in 1992, and it is the leading producer of wood-derived domestic biomass for energy generation. Owing to their wide experience in the wood processing industry and state-of-the-art equipment and production technologies operated by highly trained personnel, the company can offer the highest-quality services of wood chip production for the power industry, heat generation and distributed power engineering [38]. Three different mobile chippers powered with diesel fuel were used for the wood chip production tests (Figure 1). They are owned by the company and used in everyday practice: (1) A John Deere 1510E log skidder and a Bruks 805.2 STC chipper (further referred to simply as a Bruks chipper). A John Deere 1510E was fitted out with a John Deere 6068 PowerTech 6-cylinder diesel engine with a turbocharger and intercooler. It had a displacement of 6.8 dm3, a maximum power output of 143 kW and a maximum torque of 800 Nm. The Bruks machine had a Scania DC12 6-cylinder in-line diesel engine. It had a displacement of 11.7 dm3, a maximum power output of 331 kW and a maximum torque of 1200 Nm. (2) A self-propelled Albach Diamant 2000 TAD1672VE chipper (further referred to simply as an Albach 515 kW chipper). This machine was fitted out with a Volvo PENTA TAD1672VE 6-cylinder diesel engine, with an SCR and AdBlue catalyst and PDE injection. It had a displacement of 16.1 dm3, a maximum power output of 515 kW and a maximum torque of 3200 Nm. (3) A self-propelled Albach Diamant 2000 TAD1643VE chipper (further referred to simply as an Albach 565 kW chipper). This was fitted out with a Volvo PENTA TAD1643VE 6-cylinder diesel engine, with PDE injection, without exhaust recirculation or AdBlue. It had a displacement of 16.1 dm3, a maximum power output of 565 kW and a maximum torque of 3260 Nm.
The tests of slab chipping with each chipper were carried out on 12 July 2022 at Quercus sp. z o.o. in three replicates. Producing 40 loose cubic meters (LCM) of wood chips was taken as one replicate. Therefore, the produced chips were put by the machines into a 40 LCM container placed on a concrete base. After the container was filled completely, it was transported by lorry to the scales to determine the chip weight. All the tested chippers were operated by one operator, designated by Quercus sp. z o.o. That operator had worked for several years on each of the machines, which guaranteed the stable and reliable feeding of the wood to the chippers and performance of the other actions during the chipping process which, in turn, resulted in the even operation of each machine. This helped to eliminate the impact of the human factor on chip production efficiency.
All three chippers were properly prepared for operation in accordance with everyday practice at the company. Before the tests, each machine was refueled so that its fuel tank was full. In order to determine the maximum throughput rate, only the effective chipping time for each machine was measured. To this end, the measurement was started at the beginning of chipping and ended when the container was full, i.e., when 40 LCM of wood chips had been produced. The chipping duration in each replicate was recorded in minutes (min) and seconds (s). Subsequently, the machine was refueled, which allowed for the exact determination of the amount of diesel fuel consumed in each replicate, in liters (dm3), to the second decimal place. The time between consecutive replicates needed for each chipper refueling and weighing each container was not taken into account in the analyses [38].
2.3. Chip Characteristics
Following the weighing process, the chips were discharged onto the concrete yard. Multiple random samples were then collected from various locations within the heap to evaluate their thermophysical properties and elemental composition. The determination of chip bulk density (kg LCM−1) aligned with the guidelines outlined in EN ISO 17828:2016. For moisture content determination, the chips were subjected to drying at 105 °C using a laboratory drier (FD BINDER). After drying, the samples were weighed. The assessment of moisture content followed the specifications of PN-EN ISO 18134-2 [39]. Subsequently, the dried samples underwent grinding in an analytical mill (Retsch SM 200) equipped with a 1 mm sieve. The ELTRA CHS 500 automatic analyzer was utilized to determine the carbon, hydrogen and sulfur content in compliance with PN-EN ISO 16948:2015-07 [40] and PN-EN ISO 16994:2016-10 [41]. The nitrogen content was assessed through the Kjeldahl method using a K-435 mineralizer and a BUCHI B-324 distilling device. Similarly, chlorine content determination followed the guidelines stated in PN-ISO 587:2000 [42], employing the Eschka mixture. To determine the ash content at 550 °C, as well as the volatile matter and fixed carbon content at 650 °C, the Eltra Tga-Thermostep thermogravimetric oven was employed, adhering to PN-EN ISO 18122:2016-01 [43] and PN-EN ISO 18123:2016-01 [44]. The higher heating value (HHV) was determined using the dynamic method in an IKA C2000 calorimeter. The calculation of the lower heating value (LHV) was based on the HHV, along with the previously determined moisture content and hydrogen content, in accordance with PN-EN ISO 18125:2017-07 [45]. All laboratory analyses were conducted in three replicates to ensure accuracy and reliability.
2.4. Chip Production Efficiency Analysis
The measurements performed during the tests provided grounds for calculating the indices that enable determining the efficiency of wood chip production by the chippers under examination. These included: production process duration for 1 Mg of chips (min. Mg−1); chipper throughput rate in time (Mg min.−1); diesel fuel consumption for 1 Mg of chips (dm3 Mg−1) and for 1 LCM of chips (dm3 LCM−1). Moreover, the mean energy value of diesel fuel (37 MJ dm−3) was used to calculate the energy value of the fuel consumed for the production of 1 Mg and 1 LCM wood chips. This was expressed in MJ Mg−1 and MJ LCM−1, respectively. The heating value of the chips and the energy used for their chipping were used to determine the percentage share (%) of the energy consumed in the diesel fuel to the energy accumulated in the chips. Moreover, the energy ratio for wood chip production was determined by dividing their LHV (energy output) by the energy consumed in diesel fuel for their production (energy input).
Subsequently, based on the mean fuel oil price in July 2022 (7.74 PLN dm−3, i.e., 1.62 € dm−3), the cost of the diesel fuel consumed for the production of 1 Mg and 1 LCM of chips was calculated. Polish zloty (PLN) were converted to euros (€) according to the average exchange rate published by the National Bank of Poland in July 2022. (1.00 € = 4.7737 PLN) and the cost was expressed in € Mg−1 and € LCM−1, respectively.
Subsequently, greenhouse gas (this includes carbon dioxide (CO2), methane (CH4) and nitrous oxide (N2O)) emission (converted to carbon dioxide equivalent (CO2eq)) from diesel fuel was calculated and referred to 1 Mg and 1 LCM of chips produced. Since the aggregated GHG index (CO2eq) from diesel fuel combustion in agricultural machine and vehicle engines is 82.03147 kg GJ−1 CO2eq [46], its value as referred to 1 dm3 of diesel fuel was 3.035 kg dm−3 CO2eq. This index and the diesel fuel consumption were used to calculate the GHG emission expressed in kg Mg−1 CO2eq and kg LCM−1 CO2eq.
2.5. Statistical Analysis
The statistical analyses conducted for evaluating chip quality and chip production efficiency indices were based on a one-way analysis of variance (ANOVA). The independent variable in this analysis was the type of chipper. For each attribute and index under investigation, the arithmetic means and standard deviations were computed. Tukey’s honestly significant difference (HSD) test was utilized at a significance level of p < 0.05 to identify homogeneous groups. Additionally, descriptive statistics were obtained for the entire dataset, including the mean, median, minimum and maximum values, lower and upper quartiles, standard deviation and coefficient of variation. Furthermore, agglomerative hierarchical clustering analysis was performed on the chip production attributes and indices, as well as the chip types. Prior to analysis, the input data were standardized column-wise. Ward’s method was employed for data agglomeration, while the Euclidean distance served as the distance measure. Cluster identification was accomplished using Sneath’s criterion. Two cut-off lines were applied on the dendrogram: the first at 2/3 Dmax, and the second at 1/3 Dmax, where Dmax denoted the maximum measure of distance D. All statistical analyses were performed with STATISTICA 13 (TIBCO Software Inc., Palo Alto, CA, USA).
3. Results and Discussion
3.1. Wood Chip Quality
Of the analyzed thermophysical properties and elemental composition of the produced chips, only the ash content varied significantly (p = 0.002) between the chippers used for cutting the pinewood slabs (Table 1). This comes as no surprise as each of the three chippers produced chips from the same raw material; therefore, a majority of their properties were not affected by the chippers. Moreover, chips produced by the Bruks chipper (John Deere 1510E log skidder combined with Bruks 805.2 STC chipper) contained significantly less ash (0.21% DM) than chips produced by the other two chipper models, Albach 515 kW and Albach 565 kW (0.29% DM) (Table 2). This stemmed from the differences in chipper feeding tables. In the Bruks chipper, there was an openwork mechanism in place that allowed for the separation of a portion of the bark and other mineral components prior to chipping. As a result of this separation process, the chips produced had a lower ash content. On the contrary, the feeding tables in the Albach chippers were solid and, in consequence, the whole raw material was turned into chips. The moisture content of the chips was approximately 38%, the bulk density approximately 250 kg LCM−1, and the LHV approximately 10.6 GJ Mg−1. Moreover, the pinewood chips contained high levels of carbon and low levels of sulfur, nitrogen and chlorine (Table 3). The highest coefficient of variation (19.44%) was calculated for the content of chlorine (Table 4). This may have been associated with the changes in the bark and ash content of the chips, as described above, as the coefficient of variation for the ash content was also among the higher ones (16.49%). These coefficients for the nitrogen and sulfur content were nearly 5% and nearly 4% for bulk density and LHV, respectively. In contrast, they were very low (under 1%) for the other parameters under study.

Table 1.
Analysis of variance (F and p values) for the analyzed features.
Table 2.
Selected properties of pinewood chips.
Table 3.
Elemental composition of pinewood chips.
Table 4.
Selected statistical analysis indicators for the parameters of pinewood chips.
The mean moisture content of P. sylvestris biomass, as measured in other studies, was 49%, with the moisture content of wood slabs (55%) being higher than that of sawdust (43%) [47]. Further, the moisture content of sawmill residue, as determined in other studies [48], was higher than 50% and as much as approximately 60% of the sawdust from freshly felled pine trees [49]. Sawdust from industrial pinewood processing also contained high mean moisture content levels (59.4%), and the moisture content of forest chips produced from small logs and twigs was lower (approximately 52.5%) [50]. A lower moisture content in chips produced from pinewood slabs in this study (approximately 38%) was a consequence of storing them for several weeks in summer in the sawmill and in the yard at the firm which produced the chips. Hence, the moisture content of the raw material (slabs) and, consequently, of the chips produced from it decreased naturally. This was confirmed in other studies [51], in which the mean moisture content of wood chips was 38.3% and ranged from 29% to 46% depending on when it was acquired. The moisture content of biomass has an immediate impact on the LHV. For this reason, the LHV of wood chips with the mean moisture content mentioned above was 10.46 GJ Mg−1, which was close to the values determined in the current study. In contrast, the lower LHV levels were determined for sawdust and wood slabs, mainly due to their higher moisture content [47].
It is generally accepted that sawmill residue contains lower ash levels than that originating from forests [52]. This was also confirmed in the current study, in which wood chips contained very low ash levels (a mean of 0.26% DM). The ash content of wood slabs, as determined in other studies [47], was higher (0.50% DM) compared with sawdust, which was caused by the fact that they contained an admixture of bark, which has more minerals than wood [53]. Further, sawmill pinewood sawdust contained 0.36% DM of ash [54], and sawdust from forest residues contained 0.50% DM [55]. The elemental composition (C, H, S, N, Cl) of pinewood chips, as determined in this study (Table 3), was similar to that reported in the literature [47,56].
3.2. Duration of Work and Throughput Rate of Chippers
The duration of the work of the chippers and their throughput rates varied significantly (p = 0.000) by their type (Table 5). The Bruks chipper took the (significantly) longest to produce 1 Mg of wood chips—a mean of 2.32 min. Mg−1 (Table 6). The significantly shortest time (0.82 min. Mg−1) of producing 1 Mg of wood chips was found for the Albach 565 kW chipper. Moreover, the mean time needed for the production of 1 Mg of chips with a chipper of the same make but with a smaller engine (Albach 515 kW) was 8.8% longer. This time was 284.9% longer than when the Bruks chipper was used. Therefore, the throughput rate of the chipper under study, expressed as the mass of chips produced per minute, was by far the lowest with the Bruks chipper—0.43 Mg min.−1. The Albach 515 kW and Albach 565 kW chipper throughput rates were 1.14 and 1.23 Mg min.−1, respectively. Therefore, the Albach chippers’ throughput rates were higher by 264% and 284%, respectively, compared with the Bruks chipper. The time needed for the production of 1 Mg of chips was the most highly diversified, which is shown in the coefficient of variation (55.4%) (Table 7). A slightly lower but still considerable dispersion was demonstrated for the chipper throughput rate (41.6%). There was a wide span between these two attributes which are important from a practical point of view. The time needed for the production of 1 Mg of wood chips ranged from (minimum–maximum) 0.75 to 2.50 min. Mg−1, and the chipper throughput rate from 0.40 to 1.33 Mg min.−1.
Table 5.
Analysis of variance (F and p values) for the analyzed features.
Table 6.
Selected indices for pinewood chip production.
Table 7.
Selected statistical analysis indicators for chip production indices.
The Bruks throughput rate, as determined in a different study, was approximately 0.6 Mg min.−1 [57], and it was higher than in this study. It was demonstrated in Estonia that the chipper throughput rate, as claimed in catalogues, varied and depended on the model and the engine power output and ranged from 100 to 300 m3 h−1 for the Doppstadt DH 608 and Heinola 910ES chippers, respectively [25]. Converting the figures would yield 0.42–1.25 Mg min.−1, which would be very similar to the findings of this study. After various technical, terrain-related and logistical factors were taken into consideration, these levels in the cited studies were lower by as much as 50%. This was also confirmed in [32], where the throughput rate for chippers with the power output of 100–199 kW; 200–299 kW; 300–399 kW and ≥400 kW was 0.17; 0.29; 0.32 and 0.43 Mg DM min.−1, respectively, which when referred to fresh matter would yield approximately twice higher values: between 0.34 and 0.86 Mg min.−1. The throughput rate, as determined in other studies by the same authors, in various technological options, with the use of smaller chippers with power demands of 70 to 139 kW, was much lower and ranged from 0.07 to 0.18 Mg DM min.−1, which when referred to fresh matter would yield values ranging from 0.14 to 0.36 Mg min.−1 [33]. A high diversity in chipper throughput rates depending on their model, power output and the technological and logistic aspects under various geographic conditions around the world was illustrated and confirmed in the review paper [58].
3.3. Consumption of Diesel Fuel and Energy for Chip Production
The highest efficiency of diesel fuel consumption (expressed as the lowest diesel fuel consumption of 1.41 dm3 Mg−1) for chip production was found for the Albach 515 kW chipper (Table 6). Moreover, this index was 13.9% higher for the chipper of the same make but with a stronger engine (Albach 565 kW). Further, diesel fuel consumption for the production of 1 Mg of chips with the Bruks chipper was significantly higher (by as much as 68.6%). Similar relationships between the chippers were demonstrated regarding diesel fuel consumption for the production of 1 LCM of chips. In this case, Albach 515 kW was again the most efficient option because the mean diesel fuel consumption was the lowest: 0.36 dm3 LCM−1. The diesel fuel consumption for the production of 1 LCM of chips by the Albach 565 kW and the Bruks chippers was higher by 15.7 and 65.7%, respectively.
The fuel consumption for chip production with Doppstadt DH 608 and Heinola 910ES chippers [25] amounted to 0.45 and 0.49 dm3 LCM−1, respectively, i.e., it was 25% and 37% higher compared with the Albach 515 kW in this study. Further, fuel consumption by Jenz HEM 582 DQ and Jenz HEM 561 DQ chippers was even higher in the cited study, amounting to 0.62 and 0.69 dm3 LCM−1, respectively, i.e., it was higher by 3% and 15% compared with the least effective Bruks chipper in this study. The diesel fuel consumption, as determined in other studies, amounted to approximately 0.5 dm3 LCM−1, regardless of the chipper type, which was similar to the average consumption determined in the current study [59]. However, it is clear that the chipper throughput rate and diesel fuel consumption during the chipping process depend on the power output and the technical condition of the chipper, the type of raw material, etc., which is why the fuel consumption ranged from 0.17 to 0.76 dm3 LCM−1 [32]. Moreover, the mean levels of this index in the cited studies ranged from 0.42 through 0.50 to 0.59 dm3 LCM−1 for 200–399 kW, ≥400 kW and 100–199 kW chippers, respectively. The throughput rate, as determined in other studies by the same authors examining chip production in various technological options, with the use of smaller chippers with power demands ranging from 70 to 139 kW, consumed from 0.30 to 0.64 dm3 LCM−1 [33].
Since energy consumption for chip production was a direct consequence of the amount of diesel fuel consumed, the relationships in this regard were similar to those for the fuel, but the figures were different. Therefore, the lowest mean energy consumption for chip production (52.02 MJ Mg−1) was determined for the Albach 515 kW chipper (Table 6). Moreover, this index was higher (59.25 MJ Mg−1) for the chipper of the same make but with a stronger engine (Albach 565 kW). Further, energy consumption by the Bruks chipper for the production of 1 Mg of chips was significantly higher (87.71 MJ Mg−1). Similar relationships between the chippers were demonstrated with respect to the energy consumption for the production of 1 LCM of chips. In this case, Albach 515 kW was again the most efficient option because the mean energy consumption was the lowest: 13.42 MJ LCM−1. The energy consumption for the production of 1 LCM of chips with the Albach 565 kW and the Bruks chippers was 15.53 and 22.24 MJ LCM−1, respectively. The energy consumption for chip production, as determined in a different study [25], ranged from 16.65 to 25.53 MJ LCM−1 for a Doppstadt DH 608 and Jenz HEM 561 DQ chipper, respectively, i.e., it was higher than that determined in this study.
The average variation in the diesel fuel and energy consumption was determined as approximately 25% (Table 7). The mean diesel fuel consumption amounted to 1.79 dm3 Mg−1, and it lay within a range between (minimum–maximum) 1.33 and 2.45 dm3 Mg−1, and the energy value of the diesel fuel ranged from 49.38 to 90.47 MJ Mg−1.
3.4. Cost, GHG Emission and Efficiency of Chip Production
The lowest cost of diesel fuel (2.28 € Mg−1) used for chip production was found for the Albach 515 kW chipper (Table 8). However, such cost incurred for the production of 1 Mg of chips with a chipper of the same make but with a stronger engine (Albach 565 kW) was 13.9% higher and amounted to 2.60 € Mg−1. The cost of fuel consumption by the Bruks chipper was 68.6% higher, and it was 3.84 € Mg−1. Similar relationships between the chippers were demonstrated for the diesel fuel costs incurred for the production of 1 LCM of chips, and this parameter lay within the range from 0.59 to 0.97 € LCM−1, for the Albach 515 kW and the Bruks chipper, respectively. The cost of diesel fuel used for chip production, as determined in a different study [25], ranged from 0.38 to 0.63 € LCM−1 for a Doppstadt DH 608 and Jenz HEM 582 DQ chipper, respectively, i.e., it was lower than that determined in the current study. However, this was a consequence of a lower price for the diesel fuel, which was approximately 1.22 € dm−3, whereas it was 1.62 € dm−3 in the current study.
Table 8.
Selected indices for pinewood chip production.
The lowest mean GHG emission from diesel fuel combustion (4.27 kg Mg−1 CO2eq) for the production of 1 Mg of chips was determined for the Albach 515 kW chipper (Table 8). Moreover, the GHG emission from the chipper with a stronger engine (Albach 565 kW) during the production process of 1 Mg of chips was 4.86 kg Mg−1 CO2eq. The GHG emission from the Bruks chipper was even higher: 7.19 kg Mg−1 CO2eq. Similar relationships between the chippers were demonstrated regarding the GHG emission associated with the production of 1 LCM of chips, and this parameter lay within the range from 1.10 to 1.82 kg LCM−1 CO2eq for the Albach 515 kW and the Bruks chipper, respectively. The mean GHG emission from diesel fuel combustion for chip production, as determined in a different study [25], was 1.80 kg LCM−1 CO2eq. Depending on the chipper type, this parameter would range from 1.37 to 2.09 kg LCM−1 CO2eq, for a Doppstadt DH 608 and Jenz HEM 561 DQ chipper, respectively, i.e., it was higher than that determined in the current study. It was also shown in other studies that the GHG emission from diesel fuel combustion would range from 1.27 to 1.79 kg LCM−1 CO2eq [32] and from 0.91 to 1.94 kg LCM−1 CO2eq [33].
The LHV of the chips and the energy contained in the diesel fuel consumed for their production indicated that the lowest ratio of the energy consumed to the energy accumulated in the chips (0.49%) was achieved for the Albach 515 kW chipper (Table 8). This index was equal to 0.56% and 0.83% for the Albach 565 kW and the Bruks chippers, respectively. The energy ratio for wood chip production was also the best (204) for the Albach 515 kW chipper. The Albach 565 kW chipper was also in the same homogeneous group “a”, but the energy ratio for it was nearly 180. In contrast, the energy ratio for chip production with the Bruks chipper was significantly lower (121), homogeneous group “b”. The mean energy consumed for chip production in other studies never exceeded 1% of the energy accumulated in a ton of dry matter [32]. Therefore, this result was higher than that determined in the current study. However, the value referred to moist rather than dry chips.
The variation of costs, GHG emission and efficiency for chip production was low (<25%) (Table 7). The results (minimum–maximum) lay within considerable ranges. The ranges for the costs, GHG emission and energy ratio were the following: 2.16–3.96 € Mg−1, 4.05–7.42 kg Mg−1 CO2eq and 117.4–214.3, respectively.
The cluster analysis based on all the 13 parameters determined for the chips (thermophysical properties and elemental composition) and 12 indices associated with their production resulted in two clusters into which all the 25 attributes fell, both at the cut-off of 1/3 Dmax and 2/3 Dmax (Figure 2a). One cluster included mainly the qualitative parameters of the chips, and the other those related to their production efficiency. Further, two clusters were isolated at the cut-off of 2/3 Dmax for the chippers under study (Figure 2b). Two chippers—Albach 515 kW and Albach 565 kW—made up one cluster, whereas Bruks was in another, independent cluster. However, not only was Bruks in a separate cluster at the cut-off of 1/3 Dmax, but Albach 515 kW and Albach 565 kW also made up independent clusters. Therefore, the analysis shows that it can be concluded at a higher level of generality that both Albach chippers have similar characteristics and throughput rates in chip production, and they made up one cluster. A more in-depth analysis revealed differences between them, due to which the Albach chippers were in two independent clusters.
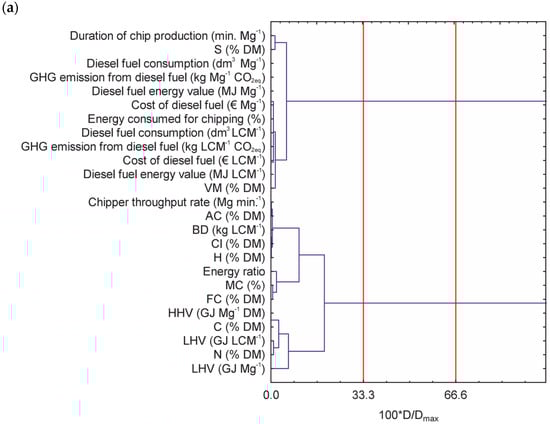
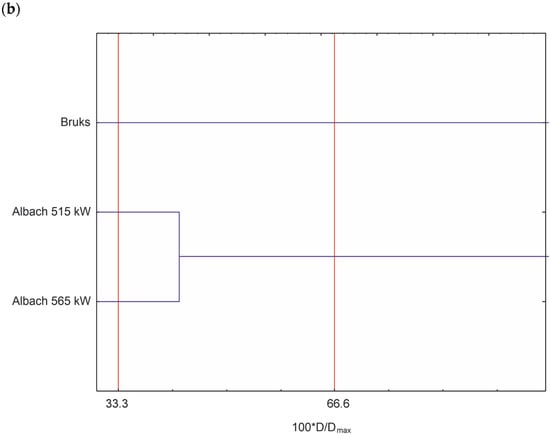
Figure 2.
The dendrogram of a hierarchical cluster analysis shows the similarities between chip properties (a) and the chippers used (b). The red vertical line marks the Sneath criterion (2/3 Dmax) and (1/3 Dmax). D—linage distance; Dmax—maximum linage distance.
This study has shown that the Albach chippers generally had better chip production effectiveness indices than the Bruks chipper. Further, chips produced by the Bruks chipper contained significantly less ash than chips produced by the two Albach models, which was caused by the differences in their feeding tables. Moreover, Albach chippers are machines of high chipping throughput, adapted to work mainly on hardened ground. However, biomass for Albach chippers must be gathered earlier in stacks with the use of other machines. Moreover, the purchase cost of chippers of this type is quite high—approximately € 950,000. On the other hand, Bruks can work under hard terrain conditions, including in logging areas, i.e., biomass does not have to be gathered in stacks beforehand. The purchase cost for this unit is lower (€ 840,000). Therefore, in practical terms, the choice of a chipper type will depend on the terrain, logistical and operational conditions, as well as on the throughput, energy-related, economic and environmental factors. In consequence, it can be accepted that each of the analyzed chippers has its advantages and disadvantages, whereas the choice of a specific solution will depend on many practical factors. Nevertheless, the knowledge of specific chip production indices presented in this study can be of significant cognitive and utilitarian importance.
4. Conclusions
This study dealt with how the use of various chipper types for wood chip production from sawmill residues may impact the process outcome. This is very important from both scientific and practical perspectives as it will have an effect on further effectiveness and justifiability of wood chips used for bioenergy generation. The tests and analyses conducted for this study showed that the duration, throughput rate and efficiency of wood chip production were significantly varied by the chipper type. The chip production process was by far the shortest with the Albach 565 kW chipper. The poorest results in this regard were achieved with the Bruks chipper. The analysis of all the parameters showed that of all the new generation chippers examined in this study, Albach 515 kW proved to be the most efficient, as its engine used diesel fuel in the most productive manner, generating the lowest energy input, the lowest chipping costs and the lowest GHG emission. On the contrary, the lowest throughput rate, efficiency of diesel fuel use and GHG emission were achieved with the Bruks chipper. The throughput rate and efficiency characteristics for wood chip production with various chippers are important factors affecting the decisions made by chip production companies. Moreover, chips produced by the Bruks chipper contained significantly less ash than chips produced by the two Albach models, which was caused by the differences in their feeding tables. The authors realize that many factors comprising the total costs, emission and energy intensity of chip production must be taken into consideration to fully explain the variation of the indices under analysis. However, this study dealt only with the subject matter presented in the manuscript. This research should be continued to gather full information in this regard, including its utilization in energy generation.
Author Contributions
Conceptualization, J.S., S.W. and M.J.S.; methodology, J.S., S.W. and M.J.S.; validation, S.W., J.S., S.N. and M.J.S.; formal analysis, J.S., S.W. and M.J.S.; investigation, J.S., S.W. and M.J.S.; data curation, J.S. and M.J.S.; writing—original draft preparation, J.S., S.W. and M.J.S.; writing—review and editing, S.W., J.S., S.N. and M.J.S.; visualization, J.S. and S.N.; supervision, S.W.; project administration, J.S. All authors have read and agreed to the published version of the manuscript.
Funding
The results presented in this paper were obtained as part of a comprehensive study financed by the University of Warmia and Mazury in Olsztyn, Faculty of Technical Sciences, Department of Mechatronics (grant No. 16.610.001-110); Faculty of Agriculture and Forestry, Department of Genetics, Plant Breeding and Bioresource Engineering (grant No. 30.610.007-110).
Data Availability Statement
Not applicable.
Acknowledgments
We would like to thank Quercus Sp. z o.o. and Department of Genetics, Plant Breeding and Bioresource Engineering staff for their technical support during the experiment.
Conflicts of Interest
The authors declare no conflict of interest.
References
- Eurostat. Key Figures on Europe; Eurostat: Kirchberg, Luxembourg, 2022. [Google Scholar] [CrossRef]
- Eurostat. Share of Energy from Renewable Sources. 2022. Available online: https://ec.europa.eu/eurostat/databrowser/view/nrg_ind_ren/default/table?lang=en (accessed on 28 May 2023).
- Statistics Poland. Energy from Renewable Sources in 2021; Statistics Poland: Warsaw, Poland, 2022; p. 96. [Google Scholar]
- Picchio, F.; Latterini, R.; Venanzi, W.; Stefanoni, A.; Suardi, D.; Tocci, L.; Pari, L. Pellet production from woody and non-woody feedstocks: A review on biomass quality evaluation. Energies 2020, 13, 2937. [Google Scholar] [CrossRef]
- Jankowski, K.J.; Dubis, B.; Sokólski, M.M.; Załuski, D.; Bórawski, P.; Szempliński, W. Productivity and energy balance of maize and sorghum grown for biogas in a large-area farm in Poland: An 11-year field experiment. Ind. Crops Prod. 2020, 148, 112326. [Google Scholar] [CrossRef]
- Stolarski, M.J.; Warmiński, K.; Krzyżaniak, M.; Olba–Zięty, E.; Akincza, M. Bioenergy technologies and biomass potential vary in northern European countries. Renew. Sustain. Energy Rev. 2020, 133, 110238. [Google Scholar] [CrossRef]
- Pedišius, N.; Praspaliauskas, M.; Pedišius, J.; Dzenajavičienė, E.F. Analysis of Wood Chip Characteristics for Energy Production in Lithuania. Energies 2021, 14, 3931. [Google Scholar] [CrossRef]
- Enström, J.; Eriksson, A.; Eliasson, L.; Larsson, A.; Olsson, L. Wood chip supply from forest to port of loading—A simulation study. Biomass Bioenergy 2021, 152, 106182. [Google Scholar] [CrossRef]
- Bielski, S.; Marks-Bielska, R.; Zielińska-Chmielewska, A.; Romaneckas, K.; Šarauskis, E. Importance of Agriculture in Creating Energy Security—A Case Study of Poland. Energies 2021, 14, 2465. [Google Scholar] [CrossRef]
- Serapiglia, M.J.; Cameron, K.D.; Stipanovic, A.J.; Abrahamson, L.P.; Volk, T.A.; Smart, L.B. Yield and woody biomass traits of novel shrub willow hybrids at two contrasting sites. Bioenergy 2013, 6, 533–546. [Google Scholar] [CrossRef]
- Manzone, M.; Bergante, S.; Facciotto, G. Energy and economic evaluation of a poplar plantation for woodchips production in Italy. Biomass Bioenergy 2014, 60, 164–170. [Google Scholar] [CrossRef]
- Amaducci, S.; Facciotto, G.; Bergante, S.; Perego, A.; Serra, P.; Ferrarini, A.; Chimento, C. Biomass production and energy balance of herbaceous and woody crops on marginal soils in the Po Valley. GCB Bioenergy 2017, 9, 31–45. [Google Scholar] [CrossRef]
- Matyka, M.; Radzikowski, P. Productivity and biometric characteristics of 11 varieties of willow cultivated on marginal soil. Agriculture 2020, 10, 616. [Google Scholar] [CrossRef]
- Scordia, D.; Papazoglou, E.G.; Kotoula, D.; Sanz, M.; Ciria, C.S.; Pérez, J.; Maliarenko, O.; Prysiazhniuk, O.; von Cossel, M.; Greiner, B.E.; et al. Towards identifying industrial crop types and associated agronomies to improve biomass production from marginal lands in Europe. GCB Bioenergy 2022, 14, 710–734. [Google Scholar] [CrossRef]
- Stolarski, M.J.; Stachowicz, P. Black locust, poplar or willow? Yield and energy value in three consecutive four-year harvest rotations. Ind. Crops Prod. 2023, 193, 116197. [Google Scholar] [CrossRef]
- Wzorek, M. Characterization of the properties of alternative fuels containing sewage sludge. Fuel Process. Technol. 2012, 104, 80–89. [Google Scholar] [CrossRef]
- Loeffler, D.; Anderson, N.; Morgan, A.M.; Sorenson, C.B. On-Site Energy Consumption at Softwood Sawmills in Montana. For. Prod. J. 2016, 66, 155–163. [Google Scholar] [CrossRef]
- Mansoori, G.A.; Agyarko, L.B.; Estevez, L.A.; Fallahi, B.; Gladyshev, G.; dos Santos, R.G.; Niaki, S.; Perisic, O.; Sillanpaa, M.; Tumba, K.; et al. Fuels of the Future for Renewable Energy Sources (Ammonia, Biofuels, Hydrogen). arXiv 2021. [Google Scholar] [CrossRef]
- Antwi-Boasiako, C.; Acheampong, B. Strength properties and calorific values of sawdust-briquettes as wood-residue energy generation source from tropical hardwoods of different densities. Biomass Bioenergy 2016, 85, 144–152. [Google Scholar] [CrossRef]
- Salvador, F.M.; da Silva Gomes, F.; da Silva, J.G.M.; Batista, D.C. Performance of a small eucalypt log sawmill: Work productivity, operational efficiency and lumber yield. Eng. Ind. Madeireira Tecnol. Pesqui. Tendências 2020, 1, 254–266. [Google Scholar] [CrossRef]
- Krigstin, S.; Hayashi, K.; Tchórzewski, J.; Wetzel, S. Current inventory and modelling of sawmill residues in Eastern Canada. For. Chron. 2012, 88, 626–635. [Google Scholar] [CrossRef]
- Islam, M.A.; Rahman, M.S.; Bosunia, A.K.M.A.; Lahiry, A.K. Present status and potentiality of the economic utilization of the sawmill residue and wastage in Bangladesh. In IRG/WP 04-50211 The International Research Group on Wood Preservation, Proceedings of the 35th Annual Meeting, Ljubljana, Slovenia, 6–10 June 2004; IRG Secretariat: Stockholm, Sweden, 2004; pp. 1–13. [Google Scholar]
- Mirski, R.; Dukarska, D.; Derkowski, A.; Czarnecki, R.; Dziurka, D. By-products of sawmill industry as raw materials for the manufacture of chip-sawdust boards. J. Build. Eng. 2020, 32, 101460. [Google Scholar] [CrossRef]
- Demirbas, A. Reuse of Wood Wastes for Energy Generation. Energy Sources Part A Recovery Util. Environ. Eff. 2009, 31, 1687–1693. [Google Scholar] [CrossRef]
- Irdla, M.; Padari, A.; Kurvits, V.; Muiste, P. The chipping cost of wood raw material for fuel in Estonian conditions. For. Stud. 2017, 66, 65–74. [Google Scholar] [CrossRef]
- Vusić, D.; Vujanić, F.; Pešić, K.; Šafran, B.; Jurišić, V.; Zečić, Ž. Variability of Normative Properties of Wood Chips and Implications to Quality Control. Energies 2021, 14, 3789. [Google Scholar] [CrossRef]
- Shehab, M.; Stratulat, C.; Ozcan, K.; Boztepe, A.; Isleyen, A.; Zondervan, E.; Moshammer, K. A Comprehensive Analysis of the Risks Associated with the Determination of Biofuels’ Calorific Value by Bomb Calorimetry. Energies 2022, 15, 2771. [Google Scholar] [CrossRef]
- Milota, M. Corrim Report: Module B, Life Cycle Assessment for the Production of Pacific Northwest Softwood Lumber, 1st ed.; Oregon State University: Corvallis, OR, USA, 2015; pp. 1–73. [Google Scholar]
- Singh, T.; Singh, A.; Hussain, I.; Hall, P. Chemical characterisation and durability assessment of torrefied radiata pine (Pinus radiata) wood chips. Int. Biodeterior. Biodegrad. 2013, 85, 347–353. [Google Scholar] [CrossRef]
- Lock, P.; Whittle, L. Future Opportunities for Using Forest and Sawmill Residues in Australia, 1st ed.; ABARES: Camberra, Australia, 2018. [Google Scholar] [CrossRef]
- Soam, S.; Börjesson, P. Considerations on Potentials, Greenhouse Gas, and Energy Performance of Biofuels Based on Forest Residues for Heavy-Duty Road Transport in Sweden. Energies 2020, 13, 6701. [Google Scholar] [CrossRef]
- Kuptz, D.; Hartmann, H. The effect of raw material and machine setting on chipping performance and fuel quality—A German case study. Int. J. For. Eng. 2015, 26, 60–70. [Google Scholar] [CrossRef]
- Kuptz, D.; Hartmann, H. Evaluation of Fuel Quality, Throughput Rate and Energy Consumption During Non-Industrial Wood Chip Production with Three PTO Driven Chippers. Croat. J. For. Eng. 2022, 43, 109–122. [Google Scholar] [CrossRef]
- Zajączkowski, G.; Jabłoński, M.; Jabłoński, T.; Szmidla, H.; Kowalska, A.; Małachowska, J.; Piwnicki, J. Forest Condition Report in Poland 2020, 1st ed.; Centrum Informacyjne Lasów Państwowych: Warszawa, Polska, 2021. [Google Scholar]
- Kozakiewicz, P.; Jankowska, A.; Mamiński, M.; Marciszewska, K.; Ciurzycki, W.; Tulik, M. The Wood of Scots Pine (Pinus sylvestris L.) from Post-Agricultural Lands Has Suitable Properties for the Timber Industry. Forests 2020, 11, 1033. [Google Scholar] [CrossRef]
- Krakau, U.-K.; Liesebach, M.; Aronen, T.; Lelu-Walter, M.-A.; Schneck, V. 6 Scots Pine (Pinus sylvestris L.). In Forest Tree Breeding in Europe, 1st ed.; Pâques, L.E., Ed.; Springer: Dordrecht, Netherlands, 2013; pp. 267–323. [Google Scholar]
- Roszyk, E.; Mania, P.; Iwańska, E.; Kusiak, W.; Broda, M. Mechanical Performance of Scots Pine Wood from Northwestern Poland—A Case Study. BioResources 2020, 15, 6781–6794. [Google Scholar] [CrossRef]
- Stolarski, J. Analysis of the Efficiency of Internal Combustion Engines in Wood Chipping Machines. Engineering Thesis, University of Warmia and Mazury in Olsztyn: Olsztyn, Poland, 2023; p. 49. [Google Scholar]
- PN-EN ISO 18134-2; Solid Biofuels–Determination of Moisture Content–Dryer Method–Part 2: Total Moisture–Simplified Method. Polish Standardization Committee: Warsaw, Poland, 2014.
- PN-EN ISO 16948:2015-07; Solid biofuels—Determination of total content of carbon, hydrogen and nitrogen. Polish Standardization Committee: Warsaw, Poland, 2015.
- PN-EN ISO 16994:2016-10; Solid biofuels—Determination of total content of sulfur and chlorine. Polish Standardization Committee: Warsaw, Poland, 2016.
- PN-ISO 587:2000; Solid fuels—Determination of chlorine using Eschka mixture. Polish Standardization Committee: Warsaw, Poland, 2000.
- PN-EN ISO 18122:2016-01; Solid biofuels—Determination of ash content. Polish Standardization Committee: Warsaw, Poland, 2016.
- PN-EN ISO 18123:2016-01; Solid biofuels—Determination of volatile matter content. Polish Standardization Committee: Warsaw, Poland, 2016.
- PN-EN ISO 18125:2017-07; Solid biofuels—Determination of calorific value. Polish Standardization Committee: Warsaw, Poland, 2017.
- Eggleston, H.S.; Buendia, L.; Miwa, K.; Ngara, T.; Tanabe, K. (Eds.) The Intergovernmental Panel on Climate Change (IPCC) Guidelines for National Greenhouse Gas Inventories; IGES: Hayama, Japan, 2006. [Google Scholar]
- Dudziec, P.; Stachowicz, P.; Stolarski, M.J. Diversity of properties of sawmill residues used as feedstock for energy generation. Renew. Energy 2023, 202, 822–833. [Google Scholar] [CrossRef]
- Sermyagina, E.; Nikku, M.; Vakkilainen, E.; Hyppanen, T. Study on properties related to energy recovery from waste streams in Finland. In WASTES—Solutions, Treatments and Opportunities II, 1st ed.; Vilarinho, C., Castro, F., de Lurdes Lopes, M., Eds.; CRC Press: London, UK, 2017; pp. 69–74. [Google Scholar] [CrossRef]
- Laurila, J.; Havimo, M.; Lauhanen, R. Compression drying of energy wood. Fuel Process. Technol. 2014, 124, 286–289. [Google Scholar] [CrossRef]
- Deboni, T.; Simioni, F.; Brand, M.; Lopes, G. Evolution of the quality of forest biomass for energy generation in a cogeneration plant. Renew. Energy 2019, 135, 1291–1302. [Google Scholar] [CrossRef]
- Stolarski, M.J.; Stachowicz, P.; Sieniawski, W.; Krzyżaniak, M.; Olba-Zięty, E. Quality and Delivery Costs of Wood Chips by Railway vs. Road Transport. Energies 2021, 14, 6877. [Google Scholar] [CrossRef]
- Gendek, A.; Malatak, J.; Velebil, J. Effect of harvest method and composition of wood chips on their caloric value and ash content. Sylwan 2018, 162, 248–257. [Google Scholar]
- Krutul, D.; Zielenkiewicz, T.; Radomski, A.; Zawadzki, J.; Antczak, A.; Drożdżek, M.; Makowski, T. Metals accumulation in Scots pine (Pinus sylvestris L.) wood and bark affected with environmental pollution. Wood Res. 2017, 62, 353–364. [Google Scholar]
- Carrillo-Parra, A.; Contreras-Trejo, J.C.; Pompa-García, M.; Pulgarín-Gámiz, M.Á.; Rutiaga-Quiñones, J.G.; Pámanes-Carrasco, G.; Ngangyo-Heya, M. Agro-Pellets from Oil Palm Residues/Pine Sawdust Mixtures: Relationships of Their Physical, Mechanical and Energetic Properties, with the Raw Material Chemical Structure. Appl. Sci. 2020, 10, 6383. [Google Scholar] [CrossRef]
- Cordero, T.; Marquez, F.; Rodriguez-Mirasol, J.; Rodriguez, J.J. Predicting heating values of lignocellulosic and carbonaceous materials from proximate analysis. Fuel 2001, 80, 1567–1571. [Google Scholar] [CrossRef]
- Stolarski, M.J.; Dudziec, P.; Olba-Zięty, E.; Stachowicz, P.; Krzyżaniak, M. Forest Dendromass as Energy Feedstock: Diversity of Properties and Composition Depending on Systematic Genus and Organ. Energies 2022, 15, 1442. [Google Scholar] [CrossRef]
- Ghaffariyan, M.R.; Andonovski, V.; Brown, M. Application of slash-bundler for collecting harvest restudies in Eucalyptus plantation. For. Sci. 2011, 48, 83–89. [Google Scholar]
- Ghaffariyan, M.R.; Brown, M.; Acuna, M.; Sessions, J.; Gallagher, T.; Kühmaier, M.; Spinelli, R.; Visser, R.; Devlin, G.; Eliasson, L.; et al. An international review of the most productive and cost-effective forest biomass recovery technologies and supply chains. Renew. Sustain. Energy Rev. 2017, 74, 145–158. [Google Scholar] [CrossRef]
- Spinelli, R.; Magagnotti, N. Determining long-term chipper usage, productivity and fuel consumption. Biomass Bioenergy 2014, 66, 442–449. [Google Scholar] [CrossRef]


Disclaimer/Publisher’s Note: The statements, opinions and data contained in all publications are solely those of the individual author(s) and contributor(s) and not of MDPI and/or the editor(s). MDPI and/or the editor(s) disclaim responsibility for any injury to people or property resulting from any ideas, methods, instructions or products referred to in the content. |
© 2023 by the authors. Licensee MDPI, Basel, Switzerland. This article is an open access article distributed under the terms and conditions of the Creative Commons Attribution (CC BY) license (https://creativecommons.org/licenses/by/4.0/).