Article

Optimization of Polypropylene Waste Recycling Products as Alternative Fuels through Non-Catalytic Thermal and Catalytic Hydrocracking Using Fresh and Spent Pt/Al2O3 and NiMo/Al2O3 Catalysts

by
Murtadha S. Al-Iessa
1,
Bashir Y. Al-Zaidi
1,
Riaydh S. Almukhtar
1,
Zaidoon M. Shakor
1 and
Ihsan Hamawand
2,*
1
Department of Chemical Engineering, University of Technology-Iraq, Alsinaa Street 52, Baghdad 10066, Iraq
2
Process Operation, Wide Bay Water & Waste Services, Fraser Coast Regional Council, Hervey Bay Qld, QLD 4655, Australia
*
Author to whom correspondence should be addressed.
Energies 2023, 16(13), 4871; https://doi.org/10.3390/en16134871
Submission received: 15 May 2023 / Revised: 14 June 2023 / Accepted: 19 June 2023 / Published: 22 June 2023
(This article belongs to the Section B: Energy and Environment)

Abstract

:
In this work, the conversion of waste polypropylene to alternative fuels (liquid and gas) was performed through non-catalytic thermal and catalytic hydrocracking over NiMo/Al2O3 and Pt/Al2O3 catalysts. The process was carried out in an autoclave batch reactor at a temperature of 450 °C and a pressure of 20 bar, which were selected based on experimental optimization. The spent catalyst was also successfully regenerated at 700 °C under a hot airflow. Experiments were conducted to determine the optimum conditions to completely separate the deactivated catalyst from the solid residue easily. The regenerated catalyst was reused to facilitate the economic cost reduction of the process. The reactivated catalysts have almost the same catalytic properties as the fresh catalysts; this was confirmed by several characterization techniques, such as TGA, XRD, SEM, EDX, BET and FTIR. The produced liquids/gases were quantified and classified into their fractions by the number of carbon atoms and gasoline to diesel ratio using GC/MS. The viscosity, density, API gravity, pour point and flash point of oil cuts were also investigated to evaluate the quality of the resulting liquid from the reactions. The NiMo/Al2O3 catalyst gave the highest liquid hydrocarbons yield of 86 wt%, while the highest weight products of gasoline range hydrocarbon fractions of 49.85 wt% were found over the Pt/Al2O3 catalyst. Almost the same catalytic behavior was found with the regenerated catalysts compared to the fresh catalysts. However, the highest gaseous products at 20.8 wt% were found in the non-catalytic thermal products with an increase in the diesel fuel range of 80.83 wt%. The kinetic model was implemented using six lumps and fifteen reactions, and the apparent activation energies for the gasoline and diesel fractions were calculated. In general, all primary and secondary reactions show greater activation energy values on the Pt/Al2O3 catalyst than on the NiMo/Al2O3 catalyst.

1. Introduction

The use of plastic products in the world is rising every day. Because they are flexible, durable, lightweight and cheap in cost, plastic materials have become an inseparable part of our lives, as they are frequently utilized in homes, industry and agriculture to make a wide variety of products related to daily human life. Plastics are polymeric materials derived from natural resources [1]. Excessive usage of these polymers is connected with creating enormous amounts of waste, representing a great threat to the environment. They are disposed of using various techniques, including burning, land-filling, reusing and conversion into value-added products. However, most of these techniques are inexpensive; they create pollution with several environmental consequences. Among these approaches, conversion into value-added products is now being explored as a result of its many scientifically proven benefits [2]. Plastic waste management has become a global issue due to its non-biodegradable nature. Plastic trash is classified as either pre-consumer or post-consumer waste. Plastic scraps created by industries during product manufacture are included in pre-consumer plastic trash. Because they are clean and similar, these plastics are typically easier to recycle. Consumers generate post-consumer plastic wastes after using products. Because they are difficult to collect, dirty after use and heterogeneous, these plastics are more challenging to recycle. Approximately, only 9 percent of the 400 million tons of plastic generated each year in the world is recycled, and 12 percent is burned. Landfills, rivers and seas are becoming dangerously polluted with plastic trash [1,3]. If burned, they emit carbon dioxide and potentially hazardous gases, which accounted for 5.9 million cubic meters of carbon dioxide in 2015 [3]. As a result, recycling and plastic waste management are becoming increasingly important. The waste plastic polymer can be recycled into original monomers or other useful compounds such as fuel, since plastic and petroleum have the same basic hydrocarbon components. Waste plastic fuel has similar properties to diesel fuel, and it has been concluded that it can be used instead of diesel. The calorific value of fuel generated from plastic waste is about 9829.3515 kcal/kg, which is almost equal to the calorific value of diesel. It is also possible to produce many other petroleum derivatives from waste plastics such as gasoline, kerosene, heavy fuel oil (HFO), light fuel oil (LFO) and furnace oil, thus reducing the high demand for fossil fuel products [4].
Pyrolysis is the thermal breakdown of big molecules in an inert environment with the absence of oxygen at high operating conditions such as temperature and pressure [1,4]. In general, plastics are long-chain molecules of hydrocarbon and include several kinds such as high-density polyethylene (HDPE), polypropylene (PP), polystyrene (PS), polyethylene terephthalate (PET), low-density polyethylene (LDPE), polyvinyl chloride (PVC) and other less famous plastics, which have been used less as polymers. Among these groups, a higher amount of PP is produced in comparison with other types of plastic products that generate large amounts of waste each year [3]. The GC/MS instrument has been used to successfully characterize the thermal degradation of PP waste plastic to generate fuel oil. The heavy oil generated had a dark color and an unpleasant odor. According to the GC/MS study, heavy fuel has a carbon chain range of C4 to C35, similar to fuel-grade oil. The fuel oil produced from PP could be an alternative to renewable energy and be used in industry and transportation [3]. Vijayakumar et al. [5] reviewed a summary of different types of plastics and the potential of pyrolysis for fuel production. The pyrolysis process is approved as a potential method to generate energy from plastic waste. The pyrolysis results of PP polymer in a batch reactor were achieved with a temperature of 380 °C. The ratio of oil obtained was 80.1 wt%, while the gas and solid ratios were 6.6 and 13.3 wt%, respectively. Pyrolysis of PP was performed by Samosa et al. [6] at a temperature of 350 °C, and the product was a liquid oil with a density of 0.8204 g/cm3. GC/MS analysis confirmed that the compounds obtained from the thermal cracking had carbon chains between C7 and C27, which was an indication that this compound is a mixture of kerosene (C8 to C19)–diesel (C7 to C27) fractions. Hakeem et al. [7] studied the pyrolysis process that converts polypropylene plastic waste into usable liquid fuel at an optimal temperature of 450 °C and a catalyst-to-plastic ratio of 1 to 3. Kaolin was shown to be an efficient, low-cost catalyst for converting PP to gasoline/diesel grade fuel. The kaolin was more selective for liquid pyrolysis products than solid and gaseous pyrolysis products. The oil obtained from the kaolin-catalyzed pyrolysis reaction is higher than the oil obtained from the uncatalyzed reaction. Moreover, thermal pyrolytic liquid fuel requires further development to be commercially viable and suitable for use as fuel. When the catalyst was used, the FTIR findings revealed that the oil included hydrocarbons with different functional groups due to the secondary breaking of the oil into lighter products. In fact, the feedstock plastic-type, cracking temperature, heating rate, operation pressure, reactor type, residence time, catalyst feed ratio and catalyst type are the key parameters impacting the plastic pyrolysis process and pyrolysis product molecular dispersion. Temperature is one of the main significant operational variables since it controls the polymer materials’ cracking response. By raising the temperature, not all polymer materials can be fractured. The Van der Waals force is the force between molecules that keeps them together and prevents them from collapsing. When the vibration of molecules is high enough, they evaporate from the liquid surface [8]. However, if the energy produced by the Van der Waals force along the polymer chains is higher than the enthalpy of the C-C bond in the chain, the carbon chain will be broken [9]. This is why when a high molecular weight polymer is heated, it decomposes rather than boils [8,9,
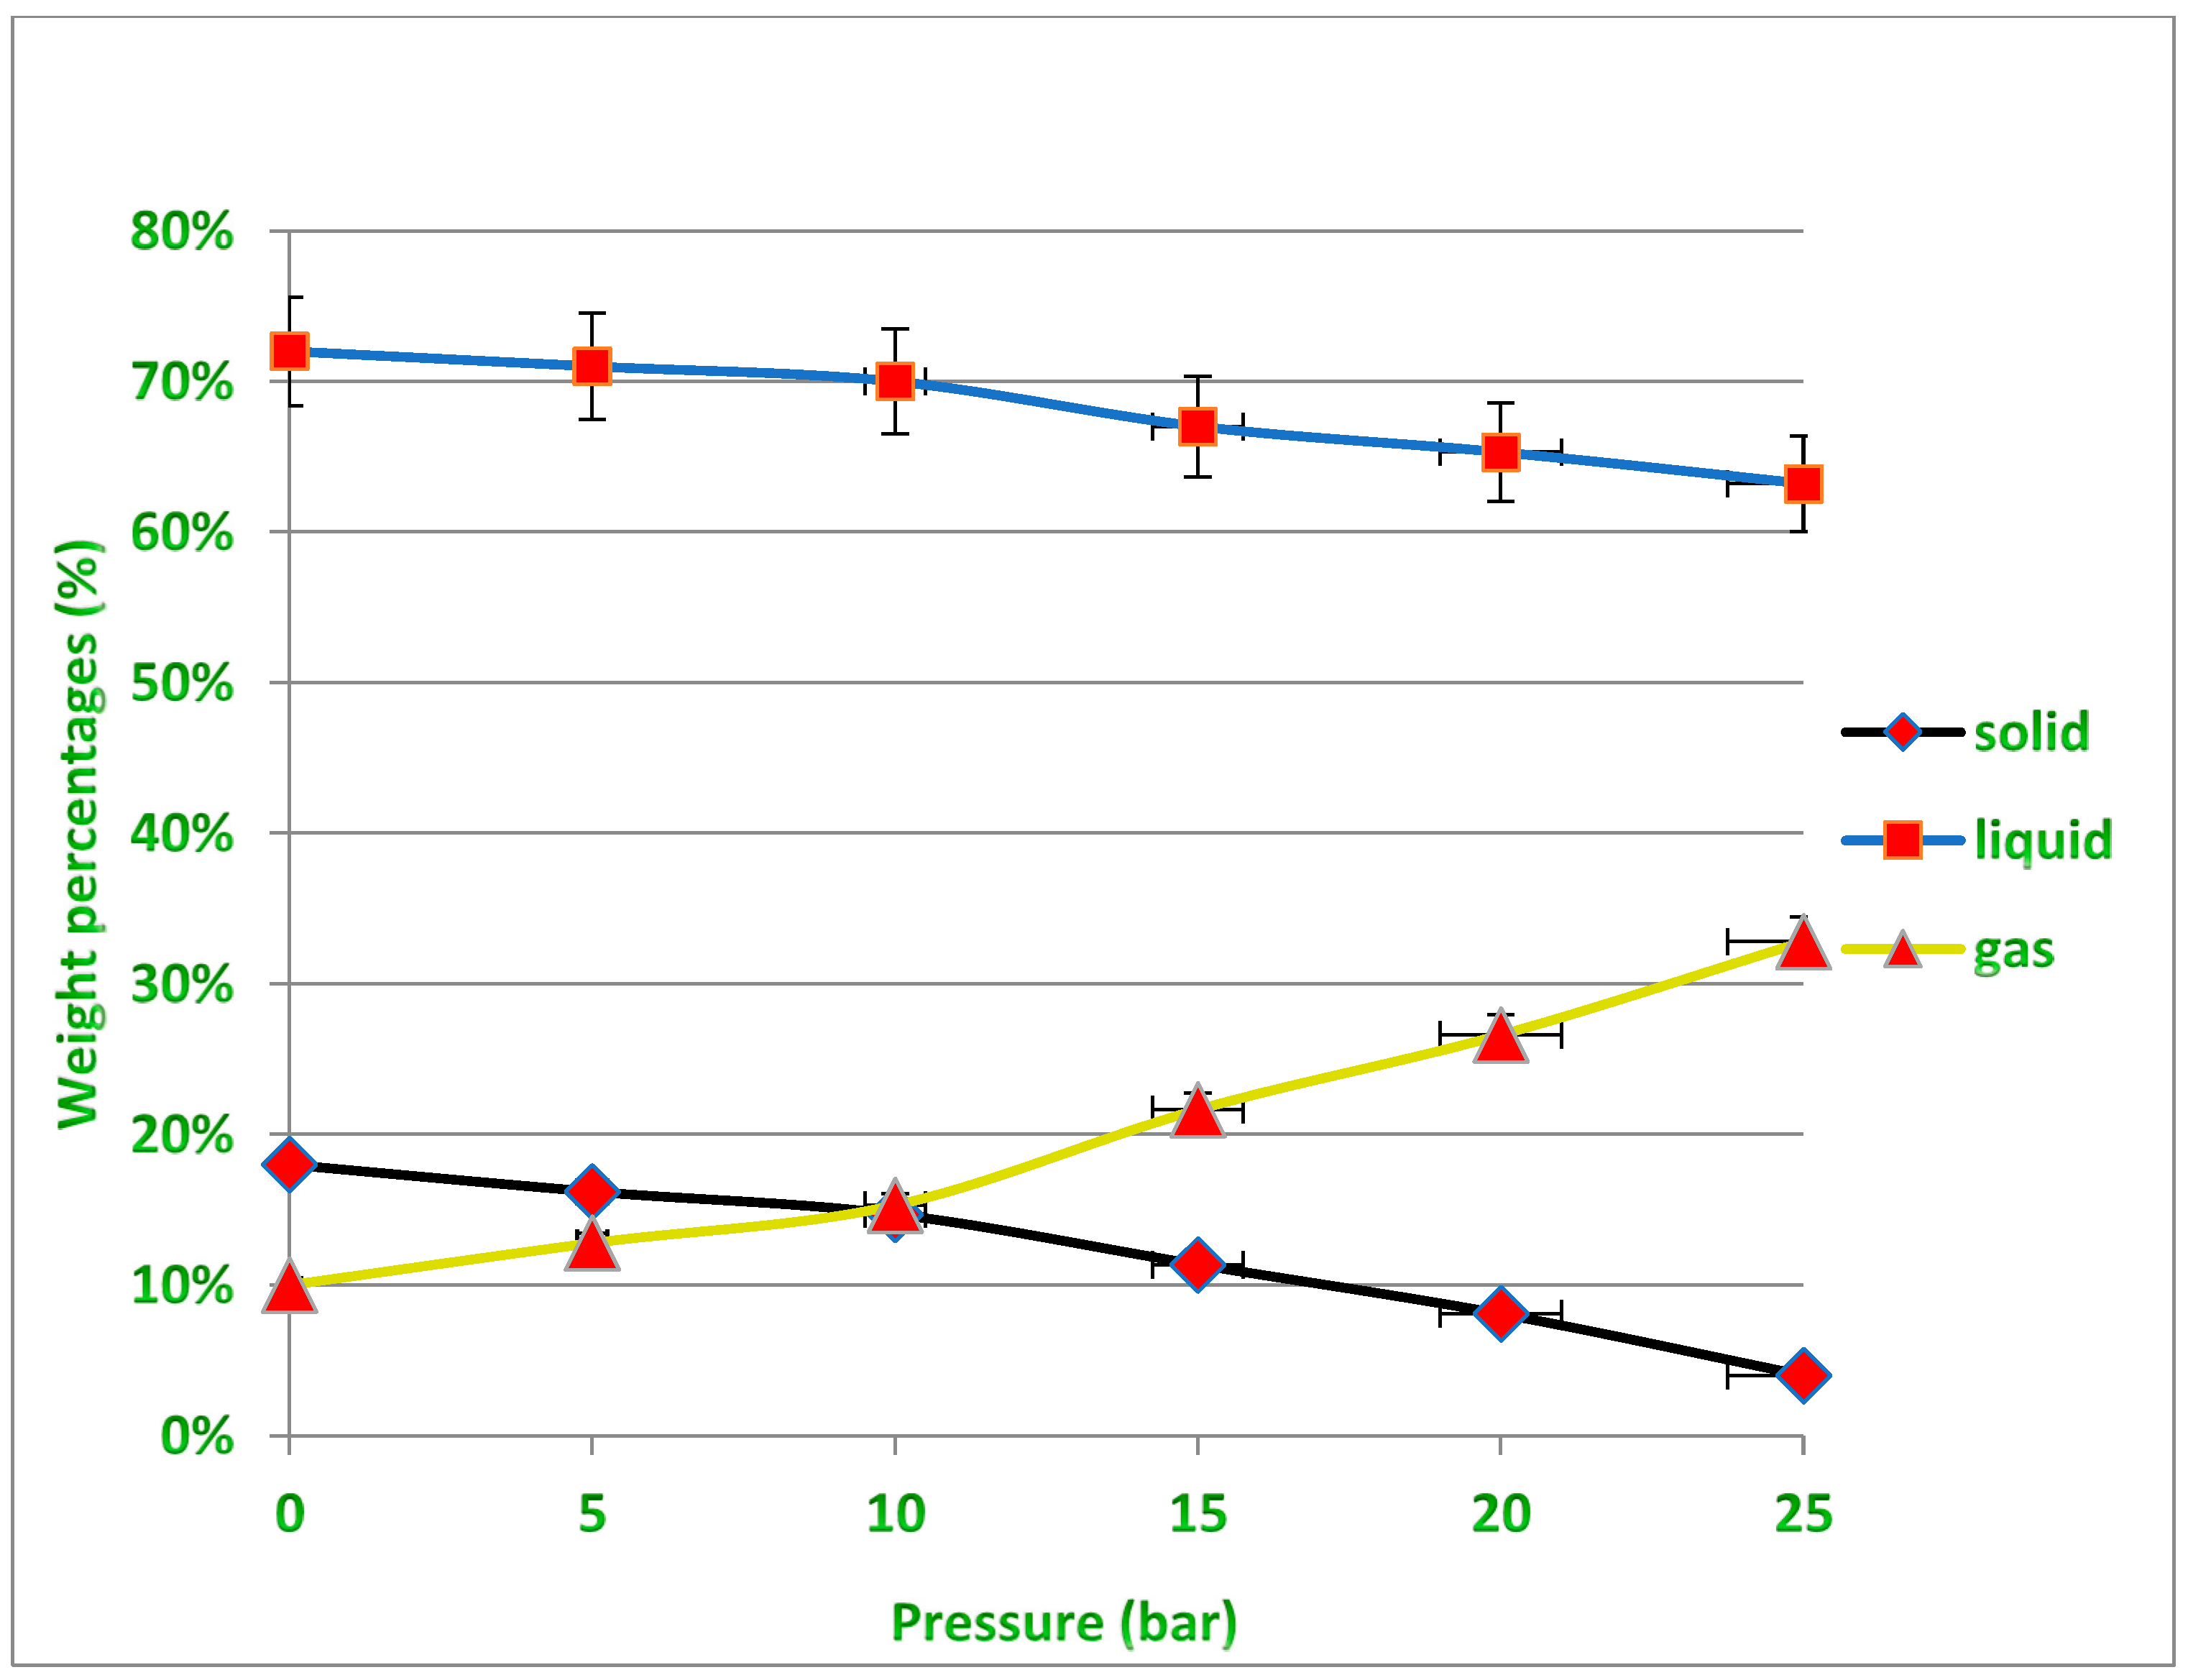
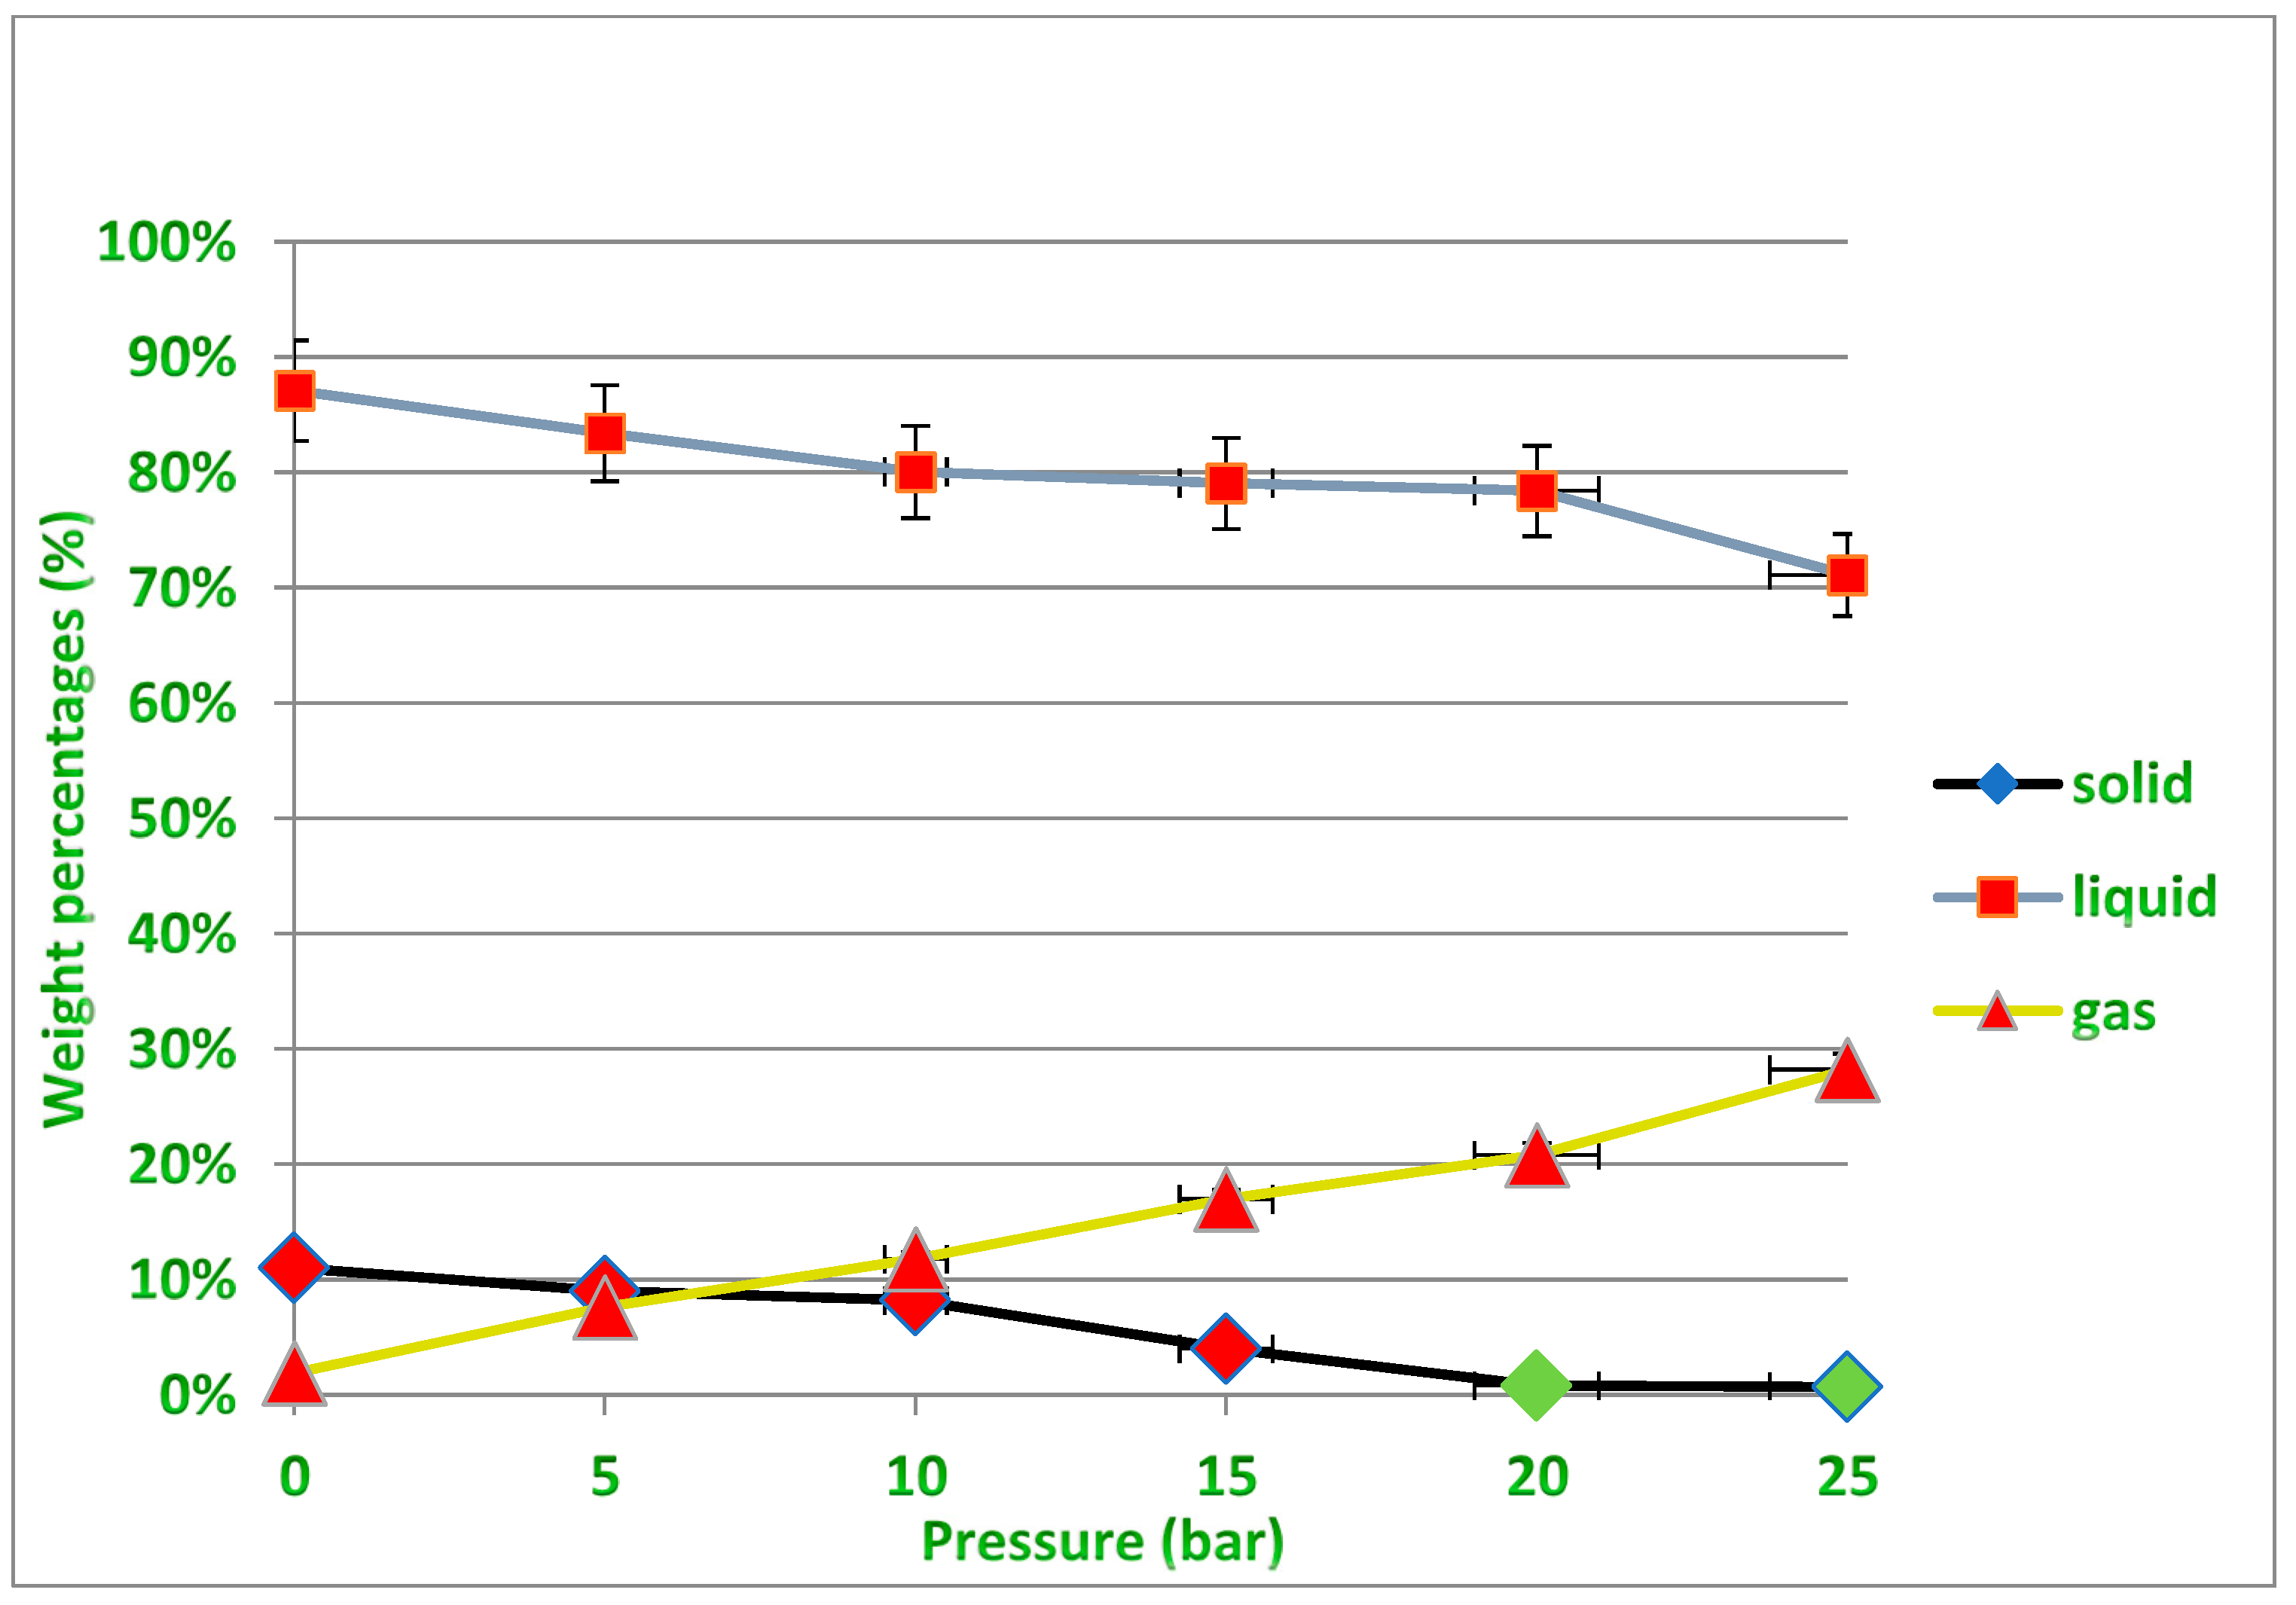
10]. The second parameter that researchers focused on is pressure; both the pyrolysis process and the amount of hydrocarbons and their fractions in pyrolysis products are affected by operating pressure. Because the boiling points of pyrolysis products grow with increasing pressure, heavier hydrocarbons are further pyrolyzed rather than evaporated at a given operating temperature in a pressurized atmosphere. In practice, additional energy is necessary for subsequent hydrocarbon cracking in pressured pyrolysis. High pressure may increase the product gases and lower the yield of liquid products and solid residue. As a result, the average molecular weight of the gas, liquid and solid products also decreases with pressure [10,11,12,13]. In order to optimize plastic pyrolysis reactions and modify the distribution of pyrolysis products, catalysts are widely used in research and industrial pyrolysis processes, which is the third and most important parameter that has attracted the attention of researchers in this field. The thermal decomposition of waste plastics can be accelerated with the use of appropriate catalysts. Zeolite, alumina, silica alumina, the FCC catalyst, the reforming catalyst and other catalysts are commonly employed in this process [4,14,15,16,17]. Table 1 summarizes some of the most common catalysts used in polymer cracking reactions.
In catalytical pyrolysis, lower operating conditions will be needed for the thermal reaction [10]. If the cracking process is achieved by a reaction with hydrogen instead of an inert gas, it is known as hydrocracking [
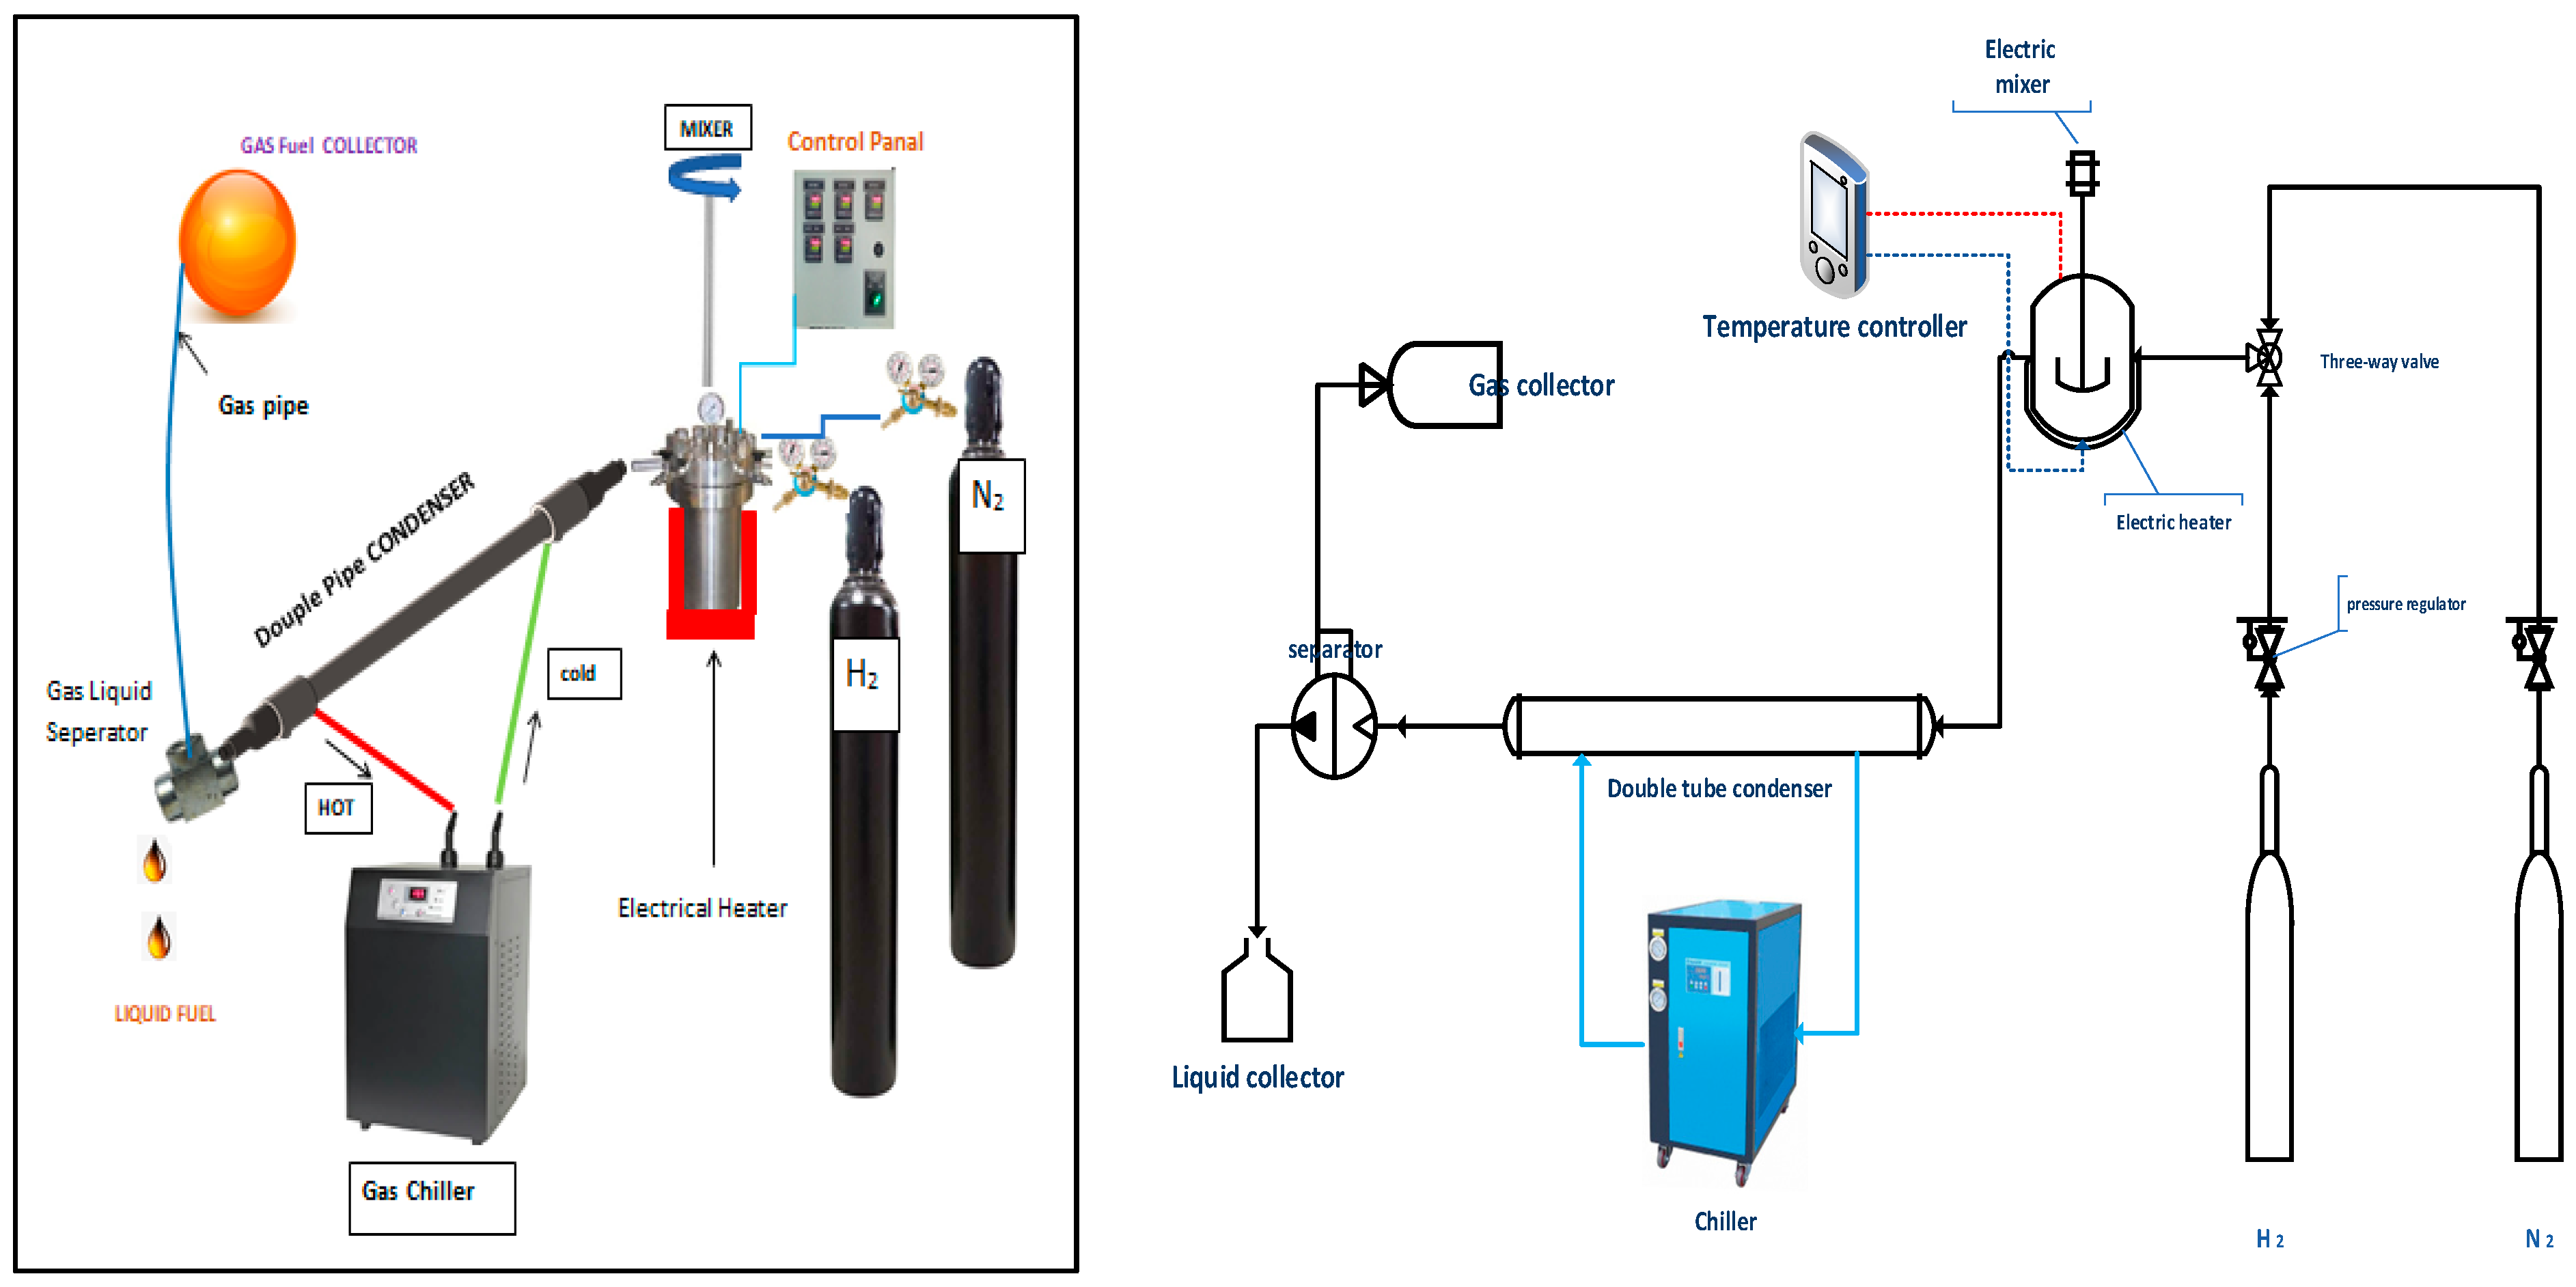
21]. Hydrocracking of polymer waste typically involves complex reactions that occur on the surfaces of special metal-loaded catalysts, including the reactions of hydrogenation and dehydrogenation inside a stirred batch autoclave at moderate temperatures and pressures, typically 150–450 °C and 20–100 bar, and obtained products containing high-quality fuel [21]. The application of cracking reactions in the presence of hydrogen reduces unwanted solid residues and increases the selectivity of single-ring aromatics compared to inert pyrolysis. In other words, hydrogen is more beneficial to pyrolysis in terms of lowering coke yield and increasing hydrocarbon yield, and this fact was concluded by Yuan Xue et al. [22]. An alumina catalyst was preferred because it is classically used in the petroleum refineries for cracking reactions in various parts of the world [21,23]. Therefore, it is possible to take the spent catalyst from these refineries and use it in polymer waste hydrocracking reactions after regenerating. In addition, the high acidity properties and the moderate price of alumina catalysts makes it possible to use them without affecting the economic viability of the process compared to other expensive catalysts such as zeolites [24,25]. Moreover, it was shown that adding metals such as molybdenum, platinum and nickel to a catalyst can increase the acidity of the catalyst, and more cracking of large molecules with better liquid quality would be achieved due to the saturation of unsaturated hydrocarbon, and produce a more stable range of gasoline–diesel products [21].
The aim of this work was to compare the quantity and quality of the reaction products from non-catalytic thermal- and catalytic hydrocracking processes. However, the focus was on making the hydrocracking process economical in terms of its practical application by separating the deactivated catalyst (i.e., spent catalyst) from the solid residues at the end of the plastic waste hydrocracking reactions. This was then further utilized after regeneration (i.e., reactivation) and its properties tested through its catalytic behavior and reaction products because the cost of using a fresh catalyst in each reaction makes recycling the waste into useful products an expensive and uneconomical procedure. Thus, the reaction conditions that give the best yield (i.e., maximizing the amount of useful products, such as oils and gases, while at the same time minimizing environmentally harmful solid waste as much as possible) are taken into account in this research. Since reducing the percentage of solid residues inside the reactor facilitates the complete separation of the spent catalyst after the end of the reaction, it can then be used again after reactivation in subsequent reactions. In addition, the data of the produced fuel from the conversion of waste polypropylene were compared experimentally and theoretically, through mathematical modeling, to determine the efficiency of the catalysts, calculating the activation energies of the reactions that took place on their surface, and comparing them with the experimental results.

2. Methodology

2.1. Materials

Table 2 summarizes the reagents used in this study with their origin and purity. The waste polypropylene was used as feed. Nitrogen gas was applied to evacuate the reactor from oxygen to prevent combustion of materials inside the reactor, while hydrogen gas was applied for the purpose of reducing metal to the active form. In this study, alumina was employed as a catalyst, which was adapted to be bifunctional by loading it with metals such as nickel, molybdenum and platinum by utilizing nickel (II) nitrate, ammonium molybdate and tetra-amine platinum (II) nitrate, respectively, as metal sources loaded within the structural framework of catalyst.

2.2. Experimental Work

2.2.1. Catalyst Preparation

Two kinds of alumina support catalyst were prepared for this purpose. The first catalyst was loaded with Pt metal, and the second catalyst was loaded with NiMo metals. Assuming a basis of 1 g of bifunctional Al2O3 catalyst, about 8 wt% (i.e., 0.0137 g of Ni and 0.0673 g of Mo) was loaded onto 0.919 g of Al2O3 for the first catalyst, and about 5 wt% (i.e., 0.0521 g of Pt) was loaded onto 0.9479 g of Al2O3 in the case of the second catalyst. Note that the molecular weights of nickel, molybdenum and platinum were 58.693, 95.95 and 195.084 g/mol, respectively. The wet impregnation technique was used for loading the metals. The impregnation apparatus consists of a 500 mL flask attached to a funnel on the top to control the dropping of the active metal salt solution onto the alumina. The salt was tetra ammine platinum (II) nitrate for Pt/alumina catalyst and ammonium molybdate and nickel (II) nitrate for NiMo/alumina catalyst. The aqueous salt solution was prepared in a neck-round flask after making accurate calculations, and then it was added to the alumina with continuous stirring for 4 h at 80 °C under reflux conditions [26]. As shown in Figure 1, the metal-loaded catalysts were washed with distilled water several times before being filtered, then oven-dried at 110 °C overnight and heated to 350 °C for 2 h in the presence of hydrogen gas toward the reduction of metal to the active form [27]. Finally, these catalysts were shaped into 2 mm pellets using a hydraulic press, squeezing the powders under about 15 tones/m2. The pellets were used as a catalyst in the hydrocracking reactions of waste plastics.

2.2.2. Experimental Procedures

A combined system of a condenser, a gas cooling chiller, a gas–liquid separator and a semi-Bach stainless steel laboratory reactor (Parr Instrument Company, Moline, IL, USA) with a volume of 300 cm3 was used to carry out the experiments. After separation from other types of waste, it went through washing, drying and crushing. A weight of 100 g of polypropylene waste was placed inside the reactor. The reactor has two openings for gases’ supply, nitrogen and hydrogen. In addition, the reactor is equipped with a mixer (100–1000 rpm), pressure gauge, K-type thermocouple and is surrounded by an electrical heating jacket (1000 Watt). The pressure was fixed at 20 bar under a pressure gauge, while a PID controller was used to control the temperature inside the reactor at the required temperature. The exit area of the reactor was connected to a cooling system consisting of a condenser, a chiller and a gas separator as shown in Figure 2. A 1 m double condenser was provided by coolant supplied from a gas chiller to condense the hot vapors leaving the reactor. A gas separator was applied to separate the non-condensable vapors from the condensate liquid, which dropped into a glass vessel. The gas was discharged through the pipeline and collected in a rubber ball, while the solid residue remained at the bottom of the reactor. When the process was hydrocracking, a bifunctional catalyst was added to the plastic with a weight ratio of 10 plastic to 1 catalyst and then the hydrogen line was opened until the pressure reached the required operating value before the system ran. In the case of non-catalytic pyrolysis experiments, nitrogen was pumped to evacuate the reactor from oxygen to prevent the combustion of materials inside the reactor, with the selection of appropriate reaction conditions of pressure and temperature. In general, the products of both processes were gas, liquid and solid char, which were analyzed for their hydrocarbon components. Moreover, the catalyst used in the hydrocracking process was separated from the solid residue of the reactants and used again in the next reaction after reactivation. It should be noted that two types of solvents, hexane and methanol, were used for the purpose of separating the residue from the spent catalyst at the end of the reaction.

2.2.3. Characterization of Plastic Feed, Catalysts and Fuel Products

The crystalline structure of the as-prepared and regenerated catalysts was characterized by the X-ray diffractometer using a Shimadzu XRD-6000, Japan, within a range of 2θ from 0° to 90° and a scan rate of 2 (deg/min) with Cu (λ = 1.5406 Å). A voltage of 40 kV with a current of 30 mA was applied as a radiation source at a rate of 2 (deg/min). The morphological structure and the macrospores’ composition of fresh and regenerated catalysts was identified by scanning electron microscopy (SEM) attached with energy-dispersive X-ray spectroscopy (EDX) from FEI Inspect S50, Holland. The surface areas and total pore volume of catalysts were characterized via the Brunauer–Emmett–Teller (BET) method using the SA-9600 series (Horiba, Poland) at a nitrogen boiling point of 77 K. In addition, the functional groups present in the catalyst structure were determined by Fourier transform infrared spectroscopy (FTIR, 8400S, Shimadzu, Kyoto, Japan). Thermo-gravimetric analyses of both waste plastic and catalysts were performed by (TGA) system using an STA PT-1000 Linseis Company with universal TA software applied for data analysis and acquisition. The liquid produced was characterized by the measurement of density, viscosity, flash point and pour point based on ASTM standards. Furthermore, the liquid fuel compositions were obtained through gas chromatography–mass spectrometer (GCMS-QP2010 Plus, Shimadzu, Japan), while the gas product was analyzed by gas chromatography (GC-ASTM 1945, 1946, Agilent, Santa Clara, CA, USA).

3. Results and Discussion

3.1. Characteristics of Feed and Catalysts

3.1.1. TGA Analysis of Polypropylene Feed

Thermo-gravimetric analysis (TGA) is a method of thermal analysis in which the mass of a sample is measured over time as the temperature changes. This measurement provides information about physical phenomena, such as phase transitions, absorption–adsorption and chemical reactions such as thermal decomposition and others. A TGA analysis was performed on the 3.023 μg of PP waste shown in Figure 3a under a nitrogen gas environment.
It is evident from Figure 3b that the decomposition of PP started at about 400 °C and ended at about 470 °C with a loss of 73.04 wt%. The total weight loss was 84.4 wt% and it refers to the weight percentages lost from the PP sample and includes the volatile fractions, water molecules and other impurities such as additives present in the sample. Thus, in this work, the reaction temperature selected was in the range of TGA (that is, 400 to 470 °C), and 450 °C is considered appropriate as the pyrolysis temperature for this polymer.

3.1.2. TGA Analysis of Catalysts

TGA was conducted to investigate the thermal decomposition of the spent catalyst after its use in the hydrocracking reaction to determine the appropriate temperature needed for its regeneration. In addition, this analysis was performed to ensure the thermal stability of the catalyst inside the reactor and during regeneration. It can be seen in Figure 4 that the two types of catalysts have high thermal stability at the proposed reaction temperature of 450 °C. However, the Pt/Al2O3 catalyst showed a higher stability than the NiMo/Al2O3 catalyst at very high temperatures, especially at temperatures above 800 °C, and this is due to the property of platinum-loaded metal, which is more stable at high temperatures. Therefore, raising the temperature to 800 °C should be avoided during the regeneration process to ensure that the metal-loaded catalyst operates within safe thermal limits when reused after reactivation in the subsequent hydrocracking reaction. The TGA diagram shows a clear weight loss in the spent catalyst that started with the temperature rise from 50 °C and continued up to 1000 °C; this weight loss was due to the loss of impurities and moisture (i.e., volatiles) and the decomposition of coke accumulated on it during the reaction. Chemically, two types of coke components are deposited on the surface of the catalyst during the cracking reaction: light coke or non-polyaromatic material at a low temperature (i.e., below 200 °C) and heavy coke or polyaromatic material at a high temperature (i.e., above 350 °C) [28]. The last distinct stage of weight loss in the TGA plot of the NiMo/Al2O3 catalyst that appears after 800 °C is associated with a dehydroxylation reaction (i.e., the rapid destruction of the hydroxyl group within the catalyst structure). Accordingly, the temperature of 700 °C was selected as suitable for the regeneration process where the catalyst is stable with no expected decrease in efficiency due to the dissolution of metals or the hydroxyl group or the occurrence of sintering and localized melting.

3.1.3. XRD Analysis of Catalysts

The structural framework of the two types of catalysts was characterized by XRD. Figure 5a,b show XRD patterns for fresh and regenerated catalysts. Generally, for both catalysts, three strong peaks at angles of 37, 46 and 67° are demonstrated, indicating the X-ray diffraction on the alumina structure. The obvious difference in the XRD pattern, such as the relative intensities of the peaks (Irel) of the alumina catalyst prior to the reaction (line in blue color) and after the reaction (line in red color), is due to both the loading of different metals on its surface and the reactivation process. This leads to a difference in the diffraction of the radiation generated during the analysis. On the other hand, there is an acceptable pattern match between the red (i.e., regenerated catalyst) and the blue (fresh catalyst) curves. The XRD pattern of the reactivated catalyst shows smaller peak intensities than the fresh catalyst, i.e., a decrease in the average degree of crystallinity due to the partial collapse of the catalyst structure that occurs normally at high reactivation temperatures or perhaps due to the presence of residues that were not removed during the reactivation stage, which served to scatter the radiation of the X-ray machine. In other words, changing just one atom, e.g., by loaded metal, influences the intensities of all reflections [29].
Moreover, the platinum, molybdenum and nickel metals loaded on the alumina support do not show obvious peaks when compared to the corresponding peaks of alumina when alone due to the lower amount of metal particles loaded on the alumina. This is inconsistent with the results of other researchers who reported that the XRD patterns do not clearly show a peak for metals up to 15 percent of the loaded weight [30]; this also indicates small metal particle sizes and good metal particle dispersion. In fact, increasing the distribution of metals such as Pt, Ni and Mo leads to the creation of more active sites capable of the adsorption of more hydrogen, which is reflected in the improvement in the activity and stability of the catalyst [31,32].

3.1.4. SEM and EDX Analyses of Catalysts

Figure 6a,c show 100 μm SEM images of two types of fresh catalysts after wet alumina metal impregnation. It can be seen that the structural morphologies are prominent along with the edges of the particles, and this is consistent with the results of other researchers [33,34]. Figure 6b,d show 100 μm SEM images of two types of catalysts after the regeneration process. There was a difference due to the simple shape and grids, which is formed due to the difference in the quality and quantity of metals loaded on the surface of the catalyst, as well as the morphological change due to the regeneration process that took place after the reaction. It is clear that there is a good similarity between the SEM images of the two catalysts. The objective of performing the SEM analysis was to check whether the molecular structure on the surface of the catalyst had been damaged or affected by the high temperature during reactivation. On the other hand, SEM results were obtained in combination with EDX data through the same equipment. These indicate that the metals were distributed uniformly on the alumina support phase. The first catalyst had a metal ratio of 6.73 wt% Mo and 1.37 wt% Ni, whereas the other had a metal ratio of 5.21 wt% Pt. It demonstrates that the metal was successfully loaded onto the alumina surface. In fact, these percentages of metals were loaded to simulate the commercial catalyst used in Iraqi oil refineries from which the spent catalyst could be utilized for future polymer recycling. Likewise, the EDX data showed completely identical results between the amount of metals loaded on the surface of the catalyst before and after the reactivation process (that is, over fresh and regenerated catalysts); the weight ratio of Mo and Ni was approximately 6 wt% and 1.2% wt% for the first catalyst, and Pt was approximately 4.8 wt% for the second catalyst. This indicates that the crystal structure of the catalyst and the percentage of the atomic composition of the metals loaded on its surface were not widely affected via the heat of regeneration or the severe conditions of the catalytic reaction. Furthermore, 1.01 wt% and 1.17 wt% of carbon appeared in the EDX data for the NiMo/Al2O3- and Pt/Al2O3-regenerated catalysts, respectively. This is because unburned coke remained on their surface, which was expected because it is practically difficult to burn 100% of coke during reactivation, which was also expected to affect the BET surface area of the catalysts. Accumulation of this amount of coke and its persistence after the reactivation process may explain the low crystallinity of the catalyst as it appeared previously in the XRD patterns.

3.1.5. BET Surface Area Analysis of Catalysts

The BET surface area is an analysis based on a phenomenon called the gas adsorption–desorption isotherm. Adsorption occurs when gas molecules contact the solid material surface and create an adsorbate layer, and desorption is the opposite. The solid surface absorbs the gas atoms, such as the accumulation of N2-gas molecules on an alumina catalyst; hence, it denotes the inner area and the outer surface area of the catalyst pellet.
Table 3 provides BET surface area data for fresh and regenerated catalysts. Accumulated coke and impurities within the pores of the catalyst would naturally reduce the BET surface area of the catalyst. Therefore, when the temperature is sufficiently high in the regeneration process, the surface area of the catalyst is restored due to the burning of the deposited coke. It is evident from the obtained results that the surface area of the regenerated NiMo over alumina catalyst decreased to become 141.48 m2/g. It also can be seen that the monomolecular volume (Vm), total pore volume and mean pore volume decreased from 34.478 cm3/g, 0.329 cm3/g and 8.777 nm to 32.506 cm3/g, 0.298 cm3/g and 8.435 nm, respectively. The same phenomenon was observed for the Pt over alumina catalyst. This reduction was due to coke residues within the pores of the catalyst and occupying the surface area, which prevented N2-gas from covering all the available pore volume within the catalyst framework structure. On the other hand, the regenerated Pt/Al2O3 catalyst showed a smaller loss of surface area than the regenerated NiMo/Al2O3 catalyst, which decreased by approximately 1% to become 150.83 m2/g. In addition, loading a larger quantity and more types of metals on the surface of the catalyst also reduced the pore volume. When these metals were distributed on the catalyst, they closed the pores of the catalyst. Thus the Pt-loaded catalyst had a larger total pore volume compared to the NiMo/Al2O3 catalyst.

3.1.6. FTIR Analysis of Catalysts

In the previous sections, XRD, SEM, EDX and BET tests of the regenerated catalysts demonstrated that the crystal structure, morphology, chemical composition and surface area, respectively, were not strikingly affected by the calcination during the regeneration process. It was necessary to verify the chemical bonds and functional groups available in the catalysts by Fourier transformed infrared spectroscopy (FTIR), and whether the active sites of the catalyst were still in their positions and not widely affected during the regeneration process after the catalyst was consumed in the reaction. Figure 7 shows the FTIR of the two catalysts used before and after the regeneration process. This test was also applied to check the metal sites within the catalyst framework structure for the purpose of ensuring the success of the metal-loading processes on its surface. The illustration of the FTIR spectra of the NiMo/Al2O3 and Pt/Al2O3 catalysts with a wavelength of 380–3800 cm−1 confirms the appearance of a bending vibration of H-O-H molecules of chemically bonded water at 1632 cm−1, indicating the presence of chemisorbed water within the pores of the catalyst [35]. In addition, the absorption bands at 574 cm−1 can be ascribed to the (O-Al-O) stretching vibration, which is assigned to the amorphous aluminum oxide [35,36,37,38]. It is clear from the spectrographs that the active peaks of the catalyst components in the curve of the fresh catalyst and the regenerated catalyst appeared in the same place.
Figure 8 shows the FTIR spectra in the left plot for the fresh and regenerated catalysts in the range of 1020 cm−1 because the small peaks are not clearly visible in Figure 7. Nickel metal added to alumina appeared to be evident in the range between 445 and 490 cm−1 [39] and molybdenum metal between 621 and 874 cm−1 [39]. The absorption band at 474.5 cm−1 in the right plot can be attributed to the Pt ion, which is evident after magnification on the x- and y-axial scale. This group suggests that Pt atoms were successfully incorporated into the alumina frameworks, and this is consistent with the results observed by other authors [40,41].
In general, the peaks in the FTIR spectra indicate that when the temperature is increased during the regeneration process, the absorption peaks appear with lower intensity due to the decreased probability of thin film deposition and a small reduction in the chemical interaction capacity due to the accumulation of unburned coke on the regenerated catalyst, which leads to a lower peak intensity. This result is consistent with the conclusion reached by Naayi when studying the alumina catalyst by FTIR [42].

3.2. Characteristics of Operating Conditions and Degradation Products

3.2.1. Optimization of Operating Conditions and Catalyst Regeneration

One of the most critical problems facing the catalytic reaction in industrial processes is the low efficiency of the catalysts either during the reaction or after several reaction cycles. In addition, there is a problem specific to the pyrolysis reactions of plastics, which is that the nature of these materials leads to the production of solid or semi-solid materials inside the reactor, which leads to the accumulation of these products on the catalyst pellets and causes its isolation from the reaction and thus hinders its work. In addition the inability to extract the catalyst at the end of the reaction is considered uneconomic and has a financial loss for any applicable operation due to the high prices of the catalyst in most cases. Accordingly, it is necessary to find a working mechanism to overcome this complex problem. Through this research, special reaction conditions were reached that allowed us to easily extract the spent catalyst from the catalyst mixture remaining after the end of the experiment to be reactivated and used again in post-reactions. The method of work was shortened by finding suitable operating conditions in terms of pressure and temperature, which allowed the least amount of solid residue to be obtained, which is the main factor that causes the loss of the catalyst; in other words, a process of almost complete transformation of waste polymers into liquid and gaseous hydrocarbon chains. Many experiments were performed at different pressures and temperatures in this regard to reach the optimum reaction conditions.
After conducting the TGA analysis as previously shown in Figure 3, it was found that the decomposition of PP waste polymer occurs between approximately 400 and 450 °C, so the reaction system must be operated under these conditions. It is consistent with what Yanik, Hammoudi and Lue found through the empirical results of their research, where this temperature gave the largest proportion of the desired liquid fuel from the decomposition of polymers [43,44,45]. On the other hand, the increase in pressure inside the reactor further stimulates the thermal cracking reaction of the compounds inside the reactor, which contributes to a significant increase in the rate of critical solid residue cracking at the bottom of the reactor. As a result, it becomes easier to extract the catalyst from such a small amount of residue at the end of the experiment. Figure 9a shows the fresh catalyst, and after extracting the catalyst at the end of the experiment, it is black in color due to the accumulation of coke and solid impurities on its surface as in Figure 9b, and when it is heated to a temperature of 700 °C in the presence of air for 45 min to burn off the coke layer, the catalyst returns to almost its original color before use (Figure 9c), and here it can be used in the subsequent reactions. In addition, the products obtained from hydrocracking reactions over the regenerated catalyst can be compared with those obtained through the use of the fresh catalyst in order to evaluate the catalytic activity of the catalyst and the effect of the reactivation process on its behavior during a repeating reaction.
Several experiments were performed at different pressures (i.e., 0.5, 10, 15 and 20 bar) under temperatures of 400 and 450 °C to determine the appropriate pressure that would produce the least amount of residue, taking into account the need to obtain the required quantity of liquid oil, which is the desired product of the process described earlier in Figure 2. Increasing the pressure leads to a decrease in the production rate of liquid fuels, while the production of gaseous fuels increases, and this is undesirable due to the economic value of liquid fuels. In fact, increasing the pressure causes the large plastic waste molecules inside the reactor to be further broken down into smaller particles with different molecular weights. Therefore, the exact critical conditions must be known to produce the least amount of solid waste inside the reactor while maintaining the highest amount of liquid fuel produced that allow the highest productivity of the desired oil derivatives to be obtained from the cracking of the waste plastic because the process mainly targets economic feasibility by reducing the high cost of the catalyst used, and this needs to achieve a balance in the operating conditions. It should also be noted that the gaseous fuel produced can be used as an alternative fuel for the electric energy that is used in such industries, especially if it is rich in fast-burning hydrocarbons and contains a high percentage of heat. It is evident from Figure 10 under 400 °C that for all pressure points except under high pressure (25 bar), the amount of residual solid is not low enough to easily recover the catalyst from it after the end of the reaction. While under 450 °C as shown in Figure 11, the amount of solid residues remaining from the reaction is reduced to its lowest levels, especially at pressures from 15 to 25 bar, allowing easy recovery of the catalyst from the process without a high agglomeration of unbroken long-chained hydrocarbons remaining on the catalyst surface. It must also be taken into account that increasing the pressure used increases the cost of the industrial process. The green dots above the black line representing the residual solid product in Figure 11 indicate the recovery of the largest amounts of the catalyst after the reaction under these conditions, while all the red dots in Figure 10 and Figure 11 mean that no sufficient recovery of the catalyst was achieved after use. It is noted that the amount of produced gases is approximately equal under both temperatures, and this quantity increases with the increase in the pressure applied in the reaction and the proportion of produced gases reaches up to about 30% more or less of the obtained products, while the proportion of solids produced is less than 20% under 400 °C and only 10% under 450 °C using pressure as low as 1 bar. On the other hand, the production of liquid fuel with a high economic value was about 65% under the temperature of 400 °C and pressure of 20 bar, while the percentage of liquid fuel produced reached about 80% under the temperature of 450 °C and pressure of 20 bar. In general, and taking into account the results obtained, the use of operating conditions of 450 °C and 20 bar in this study seems to be optimal for achieving liquid fuel outputs at the highest degrees of pyrolysis, and thus will provide the possibility of recovering the catalysts from the solid residues upon completion of the reaction for the purpose of reactivation and reuse.

3.2.2. Polypropylene Degradation Products

It was evident from the experimental work that the PP decomposition reaction products can be separated into liquid, gas and solid residue. The vapors emerging from the top of the reactor were condensed to separate the condensable vapors from the non-condensable gases. The solid residue and spent catalyst remained at the bottom of the reactor, where they were extracted and weighed after separating the catalyst. The resulting liquid was also collected and weighed. For the resulting gas, its weight was calculated by balancing the material around the reactor. The liquid, gas and solid for thermal cracking and hydrocracking were calculated using the two types of catalysts (i.e., Pt/Al2O3 and NiMo/Al2O3) for both fresh and regenerated catalysts, and the results are summarized in Table 4.
It is clear that catalytic hydrocracking produces a higher liquid yield with lower gaseous and solid yields than non-catalytic pyrolysis. This result is due to the fact that the use of more selective catalysts mainly helps to increase the catalytic thermal cracking rate of large hydrocarbon molecules on the acidic sites of the catalysts in an orderly and non-random manner, as in the case of non-catalytic thermal pyrolysis. The second reason is that the reaction under the hydrogen environment stimulates the reduction in solid waste and an increase in selectivity compared to thermal decomposition that uses nitrogen instead of hydrogen. This is because the presence of the latter with the availability of metal functions represented by the metals loaded on the surface of the catalyst significantly activates hydrogenation–dehydrogenation reactions and is useful for pyrolysis in terms of reducing the amount of coke yield and increasing the production of hydrocarbons. These results are largely consistent with Yuan Xue’s conclusions [22]. On the other hand, hydrocracking over the fresh NiMo/Al2O3 catalyst gives better performance than the fresh Pt/Al2O3 catalyst in the case of a higher amount of liquid hydrocarbons, which were 86% and 84 wt%, respectively, while the solids were 0.22% and 0.4 wt%, and the gaseous values were 13.78 and 15.6 wt% over the fresh NiMo/Al2O3 and Pt/Al2O3 catalysts, respectively. It is noted that a decrease in the amount of the solid product, even in a small amount, serves the catalyst recovery process in a more useful way after the end of the reaction. From another point of view, the results showed that the behavior of the regenerated catalyst gave close reaction products for both types of catalysts compared with those of the fresh catalysts, and this indicates that the reactivation process was successful in restoring the catalytic properties of the spent catalysts for further use. Moreover, when comparing the behavior of the fresh and regenerated catalysts, a decrease in the liquid oil produced was observed from 86 to 83.3 wt% in the case of NiMo/Al2O3 and from 84 to 82.9 wt% in the case of Pt/Al2O3, and conversely, the amount of gas produced increased by using the regenerated catalyst simultaneously with a clear increase in the amount of accumulated coke on its surface, reinforcing the belief that the activity and selectivity were relatively low. This result is consistent with what was shown by the XRD patterns and BET surface area results, in which there was a decrease in the degree of crystallinity, surface area and pore volume for both types of regenerated catalysts considering that the catalytic reactions are mainly an interface phenomenon.

3.2.3. Liquid Products’ Characterization

The resulting liquid products were investigated for both the fresh and regenerated catalysts based on chromatography–mass spectrometry. The hydrocarbon components of this liquid were divided according to the number of carbon atoms and compared with the petroleum fractions. The more carbon atoms there are, the higher the boiling point of the petroleum components [18,46,47,48,49] as shown in Figure 12. The group of hydrocarbons representing gasoline fractions in the range (C6–C12) [50,51] is highlighted in the green color, and the group of hydrocarbons representing diesel fuel fractions in the range (C13–C28) [23,50] is highlighted in the brown color in the these figure. The results showed that the distribution of hydrocarbons for liquid fuel products under the optimum conditions of temperature and pressure using the thermal pyrolysis process without a catalyst led to an increase in the weight percentage within the diesel fuel range (80.83 wt%) compared to the content of gasoline fuel (15.94 wt%). Similarly, in the case of using hydrocracking with the presence of either fresh or regenerated catalysts, there was a reduction in the proportion of diesel fuel produced compared to the non-catalytic cracking process. Of course, this indicates an increase in the regular rates of cracking reactions and the production of compounds with lower boiling points and fewer carbon atoms on the surface of the catalysts. Scientifically, the number of carbon atoms in the reaction products is in a more low and more narrow range whenever cracking reactions take place at faster rates and without randomness, and therefore it was found that the range of carbon atoms produced was (C8–C30 in non-catalytic pyrolysis), (C6–C24 in hydrocracking over NiMo/Al2O3 catalyst) and (C6–C20 in hydrocracking over Pt/Al2O3 catalyst). This means that while catalytic hydrocracking was performed, further cracking can be achieved with high selectivity.
As summarized in Table 5, the results of GC-MS showed that the percentage of the gasoline range produced increased from 15.94 wt% to 34.45 wt% and 49.85 wt% over the NiMo/Al2O3 and Pt/Al2O3 fresh catalysts, respectively. There was a slight decrease in the rates of gasoline produced on the surface of the reactivated catalysts compared to the fresh catalyst. This is due to the increase in and uniformity of the hydrocracking mechanism of hydrocarbon components of the polymer on a certain position on the active acid and metal sites of catalysts. Hydrocracking over Pt/Al2O3 catalysts gave the highest weight of products to the gasoline fractions (i.e., more selective for gasoline range hydrocarbons), and this finding can be explained according to the data obtained from the BET analysis, as this catalyst has the highest surface area and pore volume compared to the NiMo/Al2O3 catalyst.

3.2.4. Physical Properties of Liquid Product

The liquid product of all the experimental reactions was orange–yellow to brown with little difference in density, as tabulated in Table 6. Considering that the reaction was conducted under a relatively high temperature and pressure. The density of the liquid product was low, i.e., high API gravity, which was mathematically calculated from specific gravity (SG) in Equation (1) to be 44.93 for non-catalytic thermal cracking and 45.15 and 47.16 in hydrocracking over fresh NiMo/Al2O3 and Pt/Al2O3 catalysts, respectively. This result is close to the results documented by Panda [49], which were slightly lower than the density results mentioned above due to the high pressure employed in his work on kaoline and silica alumina catalysts, where a higher pressure increased the cracking of hydrocarbons towards enhancing gas production. In general, an increase in the API value indicates an improvement in the properties of the oil produced, as this indicates an increase in the light and medium fractions within the produced petroleum.
A P I   g r a v i t y = 141.5 S p e c i f i c   g r a v i t y 131.5
Additionally, the regeneration process of the spent catalyst did not show a significant effect on its catalytic behavior and thus on the density of the products obtained on its surface compared to the fresh catalyst. The results of the viscosity of the produced liquid show that the viscosity follows the trend: Pt/Al2O3 < NiMo/Al2O3 < non-catalytic thermal cracking. In fact, a higher viscosity of the liquid products was found for the non-catalytic thermal cracking process due to the increase in the percentage of diesel products in it, which reached 80.83 wt% with a small percentage of gasoline products of around 15.94 wt%. This makes these products heavier and more viscous, and that is consistent with the previous results of Sally [44]. The lower viscosity of the liquid products on the surface of the fresh and regenerated Pt/Al2O3 catalyst compared to those products on the surface of the NiMo/Al2O3 catalyst can be explained by the fact that the liquid produced on the surface of the former catalyst contains gasoline fractions in the range (C6–C12) in a higher proportion than that in the case of the NiMo/Al2O3 catalyst, while the proportion of diesel fuel fractions in the range (C13–C28) was lower than that of the products over the NiMo/Al2O3 catalyst, as previously mentioned in Table 5. The fewer carbon atoms in the components of the liquid produced, the lower its viscosity. Moreover, the flash point of a specific substance is defined as the lowest temperature at which the vapor of the substance can form a flammable mixture with air. The flash point results show that the catalyst’s efficiency follows the trend: thermal cracking > NiMo/Al2O3 > Pt/Al2O3. The lowest flash point in the lighter products was found over the surface of the fresh and regenerated Pt/Al2O3 catalyst. This means an increase in the volatile hydrocarbon components of ignition when exposed to a spark. Furthermore, the pour point of a given substance is defined as the lowest temperature at which a substance can flow under specified conditions. The pour point results follow the same trend as the flashpoint results, where the lowest pour point results for liquid products were found over the surface of the fresh and regenerated Pt/Al2O3 catalyst, since it consists of lighter oil fractions with a lower carbon atom number and lower boiling point compared to the components of the liquid produced over the surface of the fresh and regenerated NiMo/Al2O3 catalyst and/or non-catalytic thermal pyrolysis. The decrease in the pour point value indicates the enhancement in the overall flow-ability of crude oil.

3.2.5. Gas Products’ Characterization

The gas product in these experiments was collected from the gas–liquid separator and then analyzed using gas spectrometry (GC). Table 7 summarizes the results of the examination of the gas components produced from the polypropylene waste treatment reactions.
It is clear from the obtained results that the gaseous product contains burnable gases of high value, which can be used as an alternative to natural gas or petroleum gas. Although hydrogen was not used in the non-catalytic thermal process, it is noticed from the results that a quantity of this gas was produced that amounted to 12.57 vol%. This is due to the fact that thermal cracking reactions in the absence of a catalyst follow the free radical mechanism, which facilitates the production of hydrogen gas of high economic value. On the other hand, the production of H2-gas in larger quantities as shown in Figure 13 from hydrocracking reactions in the presence of catalysts gives an indication of a decrease in the consumption of this gas in that type of process because it is self-generated under the reaction conditions used, and therefore there is no need to supply the complex catalytic reaction with excess H2-gas. In addition, it is noted from the results of the reaction that there are other combustible gases that were produced in different percentages, such as methane, ethane, propane, butane and pentane, which can be used as alternative gaseous fuels in domestic and industrial operations or for the purpose of feeding the reactions of treating plastic waste with the required heat. The light gases, mainly methane, ethane and propane, appeared in the reaction products in higher concentrations compared to the other heavier gases. This can be attributed to the high pressure used in the reaction, which caused the heavy gases to break down into lighter ones. It is noted that higher concentrations of other gases appeared in the products of non-catalytic thermal reactions, such as oxygen and nitrogen gases, reaching 5.09 and 10.15 vol.%, respectively, compared to very slight concentrations of these gases within the products of catalytic hydrocracking reactions. This is due to the fact that nitrogen is pumped into the non-catalytic cracking process, while hydrogen is pumped into the catalytic cracking processes. Note that nitrogen from the source is accompanied by a small percentage of oxygen, and the survival of a percentage of air inside the reactor before conducting experiments may help in the appearance of a percentage of oxygen gas as well in the output. It is also noted that small percentages of carbon dioxide gas in the ranges of 3.58, 1.59 and 1.92 vol.% appear with the reaction products of non-catalytic thermal pyrolysis, hydrocracking over the NiMo/Al2O3 catalyst and hydrocracking over the Pt/Al2O3 catalyst, respectively, as a result of the combustion processes of some components throughout the reactions owing to the presence of an amount of oxygen gas that usually leads to oxidation reactions. The emergence of carbon dioxide increases with the increase in the availability of oxygen gas within the reaction. Therefore, the availability of a greater proportion of oxygen gas in the non-catalytic thermal pyrolysis reactions led to the emergence of a greater proportion of CO2-gas in its products.

3.2.6. Solid Products’ Characterization

Chromatography–mass spectrometry was used to analyze the solid residue after they were collected from the bottom of the reactor. The remaining solid has previously been tabulated in Table 4, with values of 0.8, 0.22 and 0.4 wt% for non-catalytic thermal pyrolysis, and hydrocracking over the fresh NiMo/Al2O3 and Pt/Al2O3 catalysts, respectively. For the use of the regenerated catalysts, the resulting ratios were 0.68 and 0.8 wt% for the NiMo/Al2O3 and Pt/Al2O3 catalysts, respectively. This indicates that the effect of accumulated coke on the Pt/Al2O3 catalyst is greater than that of NiMo/Al2O3, as confirmed by EDX data. This is possible because the increase in the surface area leads to an increase in the reaction rate, and therefore there are greater amounts of coke on its surface, while the availability of more than one metal increases the distribution of the reactants due to the activation of hydrogenation and dehydrogenation reactions, thereby reducing coke formation. It was observed that the solvents used, such as hexane and methanol, to separate the residue from the spent catalyst at the end of the reaction did not show any peak in the GC-MS results.
The previous results are explained by the absence of more hydrocarbons in the solid residue. In general, the use of high operating conditions for the regeneration process resulted in a tiny amount of solid residues.

4. Kinetic Modeling

Building the kinetic model requires conducting a series of practical experiments at different temperatures. Therefore, in this study, for the purpose of building the lump kinetic model, six catalytic hydrocracking experiments were conducted on two types of catalysts. Studying the behavior of each catalyst needs three experiments at different temperatures (i.e., 400, 425 and 450 °C) to evaluate the model parameters. Table 8 shows these results.
The products of the hydrocracking process were divided into five lumps, depending on the GC-MS results. The division was based on the number of carbon atoms in the produced hydrocarbons. The five lumps were gas (GAS), light distillates including light naphtha (LN) heavy naphtha (HN), middle distillate fuel (MDF), and finally, heavy distillate fuel (HDF). It is clear from Table 8 that the tendency to produce lower lumps such as gas, light naphtha and heavy naphtha increases as the temperature rises due to further hydrocracking of heavy hydrocarbons into lighter weights. On the other hand, a lower temperature causes middle distillate fuel and heavy distillate fuel to increase. The reaction pathways for the hydrocracking of plastic wastes proposed by Ramdoss and Tarrer assume five lumps and seven reactions [52,53]. The researchers studied the kinetic model of hydrocracking by assuming the dependence of the reaction rate constant on the Arrhenius equation. Pre-exponential factor values and activation energies for each reaction were determined by solving differential equations and regression of the data simultaneously. This method proposed by Ramdoss and Tarrer for the investigation of the kinetic model has been widely used, especially in the study of crude oil hydrocracking residue [54,55,56,
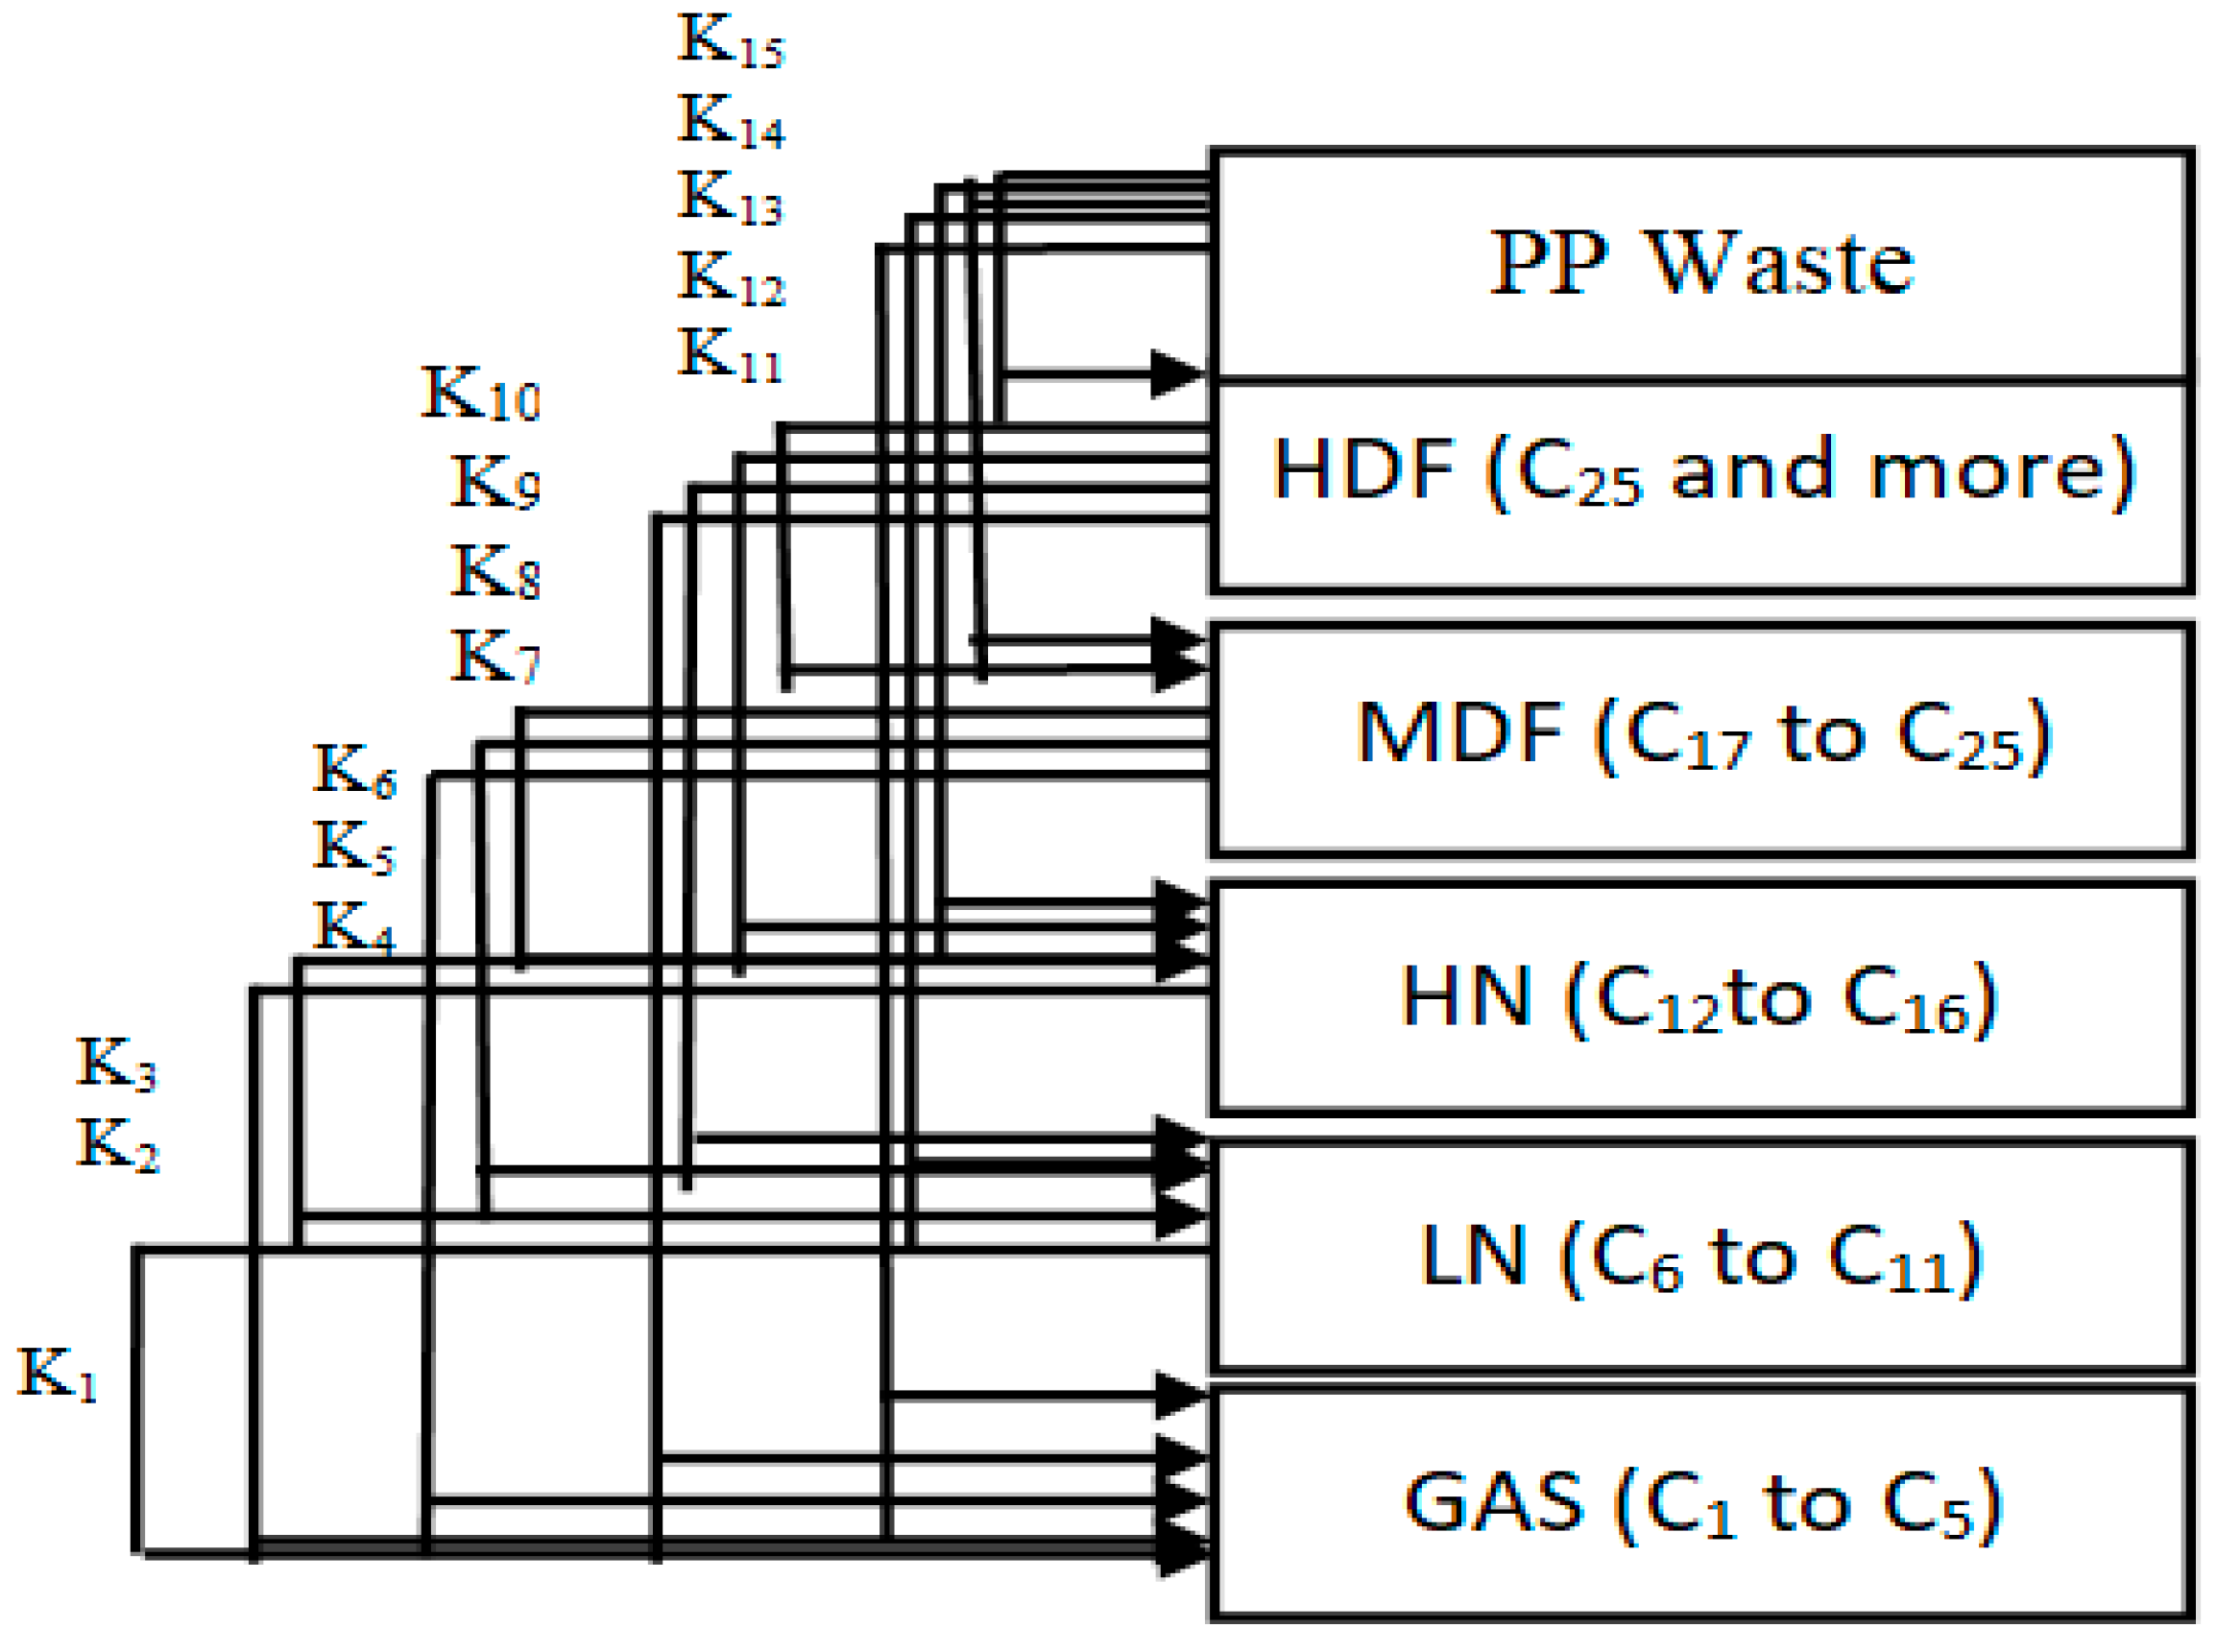
57]. All the kinetic models suggested by these studies use the lumps model with a different number of lumps for each study. The increase in the number of lumps gives more accurate results for calculating model parameters. Generally, this process is very similar to the hydrocracking of waste plastics. Thus, the same Ramdoss and Tarrer methodology is utilized, considering the modification on the use of six lumps and fifteen reactions, as shown in Figure 14.
Reactions 11 to 15 are called primary catalytic reactions because they are the first step of the decomposition of PP into other lumps (i.e., the slowest step in a reaction mechanism, which is known as the rate-determining step), and the other reactions (i.e., from reaction 1 to 10) are called secondary catalytic reactions because they follow the primary catalytic reaction. For each lump in Figure 14, a mole balance was made, and six-mole balances were solved using MATLAB software. The MATLAB program optimizes the mole balances equations and the experimental results in Table 8 depending on the genetic algorithm that is designed to fit the Arrhenius equation.
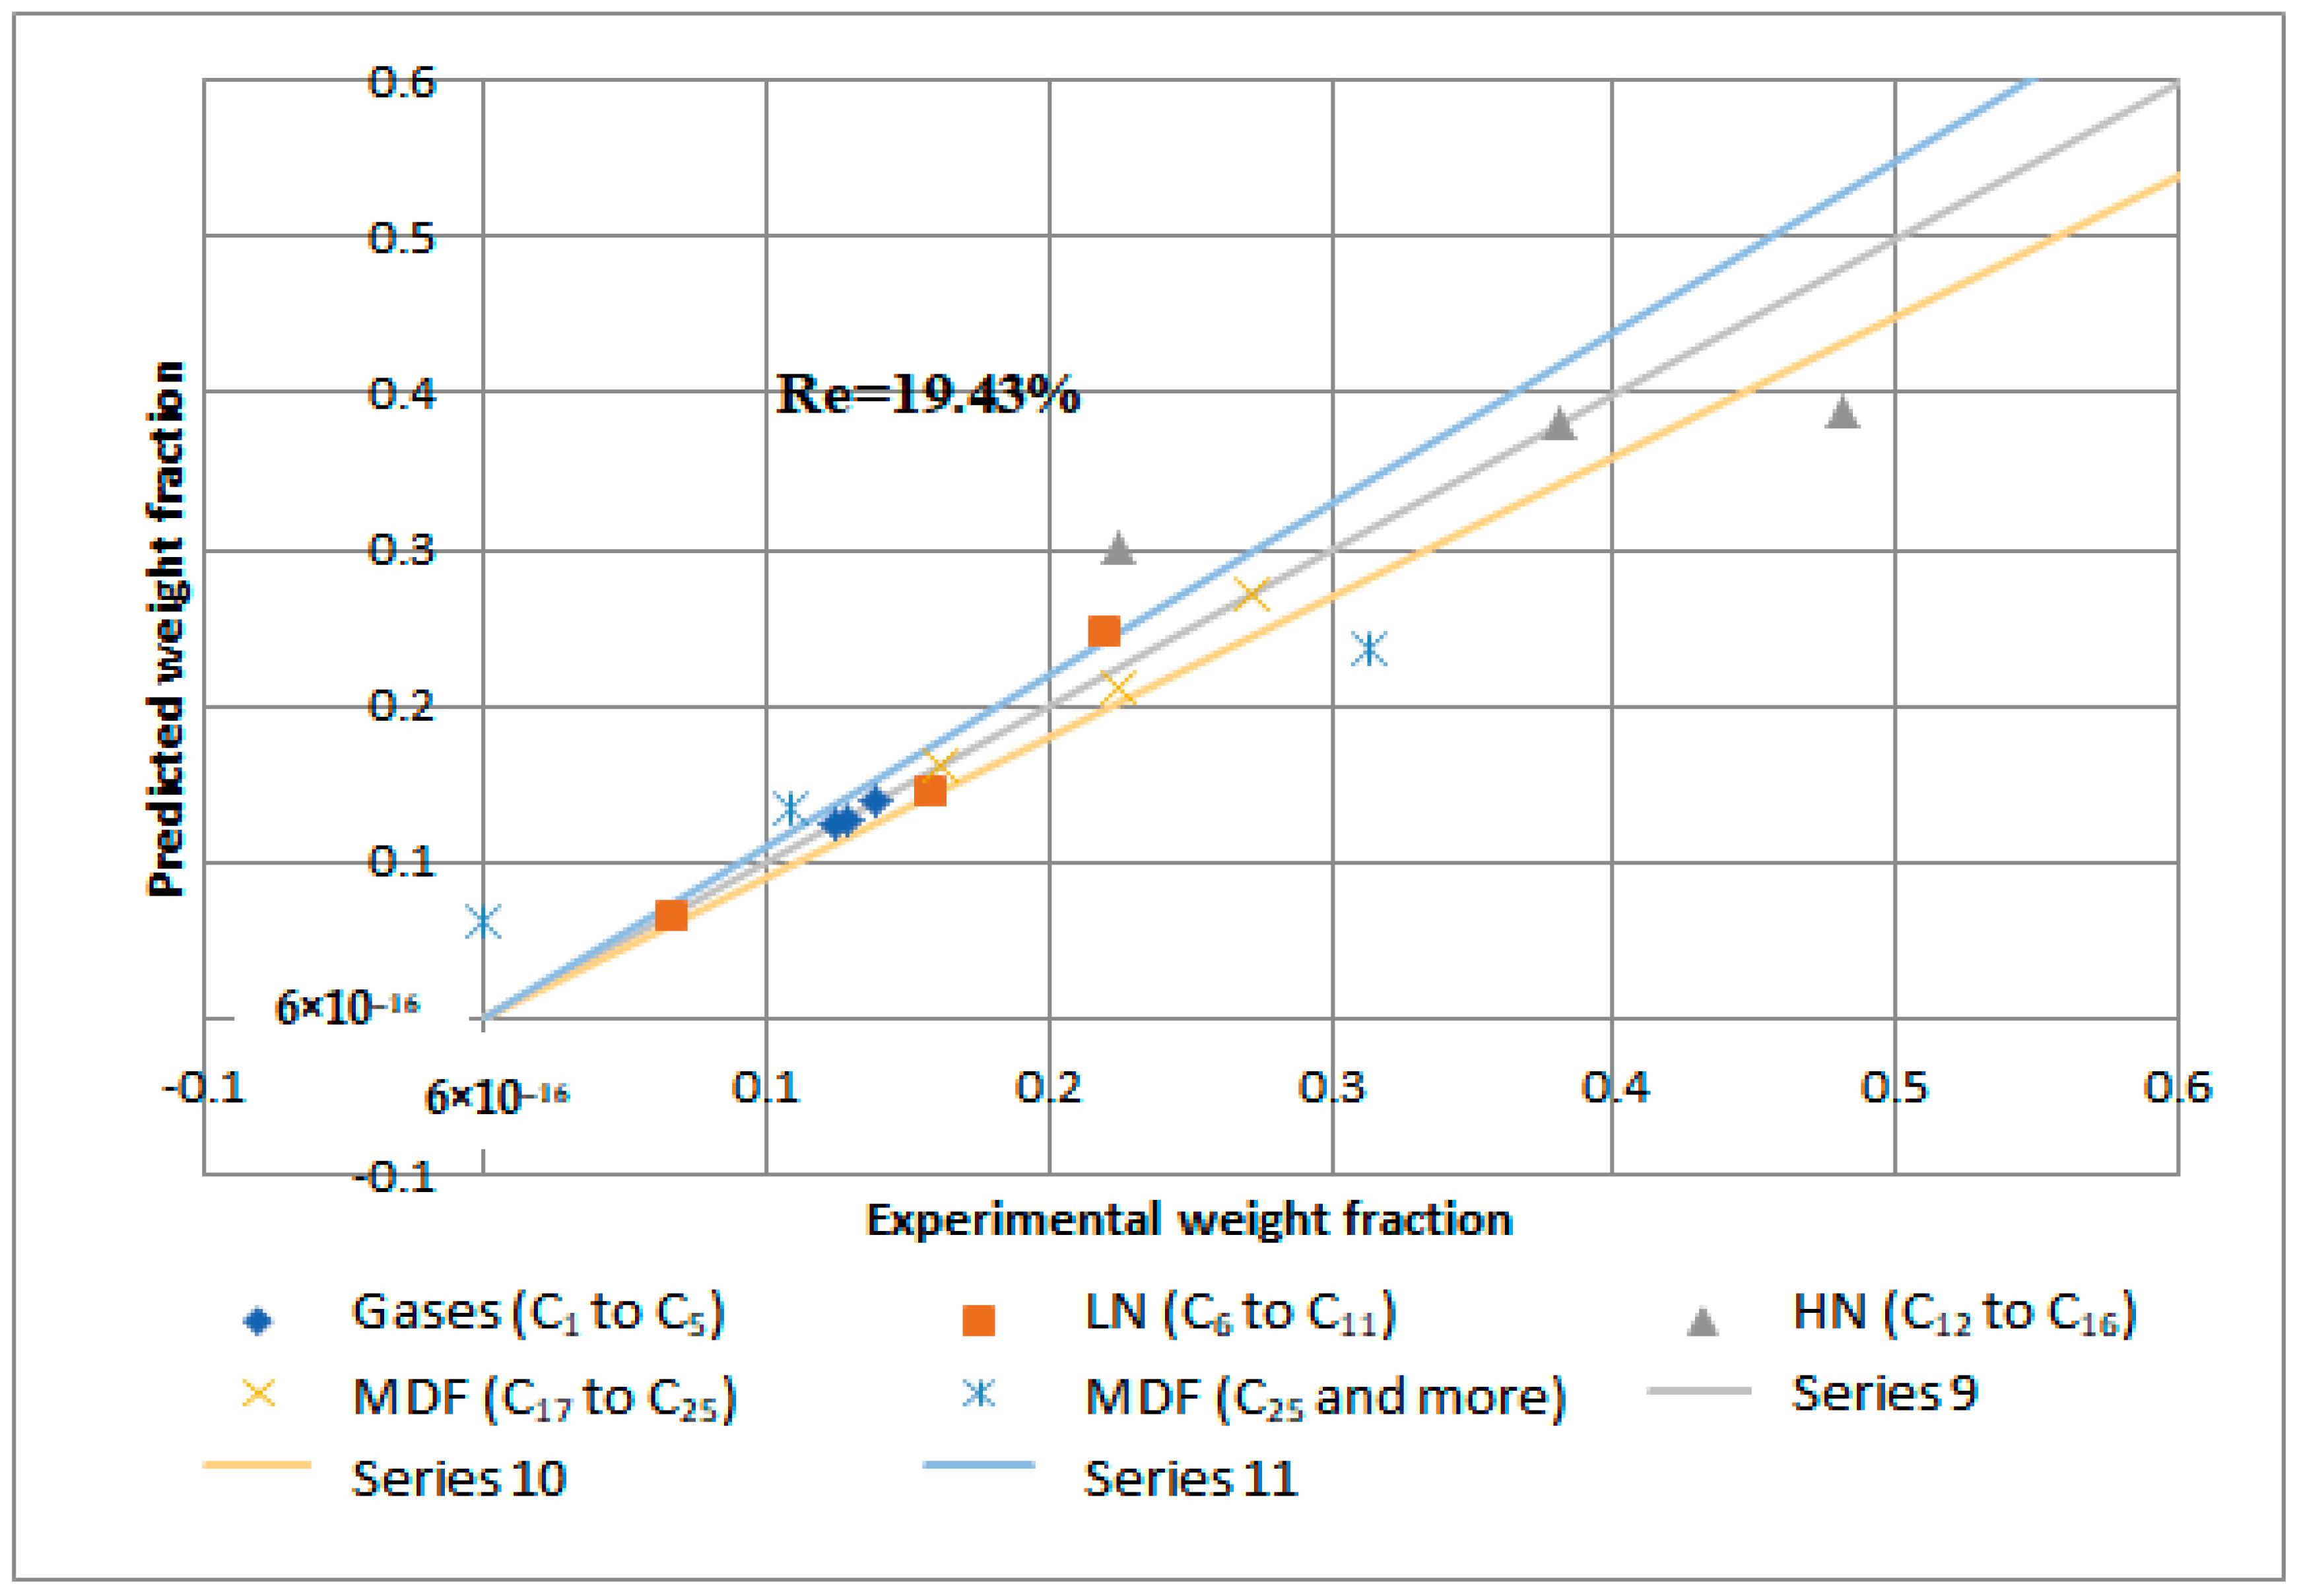
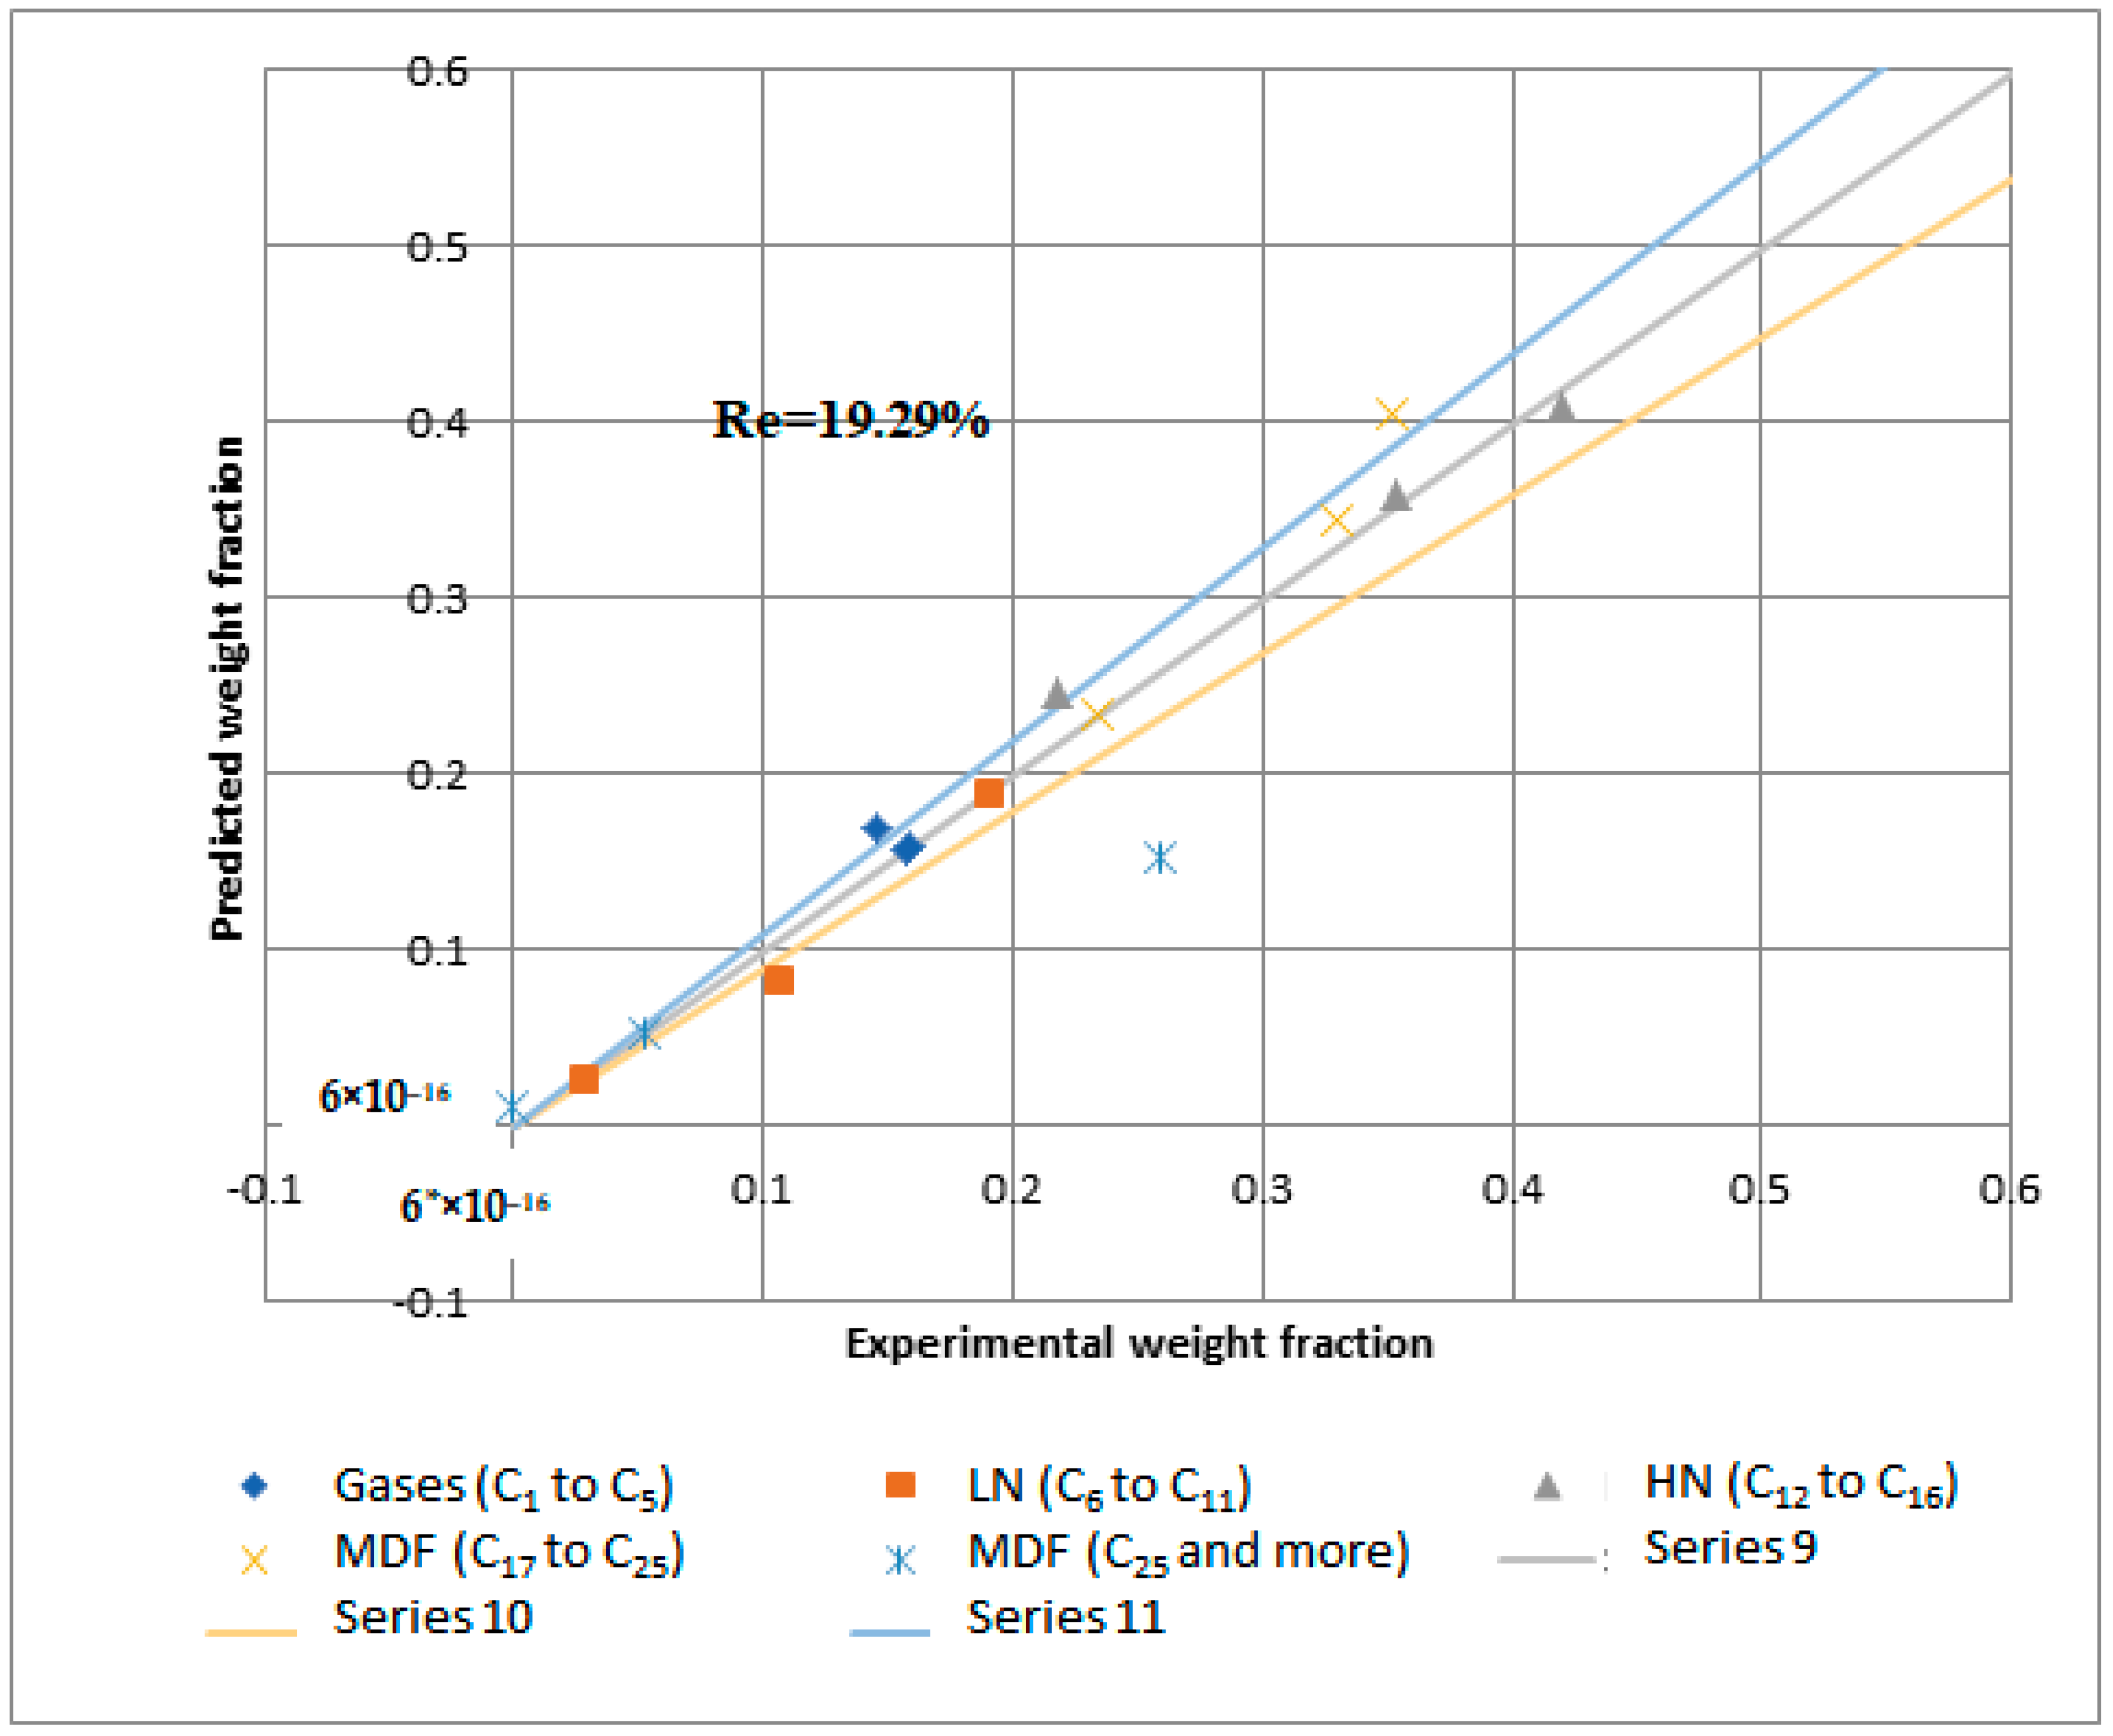
 Figure 15 and Figure 16 demonstrate that the regression of the kinetic model is acceptable. However, it had a relative error value of 19.43 and 19.29% for the NiMo/Al2O3 and Pt/Al2O3 catalysts, respectively.
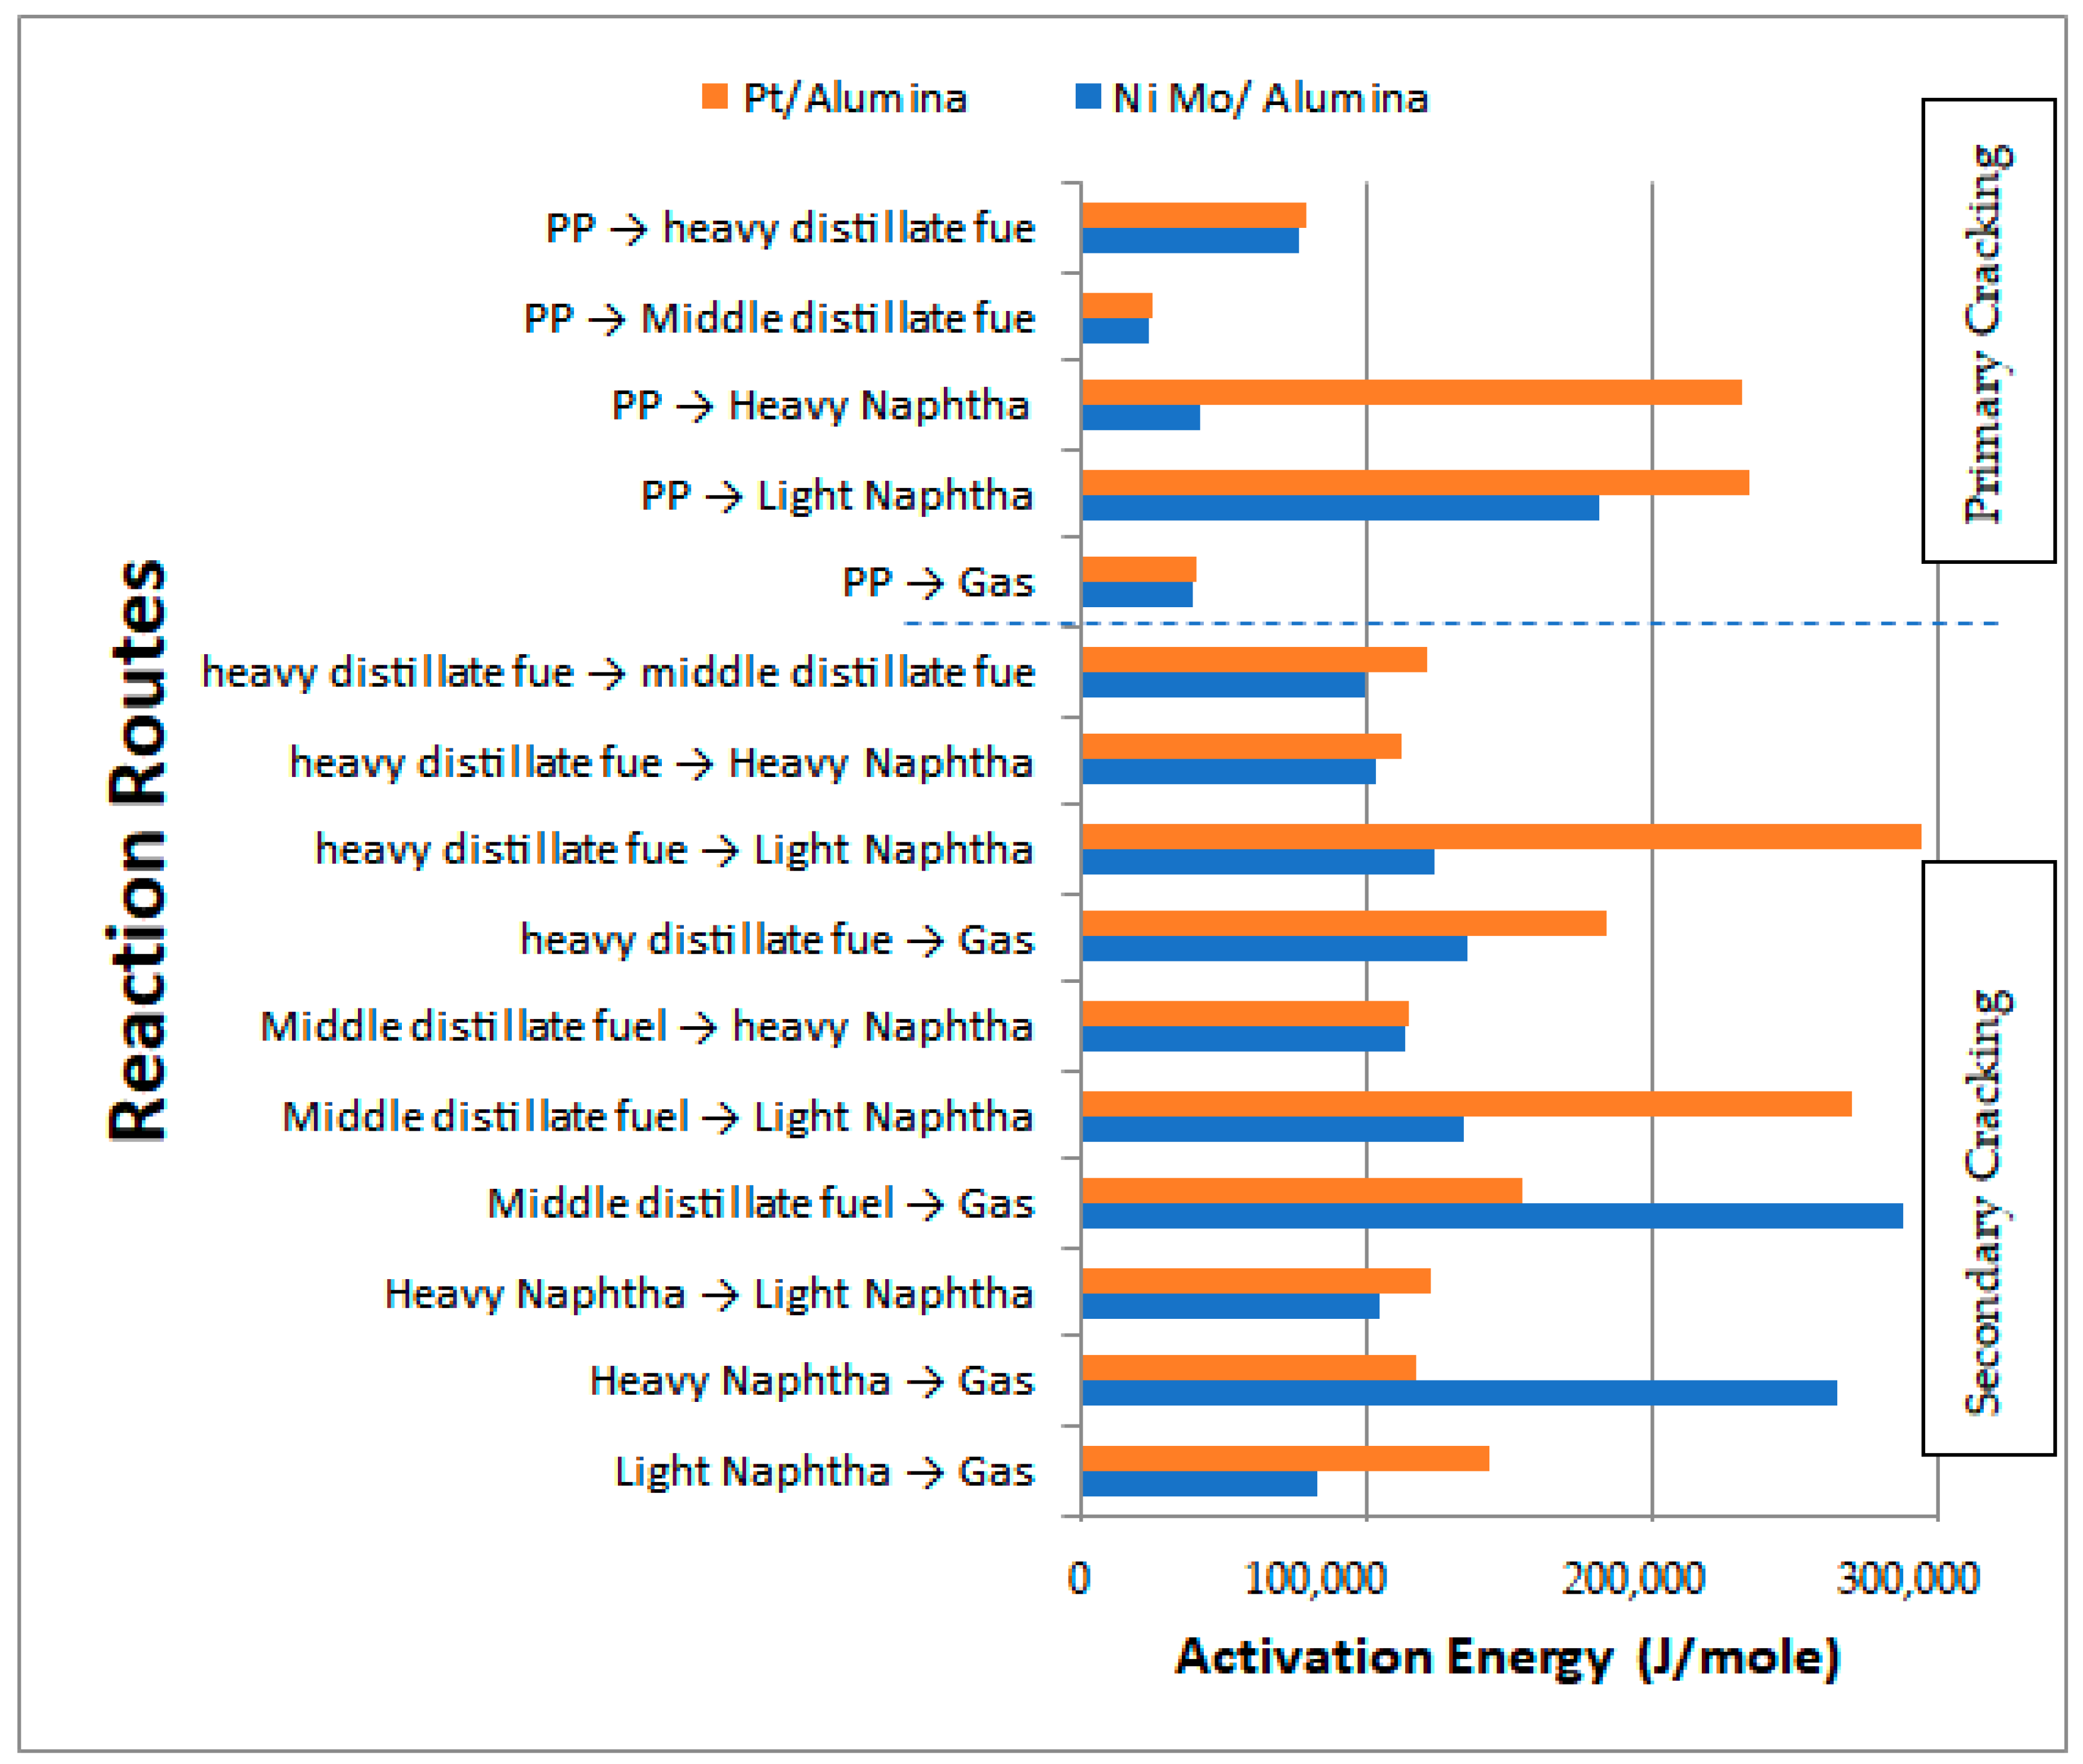
Table 9 shows the activation energies and reaction rate constants for all reactions at a reaction temperature of 450 °C over the two types of catalysts used, while Figure 17 illustrates the obtained activation energies for the primary and secondary catalytic reactions. In general, the values of the activation energies over the Pt/Al2O3 catalyst showed a larger value than those on the NiMo/Al2O3 catalyst. In particular, the primary reactions demonstrated high values for the activation energies of HN and LN of 232,017.95 and 234,521.65 J/mol, respectively, with the values for MDF and HDF being 25,332.65 and 78,823.90 J/mol, respectively. This result demonstrates that the decomposition of the large PP molecules on the surface of the Pt/Al2O3 catalyst into primary hydrocarbon lumps is more difficult than the case of the large PP molecules on the surface of the NiMo/Al2O3 catalyst, and thus more energy is required to break the large PP molecules into smaller ones.
In summary, all primary catalytic reactions show greater activation energy values on the Pt/Al2O3 catalyst except for the production of the gas lump, where its value decreased to 39,245.980 J/mol compared to 39,844.25 J/mol on the NiMo/Al2O3 catalyst. This result is consistent with the experimental results previously reported in Table 4 where less liquid and a higher amount of gas were obtained on the Pt/Al2O3 catalyst as compared to the products obtained on the NiMo/Al2O3 catalyst since the lower the activation energy value on the surface of the catalyst, the amount of production of a particular product increases due to the increase in the reaction rate. On the other hand, the activation energies of the secondary catalytic reactions also give a higher value over Pt/Al2O3 than that over NiMo/Al2O3 in seven out of ten reactions (i.e., that is, except for reactions 2 to 4).
For the purpose of comparing the result of the kinetic model with the results of the experimental work, five product lumps were selected to increase the accuracy of the parameters determined in the kinetic model and compared with the data of three fuel fractions in the experimental work. For the comparison between the kinetic model and the experimental results, the lump of LN in the model is consistent with the data for the gasoline fraction, while the HN, MDF and HDF lumps are consistent with the diesel data; this division of components certainly depends on the number of carbon atoms in the hydrocarbons produced.
Therefore, the apparent activation energy was calculated for the gas, gasoline and diesel ranges to build a clear view of this comparison. The apparent activation energy of the parallel reaction was calculated using Equation (2) [53], and Table 10 demonstrates the apparent activation energy for the liquid and gas on one side, and for the components of the liquid fraction (i.e., gasoline and diesel) on the other side.
E a p p = E 1 K 1 + E 2 K 2 + + E n K n K 1 + K 2 + + K n
where Eapp is the apparent activation energy and K is the reaction rate constant.
Firstly, the apparent activation energy value was calculated from the results of the kinetic modeling for the gas product depending on the reactions that produce the gas only (i.e., reactions 1, 2, 4, 7 and 11), as shown in Table 10 and Figure 17. The calculated apparent activation energy shows a lower value in the case of using the Pt/Al2O3 catalyst, which is in the order of 39,252.03 J/mol, while the corresponding apparent activation energy obtained using the NiMo/Al2O3 catalyst is in the range of 39,845.02 J/mol, and this result matches the experimental work data in Table 4, which showed a lower weight ratio of the gas produced if the NiMo/Al2O3 catalyst is employed. Secondly, the liquid products include the hydrocarbons produced within the range of LN, HN, MDF and HDF (i.e., reactions 3, 5, 6, 8, 9 and 10). The apparent activation energy value of the liquid components was calculated based on Equation (2) as well. It is noted that in the case of a liquid, the behavior is opposite to that of a gas. The apparent activation energy was 69,260.76 and 66,301.42 J/mol for the Pt/Al2O3 and NiMo/Al2O3 catalysts, respectively. These results are also consistent with the data of the experimental work, where the liquid production increased over the NiMo/Al2O3 catalyst in comparison with the liquid produced over the Pt/Al2O3 catalyst. On the other hand, the gasoline and diesel fractions were investigated to ensure that the results of the kinetic model matched the data of the experimental work. The LN lumps’ production reactions that correspond to the gasoline production reactions demonstrated a large value of activation energies when the NiMo/Al2O3 catalyst was used. This means that more energy is required to produce the LN range fractions on this catalyst. Moreover, in Table 10, the apparent activation energy for gasoline production (i.e., reactions 3, 5, 8 and 12) on the catalyst surface of NiMo/Al2O3 is in the order of 108,234.89 J/mol, and then this value decreases to 103,404.02 J/mole when the Pt/Al2O3 catalyst is used. This result is consistent with the experimental results documented in Table 5 where they were 34.45 and 49.85 wt% for the NiMo/Al2O3 and Pt/Al2O3 catalysts, respectively. Gasoline is produced in larger quantities on the surface of the Pt/Al2O3 catalyst. The production of the diesel fraction includes the reactions 6, 9, 10, 13, 14 and 15. The value of the apparent activation energy was recorded as 66,301.29 J/mole using the NiMo/Al2O3 catalyst. In contrast, the value of 69,260.46 J/mole was determined using the Pt/Al2O3 catalyst, and here there is also a logical agreement in the obtained results with the results of the experimental work. Diesel is produced in larger quantities on the surface of the NiMo/Al2O3 catalyst. Finally, it is possible to conclude that the results of the kinetic model conclusively agree with the results of the experimental work for the catalytic hydrocracking of PP waste plastic. Thus, the suggestive pathways of the reaction mechanism in this work have confirmed and correctly explained the reactions that occurred throughout the process.

5. Conclusions

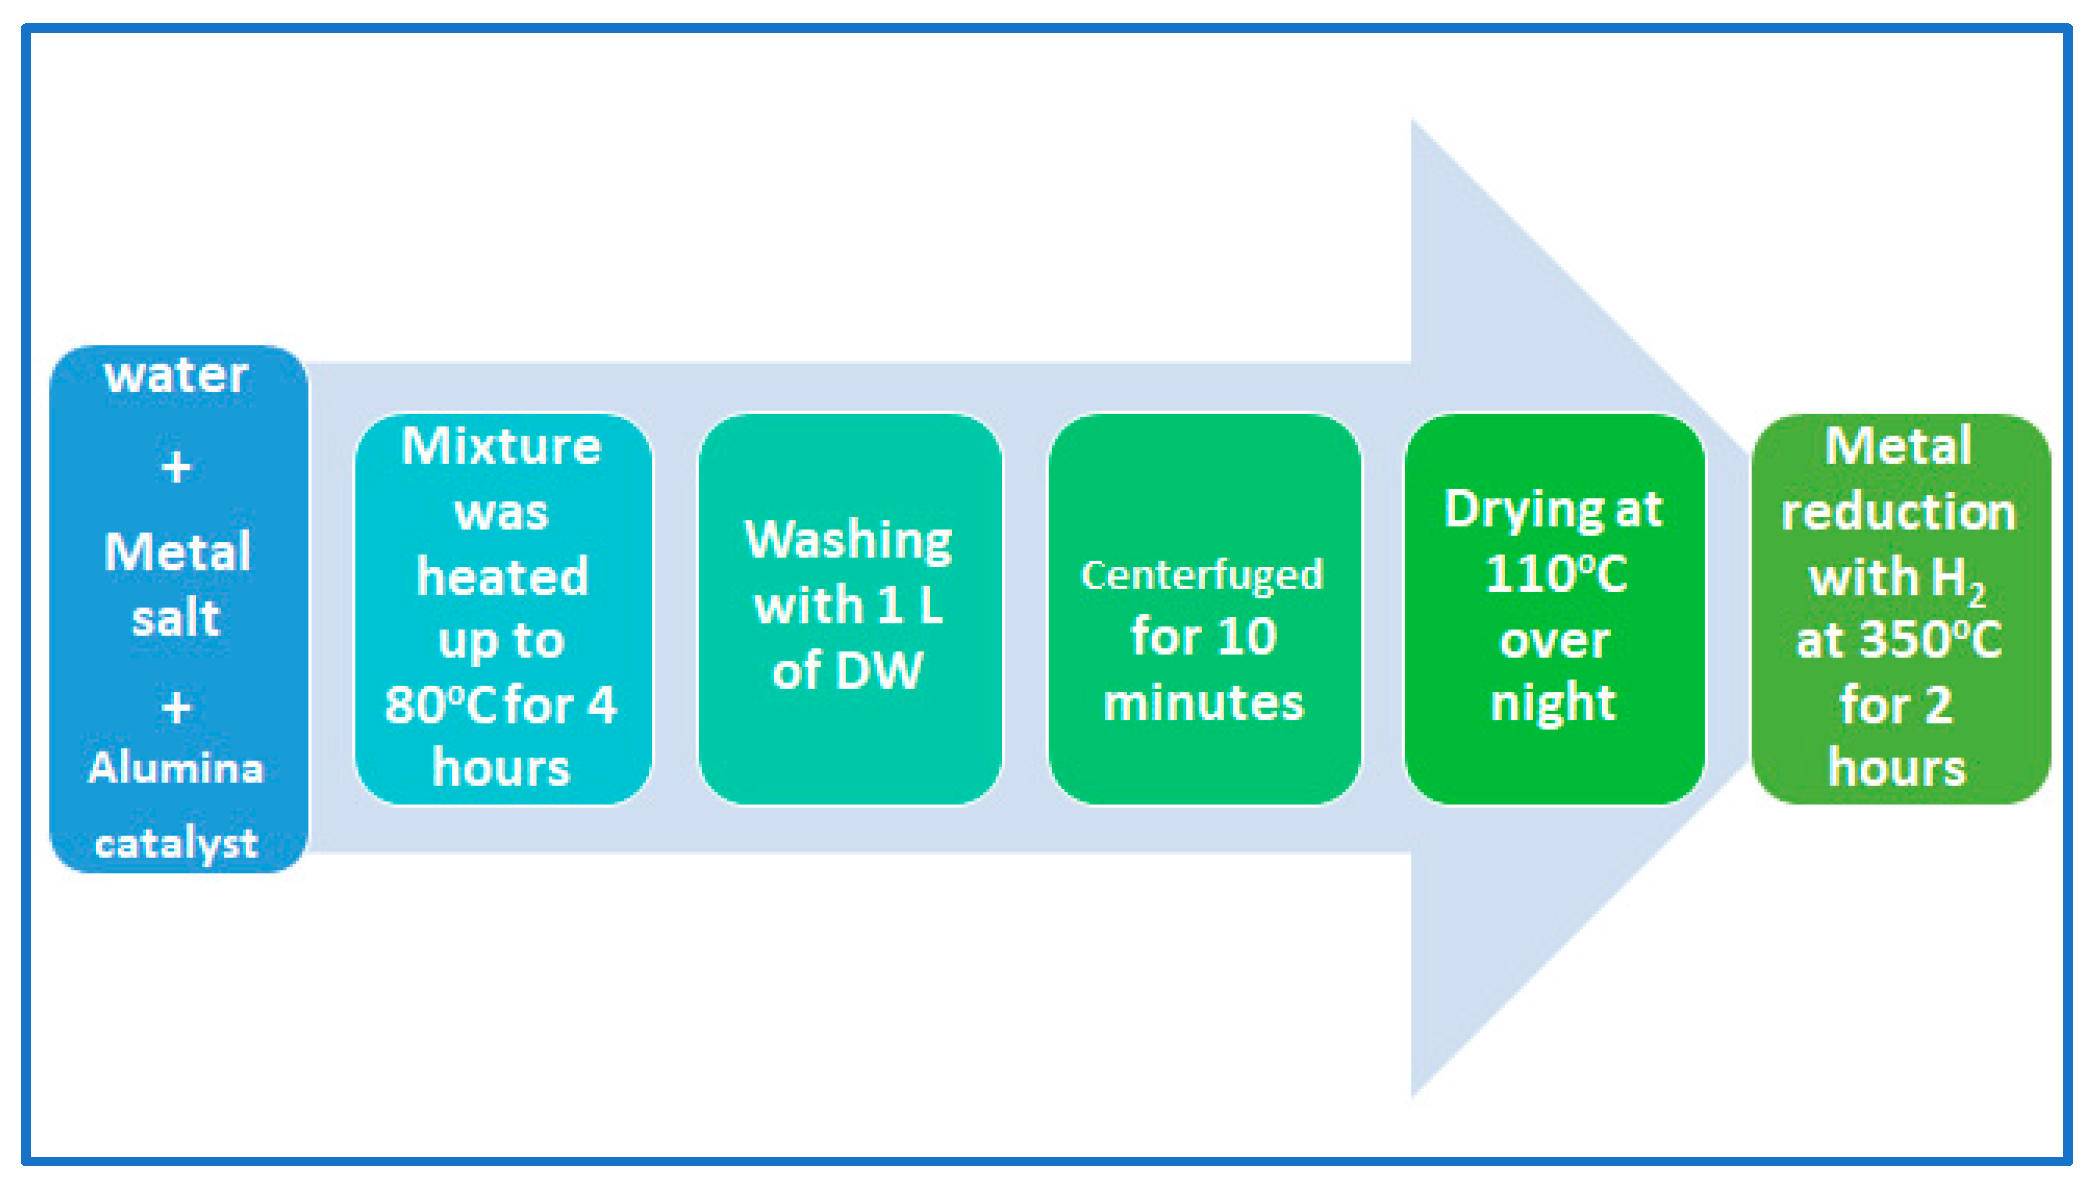
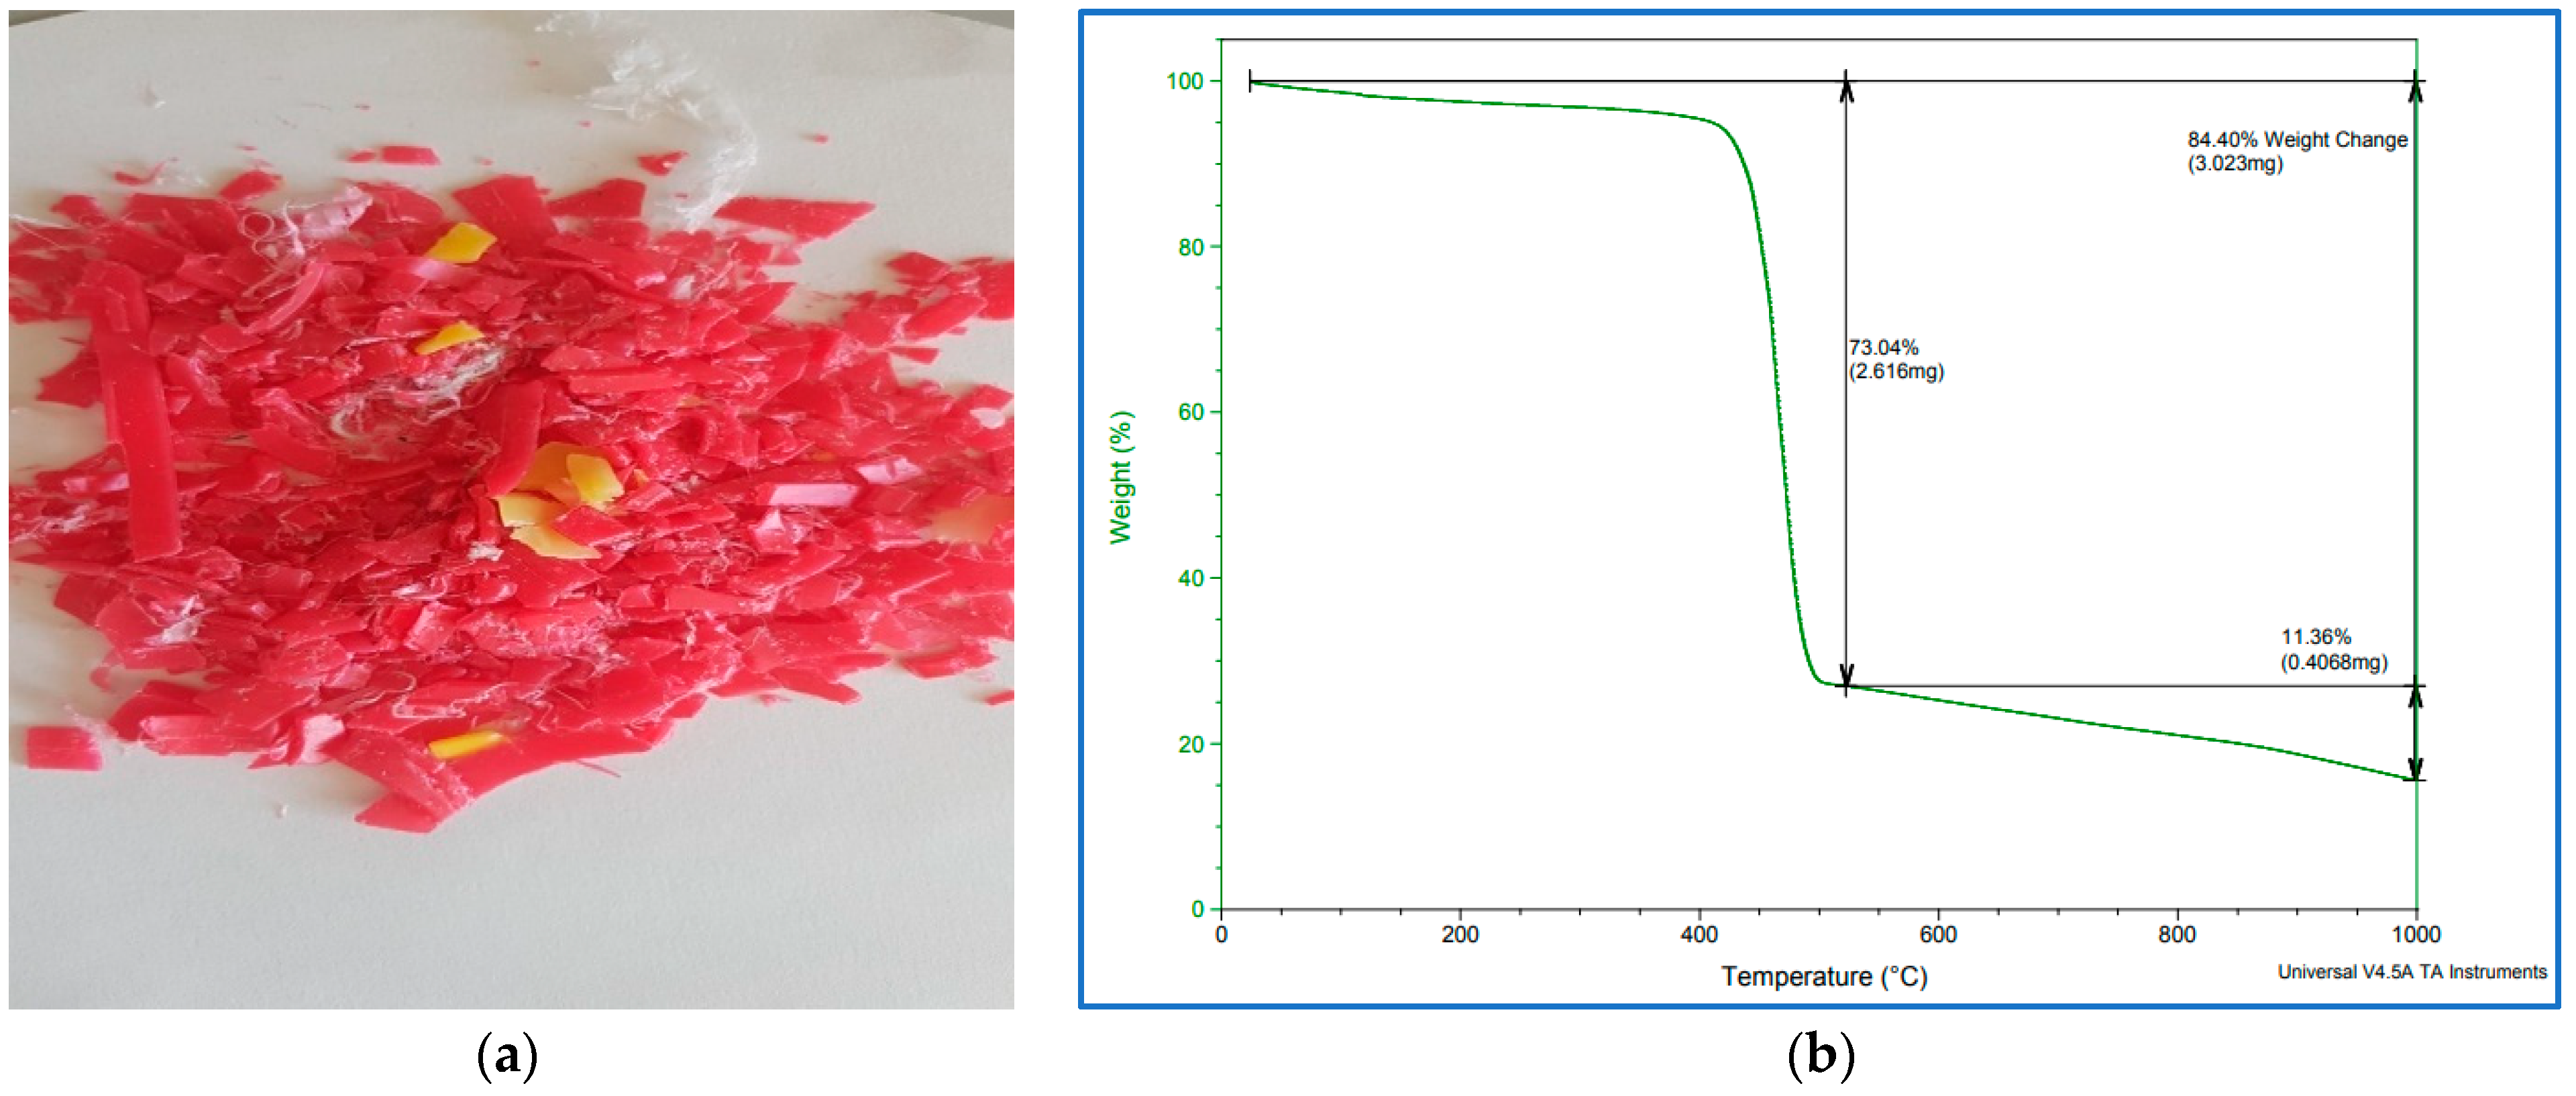
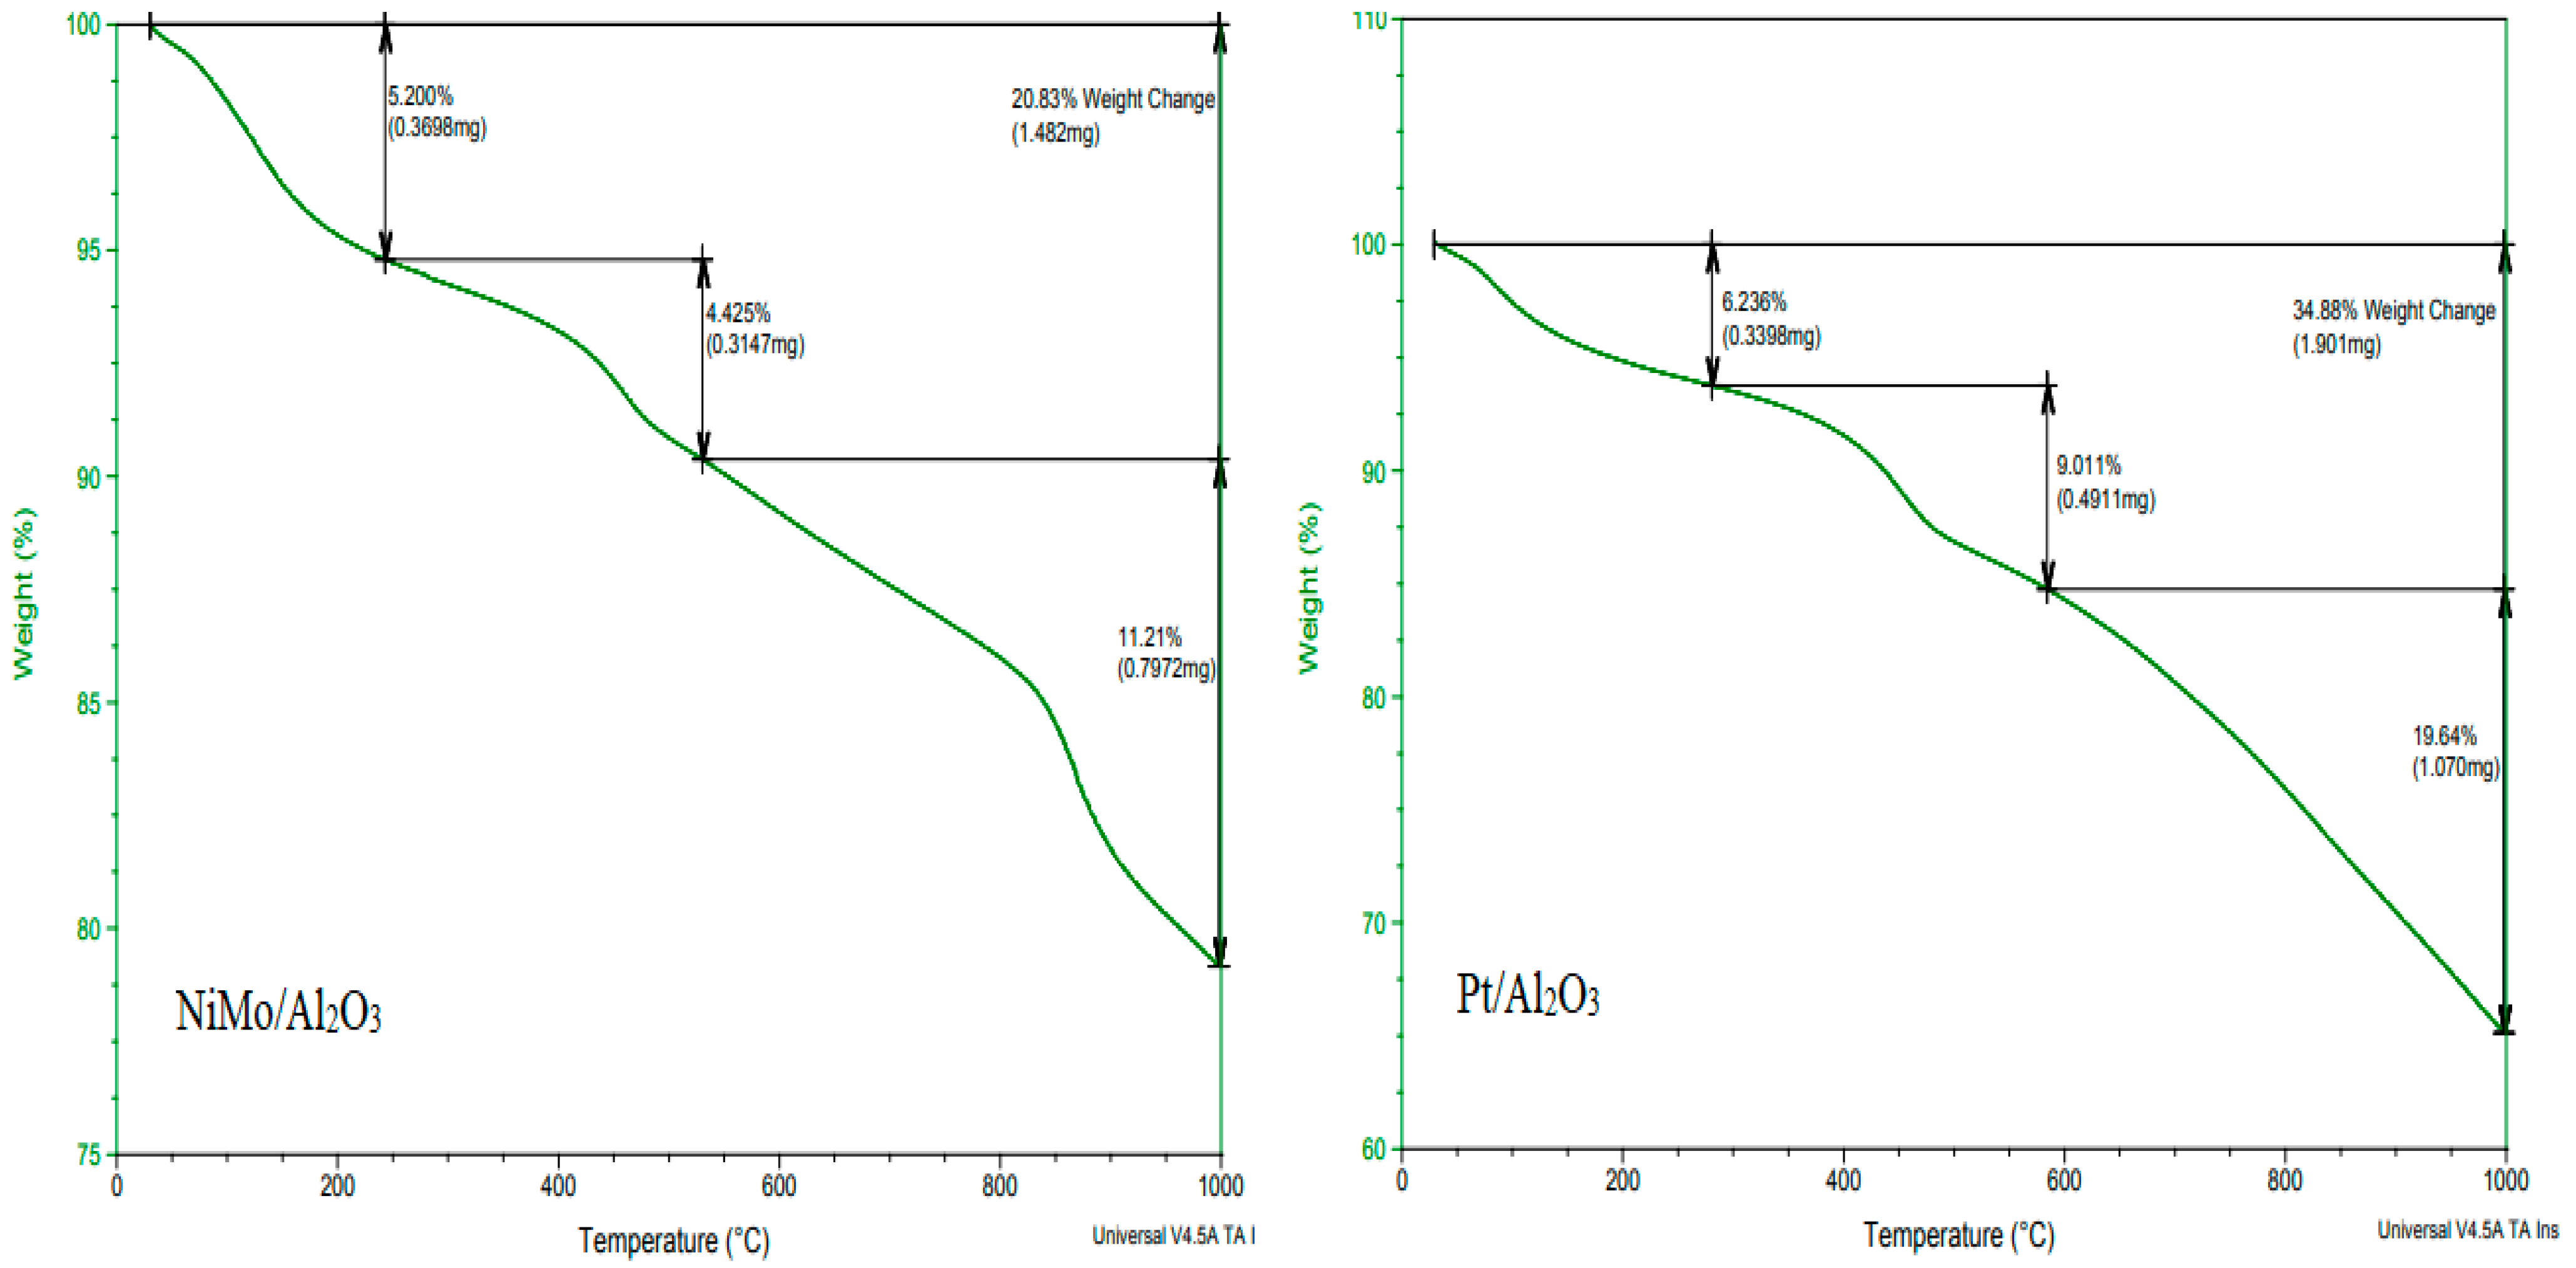
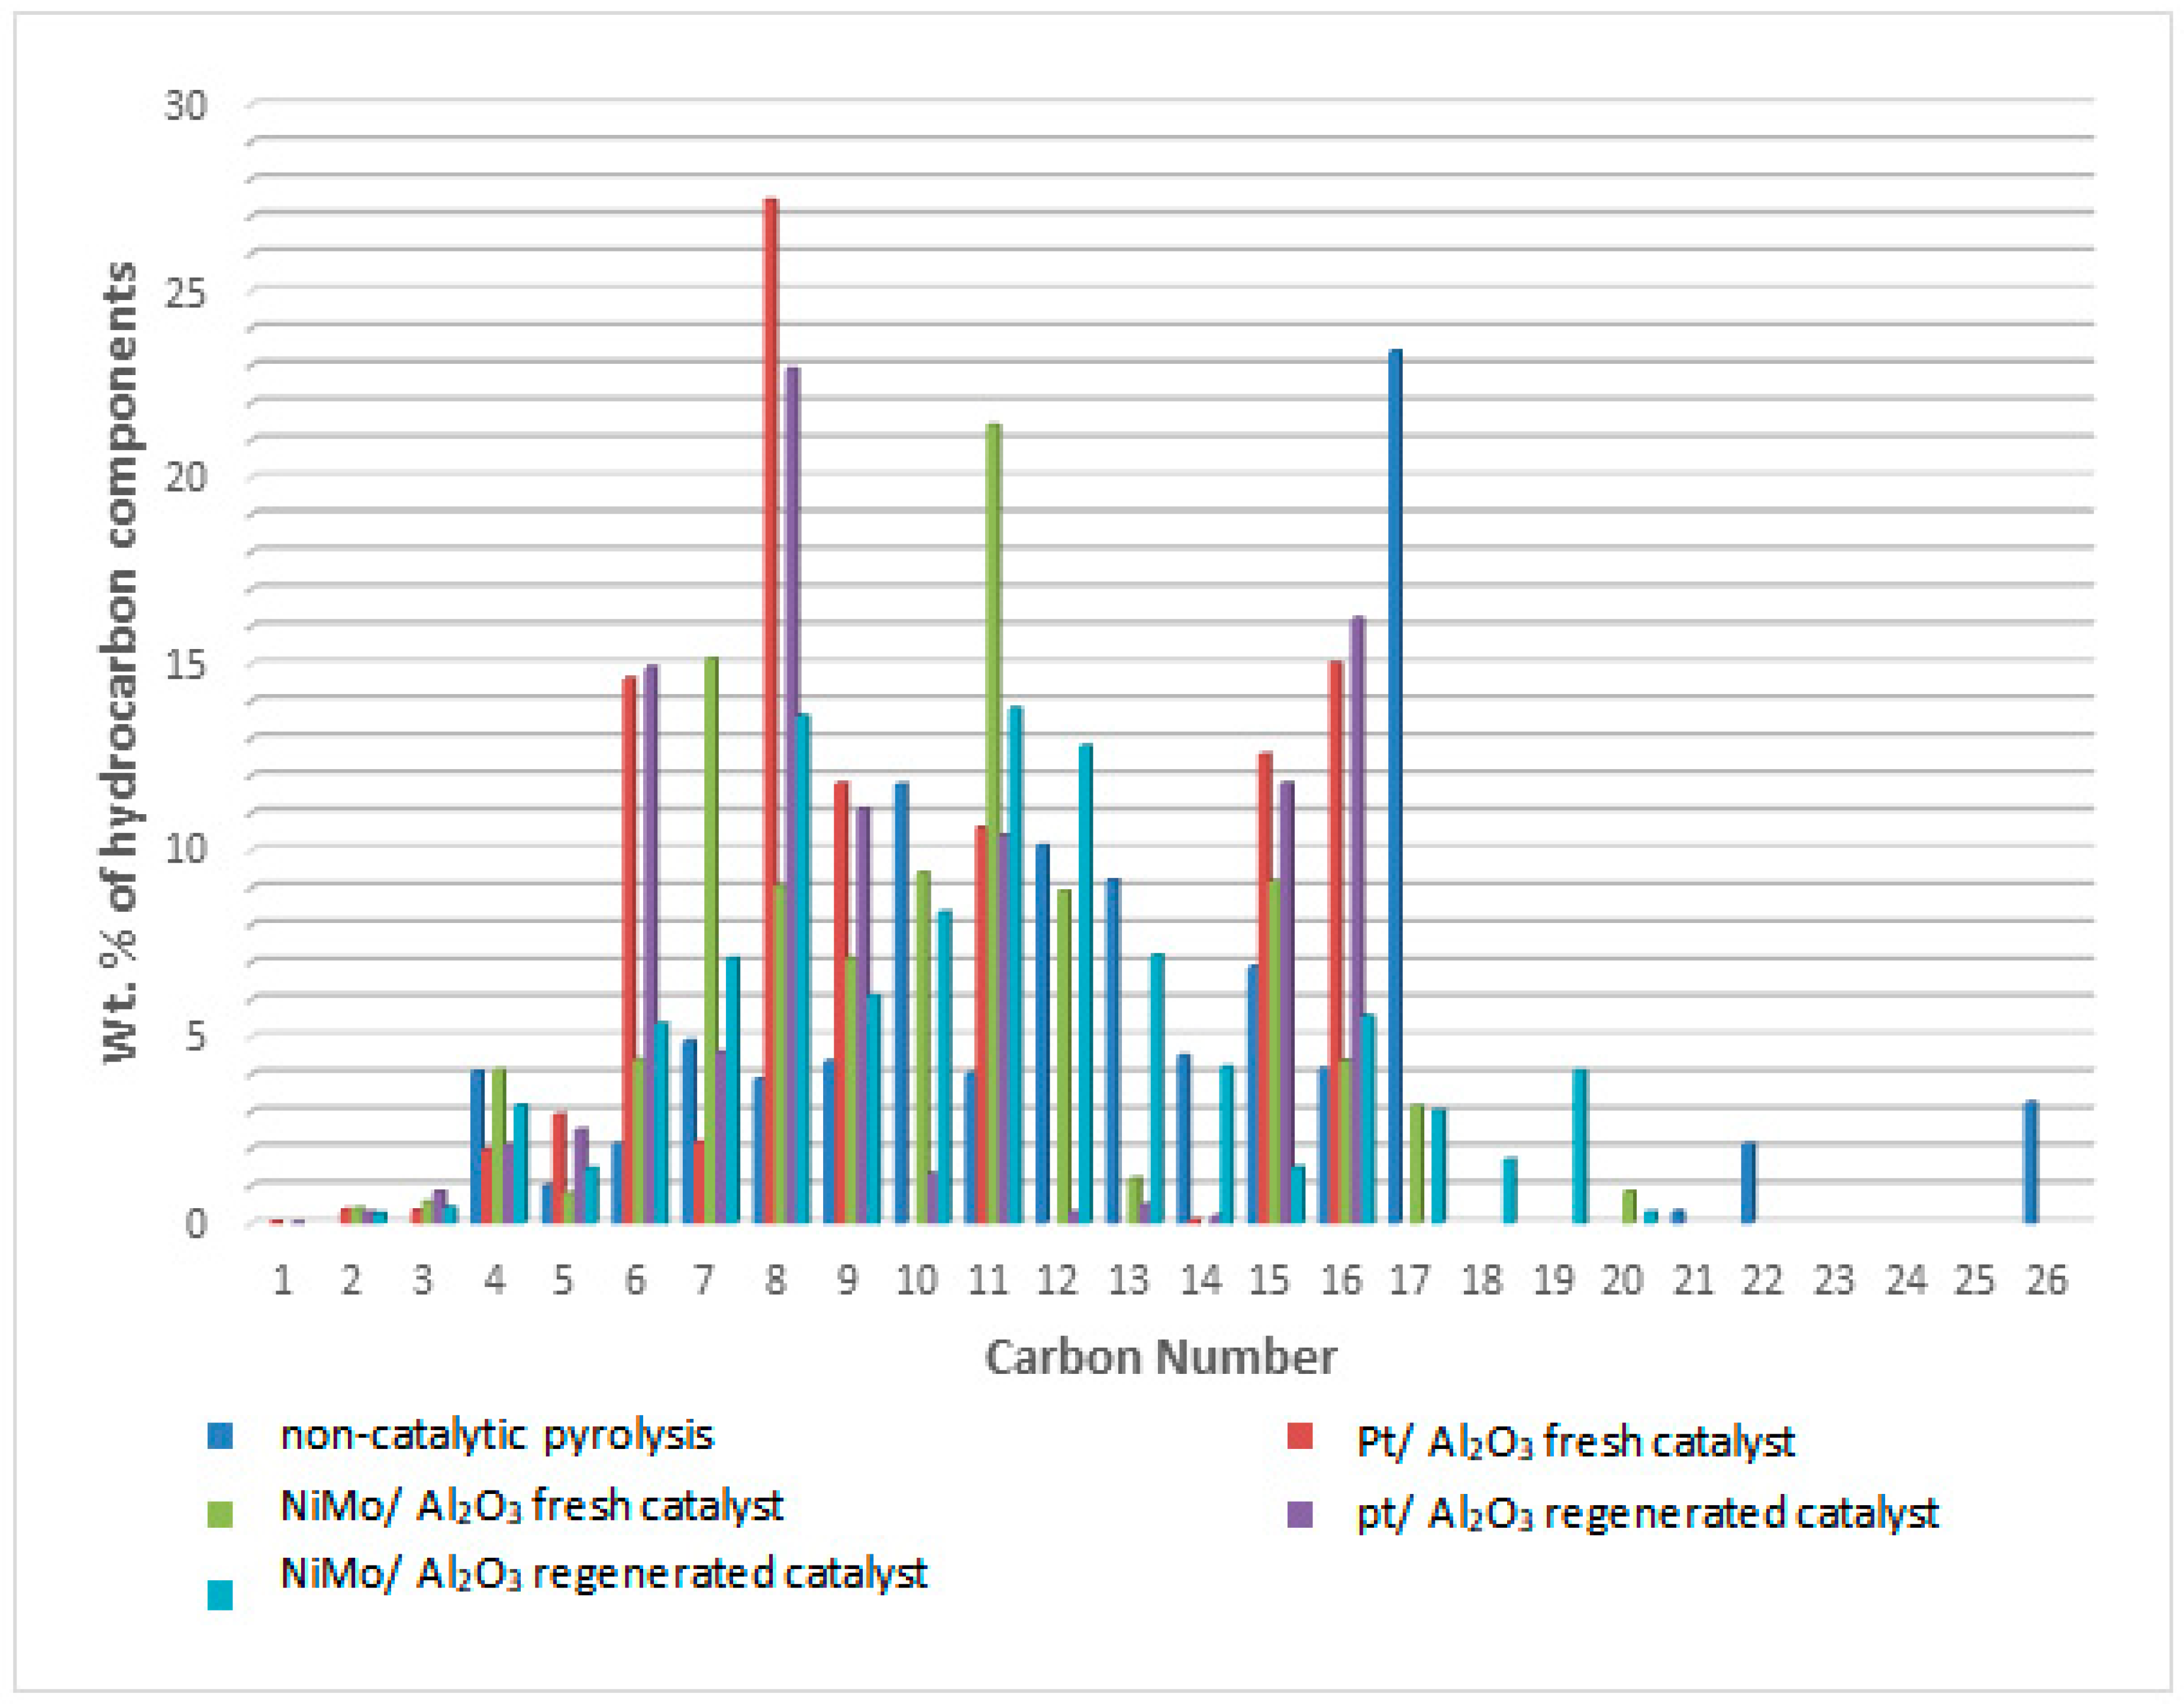
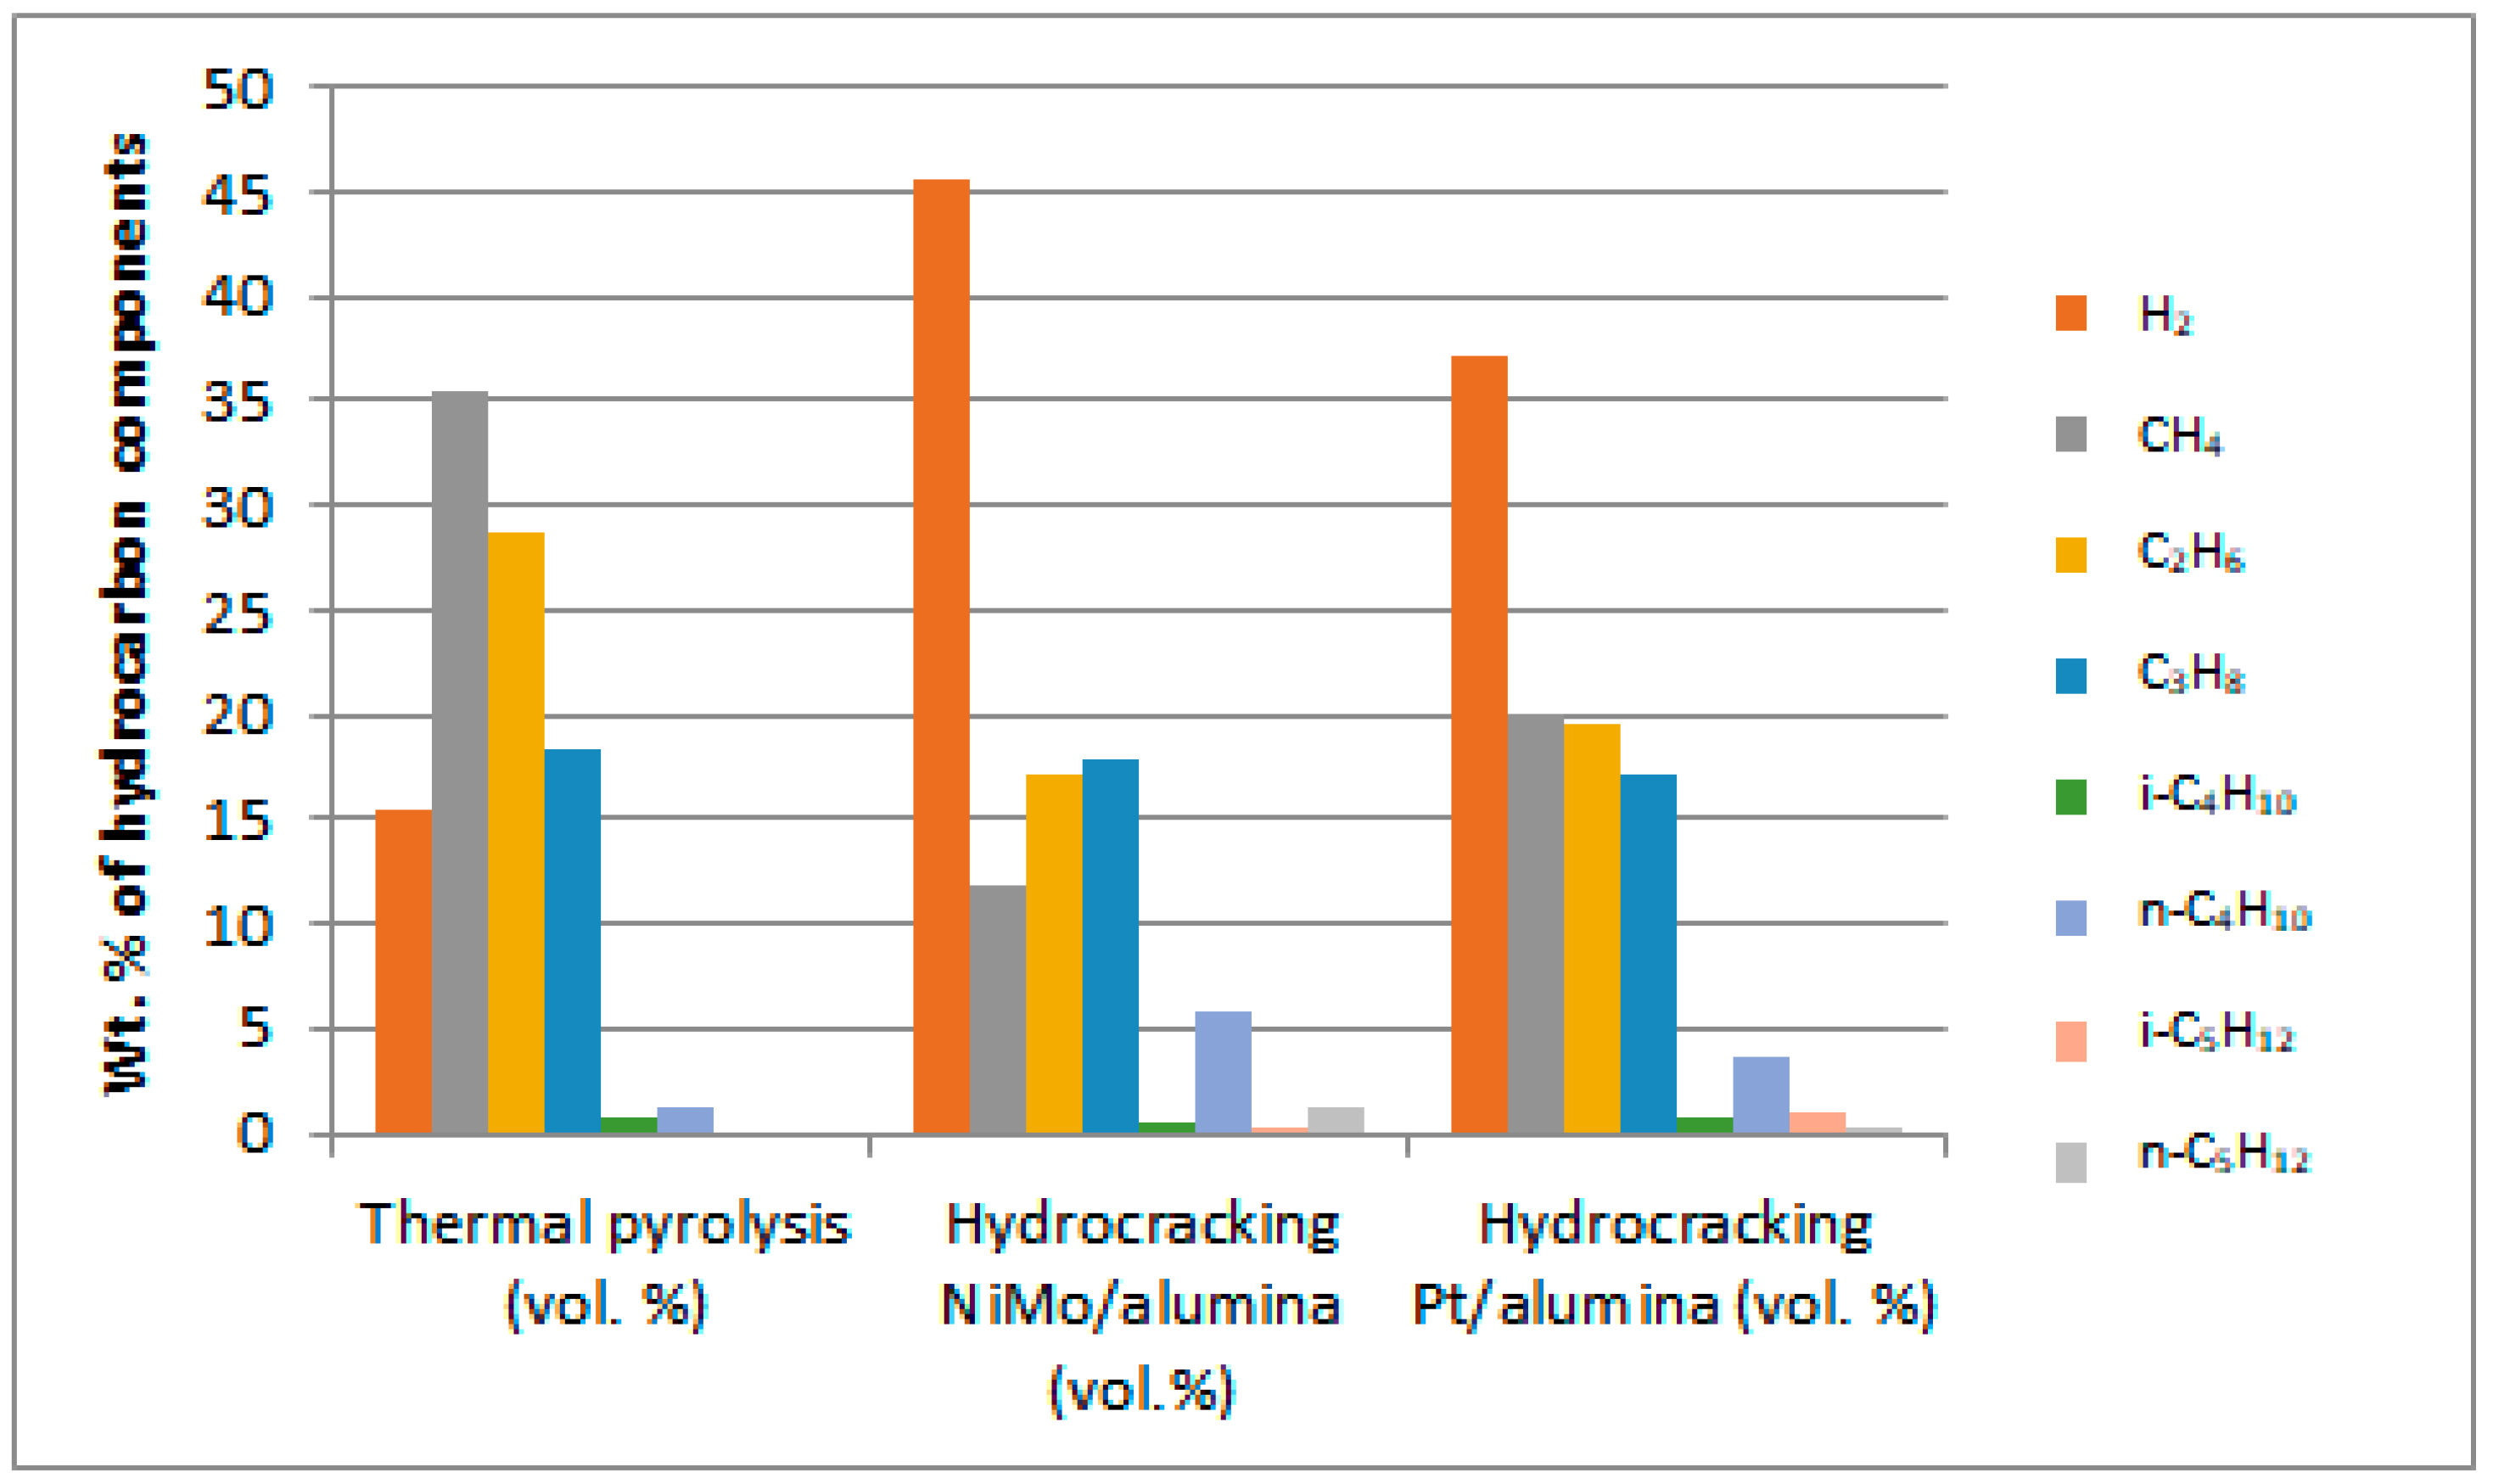
Non-catalytic thermal pyrolysis and catalytic hydrocracking using an alumina catalyst after metal loading via the wetness impregnation method gives an effective catalyst for converting waste plastics into valuable liquid and gaseous fuels. A temperature of 450 °C and a pressure of 20 bar in thermal and hydrocracking were seen as the best conditions for minimizing the solid residue to ensure that the used catalyst could easily be extracted from the reaction residues at the end of the reaction. Burning the spent catalyst at 700 °C proved successful in regenerating it to give excellent catalytic behavior while being used in the reaction again. The properties of the fresh and reactivated catalyst were investigated using TGA, XRD, SEM, EDX, BET and FTIR analyses. This was to ensure that severe reactivation conditions did not affect the structure or catalytic activity of the catalysts. GC-MS analysis showed that the fresh NiMo/Al2O3 catalyst gives the best liquid hydrocarbons yield of 86 wt% compared with non-catalytic pyrolysis and the fresh Pt/Al2O3 catalyst, which recorded 78.4 and 84 wt%, respectively. After using the regenerated catalyst, the proportion of the liquid produced was slightly decreased to 83.3 and 82.9 wt% over the NiMo/Al2O3 and Pt/Al2O3 catalysts, respectively. The obtained solids were 0.22, 0.4 and 0.8 wt% and the gases were found to be 13.78, 15.6 and 20.8 wt% over the NiMo/Al2O3 and Pt/Al2O3 fresh catalysts and non-catalytic pyrolysis, respectively. It was then observed that the ratios of the produced gas increased to reach 16.02 and 16.1 wt% when using the regenerated NiMo/Al2O3 and Pt/Al2O3 catalysts, respectively. In addition, the results showed that the hydrocracking over the Pt/Al2O3 catalysts gave the highest weight of products of the gasoline fractions (C6–C12), as the percentage of the produced gasoline range increased from 15.94 wt% in non-catalytic pyrolysis to 34.45 and 49.85 wt% over the NiMo/Al2O3 and Pt/Al2O3 fresh catalysts, respectively. When a regenerated catalyst was used instead of a fresh one, the gasoline yield decreased slightly to 48.17 and 31.39 wt% over the Pt/Al2O3 and NiMo/Al2O3 catalysts, respectively. Overall, the non-catalytic pyrolysis process led to an increase in the weight percentage within the diesel fuel (C13–C28) to 80.83 wt% compared to the content of the produced gasoline fuel. Similarly, in the case of using catalytic hydrocracking with the presence of either fresh or regenerated catalysts, taking into account a reduction in the proportion of diesel fuel produced compared to the non-catalytic cracking process, the gas in range of (C1–C5) showed that the most significant proportion of the resulting gases were combustible gases (i.e., methane, ethane, propane, butane and pentane) with a large proportion of hydrogen gas as well. Moreover, the availability of a greater proportion of oxygen gas in non-catalytic pyrolysis reactions led to the emergence of a greater proportion of carbon dioxide gas in its products compared to the gaseous products in the hydrocracking process. Furthermore, the results of the viscosity of the produced liquid show that the viscosity follows the trend: Pt/Al2O3 < NiMo/Al2O3 < non-catalytic thermal cracking, whereas the lowest pour point and flash point possessed by the liquid products were found on the surface of the fresh and regenerated Pt/Al2O3 catalysts. A decrease in the pour point and flash point values indicates the enhancement in the flowability of the crude oil and an increase in the volatile hydrocarbon components of ignition when exposed to a spark. Finally, in this work, the same methodology as that used by Ramdoss and Tarrer was applied, with the usage modified to six lumps and fifteen reactions. All primary reactions showed greater activation energy on the Pt/Al2O3 catalyst except for the production of the gas lump where its value decreased to 39,245.980 J/mol compared to 39,844.25 J/mol on the NiMo/Al2O3 catalyst. Moreover, the activation energies of the secondary reactions gave a higher value over Pt/Al2O3 than that over NiMo/Al2O3 in seven out of ten reactions. The apparent activation energies for gasoline production were 108,234.89 and 103,404.02 J/mole on the catalyst surface of the NiMo/Al2O3 and Pt/Al2O3 catalysts, respectively, while the value of the apparent activation energies for diesel fraction production were 66,301.29 and 69,260.46 J/mole on the catalyst surface of the NiMo/Al2O3 and Pt/Al2O3 catalysts, respectively.

Author Contributions

This research was conducted by M.S.A.-I. as part of his Doctorate degree program at the University of Technology-Iraq, under the supervision of B.Y.A.-Z. and R.S.A. B.Y.A.-Z. conducted the literature review and contributed to the experimental design. R.S.A. was responsible for planning the experiments, analyzing the data, and writing the paper. Z.M.S. performed all mathematical calculations, including modeling, simulation, and parameter estimation. I.H. provided valuable contributions in terms of review, editing, and scientific evaluation. All authors have read and agreed to the published version of the manuscript.

Funding

This research received no external funding.

Conflicts of Interest

The authors declare no conflict of interest.

References

  1. Jannat, M.; Akter, S.; Ehsan, M. Conversion of Waste Polypropylene Plastic into Fuel. In AIP Conference Proceedings; AIP Publishing LLC.: New York, NY, USA, 2019; Volume 2121, p. 120009. [Google Scholar]
  2. Ahmad, I.; Ismail Khan, M.; Khan, H.; Ishaq, M.; Tariq, R.; Gul, K.; Ahmad, W. Pyrolysis study of polypropylene and polyethylene into premium oil products. Int. J. Green Energy 2015, 12, 663–671. [Google Scholar] [CrossRef]
  3. Sarker, M.; Rashid, M.M. Polypropylene Waste Plastic Conversion into Fuel Oil by using Thermal Degradation with Fractional Process. Am. J. Environ. Energy Power Res. 2014, 2, 1–10. [Google Scholar]
  4. Fahim, I.; Mohsen, O.; Elkayaly, D. Production of fuel from plastic waste: A feasible business. Polymers 2021, 13, 915. [Google Scholar] [CrossRef] [PubMed]
  5. Vijayakumar, A.; Sebastian, J. Pyrolysis process to produce fuel from different types of plastic—A review. IOP Conf. Ser. Mater. Sci. Eng. 2018, 396, 012062. [Google Scholar] [CrossRef]
  6. Samosir, R.; Simanjuntak, S.L.; Budiarto. Analysis of physical and microstructure liquid fuels from waste plastic pyrolysis polypropylene. IOP Conf. Series Mater. Sci. Eng. 2018, 420, 012056. [Google Scholar] [CrossRef]
  7. Hakeem, I.G.; Aberuagba, F.; Musa, U. Catalytic pyrolysis of waste polypropylene using Ahoko kaolin from Nigeria. Appl. Petrochem. Res. 2018, 8, 203–210. [Google Scholar] [CrossRef] [Green Version]
  8. Sobko, A.A. Generalized van der Waals-Berthelot equation of state. Dokl. Phys. 2008, 53, 416–419. [Google Scholar] [CrossRef]
  9. Patra, C.N.; Yethiraj, A. Generalized van der Waals density functional theory for nonuniform polymers. J. Chem. Phys. 2000, 112, 1579–1584. [Google Scholar] [CrossRef]
  10. Gao, F. Pyrolysis of Waste Plastics into Fuels. 2010. Available online: https://ir.canterbury.ac.nz/handle/10092/4303 (accessed on 11 June 2022).
  11. Plastic Waste Management Institute. An Introduction to Plastic Recycling. Plast. Waste Manag. Inst. 2013, 16, e229–e230. [Google Scholar] [CrossRef] [Green Version]
  12. Murata, K.; Sato, K.; Sakata, Y. Effect of pressure on thermal degradation of polyethylene. J. Anal. Appl. Pyrolysis 2004, 71, 569–589. [Google Scholar] [CrossRef]
  13. Sharuddin, S.D.A.; Abnisa, F.; Daud, W.M.A.W.; Aroua, M.K. Pyrolysis of plastic waste for liquid fuel production as prospective energy resource. IOP Conf. Series Mater. Sci. Eng. 2018, 334, 012001. [Google Scholar] [CrossRef]
  14. Sah, N.B.K.; Chaudhary, S.; Timilsina, S. Design and Fabrication of Machine to Convert Plastic into Oil and Gaseous Fuel Production; Proj. report; Visvesvaraya Technique University: Belagavi, India, 2018; p. 590018. [Google Scholar]
  15. Ćwik, A. Fuel from Waste—Catalytic Degradation of Plastic Waste to Liquid Fuels. 2014. Available online: https://fenix.tecnico.ulisboa.pt/downloadFile/395146395239/Agnieszka%20Cwik%20master%20thesis%202.pdf (accessed on 18 May 2022).
  16. Lee, H.W.; Park, Y.-K. Catalytic Pyrolysis of Polyethylene and Polypropylene over Desilicated Beta and Al-MSU-F. Catalysts 2018, 8, 501. [Google Scholar] [CrossRef] [Green Version]
  17. Aguado, S. Feedstock Recycling of Plastic Wastes; Deprtment of Expermental Sciences and Engineering/Rey Juan Carlos University: Madrid, Spain, 1999. [Google Scholar]
  18. Hazrat, M.; Rasul, M.; Khan, M. A Study on Thermo-catalytic Degradation for Production of Clean Transport Fuel and Reducing Plastic Wastes. Procedia Eng. 2015, 105, 865–876. [Google Scholar] [CrossRef] [Green Version]
  19. Liu, S.; Kots, P.A.; Vance, B.C.; Danielson, A.; Vlachos, D.G. Plastic waste to fuels by hydrocracking at mild conditions. Sci. Adv. 2021, 7, eabf8283. [Google Scholar] [CrossRef]
  20. Ding, W.; Liang, J.; Anderson, L.L. Hydrocracking and Hydroisomerization of High-Density Polyethylene and Waste Plastic over Zeolite and Silica−Alumina-Supported Ni and Ni−Mo Sulfides. Energy Fuels 1997, 11, 1219–1224. [Google Scholar] [CrossRef]
  21. Garforth, A.A.; Ali, S.; Hernández-Martínez, J.; Akah, A. Feedstock recycling of polymer wastes. Curr. Opin. Solid State Mater. Sci. 2004, 8, 419–425. [Google Scholar] [CrossRef]
  22. Xue, Y.; Johnston, P.; Bai, X. Effect of catalyst contact mode and gas atmosphere during catalytic pyrolysis of waste plastics. Energy Convers. Manag. 2017, 142, 441–451. [Google Scholar] [CrossRef]
  23. Das, S.; Paney, S. Pyrolysis and Catalytic Cracking of Municipal Plastic Waste for Recovery of Gasoline Range Hydrocarbons Pyrolysis and Catalytic Cracking of Municipal Plastic Waste for Recovery of Gasoline Range Hydrocarbons. Ph.D. Thesis, National Institute of Technology, Rourkela, India, 2007; pp. 10–55. [Google Scholar]
  24. Kumar, S.; Singh, R.K. Recovery of hydrocarbon liquid from waste high density polyethylene by thermal pyrolysis. Braz. J. Chem. Eng. 2011, 28, 659–667. [Google Scholar] [CrossRef] [Green Version]
  25. Jantasee, S.; Phetyim, N.; Petchinthorn, K.; Thanupongmanee, T.; Sripirom, N. Pyrolysis oil production from polypropylene plastic waste using molybdenum modified alumina-silica catalysts. E3S Web Conf. 2019, 122, 01005. [Google Scholar] [CrossRef]
  26. Saeed, A.Q.; Al-Zaidi, B.Y.; Hamadi, A.S.; Majdi, H.S.; AbdulRazak, A.A. Upgrade of heavy crude oil via aquathermolysis over several types of catalysts. Mater. Express 2022, 12, 278–287. [Google Scholar] [CrossRef]
  27. Khalaf, Y.H.; Al-Zaidi, B.Y.S.; Shakour, Z.M. Experimental and Kinetic Study of the Effect of using Zr- and Pt-loaded Metals on Y-zeolite-based Catalyst to Improve the Products of n-heptane Hydroisomerization Reactions. Orbital Electron. J. Chem. 2022, 14, 153–167. [Google Scholar] [CrossRef]
  28. Bashir Yousif Sherhan Al-Zaidi, G.G. The Effect of Modification Techniques on the Performance of Zeolite-y Catalysts in Hydrocarbon Cracking Reactions; University of Manchester: Manchester, UK, 2011. [Google Scholar]
  29. Van Bekkum, H.; Flanigen, E.M.; Jacobs, P.A.; Jansen, J.C. Introduction to zeolite science and practice: Preface 2nd edition. In Studies in Surface Science and Catalysis; KU Leuven: Leuven, Belgium, 2001; Volume 137, pp. ix–x. [Google Scholar]
  30. Ayala-G, M.; Puello, E.; Quintana, P.; González-García, G.; Diaz, C. Comparison between alumina supported catalytic precursors and their application in thiophene hydrodesulfurization: (NH4)4[NiMo6O24H6]·5H2O/γ-Al2O3 and NiMoOx/γ-Al2O3 conventional systems. RSC Adv. 2015, 5, 102652–102662. [Google Scholar] [CrossRef]
  31. Hyde, T. Final Analysis. Platin. Met. Rev. 2008, 52, 129–130. [Google Scholar] [CrossRef]
  32. Behnejad, B.; Abdouss, M.; Tavasoli, A. Comparison of performance of Ni–Mo/γ-alumina catalyst in HDS and HDN reactions of main distillate fractions. Pet. Sci. 2019, 16, 645–656. [Google Scholar] [CrossRef] [Green Version]
  33. Al-Zaidi, B.Y.; Holmes, R.J.; Garforth, A.A. Study of the Relationship between Framework Cation Levels of Y Zeolites and Behavior during Calcination, Steaming, and n-Heptane Cracking Processes. Ind. Eng. Chem. Res. 2012, 51, 6648–6657. [Google Scholar] [CrossRef]
  34. Saleh, N.J.; Al-Zaidi, B.Y.S.; Sabbar, Z.M. A Comparative Study of Y Zeolite Catalysts Derived from Natural and Commercial Silica: Synthesis, Characterization, and Catalytic Performance. Arab. J. Sci. Eng. 2017, 43, 5819–5836. [Google Scholar] [CrossRef]
  35. Chester, A.W. Zeolite Characterization and Catalysis: A Tutorial; Springer Science + Business Media B.V.: Heidelberg, Germany, 2009; Volume 2010, ISBN 9781402096778. [Google Scholar]
  36. Ma, H.; Zhang, J.; Wang, M.; Sun, S. Modification of Y-Zeolite with Zirconium for Enhancing the Active Component Loading: Preparation and Sulfate Adsorption Performance of ZrO(OH)2/Y-Zeolite. Chemistryselect 2019, 4, 7981–7990. [Google Scholar] [CrossRef]
  37. Tolstoy, V.; Altangerel, B. A new “fluoride” synthesis route for successive ionic layer deposition of the ZnxZr(OH)yFz·nH2O nanolayers. Mater. Lett. 2007, 61, 123–125. [Google Scholar] [CrossRef]
  38. Qian, Z.; Shi, J. Characterization of pure and doped zirconia nanoparticles with infrared transmission spectroscopy. Nanostructured Mater. 1998, 10, 235–244. [Google Scholar] [CrossRef]
  39. Yalçın, E.; Sengul, U.; Ozdemir, G.; Çavuşoğlu, K. Cisplatin delivery from nickel supported Al2O3 powders: Characterization with swelling and mutagenity tests. Turk. J. Biochem. 2012, 37, 81–86. [Google Scholar] [CrossRef]
  40. Region, C.; Allen, A.D. Platinum (11) complexes: Infrared spectra i n t h e 300-800 cm-i region. Can. J. Chem. 1964, 42, 1551–1554. [Google Scholar]
  41. Chen, Z.; Wang, H.; Wang, X.; Chen, P.; Liu, Y.; Zhao, H.; Zhao, Y.; Duan, Y. Low-temperature remote plasma enhanced atomic layer deposition of ZrO2/zircone nanolaminate film for efficient encapsulation of flexible organic light-emitting diodes. Sci. Rep. 2017, 7, 40061. [Google Scholar] [CrossRef] [Green Version]
  42. Naayi, S.A.; Hassan, A.I.; Salim, E.T. FTIR and X-ray diffraction analysis of Al2O3 nanostructured thin film prepared at low temperature using spray pyrolysis method. Int. J. Nanoelectron. Mater. 2018, 11, 1–6. [Google Scholar]
  43. Yanik, J.; Karayildirim, T. Liquefaction of Municipal Waste Plastics over Acidic and Nonacidic Catalysts. In Feedstock Recycling and Pyrolysis of Waste Plastics: Converting Waste Plastics into Diesel and Other Fuels; John Wiley & Sons, Inc.: Hoboken, NJ, USA, 2006; Volume 82, pp. 209–224. ISBN 9780470021545. [Google Scholar]
  44. Hammoodi, S.I.; Almukhtar, R.S. Thermal Pyrolysis of Municipal Solid Waste (MSW). IOP Conf. Series Mater. Sci. Eng. 2019, 579, 012018. [Google Scholar] [CrossRef]
  45. Luo, M.; Curtis, C.W. Effect of reaction parameters and catalyst type on waste plastics liquefaction and coprocessing with coal. Fuel Process. Technol. 1996, 49, 177–196. [Google Scholar] [CrossRef]
  46. Bezergianni, S.; Dimitriadis, A.; Faussone, G.-C.; Karonis, D. Alternative Diesel from Waste Plastics. Energies 2017, 10, 1750. [Google Scholar] [CrossRef] [Green Version]
  47. Nagarjuna, S.; Bhosale, S.M. A Review: Energy Recovery from Plastic Wastes Through Pyrolysis. Int. J. Trend Sci. Res. Dev. 2018, 3, 772–775. [Google Scholar] [CrossRef] [Green Version]
  48. Miteva, K.; Aleksovski, S.; Bogoeva-Gaceva, G.; Karmina, M.; Slavčo, A.; Gordana, B.-G. Catalytic pyrolysis of waste plastic into liquid fuel. Zastita Mater. 2016, 57, 600–604. [Google Scholar] [CrossRef] [Green Version]
  49. Panda, A.K.; Singh, R. Catalytic performances of kaoline and silica alumina in the thermal degradation of polypropylene. J. Fuel Chem. Technol. 2011, 39, 198–202. [Google Scholar] [CrossRef]
  50. ATSDR (Agency for Toxic Substances and Disease Registry). Case Studies in Environmental Medicine. 1997. Available online: http//www.atsdr.cdc.gov/HEC/CSEM/csem.html (accessed on 18 May 2022).
  51. Anene, A.F.; Fredriksen, S.B.; Sætre, K.A.; Tokheim, L.-A. Experimental Study of Thermal and Catalytic Pyrolysis of Plastic Waste Components. Sustainability 2018, 10, 3979. [Google Scholar] [CrossRef] [Green Version]
  52. Munir, D.; Irfan, M.F.; Usman, M.R. Hydrocracking of virgin and waste plastics: A detailed review. Renew. Sustain. Energy Rev. 2018, 90, 490–515. [Google Scholar] [CrossRef]
  53. Ramdoss, P.K.; Tarrer, A.R. High-temperature liquefaction of waste plastics. Fuels 1998, 77, 293–299. [Google Scholar] [CrossRef]
  54. Souza, B.M.; Travalloni, L.; da Silva, M.A.P. Kinetic Modeling of the Thermal Cracking of a Brazilian Vacuum Residue. Energy Fuels 2015, 29, 3024–3031. [Google Scholar] [CrossRef]
  55. Gao, H.; Wang, G.; Xu, C.; Gao, J. Eight-Lump Kinetic Modeling of Vacuum Residue Catalytic Cracking in an Independent Fluid Bed Reactor. Energy Fuels 2014, 28, 6554–6562. [Google Scholar] [CrossRef]
  56. Kaminski, T.; Husein, M.M. Kinetic modelling of thermal cracking of Arabian atmospheric and vacuum residue. Fuel Process. Technol. 2019, 189, 89–97. [Google Scholar] [CrossRef]
  57. Asaee, S.D.S.; Vafajoo, L.; Khorasheh, F. A new approach to estimate parameters of a lumped kinetic model for hydroconversion of heavy residue. Fuel 2014, 134, 343–353. [Google Scholar] [CrossRef]
Figure 1. Pictorial representation of the wet impregnating steps and metal reduction.
Energies 16 04871 g001
Figure 2. Schematic flow diagram of the experimental rig.
Energies 16 04871 g002
Figure 3. (a) PP waste polymer after grinding, (b) TGA plots of PP waste polymer after grinding.
Energies 16 04871 g003
Figure 4. TGA plots of the catalysts (heating temperature vs. percentage of catalyst weight loss): the left plot represents the NiMo/Al2O3 catalyst and the right plot represents the Pt/Al2O3 catalyst.
Energies 16 04871 g004
Figure 5. (a) The left plot represents the XRD patterns of fresh and regenerated Pt/Al2O3 catalysts. (b) The right plot represents XRD patterns of fresh and regenerated NiMo/Al2O3 catalysts.
Energies 16 04871 g005
Figure 6. SEM images of: (a) the fresh NiMo/Al2O3 catalyst, (b) the regenerated NiMo/Al2O3 catalyst, (c) the fresh Pt/Al2O3 catalyst, (d) the regenerated Pt/Al2O3 catalyst.
Energies 16 04871 g006
Figure 7. FTIR spectra for fresh and regenerated NiMo/Al2O3 and Pt/Al2O3 catalysts.
Energies 16 04871 g007
Figure 8. FTIR spectra of the used catalysts; left plot represents the fresh and regenerated NiMo/Al2O3 at range of 420 to 1000 cm−1, and right plot represents the fresh and regenerated Pt/Al2O3 catalysts at range of 420 to 520 cm−1.
Energies 16 04871 g008
Figure 9. (a) The fresh catalyst, (b) the spent or deactivated catalyst and (c) the regenerated or reactivated catalyst.
Energies 16 04871 g009
Figure 10. Non-catalytic treatment results for PP waste plastics under varying pressures at 400 °C.
Energies 16 04871 g010
Figure 11. Non-catalytic treatment for PP waste plastics under varying pressures at 450 °C.
Energies 16 04871 g011
Figure 12. Classification of the weight percentages of the hydrocarbon components produced from the catalytic and non-catalytic hydrocracking reaction according to the number of carbon atoms.
Energies 16 04871 g012
Figure 13. Distribution spectra of burnable gases produced from PP waste plastic treatment.
Energies 16 04871 g013
Figure 14. Six-lumps kinetic model applied in this study for waste plastic hydrocracking.
Energies 16 04871 g014
Figure 15. Kinetic model regression for catalytic hydrogenation over NiMo/Al2O3 catalyst.
Energies 16 04871 g015
Figure 16. Kinetic model regression for catalytic hydrogenation over Pt/Al2O3 catalyst.
Energies 16 04871 g016
Figure 17. Values of the obtained activation energies and comparison of the behavior of the used catalysts.
Energies 16 04871 g017
Table 1. Common catalysts used in polymer cracking reactions [18,19,20].
FeedProcessTemperature °CCatalyst Type
Mixed plasticsThermos-catalytic degradation200–4305 wt% ZnO
LDPE, HDPE, PSThermos-catalytic degradation200–400Fe2(CO3)3
LDPE, HDPE, PSThermos-catalytic degradation200–40020 wt% ZnO
HDPECatalytic degradation400Zirconium
PPCatalytic pyrolysis400–550Al2O3
HDPECatalytic cracking381–428Al2O3
Mix of polyolefinHydrocracking225Pt/WO3/ZrO2 and HY Zeolite
Mixed plasticsHydrocracking375HZSM-5 and Alumina silica
Table 2. Materials utilized in the experimental work.
No.MaterialStructureCompanyOriginPurity
1PolypropylenePP (3 mm particles)Household waste, Jinub StreetIraq-
2Hydrogen gasesH2Al-Khaleej gases facility, Al-Masbah StreetIraq99.9%
3Nitrogen gasesN2Al-Khaleej gases facility, Al-Masbah StreetIraq99.9%
4AluminaAl2O3Sigma Aldrich, SchnelldorfGermany99%
5Nickel (II) NitrateNi(NO3)2 (Mwt. 182.70)Sigma Aldrich, SchnelldorfGermany99.5%
6Ammonium Molybdate(NH4)6MO4O24.4H2O (Mwt. 1235.86)Sigma Aldrich, SchnelldorfGermany99.6%
7Tetra ammine platinum (II) nitratePt(NH3)4(NO3)2 (Mwt. 387.21)Sigma Aldrich, SchnelldorfGermany99.9%
Table 3. BET surface area analysis results.
CatalystVm (cm3 g−1)BET Area (m2 g−1)Total Pore Volume (cm3 g−1)Mean Pore Diameter (nm)
Fresh NiMo/alumina34.478150.070.3298.777
Regenerated NiMo/alumina32.506141.480.2988.435
Fresh Pt/alumina35.149152.990.58711.904
Regenerated Pt/alumina34.655150.830.45511.558
Table 4. Products of liquid, gas and solid for decomposition reactions of PP plastic waste under 450 °C and 20 bar.
ProcessLiquid wt.%Gas wt.%Solid wt.%
Non-catalytic thermal pyrolysiss78.4020.800.80
Hydrocracking over fresh NiMo/Al2O3 Cat.86.0013.780.22
Hydrocracking over fresh Pt/Al2O3 Cat.84.0015.600.40
Hydrocracking over regenerated NiMo/Al2O3 Cat.83.3016.020.68
Hydrocracking over regenerated Pt/Al2O3 Cat. 82.9016.100.80
Table 5. Fuel range spectrum for liquid products in cracking processes under 450 °C and 20 bar.
ProcessGasoline Range wt.%Diesel Range wt.%Others wt.%
Non-catalytic thermal pyrolysis 15.9480.833.23
Hydrocracking over fresh NiMo/Al2O3 cat. 34.4565.55Nil
Hydrocracking over regenerated NiMo/Al2O3 cat. 31.3968.61Nil
Hydrocracking over fresh Pt/Al2O3 cat. 49.8550.100.05
Hydrocracking over regenerated Pt/Al2O3 cat. 48.1751.83Nil
Table 6. Physical properties of liquid products from cracking processes under 450 °C and 20 bar.
No.TestColorDensity (g.cm−3)APIk. Viscosity (cSt)Pour Point (°C)Flash Point (°C)
1 Non-catalytic thermal pyrolysisDark Brown0.80244.931.9−1544
2Hydrocracking over fresh NiMo/Al2O3Light Brown0.80145.151.32−2038
3Hydrocracking over regenerated NiMo/Al2O3Light Brown0.80244.931.40−1841
4Hydrocracking over fresh Pt/Al2O3Light Brown0.79247.161.10−2233
5Hydrocracking over regenerated Pt/Al2O3Light Brown0.80244.931.15−2234
Table 7. Fuel range spectrum for gas products in cracking processes under 450 °C and 20 bar.
ProcessNon-Catalytic Thermal Pyrolysis (vol.%)Hydrocracking over NiMo/Al2O3 (vol.%)Hydrocracking over Pt/Al2O3 (vol.%)
Hydrogen (H2) 12.5743.9135.77
Carbon Dioxide (CO2) 3.581.591.92
Methane (CH4) 28.7211.3619.36
Ethane (C2H6) 23.2416.4918.88
Propane (C3H8)15.0117.2816.47
Iso-Butane (i-C4H10)0.610.490.78
Normal Butane (n-C4H10)1.035.533.61
Iso-Pentane (i-C5H12)0.000.290.92
Normal Pentane (n-C5H12)0.001.130.29
Oxygen (O2)5.090.740.63
Nitrogen (N2)10.151.191.37
Total100100100
Table 8. Weight ratio of lumps at different temperatures.
Fraction LumpCarbon Numberwt.% over NiMo/Al2O3wt.% over Pt/Al2O3
400 °C425 °C450 °C400 °C425 °C450 °C
GasesC1 to C512.4012.9013.6813.1315.3815.60
Light naphtha C6 to C116.6015.7721.6711.9012.5718.89
Heavy naphtha C12 to C1622.4038.0548.0719.6734.1241.68
Middle distillate fuelC17 to C2527.2022.5016.0131.8529.9023.25
Heavy distillate fuelC25 and more31.4010.780.5723.458.030.58
Table 9. Activation energies and reaction rate constant at 450 °C obtained for the two types of catalysts used.
KnReactionE (J/mol) over Pt/Al2O3E (J/mol) over NiMo/Al2O3
1Light naphtha Gas142,961.93082,729.84
2Heavy naphtha Gas117,973.730264,831.36
3Heavy naphtha Light naphtha103,404.020104,720.17
4Middle distillate fuel Gas155,133.080287,904.78
5Middle distillate fuel Light naphtha270,180.030134,380.31
6Middle distillate fuel → Heavy naphtha115,029.780114,175
7Heavy distillate fuel → Gas184,290.320136,089.49
8Heavy distillate fuel → Light naphtha294,190.620124,452.35
9Heavy distillate fuel → Heavy naphtha112,350.010103,963.55
10Heavy distillate fuel → Middle distillate fuel122,042.58099,562.64
11PP → Gas39,845.98039,244.25
12PP → Light naphtha234,521.650181,936.02
13PP → Heavy naphtha232,017.95042,261.72
14PP → Middle distillate fuel25,332.65023,980.24
15PP → Heavy distillate fuel78,823.90076,659.5
Where n represents the number of reactions.
Table 10. The values of apparent activation energies of gases and liquids on the surface of catalysts, including gasoline and diesel products.
ProductsEapp (J/mol) Pt/Al2O3 CatalystEapp (J/mol) NiMo/Al2O3 Catalyst
Gas product39,252.0339,845.02
Liquid product69,260.7666,301.42
Gasoline product103,404.02108,234.89
Diesel product69,260.4666,301.29
Disclaimer/Publisher’s Note: The statements, opinions and data contained in all publications are solely those of the individual author(s) and contributor(s) and not of MDPI and/or the editor(s). MDPI and/or the editor(s) disclaim responsibility for any injury to people or property resulting from any ideas, methods, instructions or products referred to in the content.

