Review

Key Modes of Ignition and Maintenance of Corona Discharge in Air

by
Vasily Yu. Kozhevnikov
1,*,
Andrey V. Kozyrev
1,
Victor F. Tarasenko
2,
Aleksandr O. Kokovin
1,
Evgeni Kh. Baksht
2 and
Nikita P. Vinogradov
2
1
Laboratory of Theoretical Physics, Institute of High Current Electronics, Siberian Branch (SB), Russian Academy of Sciences, Akademicheskii Av. 2/3, 634055 Tomsk, Russia
2
Laboratory of Optical Radiation, Institute of High Current Electronics, Siberian Branch (SB), Russian Academy of Sciences, Akademicheskii Av. 2/3, 634055 Tomsk, Russia
*
Author to whom correspondence should be addressed.
Energies 2023, 16(13), 4861; https://doi.org/10.3390/en16134861
Submission received: 28 May 2023 / Revised: 16 June 2023 / Accepted: 20 June 2023 / Published: 21 June 2023
(This article belongs to the Section E: Electric Vehicles)

Abstract

:
Theoretical and experimental studies of various modes of corona discharge operation in atmospheric pressure air are presented in this short review. The original results of modeling negative corona discharges are presented, taking into account the non-stationary plasma-chemical kinetics of charged particles in air plasma. The space–time evolution of the discharge in needle-to-plane geometry is investigated and analyzed. Several stages of discharge development are revealed from the moment of initiation of a low-negative current corona to the quasi-stationary mode of a glow discharge. Experimental data of the authors are presented. Modern technology and diagnostic equipment with a wide variation of the main parameters (the shape and polarity of the applied voltage, the type of gap, etc.) was used. The measurement of the optical characteristics of the plasma glow was carried out with high spatial resolution. Corona discharge current pulse profiles in the air at atmospheric pressure have been recorded with subnanosecond time resolution. With a positive polarity of the pin electrode and high voltage, a transition from a spherical streamer initiating a corona discharge to a cylindrical streamer is shown. The author’s results are rigorously evaluated through a critical comparison with findings from other research groups.

1. Introduction

Self-sustained air corona discharge is one of the most common types of electric discharge used in technology [1,2,3,4]. That is due to the simplicity of technical implementation and a wide range of possible applications as a source of atmospheric ions, reactive radicals, excited molecules and ionizing ultraviolet radiation, electrostatic precipitators for air purification from harmful impurities, etc. Despite the extensive history of corona discharge research [1,2,3,4,5] and the substantial number of recent publications, numerous unresolved issues necessitate further investigation. Since corona discharge in atmospheric air has profound prospects in technical applications (indoor ionizers, processing of biological objects, sterilization of surfaces and tools), corona in air is receiving increasing attention from researchers [6,7,8]. In nature, a corona discharge ignites on sharp edges at high electric field strengths in a thunderstorm atmosphere [9,10,11].
Well-known papers describe dozens of models of corona discharge, which made it possible to study its properties in various gases at negative and positive polarity of an electrode with a small radius of curvature. One of the issues of great interest is the physical nature of Trichel pulses: see, for example [1,3,12,13,14,15,16,17,18,19,20,21,22,23,24]. The pulses arise when a corona discharge is ignited with a negative polarity voltage at the needle and continues with increasing frequency as the voltage across the gap increases. The amplitude of the Trichel pulses decreases in relation to the stationary stage of the corona current as the voltage increases, while the magnitude of the corona current between pulses increases [7].
A feature of Trichel pulses in an electronegative gas is the rapid increase of the current through the gap and the presence of a step on the leading edge of the current pulse [21,23,25]. The first physical models explaining the rapid current increase in Trichel pulses were proposed in [3,19,20]. According to [19], the first electron initiated from the cathode due to field emission or bombardment by a positive ion forms a primary avalanche due to Townsend ionization. Secondary avalanches are initiated from the cathode due to photoionization. However, as shown in [20,23], this mechanism could not provide the rise time of the Trichel pulse current of ~1 ns, which was obtained in [21,23,25].
The Loeb theory [1,19] was extended by Aleksandrov [20]. Based on analysis, it was shown that a large number of electron avalanches are formed simultaneously due to photoionization. It was also proposed that there is an initial stage of the discharge with a duration of ~500 ns with a slow increase in current up to the value from which the Trichel pulse occurs. That could explain the short current rise time duration at a level of ~10 ns. However, the model did not explain the formation of a sequence of Trichel pulses and their disappearance with increasing voltage.
Morrow [26,27] suggested that the step on the leading edge of the Trichel pulse is due to the processes of electron emission from the cathode. At the initial current growth, the emission is determined by prompt photons from the discharge plasma, then the main contribution to the electron emission from the same part of the cathode is made by positive ions.
A study of the role of electron photoemission from the cathode revealed its effect on the step on the leading edge of the current pulse in pure oxygen at atmospheric pressure [23]. In that work, it is assumed that Trichel pulses in case of negative corona are associated with the development of a cathode-directed streamer in the immediate vicinity of the needle tip and the formation of a glow discharge after the streamer arrives at the cathode. In the review [28], based on analysis and simulation, the hypothesis of [23] was supported, according to which Trichel pulses are due to the formation of positive streamers in the immediate vicinity of the cathode. However, this model did not explain the formation of the pulse sequence and its disappearance with increasing voltage.
The formation of the Trichel pulse sequence was obtained in the model developed in [29], and the previous results of these authors were published in [22,24]. It followed from the calculations that, during the pulse time, a significant change in the transverse structure of the discharge occurs, and the current growth is ensured by filling the cathode surface with plasma.
As follows from the analysis of the most cited works, the proposed physical models describing the formation of Trichel pulses differ significantly. The parameters and modes of Trichel pulses generation obtained in various experimental studies also differ. Therefore, deeper and more comprehensive studies of this regime of corona discharge are required. Moreover, for adequate theoretical modeling of multivariate gas-discharge processes occurring in small volumes and in short times, it is necessary to use modern computational algorithms that require large memory and computation time.
The review summarizes the theoretical and experimental data obtained in recent years by the authors of the review [7,15,17,30] and also compares them with data from other scientific groups. The main part of the review consists of sections with data obtained by theoretical modeling (Section 2 and Section 3) and experimental studies (Section 4 and Section 5), which describe the key modes during the ignition and maintenance of a corona discharge, as well as its transition to other forms of discharges.
In this review, we generally confine ourselves to a detailed consideration of the corona discharge with the negative polarity of the pointed electrode, leaving aside for various reasons the “positive corona” for a separate analysis. For those interested in a discharge with a positive needle, we suggest as a good work [31]; you can also find data in our experimental works; see, for example, [7]. Since the development of several parallel filaments from the needle, which has a radius of curvature of more than 100 μm, can affect the modes of a corona discharge and its properties [16], this review considers the experimental results and processes during the ignition of a single “elementary” corona discharge from the needle with a radius of curvature about 100 μm or less. In this case, one elementary filament of the corona discharge is formed, which enhances to determine its key modes more accurately. It is easy to perform this in calculations by setting certain conditions in the model used under which a single corona discharge is formed.
Thus, the aim of this review is to analyze the physical processes responsible for the occurrence of a corona discharge and its development, to present the main experimental data on the electrical and optical characteristics of a corona discharge in atmospheric pressure air, and also, to consider the conditions for the transition of a corona discharge to other modes of self-sustained discharges.
The analysis is based on the authors’ theoretical modeling of a corona-streamer discharge [15], since it revealed four sequential burning modes. These are (1) the “dark mode” of the breakdown delay; (2) the “mode of the Trichel pulse” with a variable duty cycle and a quasi-stationary component of the corona current; (3) an “intermediate mode” of a growing weak current, culminating in an oscillatory transition to (4), a “stationary mode”, which has the structure of a classical glow discharge. The same modes were implemented in the experiments of the authors.

2. Theory of Corona-Streamer Discharge

2.1. Plasma-Chemical Reaction Model

To describe the kinetics of charged and neutral species of air plasma, a set of plasma-chemical reactions was developed, optimized, and tested [15], which includes 26 elementary reactions (electron impact ionization, electron– and ion–ion recombination, dissociation of molecules, electron attachment and detachment, ion–ion conversion, and recharge). Unlike natural (ambient) air, which consists of a mixture of many gases (nitrogen, oxygen, argon, carbon monoxide, water vapor, and other very small impurities), we consider here a binary mixture of nitrogen and oxygen molecules in the ratio N2:O2 = 4:1, which is commonly called artificial air.
The kinetic scheme for artificial air was made as simplified as possible, so it includes only 9 kinds of species (free electrons e and 8 types of heavy species N, N2, N2+, O, O2, O2+, O4+, O2) and 21 plasma-chemical reactions, which are summarized in the table below. Since our goal is to describe the electrodynamic parameters of the discharge and not its detailed plasma chemistry, we did not complicate the model by introducing excited atoms and molecules and composite molecules (such as NxOy).
The main mechanism of charged particle generation is determined by the reactions of electron impact ionization of the background gas molecules (reactions R1 and R2 in the table). The rate of these reactions has a high threshold electron energy Δε and is very sensitive to the shape of the electron energy distribution function (eEDF), and therefore, the rates are obtained using a BOLSIG+ procedure of numerical solution of the Boltzmann equation [32], using known data on ionization cross sections. Other ionization mechanisms (stepwise, dissociative, etc.) are not taken into account in our model.
The model includes the attachment of free electrons to the oxygen molecules with the formation of the molecular negative ions and the reverse reaction of thermal detachment (reactions R10R14). The reaction set includes ion conversion reactions (reactions R4, R15, R16), having large cross sections and determining the ion composition of the plasma. The model takes also into account 6 types of electron–ion recombination (reactions R3, R5R9) and 3 reactions of ion–ion recombination (reactions R19R21) with known rates [33,34].
Validation of the plasma-chemical model showed that it is necessary to add two reactions of impact dissociation of molecules (reactions R17R18) to it since they play an extremely important role in the formation of the tail of the electron energy distribution function, which determines the rates of all inelastic processes involving electrons. These reactions have very different bond-breaking (dissociation) threshold energies (9.7 eV for N2 and 5.12 eV for O2), and this difference is taken into account in the calculation of reaction rates. Thus, without taking into account the reactions R17R18, the calculated Townsend ionization coefficient α(Te) for air turns out to be strongly overestimated compared to the known data, and taking into account the impact dissociation processes ensures the correct value of the coefficient α(Te).
The plasma-chemical reaction model presented in Table 1 possesses the property of the “minimality” condition. This means that the addition of any extra reaction has little effect on the result of calculations, and the exclusion of any of the reactions described above, on the contrary, significantly changes the result.

2.2. Gas Discharge Model

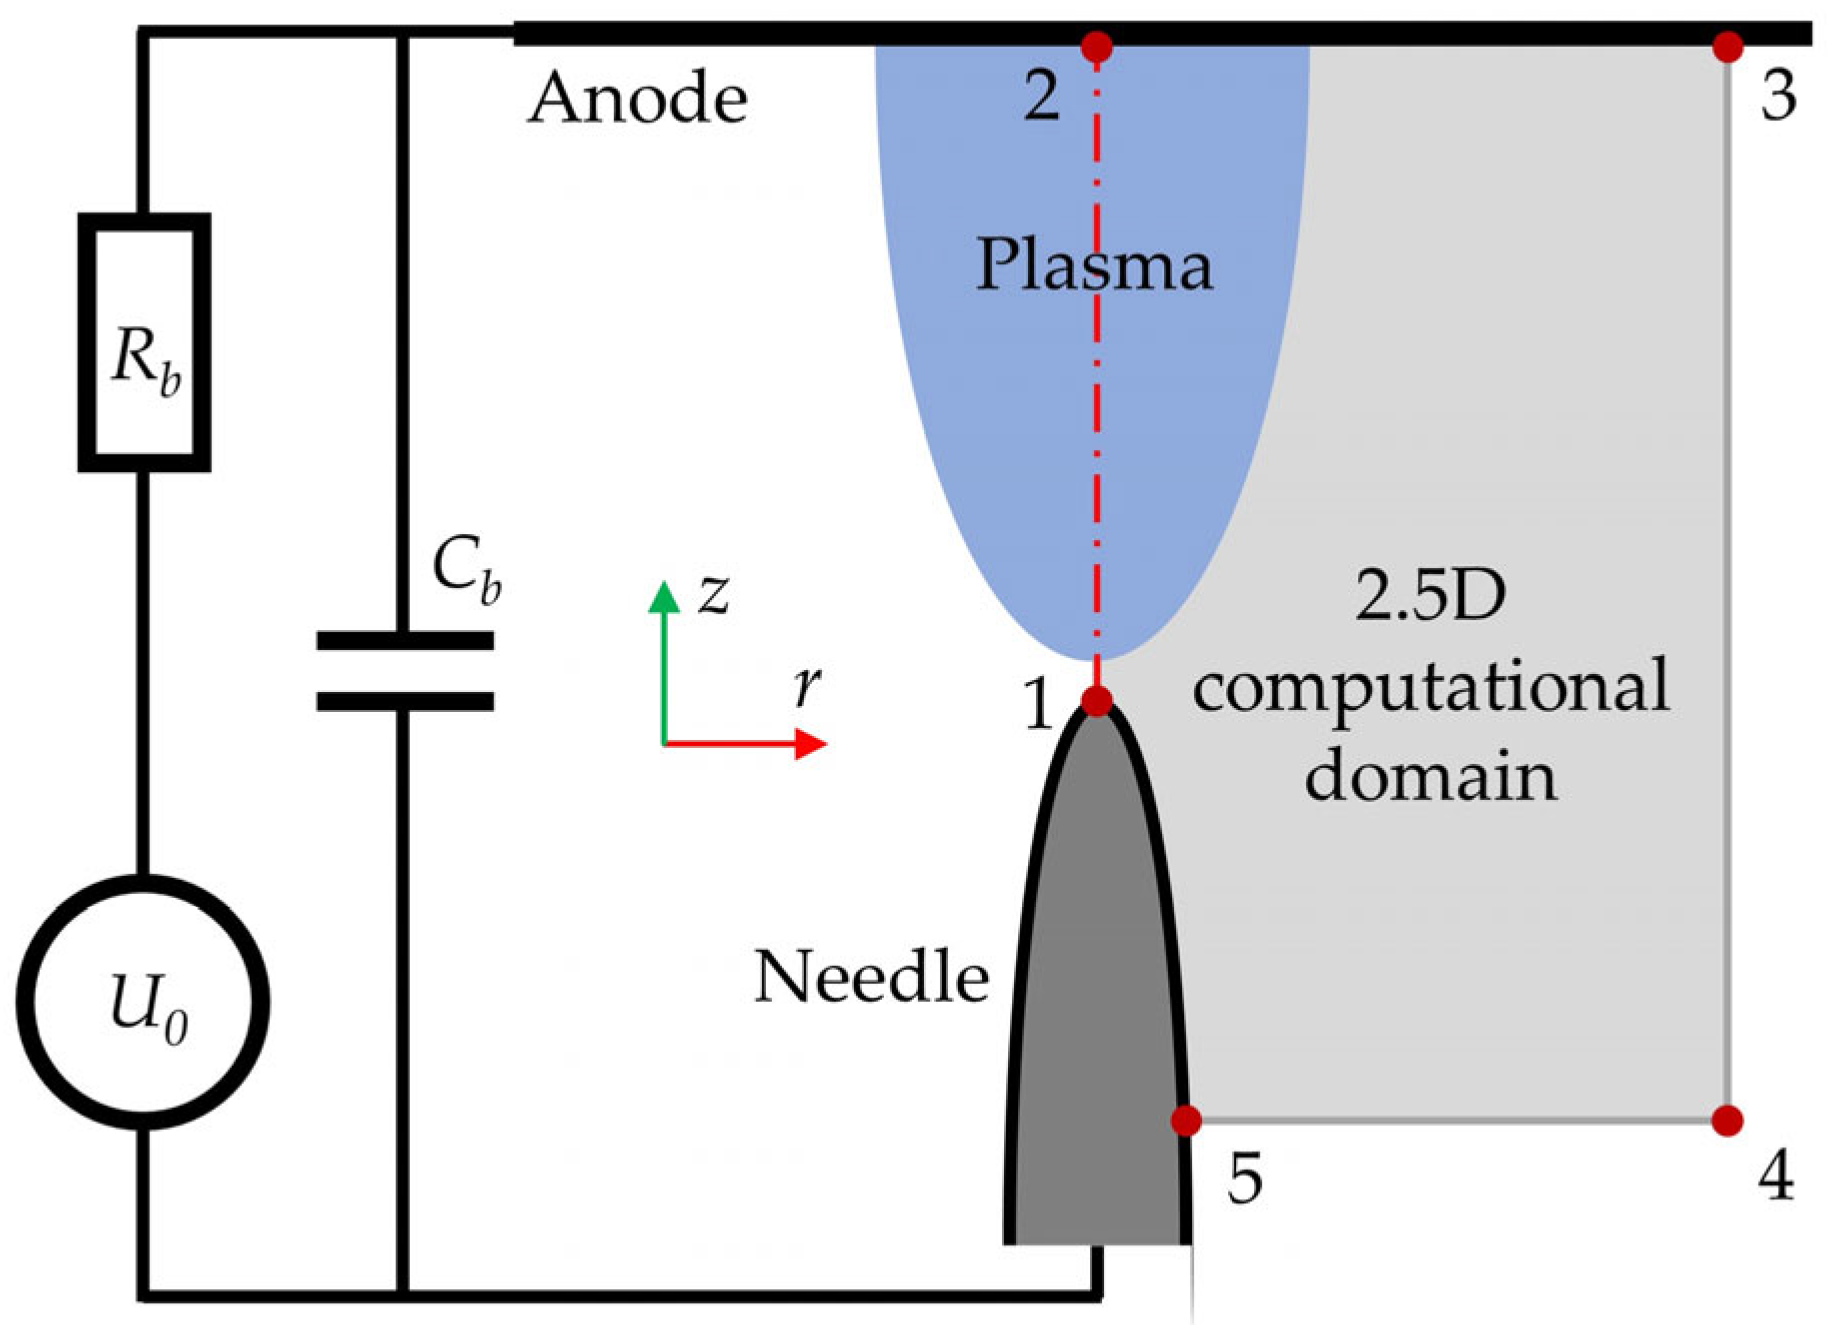
The plasma-chemical reaction model is included in the transport equation system describing the drift-diffusion kinetics of nine kinds of neutral and charged species (e, N, N2, N2+, O, O2, O2+, O4+, O2), and the transport equations are coupled with the Poisson’s equation for the electric field calculation and the Kirchhoff’s equation for the external electric circuit. Figure 1 schematically illustrates the axisymmetric geometry of the problem, which is typical for most experiments with a corona discharge [7−8,37,38], and the configuration of the computational domain.
We described the plasma dynamics in terms of the two-term drift-diffusion transport model of electrons and ions in a self-consistent electric field (Approximation of Multi-Fluid Media). This approach is the most common in describing a high-pressure corona discharge [37], but the PIC–MCC (Particle in Cell + Monte Carlo Collisions) method is also often used [38]. PIC–MCC is not as versatile as AMFM and it is closer to the concept of a “numerical experiment” than to the traditional theoretical description of electrodynamic problems by partial differential equations.
The spatiotemporal evolution of the discharge plasma is described by a system of partial differential continuity equations for each k–th kind of charged species:
n e t + j e = R e ,
n ε t + j ε + j e ( - e E ) = R ε ,
n k t + j k = R k , k = 1 , , N ,
where e is the elementary charge, ne and nε are the electron number density and mean energy density, respectively, je and jε are the flux vectors of electron density and energy density, respectively, defined in terms of drift-diffusion transport, Re and Rε are the rate expressions of electrons, describing the growth–decay processes of electrons and the energy loss–gain due to inelastic collisions, respectively, Rk is the rate expression for k–th species, N is the total number of ion kinds, E is the electric field.
The transport equations are coupled with Poisson’s equation to calculate the self–consistent electric field:
E = e ε 0 ( k = 1 N z k n k - n e ) , E = - φ ,
where ε0 is the permittivity of the vacuum, zk is the charge number of k-th species (charge sign included), and φ is the electrostatic potential.
The diode voltage Ud and the current through the gap I are calculated from Kirchhoff’s equation using integration over the cathode or anode surfaces:
U d = U 0 - ( I + C b d U d d t ) R b ,
I = S [ e ( k = 1 N z k j k - j e ) + ε 0 E t ] d S
where U0 is the source voltage (assumed constant in the calculation), Rb is the large ballast resistance connected in series with the voltage source and the diode, Cb is the blocking capacitance connected in parallel with the diode and takes into account the interelectrode capacitance of the diode.
The equation system (1)–(6) is complemented by the boundary conditions on metal electrodes and open boundaries (boundary 3–4–5 in Figure 1). On the electrodes (the boundaries of the computational domain at the cathode 5–1 and at the anode 2–3 in Figure 1), the secondary ion–electron emission coefficient is set to γ = 0.01 for all kinds of ions, and the electrons are completely absorbed in the anode. At the cathode, field emission on a rough surface is also taken into account, as described in [39], and all emission electrons have an initial kinetic energy of 0.026 eV (room temperature). At the open boundaries of the domain (boundaries 3–4–5 in Figure 1), the normal components of the electric field and all flux vectors of charged species were assumed to be equal to zero. To initialize the calculation, a uniform initial distribution of free electrons and ions at room temperature with the number density of 1 cm–3 is set in the entire domain.

2.3. Numerical Method Details

The numerical solution of the partial differential equation system was performed by the finite element method implemented in the COMSOL environment [40] with additional stabilization techniques in the convergence process of the calculation. For two–dimensional geometry (within the domain 1–2–3–4–5–1 in Figure 1), the finite element mesh distribution of variable element size (the average number of mesh elements in the domain ~105) was fine-tuned, and the minimum size of the mesh element (at the tip of the needle) is ~1 μm, and the maximum (away from electrodes) is ~0.2 mm. To correctly resolve the near-boundary processes, boundary matching layers are implemented in the model.

3. Non–Stationary Dynamics of Corona Discharge

3.1. Discharge with Current Limitation by Ballast Resistance

Let us consider in detail the basic regularities of the corona discharge dynamics using a particular example, which demonstrates the main characteristics of negative corona on a specific example. The parameters of the discharge circuit and the geometrical characteristics of the diode, taken below in our calculations, are typical for corona technical applications. The radius of curvature of the needle cathode is assumed to be 100 μm (this is a typical value for technical devices, since sharper tips are quickly smoothed out during discharge burning due to electrode erosion, and less sharp ones require increased voltages to initiate a corona). The distance from the needle cathode to the plane anode is equal to d = 10 mm. Since the typical voltage values in corona–discharge devices for such gaps fall in the range 5–30 kV (depending on the purpose of the discharge), for the calculation below, we have chosen the external source voltage value closer to the lower limit of this range: U0 = −8 kV.
The ballast capacitance Cb = 100 pF is connected in parallel to the diode (such capacitance in real circuits is inevitable as the interelectrode capacitance of the diode, but in technical devices, it can be implemented as a separate capacitor). The current–limiting ballast resistance in this example is set to Rb = 1.0 MΩ, which limits the stationary discharge current in the circuit to the milliampere level (this is a typical value for the corona discharge devices to prevent an electrical fault in the circuit and irreversible destruction of the device).
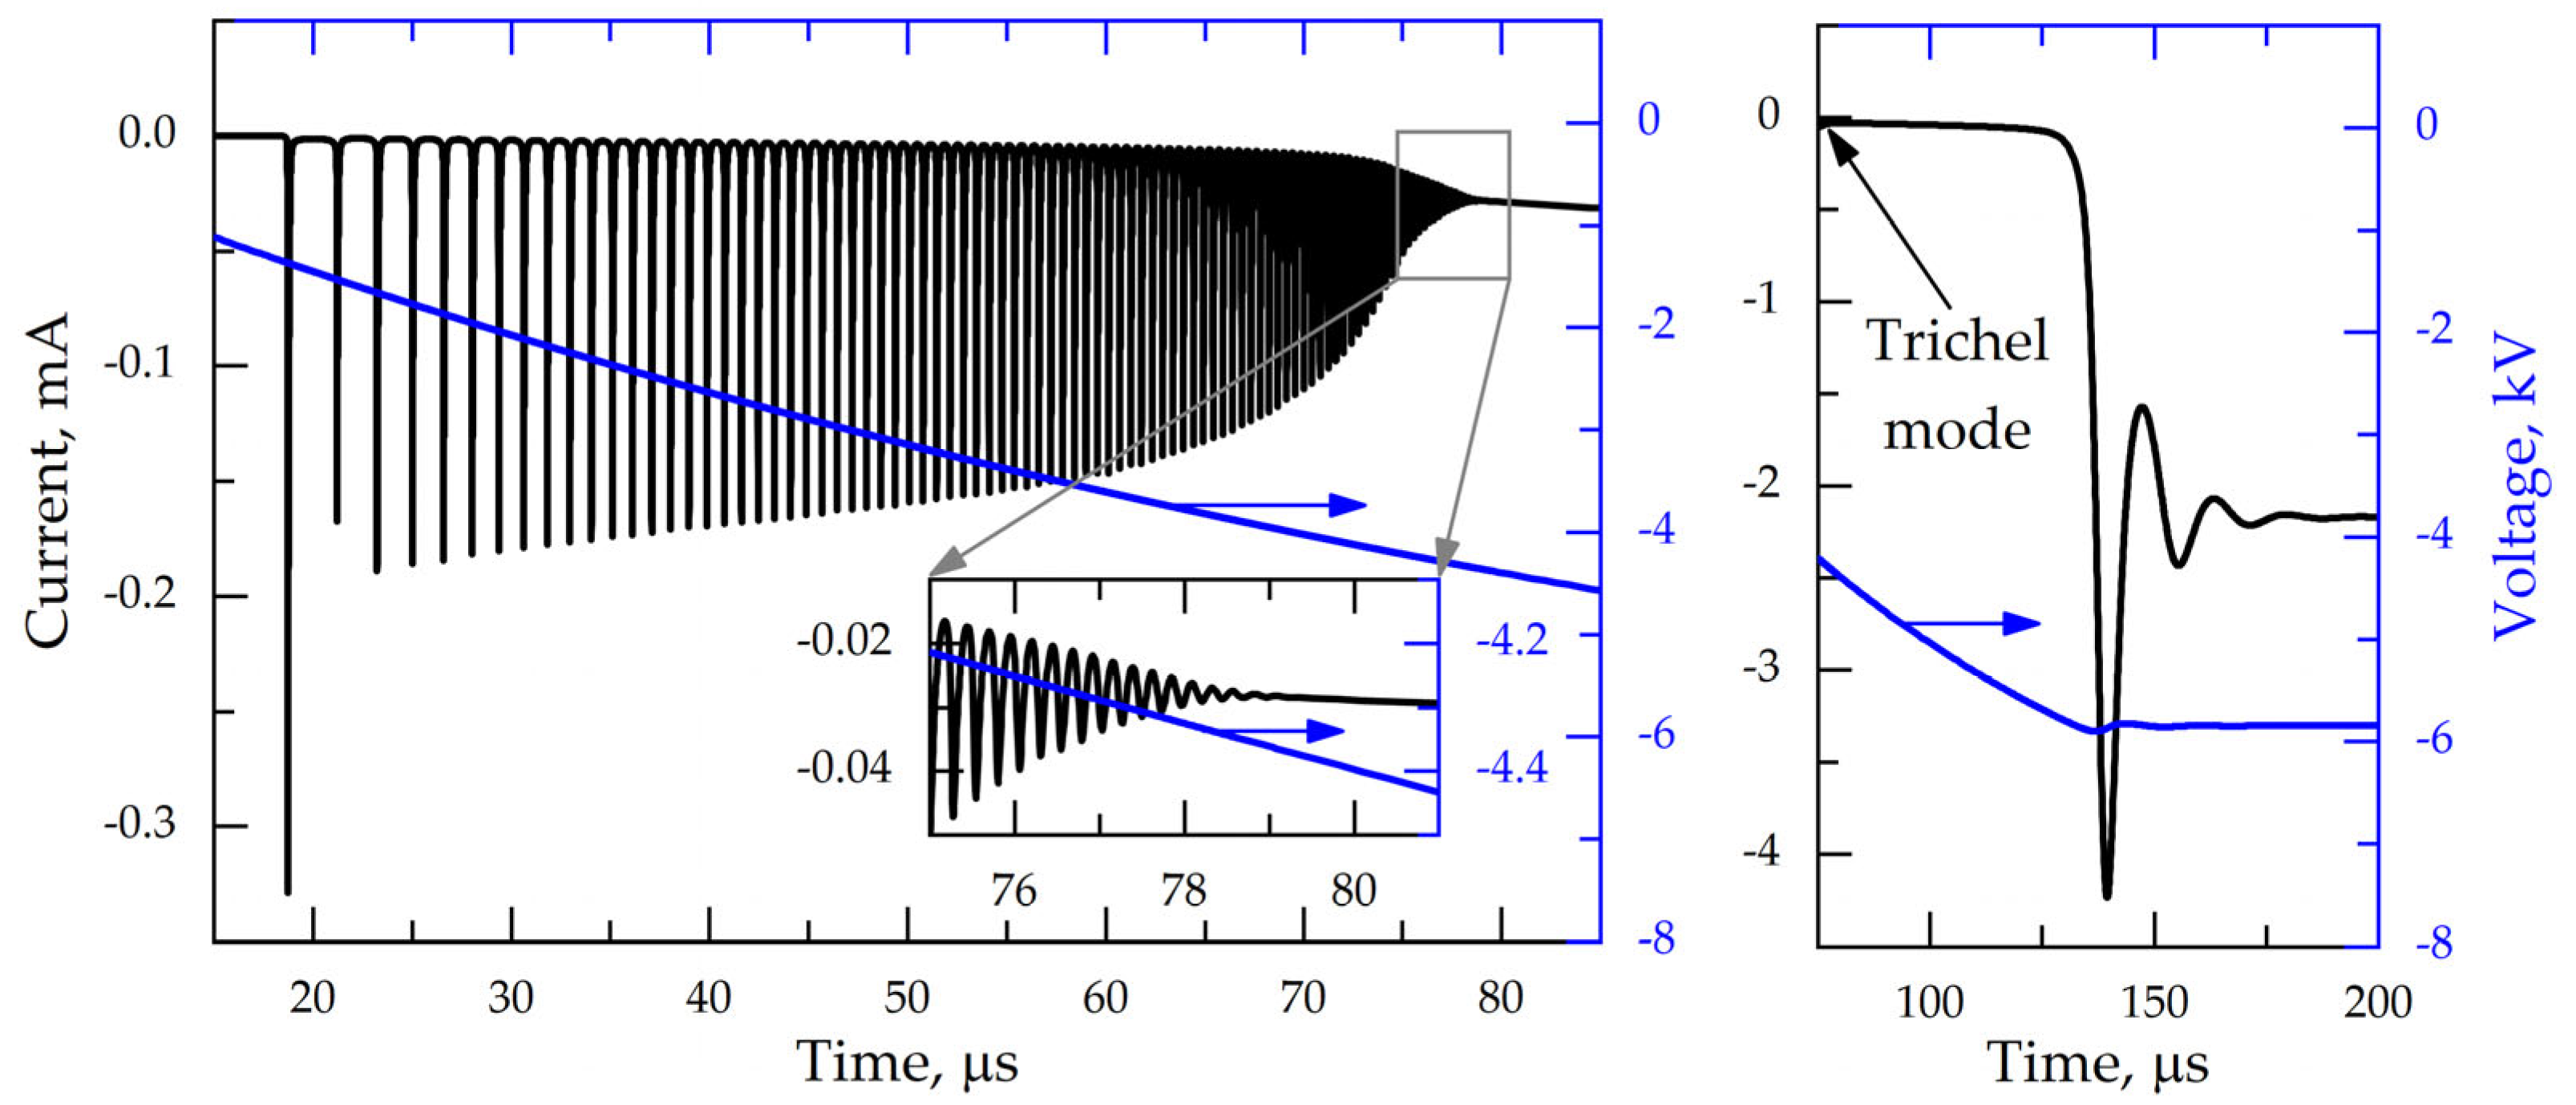
Figure 2 shows the calculated time profiles of the discharge current I and the diode voltage Ud. Due to the large ballast capacity and resistance, the diode voltage slowly increases (time constant RbCb = 100 μs), and the corona discharge sequentially passes through the four distinct stages. They are well identified on the discharge current time profile in the time range of 0 to 200 μs.

3.2. Dark Discharge Mode (DDM) of Breakdown Delay

The first stage, which can be called pre-breakdown (or “dark” phase, since the discharge glow is not experimentally observed due to the low brightness level), is characterized by an increase in the diode voltage from zero to about U1 = 1500 V. The duration of this stage is τ1, which is easy to estimate from the expression U1 = U0·τ1/RbCb, which can be called the breakdown delay time.
In our calculations (Figure 2), this stage takes place in the time range from 0 to the 19th microsecond. At this stage, the initiating and emitted electrons generate exponentially near the needle tip, starting with single electrons emitted on the surface of the needle cathode. By the end of this stage, the number density of charged particles even near the tip of the needle cathode does not exceed 108 cm−3, and the space charge does not distort the electric field yet. Certainly, the space charge begins to distort increasingly the electric field with time, triggering positive feedback and providing a rapid local increase in plasma density, which is manifested as a sharp surge of the discharge current. This pulse indicates the transition to the next stage of the corona discharge.

3.3. Frequency Mode of Trichel Pulses

The second stage begins with a rapid increase in the plasma density at the tip of the needle cathode and the formation of the first current pulse, followed by a pulse-frequency sequence of Trichel pulses [1,2,3,7,8,12,13,14,15,16,17]. In the interpulse period, a “background current” occurs with increasing magnitude with time.
The first pulse is of particular interest, and its parameters differ significantly from the parameters of all subsequent pulses. So, the first pulse has maximum amplitude. The physical processes responsible for the formation of the first current pulse are studied in detail in the works of the authors [17,30].
In the case of the strong limitation of the discharge current by the ballast resistance, the gap voltage gradually increases, and, as a result, the parameters of the Trichel pulse mode also drift, as shown in Figure 3. The amplitudes and durations of the current pulses are weakly dependent on the source voltage, smoothly changing with the diode voltage.
Figure 4 shows the current time profile of the 5th pulse and the corresponding spatial axial distributions of electron number density at different time instances, marked with dots on the current profile. It can be observed that the maximum number density near the tip varies by about four orders of magnitude: from 3 × 10⁹ in the interpulse interval to 3 × 1013 cm−3 at the peak current. It is also seen that the trailing edge of the current pulse is ensured by the rapid dissociation of free electrons at the plasma edge facing the anode.
The trailing edge of the Trichel pulse is related to the disappearance of free electrons and the accumulation of negative ions in the region with a relatively weak electric field. In the interpulse interval, the number density of negative ions gradually decreases due to the divergence of the transport flux, and thermal detachment of electrons occurs in the weak field region and propagates rapidly to the anode. After the decay/departure of negative ions, the electric field near the tip increases again up to ~10 kV/cm, the rate of free electrons and positive ions generation greatly increases, and the sequent Trichel pulse forms. Let us pay attention to the fact that if we excluded from the plasma–chemical model the reactions of electron detachment, the subsequent pulses would not appear! As an indirect confirmation of the above-stated point of view on the pulse-periodic mode of the negative corona being able to serve a strongly pronounced effect of the gas electronegativity, in electropositive mixtures (N2:Ar), the Trichel pulse sequence is not observed [2].
The amplitudes of the Trichel current pulses gradually decrease (and the pulse durations increase) with an increase in the applied voltage, and gradually fade to zero pulsations. The Trichel pulse repetition rate drifts from (0.7−1.0) × 106 pps at the beginning to 4.0 × 10⁶ pps by the end of the second evolution stage. Additional studies have shown that the discharge current at the end of the Trichel pulse mode, that is, by the time of transition to the third stage, does not depend on the source voltage and equals 27–29 µA (Figure 2). Hence, we can draw a cautious conclusion that the termination of the pulsed mode of corona discharge is determined not so much by the applied voltage as by the density of the accumulated plasma near the tip of the needle cathode.

3.4. Intermediate Discharge Mode (IDM) of Monotonous Current Growth

The third stage begins at the damping of the Trichel pulse mode and is characterized by a monotonous increase in the discharge current and ended with a rapid transition to a high-current mode, as one can see in Figure 2. This stage of the corona discharge is given very little attention in publications if it is mentioned at all. It is this mode that is responsible for the gradual formation of the classical glow discharge structure along the diode axis. By the end of the pulse mode, a plasma density with a monotonic decrease from the tip to the anode is formed in the gap, and the electric field is close to a homogeneous distribution.
The transition from the third stage to the fourth is similar to the “second breakdown” of the gas discharge gap after the gap voltage exceeds the threshold value (in our case, this value is approximately 6.0 kV). Namely, the slow growth of the discharge current from the microampere level abruptly changes on a steep increase by several orders of magnitude, and the transition occurs as a relaxation-damped oscillation (see Figure 2). This analogy is fully confirmed by calculations of the charged particle’s transport and the electric field evolution: when the field strength reaches the threshold value, an avalanche-like increase in the free electrons density occurs, the space charge of which quickly redistributes the electric field from an approximately uniform distribution in the gap to its enhancement near the cathode, which is specific to a glow discharge.

3.5. Stationary Glow Discharge Mode (GDM)

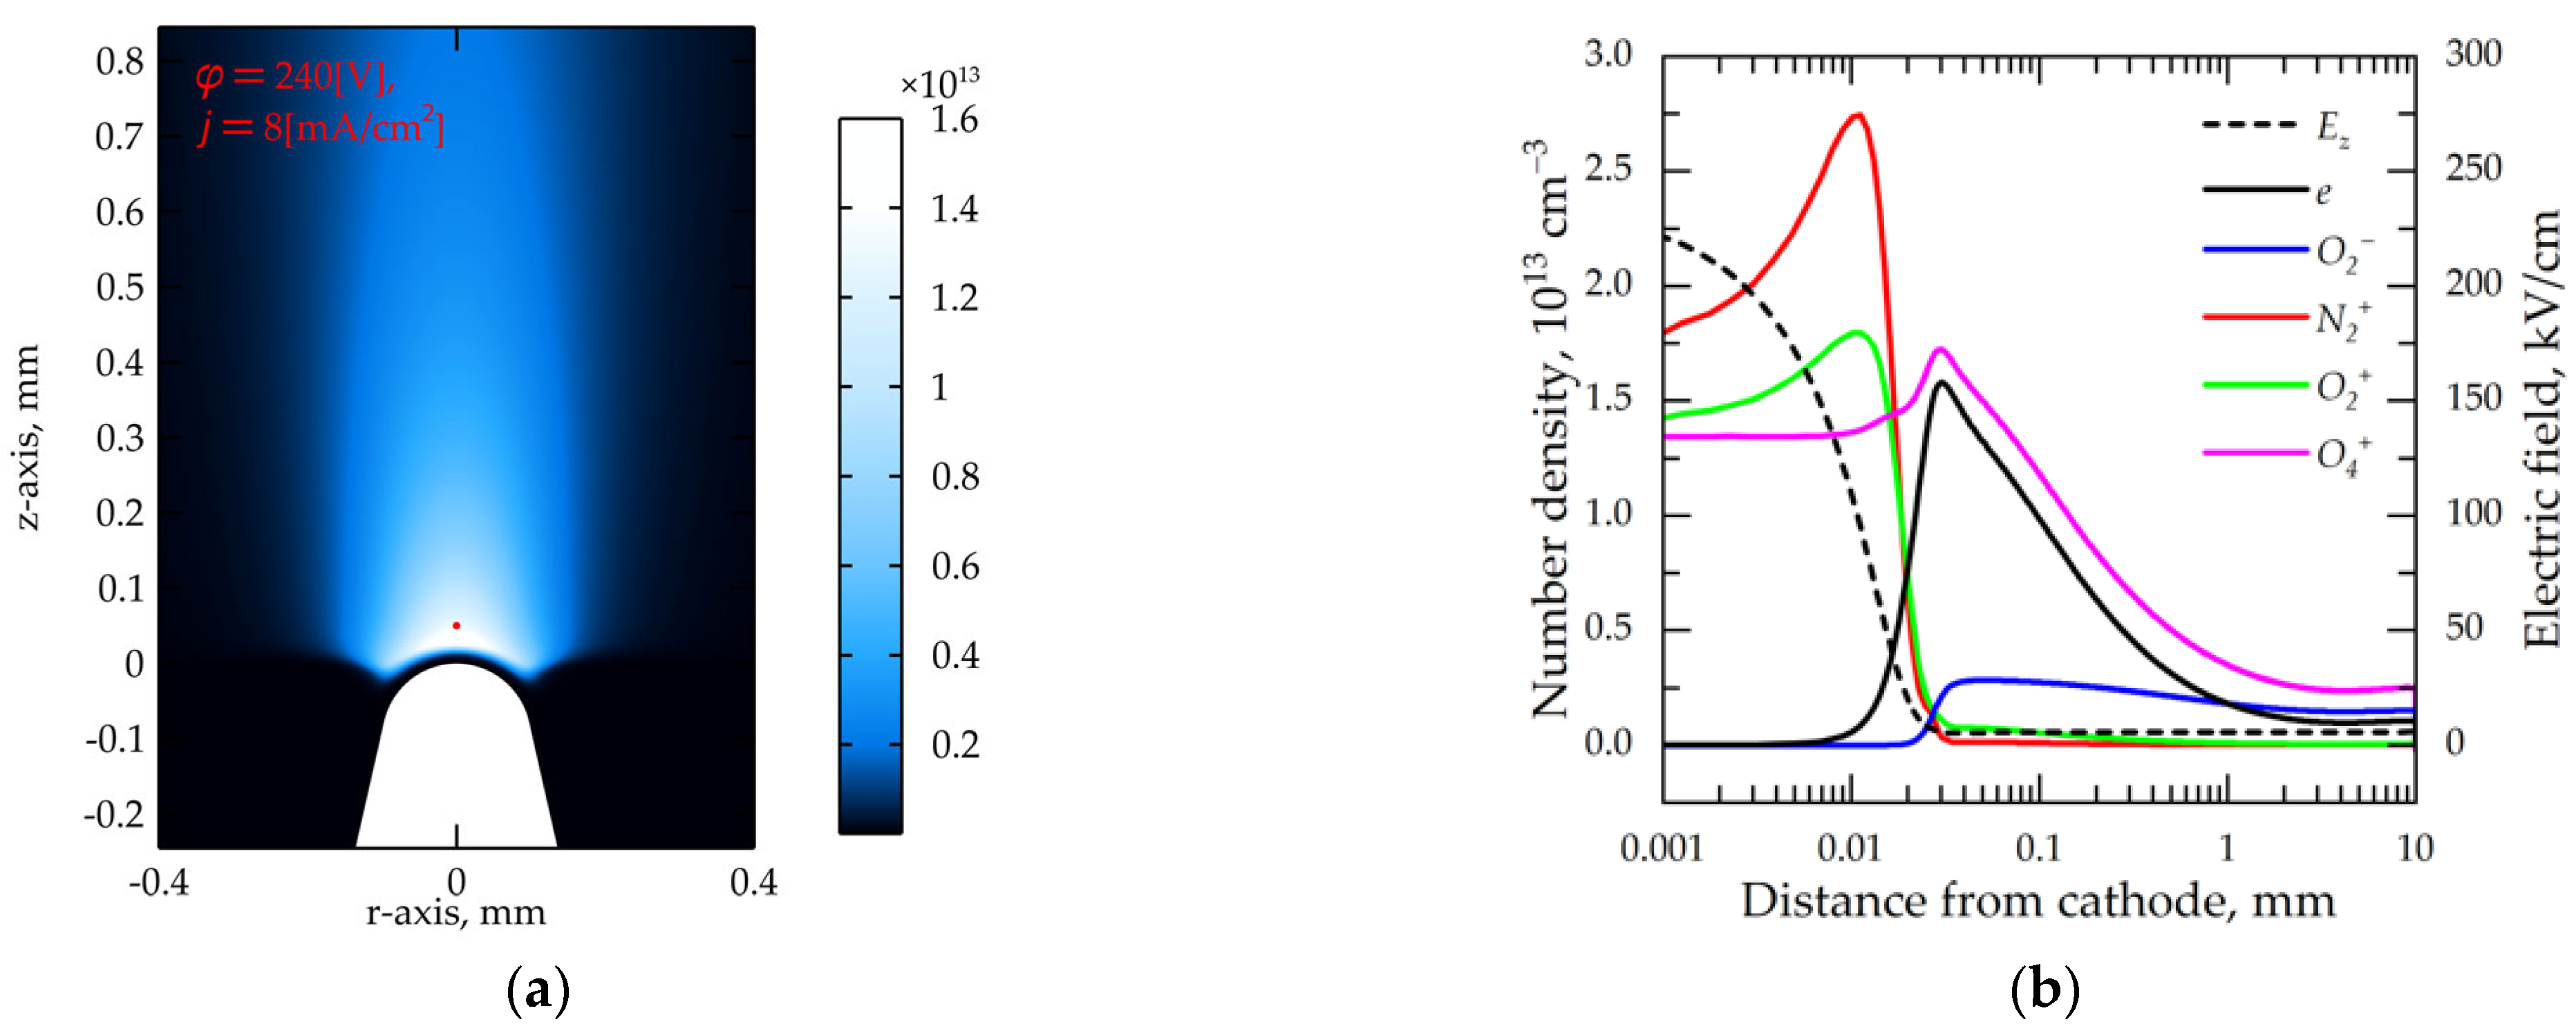
In the fourth stage, a steady-state stationary structure of the classical glow discharge is established, despite the presence of axial geometry of the gap. The plasma density distribution remains highly non-uniform, which is typical for the corona, as shown in Figure 5. At this stage, the discharge current is equal to 2.2 mA, and the current density value is 8.0 A/cm2 at z = 50 μm on the discharge axis. The plasma potential with respect to the cathode is +240 V, which is typical for a glow discharge in the air [2].
Note that the increase in the voltage of source U0 affects only the discharge current and almost does not change the discharge burning voltage remaining near the value of 5.9 kV. The electric field distribution is almost uniform along the discharge axis and also does not change (~5.6 kV/cm), although the current density drops significantly due to the decrease of plasma density along the discharge axis towards the anode. This non–obvious fact (the constancy of the burning voltage at a large variation of the discharge current) is due to the fact that the current density at the steady-state stage is determined by processes in the near-cathode region, and the column (in glow discharge, it is called the positive column) plays a low-key role of a conductor, which is sufficient to maintain the plasma conductivity at the low voltage value.
For that reason, it is interesting to compare the obtained parameters of the cathode layer with the known parameters of a normal glow discharge in the atmospheric-pressure air [2]: the voltage drop is about 270 V (depending on the cathode material), the layer width is about 6 microns, the current density is about 200 A/cm2. At the steady-state stage, the current density on the axis near the tip needle (8–20 A/cm2) is ten times lower than the ”normal” one, the width of the cathode layer (2–15 microns) is several times greater than the “normal” one, and the cathode voltage drop (240–280 V) is practically equal to the “normal” values. These divergences from the “normal” parameters show a special (irregular) mode of the cathode layer formation in a stationary corona discharge, clearly due to its highly inhomogeneous geometry.

3.6. Ionic Composition and Mechanism of Charge Transport in Plasma

We can conclude that the theoretical model of the corona discharge formulated above allows us to describe correctly the dynamics of the ionization processes and to obtain a correct estimation of the observed discharge parameters at all stages of its burning. Thus, the theoretical results confirm the experimental studies that the first Trichel pulse has the maximum amplitude of the current, and the amplitude of the second pulse is several times lower than the one of the first pulse.
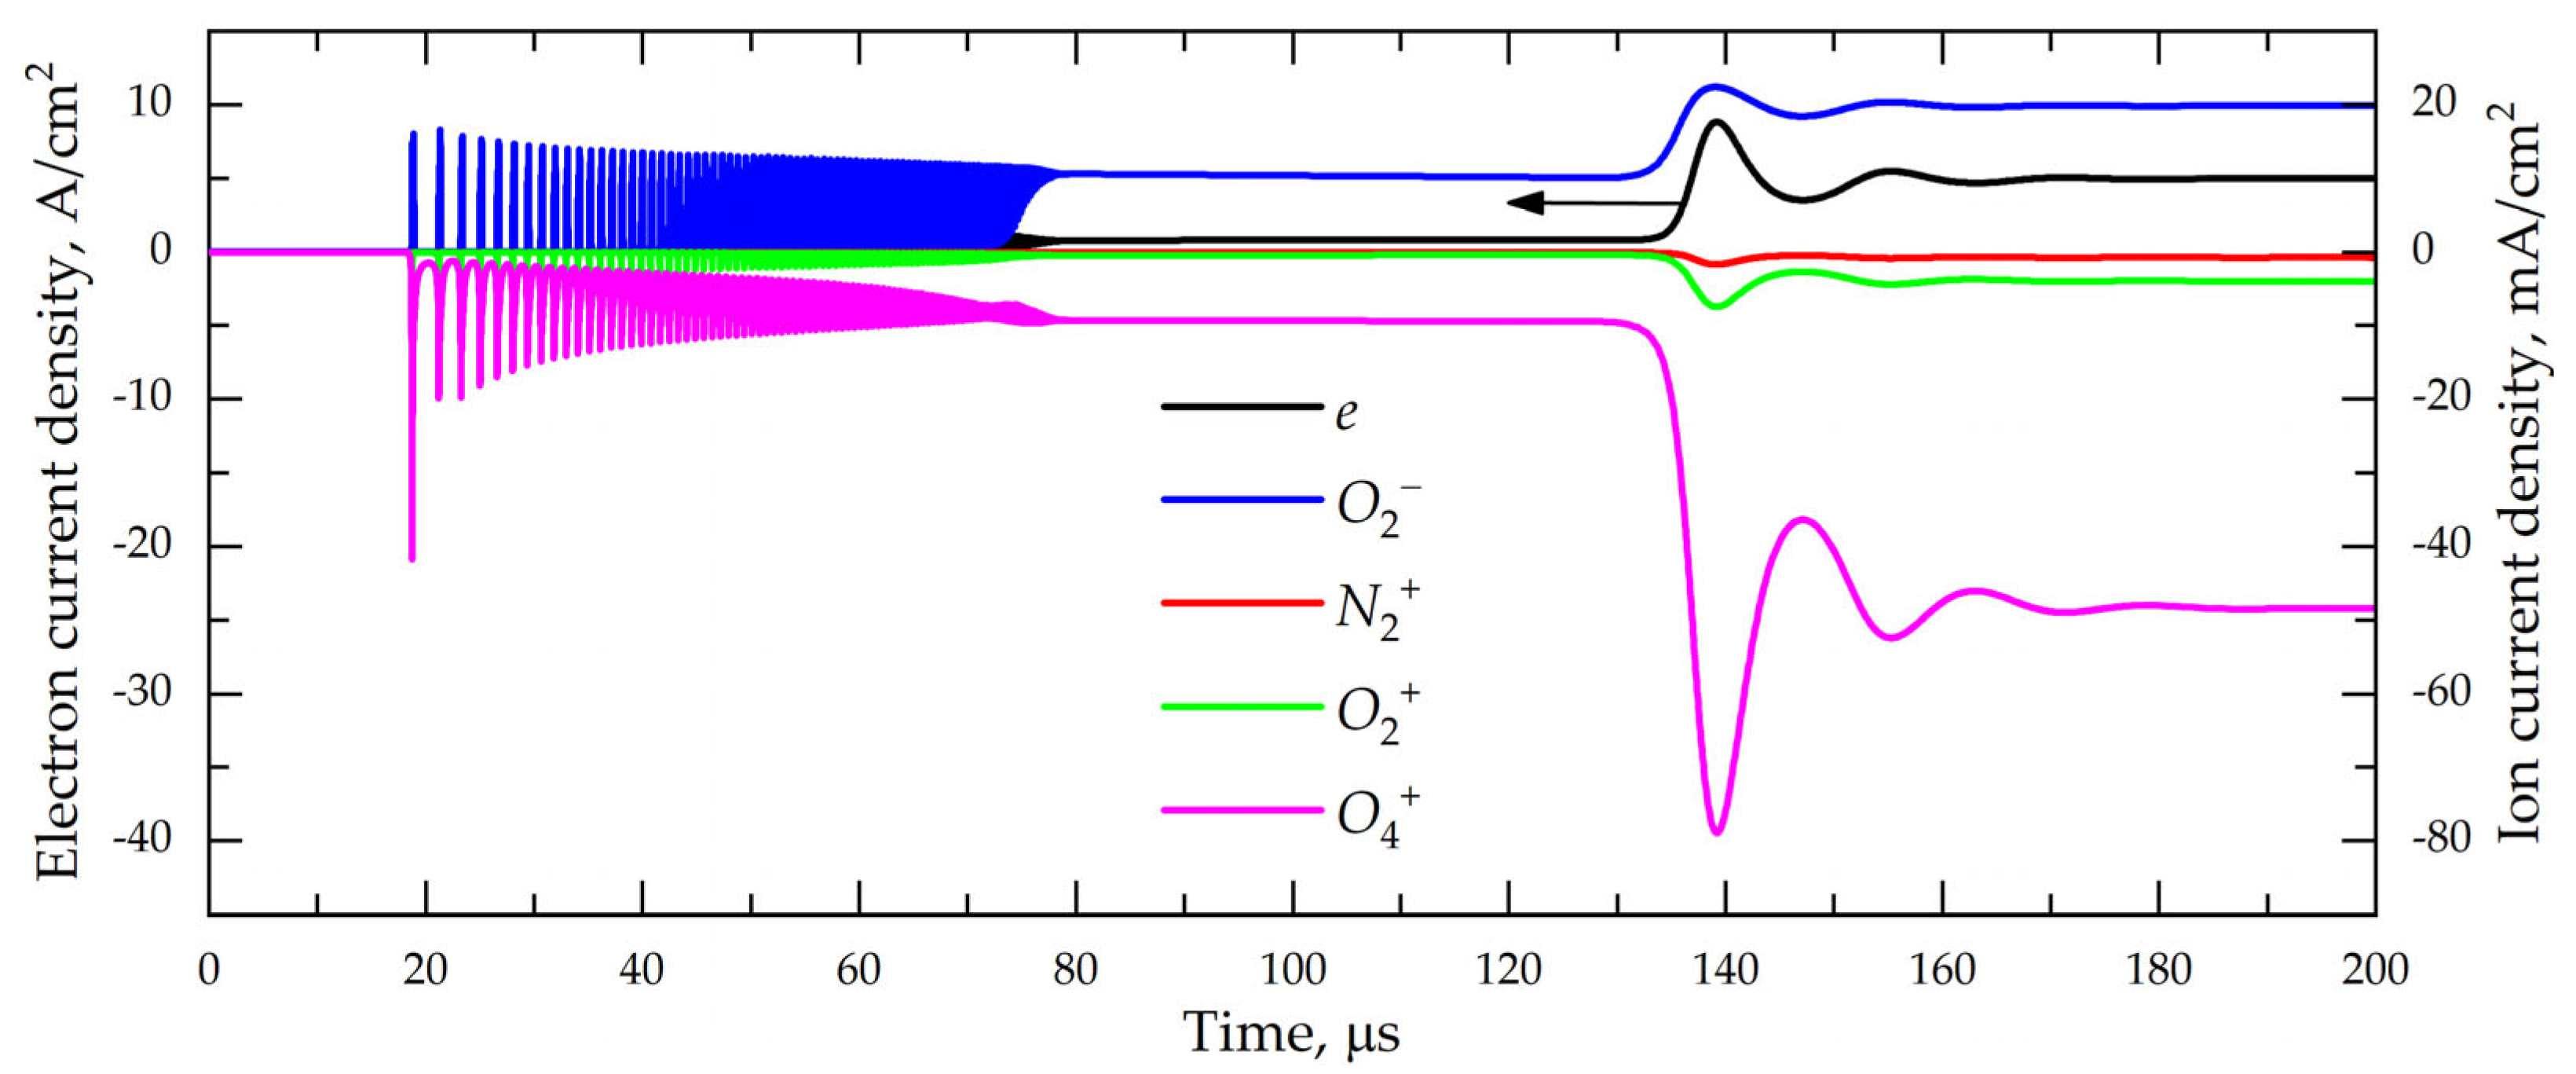
Based on the plasma chemical scheme (Table 1), we can perform the detailed calculation of the “partial composition of the discharge current” (Figure 6), which shows the local dynamics of currents in the plasma near the cathode tip (at a distance of 100 microns from the tip needle). Here, the additional details of the discharge development are visible, in particular, changes in the ion composition of the plasma and the mechanism of charge transport at different stages of the discharge.
Thus, the amplitudes of the ion current are about 200 times smaller than the amplitude of the free electron current. Taking into account the mass ratio M i / m e 240 , this means that the density of electrons and ions at this stage is commensurate, and the electron–ion plasma can is presented. This ratio of electron and ion densities decreases by about 2 times in the third (quasi-stationary) stage of current transport.
The ratio of currents and densities changes even more noticeably at the stationary (fourth) stage of the discharge. The total ion current density at this stage is about 90 mA/cm2, and the current density of free electrons is about 5 A/cm2, which is only ~50 times higher. This means that the density of free electrons in the plasma is several times lower than the concentration of ions, but the plasma conductivity is still provided by electrons. This situation is typical for the air plasma [41,42], when its quasi-neutrality is maintained by a balance of positive and negative ions, and current transport is provided by electrons.

4. Experimental Setup Used to Study Corona Discharge (CD)

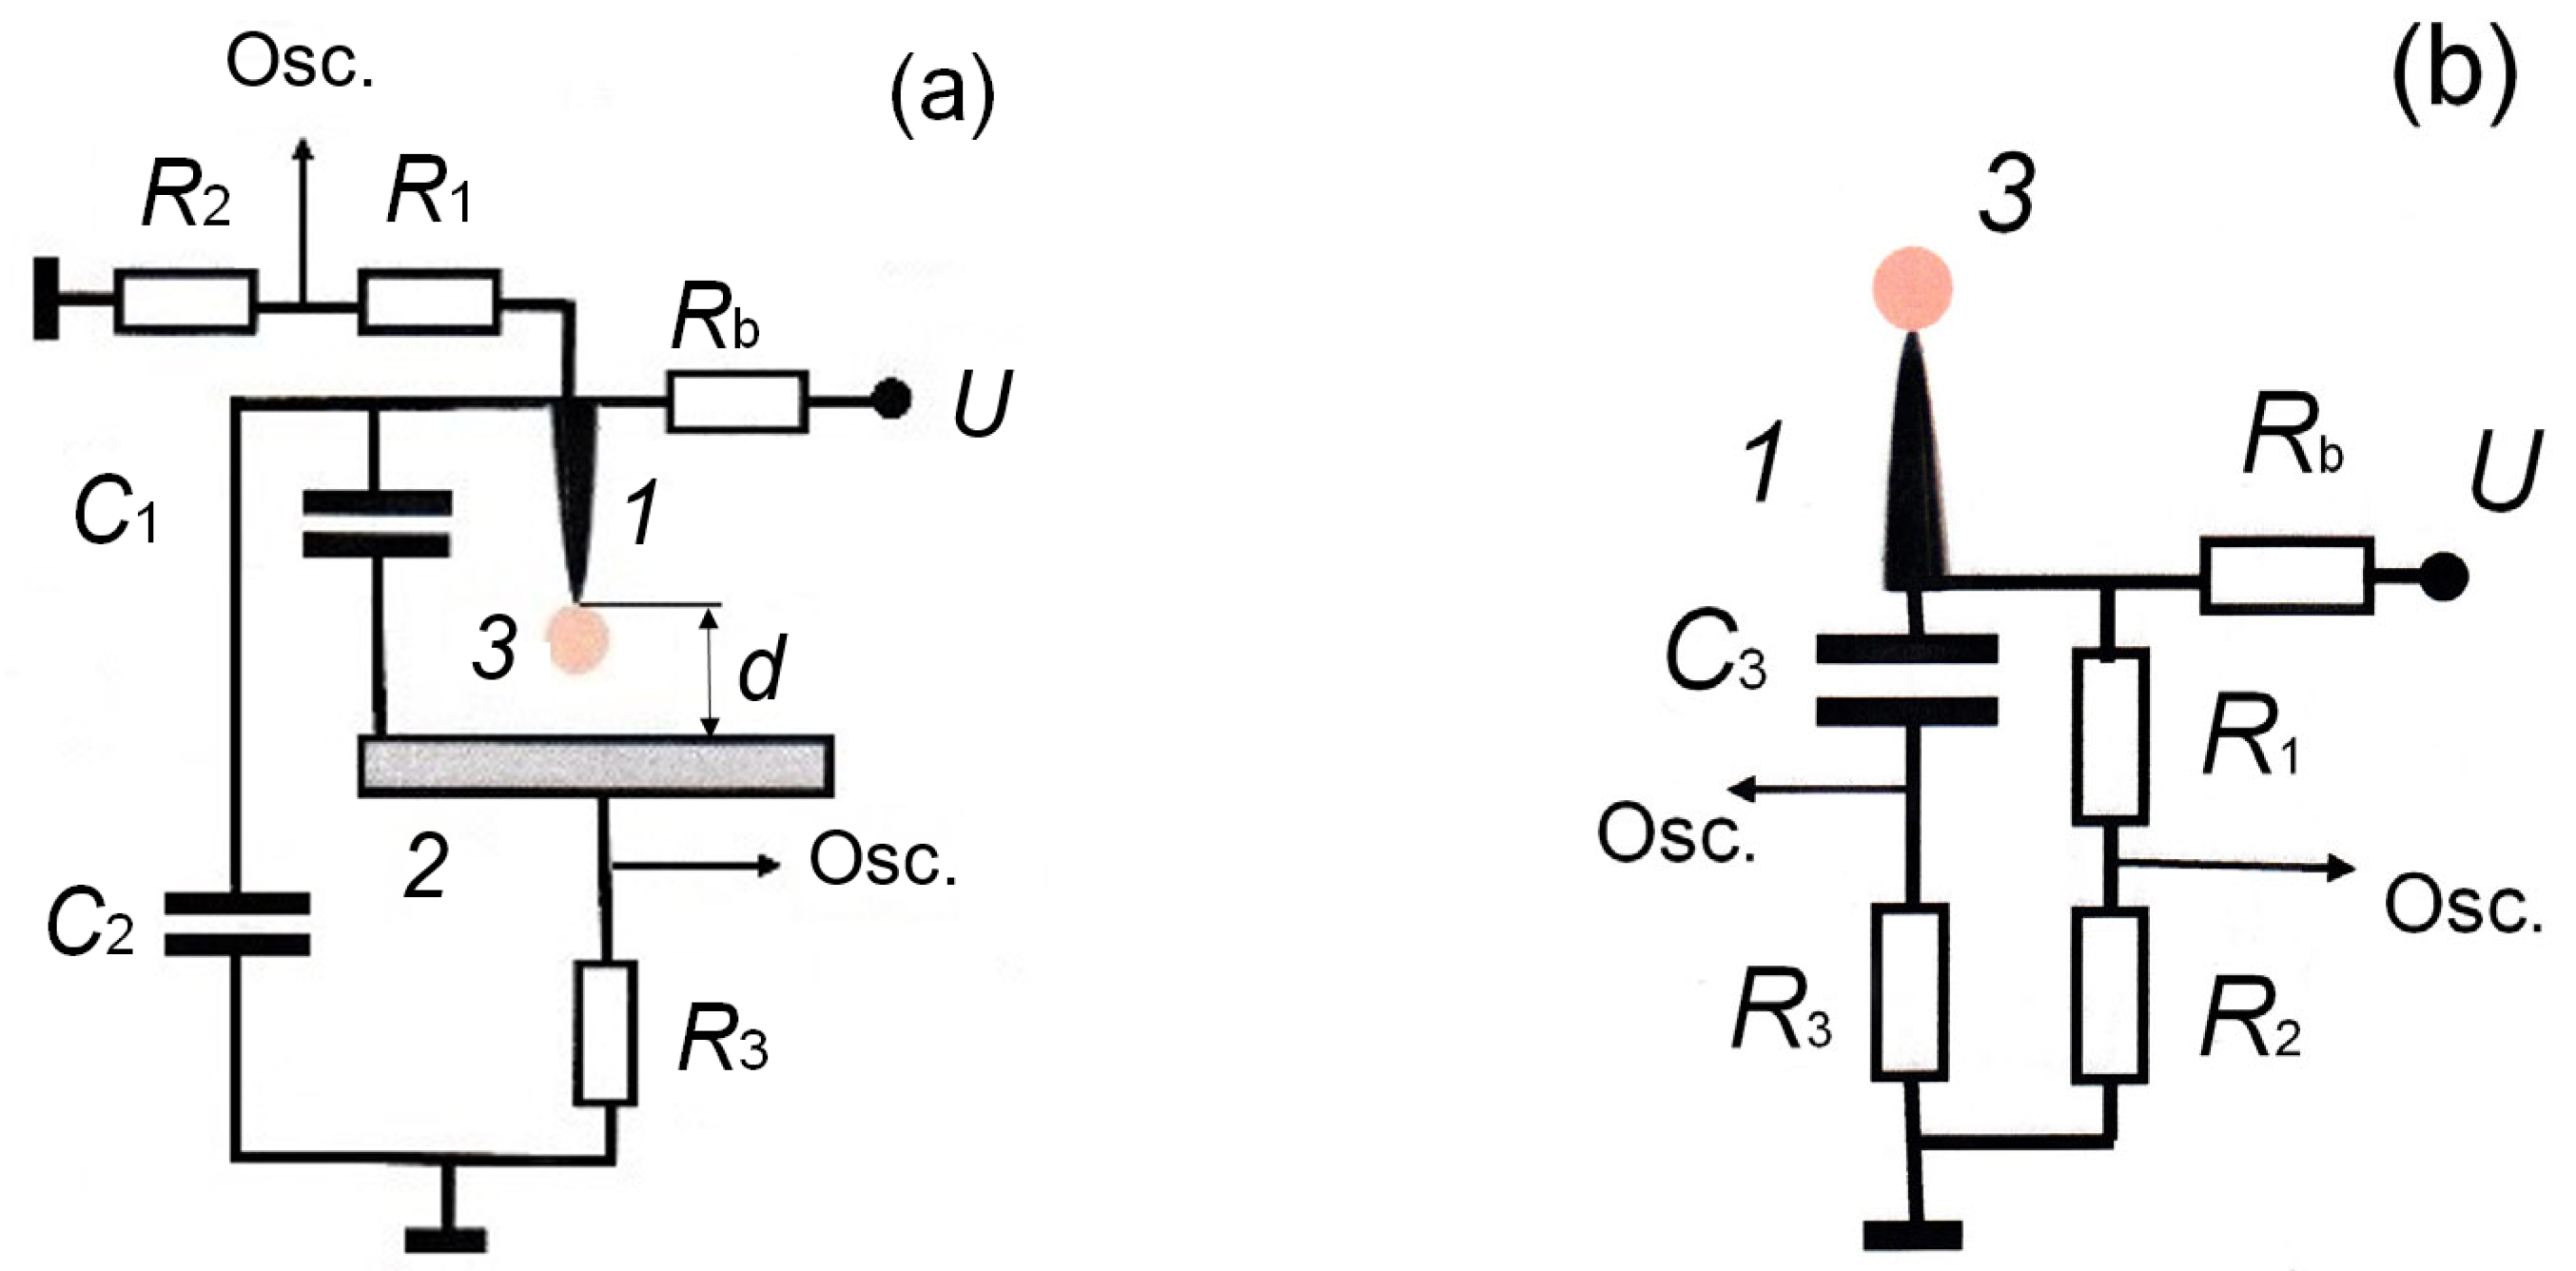
When conducting corona discharge research, the most commonly used electrode configuration is needle-to-plane. A voltage is applied to the gap at various rates of voltage rise; see [12,14,20,42]. In our experiments, we employed two setups, as depicted in Figure 7 and described in references [7,15,17,30].
In the common setup shown in Figure 7a (Setup 1), which utilizes the needle-to-plane electrode configuration, a constructive capacitance C1 was added between needle 1 and plane 2. The current through C1 was not registered by the shunt. Moreover, an additional capacitor C2 was included. For an interelectrode gap of 20 mm, the value of C1 was 3.7 pF. The shunt registered the current through the capacitor C2, which was formed on one side by the needle and its connection to the ballast resistance Rb, and on the other side, by the plane electrode 2 and the metallic surface of the experimental setup, which was connected to the plane electrode via the shunt R3 and also connected to the grounded output of the power source. The capacitance C2 had a value of 5.8 pF. The shunt resistance was 1 kΩ. The voltage applied to the needle-to-plane gap was supplied from the power source through the ballast resistance Rb, which typically had a value of 3 MΩ in most experiments. The voltage pulse rise time to the desired level varied. In the experiments on CD initiation, it was intentionally set to a low value (tens of seconds or more). This allowed for simulating CD initiation under steady-state voltage conditions in the gap and implementing the conditions of the dark discharge mode (DDM). Experiments were also conducted with rapid voltage rise in the gap (tens to hundreds of volts per nanosecond). At the same time, the recording of the volt–ampere characteristics of the CD was accelerated, as well as its transition to other forms. The gap length could vary from 1 to 100 mm. Most of the data were obtained with interelectrode gaps of 5, 10, and 20 mm.
In the second setup depicted in Figure 7b (Setup 2), a solitary needle was used, which was associated with remote objects through “stay” capacitance (not shown in Figure 7b). The needle was mounted on a K15-10 ceramic capacitor with a capacity of 4.7 nF. This allowed for the registration of the pulsed component of the CD current. In this setup, the magnitude of the electric field strength, E, near the needle tip did not change significantly. However, with increasing distance from the needle tip, the electric field strength fell faster, and the current of the stationary CD decreased.
The needle electrode was fabricated from a piece of a “bead” needle 0.32 mm in diameter with a radius of curvature of about 20 μm, which varied insignificantly during the experiments. This stability was achieved using a large ballast resistance and operation in modes without spark breakdown, as well as without switching to the glow discharge mode (GDM). This made it possible to reduce the pulse and average currents of discharges and, thereby, strongly reduced the erosion of the electrode. The stability of the geometrical parameters of the needle can be rapidly controlled in terms of the voltage, ensuring the initiation of the first current pulse of the CD. It is known that the CD ignition voltage increases with the needle tip radius of curvature under the same external conditions (pressure, humidity, and temperature of the air), which is associated with a decrease in the reduced electric field strength. In preliminary experiments, it was found that at r ≥ 100 μm, several filaments can form near the needle tip, attached to different points of the needle tip, which merge into one when the voltage increases, and a constriction forms at the needle tip. The presence of several attachment points of a CD to a needle negative polarity is described in detail in [16,18].
When the power supply voltage increased >8 kV, the air in the gap was purged by a fan. This was done to reduce the effect on the CD of particles that are produced in the region of a high electric field near the needle tip and are carried into the gap due to the electric wind [43].
The voltage across the discharge gap was measured using an ACA-6039 high-voltage voltage divider with a bandwidth of 50 MHz, and the discharge current was measured by a shunt based on TVO brand resistors. The signals from the shunt and voltage divider were fed to an MDO 3104 oscilloscope (1 GHz, sampling frequency 5 GS/s). At a sampling rate of a long-duration oscilloscope (hundreds of microseconds or more), the bandwidth of the oscilloscope was reduced to 20 MHz. This made it possible to reduce the effect of electromagnetic interference on the signals. Note that when using shunt R3 and the first circuit, both pulsed and stationary components of the CD current were recorded. The second scheme made it possible to register only the impulse component of the current. The discharge glow was photographed using a four-channel HSFC PRO ICCD camera and a SONY A100 camera with spectral sensitivities of a GaAsP photocathode in the 300–900 nm range. The minimal exposure duration of the ICCD camera was 3 ns. Since the energy of one Trichel pulse was very small (~1 µJ and less), it was not possible to obtain data on the dynamics of plasma radiation during the formation of a single pulse. However, when using the ICCD camera, the dimensions of the luminous plasma region near the needle tip were recorded for some Trichel pulses. A similar technique was used in [14], where the integral image of a corona discharge was photographed using an ICCD camera for 15 or 50 pulses. To obtain color photographs of corona discharge radiation at low voltages of the voltage source, a SONY A100 camera was fixed on a tripod and the shutter speed was tens of seconds.
The emission spectra of a CD were recorded by an HR2000+ES spectrometer (OceanOptics Inc., Dunedin, FL, USA; Δλ = 200–1150 nm and δλinstr ≈ 0.9 nm) with a known spectral sensitivity curve, radiation to which was fed through a P600-1-SR optic fiber. We checked the sensitivity calibration of the spectrometer using sources of spontaneous emission with a SL5 Deuterium/Halogen Combination Lamp, (StellarNet Inc., Tampa, FL, USA); a miniature Deuterium and a halogen light source that covers the 200–1700 nm range.
Experiments carried out by these setups made it possible to obtain new data of the CD and greatly facilitated their interpretation, as well as the comparison of the obtained dependences with the simulation results. When analyzing and comparing the experimental results of various scientific groups, the description of important details is very often missing. Therefore, prompt verification of the received and known data facilitated the preparation and writing of this review.

5. Experimental Data on the Initiation, Functioning, and Transition of a Corona Discharge to Other Forms

5.1. Corona Discharge Precursors (Dark Discharge Mode—DDM)

One of the features of glow discharge is that it is preceded by another form of self-sustained discharge, so-called Townsend dark discharge (TDD) [2]. TDD has previously been studied in detail under conditions of a uniform electric field. It is characterized by very low discharge current densities, usually pA/cm2 or less [44]; see also Section 3.2. It should be noted that, in the study of CD, it is usually not the current density that is used, but the discharge current. This is due to the difficulty of determining the discharge area near an electrode with a small radius of curvature. It should also be noted that there is a large difference in the TDD values before the initiation of CD in different studies. For example, in [14], the value of TDD is given, which reached 1 μA. Under the conditions of our experiments on Setup 1 (described in Section 4), under comparable conditions (tip-to-plane gaps from 3 to 100 mm, the needle tip has a radius of curvature of 20 and 100 μm), the TDD current was less than 2 nA. This difference can be explained by the difficulties of measuring small currents in TDD, which can lead to errors in its determination.
For the initiation of a TDD in a uniform electric field, relatively high voltages (reduced electric field strengths) are needed, which are necessary to initiate ionization processes between the electrodes. In this case, the breakdown voltage with its slow increase in the gap (voltage pulse front of 1 μs or more) in a wide pressure range corresponds to the right branch of the Paschen curve [45]. Due to the low concentration of charged particles in the gap during TDD, the electric field between the electrodes is not distorted. The glow of the discharge in the gap under these conditions is very weak and is not visually noticeable. Therefore, this discharge is called dark mode.
It should be noted that at voltages that are lower than those required for initiation of TDD, there is another form of discharge, which is non-self-sustained [2]. The non-self-sustained discharge is initiated by high-energy particles that ionize the Earth’s atmosphere and gamma radiation created by high-energy particles, as well as background radiation near the Earth’s surface [46].
A feature of CD ignition is its initiation under the conditions of using one or both electrodes, which have a small radius of curvature. The electric field near the needle electrode increases due to the geometric factor and this significantly affects the formation of the transition from the previous discharge stage (DDM) to the next modes of CD. In particular, the ignition of a CD occurs at voltages that are lower than the voltages following from the Paschen curve [45], which was obtained with a uniform electric field and a slow voltage increase across the gap.
Let us consider in more detail the transition from DDM to developed modes of CD. The simulation results are presented in Section 3 for an ideally shaped cathode with a small radius of curvature. In real conditions, macro and micro points on the electrodes, which have a small radius of curvature, are additionally affected, which increases the electric field strength. This accelerates the ionization of the gas in this area and the production of positive ions at the needle’s negative polarity. As a result of an increase in the ion concentration, the electric field increases, and the ionization rate increases. This transitional stage of the discharge has been relatively poorly studied. On the other hand, there are many works in which one can find experimental data on measurements of discharge characteristics and various optical parameters of radiation in some steady modes; see, for example, [12,23,29,30,42,43,44,45,47,48,49].
Due to the small size of a single corona and the difficulty in experimental measurements, the known data on several key points differ significantly. As we have already noted, in our experiments, the DDM current at a voltage lower by 1% than the Trichel pulse mode was less than 2 nA at interelectrode gaps from 5 to 100 mm. For example, at gaps of 5 and 10 mm and curvature radii of 20 and 100 μm, the voltage across the gap was only 20 V lower than the voltage at which Trichel pulses appear. DDM currents up to 1 µA have been reported in non-Trichel mode. The results of our calculations using the program, which is described in detail in Section 2 and in [15,17,50], also showed low DDM currents before the appearance of the first Trichel pulses. Thus, at a voltage rise rate across the gap of 1.5 V/ns with an increase in voltage by 56 V, the discharge current before the formation of the first Trichel pulse increased by 4 orders of magnitude. The calculated discharge current at a voltage of 1071 V was only 11.9 nA.
In an inhomogeneous electric field, the accumulation of positive ions in small regions near electrodes with macro- and micro-inhomogeneities accelerates the appearance of additional electrons. These electrons initiate the next mode of discharge at a smaller electric field across the gap than under the conditions of the formation of a glow discharge with flat electrodes. Moreover, with a further transition from DDM to pulsed mode regardless of the polarity of the needle electrode, a short current pulse is formed. In the air, with a negative polarity of the needle, its properties correspond to the Trichel impulses [30]. With positive polarity, as was established in [7], the first current pulse is also similar in shape and amplitude to the Trichel pulse. However, the mechanism of its generation is different.
Note that current pulses sometimes observed in corona discharges in electropositive gases (nitrogen, argon, and others) [51,52] cannot be considered Trichel pulses. These pulses have a longer duration and are formed due to the voltage drop across the gap at high limiting resistances.

5.2. Ignition of Corona Discharge in Air

Our studies [7,53] and analysis of known experimental data (see, for example, [12,13,23]) have shown that a CD begins with the generation of short current pulses. Moreover, their generation does not depend on the polarity of the needle. The generation of the first pulse with a current of tens–hundreds of microamperes or more indicates the transition from DDM to CD. As shown in [30] and in Section 3.3, when a CD is initiated, the discharge gap near the needle tip rapidly ionizes and a dense plasma is generated. In the rest of it, due to the relatively low electric field strengths, the conductivity during the current pulse is provided by the dynamic displacement current (DDC) [54], which plays an important role in the streamer breakdown in a nonuniform electric field. Here and in [54], we call the dynamic displacement current (DDC) what is calculated by the formula IDDC = Ud dCdispl/dt, where Ud is the voltage across the gap, Cdispl is the capacitance of the capacitor formed by the dense plasma near the needle tip and the plane electrode, t is the time. DDC is determined by changing the value of the capacitor Cdispl. The appearance of DDC after reaching the threshold plasma concentration ensures the conduction of the gap in its non-ionized part at short pulses. With a rapid change in dCdispl/dt, the DDC contributes to the formation of the rising and falling of short current pulses during the initiation of a CD. The current decrease in the first pulse of CD is associated with a decrease in the electric field strength as the streamer front moves away from the needle tip, respectively, and with a decrease in the ionization rate. The plasma concentration at the ionization wavefront, which is formed by parallel avalanches at relatively low source voltages [20,30] or streamers with increasing voltage [17,53], decreases. Accordingly, the value of Cdispl ceases to grow and the DDC decreases, and the current in the first pulse also decreases. Therefore, current pulses initiate a CD not only in electronegative gases but also in electropositive ones [51]. However, in electronegative gases, the decrease in the current in CD pulses, both in the first and subsequent ones, is affected by the attachment of electrons to the electronegative gas, in air, mainly to oxygen; see Section 3. The charge of negative ions shields the electric field at the needle tip, and the number density of positive ions decreases, but the CD current does not stop. The conductivity of the main part of the gap with a low reduced electric field strength during a CD in the pauses between pulses is ensured by the drift of negative and positive ions.

5.3. The First Current Pulse of Corona Discharge

The amplitude of the first current pulse in the air at atmospheric pressure depends on many factors (the radius of curvature of the electrode and its material, the rate of growth of the voltage across the gap, the composition of the gas, its relative humidity, etc.), but its appearance, as mentioned above, does not influence the polarity of the electrode with a small radius of curvature. Figure 8 shows the waveforms of first current pulses at negative and positive voltage polarity for a needle made of stainless steel with a radius of curvature of 20 microns.
Since the issue of initiating the first pulse in a CD is very important, but it is very difficult to model it with a needle-positive polarity, in this section, we present experimental data for both needle polarities. The first pulses in Figure 8 were obtained using a solitary needle with a radius of curvature of 20 µm (Setup 2 in Figure 7b). With a needle negative polarity, the rate of current rise at the level of (0.1–0.9) of maximum was ≈ 1.5 ns at a voltage across the gap of 4.3 kV. With a positive polarity of the needle, the voltage for its initiation required ~1.5 times more, but the duration of the current pulse front at the level of (0.1–0.9) of maximum practically did not change (≈2 ns).
When using the needle–plane gap with the same needle and an interelectrode gap of 20 mm (Setup 1 in Figure 7a), the shape of the current pulses and their amplitude did not change significantly. However, the voltage of their appearance decreased. It was not possible to photograph the plasma glow near the needle tip in one first pulse (even using an ICCD camera) because of its very low intensity. Note that the voltage across the gap does not change significantly under the conditions of generation of the first pulses. This is due to the presence of a constructive capacitance between the electrodes and low energy in one current pulse. An estimate of the charge in the first Trichel pulse, which has the largest amplitude with a slow increase in the voltage at the needle and a given voltage, showed that no more than 0.04 nC passes per pulse. This gives a voltage drop on C1 per pulse ≈ 4 V. Such a voltage variation is not noticeable in short segments of the oscillograms.
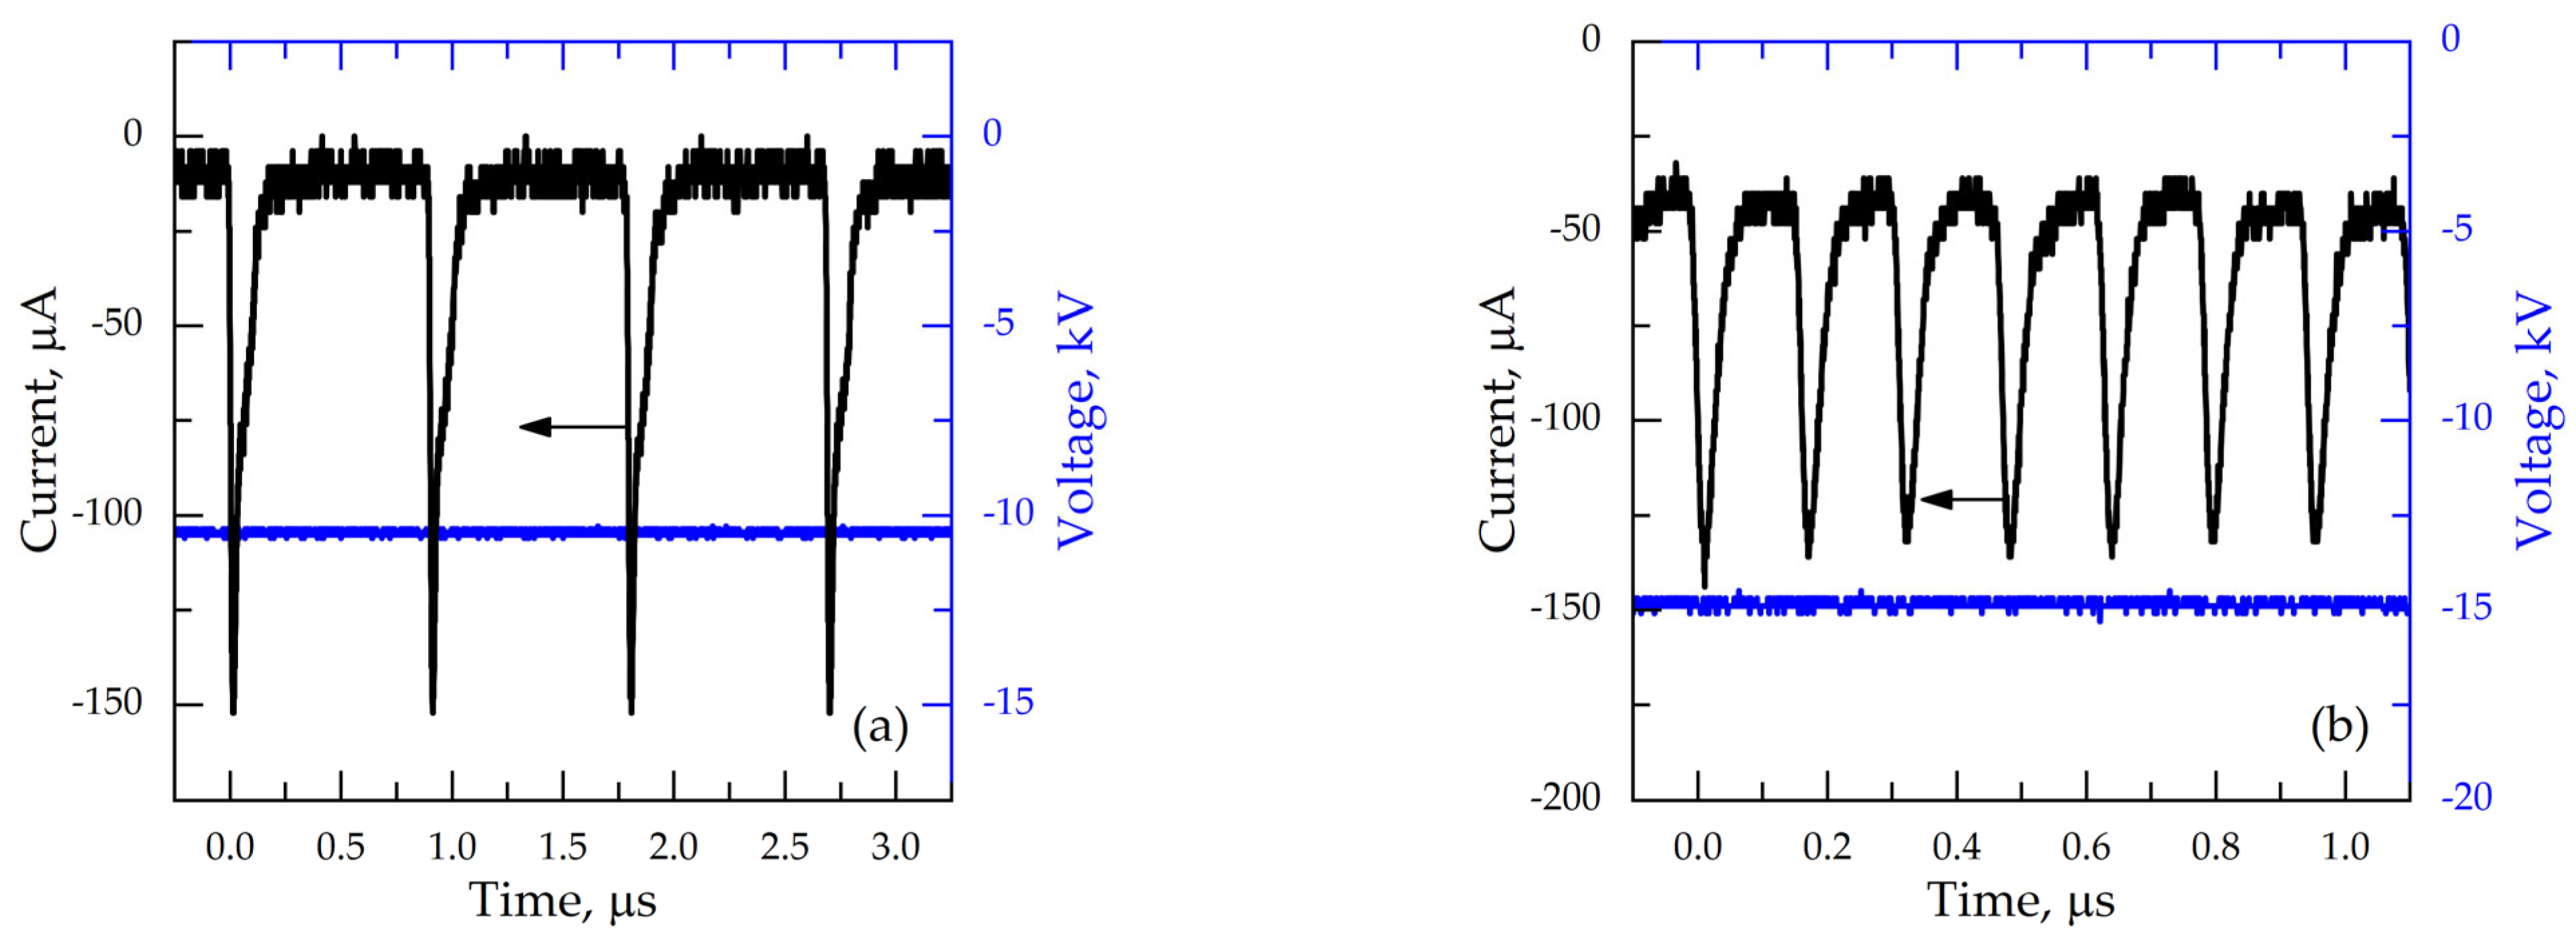
At a constant voltage, which is the threshold for the appearance of the first current pulses, the delays between them can be very large. So, with a sampling rate of a long-duration oscilloscope, intervals between current pulses of approximately the same amplitude up to several seconds or more were recorded. With such delays, the properties of the plasma near the needle tip before the generation of each of the pulses correspond to the DDM in an inhomogeneous electric field, and a stationary GDM is not formed. The waveforms of the current and voltage pulses for both polarities of the needle are shown in Figure 9.
The registered pulses are related by their properties to the first pulses, which usually initiate a CD. To demonstrate the possibility of obtaining large delays (intervals) between pulses, the voltage threshold mode was used. Under these conditions, current and voltage waveforms could only be recorded with a low temporal resolution. Due to the long duration of the signal recording, the waveforms in the quasi-stationary stages were blurred.
With a negative polarity of the needle, Figure 9a, the detected current pulses are single Trichel pulses. On the current graph, individual pulses are visible, which are initiated under the conditions of transition from the DDM in a nonuniform electric field to the first pulses. It was not possible to register the DDM current between pulses due to its small value, even with statistical processing of 500 signals. The small value of the quasi-stationary current in the pauses between pulses confirms the reverse transition to the DDM after the initiation of the first pulse and repeated transitions from the DDM to the “next first pulse” without further initiation of a series of Trichel pulses and the appearance of a quasi-stationary GDM current.
Figure 9b shows current pulses that appear at large intervals with a needle-positive polarity. The intervals between them are also tens of milliseconds or more. The current in the pauses between pulses in Figure 9 was not registered at both polarities of the needle. As was shown earlier [7], with positive polarity of the needle, with increasing voltage, a quasi-stationary stage of the CD is observed, at which the discharge current increases. For the mode shown in Figure 9b, several pulses are visible. It follows from this that after each current pulse at a constant positive voltage of the source, the mode also returns to the DDM in a non-uniform electric field. Then, after tens of milliseconds, the first current pulse is initiated again, as for the needle’s negative polarity. Accordingly, the properties of the plasma near the needle tip should correspond under these conditions to the properties of the DDM in a nonuniform electric field, and the recorded pulses are related to the first pulses of the CD. However, the ignition of the CD does not occur. To ignite a CD, it is necessary to increase the voltage across the gap or decrease the ballast resistance. We believe that the first current pulses with positive polarity of the needle cannot be attributed to Trichel pulses due to the difference in the physical processes during their formation. In most of the known works with positive polarity of the needle, the registration of the first pulses and their parameters were not reported. As the voltage increases, repeated pulses from the positive polarity of the needle are not formed, but a growing stationary current is recorded without separate bursts. This continues until the implementation of the CD regime with the generation of cylindrical streamers [7,53], which will not be considered in detail in this review.
It was not possible to register the DDM radiation and the radiation of the first Trichel pulses at low voltages in our experiments due to their low intensity, even with the use of an ICCD camera.

5.4. Trichel Pulse Sequence during Corona Discharge

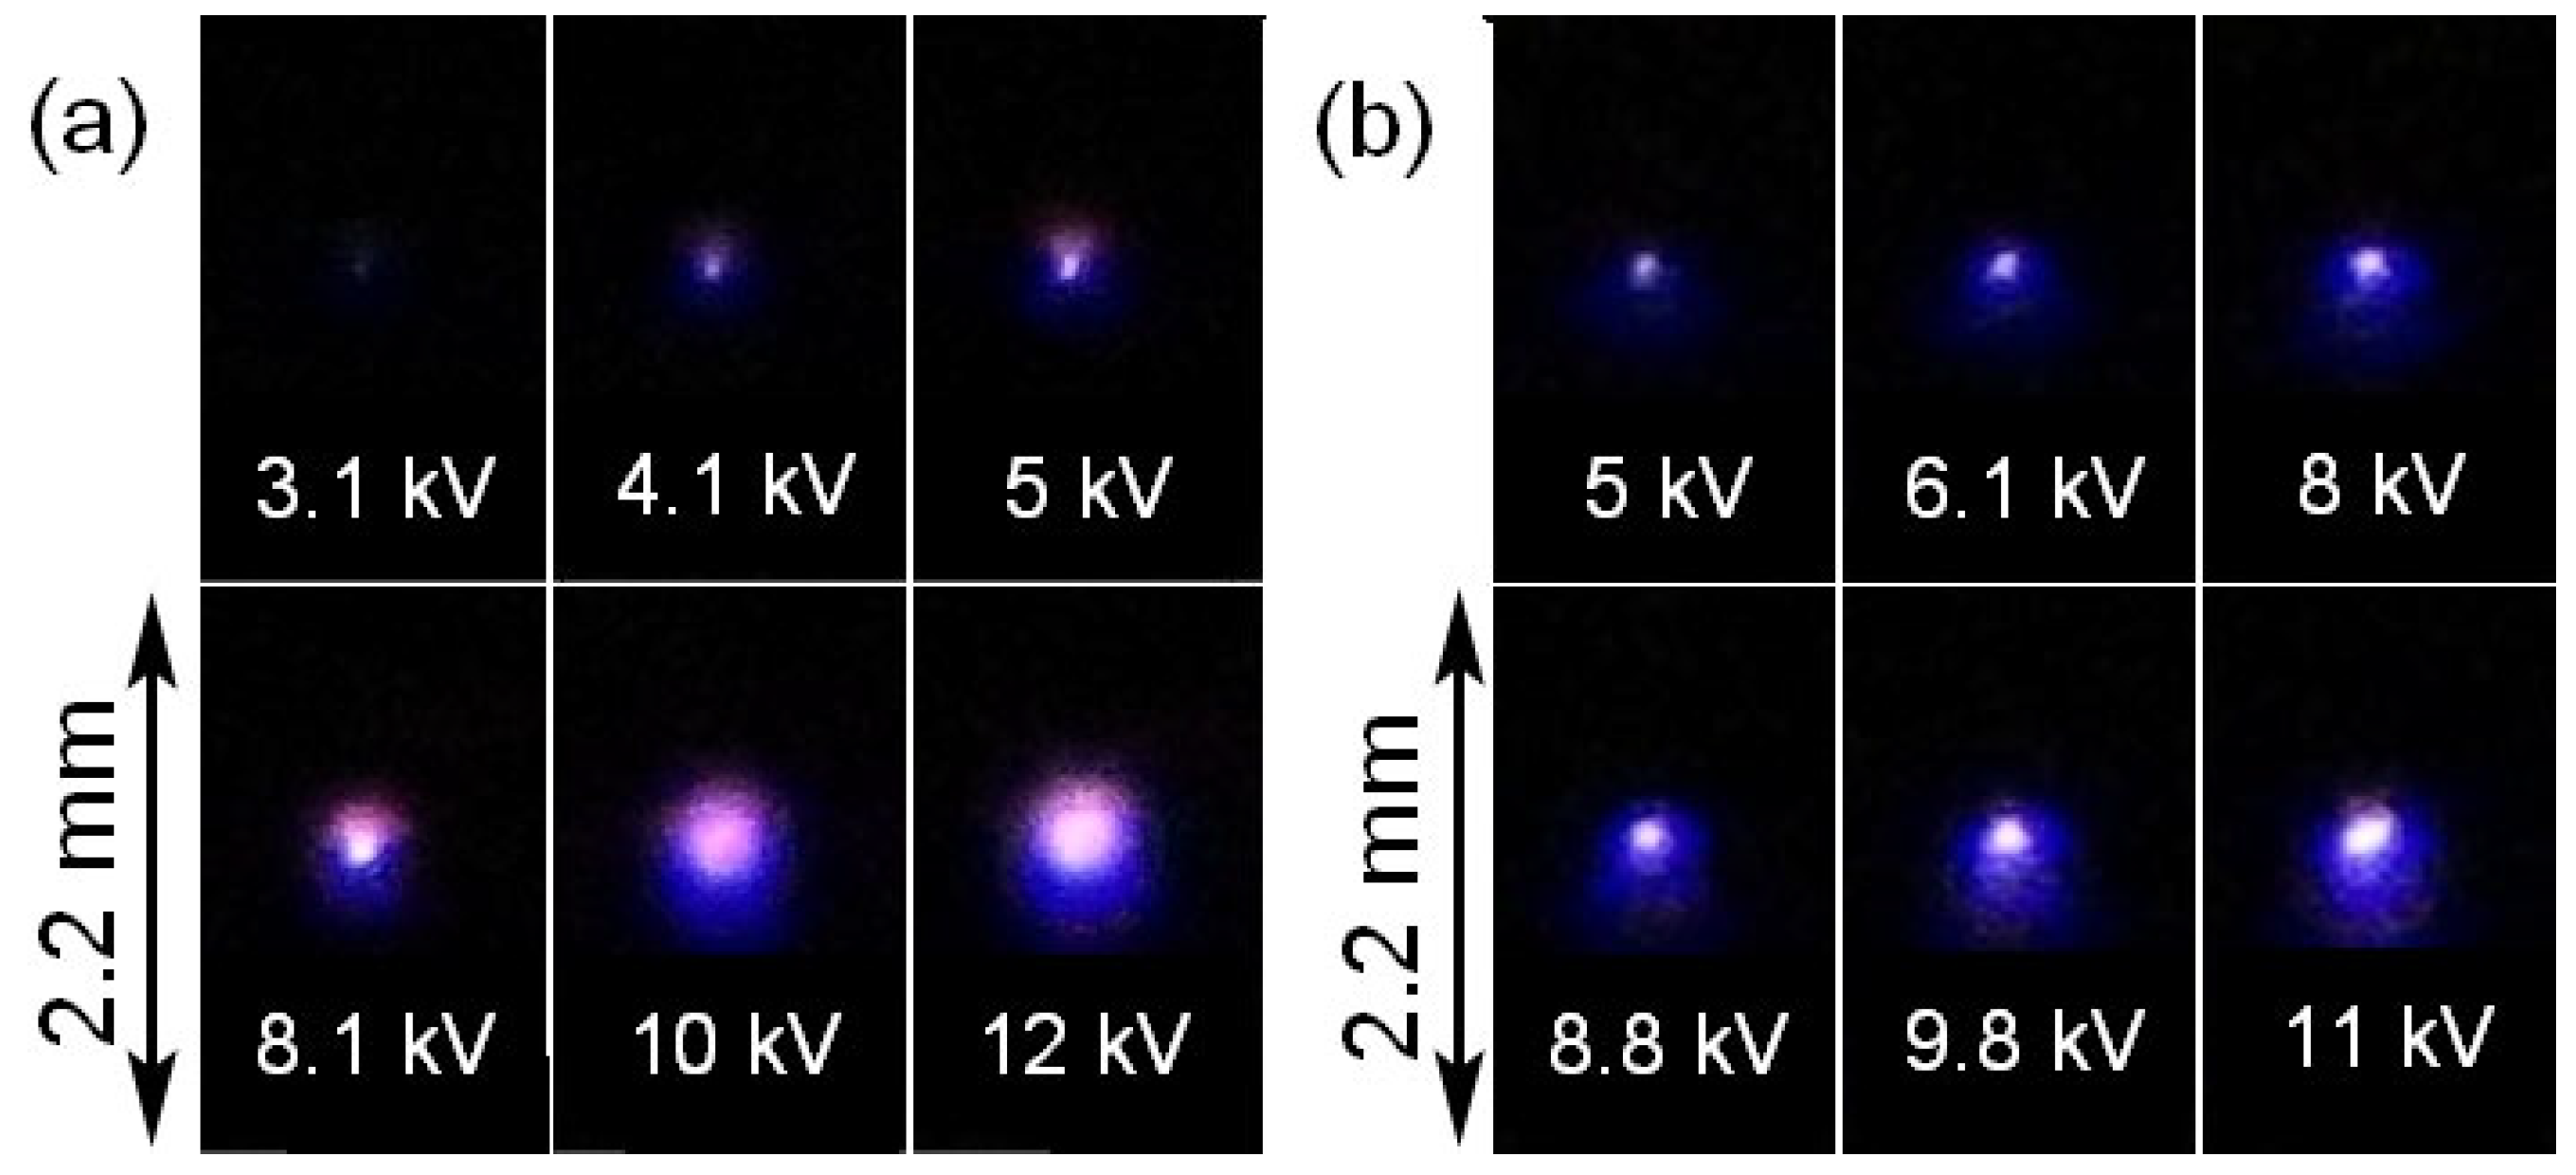
With an increase in the voltage across the gap after ignition of the CD from the needle negative polarity, Trichel pulses are recorded in the repetitively pulsed mode and the quasi-stationary component of the corona current. This makes it possible to carry out studies by optical methods using long exposure times. Figure 10 shows the light of plasma of negative and positive coronas near the needle tip (Setup 1).
Photographing was carried out with a SONY A100 camera. The size of luminous corona regions depended on the voltage and length of the gap. The plasma glow near the electrodes had a shape close to spherical for both polarities. The corona plasma was spherical only in the range of low voltages and was changed as the voltage was increased, which agrees with data reported elsewhere [14,55]. At the same voltage, the total radiation near the negative polarity of the needle, compared to the positive one, was higher. Figure 10 shows the glow of the CD at relatively low voltages.
The use of an ICCD camera made it possible to obtain more information about the dynamics of plasma radiation during a CD. The change in the intensity of the plasma glow in the gap with the negative polarity of the needle at two exposure times of the ICCD camera is shown in Figure 11.
As shown by multiple photographs using an ICCD camera in Figure 11, if the integral radiation is recorded for 10 pulses or more, the shape and intensity of the plasma glow near the needle tip under these conditions did not change significantly with a change in the discharge mode. It was not possible to obtain an image in one current pulse and data on the dynamics of plasma radiation. The reason is the small energy deposition, which amounted to ≈ 1 μJ or less in one current pulse. However, in the accumulation mode, as in [14], the dimensions of the luminous plasma region near the needle tip were recorded, which depended on the exposure time. With an exposure time of one frame of 3 μs, a weak glow is seen at the needle tip with a registered diameter of the luminous region of ≈ 0.8 mm. Increasing the exposure time to 500 μs led to an increase in the detected diameter of the brightly glowing plasma, which had a spherical shape, up to 2.5 mm, frame K4 in Figure 11. Using the ICCD camera, it was also found that with needle tips having a radius of curvature of 100 µm or more, the CD is initiated by several small filaments, which then merge into one with a bridge at the needle tip. This affected the shape of the plasma formation; it lost its spherical shape.
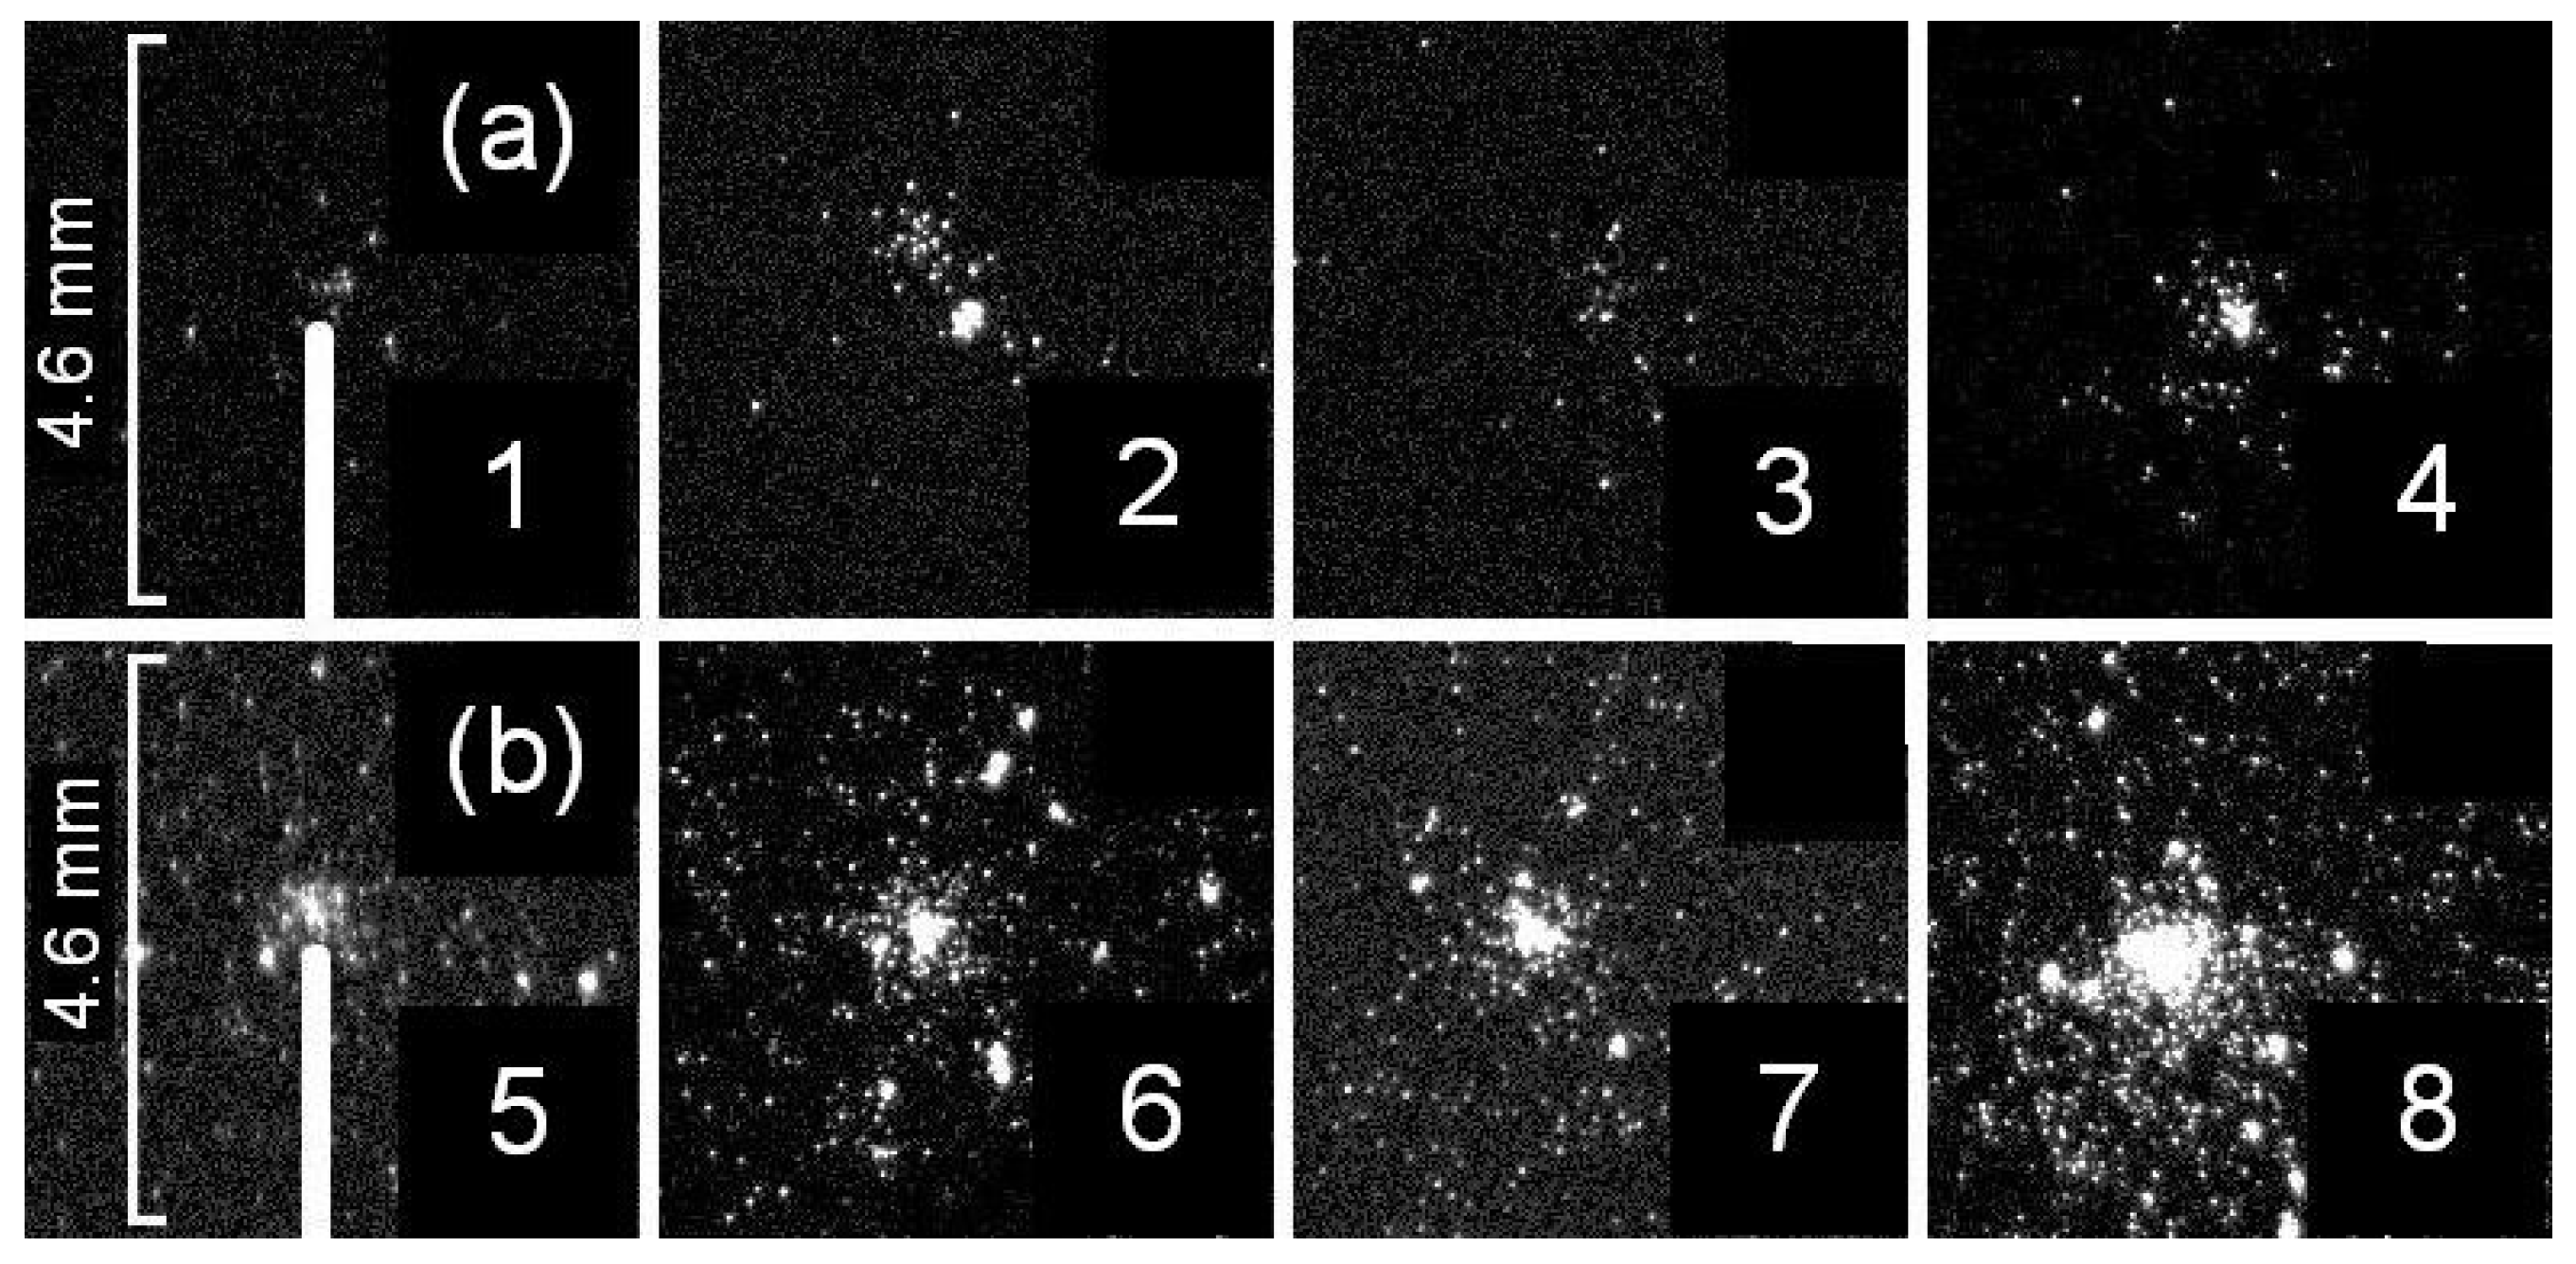
We explain the spherical shape of the plasma glow near the needle tip by the formation of spherical streamers [53,56]. Note that the use of voltage pulses with a short front makes it possible to detect spherical streamers in individual pulses. Figure 12 shows ICCD images of the plasma of a negative corona near the needle tip at pulsed voltage.
Because of the low intensity and widely varied start times of first avalanches and streamers at low voltages with low rates of rise, it was impossible to accurately trace their formation dynamics by ICCD imaging. However, an increase in the radiation intensity due to streamers was identified in individual frames ~200 ns long. As can be seen from Figure 12a, more intense streamer radiation is present in frame 2 and in frame 4 whose duration spans that of frames 1, 2, and 3. Such radiation within 200 ns corresponds to the current pulse duration of the first spherical streamer. Under the conditions considered, the spacing between streamer pulses was much longer than 600 ns, and such images were possible only after tens to hundreds of corona imaging events.
As the frame duration was increased to over 20 μs, the detection of individual streamers failed. The radiation intensity was determined by the quasi-stationary corona current and was the same at the same frame durations. Our experiments on the detection of first streamers at a pulse voltage rise time of 500 ns confirmed the results reported elsewhere [7,53]. Increasing the gap voltage allowed us to capture their radiation at negative polarity in frames 200 ns and 100 ns long, which roughly corresponds to the current FWHM through the gap. However, their formation dynamics at such frame durations were untraceable. We think that it is similar to what is observed at voltage pulses of tens of nanoseconds [56]. With a frame duration of ~10 ns and shorter, the radiation intensity of the negative streamer was insufficient for its identification. The total emission intensity at the negative polarity of the needle, compared to the positive one, was higher due to higher streamer formation rates (Figure 10)
Photographing the CD with the help of ICCD cameras under conditions of successive stable formation of Trichel pulses showed that the glow region with a separated needle has a spherical shape and small dimensions, which are well calculated by the calculated size of the region of increasing gas ionization. As was presented in Section 3, in the numerical simulation of the experiment, the electron number density exceeds 1013 × cm−3 in this region.
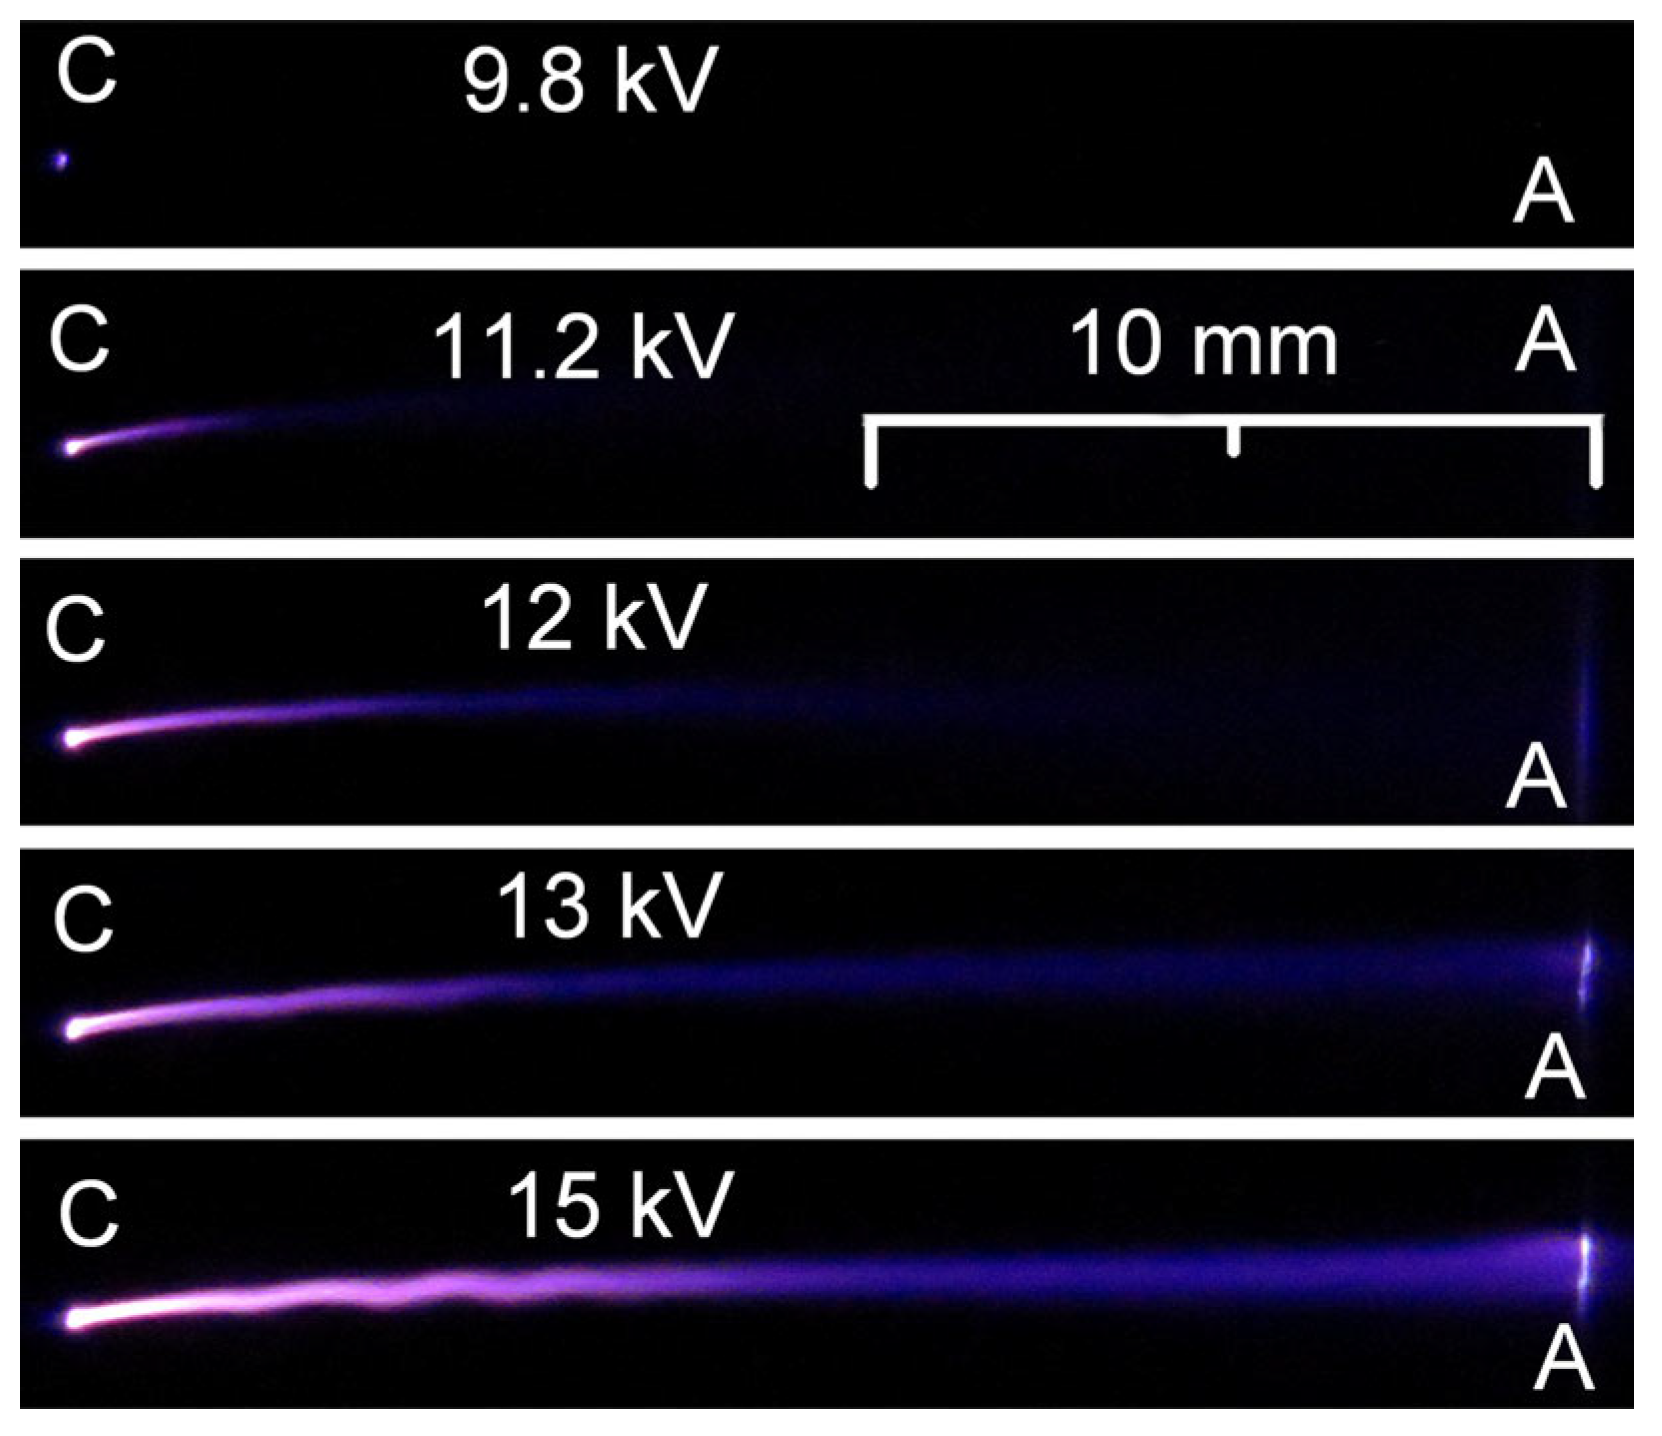
At a positive polarity, the plasma was spherical with a wide voltage range (Figure 10), and as the voltage was increased, jets escaped from the plasma up to the plane electrode (Figure 13).
At a voltage of up to 9.8 kV, a spherical streamer was formed near the tip of the needle, and starting from a voltage of 11 kV, a cylindrical streamer began to form [7,53]. This mode differs from the discharge mode with a negative polarity of the needle.
Spectral measurements of the CD luminescence at under the conditions of Figure 10 and Figure 11 showed that the main part of the radiation belongs to the second positive nitrogen system. It follows from this that the optical properties of the plasma near the tip of the needle under these conditions correspond to the optical properties of diffuse discharges. When the corona discharge is contracted, a broadband continuum appears in the emission spectrum, as well as lines of atoms and ions of the electrode metal with a small radius of curvature. Our observations confirm the results of numerous experimental measurements of corona discharge spectra; see, for example, review [57].
Shown in Figure 10, Figure 11 and Figure 12, images taken with the ICCD camera are accompanied by the formation of a series of Trichel pulses. Examples of such series registered on Setup 1 with a needle negative polarity are shown in Figure 14.
An increase in voltage leads to an increase in the pulse repetition rate and an increase in voltage in the quasi-stationary stage of the discharge. The specific values of current and voltage are also affected by the size of the interelectrode gap, the radius of curvature of the needle tip, and other parameters. For example, with a gap of 8 mm and a needle voltage of negative polarity of 8 kV, the FWHM of the Trichel pulse was 94 ns, the current amplitude was 56 μA, and the pulse repetition rate was 5 × 10⁶ pps. The constant current component between pulses in this mode was ~42 μA. Note that the oscillograms in Figure 14b correspond to the ICCD camera images shown in Figure 11.
The formation of Trichel pulses in the repetitively pulsed regime has been studied in sufficient detail and described in many publications; see, for example [1,12,13,14,42]. Additionally, in many works, the current–voltage characteristics of a CD are given; see, for example [37,44,51,58].

5.5. Transition from Trichel Pulse Mode to Glow Discharge Mode

In special experiments realizing the CD current limiting mode, there are unavoidable, in comparison with the calculated variant, complications of the electric circuit. Although this leads to quantitative variations in the time profiles of the discharge current and voltage, they are qualitatively well reproduced. Unfortunately, due to the large difference in the level of currents at different stages of the development of a CD, it is not possible to simultaneously fix all four stages in the experiment, as was shown in the calculations in Figure 2. For example, when registering small current amplitudes of Trichel pulses, it is dangerous (because of the oscilloscope damage) to allow a large stationary discharge current in the circuit. Therefore, Figure 15 shows a “compromise” example of the experimental time profile of the current and voltage in a diode with a needle cathode, the parameters of which were as follows: the radius of curvature of the needle tip is 100 μm (the same in the calculation), the gap length is 3 mm, the source voltage is 5.3 kV, the limiting resistor is 1 MΩ (the same in the calculation), constructive capacitance 4.7 nF. Such parameters provided a comparable level of discharge current at all stages.
In general, this experiment gives the same results of the evolution of the CD that was obtained in the simulation: the first two and the fourth stationary stages of the discharge are clearly visible, and the third (low-voltage transitional stage) is not realized, since the average current level by the end of the Trichel regime (1.4 mA) turned out to be close to the stationary current (2.4 mA). Naturally, the increased level of the varying discharge current in the experiment had a noticeable effect on the diode voltage, which was not in the calculation. The high average discharge current in this experiment was due to the high average field strength (at the level of 10 kV/cm in the experiment versus 4.2 kV/cm in the calculation). The same strong field factor provides sufficient conditions for the formation of a stationary glow discharge structure without a long transitional (third) mode, as was the case in the calculation. Under other experimental conditions, when the pulsed corona current was orders of magnitude less than the stationary current of the last stage, the long-term low-current intermediate discharge mode was clearly recorded in the experiment.
We can also mention other differences between the experimental dependences (Figure 15) and the calculated ones (Figure 2). In the experiment, a stochastic nature of the amplitudes in the sequence of Trichel pulses is observed, which was to be expected, since there was no symmetry in the processes of generation of the discharge plasma. In addition, in our theoretical model, gas heating in the discharge region was not taken into account, and in the experiment, this effect must inevitably affect the variability of the discharge conditions from pulse to pulse.

6. Conclusions

Based on the presented studies and the results of other researchers, it is possible to formulate several reliably established regularities of a corona discharge with a negative polarity of the tip.
(1) The process of a corona discharge formation as the voltage on the diode increases can go through 4 different modes: a dark discharge mode, the mode of Trichel pulses, an intermediate mode of a monotonous increase in current, ending with a “second breakdown”, and passing into the mode of a stationary glow discharge. The Trichel pulse mode is implemented in a limited voltage range (in Figure 2a, this is a wide range of 1.4–3.9 kV, and in Figure 15, the range is narrower, 3.0–3.4 kV).
(2) If, according to the conditions of the experiment, the voltage does not rise above the upper limit of this range, then the pulse-periodic Trichel regime can continue indefinitely in time. At a voltage just above this level, the pulsed mode can have a very low repetition rate, down to a few pulses per second. In this case, a pulsed corona discharge can go into a dark mode, and then generate the “next first” corona pulse. This feature during the ignition of a corona discharge was recorded both at the negative and the positive polarity of the tip. The amplitude of the rare “first” Trichel pulses did not change significantly.
Note that the transition stage from the dark mode to the first Trichel pulses, as well as the return to the dark mode between rare current pulses, requires additional experimental and theoretical studies, both for the negative and positive polarity of the tip.
(3) Theoretical simulation showed that the Trichel pulse mode is due to the accumulation of positive ions near the pointed cathode and the rapid increase in the rate of ionization processes when the number density of free electrons reaches a level of ~1011 cm−3. The calculations showed that the maximum current of the first Trichel pulses is realized at an electron number density of ~1013 cm−3, which is typical for electron avalanches in the avalanche–streamer transformation. However, the rapid escape of free electrons from the strong field region and their subsequent recombination and/or attachment does not allow the starting streamer to move toward the anode.
(4) Detailed simulation of the 1st Trichel pulse generation showed [12] that the lower voltage limit U1 for triggering the pulsed mode corresponds to the local field strength at the tip at the level of 2-fold static breakdown field strength of the flat gap. For air, it is ~30 kV/(cm × atm). This level of the local field just ensures the formation of the structure and the burning of a self-sustained discharge. To estimate the field strength at the tip, you can use the well-known formula E max = ( U 1 / r c u r v ) / ln ( 2 d / r c u r v ) , which is exact for the “hyperboloid of revolution-plane” geometry. For the conditions of Figure 2 (U1 = 1500 V, d = 1 cm, rcurv = 0.01 cm), this formula gives an estimate of Emax = 50 kV/cm, which is approximately twice the static breakdown threshold.
(5) The upper voltage limit U2 = 5.9 kV corresponds to the situation when stationary plasma can be maintained along the entire length of the gap, which is possible at an average field strength of Eaver = U2/d ~ 6 kV/cm. It is this level of field strength (~5 kV/cm × atm) that occurs in the positive column of a glow discharge in the air [2]. It should be specially emphasized that the current density of a stationary glow discharge mode in the tip–plane configuration is very far from the parameters of the classical “normal glow discharge” in the plane-parallel geometry.
If the voltage across the diode can provide an average field significantly higher than this level, then the intermediate mode of the transition from the pulse mode to the stationary glow discharge can be short or even absent. This situation takes place in Figure 15 when the average electric field strength is 11 kV/cm already by the end of the impulse stage.
(6) Since we did not take into account the thermophysical processes in the discharge, the presented calculated results and conclusions are valid as long as the “short circuit” current I s c c = U 0 / R b does not exceed ten milliamperes.
Author Contributions

Conceptualization, writing—original draft, editing, A.V.K. and V.F.T.; simulation V.Y.K. and A.O.K.; experiments, analysis, methodology, E.K.B. and N.P.V.; project administration, V.F.T. All authors have read and agreed to the published version of the manuscript.

Funding

This research was supported by the Russian Science Foundation (project no. 22-29-00137).

Data Availability Statement

Data are contained within the paper.

Conflicts of Interest

The authors declare no conflict of interest. The funders had no role in the design of the study; in the collection, analyses, or interpretation of data; in the writing of the manuscript; or in the decision to publish the results.

References

  1. Loeb, L.P. Electrical Coronas. Their Basic Physical Mechanisms; University of California Press: Berkeley, CA, USA, 1965; p. 694. [Google Scholar]
  2. Raizer, Y.P. Gas Discharge Physics, 1st ed.; Allen, J.E., Ed.; Springer: Berlin/Heidelberg, Germany, 1991; p. 449. [Google Scholar]
  3. Trichel, G.W. The Mechanism of the Negative Point to Plane Corona Near Onset. Phys. Rev. 1938, 54, 1078–1084. [Google Scholar] [CrossRef]
  4. Goldman, M.; Goldman, A.; Sigmond, R.S. The corona discharge, its properties and specific uses. Pure Appl. Chem. 1985, 57, 1353–1362. [Google Scholar] [CrossRef] [Green Version]
  5. Adamiak, K. Simulation of corona in wire-duct electrostatic precipitator by means of the boundary element method. IEEE Trans. Ind. Appl. 1994, 30, 381–386. [Google Scholar] [CrossRef]
  6. Sattari, P.; Gallo, C.F.; Castle, G.S.P.; Adamiak, K. Trichel pulse characteristics—Negative corona discharge in air. J. Phys. D Appl. Phys. 2011, 44, 155502. [Google Scholar] [CrossRef]
  7. Tarasenko, V.; Baksht, E.; Kuznetsov, V.; Panarin, V.; Skakun, V.; Sosnin, E.; Beloplotov, D. Corona with Streamers in Atmospheric Pressure Air in a Highly Inhomogeneous Electric Field. J. Atmos. Sci. Res. 2020, 3, 28–37. [Google Scholar] [CrossRef]
  8. Chen, S.; Nobelen, J.C.P.Y.; Nijdam, S. A self-consistent model of ionic wind generation by negative corona discharges in air with experimental validation. Plasma Sources Sci. Technol. 2017, 26, 095005. [Google Scholar] [CrossRef]
  9. Chalmers, J.A. Atmospheric Electricity, 2nd ed.; Pergamon Press: London, UK, 1967; p. 526. [Google Scholar]
  10. Arcanjo, M.; Montanyà, J.; Urbani, M.; Lorenzo, V.; Pineda, N. Observations of corona point discharges from grounded rods under thunderstorms. Atmos. Res. 2021, 247, 105238. [Google Scholar] [CrossRef]
  11. Guo, X.; Zhang, L.; Ji, Z.; Gao, Y.; Wang, Z.; Zhao, N. Three-Dimensional Simulation of Corona Discharge in a Double-Needle System during a Thunderstorm. Atmosphere 2023, 14, 789. [Google Scholar] [CrossRef]
  12. Mizeraczyk, J.; Berendt, A.; Akishev, Y. Controlled generation of a single Trichel pulse and a series of single Trichel pulses in air. J. Phys. D Appl. Phys. 2018, 51, 155204. [Google Scholar] [CrossRef]
  13. Lama, W.L.; Gallo, C.F. Systematic study of the electrical characteristics of the “Trichel” current pulses from negative needle-to-plane coronas. J. Appl. Phys. 1974, 45, 103–113. [Google Scholar] [CrossRef]
  14. Zhang, Y.; Qin, Y.; Zhao, G.; Ouyang, J. Time-resolved analysis and optical diagnostics of Trichel corona in atmospheric air. J. Phys. D Appl. Phys. 2016, 49, 245206. [Google Scholar] [CrossRef]
  15. Kozyrev, A.V.; Kokovin, A.O.; Kozhevnikov, V.Y.; Tarasenko, V.F.; Baksht, E.K.; Vinogradov, N.P. Evolution of Negative Corona in the Discharge-Current Limitation Mode: Transition from the Pulsed-Periodic Mode to Steady-State Burning. J. Exp. Theor. Phys. 2023, 136, 250–257. [Google Scholar] [CrossRef]
  16. Asinovskiĭ, É.I.; Petrov, A.A.; Samoylov, I.S. Frequency Response Characteristics of Trichel Pulses and the Behavior of the Cathode Spot in a Negative Corona Discharge. JETP Lett. 2007, 86, 302–303. [Google Scholar] [CrossRef]
  17. Kozyrev, A.V.; Kokovin, A.O.; Kozhevnikov, V.Y.; Tarasenko, V.F. Change in Mechanism of Corona Discharge Formation in Atmospheric Air with a Negative Tip. Russ. Phys. J. 2023, 65, 1758–1761. [Google Scholar] [CrossRef]
  18. Asinovskiĭ, É.I.; Petrov, A.A.; Samoylov, I.S. Erosion of a Copper Cathode in a Negative Corona Discharge. Tech. Phys. 2008, 53, 279–281. [Google Scholar] [CrossRef]
  19. Loeb, L.B. The Mechanism of the Trichel Pulses of Short Time Duration in Air. Phys. Rev. 1952, 86, 256–257. [Google Scholar] [CrossRef]
  20. Aleksandrov, G.N. On Nature of Current Pulses of a Negative Corona. Sov. Phys. Tech. Phys. 1963, 8, 161–166. [Google Scholar]
  21. Goldman, M.; Dancer, P.; Davidson, R.C.; Farish, O. Unified theory for the mechanism of the negative corona Trichel pulse. In Proceedings of the Conference Records of IEEE—IAS Annual Meetings, Cleveland, OH, USA, 11–15 October 1979; pp. 87–90. [Google Scholar]
  22. Napartovich, A.P.; Akishev, Y.S.; Deryugin, A.A.; Kochetov, I.V.; Pan’kin, M.V.; Trushkin, N.I. A numerical simulation of Trichel-pulse formation in a negative corona. J. Phys. D Appl. Phys. 1997, 30, 2726–2736. [Google Scholar] [CrossRef]
  23. Černák, M.; Hosokawa, T.; Kobayashi, S.; Kaneda, T. Streamer mechanism for negative corona current pulses. J. Appl. Phys. 1998, 83, 5678–5690. [Google Scholar] [CrossRef]
  24. Akishev, Y.S.; Grushin, M.E.; Kochetov, I.V.; Napartovich, A.P.; Trushkin, N.I. Establishment of Regular Trichel Pulses in a Negative Corona in Air. Plasma Phys. Rep. 1999, 25, 922. [Google Scholar]
  25. Zentner, R. Über die Anstiegzeiten der negativen Koronaentladungimpulse. Z. Angew. Phys. 1970, 29, 294–301. [Google Scholar]
  26. Morrow, R. Theory of negative corona in oxygen. Phys. Rev. A 1985, 32, 1799–1809. [Google Scholar] [CrossRef] [PubMed]
  27. Morrow, R. Theory of stepped pulses in negative corona discharges. Phys. Rev. A 1985, 32, 3821–3824. [Google Scholar] [CrossRef]
  28. Černák, M.; Hoder, T.; Bonaventura, Z. Streamer breakdown: Cathode spot formation, Trichel pulses and cathode-sheath instabilities. Plasma Sources Sci. Technol. 2020, 29, 013001. [Google Scholar] [CrossRef]
  29. Akishev, Y.S.; Kochetov, I.V.; Loboiko, A.I.; Napartovich, A.P. Numerical simulations of Trichel pulses in a negative corona in air. Plasma Phys. Rep. 2002, 28, 1049–1059. [Google Scholar] [CrossRef]
  30. Tarasenko, V.F.; Baksht, E.K.; Vinogradov, N.P.; Kozyrev, A.V.; Kokovin, A.O.; Kozhevnikov, V.Y. On the Mechanism of Generation of Trichel Pulses in Atmospheric Air. JETP Lett. 2022, 115, 667–672. [Google Scholar] [CrossRef]
  31. Wu, S.; Cheng, W.; Huang, G.; Wu, F.; Liu, C.; Liu, X.; Zhang, C.; Lu, X. Positive streamer corona, single filament, transient glow, dc glow, spark, and their transitions in atmospheric air. Phys. Plasmas 2018, 25, 123507. [Google Scholar] [CrossRef]
  32. Hagelaar, G.J.M.; Pitchford, L.C. Solving the Boltzmann equation to obtain electron transport coefficients and rate coefficients for fluid models. Plasma Sources Sci. Technol. 2005, 14, 722–733. [Google Scholar] [CrossRef]
  33. Pancheshnyi, S.; Nudnova, M.; Starikovsii, A. Development of a cathode–directed streamer discharge in air at different pressures: Experiment and comparison with direct numerical simulation. Phys. Rev. E 2005, 71, 016407. [Google Scholar] [CrossRef]
  34. Kossyi, I.A.; Kostinsky, A.Y.; Matveyev, A.A.; Silakov, V.P. Kinetic scheme of the non-equilibrium discharge in nitrogen-oxygen mixtures. Plasma Sources Sci. Technol. 1992, 1, 207–220. [Google Scholar] [CrossRef]
  35. Bultel, A.; Cheron, B.G.; Vervisch, P. Measurement of the ground state and metastable atomic nitrogen number density in a low-pressure plasma jet. Plasma Sources Sci. Technol. 1999, 4, 597–605. [Google Scholar] [CrossRef]
  36. He, J.; Zhang, Y.T. Modeling Study on the Generation of Reactive Oxygen Species in Atmospheric Radio-Frequency Helium-Oxygen Discharges. Plasma Process. Polym. 2012, 9, 919–928. [Google Scholar] [CrossRef]
  37. Chen, S.; Li, K.; Nijdam, S. Transition mechanism of negative DC corona modes in atmospheric air: From Trichel pulses to pulseless glow. Plasma Sources Sci. Technol. 2019, 28, 055017. [Google Scholar] [CrossRef]
  38. Jiang, M.; Li, Y.; Wang, H.; Ding, W.; Liu, C. 3D PIC–MCC simulation of corona discharge in needle-plate electrode with external circuit. Plasma Sources Sci. Technol. 2020, 29, 015020. [Google Scholar] [CrossRef]
  39. Zubarev, N.M.; Kozhevnikov, V.Y.; Kozyrev, A.V.; Mesyats, G.A.; Semeniuk, N.S.; Sharypov, K.A.; Shunailov, S.A.; Yalandin, M.I. Mechanism and dynamics of picosecond radial breakdown of a gas-filled coaxial line. Plasma Sources Sci. Technol. 2020, 29, 125008. [Google Scholar] [CrossRef]
  40. COMSOL Multiphysics® v. 6.0; COMSOL AB: Stockholm, Sweden, 2021; Available online: www.comsol.com (accessed on 23 May 2023).
  41. Akishev, Y.S.; Grushin, M.E.; Karal’nik, V.B.; Trushkin, N.I. Pulsed mode of a negative corona in nitrogen: I. Experiment. Plasma Phys. Rep. 2001, 27, 520–531. [Google Scholar] [CrossRef]
  42. Akishev, Y.; Grushin, M.; Kochetov, I.; Karal’nik, V.; Napartovich, A.; Trushkin, N. Negative corona, glow and spark discharges in ambient air and transitions between them. Plasma Sources Sci. Technol. 2005, 14, S18–S25. [Google Scholar] [CrossRef]
  43. Stishkov, Y.K.; Samusenko, A.V.; Ashikhmin, I.A. Corona discharge and electrogasdynamic flows in the air. Phys. Uspekhi 2018, 61, 1213–1226. [Google Scholar] [CrossRef]
  44. Bandel, H.W. Point–to–Plane Corona in Dry Air. Phys. Rev. 1951, 84, 92–99. [Google Scholar] [CrossRef]
  45. Townsend, J.S. XI. The potentials required to maintain currents between coaxial cylinders. Lond. Edinb. Dublin Philos. Mag. J. Sci. 1914, 28, 83–90. [Google Scholar] [CrossRef] [Green Version]
  46. Gupta, M.; Mahur, A.K.; Varshney, R.; Sonkawade, R.G.; Verma, K.D.; Prasad, R. Measurement of natural radioactivity and radon exhalation rate in fly ash samples from a thermal power plant and estimation of radiation doses. Radiat. Meas. 2013, 50, 160–165. [Google Scholar] [CrossRef]
  47. Akishev, Y.S.; Grushin, M.E.; Karal’nik, V.B.; Monich, A.E.; Trushkin, N.I. Shape of the current tube of a negative point–to–plane corona in air. Plasma Phys. Rep. 2003, 29, 717–726. [Google Scholar] [CrossRef]
  48. Liao, R.; Wu, F.; Yang, L.; Wang, K.; Zhou, Z.; Liu, K. Investigation on microcosmic characteristics of Trichel pulse in bar–plate DC negative corona discharge based on a novel simulation model. Int. Rev. Electr. Eng. 2013, 8, 504–513. [Google Scholar]
  49. Sun, A.; Zhang, X.; Guo, Y.; He, Y.; Zhang, G. Review on ionization and quenching mechanisms of Trichel pulse. Chin. Phys. B 2021, 30, 055207. [Google Scholar] [CrossRef]
  50. Kokovin, A.O.; Kozyrev, A.V.; Kozhevnikov, V.Y. Simulation of negative corona discharge in atmospheric air: From mode of Trichel pulses to stationary discharge. J. Phys. Conf. Ser. 2021, 2061, 012024. [Google Scholar] [CrossRef]
  51. Zhang, X.; Guo, Y.; Sun, A.; Yao, C.; Sun, G.; Zhang, G. The pulsed mode of negative DC corona in nitrogen at atmosphere pressure: Comparison with Trichel pulses in air. Phys. Plasmas 2020, 27, 033501. [Google Scholar] [CrossRef]
  52. Dandaron, G.-N.B.; Baldanov, B.B. Experimental Study of a Negative Corona in Atmospheric-Pressure Argon. Plasma Phys. Rep. 2007, 33, 243–248. [Google Scholar] [CrossRef]
  53. Tarasenko, V.F.; Kuznetsov, V.S.; Panarin, V.A.; Skakun, V.S.; Sosnin, E.A.; Baksht, E.K. Role of Streamers in the Formation of a Corona Discharge in a Highly Nonuniform Electric Field. JETP Lett. 2019, 110, 85–89. [Google Scholar] [CrossRef]
  54. Beloplotov, D.V.; Lomaev, M.I.; Tarasenko, V.F.; Sorokin, D.A. Measurement of the Dynamic Displacement Current as a New Method of Study of the Dynamics of Formation of a Streamer at a Breakdown of Gases at a High Pressure. JETP Lett. 2018, 107, 606–611. [Google Scholar] [CrossRef]
  55. Afanas’ev, S.B.; Lavrenyuk, D.S.; Petrushenko, I.N.; Stishkov, Y.K. Peculiarities of the corona discharge in air. Tech. Phys. 2008, 53, 848–852. [Google Scholar] [CrossRef]
  56. Tarasenko, V.F.; Naidis, G.V.; Beloplotov, D.V.; Kostyrya, I.D.; Babaeva, N.Y. Formation of Wide Streamers during a Subnanosecond Discharge in Atmospheric-Pressure Air. Plasma Phys. Rep. 2018, 44, 746–753. [Google Scholar] [CrossRef]
  57. Riba, J.-R. Application of Image Sensors to Detect and Locate Electrical Discharges: A Review. Sensors 2022, 22, 5886. [Google Scholar] [CrossRef] [PubMed]
  58. Ferreira, N.G.C.; Almeida, P.G.C.; Benilov, M.S.; Panarin, V.A.; Skakun, V.S.; Tarasenko, V.F.; Naidis, G.V. Computational and Experimental Study of Time–Averaged Characteristics of Positive and Negative DC Corona Discharges in Point–Plane Gaps in Atmospheric Air. IEEE Trans. Plasma Sci. 2020, 48, 4080–4088. [Google Scholar] [CrossRef]
Figure 1. Sketch of gas discharge diode with finite computational domain 1–2–3–4–5–1.
Energies 16 04861 g001
Figure 2. Time profiles of discharge current (black line) and diode voltage (blue line, right y-axis).
Energies 16 04861 g002
Figure 3. (a) The drift of amplitudes, durations, and interpulse periods of the Trichel pulses depending on the pulse number in the sequence; (b) Time profiles of some current pulses in sequence (normalized to the pulse pear).
Energies 16 04861 g003
Figure 4. Distributions of electron number density along the discharge axis during the 5th current pulse.
Energies 16 04861 g004
Figure 5. (a) Distribution of free electrons number density in stationary glow discharge (color bar unit in cm–3); (b) Axial distribution of plasma components and self-consistent electric field.
Energies 16 04861 g005
Figure 6. Time profiles of partial current densities on the axis of the system at z = 50 μm away from the tip. The electron current on the left and the remaining currents on the right y-axis are displayed.
Energies 16 04861 g006
Figure 7. Schemes of two setups used for research: (a) Setup 1 with the gap d between the needle 1 and the plane electrode 2; and (b) Setup 2 with a solitary needle electrode 1. 3—location of CD glow before transition into other forms. U—high voltage connected to the limiting resistance. Rb = 3 MΩ in most experiments—ballast resistance for limiting the discharge current. R1, R2—resistances of the voltage divider. R3 = 1 kΩ-shunt resistance. C1—capacitance between needle 1 with its connections and the plane electrode 2. C2—additional capacitor, installed in parallel with the gap d and in series with the shunt R3. C3—capacitor used for applying voltage and registering current pulses in the case of a solitary needle electrode.
Energies 16 04861 g007
Figure 8. Discharge current pulses, which indicate the ignition of a CD in the air at atmospheric pressure at (a) negative and (b) positive polarity of the needle, as well as the corresponding graphs of discharge voltage (blue lines).
Energies 16 04861 g008
Figure 9. Discharge current pulses in the air at atmospheric pressure with large intervals for (a) a needle negative polarity (Setup 1) with a gap d = 10 mm and (b) a needle positive polarity (Setup 2) and the voltage graphs (blue lines).
Energies 16 04861 g009
Figure 10. Images of CD near needle at (a) negative and (b) positive polarity. Setup 1, length of gap d = 2 cm; exposure time was 15 s.
Energies 16 04861 g010
Figure 11. Corona discharge images were obtained with an ICCD camera in the air at atmospheric pressure. U0 = −15 kV. Needle negative polarity at the bottom. Exposure time is 3 µs for frames K1 (a), K2 (b), K3 (c) and 500 µs for frame K4 (d). Frames K1 and K4 start at the same time, the delay of frame K2 relative to the beginning of frame K1 is 3 µs, and frame K3 is 6 µs.
Energies 16 04861 g011
Figure 12. ICCD images of negative coronas near needle tip (Setup 1) with d = 9 mm at maximum gap voltages (a) 13 kV and (b) 6 kV. The needle tip is shown only in frames 1 and 5. Frame duration 200 ns (1, 2, 3), 600 ns (4), 20 μs (5, 6, 7), and 60 μs (8) with no time delay between first (1, 5) and second frames (2, 6) and between second and third (3, 7). The last frames (4, 8) are for coronas within the respective first frames (1, 2, 3 and 5, 6, 7).
Energies 16 04861 g012
Figure 13. Images of discharges from the positive polarity of the needle (on the left) at Setup 1 and d = 20 mm with different voltages. C and A indicate the position of the cathode and anode; the exposure time is 15 s.
Energies 16 04861 g013
Figure 14. Time profiles of the gap voltage (straight lines) and Trichel current pulses at the power supply voltage (a) U0 = −10 kV and (b) −15 kV. Waveforms were obtained with an additional capacitor C3 = 7.5 pF. The value of the constructive capacitance of the gap C1 = 3.7 pF.
Energies 16 04861 g014
Figure 15. Experimental profiles of the corona discharge current and gap voltage with parameters close to the calculated model. The oscilloscope bandwidth is 1 GHz.
Energies 16 04861 g015
Table 1. Plasma–-chemical reaction set in air plasma.
#Reaction 1Rate Coefficient 2,3Ref.
R1e + N2e + e + N2+Townsend coefficient α(Te) calculated
from eEDF (Δε = 15.58 eV)
[32]
R2e + O2e + e + O2+Townsend coefficient α(Te) calculated
from eEDF (Δε = 12.06 eV)
[32]
R3e + e + O2+e + O21.0 × 10−19 (300[K]/Te)9/2[34]
R4O2 + N2+ → N2 + O2+1.0 × 10⁻¹¹[33]
R5e + N2+ + M → N2 + M6.0 × 10−29 (300[K]/Te)3/2[34]
R6e + O2+ + M → O2 + M6.0 × 10−29 (300[K]/Te)3/2[34]
R7e + O4+ → O2 + O21.4 × 10−6 (300[K]/Te)1/2[33]
R8e + O2+ → O + O2.0 × 10−7 (300[K]/Te)3/2[33]
R9e + N2+ → N + N2.8 × 10−7 (300[K]/Te)1/2[33]
R10e + O2 + O2 → O2+ O21.9 × 10−30 (300[K]/Te)·exp[7/3·(1 − 300[K]/Te)][34]
R11O2+ O2e + O2 + O22.2 × 10−18[34]
R12e + O2 + N2 → N2+ O28.5 × 10−32 (300[K]/Te)2·exp[5(1 − 300[K]/Te)][34]
R13N2+ O2e + O2 + N22.2 × 10−19[34]
R14e + O2 + O → O+ O21.0 × 10−31[34]
R15O2 + M + O2+ → M + O4+2.4 × 10⁻³⁰[33]
R16O2 + O4+ → O2 + O2 + O2+1.7 × 10⁻¹³[34]
R17e + N2e + N + N1.0 × 10−7 (Te[eV])−1.6·exp(−9.8[eV]/Te)[35]
R18e + O2e + O + O4.2 × 10−9·exp(−5.6[eV]/Te)[36]
R19O2 + O4+ → O2 + O2 + O21.0 × 10−7[33]
R20O2 + O4+ + M → 3O2 + M2.0 × 10−25[33]
R21O2 + O2+ + M → 2O2 + M2.0 × 10−25[33]
1 Species M represents molecules N2 and O2. 2 Two-term reaction rate coefficients given in cm3/s, three-term given in cm6/s. 3 Reaction rate coefficients are given at background gas temperature Tg = 300 K.
Disclaimer/Publisher’s Note: The statements, opinions and data contained in all publications are solely those of the individual author(s) and contributor(s) and not of MDPI and/or the editor(s). MDPI and/or the editor(s) disclaim responsibility for any injury to people or property resulting from any ideas, methods, instructions or products referred to in the content.