Article

Improved Current and MTPA Control Characteristics Using FEM-Based Inductance Maps for Vector-Controlled IPM Motor †

1
Graduate School of Science and Technology, Shizuoka University, Hamamatsu 432-8561, Japan
2
Department of Electrical Engineering, Universitas Indonesia, Depok 16424, Indonesia
3
Graduate School of Integrated Science and Technology, Shizuoka University, Hamamatsu 432-8561, Japan
*
Author to whom correspondence should be addressed.
This paper is an extended version of our paper published in 2021 17th QIR: International Symposium on Electrical and Computer Engineering, Depok, Indonesia, 13–15 October 2021; pp. 90–93.
Energies 2023, 16(12), 4712; https://doi.org/10.3390/en16124712
Submission received: 28 April 2023 / Revised: 2 June 2023 / Accepted: 12 June 2023 / Published: 14 June 2023
(This article belongs to the Section F: Electrical Engineering)

Abstract

:
Some major problems in the motor drive are the overshoot or undershoot of transient response characteristics and a parameter mismatch due to magnetic saturation. This study proposed a 3D inductance map combined with a maximum-torque-per-ampere (MTPA) map based on a finite-element (FE) motor model considering a cross-coupling magnetic saturation impact to overcome this problem. The proposed FE motor model has a high accuracy of no-load back electromotive force (e.m.f.) around 98.3% compared to the measurement results. Then, nine scenarios of vector control combinations of inductance maps and current supply variations of β 0°, 45°, and MTPA were investigated. As a result, the transient response improvement for β 0°, 45°, and MTPA without the map and with Ld and Lq maps is 63%, 10%, and 15%, respectively. Moreover, for the steady-state response, the average torque improvement between MTPA and Idref 0 A control is 9.21%, 8.97%, and 8.98% for the no-map, ave-map, and 3D-inductance-map conditions, respectively. The MTPA trajectory characteristic was also updated to illustrate the actual MTPA condition compared to the conventional MTPA control. In detail, the proposed method has reduced the parameter mismatch for the current control loop in the transient state and improved the MTPA control trajectory for the steady-state response. Finally, the improvement of vector control characteristics of the proposed method was verified by an FE simulation and experimental measurement results.

1. Introduction

Limited energy sources and global warming are among two key issues in sustainable development goals (SDGs) globally [1,2]. Extensive research and numerous projects on energy efficiency and green technology are funded to overcome these issues, including in electric propulsion and home appliance technology [3,4]. Based on the EIA 2022 annual report, both transport and industry sectors are the major contributors to more than 60% of the world CO2 emissions. Interestingly, 70% of these loads are electrical machines [5]. As a result, interior permanent magnet (IPM) motors are commonly used for traction systems of electric vehicles and industrial applications. The rapid growth of the implementation of the IPM motors is due to their highly efficient and large power-energy density [6,7]. However, the IPM motor drive poses several challenges, such as dealing with magnetic saturation, demagnetization of the permanent magnets, cross-coupling between the d- and q-axes within the controller, and the influence of time and space harmonics on the effectiveness of vector control [8,9,10,11]. These challenges and their impact on the IPM motor control are illustrated in Figure 1. Additionally, harmonics and magnetic saturation lead to higher power losses and poor control response due to parameter mismatches between the controller and motor plant [12,13].
Many studies have been proposed to reduce the copper loss in the IPM motor operation and mitigate the magnetic saturation impact. The typical vector control proposed for the copper loss reduction is the maximum-torque-per-ampere (MTPA) control [14,15,16,17,18,19,20,21,22]. This method is the best alternative way to reduce the copper loss, as the highest torque output with the lowest current supply is the controller’s objective. Moreover, the magnetic saturation phenomenon in the IPM motor is influenced by the motor current supply id and iq. Saturation will reduce the controller’s robustness, including the transient response of the current control and the MTPA trajectory line. In the MTPA conventional control method, the inductance parameter is assumed constant, yet its value is highly dependent on the motor operation [23]. As a result, this constant parameter assumption will lead to an inaccurate MTPA trajectory and higher power loss during the IPM motor operation. As the motor operation reaches the magnetic saturation level, the current supply changes that are proportional to the magnetic field will not significantly impact magnetic flux density, as illustrated in Figure 1c, point B. As a result, there is a mismatch between the motor parameters and its controller.
Various studies have suggested techniques to mitigate the parameter mismatch through precise parameter estimation. These methods can be categorized into offline and online approaches [24]. Due to its flexibility and capacity for real-time adaptation without downtime, the online method becomes critical for improving control performance [25]. However, online parameter identification such as the one proposed in [26] using MRAS or other numerical methods including the recursive least squares (RLS) [27] and extended Kalman filter (EKF) [28] needs intense calculation and some time to converge. This will be challenging for the IPM motors with high-dynamic operations, as the inductance is a function of the current operation.
As an alternative solution, online identification using a map based on a finite element model (FEM) remains a popular approach. The inductance map becomes significant because it can correspond instantaneously with the operating current condition. Several studies have focused on developing inductance maps considering magnetic saturation [29,30,31,32]. The authors of [29,30] proposed inductance calculations based on magnetic equivalent circuits. Both consider the nonlinearity circuit during magnetic saturation; however, a complex mathematical modeling for magnetic circuit calculation using relative permeance was involved. The winding function theory is proposed to calculate the inductance as in [31], yet the implementation is in a no-load condition which is different from load conditions. Offline method of inductance map based on fast Fourier transform (FFT) of voltage and current is used in [32]. However, the usefulness of the inductance map to overcome the impact of magnetic saturation on the MTPA trajectory accuracy is not yet considered in all mentioned studies. In this study, the authors investigated the influence of a simple 3D FEM-based inductance map to improve the robustness of the IPM motor controller during magnetic saturation. The map is developed from the FE simulation results based on 323 cases for robustness. We started by investigating the no-load condition followed by the load operation under saturation conditions. Both results of the FEA simulation and experimental measurement agree with each other in terms of the proposed method.
As a novelty, we proposed a simple yet robust 3D FEM-based inductance map to improve the conventional vector control. The detailed contribution of this paper is as follows:
  • Online estimation of IPM motor parameters;
  • Robust and fast response corresponding to different motor operation conditions;
  • Consideration of magnetic saturation with cross-coupling influence; and
  • A more accurate MTPA trajectory line.
Finally, the proposed motor control algorithm can improve both the output characteristics by reducing the undershoot of the current response at a transient state to up to 60% and the increase in the accuracy of the MTPA trajectory in a steady state. This paper is organized as follows: Section 2 explains the proposed IPM motor drive system used in this study. The details of FEA, including the proposed parameter maps, are explained in Section 3. The simulation results and experimental validation with the finding and a discussion of the IPM motor drives under no-load and nine cases of load conditions are described in Section 4 and Section 5, respectively. Finally, this study is concluded in Section 6.

2. Proposed IPM Motor Drive System

This section first explains the IPM motor configuration and its specification, followed by the mathematical equation, and the block diagram of the proposed IPM motor drive system used in this study. Moreover, the motor drive system principle utilizing the PI regulator and the controller constraint is also included in this section.

2.1. IPM Motor Configuration and Specification

Figure 2 and Table 1 illustrate the 2D IPM motor prototype configuration and its detailed specification. The prototype has 4 poles or a 2-pole pair of permanent magnets (PMs) Neodymium N40SH made by Shin Etsu. The PM has maximum energy of 40 MGOe and high intrinsic coercive force of 20 KOe. Due to this high intrinsic coercive force, this magnet is capable to withstand high external force from being demagnetized. Furthermore, it has a maximum limit of PM temperature operation at 150 °C. The residual flux density (Br), coercive force (HcB and HcJ), and recoil relative permeability (μr) of PM for 20 °C operating temperature are 1.26 T, 955 kA/m, 1592 kA/m, and 1.05, respectively. The thermal property of the PM itself is isotropic, with a constant heat property of 6.2 W/(m/°C) and a specific heat constant of 460 J/(kg/°C).
Furthermore, it has 24 slots or 12 slots per pole pair. Motor winding type is marked by light red, green, and blue colors corresponding to U-, V-, and W-phase windings, respectively. The stator and rotor core materials are made of 50A350 steel sheet. It has a thickness of 0.5 mm and a joule loss of 350 W with saturation magnetization at 1633 kA/m. The steel sheet density is assumed constant at 7.65 g/m3, and the values of Young’s modulus and Poisson’s ratio are 210,000 MPa and 0.3, respectively. The thermal conductivity of the material is 0.02614 W/(m per °C) with a specific heat constant value of 1.007 kJ/(kg per °C). The motor shaft is made of S45C soft magnetic material manufactured by JSOL. The resistivity and density constants of the material are 2.7 × 10⁻⁷ Ωm and 7800 kg/m3, whereas the Young’s modulus and Poisson’s ratio are 202,200 MPa and 0.31, respectively.
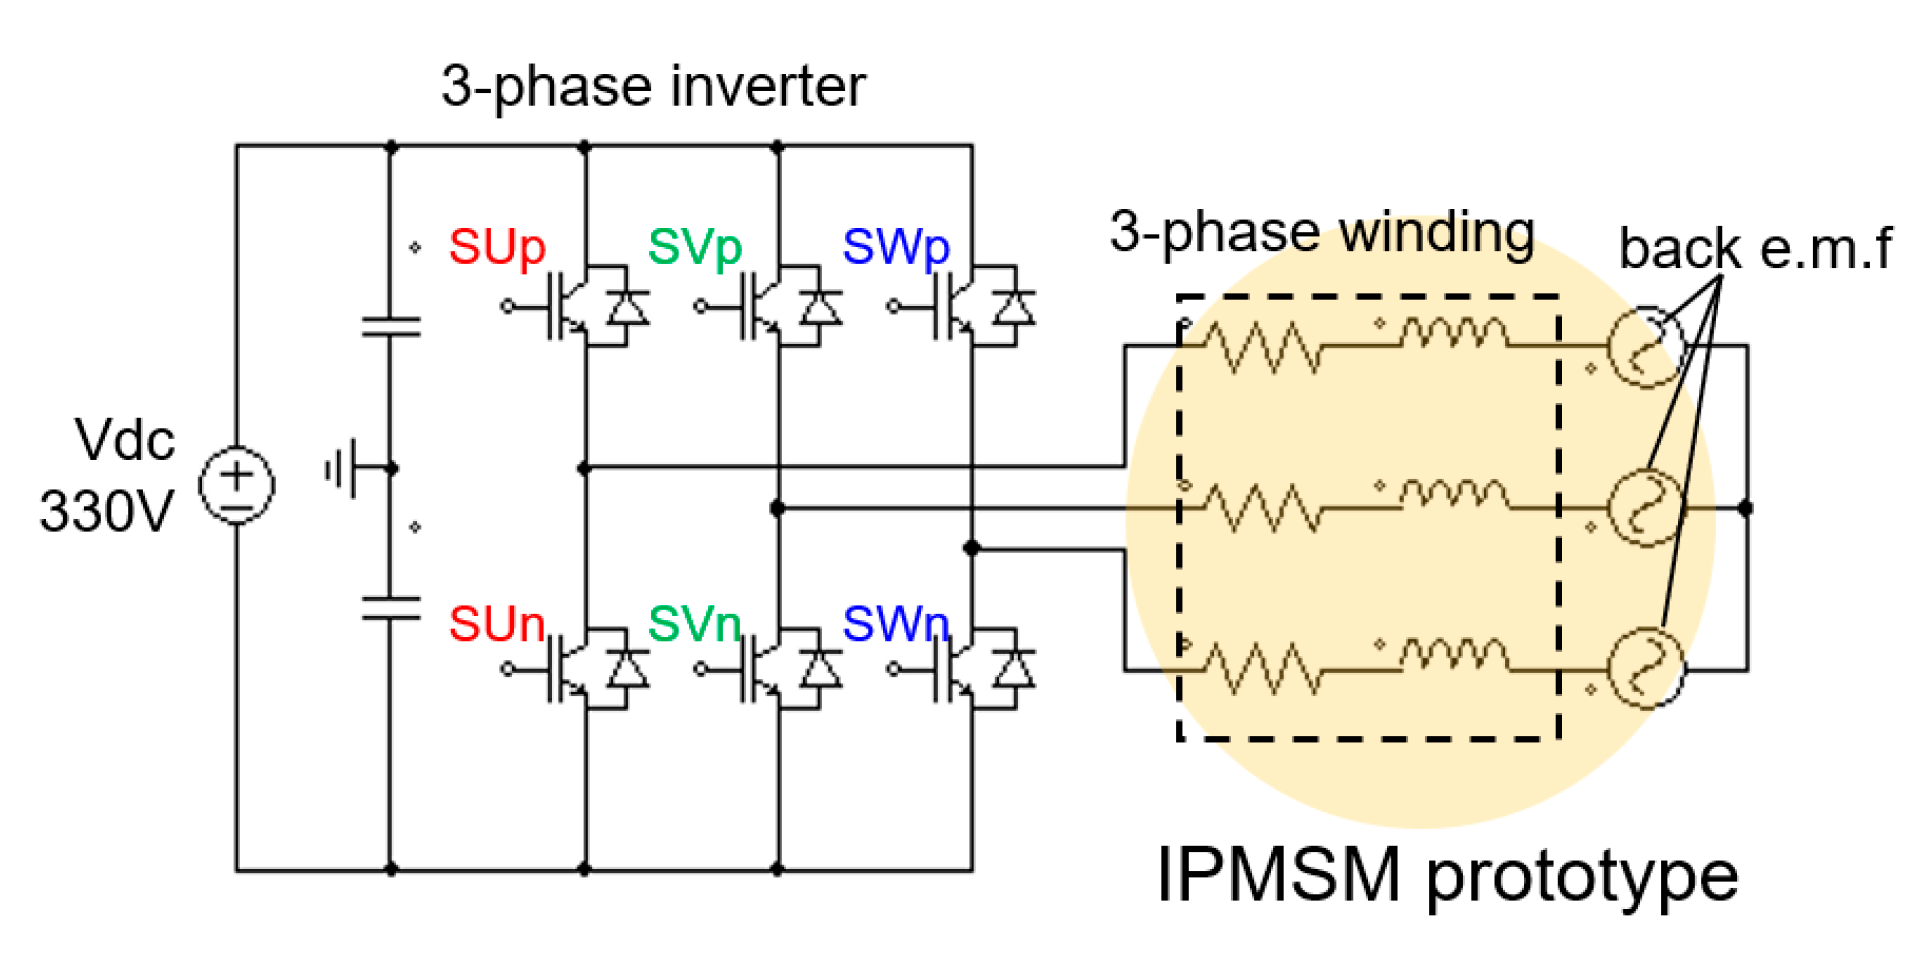
A 3-phase voltage source inverter (VSI) is used to supply the IPM motor. The illustration of the VSI circuit is shown in Figure 3. The red, green, and blue switches represent the U, V, and W phases, and the equivalent circuit is represented by the yellow circle with the back e.m.f. component. The dots found near capacitors, resistors, inductors, and back e.m.f. illustrate the positive polarity of the components.

2.2. IPM Motor Equation

The conventional IPM motor voltage equation in the two-phase rotating d-q reference frame is shown in Equation (1) [33],
v d v q = R a + p L d P n ω m L q P n ω m L d R a + p L q i d i q + 0 P n ω m ψ a
In the given voltage equation, the variables v d   and v q represent the d- and q-axis components of the stator terminal voltage, while i d and i q represent the d- and q-axis components of the armature current. The term ψ a is defined as the square root of (3/2) multiplied by ψ p m , where ψ p m represents the maximum flux linkage per phase due to the permanent magnet (PM). L d and L q denote the components of the armature self-inductance. The variable p represents the derivative with respect to time, and P n   represents the number of pole pairs associated with the IPM motor. The parameter ω m corresponds to the mechanical speed of the rotor. It is assumed that the parameters in this voltage equation remain constant. Additionally, the torque generated by the IPM motor can be determined using Equation (2) [33], which accounts for both the torque of the permanent magnet (Tpm) and the reluctance torque (Tre). The id current supply for the conventional method, following the MTPA (maximum torque per ampere) trajectory, can be calculated using (3) [34].
T = P n ψ a i q + L d L q i d i q
i d = Ψ a 2 L q L d Ψ a 2 4 L q L d 2 + i q 2
Figure 4a,b show IPM motor equivalent circuits at steady-state conditions for both d and q axes. In this study, we focus on considering the only copper loss in winding and motor core as illustrated by resistance Ra (copper loss). The resistance is placed in a series connection with the power output of the IPM motor and flux linkage.
In the implementation and operation of motor control, specific limits for current and voltage supply are necessary. These limits are established based on the specifications of the inverter (VSI), as depicted in Equations (4) and (5) for current and voltage, respectively [34]. The variables I a and V a represent the input supply of a 3-phase current and voltage for the armature winding. To ensure safety and meet design requirements, the values of I a m p and V a m p are configured to be approximately 18 A and 380 V, respectively.
I a = i d 2 + i d 2 I a m p
V a = v d 2 + v d 2 V a m p

2.3. Proposed Vector Control of IPM Motor

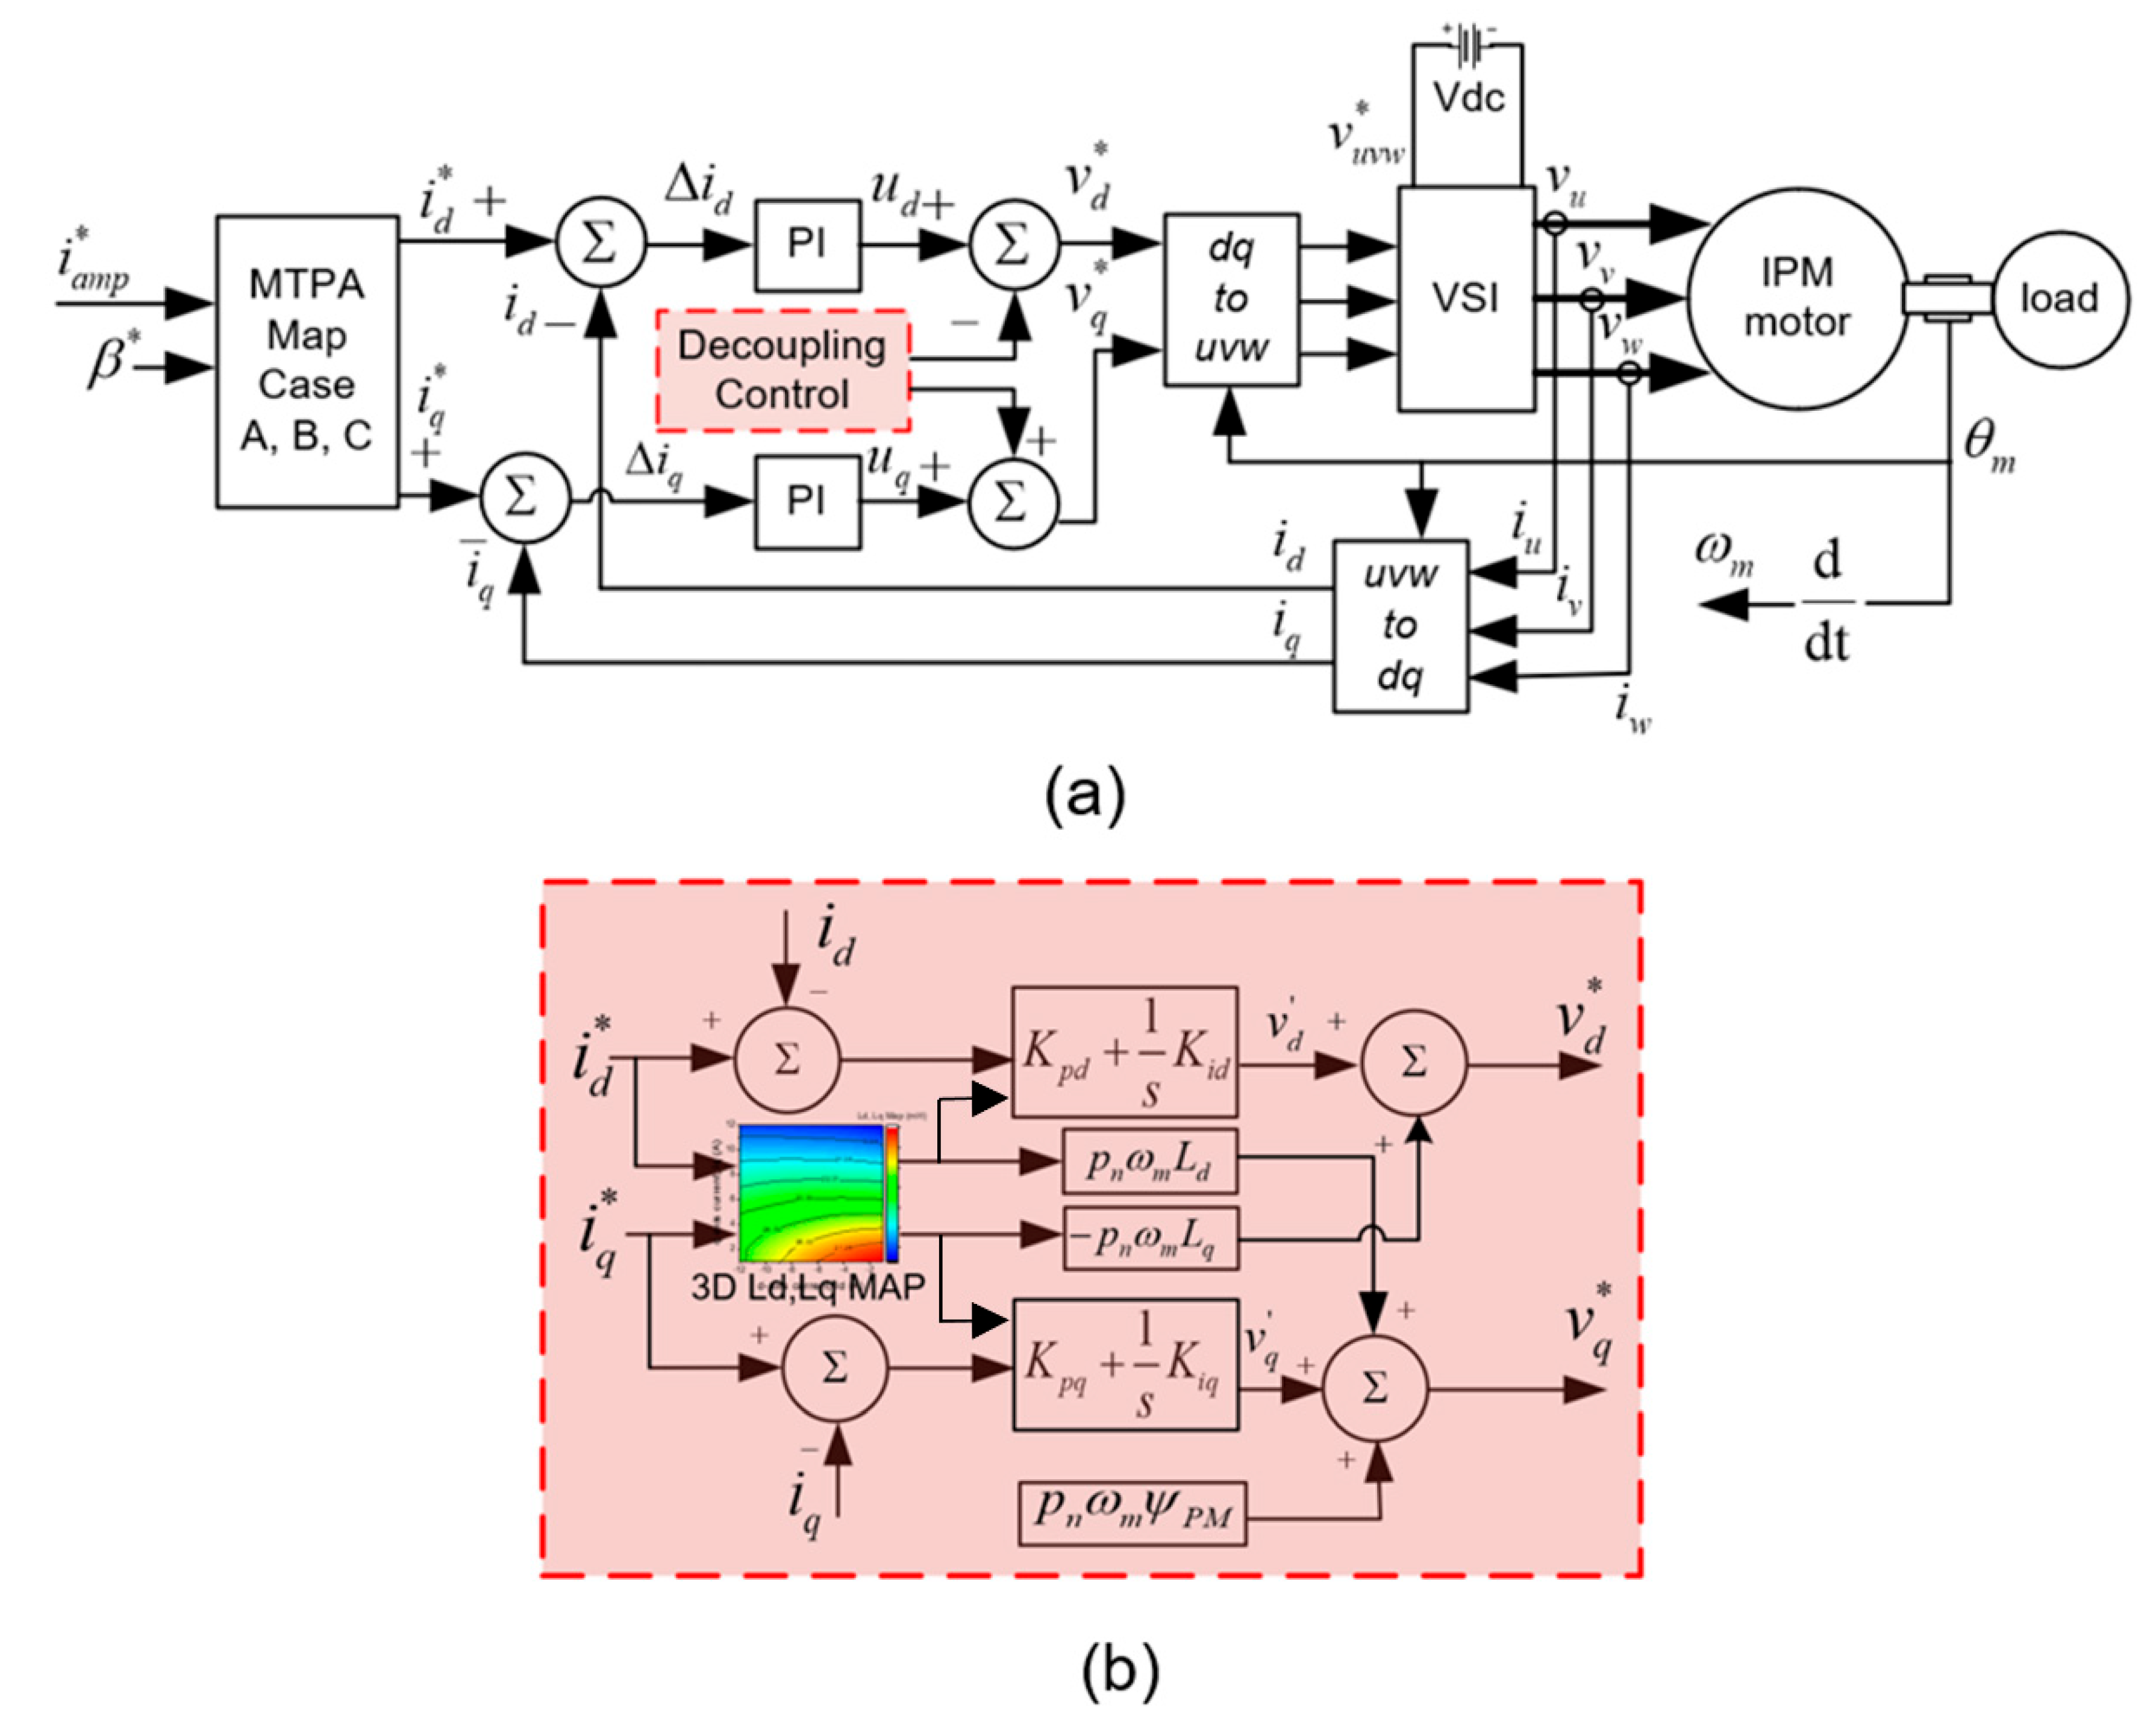
In this section, we present an explanation of the proposed vector control method to drive an IPM motor. The block diagram of the decoupling vector control of the IPM motor is depicted in Figure 5a. It demonstrates the principle of control algorithm which utilizes a PI regulator and a decoupling process. The d- and q-axis voltage commands are transformed into a 3-phase form, denoted as v u v w , which determines the switching signal of the VSI to control the motor. The detailed principle of the PI control utilized in this study is shown in Figure 5b. From this detailed PI current control, it is evident that both L d and L q play a significant role in controlling the output values in the decoupling current control. The current flowing in the uvw-axis, through the core winding, produces the armature winding. The generated armature flux is highly influenced by the inductance parameter’s value. By considering L d and L q as functions of the dq-current, the proposed control algorithm automatically considers the impact of cross-coupling magnetic saturation. Consequently, the values of the d- and q-axis currents controlled are dependent on v d and v q .
The presence of the cross-coupling effect results in a situation where the armature flux, ω L d i d and ω L q i q , contributes to the flux in the dq axes (1). The mismatch between the PI regulator, decoupling compensation, and motor model parameters significantly affects the efficiency of the output signal for motor control. By incorporating the influence of cross-coupling magnetic saturation in the proposed motor drive, it becomes possible to reduce the parameter mismatch between the controller and IPM motor caused by magnetic saturation. This leads to a closer alignment between the output characteristics and the ideal case.
Furthermore, from the block diagram also we could evaluate that the inductance values will directly impact the PI regulator of the current control. The effectiveness of the current loop output will depend on the inductance values. Therefore, during the magnetic saturation operation, the conventional method is unable to effectively perform the pole and zero cancelation. As a result, there will be an overshoot or undershoot during the transient time. In this drive system, the input of the current command is Iamp with a variation in beta. Nine cases of the control system were investigated. Then, nine scenarios of vector control combinations of inductance maps and current supply variations of β 0°, 45°, and MTPA were investigated.

3. Finite Element Model Analysis of IPM Motor

This section explains the finite element model analysis of the proposed IPM motor. The explanation starts with the electromagnetic analysis of the prototype, followed by the magnetic flux density profile and the NT and IT characteristics. Moreover, the details of the proposed 3D inductance maps are also included in this section.

3.1. Electromagnetic Analysis of Prototype IPM Motor

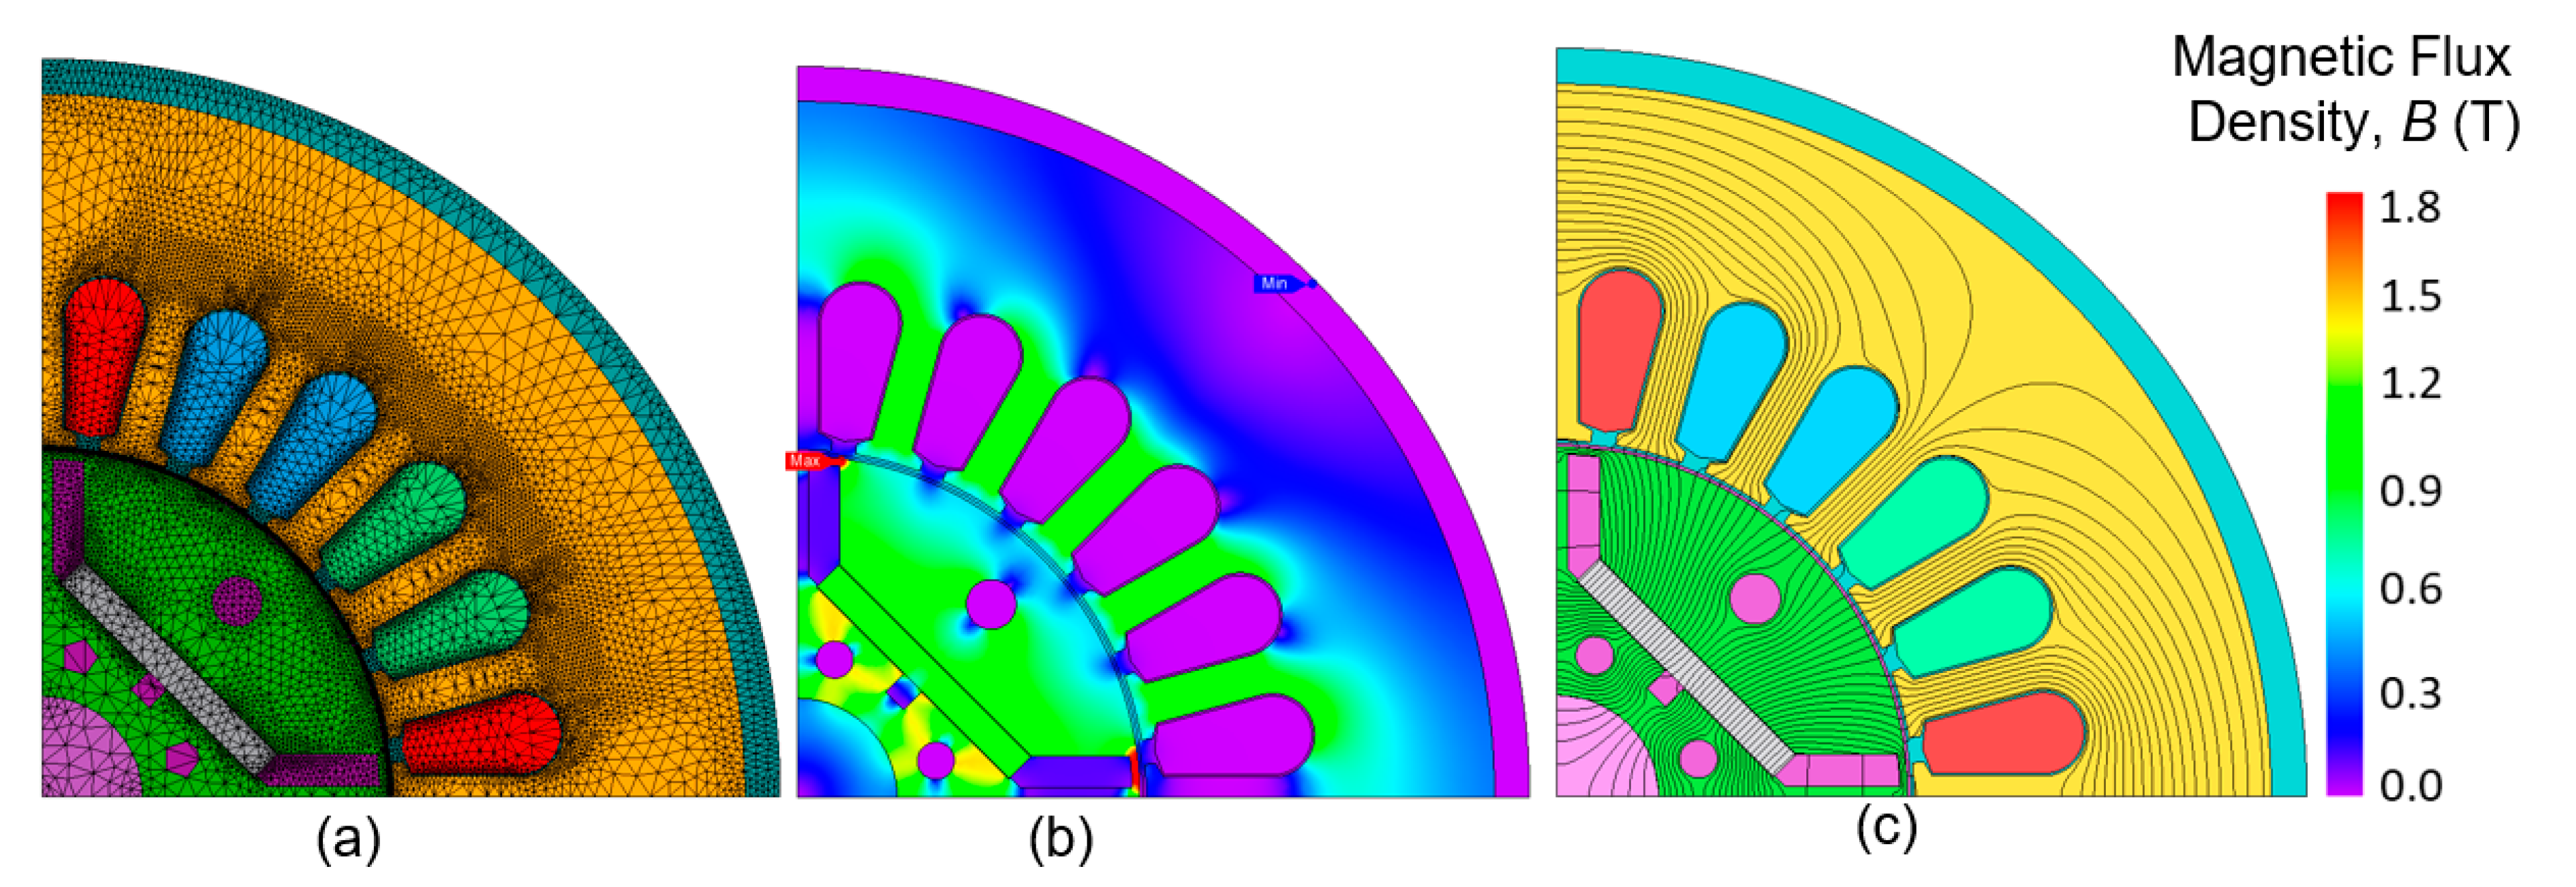
Figure 6 illustrates the electromagnetic analysis of the IPM motor prototype for no-load back e.m.f. at rotating speed N 1800 r/min. The mesh analysis used within the finite element motor model (FEM) is shown in Figure 6a. The mesh size and quality used in this electromagnetic analysis varied from 0.1 to 1.0 mm with the dominant size of 0.8–0.9 mm for the stator and rotor cores and 0.2–0.3 for the airgap, which results in the D-model in the total number of 22,055 elements and 11,745 nodes with the minimum, maximum, and average sizes of 0.0468715 mm, 0.997835 mm, and 0.729695 mm, respectively.
As can be seen, the mesh size near the airgap or in the airgap itself is much smaller compared to the mesh of stator and rotor cores. The purpose is to capture the magnetic flux during FEA. Due to its symmetrical configuration, the D-model of the IPM motor prototype was used in the electromagnetic analysis to shorten the calculation and processing time. The calculation itself was conducted by a workstation (PC) with detailed specifications of the PC as follows: the processor Intel® Xeon® CPU E5-2667 v3 @ 3.20 GHz, 3201 MHz, with eight cores, eight logical processors, and a RAM of 256 GB. Furthermore, the magnetic flux density analysis contour plot with a maximum of 1.8 T is depicted in Figure 6b. At N 1800 r/min and under the no-load condition, the magnetic flux is generated from the PM flux only. As a result, the value was no more than 1.2 T which is the residual value of the PM. The flux line used to illustrate the flux direction is shown in Figure 6c. A 30-line setting is used to depict the density of the flux linkage of the prototype of the IPM motor in the electromagnetic analysis.
Electromagnetic analysis in IPM motors is essential to understand the behavior of the motor during operation. One of the critical phenomena that can affect the performance of the motor is magnetic saturation, which occurs when the magnetic field strength exceeds the saturation limit of the motor’s magnetic material. During magnetic saturation, the motor’s magnetic properties change, which can result in a non-linear behavior and loss of performance. The cross-coupling effect is another phenomenon that can occur during magnetic saturation in IPM motors. This effect happens when the magnetic field in one direction affects the magnetic field in another, which can lead to an increase in torque ripple and a decrease in motor efficiency. Due to a 3D model of the IPM motor that we used, no leakage flux from coil end is considered in our study results.
FEA is used to analyze the electromagnetic behavior during magnetic saturation and to investigate its cross-coupling effect. The magnetic field distribution, magnetic flux density, and electromagnetic forces within the motor can be calculated for different operating conditions, including magnetic saturation and cross-coupling effect, using FEA. The FEA results can be used to optimize the motor’s design and improve its performance.

3.2. Magnetic Flux Density Profile of Prototype IPM Motor

In this section, an example of the magnetic flux density profile of the IPM motor is explained. In a finite element analysis (FEA) simulation of an electromagnetic system, the magnetic flux density is a critical parameter often calculated and analyzed. Magnetic flux density refers to the strength of the magnetic field at a specific point in space, and it is typically measured in units of tesla (T) or gauss (G). The FEA simulation calculates the magnetic flux density distribution in the electromagnetic system based on the system’s geometry, materials, and operating conditions. The magnetic flux density distribution can provide insights into the system’s behavior, such as the location and strength of magnetic field concentrations, the level of magnetic saturation, and the impact of eddy currents. In an IPM motor, the magnetic flux density is significant because it directly affects its performance. The magnetic flux density distribution in the motor determines the torque produced by the motor and the losses due to eddy currents and hysteresis.
The FEA simulation results of the magnetic flux density distribution for the prototype IPM motor can be seen in Figure 7. The magnetic flux density profile under a current magnitude of 21 A with four β variations is clearly illustrated in Figure 7a,b. The magnetic flux density under the high-output torque motoring conditions with β 0°, 30°, and 60° is shown in Figure 7a. Whereas in Figure 7b, the profile under a low torque output with β 90° or Iq 0 A is illustrated. The scale for magnetic flux density B was set between 1.0 and 1.2 T. As illustrated in Figure 7a, more saturation occurred in the stator core with β 0° compare to other beta values.

3.3. IT and NT Characteristics of Proposed IPM Motor

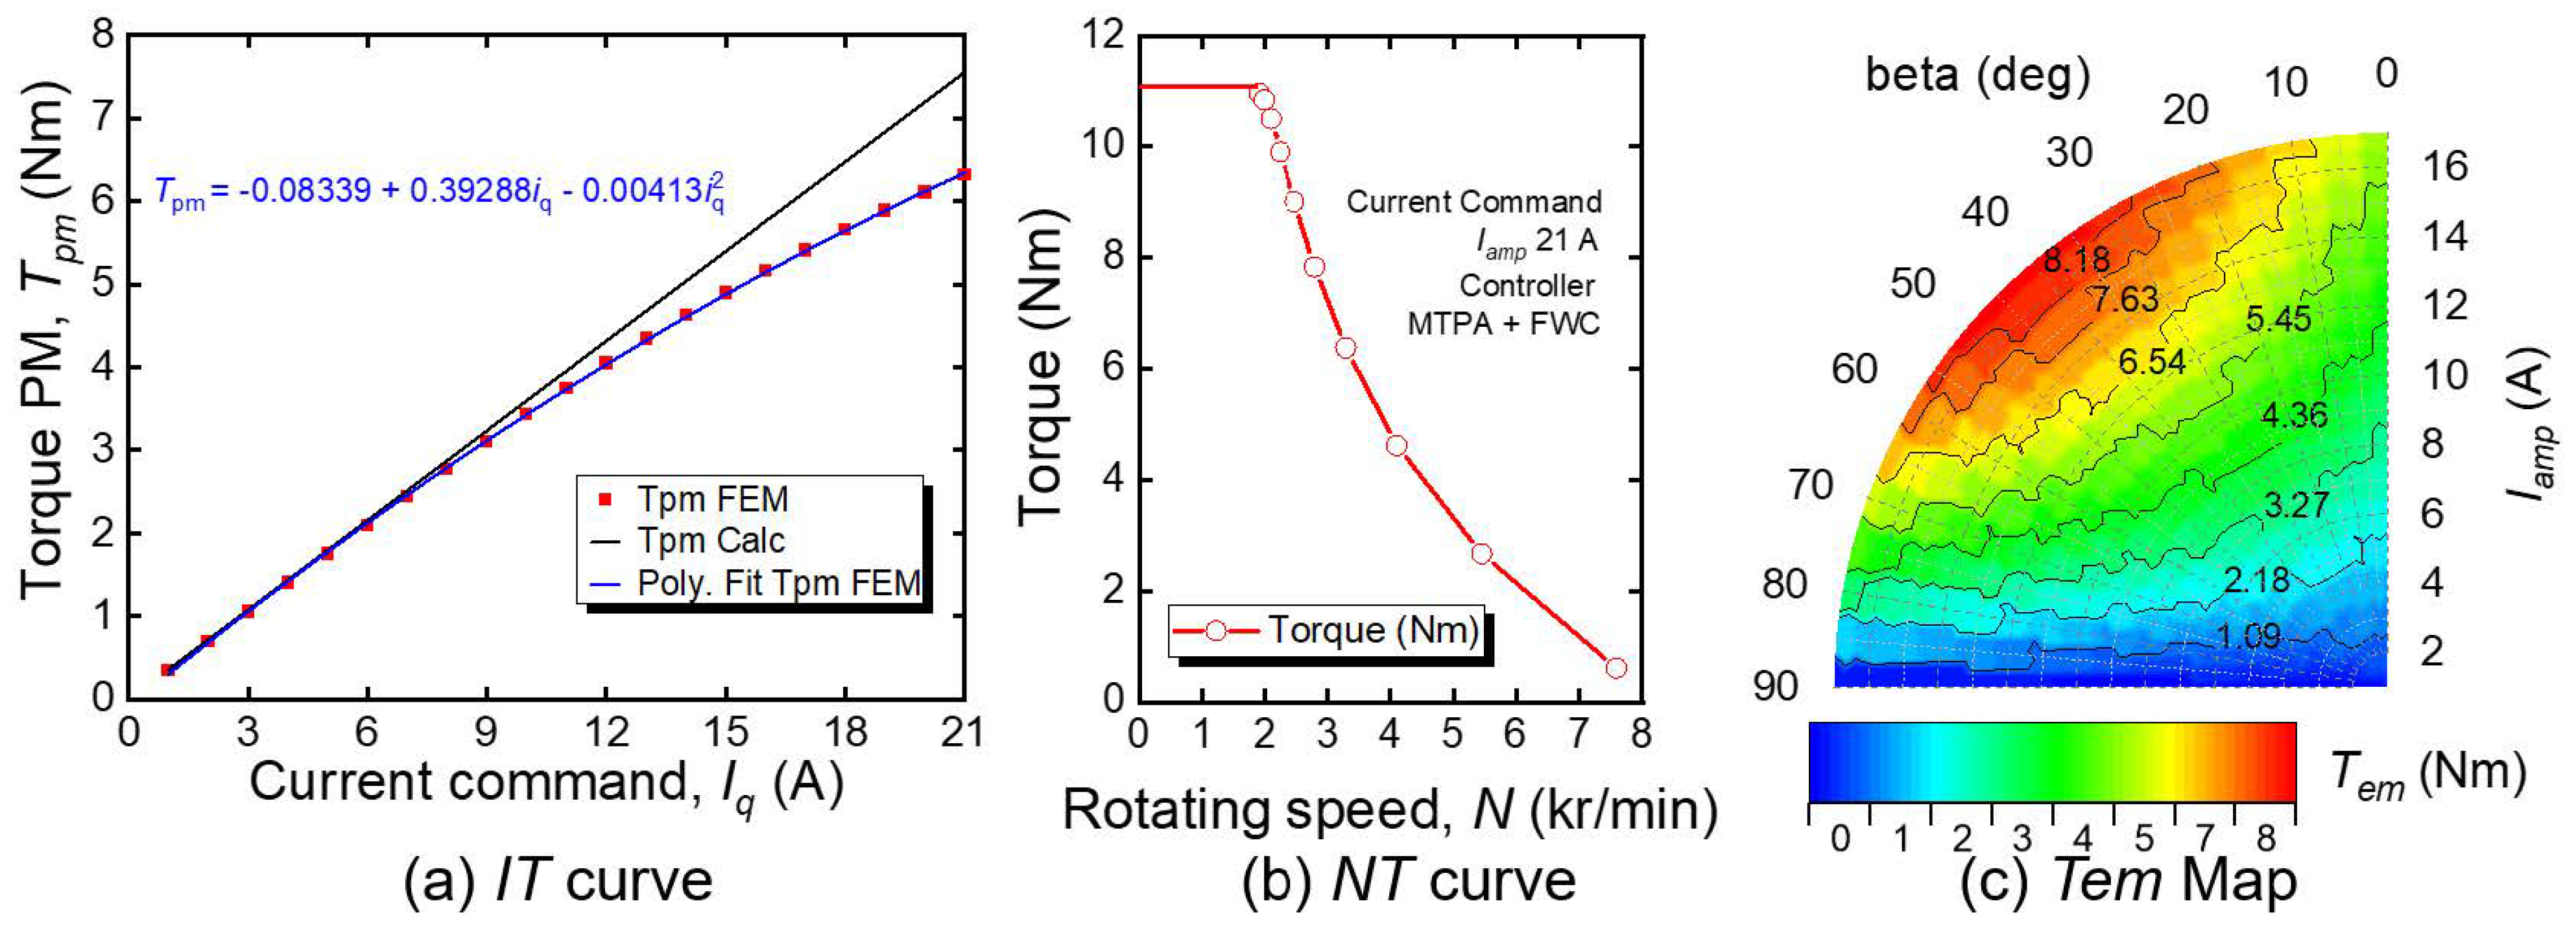
The IT and NT curves of an IPM motor are used to characterize the motor’s performance and operating limits. The IT curve shows the relationship between the motor’s torque and the current supplied to the motor, as illustrated in Figure 8a. The IT curve shows the characteristic of PM torque as a function of current command at β 0° or Id 0 A. The black line illustrates the ideal calculated PM torque output, whereas the red square and blue line illustrate the FEM PM torque and its polynomial fit with the quadratic function. As can be seen, the magnetic saturation phenomenon is occurring because of the current command of 9 A. The error between the ideal PM torque and FEA PM torque increases as the current increases. The proposed 3D inductance maps in this study will address this phenomenon.
Furthermore, the NT curve shows the relationship between the motor’s speed and torque. For the current command of 21 A and under MTPA and field weakening control, the NT characteristic of the IPM prototype is illustrated in Figure 8b. As can be seen, the maximum speed is around 8000 r/min. The IT and NT curves are essential for understanding the performance and limitations of an IPM motor. The IT curve can be used to determine the current required to achieve a specific torque output. In contrast, the NT curve can determine the maximum speed and torque the motor can produce under specific operating conditions. Figure 8c depicts the average torque output of the electromagnetic map as a function of the current command. The torque map illustrates the average electromagnetic torque output that will be generated by the IPM prototype. For the current command of 17 A, the highest output torque output is around 8.713 Nm. This value is achieved under MTPA control with a beta value of 45 deg. For a larger beta value, the output torque is lower due to a smaller value of Iq involved. However, at a lower beta value or Id 0 A, the output torque is not as high as the higher beta due to no reluctance torque is produced. The presence of reluctance torque seems feasible between beta 10° and 70° with the maximum at its MTPA trajectory line for each current command.

3.4. 3D-Inductance Maps

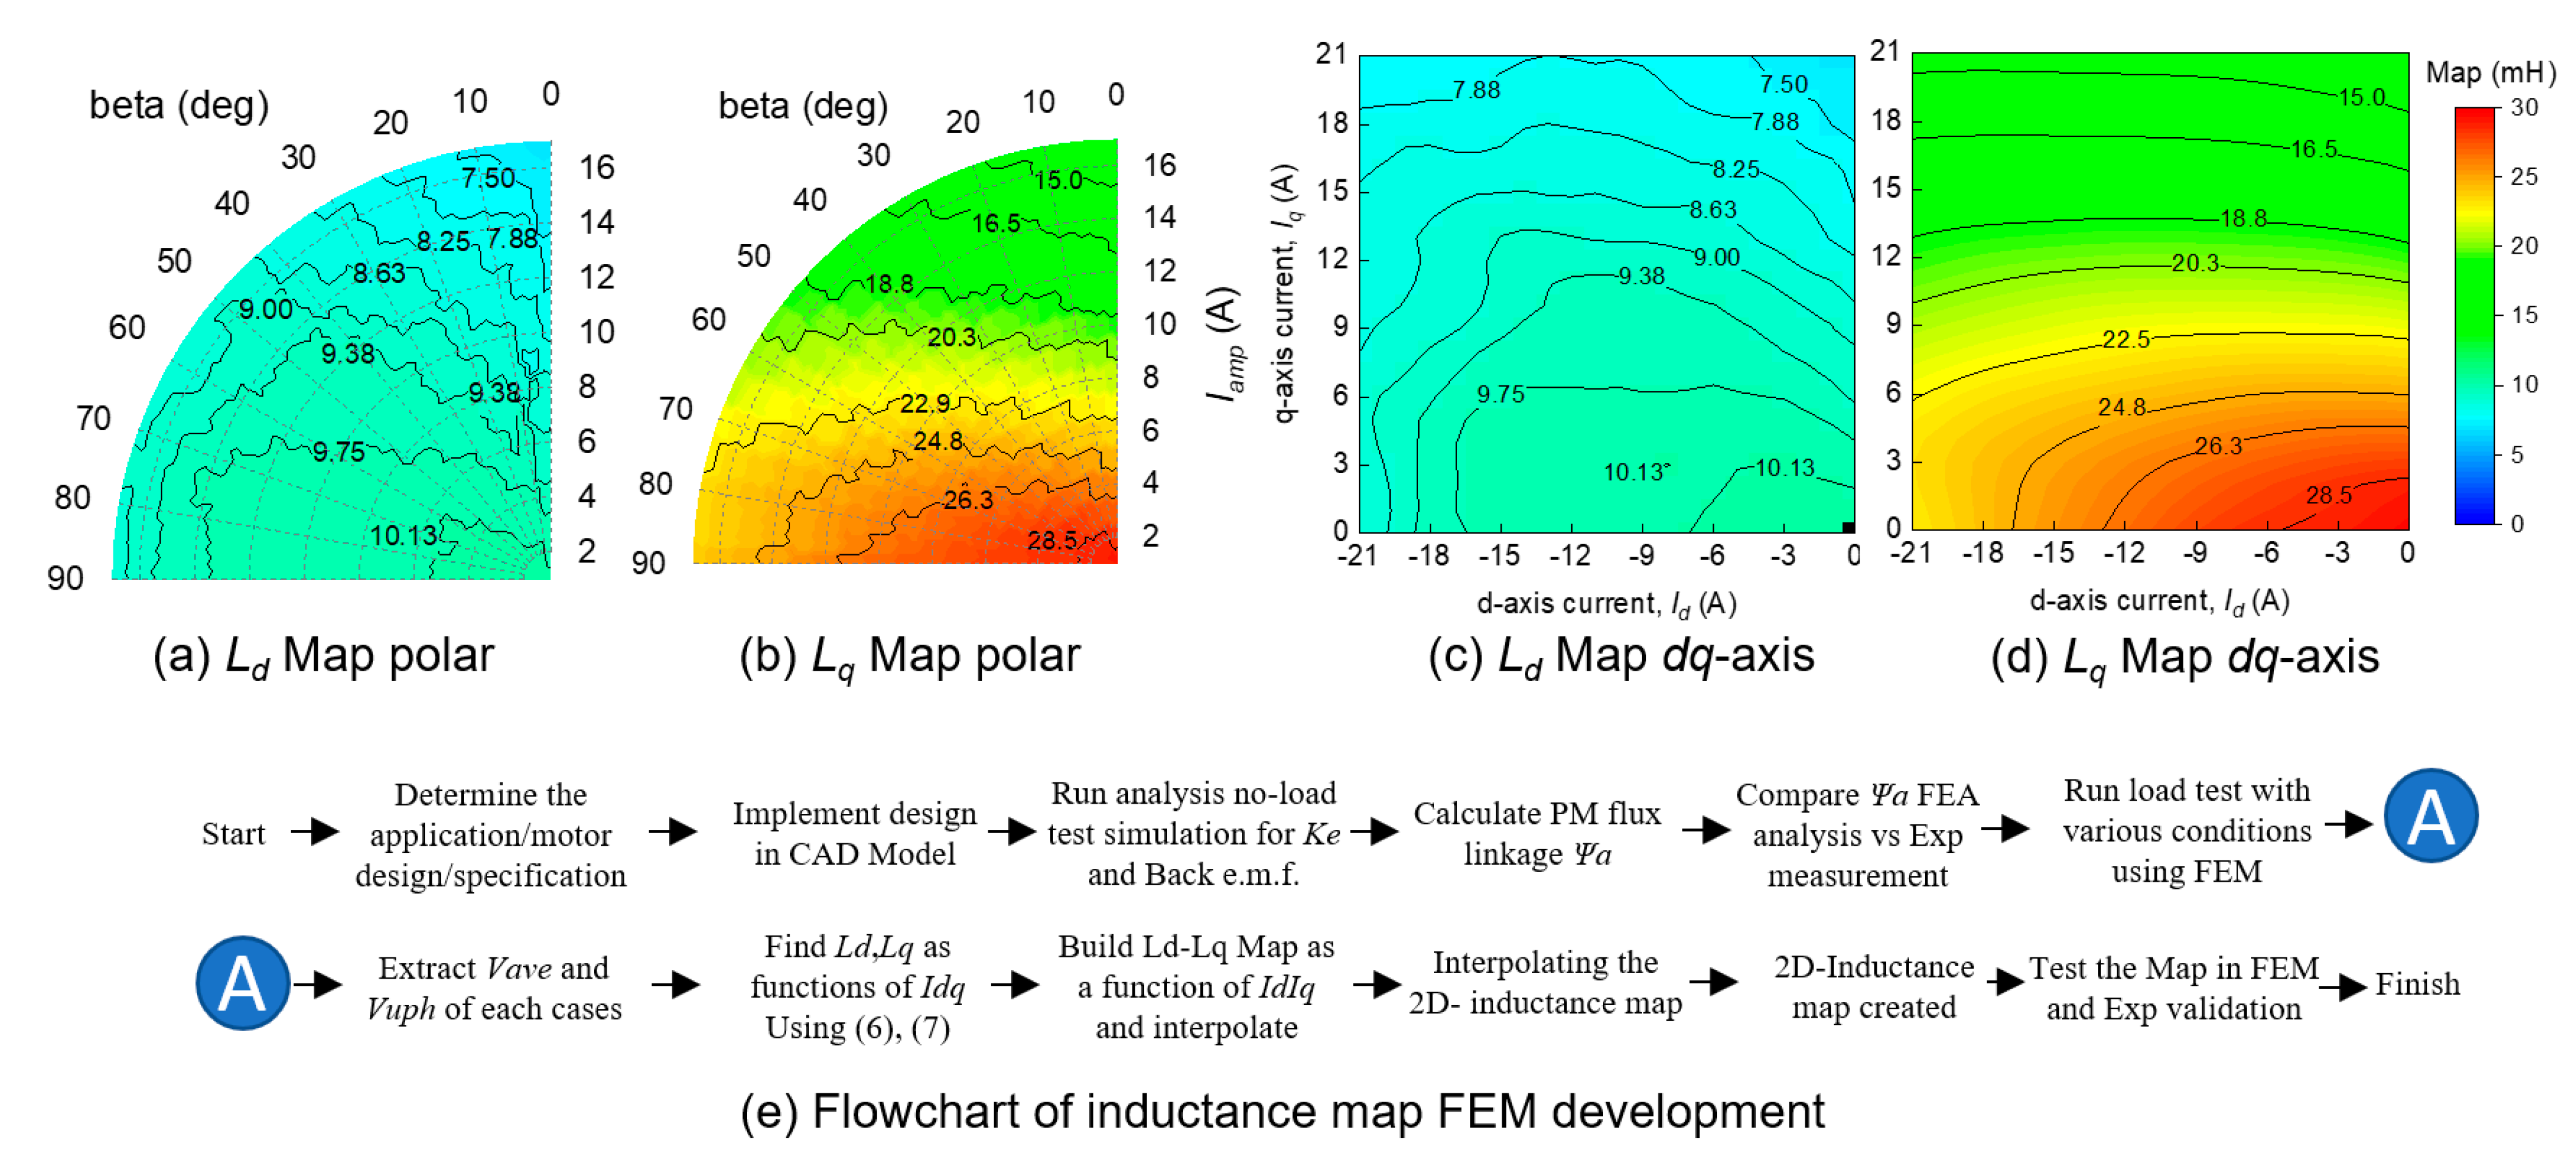
The FEM-based inductance map utilized in the drive system of the proposed IPM motor is illustrated in Figure 9. Both Ld and Lq maps are plotted on the dq-axes as a function of the dq-axis current. The inductance analysis values are calculated using (6) and (7) [32]. The trend for both inductance maps is as follows: as the q-axis current amplitude increases, each inductance map decreases. Furthermore, both maps share magnetic cross-coupling of the dq-axis current for the magnetic saturation phenomenon, yet the q-axis current contributes more compared to the d-axis current for the inductance variation. Figure 9a,b illustrate the inductance map in polar coordinates, whereas Figure 9c,d illustrate Ld and Lq inductance in dq-axis coordinates, respectively. The Lq value varies from double to up to triple Ld. The inductance map used in this study is achieved from the FEM based on rearranging the voltage equation and calculating the Ld and Lq by the fundamental component of the U-phase voltage at the steady-state condition.
The map utilized in this study is created using the flowchart shown in Figure 9e. The tuning process is as follows: first, motor design and specification are determined based on the motor application and built in the CAD software. The FEA is then conducted to find the no-load back e.m.f. and Ke. Then, PM flux linkage of FEA is calculated and compared with the measurement data. If the values match with an accuracy of 95%, then the FEA continues to the load condition with 323 cases to accommodate motor operation possibilities. Then load fundamental voltage and its phase are extracted to create the parameter map based on (6) and (7). A neural network approach is used to interpolate the 3D map. Finally, the effectiveness of the proposed map is tested to control the real motor.
L d = V q R a i q P n ω m ψ a P n ω m i d
L q = V d R a i d P n ω m i q
The true MTPA trajectory line considers the variation in inductance values due to magnetic saturation and is the trajectory line that produces the maximum torque for a given current input [26]. It is typically nonlinear and varies with the motor’s operating conditions, such as speed and current. When comparing the conventional MTPA control with the proposed MTPA control, there is a slight difference in the inductance value considering the magnetic saturation and motor operation [35]. Thus, a more accurate MTPA trajectory line is produced using the proposed MTPA control based on a lookup table of inductance values to calculate the torque output. It is more computationally intensive than the conventional MTPA control, but it results in a more accurate torque output, especially at high speeds and high currents. Based on this inductance map, the modified IPM voltage, torque, and MTPA trajectory Equations become (8), (9), and (10), respectively. An alternative method of MTPA control utilizing a FEM-based map was also reported in [36].
v d v q = R a + p L d i d i q P n ω m L q i d i q P n ω m L d i d i q R a + p L q i d i q i d i q + 0 P n ω m ψ a
T = P n ψ a i q + L d i d i q L q i d i q i d i q
i d , M T P A = Ψ a 2 L q i d i q L d i d i q Ψ a 2 4 L q i d i q L d i d i q 2 + i q 2

3.5. FEM Analysis of the IPM Motor

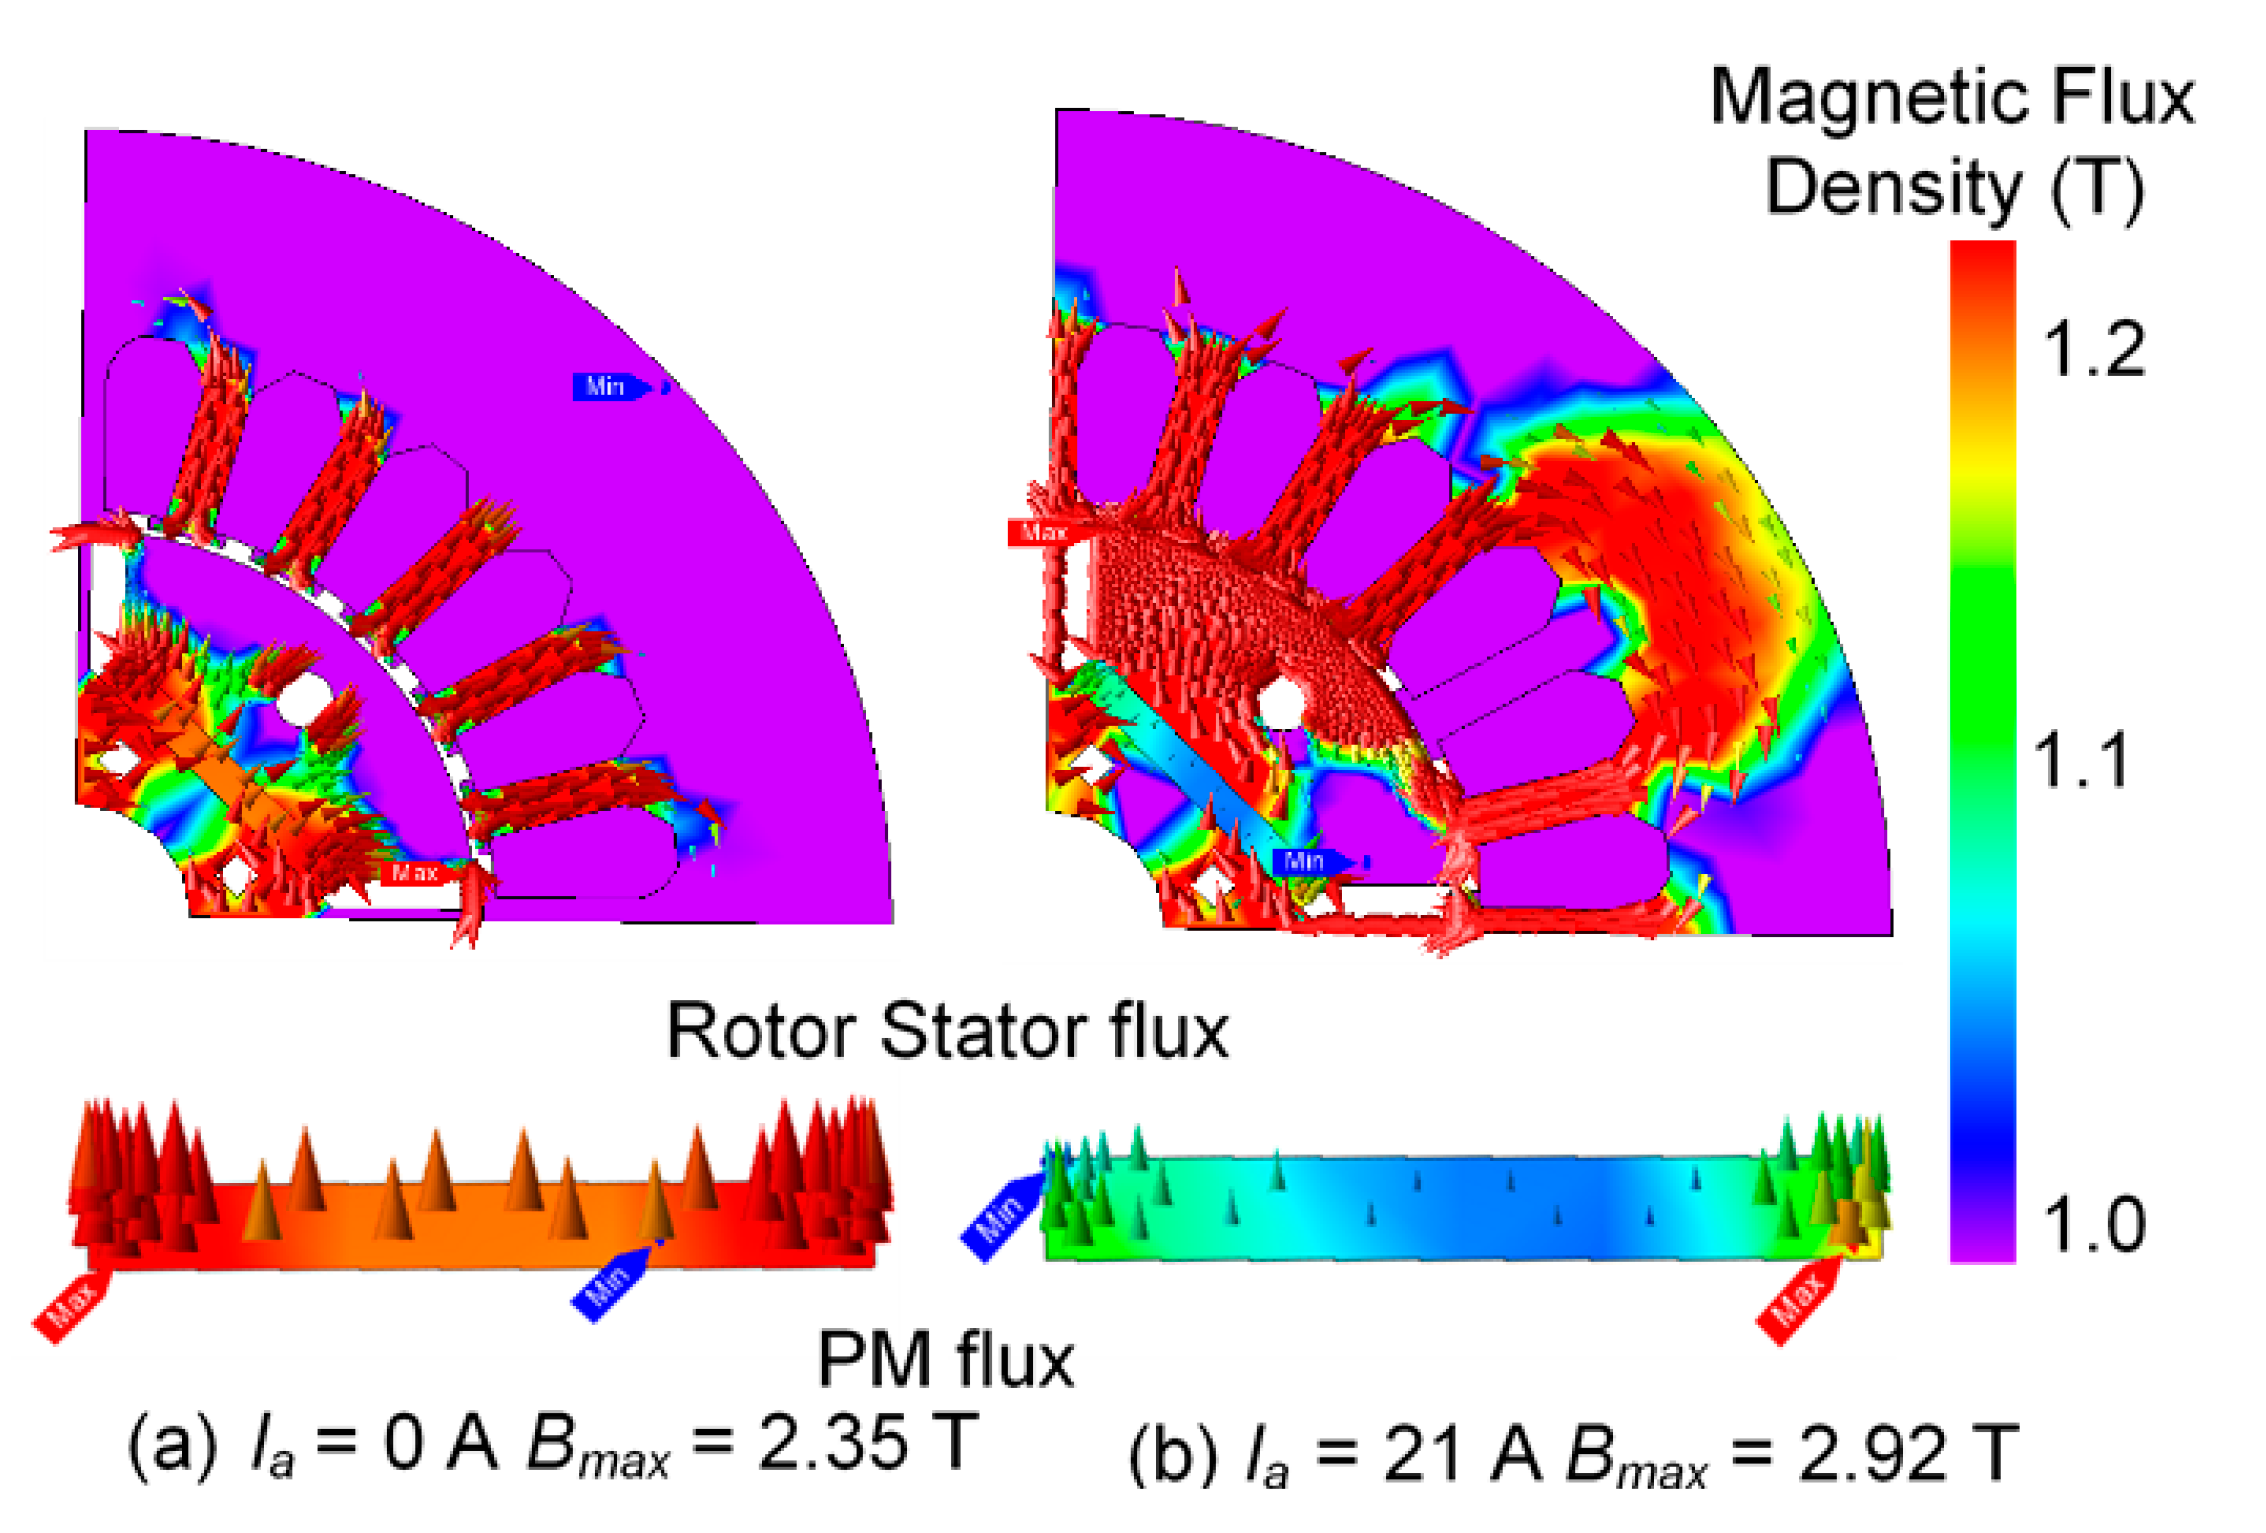
Figure 10 presents a contour plot of the magnetic flux density B for a D-model IPM motor under both the no-load and full-load conditions [13]. In Figure 10a, the contour plot of B under the no-load (Iamp = 0 A) condition reveals a maximum value of 2.35 T. It is illustrated clearly that under the no-load conditions, a high magnetic flux from the permanent magnet (PM) permeates the rotor and stator core radially, since no armature flux is being produced by the armature winding at this point. Conversely, during the full-load condition (Iamp = 21 A) illustrated in Figure 10b, a smaller amount of PM flux is able to penetrate the rotor and stator core. In this state, the maximum value of B at the rotor–stator core is 2.93 T, representing a difference of approximately 0.58 T from the no-load condition. Additionally, the contour and vector plots of B clearly demonstrate an increase in magnetic flux density, as they occupy nearly the entire area of the rotor–stator core with higher density.
The contour and vector plots of B provide evidence of magnetic saturation caused by variations in the three-phase current supply, i u v w . These changes in magnetizing current affect the magnetic field variation, H, in both the armature winding and PM. Initially, the PM flux density is high due to its strong magnetic field, HPM. However, as the supply current, Iamp, increases from 0 to 21 A, the PM flux density, B, decreases as the permeability of the stator and rotor core diminishes. This reduction in core permeability occurs when it reaches the saturation level. The phenomenon arises from the magnetic field generated by the armature winding, which opposes the PM magnetic field, HPM. Consequently, the PM magnetic field is reduced, resulting in a decrease in B from the PM. As the stator and rotor core become saturated, their permeability decreases significantly, making it more difficult for the PM magnetic flux to penetrate these cores. As the PM flux diminishes, the PM torque produced by the IPM motor also decreases.

4. Simulation Results

In this section, we present the simulation results of an IPM motor drive using JMAG, a finite element analysis tool. Initially, the motor model is simulated under the no-load condition. Once the back electromotive force (e.m.f.) profile is obtained, the simulation proceeds to the under-load condition. This study considers practical aspects such as space and time harmonics, as well as the magnetic saturation phenomena. This section focuses on discussing the no-load test, load test, and the maximum torque per ampere (MTPA) trajectory analysis of the D-model IPM motor.

4.1. No-Load Test Profile

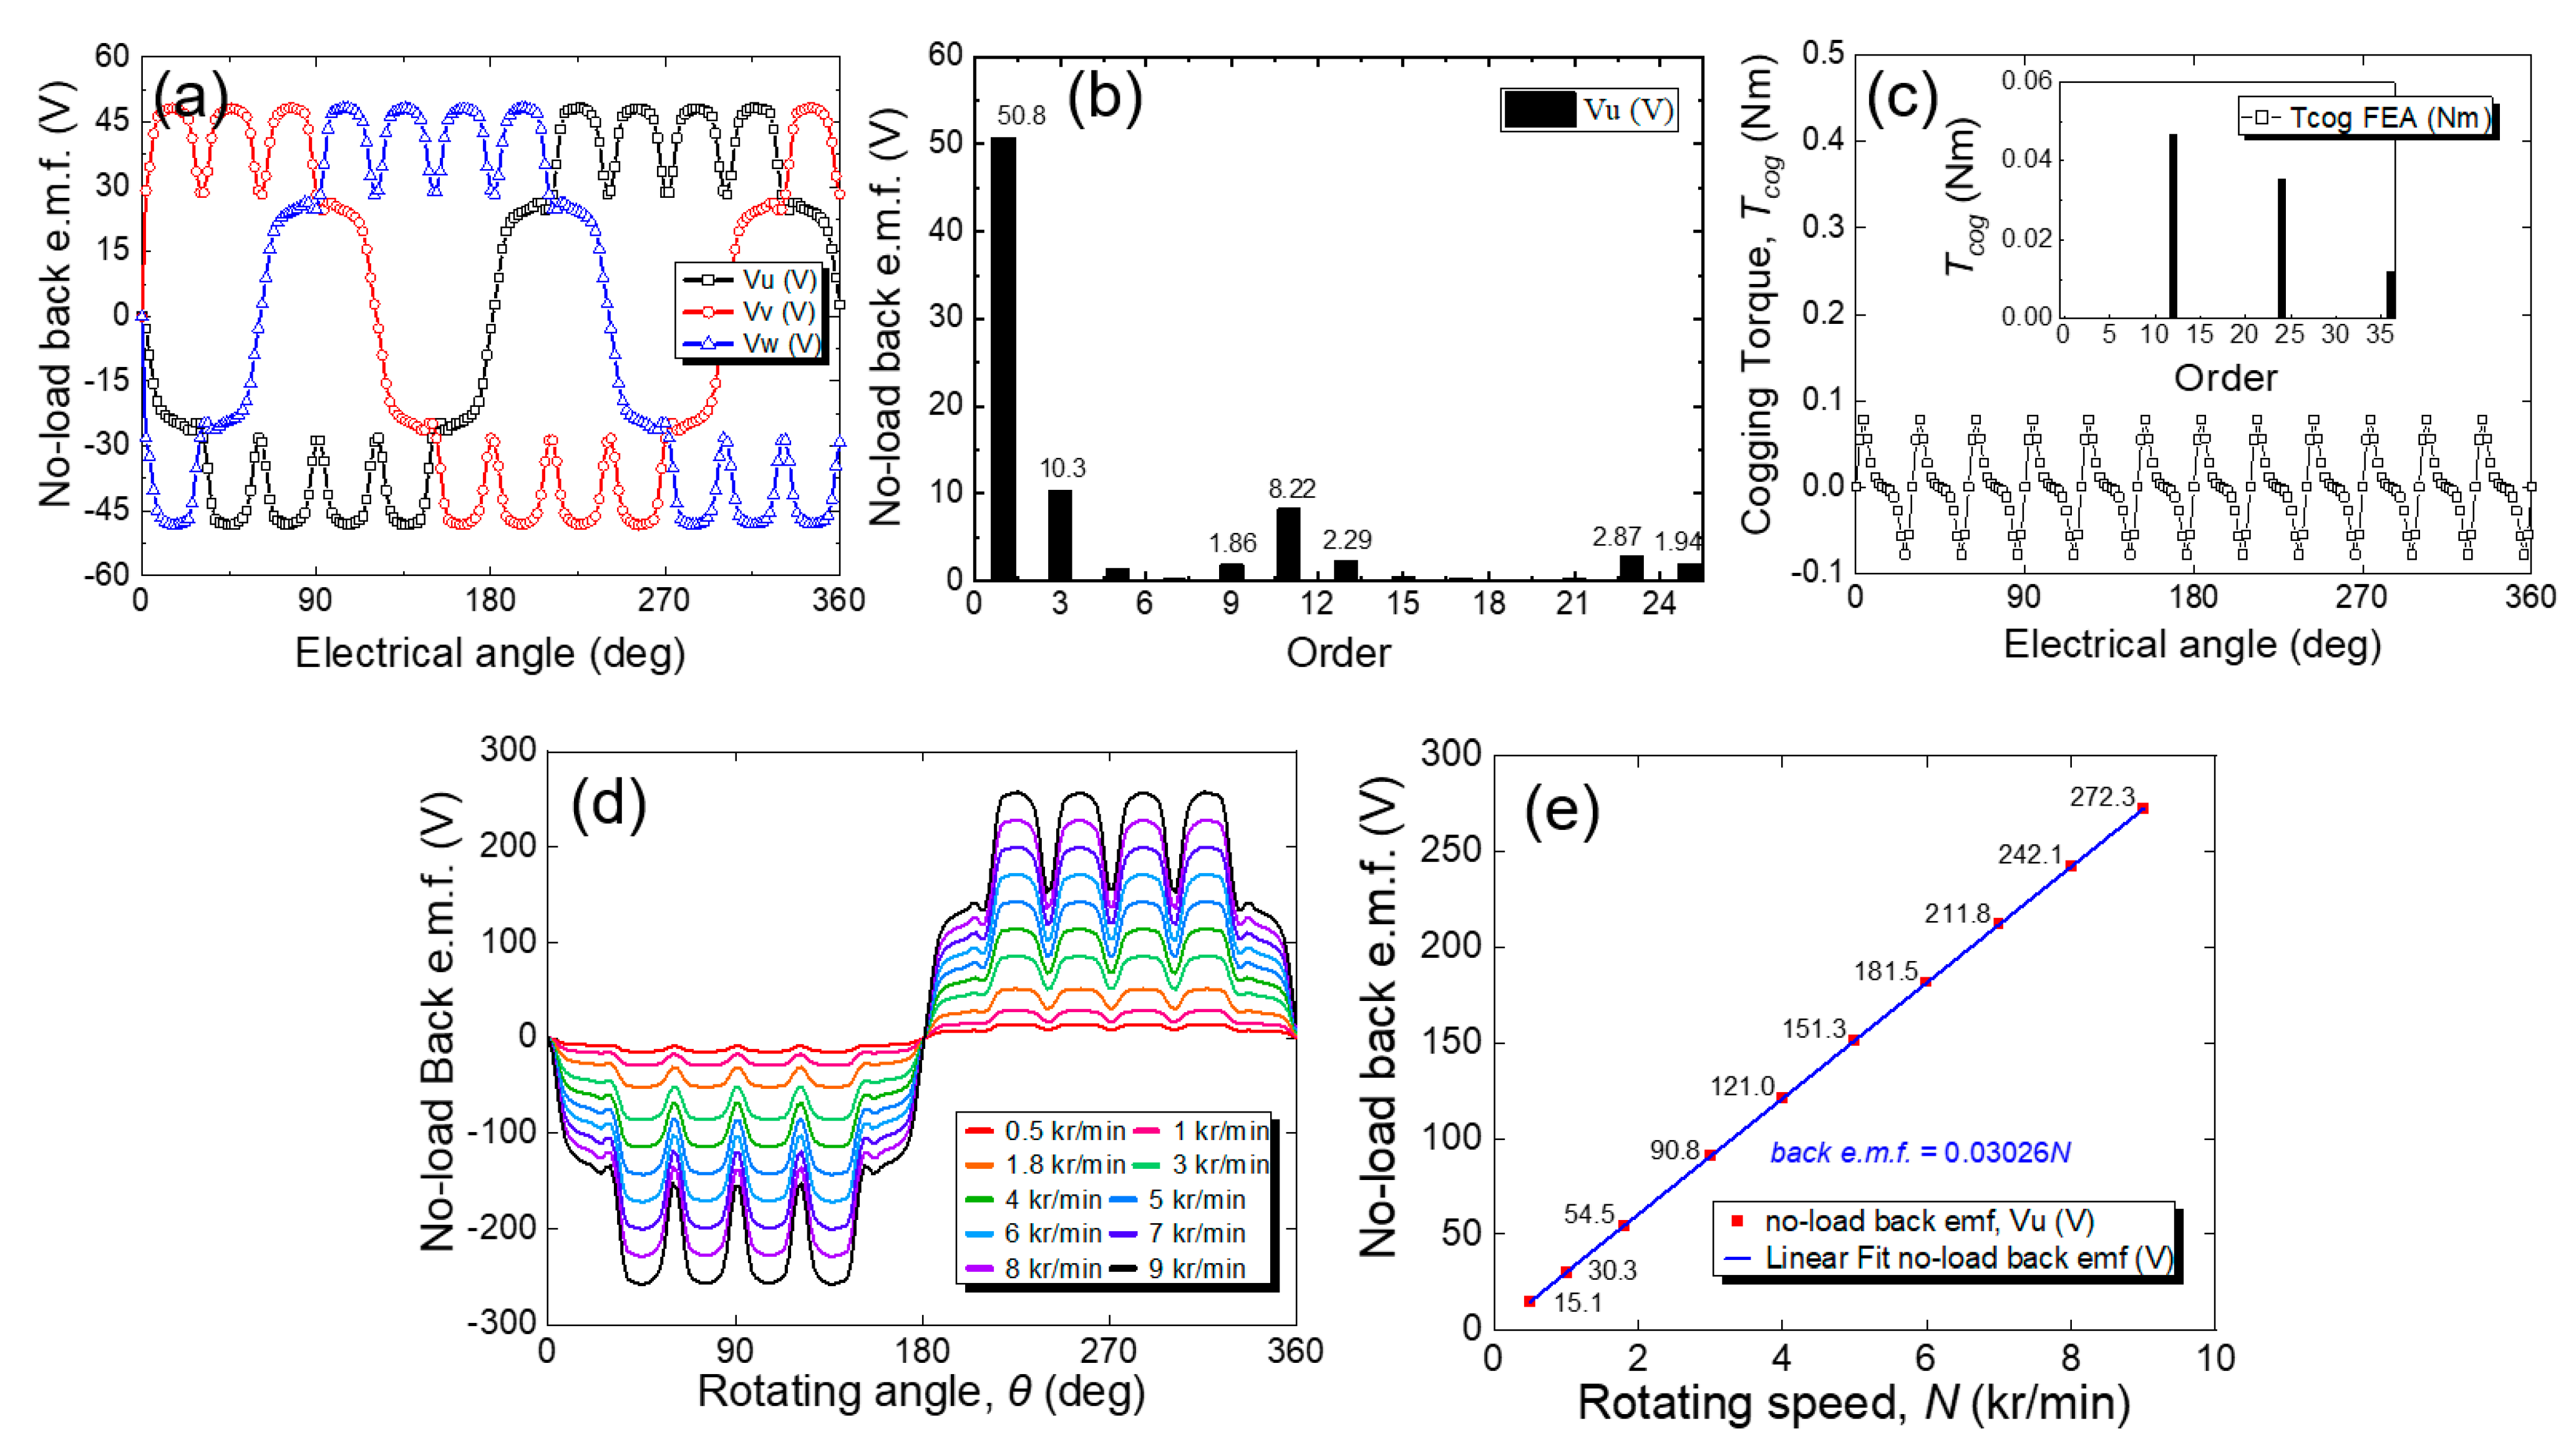
Figure 11a describes the results of the electromagnetic simulation of the three-phase no-load back e.m.f. under a rotating speed, N, of 1800 r/min, using the JMAG-Designer version 21.0.01zt software. The measured no-load back e.m.f. value and the phase angle are 50.8 V and 87 deg (initial condition of 0 deg), respectively. Consequently, the magnetic flux linkage measured under the no-load condition is solely produced by the PM flux linkage, denoted as ψ f . This flux linkage between the stator and rotor can be evaluated using Equations (11)–(13) [33]. The calculated value of the PM flux during the no-load condition is determined to be 0.167 Wb. This value is utilized in the torque calculation generated by the motor model in a later section.
back   e . m . f .   V = ψ f   Wb ω e rad s
ψ a = 3 2 ψ f   Wb
ω e = ω m P n   rad s
The presence of a space harmonic is determined by the motor design. In the proposed IPM motor model, there are 12 winding slots for each magnetic pole pair. As a result, there are 12 mechanical periods for each electric period, as illustrated in Figure 11a. This fact contributes to the ripple observed in the no-load back e.m.f. as illustrated both in the waveform and the FFT analysis results. In Figure 11b, the fundamental component of the U-phase back e.m.f. is measured at 50.8 V. Figure 11c reveals the cogging torque results where the peak-to-peak value is determined to be 0.16 Nm. The cogging torque displayed noticeable energy in the twelve harmonics and their multiplication. Cogging torque occurs due to the interaction between the rotor magnets and stator teeth. It can be a significant source of vibration and noise in motors, so it is important to simulate and analyze it in motor design.
The impact of the rotational speed on the no-load back e.m.f. follows a linear relationship, as depicted in Figure 11d for the waveform and Figure 11e for the peak value of the fundamental frequency component in the FFT analysis. For an IPM motor, back e.m.f. is generated as the rotor containing PM rotates within the magnetic field of the stator. It opposes the applied voltage, and its magnitude is proportional to the motor speed. In the no-load condition, where the motor operates without any external load, the back e.m.f. is the only voltage present in the circuit. Consequently, the plot exhibits a linear relationship between the back e.m.f. voltage and the rotor speed, as shown in Figure 11e. The slope of the plot is influenced by motor parameters, such as the number of turns in the windings and the strength of the magnetic field.
Furthermore, harmonics are observed at the third, fifth, nineth, eleventh, thirteenth, twenty-third and twenty-fifth order. Among them, the third-order harmonic contributes the most, followed by the eleventh, twenty-third, thirteenth, and twenty-fifth with a magnitude of 10.3, 8.22, 2.87, 2.29, and 1.94 V, respectively. Although the space harmonics, due to mechanical configuration, have a major contribution in the twelfth order, the contribution of the twelfth and twenty-fourth harmonic component values are reduced considerably due to the multiples of the third harmonic component.

4.2. Load Test Profile

In the load test simulation, the phase and frequency values of the power supply source in the electric circuit simulation are derived from the no-load profile. The control parameters utilized in the simulation are described in Table 2. Proposed 3D inductance map also utilized in the PI regulator gain. The load test consists of nine different cases, involving a combination of current command profile variations and parameter map scenarios. These scenarios include the absence of a map, the presence of an average map, and the presence of a full map. To achieve these conditions, the current controller algorithm incorporates both constant and variable L d and L q parameters. Nine scenarios of vector control combinations are investigated, including inductance maps and current supply variations in β 0°, 45°, and MTPA conditions. The aim is to assess the transient response improvement for each scenario, considering the impact of magnetic saturation on motor parameters. Additionally, variations in the current reference value are applied to evaluate the robustness of the vector control approach. The map scenario involves the utilization of the L d and L q map in the PI controller and the decoupling calculation for the simulation controller.
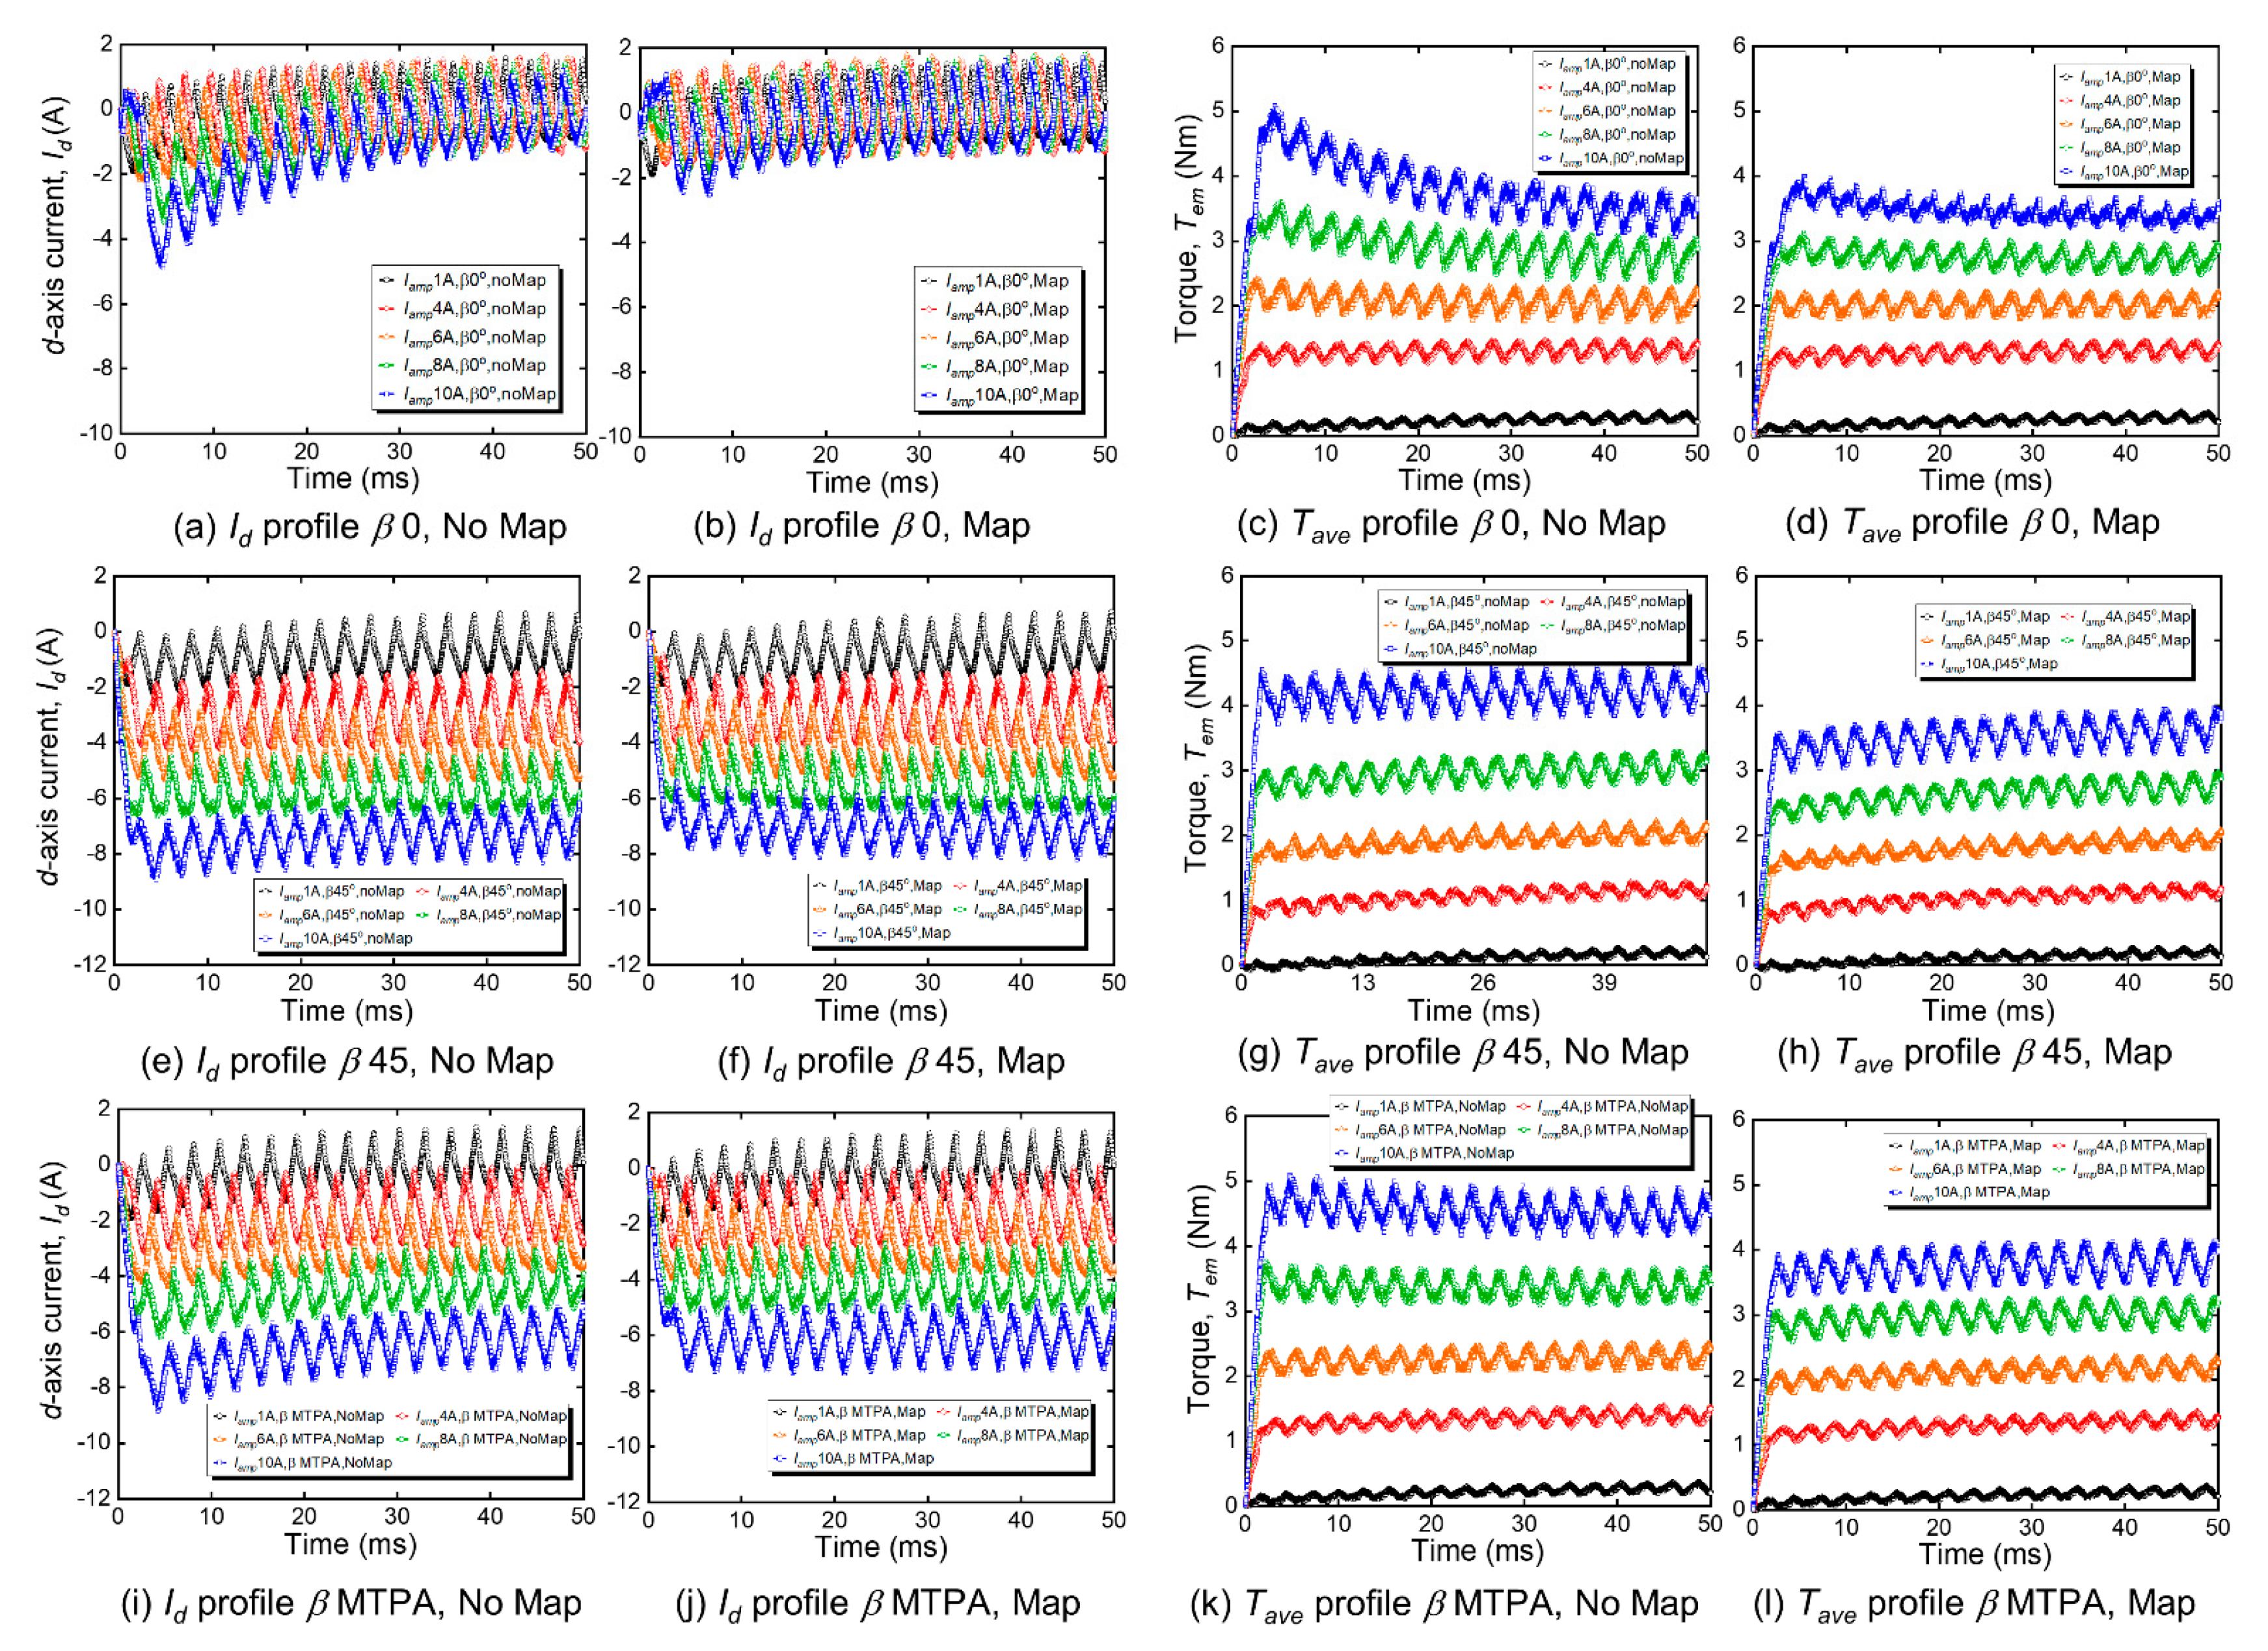
Figure 12 illustrates the load test profile of the proposed vector control for the prototype of the IPM motor. Five current command amplitudes were applied to evaluate the robustness of the algorithm, including 1, 4, 6, 8, and 10 A. These five current commands were then applied to the current control algorithm with no map or a constant inductance parameter, with an average map or a constant value for the average map, and with a full map or dynamic inductance parameter values. The current response and torque output of the FEM simulation were then evaluated for each case of β 0°, 45°, and MTPA. For the case of β 0°, the simulation results are illustrated in Figure 12a–d. There is a transient response improvement that occurs as the parameter map is utilized. The undershoot and overshoot were reduced due to a smaller mismatch between the controller and motor parameters during the motor operation.
Correspondingly, in the cases of β 45° and β MTPA, there is also a transient improvement of the current and torque response due to the 3D inductance map utilization as illustrated by the blue waveform for the current in Figure 12e–h and Figure 12i–l, respectively. The improvement of the current and torque response seems significant, as the IPM motor operates in the magnetic saturation condition or at a high current command. Under the magnetic saturation condition, the parameter mismatch occurs between the IPM motor and its controller.
Similarly, Figure 13 illustrates the torque and dq-axis current profile of the load test results with a torque command of β 0° or Id 0A. Five torque command values ranging from 1.0 Nm to 9.0 N were applied to the IPM motor model, as shown in Figure 13a,b. It was observed that the transient overshoot in the case of no map is more significant than that of the cases with the maps.
For the 9.0 Nm torque command, the maximum torque and torque ripple are measured as 14.396 Nm with 1.67 ripples for the case without the map and 10.508 Nm with 1.31 ripples for the case with the map, respectively. Consequently, this torque variation leads five different q-axis current commands. Using (2), the q-axis current commands are determined as 2.56, 7.69, 12.8, 17.9, and 23.1 A, as illustrated in Figure 13c,d. The dq-axis current profiles for the cases without the map and with the map are shown in Figure 13c,d. Both scenarios share a similar steady-state profile, which becomes stable after reaching approximately 30 ms. The FFT profiles for the steady state also show a similar pattern in both cases. The 12th and 24th components are categorized as the main contributors, with increasing trends corresponding to the torque command. As described earlier, this is caused by space harmonics. The average torque of cases a, b, and c at the 9.0 Nm torque reference is 7.07 Nm, 7.83 Nm, and 7.72 Nm with the main harmonic component for the torque ripple by the 24th harmonic order component with a value of 1.15 Nm, 0.97 Nm, and 0.98 Nm, respectively.
Similarly, the d-axis current exhibits an undershoot trend during the transient time, with an increase corresponding to the torque command. Figure 13c illustrates the waveform of the d-axis current in the case without the map, indicating a parameter mismatch between the current controller and motor plant during the transient time. This mismatch is reduced as the parameter map is utilized in the case with the map, as shown in Figure 13d. On the other hand, the mismatch did not occur in the q-axis control of both cases, as the current waveform was effectively regulated following its reference.

5. Experimental Measurement and Discussion

This section describes the experimental measurement results to validate the proposed control algorithm of the IPM motor drive. First, the detailed experimental setup and data acquisition used to capture the data are explained. Then, the no-load back e.m.f. and motor parameters such as the PM flux linkage are obtained. After the no-load back e.m.f. profile was obtained, the experiment then continued to the under-load condition. Finally, the finding from this study is explained.

5.1. Experimental Setup and Data Acquisition

Figure 14 shows the photograph of the IPM motor prototype testbench system. The prototype drive system itself is illustrated in Figure 14a. It consisted of a DC power supply, a 9 kW VSI system, data acquisition tools such as digital oscilloscope, torque meter and encoder, and a drive system from the MyWay PEV system. The dynamometer drive system for the load motor is shown in Figure 14b. The detailed motor test bench system with prototype and load motor used in the study is illustrated in Figure 14c. A torque meter with a maximum capacity of 5 Nm was utilized, which corresponds to the 17 Arms three-phase current supply. We assumed that the temperature operation is below 85 °C.
In this study, we assumed that the motor has an effective natural cooling system. Therefore, the winding resistance, which is made of copper, is assumed constant or slightly changing following (14), where R t o is the copper resistance at 25 °C, α is the copper thermal coefficient with the value of 0.00386 kJ/kg Δ K, and Δ T is the temperature increase due to the motor operation. This temperature increase influences the winding resistance, Δ R a , to vary up to 0.188522 Ω with the final temperature of the motor assumed at no more than 85 °C. Thus, the PM demagnetization and detailed temperature estimation in this study as proposed in [37] are not required.
R t f = R t o 1 + α Δ T

5.2. No-Load Test

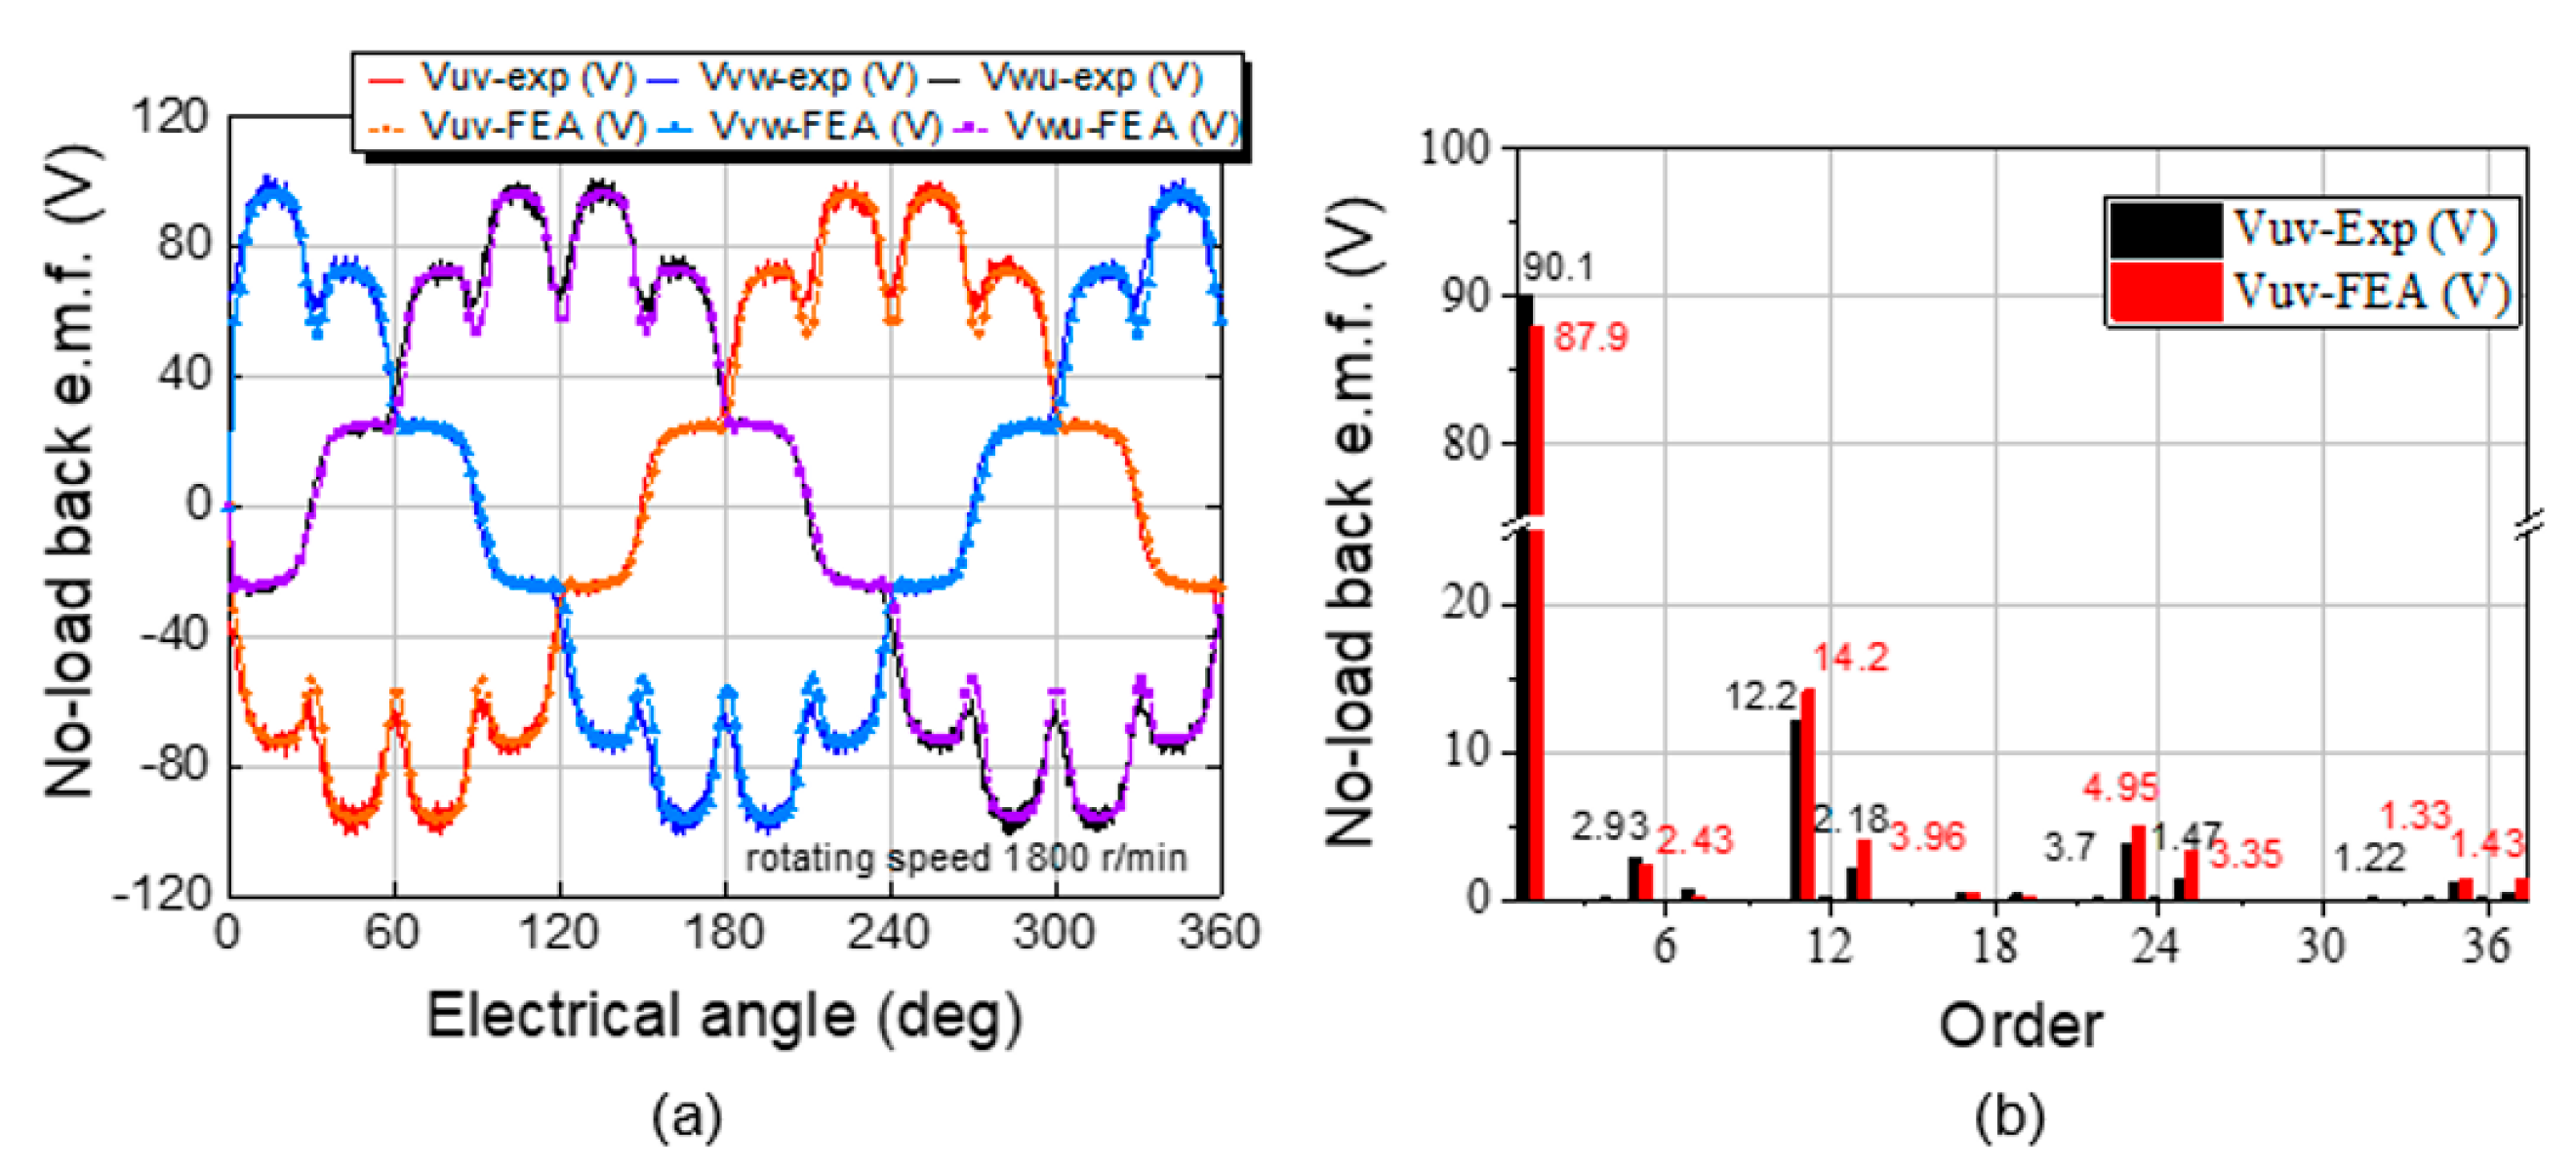
Figure 15 depicts the experiment’s no-load back e.m.f. line-to-line voltage profile of the prototype motor with a rotating speed N of 1800 r/min. It was taken using a digital multimeter (DMM) Yokogawa DL850 ScopeCorder, produced by Yokogawa Meters and Instruments Corporation in Tokyo, Japan. The data sampling of 500 kS/s and 20 ms/s was chosen during data acquisition. Thus, the total of data points taken is around 100 k. The line-to-line voltage of Vuv, Vvw, and Vwu of the no-load experimental measurement and FEA simulation results are illustrated in Figure 15a. The FFT analysis of this Vuv line-to-line voltage is illustrated in Figure 15b. As can be seen, the fundamental component of Vuv in the experimental and FEA simulation is 90.1 and 87.9 V, respectively. Furthermore, the FEA back e.m.f. profile matched the experimental back e.m.f. as shown in Figure 15a.

5.3. Load Test

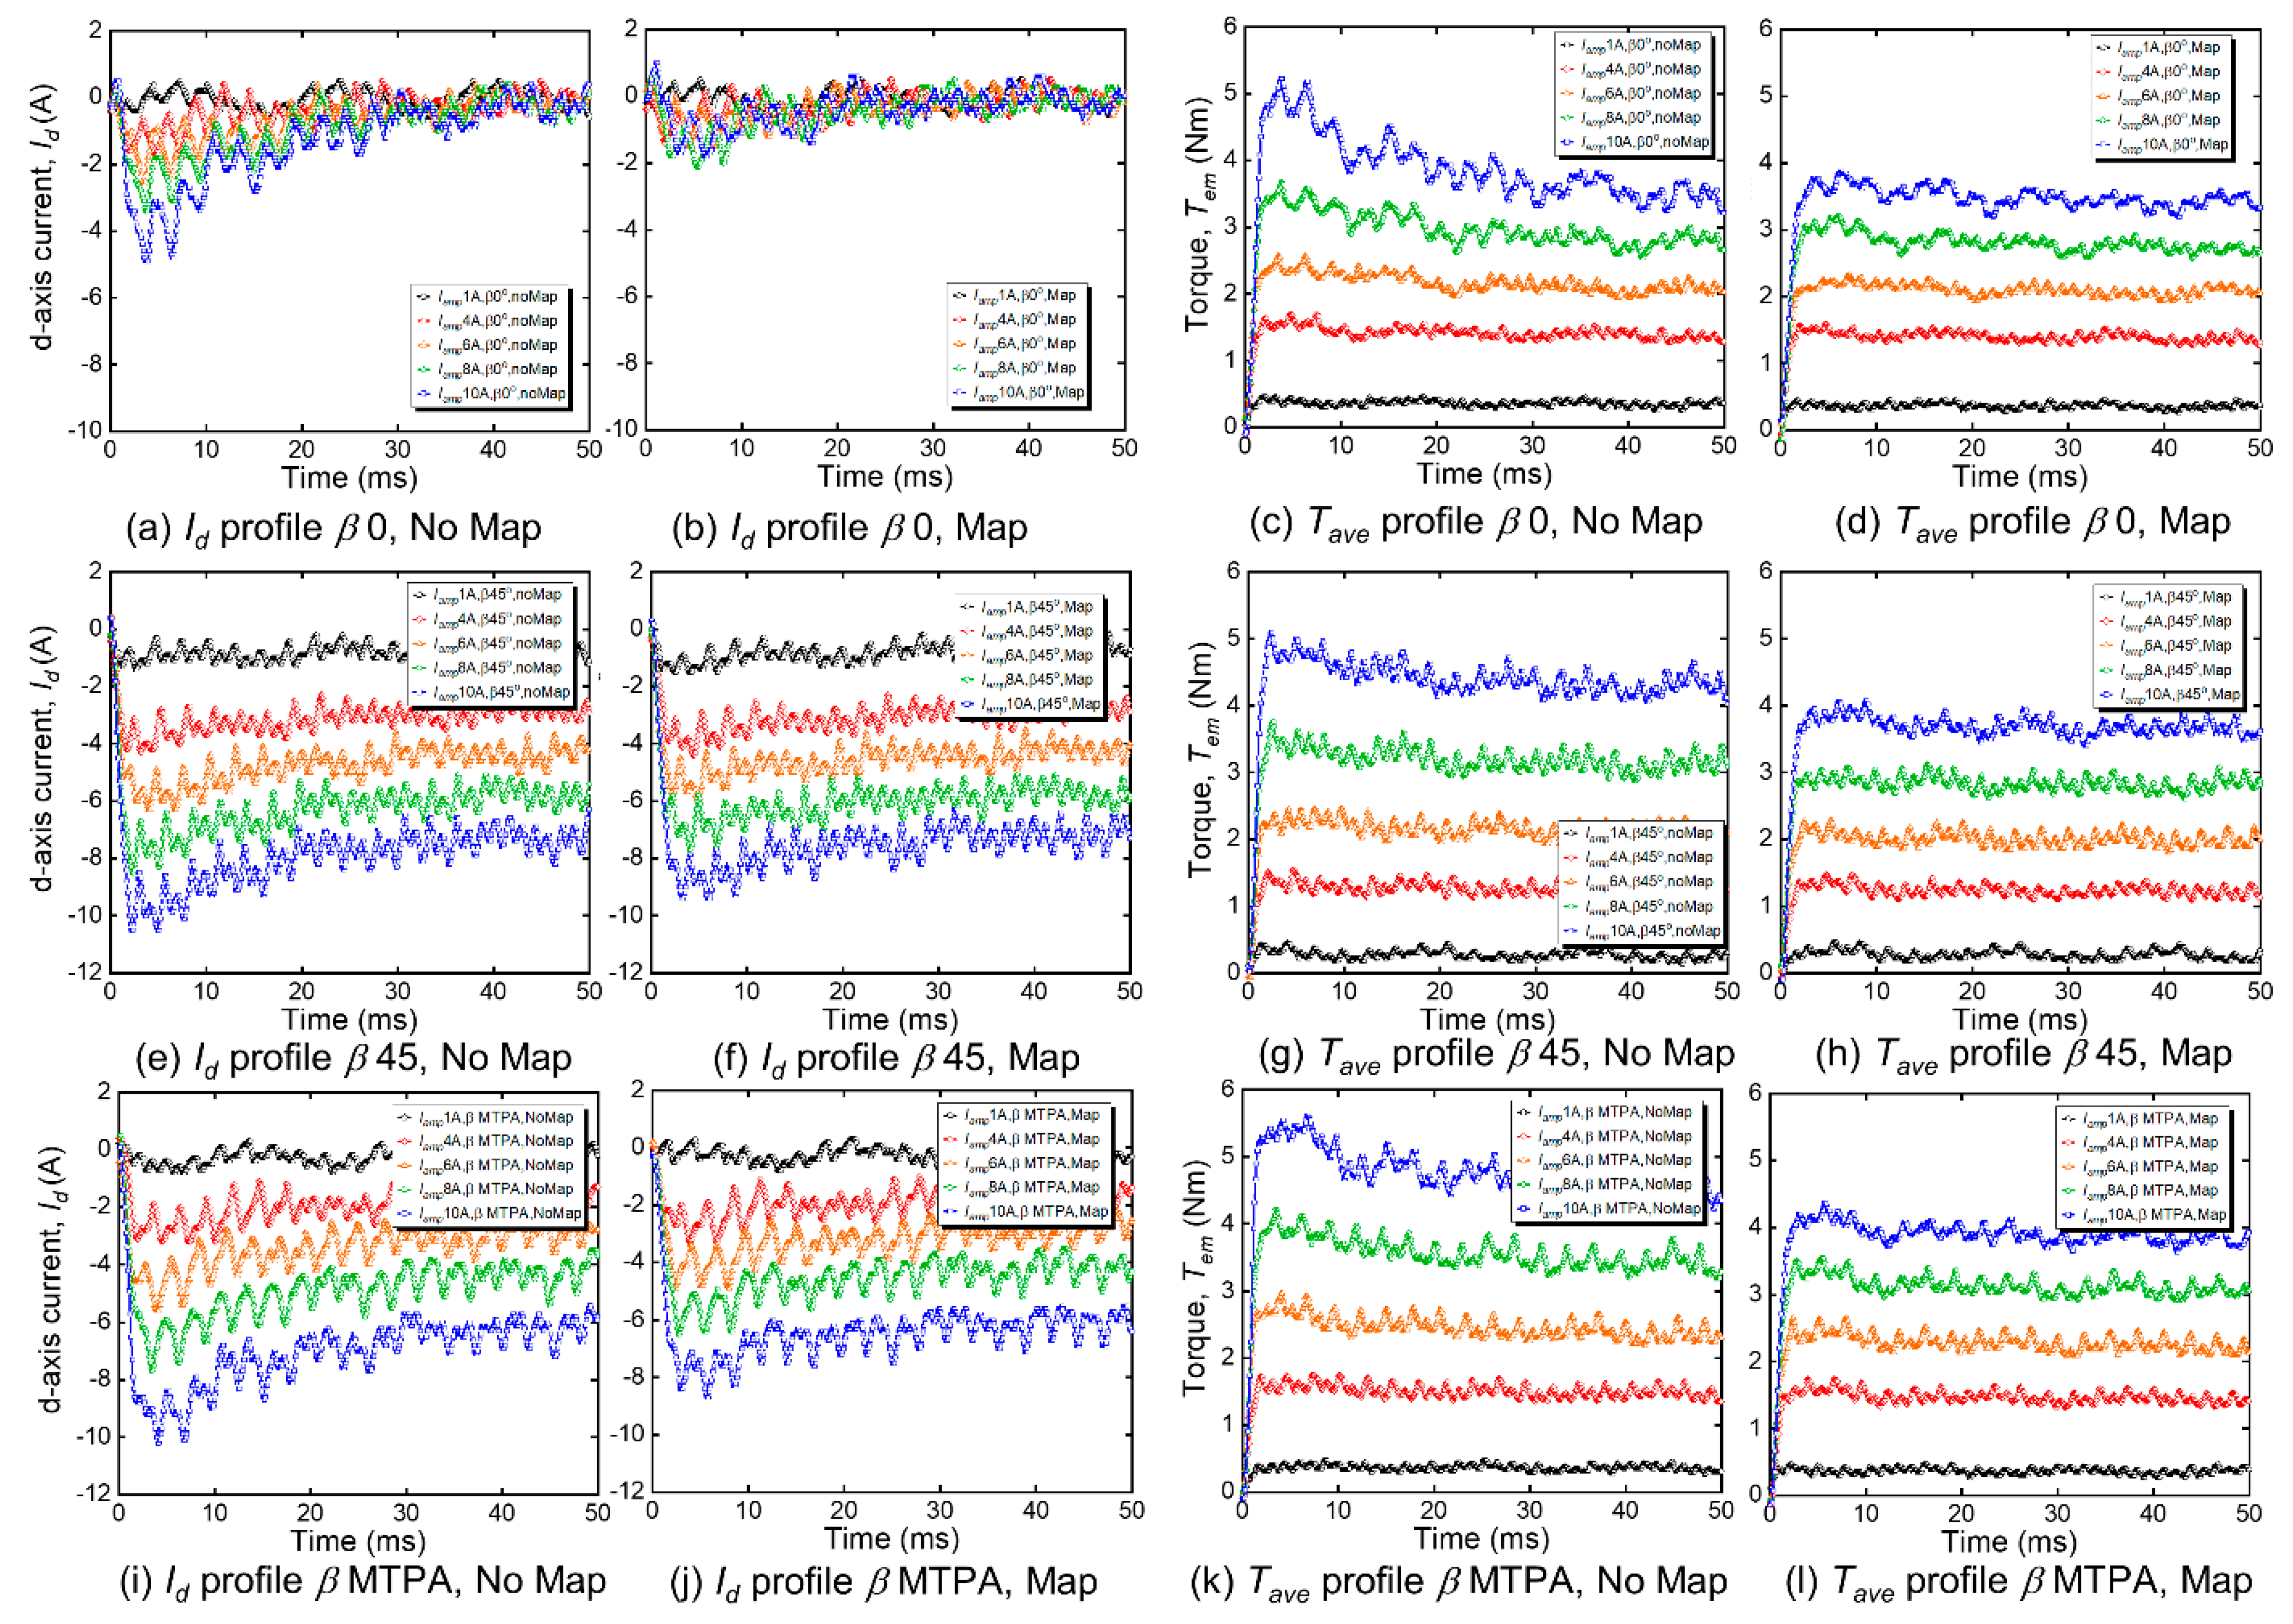
The load test results are illustrated in Figure 16. The current and torque response profiles for variations in current command for β 0°, 45°, and MTPA with no-map and map combinations are investigated. The current response and torque output profiles are shown without and with the inductance map in (a–d) for β 0°, in (e–h) for β 45°, and in (i–l) for β MTPA. Five Iamp values were investigated, including 1.0, 4.0, 6.0, 8.0, and 10.0 A. Each current amp represents a different current color response, from black for 1.0 A to blue for 10.0 A. As can be clearly seen, there are undershoot and overshoot suppression by implementing the parameter map in the control algorithm. For example, in beta β 0° undershoot for 10.0 A, the undershoot peak Id current is from −4.9 A to −2.0 A or of up to 60% improvement.
Figure 17 illustrates the comparison of Id peak value during the transient time under the no-map, ave-map, and map conditions for β 0°, 45°, and MTPA with variations in the current command. For all beta values, the results share common phenomena that as the magnetic saturation occurs, the undershoot of Id peak during transient time becomes higher. For each case, detail profiles of statistic values including maximum (Max), minimum (Min), average (Mean), summation (Sum), and standard deviation (StandDev) are shown in the table of each plot. Red, blue, and black represent the no-map, ave-map, and full-map profiles, respectively. Furthermore, the trendline quadratic equation using linear regression also provided in each figures to illustrate the relationship between current command and Id peak value during transient time.
Figure 18 illustrates the comparison of Tave peak value with β 0°, 45°, and MTPA for no-map, ave-map, and map conditions with variations in the current command. For all beta values, the results share common phenomena that the MTPA control is superior compared to other scenarios. The average Tave peak value for current command Iamp 10.0 A is around 4.4143 Nm. The trend for Tave peak value for no-map, ave-map, and map seem similar, as the proposed map contributes highly during the transient time. Figure 19 illustrates the comparison of Tave/Iamp value under the no-map, ave-map, and map conditions for β 0°, 45°, and MTPA with variations in the current command. All cases illustrate that as the magnetic saturation occurs, the Tave/Iamp value tends to decrease as Tave is saturated. Figure 20 shows experimental measurement results for the torque as a function of current command Iamp and beta. It illustrate the comparison of IT curve profile under no-map, ave-map, and map conditions with variations in the current command. The colour variation from red to blue illustrate the profile variation of current command amplitude used in the experiment from 1.0 A to 10.0 A with resolution of beta 5 deg.

5.4. Discussion

As shown in Figure 16a,b of the load test results described in Section 5.3, there is a parameter mismatch that occurs between the controller and the motor model due to magnetic saturation. To mitigate this parameter mismatch, the utilization of L d and L q map, as illustrated in Figure 9, proves to be a robust and beneficial alternative solution. The L d and L q map is determined based on the i d and i q current reference supplied by the VSI input. The FEM-based parameter map proves the L d and L q values are determined by i d and i q supply. This key finding of the FEM-based parameter map matches that of the previous study that considered the magnetic saturation in the MTPA control [23,30,31,32]. Hence, applying the 3D L d and L q maps to the PI regulator of current controller and to the decoupling control calculation effectively reduces the mismatch effects during magnetic saturation. This reduction in mismatch is achieved by estimating both the Kp and Ki gain factors, as well as the armature flux in the controller. This transient response as well as the MTPA trajectory improvement are illustrated by the reduction in the overshoot of torque waveform and the undershoot of i d during the transient response in Figure 16 and Figure 21 for the real MTPA trajectory of the IPM motor prototype. As illustrated in Figure 16c,d, this improvement is possible by up to 60%.
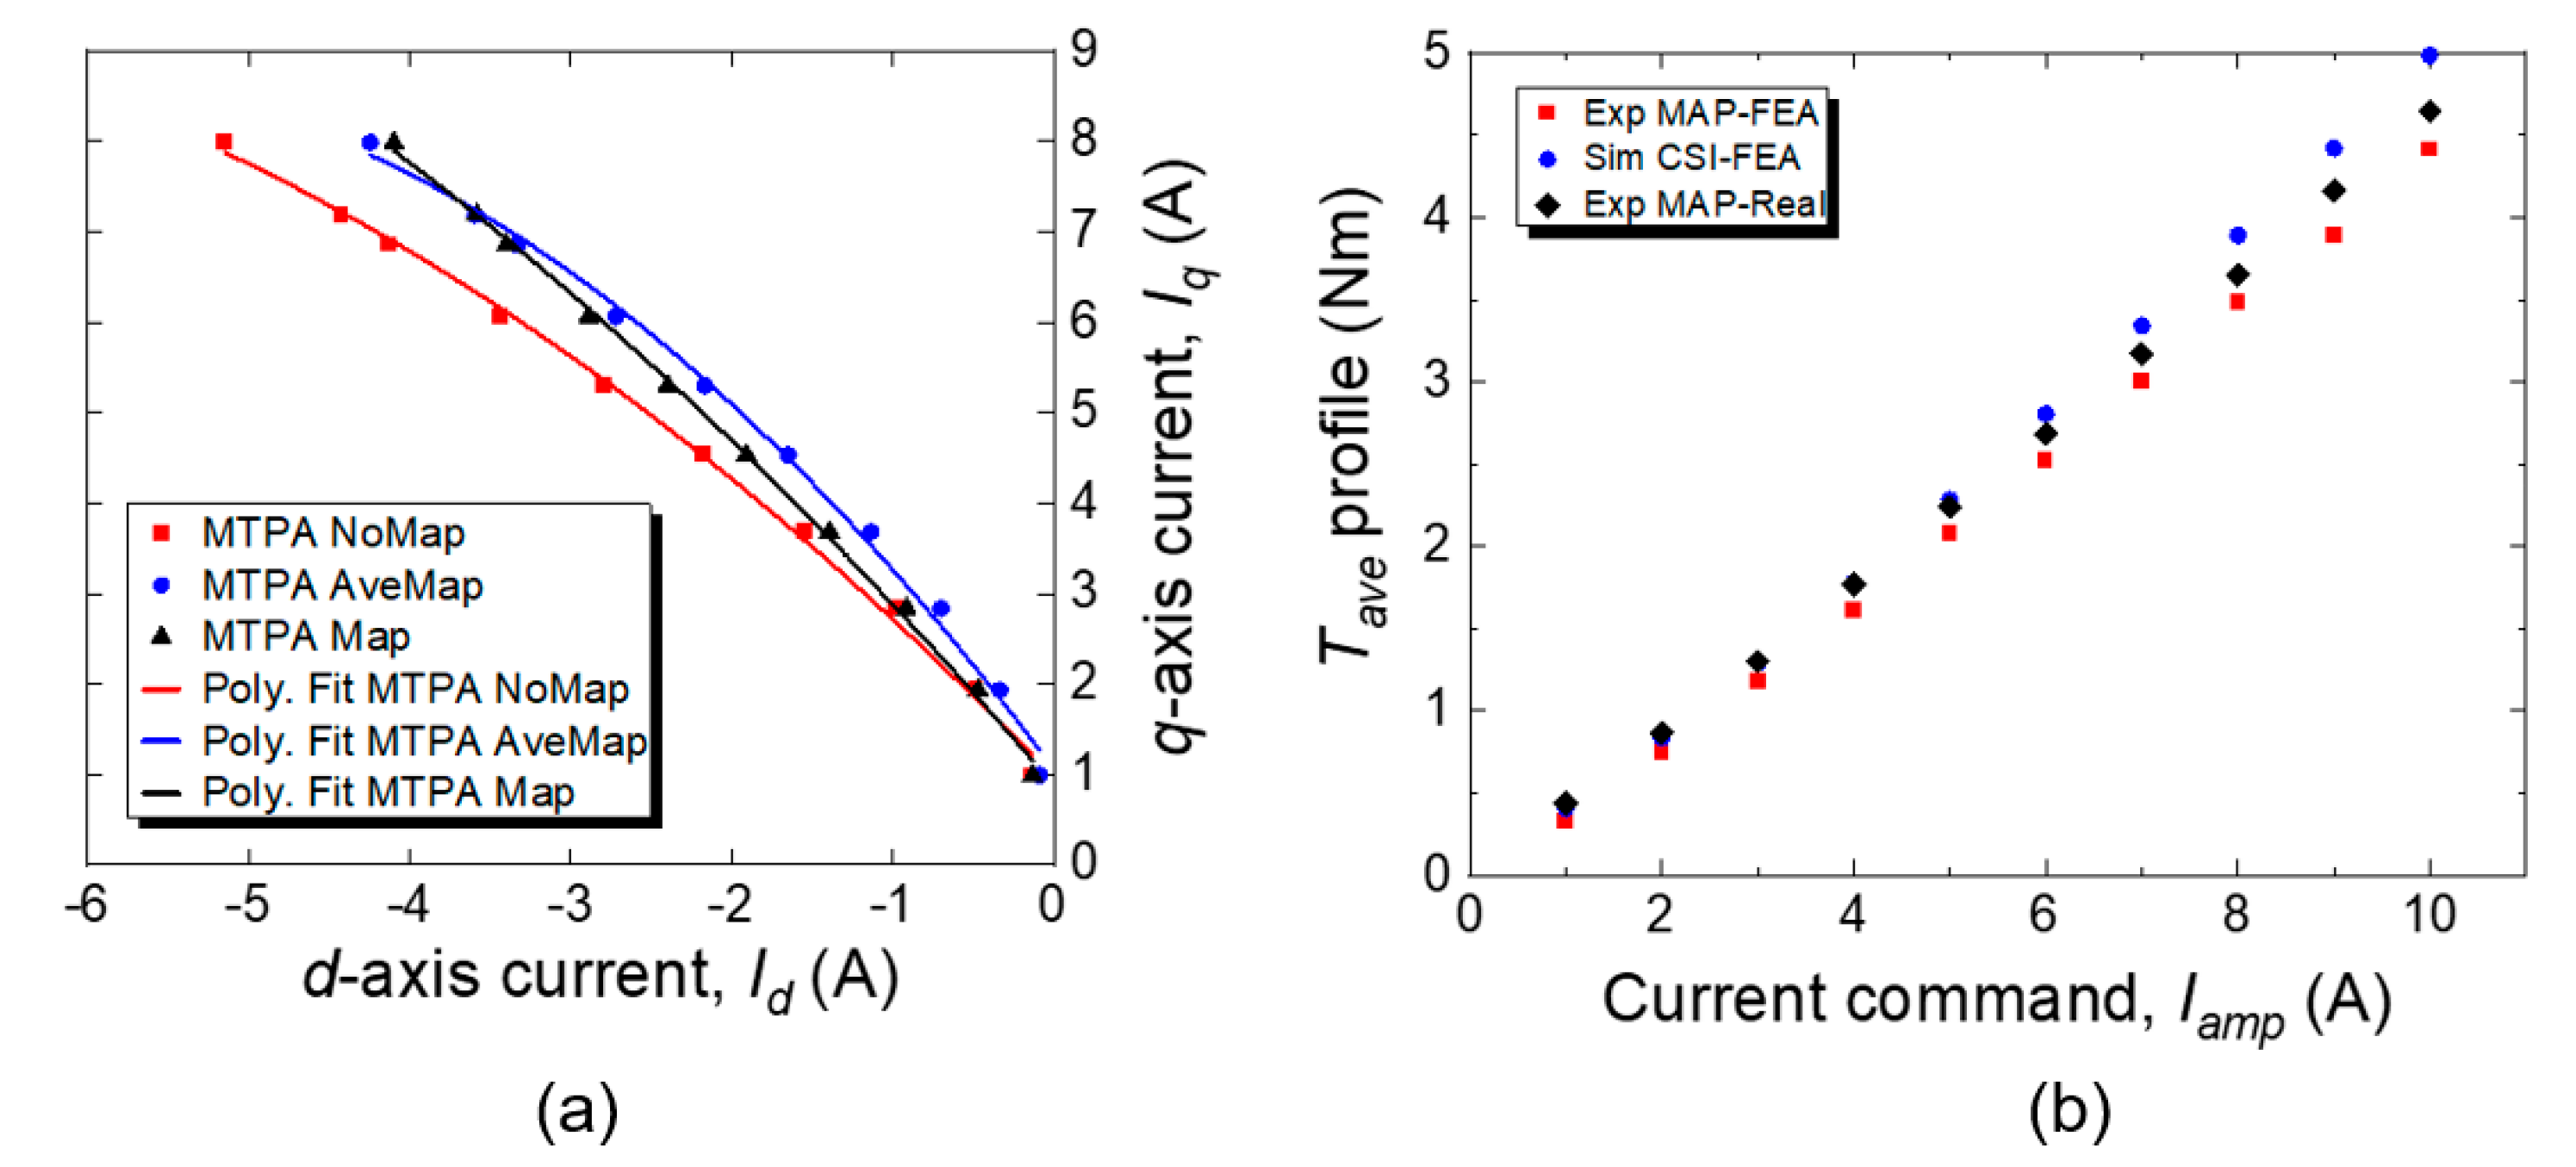
Magnetic saturation in the motor occurs when the magnetic field strength in the motor’s magnetic core reaches a maximum level and can no longer increase with an increase in current. Saturation affects the magnetic flux and inductance of the motor, which in turn affects the motor’s performance characteristics, including the MTPA trajectory. The impact of magnetic saturation on the MTPA trajectory depends on the degree of saturation. When magnetic field in the motor’s core approaches saturation, the slope of the MTPA trajectory decreases. The IPM motor becomes less efficient at producing torque per ampere of current as illustrated in Figure 21a. This is because the saturation reduces the motor’s inductance, which in turn reduces the torque produced by the motor for a given current.
The proposed 3D FEM-based inductance map is robust enough to match the real MTPA trajectory line of the experiment as shown in Figure 21b. However, as the current increases, some errors occur between the proposed model and experimental results. This error is due to some phenomena such as coil end leakage flux and PM flux dependency on its temperature that are not modelled well by the proposed controller map.
Future work will explore the effectiveness of the proposed map in an adjustable-field IPM motor drive, coil end leakage flux impact, and temperature dependency of the magnetic flux for accurate PM flux estimation and anti-demagnetizing monitoring [38,39,40,41,42]. Furthermore, it will investigate the possibility of the implementation of alternative existing control methods, such as asymptotic tracking with novel integral robust schemes for mismatched uncertain nonlinear systems [43], and the neuroadaptive learning algorithm for constrained nonlinear systems with disturbance rejection [44] to enhance the proposed method of the IPM motor control.

6. Conclusions

We successfully reduce the mismatch and show the true MTPA trajectory line of the IPM motor prototype using the proposed control algorithm. As demonstrated by the FEA simulation results and validated by the experimental measurements, the proposed vector control algorithm by a simple 3D FEM-based inductance map that considers the cross-coupling magnetic saturation impact effectively reduces the parameter mismatch. Furthermore, the FEB-based parameter map also increases the accuracy of the MTPA trajectory, as the MTPA point is influenced by the inductance value which highly depends on the current operation.
In the future, the influence of magnetic temperature will be considered in the control algorithm, as the magnetic flux is dependent on its temperature affected by the motor operation conditions, and the possibility for a hybrid with other online parameter estimation systems such as MRAS, extended state observer, and neuroadaptive learning for an accurate online parameter estimation.

Author Contributions

Conceptualization, F.H. and T.N.; methodology, F.H. and T.N.; software, F.H. and R.A.; validation, F.H., T.N., R.A., and F.Y.; formal analysis, F.H. and T.N.; investigation, F.H., T.N. and F.Y.; resources, T.N. and R.A.; data curation, F.H.; writing—original draft preparation, F.H.; writing—review and editing, F.H., T.N. and F.Y.; visualization, F.H.; supervision, T.N. and F.Y.; project administration, T.N.; funding acquisition, T.N. All authors have read and agreed to the published version of the manuscript.

Funding

This research was funded by JSPS KAKENHI, grant number JP21K04022.

Informed Consent Statement

Not applicable.

Data Availability Statement

Not applicable.

Acknowledgments

Author (F.H.) would like to thank Kiyohiro Iwama, Teguh Firmansyah, Boma Anantasatya Adhi, Arief Noor Rahman, and Juntaro Ishihara for the help during simulation and experiment.

Conflicts of Interest

The authors declare no conflict of interest.

References

  1. Bhowmik, C.; Bhowmik, S.; Ray, A. Green Energy Sources Selection for Sustainable Planning: A Case Study. IEEE Trans. Eng. Manag. 2022, 69, 1322–1334. [Google Scholar] [CrossRef]
  2. Faisal, M.; Hannan, M.A.; Ker, P.J.; Hussain, A.; Mansor, M.B.; Blaabjerg, F. Review of Energy Storage System Technologies in Microgrid Applications: Issues and Challenges. IEEE Access 2018, 6, 35143–35164. [Google Scholar] [CrossRef]
  3. Fard, M.T.; He, J.; Huang, H.; Cao, Y. Aircraft Distributed Electric Propulsion Technologies—A Review. IEEE Trans. Transp. Electrif. 2022, 8, 4067–4090. [Google Scholar] [CrossRef]
  4. Thangavel, S.; Deepak, M.; Girijaprasanna, T.; Raju, S.; Dhanamjayulu, C.; Muyeen, S.M. A Comprehensive Review on Electric Vehicle: Battery Management System, Charging Station, Traction Motors. IEEE Access 2023, 11, 20994–21019. [Google Scholar] [CrossRef]
  5. Prakht, V.; Ibrahim, M.N.; Kazakbaev, V. Energy Efficiency Improvement of Electric Machines without Rare-Earth Magnets. Energies 2023, 16, 3573. [Google Scholar] [CrossRef]
  6. Chin, J.W.; Cha, K.S.; Park, M.R.; Park, S.H.; Lee, E.C.; Lim, M.S. High Efficiency PMSM with High Slot Fill Factor Coil for Heavy-Duty EV Traction Considering AC Resistance. IEEE Trans. Energy Convers. 2021, 36, 883–894. [Google Scholar] [CrossRef]
  7. Liu, X.; Chen, H.; Zhao, J.; Belahcen, A. Research on the Performances and Parameters of Interior PMSM Used for Electric Vehicles. IEEE Trans. Ind. Electron. 2016, 63, 3533–3545. [Google Scholar] [CrossRef]
  8. Orlowska-Kowalska, T.; Wolkiewicz, M.; Pietrzak, P.; Skowron, M.; Ewert, P.; Tarchala, G.; Krzysztofiak, M.; Kowalski, C.T. Fault Diagnosis and Fault-Tolerant Control of PMSM Drives-State of the Art and Future Challenges. IEEE Access 2022, 10, 59979–60024. [Google Scholar] [CrossRef]
  9. Filho, C.J.V.; Xiao, D.; Vieira, R.P.; Emadi, A. Observers for High-Speed Sensorless PMSM Drives: Design Methods, Tuning Challenges and Future Trends. IEEE Access 2021, 9, 56397–56415. [Google Scholar] [CrossRef]
  10. Morimoto, S.; Ueno, T.; Sanada, M.; Yamagiwa, A.; Takeda, Y.; Hirasa, T. Effects and Compensation of Magnetic Saturation in Permanent Magnet Synchronous Motor Drives. In Proceedings of the Conference Record—IAS Annual Meeting (IEEE Industry Applications Society), Toronto, ON, Canada, 2–8 October 1993; Volume 1, pp. 59–64. [Google Scholar]
  11. Lu, Y.; He, S.; Li, C.; Luo, H.; Yang, H.; Zhao, R. Online Full-Speed Region Control Method of IPMSM Drives Considering Cross-Saturation Inductances and Stator Resistance. IEEE Trans. Transp. Electrif. 2022, 1–13. [Google Scholar] [CrossRef]
  12. Balamurali, A.; Anik, A.K.; Clandfield, W.; Kar, N.C. Non-Invasive Parameter and Loss Determination in PMSM Considering the Effects of Saturation, Cross-Saturation, Time Harmonics, and Temperature Variations. IEEE Trans. Magn. 2021, 57, 8202206. [Google Scholar] [CrossRef]
  13. Husnayain, F.; Noguchi, T.; Iwama, K.; Yusivar, F. Mismatch Reduction Using 2-D Inductance Map for Robust Vector Control of IPM Motor. In Proceedings of the 17th International Conference on Quality in Research, QIR 2021: International Symposium on Electrical and Computer Engineering, Depok, Indonesia, 13–15 October 2021; IEEE: Depok, Indonesia, 2021; pp. 90–93. [Google Scholar]
  14. Dianov, A.; Tinazzi, F.; Calligaro, S.; Bolognani, S. Review and Classification of MTPA Control Algorithms for Synchronous Motors. IEEE Trans. Power Electron. 2022, 37, 3990–4007. [Google Scholar] [CrossRef]
  15. Kim, H.S.; Lee, Y.; Sul, S.K.; Yu, J.; Oh, J. Online MTPA Control of IPMSM Based on Robust Numerical Optimization Technique. IEEE Trans. Ind. Appl. 2019, 55, 3736–3746. [Google Scholar] [CrossRef]
  16. Li, K.; Sun, T.; Jiang, F.; Feng, W.; Li, H. MTPA Control for IPMSM Drives Based on Pseudorandom Frequency-Switching Sinusoidal Signal Injection. Machines 2022, 10, 231. [Google Scholar] [CrossRef]
  17. Kim, H.S.; Yoo, J.; Sul, S.K. Online MTPA Operation of IPMSM Based on Dual-Loop Control in Polar Coordinates. IEEE Trans. Power Electron. 2022, 37, 4431–4441. [Google Scholar] [CrossRef]
  18. Lyu, S.; Yang, H.; Lin, H.; Zhan, H.; Chen, Z. Improved MTPA Control for Variable-Flux Memory Machine with Operating Envelope Prediction-Based MS Manipulation. IEEE Trans. Power Electron. 2023, 38, 3700–3710. [Google Scholar] [CrossRef]
  19. Jin, N.Z.; Chen, H.C.; Sun, D.Y.; Wu, Z.Q.; Zhou, K.; Zhang, L. Virtual Signal Injection Maximum Torque per Ampere Control Based on Inductor Identification. Energies 2022, 15, 4851. [Google Scholar] [CrossRef]
  20. Miao, Q.; Li, Q.; Xu, Y.; Lin, Z.; Chen, W.; Li, X. Virtual Constant Signal Injection-Based MTPA Control for IPMSM Considering Partial Derivative Term of Motor Inductance Parameters. World Electr. Veh. J. 2022, 13, 240. [Google Scholar] [CrossRef]
  21. Xia, Z.; Nalakath, S.; Tarvirdilu-Asl, R.; Sun, Y.; Wiseman, J.; Emadi, A. Online Optimal Tracking Method for Interior Permanent Magnet Machines with Improved MTPA and MTPV in Whole Speed and Torque Ranges. IEEE Trans. Power Electron. 2020, 35, 9755–9771. [Google Scholar] [CrossRef]
  22. Li, Z.; Li, H. MTPA Control of PMSM System Considering Saturation and Cross-Coupling. In Proceedings of the 2012 15th International Conference on Electrical Machines and Systems (ICEMS), Sapporo, Japan, 21–24 October 2012; IEEE: Sapporo, Japan, 2012; pp. 1–5. [Google Scholar]
  23. Takase, Y.; Hamabe, Y.; Rui, H.; Morimoto, S.; Higashikawa, K. High-Precision Torque Control of IPMSM Considering Magnetic Saturation and Magnet Temperature Variation. In Proceedings of the 2022 International Power Electronics Conference, IPEC-Himeji 2022-ECCE Asia, Himeji, Japan, 15–19 May 2022; Institute of Electrical and Electronics Engineers Inc.: Piscataway, NJ, USA, 2022; pp. 662–666. [Google Scholar]
  24. Rafaq, M.S.; Jung, J.W. A Comprehensive Review of State-of-the-Art Parameter Estimation Techniques for Permanent Magnet Synchronous Motors in Wide Speed Range. IEEE Trans. Industr. Inform. 2020, 16, 4747–4758. [Google Scholar] [CrossRef]
  25. Zhu, Z.Q.; Liang, D.; Liu, K. Online Parameter Estimation for Permanent Magnet Synchronous Machines: An Overview. IEEE Access 2021, 9, 59059–59084. [Google Scholar] [CrossRef]
  26. Noguchi, T.; Kumakiri, Y. On-Line Parameter Identification of IPM Motor Using Instantaneous Reactive Power for Robust Maximum Torque per Ampere Control. In Proceedings of the IEEE International Conference on Industrial Technology, Seville, Spain, 17–19 March 2015; IEEE: Seville, Spain, 2015; pp. 793–799. [Google Scholar]
  27. Inoue, Y.; Kawaguchi, Y.; Morimoto, S.; Sanada, M. Performance Improvement of Sensorless IPMSM Drives in a Low-Speed Region Using Online Parameter Identification. IEEE Trans. Ind. Appl. 2011, 47, 798–804. [Google Scholar] [CrossRef]
  28. Shi, Y.; Sun, K.; Huang, L.; Li, Y. Online Identification of Permanent Magnet Flux Based on Extended Kalman Filter for IPMSM Drive with Position Sensorless Control. IEEE Trans. Ind. Electron. 2012, 59, 4169–4178. [Google Scholar] [CrossRef]
  29. Kim, W.H.; Kim, M.J.; Lee, K.D.; Lee, J.J.; Han, J.H.; Jeong, T.C.; Cho, S.Y.; Lee, J. Inductance Calculation in IPMSM Considering Magnetic Saturation. IEEE Trans. Magn. 2014, 50, 4001304. [Google Scholar] [CrossRef]
  30. Lee, K.D.; Lee, J.; Lee, H.W. Inductance Calculation of Flux Concentrating Permanent Magnet Motor through Nonlinear Magnetic Equivalent Circuit. IEEE Trans. Magn. 2015, 51, 8204304. [Google Scholar] [CrossRef]
  31. Liang, P.; Pei, Y.; Chai, F.; Zhao, K. Analytical Calculation of D- and Q-Axis Inductance for Interior Permanent Magnet Motors Based on Winding Function Theory. Energies 2016, 9, 580. [Google Scholar] [CrossRef] [Green Version]
  32. Rahman, K.M.; Hiti, S. Identification of Machine Parameters of a Synchronous Motor. IEEE Trans. Ind. Appl. 2005, 41, 557–565. [Google Scholar] [CrossRef]
  33. Pillay, P.; Krishnan, R. Modeling, Simulation, and Analysis of Permanent-Magnet Motor Drives, Part I: The Permanent-Magnet Synchronous Motor Drive. IEEE Trans. Ind. Appl. 1989, 25, 265–273. [Google Scholar] [CrossRef]
  34. Morimoto, S.; Sanada, M.; Takeda, Y. Wide-Speed Operation of Interior Permanent Magnet Synchronous Motors with High-Performance Current Regulator. IEEE Trans. Ind. Appl. 1994, 30, 920–926. [Google Scholar] [CrossRef]
  35. Inoue, T.; Inoue, Y.; Morimoto, S.; Sanada, M. Mathematical Model for MTPA Control of Permanent-Magnet Synchronous Motor in Stator Flux Linkage Synchronous Frame. IEEE Trans. Ind. Appl. 2015, 51, 3620–3628. [Google Scholar] [CrossRef]
  36. Bianchini, C.; Bisceglie, G.; Torreggiani, A.; Davoli, M.; Macrelli, E.; Bellini, A.; Frigieri, M. Effects of the Magnetic Model of Interior Permanent Magnet Machine on MTPA, Flux Weakening and MTPV Evaluation. Machines 2023, 11, 77. [Google Scholar] [CrossRef]
  37. Liu, C.; Zou, J.; Xu, Y.; Yu, G. An Efficient Thermal Computation Model of PMSM Based on FEA Results and Interpolation. IEEE Trans. Appl. Supercond. 2021, 31, 5204904. [Google Scholar] [CrossRef]
  38. Kim, H.; Jung, H.S.; Sul, S.K. Stator Winding Temperature and Magnet Temperature Estimation of IPMSM Based on High-Frequency Voltage Signal Injection. IEEE Trans. Ind. Electron. 2023, 70, 2296–2306. [Google Scholar] [CrossRef]
  39. Guo, H.; Ding, Q.; Song, Y.; Tang, H.; Wang, L.; Zhao, J. Predicting Temperature of Permanent Magnet Synchronous Motor Based on Deep Neural Network. Energies 2020, 13, 4782. [Google Scholar] [CrossRef]
  40. Reigosa, D.; Fernandez, D.; Martinez, M.; Guerrero, J.M.; Diez, A.B.; Briz, F. Magnet Temperature Estimation in Permanent Magnet Synchronous Machines Using the High Frequency Inductance. IEEE Trans. Ind. Appl. 2019, 55, 2750–2757. [Google Scholar] [CrossRef]
  41. Noguchi, T.; Kondo, S.; Takahashi, I. Field-Oriented Control of an Induction Motor with Robust On-Line Tuning of Its Parameters. IEEE Trans. Ind. Appl. 1997, 33, 35–42. [Google Scholar] [CrossRef]
  42. Iwama, K.; Noguchi, T. Three-Phase Inverter Fed Adjustable Field IPMSM Drive Utilizing Zero-Sequence Current. IEEE Trans. Ind. Electron. 2023, 70, 1239–1249. [Google Scholar] [CrossRef]
  43. Yang, G. Asymptotic Tracking with Novel Integral Robust Schemes for Mismatched Uncertain Nonlinear Systems. Int. J. Robust Nonlinear Control 2023, 33, 1988–2002. [Google Scholar] [CrossRef]
  44. Yang, G.; Yao, J.; Dong, Z. Neuroadaptive Learning Algorithm for Constrained Nonlinear Systems with Disturbance Rejection. Int. J. Robust Nonlinear Control 2022, 32, 6127–6147. [Google Scholar] [CrossRef]
Figure 1. Research position of the proposed method. (a) Research background, (b) space and time harmonics phenomena in no-load back e.m.f., and (c) B–H curve of 50A350 soft magnetic material.
Energies 16 04712 g001
Figure 2. The 2D IPMSM prototype configuration with yellow stator core, green rotor core, light red, green, and blue armature windings of U, W, and V phases, gray permanent magnet (PM), and purple motor shaft.
Energies 16 04712 g002
Figure 3. Three-phase three-wire motor equivalent testing circuit.
Energies 16 04712 g003
Figure 4. IPM motor equivalent circuit at steady-state conditions: (a) d-axis and (b) q-axis.
Energies 16 04712 g004
Figure 5. Proposed vector control. (a) Block diagram of vector control with decoupling and 3D inductance map control, (b) detail decoupling control and cross-coupling of 3D inductance map configuration.
Energies 16 04712 g005
Figure 6. Electromagnetic analysis of IPM motor prototype for no-load back e.m.f. at rotating speed N 1800 r/min. (a) The D-model of the prototype with mesh quality size of 0.5 mm. (b) Magnetic flux density B analysis contour and vector plot with a maximum of 1.8 T. (c) Flux line profile with the setting of 30 lines.
Energies 16 04712 g006
Figure 7. Magnetic flux density profile under a current magnitude of 21 A with 4 β variations. (a) Magnetic flux density under motoring conditions with β 0°, 30°, and 60°, respectively. (b) Profile under β 90° or Iq 0 A. The scale for magnetic flux density B was between 1.0 and 1.2 T.
Energies 16 04712 g007
Figure 8. IT and NT characteristics of the proposed IPM motor. (a) Profile of PM torque with a variation of q-axis current. (b) Profile of NT rotating speed vs. torque generated under vector control. (c) Torque electromagnetic profile Tave of proposed IPM motor with a variation in Iamp and β supply.
Energies 16 04712 g008
Figure 9. The 3D inductance maps based on FEM considering cross-coupling. (a) Ld map in polar coordinates. (b) Lq map in polar coordinates. (c) Ld map in dq axes. (d) Lq map in dq axes. (e) Flowchart of 3D FEM-based inductance map.
Energies 16 04712 g009
Figure 10. Vector and contour plots of B at Iamp = 0 A and 21 A.
Energies 16 04712 g010
Figure 11. Three-phase no-load back e.m.f. profiles of FEM IPM motor prototype. (a) Waveform, (b) FFT, (c) cogging torque waveform and its FFT profile, (d) no-load back e.m.f. with N variation, and (e) FFT U-phase back e.m.f.
Energies 16 04712 g011
Figure 12. Load test results for β 0°, 45°, and MTPA with no-map and map combinations. Current response and torque output profiles without and with inductance map (ad) for β 0°, (eh) β 45°, and (il) β MTPA.
Energies 16 04712 g012
Figure 13. Load test results for no-map and map conditions with a torque reference of 1, 3, 5, 7, and 9 Nm. The dq-axis response for both (a) no-map and (b) with map. The torque waveform for both (c) no-map and (d) with map conditions.
Energies 16 04712 g013
Figure 14. Photograph of IPM motor prototype testbench system: (a) prototype drive system, (b) load motor drive system, and (c) motor test bench system with prototype and load motor.
Energies 16 04712 g014
Figure 15. Profile of measured no-load back e.m.f.: (a) waveform and (b) FFT analysis.
Energies 16 04712 g015
Figure 16. Load test results for β 0°, 45°, and MTPA with no-map and map combinations. Current response and torque output profiles without and with inductance map (ad) β 0°, (eh) β 45°, and (il) β MTPA.
Energies 16 04712 g016
Figure 17. Comparison of Id peak value under no-map, ave-map, and full-map conditions for β 0°, 45°, and MTPA with variations in the current command.
Energies 16 04712 g017
Figure 18. Comparison of Tave value under no-map, ave-map, and map conditions for β 0°, 45°, and MTPA with variations in the current command.
Energies 16 04712 g018
Figure 19. Comparison of Tave/Iamp value under no-map, ave-map, and map conditions for β 0°, 45°, and MTPA with variations in the current command.
Energies 16 04712 g019
Figure 20. Comparison of IT curve under no-map, ave-map, and map conditions with variations in the current command.
Energies 16 04712 g020
Figure 21. Impact of 3D inductance map on MTPA control accuracy. (a) The MTPA trajectory line of experimental results based on FEA MTPA points. (b) Comparison of Tave profiles between real MTPA and MTPA from FEA.
Energies 16 04712 g021
Table 1. Motor specification.
Motor SpecificationValueUnit (SI)
DC bus voltage (Vdc)330V
Rated current (irated)3A
Stack length60mm
Rotating speed (N)1800r/min
Stator resistance (Ra)0.851
d-axis inductance (Ld)10.7mH
q-axis inductance (Lq)26.3mH
Table 2. Controller parameters of inverter and their values.
Controller Parameters of InverterValues
Switching freq (Cfeq)10 kHz
Cutoff freq (ωc)1000 rad/s
Vdc bus voltage (Vdc)330 Vdc
Gain Kp d-axis (Kpd)ωcLd(idiq)
Gain Kp q-axis (Kpq)ωcLq(idiq)
Gain Ki (Ki)ωcRa
Disclaimer/Publisher’s Note: The statements, opinions and data contained in all publications are solely those of the individual author(s) and contributor(s) and not of MDPI and/or the editor(s). MDPI and/or the editor(s) disclaim responsibility for any injury to people or property resulting from any ideas, methods, instructions or products referred to in the content.