Article

Study on the Vulnerability of Municipal Solid Waste Resource Symbiosis Network—A Case Study Based on the Construction of Zero Waste City in Panjin

1
School of Mangement, Shenyang Jianzhu University, Shenyang 110168, China
2
School of Transportation and Geomatics Engineering, Shenyang Jianzhu University, Shenyang 110168, China
*
Author to whom correspondence should be addressed.
Energies 2023, 16(12), 4711; https://doi.org/10.3390/en16124711
Submission received: 25 April 2023 / Revised: 10 June 2023 / Accepted: 13 June 2023 / Published: 14 June 2023

Abstract

:
Building zero-waste cities is an important initiative. It helps China to meet the challenges of climate change, build an ecological civilization, and build a beautiful and high-quality China. Through the recycling and safe disposal of waste, the ultimate goal of the construction of zero-waste cities is to minimize the amount of solid waste. Municipal Solid Waste Resource Symbiosis Network (MSWRSN) is the best way to achieve zero-waste cities. However, this system is vulnerable to many factors. These factors will restrict the construction and development of zero-waste cities. This study proposes a vulnerability measurement method of MSWRSN based on energy exchange. Panjin, a city in Liaoning Province, is used as an example to simulate it. The vulnerability measurement method of MSWRSN is composed of three parts. First, the study adopts a directional weighting approach to design the topologic structure of MSWRSN. Second, Dijkstra’s algorithm is used to analyze two topological parameters, node mesonumber and edge mesonumber. It also focuses on single-node failure mode and edge failure mode. Finally, the study uses a functional measure function to calculate the vulnerability of each node and each edge in symbiotic networks. The results of the study show that (1) MSWRSN in Panjin has not yet formed a nested pattern. The symbiotic patterns of different industrial chains are also different. (2) Node failure has a greater impact on MSWRSN. (3) There are differences in the vulnerability of the industry chain in the network. Based on the findings of the study, this study advises managing the vulnerability of MSWRSN from the following aspects. It includes increasing the diversity of symbiotic units, promoting the development of symbiotic networks to nested types, and strengthening risk monitoring and management of core enterprises.

1. Introduction

The theme of the third energy revolution is sustainable development. That is a shift from an energy system dominated by oil and natural gas to an environmentally friendly hydrogen energy economic system based on renewable energy [1]. Hydrogen production from renewable biomass not only replaces traditional oil, natural gas, and coal, but also solves the problem of recycling solid waste. The “zero waste” concept, introduced in 1973, is an important vehicle for the realization of the hydrogen energy economy system. Zero waste cities are new models of sustainable urban development that minimize the environmental impact of solid waste. By promoting the formation of green development and lifestyle, we will continue to promote the reduction and resource utilization of solid waste at the source, and minimize the amount of waste going to the landfill. Since the 21st century, some developed countries and regions have put forward the vision of “zero waste” development. China is a member of the C40 Cities Group, an international consortium to respond to climate change. In 2018, twenty-three cities in the C40 Cities Group have joined together to issue a declaration on “building zero waste cities”, of which eight cities have defined their technical routes and construction plans [2]. At the end of 2018, the General Office of the State Council issued pilot work plan for the construction of “Zero Waste Cities” [3]. It means that China has officially launched the construction of zero-waste cities.
With the steady promotion of a circular economy in China, municipal waste recycling has shown a trend of scale, agglomeration, and networking [4]. With the aim of recycling municipal waste, a collection of various symbiotic relationships has been formed. It has become an innovative organizational form for the high-value and efficient utilization of municipal waste [5]. Symbiotic networks increase the economic performance of the participants by improving the potential utilization of waste. In the organization of MSWRSN, the waste from one enterprise could be used as raw materials for another industry. Waste disposal costs and raw material purchasing costs of both parties will be reduced. The resources saved from the cost reduction could be used to expand or improve operations and improve performance [6]. At the same time, the recycling of waste resources could reflect social efficiency by improving the environment of the communities in which companies are located. On the one hand, this innovative model of municipal solid waste management promotes the sustainable development of enterprises. On the other hand, it also reduces waste and protects the ecological environment [7].
MSWRSN could improve the efficiency of waste utilization. However, the participating companies in the network organization are involved in multiple industries, and the structure of the network is complex. Therefore, it is vulnerable to disruption [8]. Even if an enterprise is disturbed by internal and external factors, it may cause a domino effect and affect the normal operation of the entire system [9,10].
The instability in the operation of MSWRSN is related to the technical, organizational, social, and policy environment [11]. Technology is a precondition for the smooth operation of symbiotic networks [12]. When there is technical backwardness, technical infeasibility, and a lack of technical security within a symbiotic network organization [13], the network will not function normally [14]. In the symbiotic network organization, the context of the units also has an impact on the operation of the network. Studies in countries such as Italy [15], Sweden [16], and Denmark [17] have shown that weak organization is a major obstacle to development. In addition, the internal resources and the capital accumulation of the symbiotic unit are also factors to be considered [17]. Society is also an important factor influencing symbiotic networks. Consumer perceptions about symbiotic networks could have an impact on their operational efficiency, but in different places, this impact may be short-lived or permanent [18]. In the process of forming and developing symbiotic networks, the way that stakeholders communicate and handle conflicts is equally important [19]. Policy support could determine whether symbiotic networks are able to achieve significant ecological potential. Symbiotic networks require the help of governments to coordinate relationships between enterprises to enable the design and execution of symbiotic networks. The efficient operation of symbiotic networks requires the formulation of appropriate incentive systems to encourage the government to actively participate in symbiotic networks. It helps companies to tackle technical, organizational, and social factors, so that the companies could achieve the purpose of performance improvement, cost reduction, and environmental friendliness [20]. Symbiotic networks that lack the support or effective participation of local authorities are bound to show vulnerability in operation. They could not resist interference from external factors [21].
The vulnerability of MSWRSN is manifested as system instability in actual operation. This instability will not only affect the exertion of the synergy effect. When the network experiences the influence of unforeseen factors, it may lead to network collapse [22]. In the reality of waste management, the unstable operation caused by the vulnerability is mainly manifested as the interruption of material flows. Prolonged disruptions in material flows could significantly affect the operation of the network. If no correction is made, the collapse of firms or industrial decline will happen. It will cause changes in the amount of waste in turn [23].
MSWRSN is a very complex system. Yet in some aspects, it is similar to natural ecosystems. Under a certain structure, it could maintain its function to counteract stress and adapt to external or internal changes [7,24]. Current research about waste symbiotic networks is mainly based on the approaches of life cycle, material flow, environmental indicator, and network theory. Table 1 shows the comparison of these methods.
Life cycle, material flow analysis, and environmental indicators are used to assess the flow of waste and the impact of waste recycling on the company and the environment. They help managers to make decisions on whether to join the waste symbiotic network. However, these three approaches could not help managers to analyze the risks of symbiotic networks and improve the efficiency of network operations. Network theory is mainly used to study the stability of symbiotic networks and the resilience of networks when they experience interference. Only a few articles [32,33] have studied the vulnerability of industrial parks in China. These articles study the vulnerability of symbiotic networks through topology. They evaluate the power and the state of nodes and analyze vulnerabilities to prevent cascading failures in symbiotic networks [34,35].
The aim of this study is to investigate the vulnerability of MSWRSN through complex network theory. This study constructs a vulnerability assessment model. It could reveal the reasons why MSWRSN is running wrong. This study takes the construction of a zero waste city in Panjin as an example. It analyses the impact of the key nodes and key routes of MSWRSN on the efficiency of network operation. This article also proposes some policy recommendations for improving the vulnerability management of symbiotic networks. The main contributions of this study are threefold as follows. First, the network model is the main factor affecting the operational stability of MSWRSN. Second, there are differences in the symbiotic model and vulnerability of different industrial chains. Third, node failure has a greater impact on MSWRSN.
The rest of the study is organized as follows. Section 2 introduces the research methodology applied in this study. Section 3 constructs criteria for the construction of municipal solid waste networks and vulnerability evaluation indicators. Section 4 takes Panjin as an example and constructs the network topology. This study simulates and analyzes the impact of single-node failures and edge failures on the network. Finally, Section 5 presents the conclusion.

2. Research Methodology

2.1. Qualitative Methods

The main qualitative research methods used in the study are participant observation, in-person and telephone interviews, and questionnaire survey. Through participant observation, we obtained various documents and workflows issued by the government in the process of building a zero-waste city in Panjin. At the same time, a field survey was also conducted on the utilization of equipment and production of some key enterprises for waste recycling. In-person and telephone interviews are used to collect detailed quantitative information on waste recycling. The interviewees are mainly senior managers. They work in companies that generate a lot of waste and in those that apply waste for reproduction. A total of 20 companies were interviewed. We have taken detailed notes during the interviews. The interviewees were also invited to provide a list of participants in the questionnaire. After the interviews, we checked the relevant data recorded in the interviews by email. The questionnaire survey focuses on obtaining information about the specific operations and existing risk management of the enterprises involved in waste recycling. A total of 109 questionnaires were distributed and 93 were returned. Table 2 shows the comparison of the three qualitative studies.

2.2. Simulation Analysis

The study collected information about the exchanges of material energy in the process of municipal solid waste recycling of important enterprises. To collect the information above, we used field research, telephone interviews, and questionnaires. Using UCINET, a vulnerability network topology was created for the Eco-Industrial Park Symbiosis Network. Dijkstra’s algorithm was used to calculate two types of topological parameters: node mesonumber and edge mesonumber. The study focused on the single node failure mode and edge failure mode. A network functional measure function was constructed to measure the vulnerability of each node and each edge.

3. Vulnerability Analysis of MSWRSN

3.1. Topology Diagram of MSWRSN

To assess the vulnerability of MSWRSN, we should first abstract the realistic industrial symbiotic relationship into a network diagram. That is to build a symbiotic network topology. In the symbiotic network, the nodes represent the enterprises in the park (e.g., power plants, manufacturing plants, sewage treatment plants). The edges of the network represent the exchanges of materials and energy (e.g., water, electricity, waste heat, residues) between these enterprises. By connecting companies with material and energy exchanges in this way, a symbiotic network topology will be formed.
Most of the quantitative studies about vulnerability in the existing literature have also neglected the relationship between the elements within the system. That is, the magnitude and the specific relationship of correlation between the enterprises [34]. It makes the constructed network far from the actual situation. The results of the simulations are also hardly informative. It will reduce the efficiency of management.
In the topology of MSWRSN, this study uses the adjacency matrix. It could represent whether there is a physical or non-physical exchange of energy between the enterprises in the process of waste recycling. If there is a correspondence between the two, the number “1” could be used. If there is no relationship between the two, the number “0” could be used. The composition of the adjacency matrix is given by the Formula (1).
A n × m = ( a 11 a 1 n a m 1 a m n )
Among it, If  a i j  = 1 there is an exchange of materials and energy between company i and company j. If  a i j  = 0, there is no exchange of materials and energy between company i and company j.
UCINET could transform the adjacency matrix into a topological network diagram. Clustering coefficient and mean path length are used to describe the nature of the topology of MSWRSN.

3.2. Vulnerability Assessment of MSWRSN

This study intends to apply the relevant instrumental methods of complex network theory to analyze the vulnerability of realistic MSWRSN. The principle of vulnerability analysis based on complex network theory could be expressed by the following equation. The vulnerability V of the network G under the D attack could be defined as:
V [ G , D ] = Φ [ G ] W [ G , D ] Φ [ G ]
D  is the set of possible attacks on the network. It represents the network after an attack,  G D ( G , d ) G d D . The percentage of degradation in network functionality indicates the importance of the attack (vulnerability). When it is the minimum value, it indicates the most severe attack on the network.  Δ Φ / Φ d Δ Φ = Φ [ G ] Φ [ D ( G , d ) ] 0 Φ [ D ( G , d ) ] d D G . The range of values of which is:  W [ G , d ] = Φ [ D ( G , d ) ] V [ G , d ] [ 0 , 1 ] .
With reference to this formula, a vulnerability in MSWRSN could be defined as the impact of external threats on the proportion of the decline in system function [36]. The networked symbiotic system M of the eco-industrial park is under the influence of the threat W. Its vulnerable V could be obtained as:
V ( M , W ) = f ( M ) f [ M ( w ) ] f ( M )
The above formula indicates the symbiotic system composed of various enterprises within the eco-industrial park.  M W  means the set of possible threats to the system. The threat set in this study refers to a situation where a problem in one of the enterprises within the symbiotic ecosystem causes the system to break down; f means the system functional measure function;  f ( M )  means the function of the whole symbiotic system;  f [ M ( w ) ]  means the network function of the system after a threat has been made; and  Δ f / f  indicates the vulnerability of subsystem  M  after an attack. It is important to note that  V ( M , W )  takes values between  [ 0 , 1 ] , and  Δ f = f ( M ) f [ M ( w ) ] 0 .
Network functionality is measured by indicators such as connectivity, resilience, and coherence [36]. Combined with the characteristics of MSWRSN, the above three functional functions are briefly analyzed and discussed.
Network connectivity is often measured by removing nodes. It means that the node is assumed to have failed and the path length of the network features before and after the deletion of the node is calculated. The connectivity of the network is measured by comparing the order of magnitude before and after the two. The specific calculation formula of the characteristic path length L is shown in Formula (4). The characteristic path length is the average of the shortest paths of all nodes in the network system.
L = 1 n ( n 1 ) i j l i , j
The above equation is the shortest length of the network node and the path between them. It could be calculated by the following formula:
l i , j = min a ( i , j ) e i , j
In the research, scholars have found that the study of networks with isolated nodes could measure the impact of isolated nodes on network function. It is mainly measured through node shrinkage. Coherence could be used as a measure of network functionality. Cohesiveness is defined as:
( G ) = 1 n · L = 1 n n ( n 1 ) · Σ i j l i , j = n 1 Σ i j l i , j
The concept of resilience was introduced by Cozzens et al. [37]. G(V,E) consists of  I = ω ( G )  linked sub-graphs, denoted, respectively, as  G 1 ( V 1 , E 1 ) G 2 ( V 2 , E 2 ) …  G t ( V t , E t ) γ ( G )  means the order of the largest connected branch, i.e.,  γ ( G ) = | max ( V 1 , V 2 , , Vt ) | . Network failures could be described in triples.
V ( G ) = { S , ω ( G S ) , γ ( G S ) }
S is the set of network failure nodes or the set of edge failures. It reflects the network failure mode;  ω ( G S )  is the number of remaining network connected branches.  γ ( G S )  is the number of nodes or edges of the maximum connected branch. These two indicators could reflect the disruption of the network.
Resilience is defined as:
T ( G ) = min { | s | + γ ( G S ) ω ( G S ) }
Resilience is a measure that takes into account both the damage to the network and the state of the remaining parts of the network. It is the ideal parameter for network vulnerability.

4. Simulation

4.1. A Brief Introduction to Panjin

Panjin covers a total area of 4102.9 square kilometers. It is under the jurisdiction of one county and three districts. The city’s resident population is 1.44 million. In 2020, the city generated a total of about 690,000 tons of waste, including six types of waste such as domestic waste and municipal sludge. The city’s household waste harmless treatment rate reaches 100%. Panjin has a flat topography with many water resources and no mountains. The city’s urban and rural transportation conditions are convenient. Among them, 323 villages are fully covered by tarred roads. It has good conditions to carry out urban–rural integrated sanitation in terms of city scale, traffic conditions and classification basis.
The overall goal of the construction of a zero-waste city in Panjin could be summarized as three systems, four models, and five colors. The three systems are to build the institutional system, technical system, and regulatory system. The four models include (1) the “zero waste mining area” model of Liaohe oilfield; (2) green and high-quality development model of the petrochemical and fine chemical industry; (3) the model of urban and rural solid waste integration, the whole process, and refinement of sanitation; (4) resource utilization model of livestock and poultry manure in the Dawa District. The five colors refer to (1) black: waste from the petroleum and petrochemical industry will be reduced and treated with high value; (2) red: the whole process of hazardous waste is standardized; (3) blue: domestic waste is managed in a holistic and collaborative manner; (4) gold: agricultural waste is greened at source, standardized in the process of recycling, and high value in comprehensive utilization; (5) green: it achieves a refined green management approach. The city aims to build a “zero waste city” to transform and upgrade resource-depleted cities.

4.2. Construction of the Topology for MSWRSN

According to the plan for the construction of a zero-waste city in Panjin, a recycling transformation demonstration park will be built in Liaodong Bay New District. The park will be a complex MSWRSN when completed. The network consists of four components, urban residential solid waste recycling, industrial solid waste recycling, mining solid waste recycling, and agricultural product waste recycling. Among them, industrial waste recycling could be further divided into petrochemical and fine chemical and modern manufacturing recycling. The park is a complex network, and Figure 1 shows a sketch of the system of this symbiotic network. Its residential waste treatment plants are connected to various nodes.
The symbiotic network of waste recycling establishes industrial symbiosis mainly through the exchange of products, energy, and waste streams. The main links are: (1) municipal domestic waste→incineration→power generation→various enterprises; (2) municipal domestic waste→incineration→waste heat steam→various enterprises; (3) rice husk→combustion→power generation→various enterprises; (4) crop straw→catalytic hydrolysis→fuel→various enterprises; (5) vegetable oil by-products→comprehensive treatment→chemical products→various enterprises; (6) oil sludge→comprehensive treatment→new fuel→various enterprises. Material, energy, and information flow and share between chains. They are interlaced and laterally coupled with each other, forming a net-like structure for the entire symbiosis. Table 3 shows the core companies and role projects involved in symbiotic networks.
The project takes companies related to waste recycling within and around the Liaodongwan New District Recycling Demonstration Park in Panjin as nodes. The exchanges of materials, energy, and information between enterprises are used as edges. Although there are directional problems in the flow of material, energy, and information between enterprises in the network, the most common of the symbiotic relationships is the mutually beneficial symbiosis. In the study of symbiotic network stability, some researchers have made a point. It is that when there is a problem in the production and operation of one company in symbiotic networks, it may lead to the paralysis of the production and operation of the whole symbiotic chain. The raw materials used by downstream enterprises for production mainly come from the waste or by-products produced by upstream enterprises. The production of the downstream enterprises will be largely dependent on the upstream enterprises. This increases the instability in the production and operation of downstream enterprises. Likewise, the production and operation of upstream enterprises is also largely influenced by the production and operation of downstream enterprises. This leads to the instability of the industrial symbiosis network in the Eco-Industrial Park in turn. As could be seen, there is an interaction between the enterprises in the operation of the industrial symbiosis network. The project starts from the perspective of mutually beneficial symbiosis and interactive influence among waste recycling enterprises. At the same time, it considers that the study of complex network theory in municipal solid waste recycling is in its infancy. Therefore, the network is simplified as an entitled network to study.
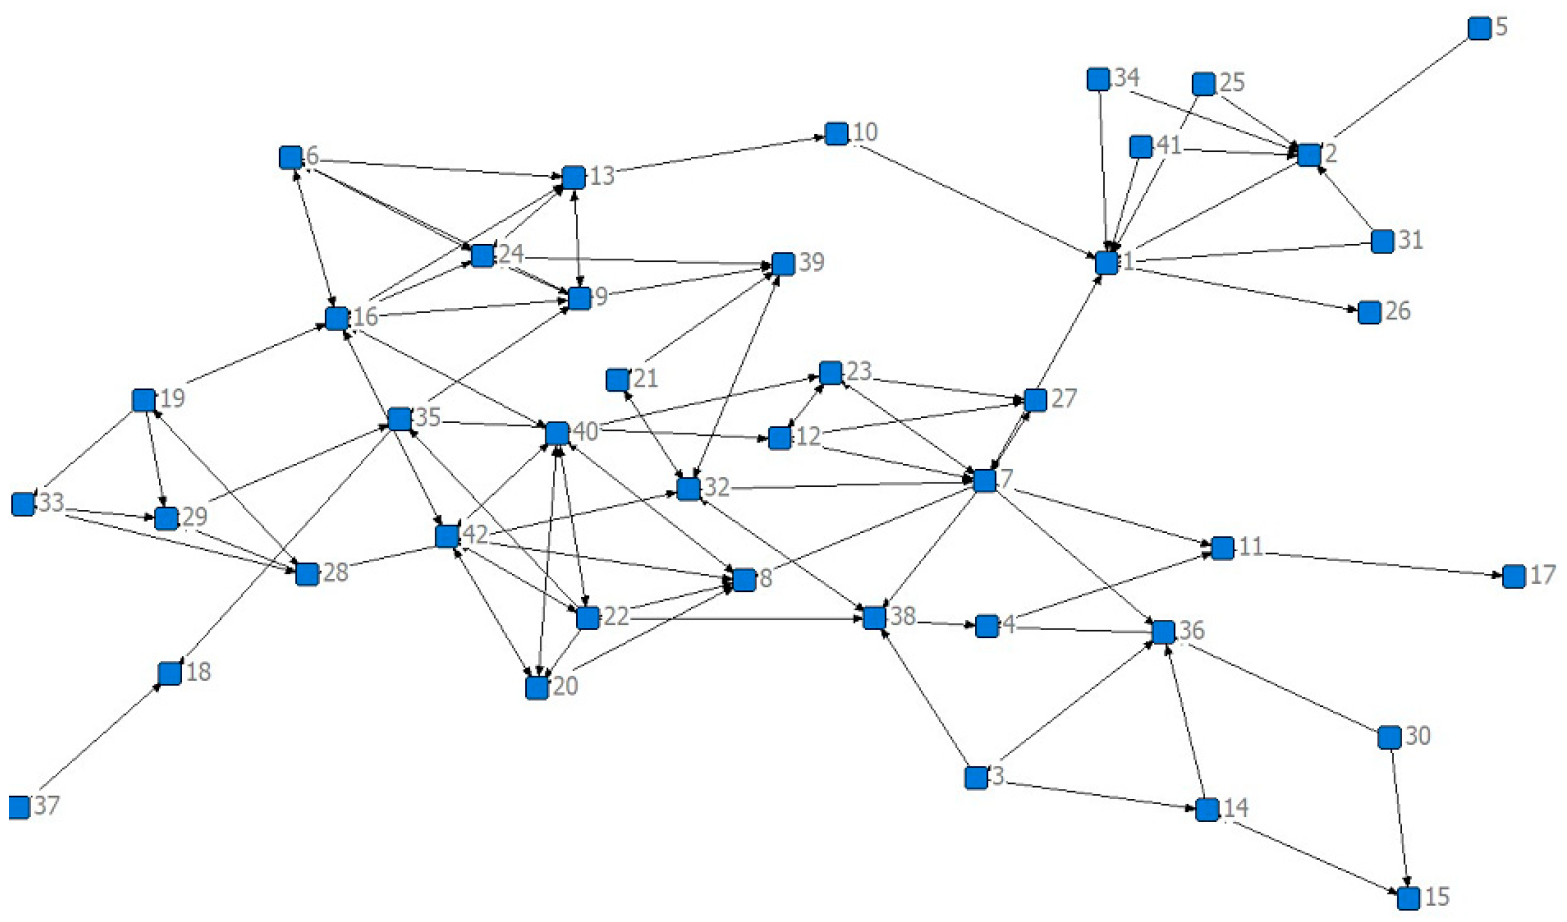
The study investigated the enterprises of waste recycling in Panjin. A total of 42 companies were found to have close interrelationships with each other, leading to an adjacency matrix. The Ucinet software 6.633 was also used to draw up the topology of symbiotic networks for municipal solid waste recycling. The details are shown in Figure 2.
Topological parameters are the effective indicators to characterize the network. We selected four metrics, namely clustering coefficient, average degree, and average path length, to quantitatively analyze the structural characteristics of the three constructed symbiotic networks. The output of the Matlab 7.0 programming calculation is shown in Table 4.
The clustering coefficient is a characteristic parameter that measures the degree of network conglomeration. The larger the clustering coefficient, the closer the connected the firms in the network, and the higher the degree of. Both average degree and average path length could measure the strength of network relationships. The higher the average degree, the shorter the average path length and the higher the strength of the network relationship. The clustering coefficient of the symbiotic network is 0.404. It indicates the highest network centrality. The average path of the network is 3.451. It could be considered that the shortest relationship chain connecting two nodes could be connected by three or four companies on average. In practice, it could be interpreted that a portion of enterprises could be connected to each other by nodes. A part of enterprises are not connected by edges but have smaller average paths. These studies suggest that Panjin waste resources already have network characteristics

4.3. Simulation Experiment and Data Analysis

There are various failure modes of symbiotic networks, but the main modes are single-node failure mode, multi-node failure mode, and edge failure mode. The probability of simultaneous failure of two municipal solid waste enterprises is low. Therefore, simulation experiments are conducted only for single node failure and edge failure modes under the chain failure effect.

4.3.1. Single Node Failure Mode

We successively removed the network nodes and calculated the value of V(S, T) with the node mesonumber bv(i). As could be seen by the vulnerability indicators and node betweenness in Table 5, the impact of each node is significantly variable. For example, when f7 failed, the network efficiency dropped by 34.06%. When f9 failed, the efficiency dropped to 9.21%. f1, f7, f9, f11, f12, f32, f35, and f38 all appear in the top 10 rankings for vulnerability and node betweenness. Node 7 is the top-ranked node in terms of vulnerability and node betweenness. This shows that the enterprises responsible for the treatment of residential waste (f7), the enterprises engaged in the comprehensive utilization of construction waste (f32), and the enterprises responsible for the treatment of agricultural waste (f1) have an important impact on the whole system. Other companies, especially downstream companies, have a relatively small impact on the system. This is because the heat formed during the operation of the residential waste treatment enterprises is useful. It could be used by other enterprises in the demonstration park for resource-based recycling. Construction waste treatment companies could also provide raw materials downstream. If these three nodes fail, the whole system will not function efficiently. Some other companies such as f9, f39, and the companies not shown in the table have a smaller impact on the system. This indicates a more complex relationship between firms in the chemical industry. The vulnerability of nodal companies is lower than that of residential waste treatment enterprises, construction waste recycling enterprises, and agriculture waste treatment enterprises. One of the main reasons is the existence of multiple leading companies. Small and medium-sized companies have more options. Therefore, it is concluded that the MSWRSN model in Panjin is still between equality and nesting. The four areas do not form a nested relationship with each other and operate independently. Companies engaged in the collection and treatment of residential waste are the most vulnerable.
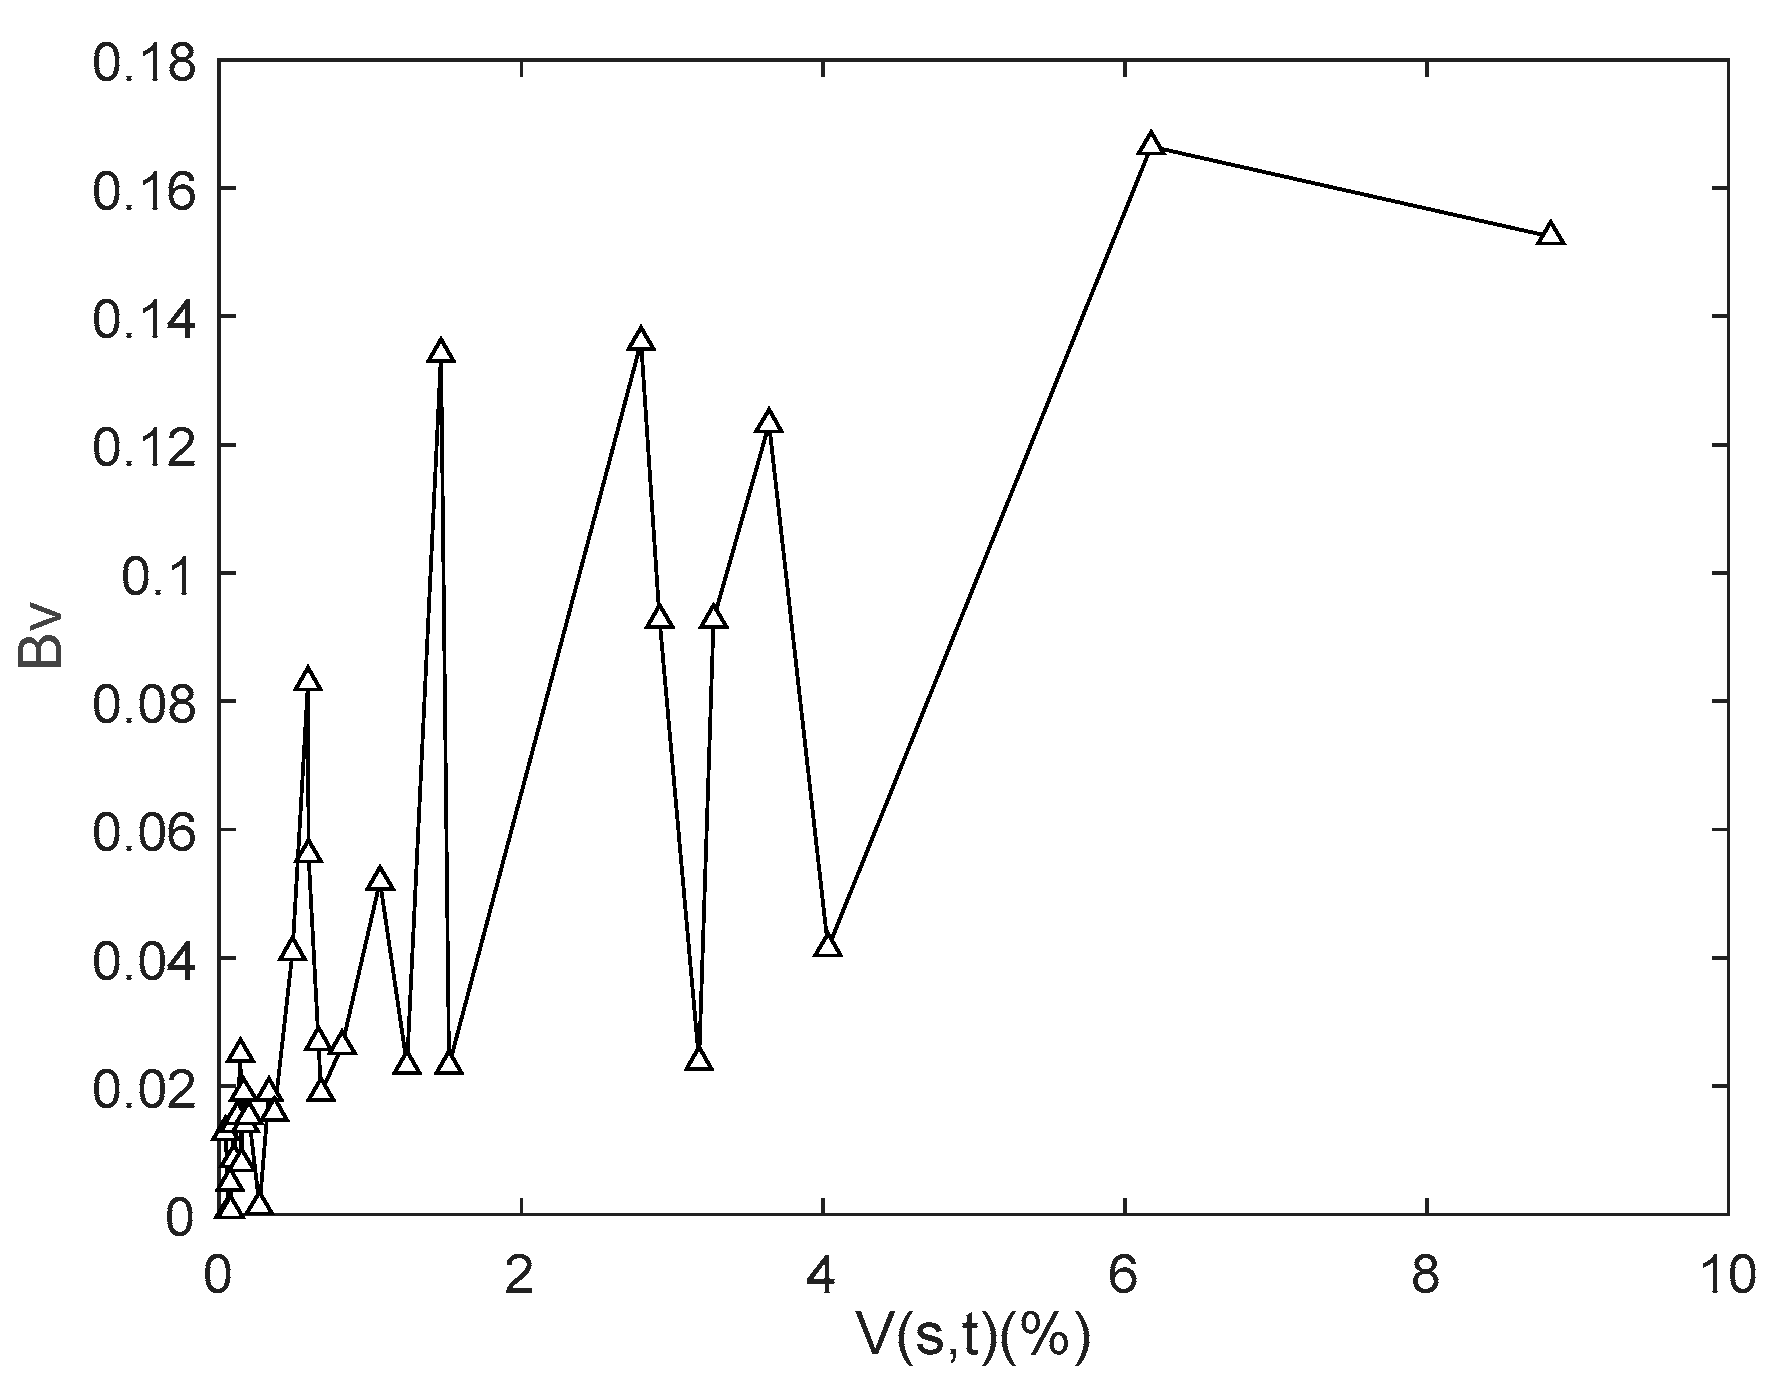
Figure 3 shows a roughly positive correlation between vulnerability and node betweenness. However, oscillations could occur in some locations. The reason for this phenomenon is that there is a certain amount of redundancy in the network. Some of the node functions are damaged and are replaced by other nodes. In addition, the relationship between vulnerability and node betweenness values is related to the number of nodes and their weights. There are 42 nodes in the Panjin symbiotic network, which is a limited number and leads to unbalanced results.

4.3.2. Edge Failure Mode

Similar to the single-node failure model, we compute V (S, T) and boundary value betweenness to be (i, j). Since there are hundreds of edges in total, we have chosen some representative ones. The result is shown in Table 6 and Figure 3. We find that the conclusion is similar to that of the single-node failure study. The effect of removing different edges on the efficiency of the network is different. The edges  e 1 , 7 e 4 , 11 e 7 , 1 e 11 , 7 e 12 , 7 e 35 , 9 e 36 , 4  all appear in the top 10 sequences of vulnerability and edge betweenness. However, removing edges has less impact on the network than removing nodes on the network. The largest vulnerability value was caused by removing edges  e 11 , 7 . The specific vulnerability value is 8.82%. However, the maximum vulnerability value caused by removing a single node f7 was 34.06%. This is because when a node is removed, the edges connected to the node are also removed. The impact on the system is therefore greater. The side  e 7 , 11   e 7 , 1  have the greatest vulnerability. They represent the industrial chain where residential waste is used to generate electricity. Of them, f11 represents the use of urban residential waste to generate electricity. f1 represents the use of rural waste from rice husks to generate electricity. In the study of node failures, f7 is the node of greatest vulnerability. In the edge failures, f7 is also the important node. It shows that in this network, the industrial chain of residential waste recycling is the most vulnerable. Failures in the network—once the quantity or quality of waste changes—could lead to a domino effect. Downstream companies could experience a shortage of raw materials, unable to produce as planned or produce substandard products, etc.
Figure 4 shows that vulnerability is also roughly positively correlated with the edge betweenness. However, the results are more severe under single-edge failure than under single-node failure. It occurs mainly when the betweenness values are larger or smaller. This suggests that the frequency of material exchange between firms determines the synergistic relationship and affects the efficiency of the network.

5. Discussion and Recommendations

This study examines the vulnerability of MSWRSN with the help of the construction of zero waste city in China. The study proposes a methodology for vulnerability assessment. Failures in symbiotic networks are studied by performing simulations of single-node failures and edge failures. This evaluation method could help us to effectively identify the role of the key nodes and edges in symbiotic networks. The simulation results show that, first, MSWRSN in Panjin has not yet formed a nested pattern. There are differences in the symbiotic pattern of different industrial chains. The symbiotic model of residential and construction solid waste recycling is a single point of dependence. Chemical and agricultural solid waste recycling are co-equal. Second, node failure of MSWRSN in Panjin has a greater impact on the network. Among them, the core enterprises that collect and transport municipal residential waste have the greatest impact on the network. This is followed by the core enterprises for construction solid waste recycling. Third, in Panjin, the vulnerability of the different chains in MSWRSN is different. The industrial chain for residential waste recycling is the most vulnerable.
In practice, we propose the following recommendations:

5.1. The City Should Promote the Construction of Solid Waste Information Technology

Technology has undergone dramatic changes, but the symbiotic units within the network do not adjust to external changes in time. There is then often a mismatch between system complexity and environmental complexity. The lower the degree of matching the less efficient the transformation of the network’s dynamic capacity, and the more vulnerable the network [37]. Companies in symbiotic networks should keep informed of relevant information from other companies and adjust their own production strategies. Building an IT platform is the least costly way for companies to access relevant information. At present, Panjin has built an “Internet+” system covering four types of waste, but other solid wastes such as domestic waste, kitchen waste, construction waste, and agricultural waste have not been included. The information construction of the symbiotic network in Panjin should focus on the following aspects: First, the relevant departments should expand the waste “Internet+” system and connect it to the provincial network. It includes all the other solid waste, such as domestic and kitchen waste. Second, a cloud platform for waste resource management should be established. The departments should include integrated solid waste treatment circular economy parks, industrial eco-parks, and enterprises related to waste recycling in the management cloud platform. Third, a trading platform for waste resource-based products should be established. The government should also keep track of the dynamics of transactions between enterprises based on relevant information. The department should detect unfavorable factors and make dynamic adjustments in time. In this way, the vulnerability of symbiotic networks will be able to be reduced.

5.2. The Government Should Pay Attention to the Operation of the Core Business, Identify Abnormalities and Make Adjustments in a Timely Manner

The department identifies problems that arise in these companies in a timely manner and responds quickly. It plays an important role in achieving dynamic risk management [38]. The operation and management of these enterprises should focus on the following aspects: First, companies should develop and apply material flow monitoring network technology. Municipal solid waste recycling in Panjin is different from other cities due to its large proportion of waste from agriculture and the chemical industry. By combining macro and micro information, the risks will be reduced. Second, the relevant departments should improve the benefit-sharing mechanism. In this way, the monopolistic behavior of core enterprises could be prevented. The government could consider raising government subsidies for resource-based enterprises to promote the extension of the industrial chain and encourage deep cooperation among member enterprises. Third, the government should focus on the problem of unstable quality of resource-based products due to fluctuations of key components and the transformation of harmful elements. The government should pay attention to whether the core enterprises have taken the necessary treatment of harmful substances to reduce the occurrence of secondary pollution incidents.

5.3. Relevant Departments Carry out Technology Innovation Demonstrations and Build Technology Innovation Networks

Due to the linkability of symbiotic networks, technological innovation is not only manifested in the technological research and development of individual enterprises within the network. What is more important is that network members adopt a collaborative and consistent innovation behavior. This ensures the overall stability of network operations [39]. On the one hand, MSWRSN requires waste producers to increase their research and development efforts to reduce the generation of waste. On the other hand, it requires recycling companies to innovate and improve the efficiency of waste recycling. The symbiotic network of waste recycling in Panjin has been initially formed. However, there are still some problems in waste reduction and resourcefulness compared with other domestic enterprises. This requires further investment in R&D. All parties make efforts to build it into an innovation network for waste recycling. The construction of the technological innovation network requires attention to the following aspects: First, technological developments should be combined with the characteristics of urban symbiotic networks. The main direction of municipal solid waste recycling in Panjin is chemical and agricultural products. Therefore, we should rely on universities and R&D institutions to effectively solve the problem of effective disposal and comprehensive utilization of oil sludge, floating residue, and tank bottom sludge generated from oil extraction. Second, an effective mechanism for technology exchange and sharing should be established. Panjin’s municipal waste recycling technology research needs to be carried out by large-scale enterprises. The role of government in symbiotic development is to develop policy and provide financial support. [40] Therefore, the government should provide financial support for the research and development of these technologies. This would accelerate industrialization and marketization. Third, joint technological development of symbiotic units should be promoted. In the R&D process, according to the characteristics of different fields of technology, joint strategies should be developed gradually from resource recycling symbiosis to higher levels.

6. Conclusions

“Zero waste city” is an important way for cities to achieve sustainable development. It requires the cooperation of municipal solid waste producers, recycling companies, the government, and scientific institutions [41]. Theoretical studies and practical experience with eco-industrial parks show that symbiotic networks are the most effective way to improve the eco-efficiency of eco-industrial parks [42]. The symbiotic network is a complex system. The characteristics of its structure, function, and model determine its vulnerability in the process of operation. It, in turn, affects the secure operation of the network, and thus the evolution of the network [43,44]. This study proposes the utilization of complex network theory to assess the vulnerability of MSWRSN. The methodology is verified by simulation. The study shows that:
First, there is a vulnerability in MSWRSN. A topology diagram of MSWRSN was constructed. Changes in network efficiency were calculated by removing nodes (edges). It was found that the efficiency of the network decreased significantly after some nodes (edges) were removed. This is the evidence of vulnerability of MSWRSN.
Second, there is a state of imbalance in the development of MSWRSN. The simulation analysis revealed a large difference in the impact of different failure edges of symbiotic networks on network efficiency. This difference is mainly related to the nature of the recycling chain. The vulnerability of the industrial waste recycling chain is lower than that of the municipal waste recycling chain and the construction solid waste chain.
Third, MSWRSN has not yet developed a nested pattern. Therefore, it has a strong vulnerability. The simulation results show that the industrial solid waste symbiosis network is in an equal model. The municipal waste symbiosis network is in the monocentric dependency mode.
This study investigates the vulnerability of MSWRSN through complex network theory. The proposed model takes full account of the complexity of the symbiotic network and the interrelationships between enterprises. A quantitative calculation of the vulnerability of MSWRSN is achieved. It could effectively identify the key node enterprises and edges of the symbiotic network, which has more general applicability. This study could be used as a reference for the construction, risk decision-making, and management of the symbiotic networks for zero-waste cities.
However, this project has the following shortcomings which need further study. First, due to objective constraints, we have researched 20 enterprises related to municipal solid waste recycling in Panjin. These enterprises involve municipal waste, construction solid waste, chemical waste, agricultural waste, etc. The number of nodal firms is relatively few. The symbiotic network is also relatively simple. This causes the advantages of complex network theory to be unrealized. The case is only used as a validation of the proposed model. In future studies, it would be desirable to find a larger city to use as a case study. Second, the vulnerability evaluation lacks the influence of external factors. The project mainly measures the vulnerability of the system by measuring the changes in network efficiency under two modes of single node failure and edge failure. It lacks an analysis of the overall system performance. In fact, the vulnerability of symbiotic network systems is influenced by many factors, including market, policy, environment, public opinion, etc. It is not convincing enough to simplify the model to node failure and edge failure. Therefore, in future studies, it is necessary to construct a linkage model for external influencing factors.

Author Contributions

Q.W. did the writing of the original manuscript, M.C. did the research and Y.Y. did the simulation of the software. All authors have read and agreed to the published version of the manuscript.

Funding

Thanks for The Research on the Vulnerability and Governance Mechanism of Urban Waste Resource Symbiosis Network Based on CAS Theory, grant number 18YJC790167.

Data Availability Statement

To improve the reliability and validity of the case analysis and ensure the reliability of the data, this study collects the relevant data on the non-waste urban construction in Panjin in multiple dimensions and through multiple channels. It mainly includes ① the official website of Ecology and Environment of the People’s Republic of China; ② Official data of Panjin Ecological Environment public account, media interviews, and reports in Liaoning Province; ③ Major press conferences, interviews, and related articles on the Internet held by the Ministry of Environment, PRC; ④ Relevant journal papers, etc. The data collected in this study are real-time and are checked repeatedly in the process of data collection to ensure that they are not affected by third-party evaluation.

Conflicts of Interest

The authors declare no conflict of interest.

References

  1. Mahdavi, M.; Vera, D. Importance of renewable energy sources and agricultural biomass in providing primary energy demand for Morocco. Int. J. Hydrogen Energy 2023, in press. [Google Scholar] [CrossRef]
  2. Ying, C.; Jing, T.; Na, Z. The meaning, objectives and construction of the “zero waste city” pilot project Pathways. Environ. Prot. 2019, 47, 21–25. [Google Scholar] [CrossRef]
  3. General Office of the State Council of the People’s Republic of China. The Pilot Work Plan for the Construction of ‘Zero-Waste Cities’ (In Chinese). 2018. Available online: https://www.gov.cn/zhengce/con-tent/2019-01/21/content_5359620.htm (accessed on 21 February 2020).
  4. Awasthi, A.K.; Cheela, V.S.; D’adamo, I.; Iacovidou, E.; Islam, M.R.; Johnson, M.; Miller, T.R.; Parajuly, K.; Parchomenko, A.; Radhakrishan, L.; et al. Zero waste approach towards a sustainable waste management. Resour. Environ. Sustain. 2021, 3, 100014. [Google Scholar] [CrossRef]
  5. Lee, R.P.; Meyer, B.; Huang, Q.; Voss, R. Sustainable waste management for zero waste cities in China: Potential, challenges and opportunities. Clean Energy 2020, 4, 169–201. [Google Scholar] [CrossRef]
  6. Chen, X.; Dong, M.; Zhang, L.; Luan, X.; Cui, X.; Cui, Z. Comprehensive evaluation of environmental and economic benefits of industrial symbiosis in industrial parks. J. Clean Prod. 2022, 354, 131635. [Google Scholar] [CrossRef]
  7. Wadström, C.; Johansson, M.; Wallén, M. A framework for studying outcomes in industrial symbiosis. Renew. Sustain. Energy Rev. 2021, 151, 111526. [Google Scholar] [CrossRef]
  8. Chopra, S.S.; Khanna, V. Understanding resilience in industrial symbiosis networks: Insights from network analysis. Environ. Manag. 2014, 141, 86–94. [Google Scholar] [CrossRef]
  9. Allenby, B.; Fink, J. Toward inherently secure and resilient societies. Science 2005, 309, 1034–1036. [Google Scholar] [CrossRef] [Green Version]
  10. Behera, S.K.; Kim, J.H.; Lee, S.Y.; Suh, S.; Park, H.S. Evolution of ‘designed’ industrial symbiosis networks in the Ulsan Eco-industrial Park: ‘research and development into business’ as the enabling framework. J. Clean. Prod. 2012, 29, 103–112. [Google Scholar] [CrossRef]
  11. Khan, Z.A.; Chowdhury, S.R.; Mitra, B.; Mozumder, M.S.; Elhaj, A.I.; Salami, B.A.; Rahman, M.M.; Rahman, S.M. Analysis of industrial symbiosis case studies and its potential in Saudi Arabia. J. Clean. Prod. 2022, 385, 414. [Google Scholar] [CrossRef]
  12. Maqbool, A.S.; Alva, F.M.; Van Eetvelde, G. An assessment of European information technology tools to support industrial symbiosis. Sustainability 2019, 11, 131. [Google Scholar] [CrossRef] [Green Version]
  13. Lyons, D. Integrating waste, manufacturing and industrial symbiosis: An analysisof recycling, remanufacturing and waste treatment firms in Texas. Local Environ. 2005, 10, 71–86. [Google Scholar] [CrossRef]
  14. Blasi, A.; Verardi, A.; Sangiorgio, P. The zero-waste economy: From food waste to industry. Membr. Eng. Circ. Econ. 2022, 3, 63–100. [Google Scholar] [CrossRef]
  15. Patricio, J.; Axelsson, L.; Blomé, S.; Rosado, L. Enabling industrial symbiosiscollaborations between SMEs from a regional perspective. J. Clean Prod. 2018, 202, 1120–1130. [Google Scholar] [CrossRef]
  16. Taddeo, R.; Simboli, A.; Morgante, A.; Erkman, S. The development of industrialsymbiosis in existing contexts. Experiences from three Italian clusters. Ecol. Econ. 2017, 139, 55–67. [Google Scholar] [CrossRef]
  17. Lybaek, R.; Christensen, T.B.; Thomsen, T.P. Enhancing policies for deployment of Industrial symbiosis—What are the obstacles, drivers and future way forward? J. Clean. Prod. 2021, 280, 124351. [Google Scholar] [CrossRef]
  18. Fric, U. Socio-cultural aspects and barriers of industrial symbiosis—The good, the bad and the ugly: Which ones matter and why. In Proceedings of the 4th International Conference on Economics, Political and Law Science, Rome, Italy, 7–9 November 2015; pp. 125–131. [Google Scholar]
  19. Herczeg, G.; Akkerman, R.; Hauschild, M.Z. Supply chain collaboration in industrial symbiosis networks. J. Clean. Prod. 2018, 171, 1058–1067. [Google Scholar] [CrossRef] [Green Version]
  20. Södergren, K.; Palm, J. The role of local governments in overcoming barriers to industrial symbiosis. Clean. Environ. Syst. 2021, 2, 100014. [Google Scholar] [CrossRef]
  21. Tao, Y.; Evans, S.; Wen, Z.; Ma, M. The influence of policy on industrial symbiosis from the Firm’s perspective: A framework. J. Clean. Prod. 2019, 213, 1172–1187. [Google Scholar] [CrossRef]
  22. Bain, A.; Shenoy, M.; Ashton, W.; Chertow, M. Industrial symbiosis and wasterecovery in an Indian industrial area. Resour. Conserv. Recycl. 2010, 54, 1278–1287. [Google Scholar] [CrossRef]
  23. Li, Y.; Shi, L. The Resilience of interdependent industrial symbiosis networks:a case of Yixing economic and technological development zone. Ind. Ecol. 2015, 19, 264–273. [Google Scholar] [CrossRef]
  24. Singhal, S.; Kapurb, A. Industrial estate planning and management in India—An integrated approach towards industrial ecology. Environ. Manag. 2002, 66, 9–29. [Google Scholar] [CrossRef] [PubMed]
  25. Sokka, L.; Lehtoranta, S.; Nissinen, A.; Melanen, M. Analyzing the environmental benefits of industrial symbiosis: Life cycle assessment applied to a Finnish forest industry complex. Ind. Ecol. 2011, 15, 137–155. [Google Scholar] [CrossRef]
  26. Sokka, L.; Pakarinen, S.; Melanen, M. Industrial symbiosis contributing to more sustainable energy use e an example from the forest industry in Kymenlaakso. Finl. Clean. Prod. 2011, 19, 285–293. [Google Scholar] [CrossRef]
  27. Geng, Y.; Fu, J.; Sarkis, J.; Xue, B. Towards a national circular economy indicator system in China: An evaluation and critical analysis. Clean. Prod. 2012, 23, 216–224. [Google Scholar] [CrossRef]
  28. Sendra, C.; Gabarrell, X.; Vicent, T. Material flow analysis adapted to an industrial area. J. Clean. Prod. 2007, 15, 1706–1715. [Google Scholar] [CrossRef]
  29. Kurup, B.; Stehlik, D. Towards a model to assess the sustainability implica-tions of industrial symbiosis in eco-industrial parks. Prog. Ind. Ecol. 2009, 6, 103–119. [Google Scholar] [CrossRef]
  30. Pakarinen, S.; Mattila, T.; Melanen, M.; Nissinen, A.; Sokka, L. Sustainability and industrial symbiosisdthe evolution of a Finnish forest industry complex. Resour. Conserv. Recycl. 2010, 54, 1393–1404. [Google Scholar] [CrossRef]
  31. Nair, A.; Vidal, J.M. Supply network topology and robustness against disruptions e an investigation using multi-agent model. Int. Prod. Res. 2011, 49, 1391–1404. [Google Scholar] [CrossRef]
  32. Xiao, Z.; Cao, B.; Sun, J.; Zhou, G. Culture of the stability in an eco-industrial system centered on complex network theory. J. Clean. Prod. 2016, 113, 730–742. [Google Scholar] [CrossRef]
  33. Wang, G.; Feng, X.; Chu, K.H. A novel approach for stability analysis of in-dustrial symbiosis systems. J. Clean. Prod. 2013, 39, 9–16. [Google Scholar] [CrossRef]
  34. Zeng, Y.; Xiao, R.; Li, X. Vulnerability Analysis of Symbiosis Networks of Industrial Ecology Parks. Procedia Comput. Sci. 2013, 17, 965–972. [Google Scholar] [CrossRef] [Green Version]
  35. Zeng, Y. Evaluation of node importance and invulnerability simulation analysis in complex load- network. Neurocomputing 2020, 416, 158–164. [Google Scholar] [CrossRef]
  36. Erdos, P.; Renyi, A. Academy of Sciences; Publications of the Mathematical Institute of the Hungarian; Academy of Sciences: Budapest, Hungary, 1956. [Google Scholar]
  37. Recycling Technologies. Technology. Available online: https://recyclingtechnologies.co.uk/technology/ (accessed on 30 April 2020).
  38. Cottrill, K. Speedier supply chains. Traffic World 2000, 261, 16–17. [Google Scholar]
  39. Henriques, J.; Ferrão, P.; Castro, R.; Azevedo, J. Industrial symbiosis: A sectoralanalysis on enablers and barriers. Sustainability 2021, 13, 1723. [Google Scholar] [CrossRef]
  40. Cárcamo, E.A.B.; Peñabaena-Niebles, R. Opportunities and challenges for the waste management in emerging and frontier countries through industrial symbiosis. J. Clean. Prod. 2022, 363, 132607. [Google Scholar] [CrossRef]
  41. Ma, W.; de Jong, M.; Zisopoulos, F.; Hoppe, T. Introducing a classification framework to urban waste policy: Analysis of sixteen zero-waste cities in China. Waste Manag. 2023, 165, 94–107. [Google Scholar] [CrossRef]
  42. Bui, T.-D.; Tseng, J.-W.; Tseng, M.-L.; Wu, K.-J.; Lim, M.K. Municipal solid waste management technological barriers: A hierarchical structure approach in Taiwan. Resour. Conserv. Recycl. 2022, 190, 2023. [Google Scholar] [CrossRef]
  43. Folke, C. Resilience: The emergence of a perspective for social–ecological systems analyses. Glob. Environ. Change 2006, 16, 253–267. [Google Scholar] [CrossRef]
  44. Pheng, L.S.; Ying, L.J.; Kumaraswamy, M. Resilience and vulnera-bility: Complementary or conflicting concepts? Ecol. Soc. 2010, 15, 11. [Google Scholar] [CrossRef]
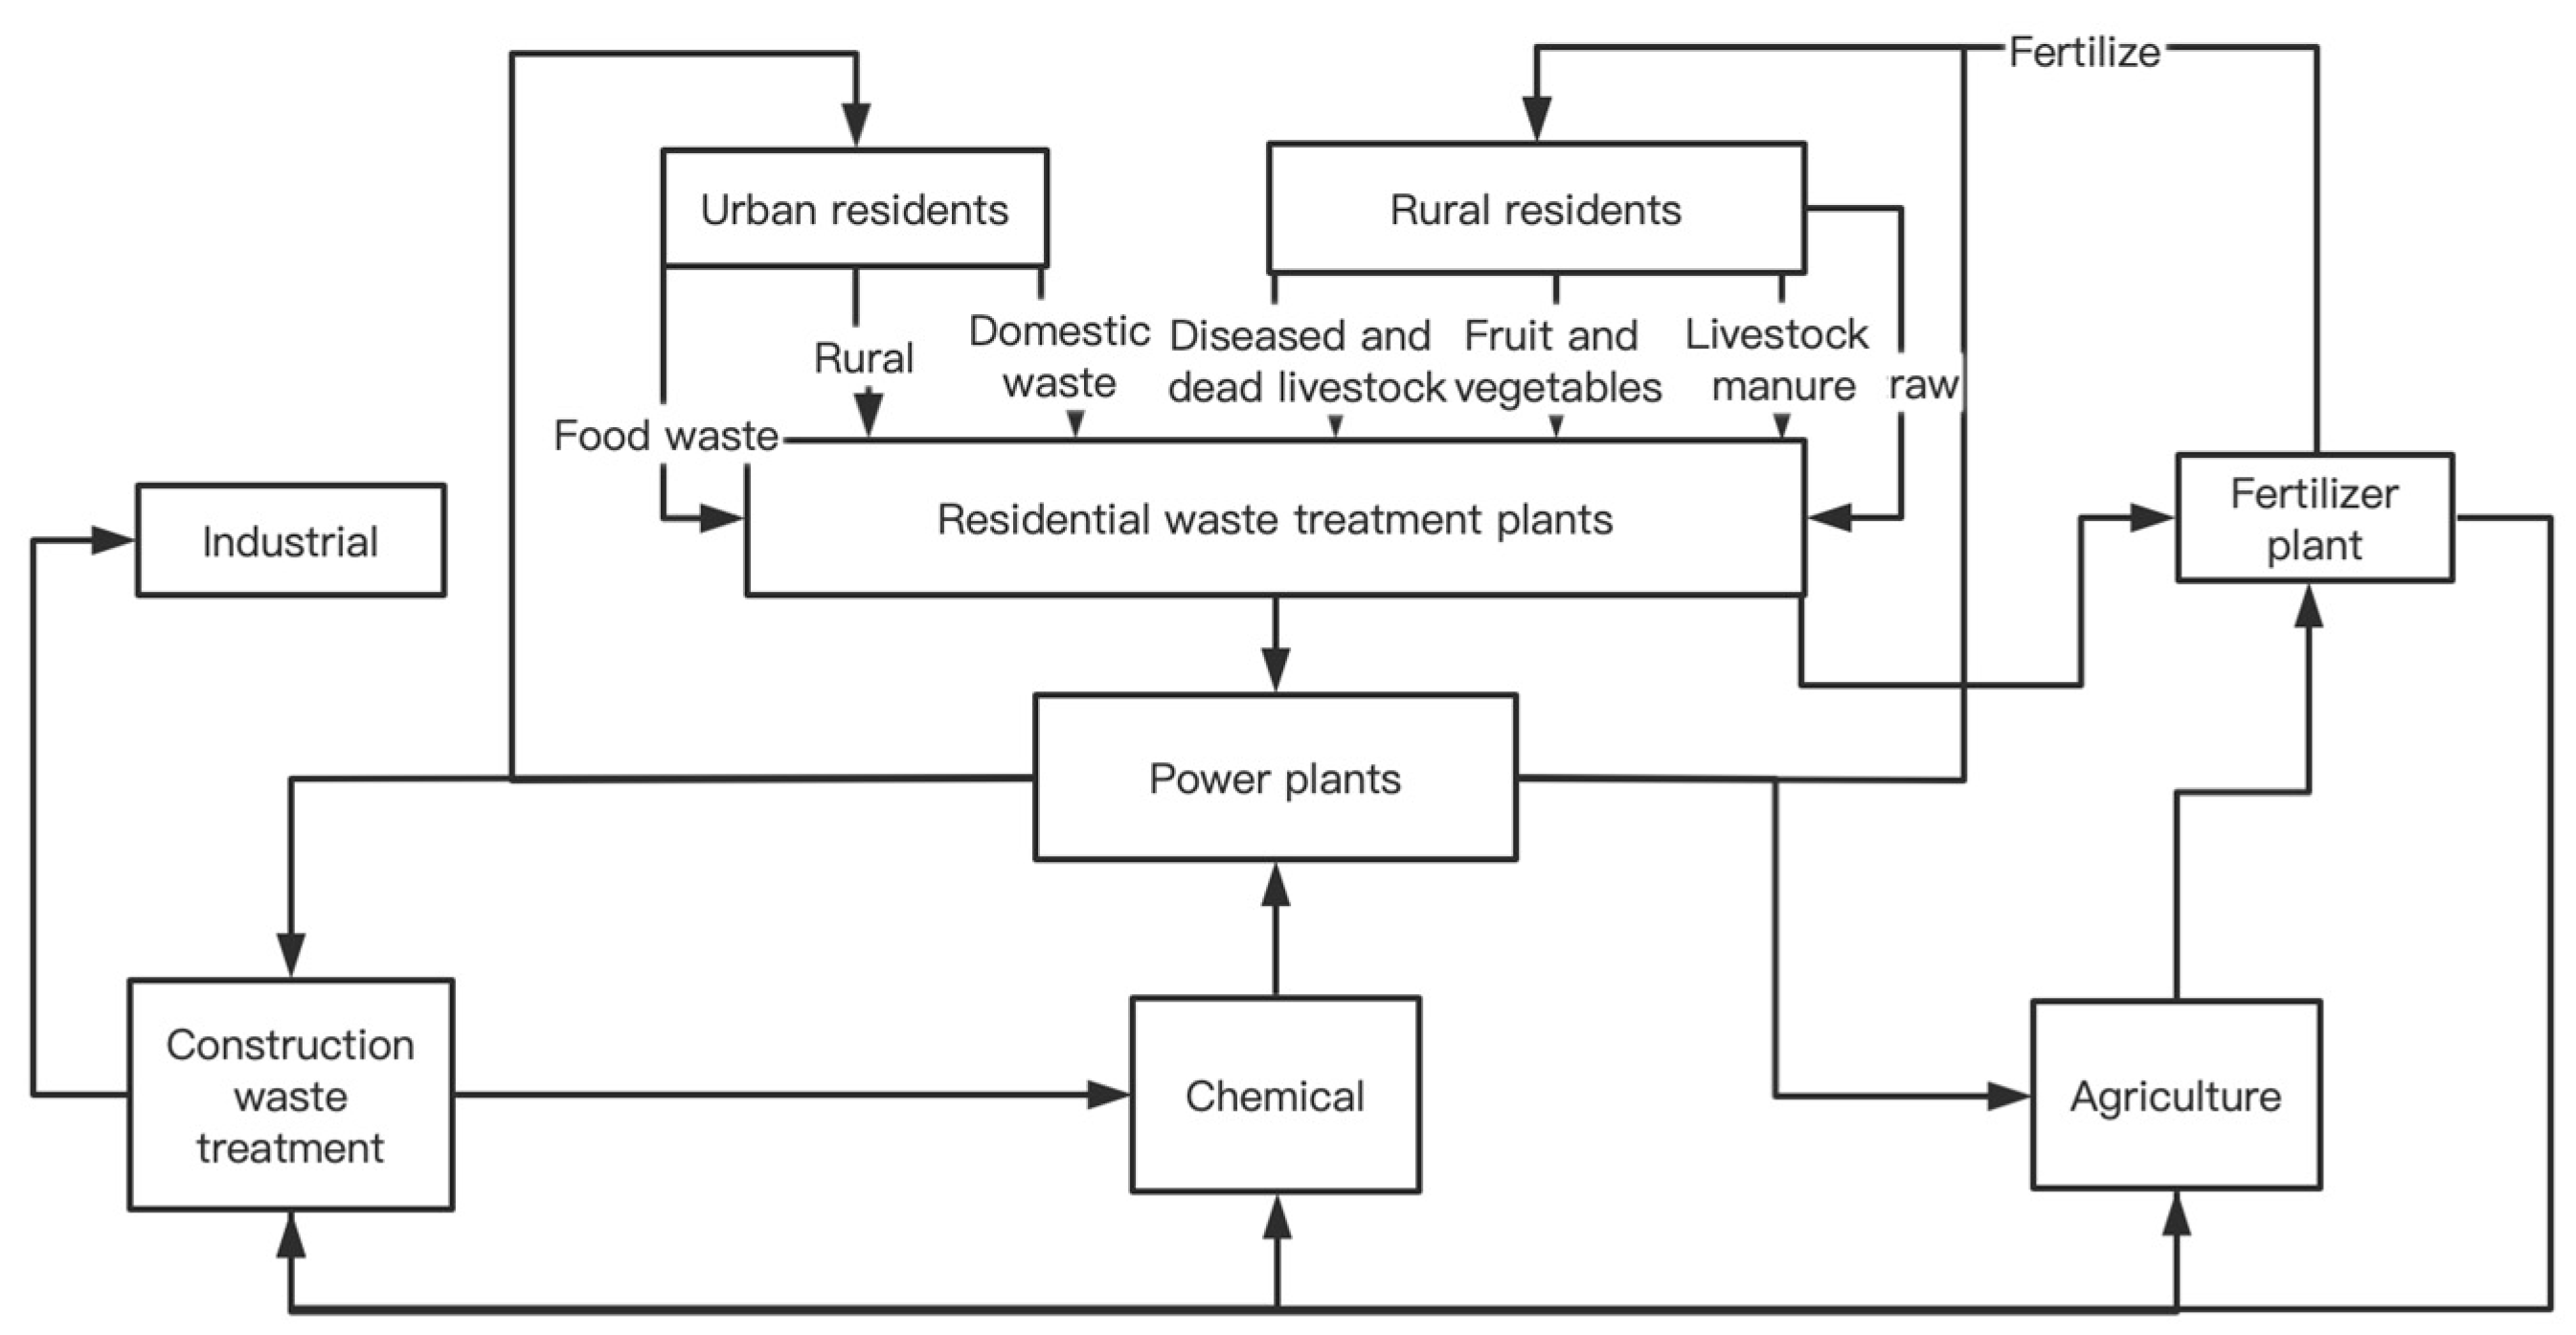
Figure 1. MSWRSN Flow Chart.
Energies 16 04711 g001
Figure 2. Topology of MSWRSN.
Energies 16 04711 g002
Figure 3. Scatter plot of node mesonumber versus node vulnerability under single node failure.
Energies 16 04711 g003
Figure 4. Scatterplot of node betweenness and edge vulnerability under single edge failure.
Energies 16 04711 g004
Table 1. Comparison of the methods.
MethodsCharacteristicsLiterature
life cycle assessmentThis method considers the energy and material supply chain. It is used to evaluate the environmental impacts arising from resource utilization and services. The approach avoids the transformation of environmental impact issues in different life cycle stages, in different regions, and in different environmental standards contexts.Sokka et al., 2011a [25] 2011b [26]
material flow analysisThis method starts with the quality of the physical object. It is divided into three parts: input, storage, and output. The flow characteristics and transformation efficiency in a specific region are revealed.Geng et al., 2012 [27]
Sendra et al., 2007; [28]
environmental indicatorThis method is based on the development of an evaluation model to conduct environmental governance evaluation.Kurup and Stehlik, 2009; [29]
Pakarinen et al., 2010; [30]
network theoryThis approach studies the impact of network structure and unit relationships on the organization.Nair and Vidal, 2011 [31]
Chopra and Khanna, 2014 [8]
Table 2. A comparison of three qualitative studies.
TimeNumber of
Participants
Accessing Data
Participant observationfrom 2020-10-08 to 2021-10-1215Government Documents
Waste Recycling Management Process
In-person and telephone interviewsfrom 2021-04-15 to 2022-05-1220Input of waste resources from selected companies
Output data
List of participants in the questionnaire
Questionnaire surveyfrom 2021-06-15 to 2021-08-1293Inputs of waste resources from selected companies
Output data
Risk management situation
Table 3. Classification of specific symbiotic networks.
Symbiosis Unit CategoryMajor ProjectsMajor Companies
ResidentsDomestic waste landfills
Medical waste incineration
Sludge drying
Domestic waste incineration for power generation
Panjin Jinghuan Environmental Protection Technology Co.
Panjin Xinlitong Recycling Resources Co.
IndustrialOil sludge resource utilization and harmless disposal
Comprehensive utilization of construction waste to produce aggregates and masonry bricks
Waste tire resource recycling
Chemical catalytic recycling and reuse comprehensive project
Panjin Liaohe Oilfield Yuanda Oil Sludge Treatment Treatment and Utilization Co.
Shenghong Group
Panjin Yuwang Waterproof Building Material Group
Panjin Xinyanyuan Chemical Industry Co.
MinesDrilling process of “no mud on the ground”
Reduction of landed mud at source
Disposal of waste mud and paving of well sites, roads, and other construction materials, etc.
Resourceful use and harmless disposal of oil sludge
CNOOC Liaoning River Oilfield Branch
Changcheng Drilling Company of CNOOC Liaoninghe Oilfield Branch
Sinopec Liaohe Oilfield Xinglongtai Oil Production Plant
Panjin Liaohe Oilfield Liaohe Industrial Group Co.
Panjin Liaohe Oilfield Yuanda Oil Sludge Treatment and Utilization Co.
AgricultureComprehensive utilization of vegetable oil by-products
Centralized heating and power supply of rice husk fuel
Comprehensive utilization of crop straw
Comprehensive utilization of livestock and poultry manure
Liaodong Bay Xinhaiyuan Biotechnology Co.
Yihai Kerry (Panjin) Food Industry Co.
Liaoning Zhenxing Ecological Group Development Co.
Panjin Jinchang Animal Husbandry Co.
Panjin North Asphalt Co.
China Resources Panjin Thermal Power Plant
Shuguang Oil Production Plant
Table 4. Statistical characteristics parameters of MSWRSN in Panjin.
Number of NodesEdgesAverage DegreeAverage Weighted DegreeNetwork DensityAggregation FactorAverage Path LengthNetwork Diameter
Characteristic parameters421453.452150.0840.4043.4158
Table 5. Vulnerability and node mesonumber in single node failure mode (ex. top 10).
Serial NumberVulnerability in Descending OrderNode Betweenness in Descending Order
f(i)V(S, T)%bv(i)f(i)V(S, T)%bv(i)
1f734.060.5957f734.060.5957
2f3222.750.2476f119.330.3366
3f119.330.3366f3511.970.3055
4f1115.100.2268f1212.310.3055
5f1212.310.3055f3222.750.2476
6f3511.970.3055f1115.100.2268
7f3811.840.1445f99.210.2195
8f2110.430.0476f367.540.1884
9f3910.340.0634f48.130.1683
10f99.210.2195f3811.840.1445
Table 6. Vulnerability and side median in one-sided failure mode (ex. top 10).
Listed in Descending Order of VulnerabilitySorted in Descending Order by Side Median
SequenceEdgesNode BetweennessEdgesEdge Betweenness
18.820.15246.170.1665
26.170.16658.820.1524
34.030.04152.800.1360
43.640.12321.470.1341
53.280.09273.640.1232
63.180.02383.280.0927
72.920.09272.920.0927
82.800.13600.590.0829
91.520.02320.590.0561
101.470.13411.070.0518
Disclaimer/Publisher’s Note: The statements, opinions and data contained in all publications are solely those of the individual author(s) and contributor(s) and not of MDPI and/or the editor(s). MDPI and/or the editor(s) disclaim responsibility for any injury to people or property resulting from any ideas, methods, instructions or products referred to in the content.