Article

Investigation of Multiple Degradation Mechanisms of a Proton Exchange Membrane Fuel Cell under Dynamic Operation

1
Department of Mechanical Engineering, Graduate School, Chungnam National University, 99 Daehak-ro, Yuseong-gu, Daejeon 34134, Republic of Korea
2
School of Mechanical Engineering, Chungnam National University, 99 Daehak-ro, Yuseong-gu, Daejeon 34134, Republic of Korea
*
Author to whom correspondence should be addressed.
Energies 2022, 15(24), 9574; https://doi.org/10.3390/en15249574
Submission received: 4 November 2022 / Revised: 13 December 2022 / Accepted: 14 December 2022 / Published: 16 December 2022
(This article belongs to the Special Issue Research in Proton Exchange Membrane Fuel Cell)

Abstract

:
In this paper, a new voltage aging model for the polymer electrolyte membrane fuel cell (PEMFC), which includes multiple degradation mechanisms for proton exchange membrane fuel cells, is proposed. The model parameters are identified using a curve-fitting procedure based on long-term experimental data for the modular stack under the New European Driving Cycle (NEDC). A good fit was found between the model and experimental data, with R-squared values greater than 0.99 for all simulation cases. Moreover, according to the model sensitivity analysis, the voltage degradation model is most sensitive to load current, followed by time. The effect of operating temperature on performance, voltage degradation, and lifetime is investigated. After 300 h, significant performance loss was detected. When the temperature is raised to 75 °C, voltage degradation becomes worse. Based on the simulated voltage degradation profiles at 55 °C and 75 °C, PEMFCs have reached the end of their useful lives at 1100 h and 600 h, respectively. The simulation model indicates that the model is capable of forecasting how long the fuel cell will last under specified operational conditions and drive cycles.

1. Introduction

Fuel cells are an attractive option for power generation since they are clean and efficient and may assist in addressing key problems related to the production and use of energy. Due to their high energy efficiency, ease of operation, and friendliness to the environment, polymer electrolyte membrane fuel cells, also known as PEMFCs, have been considered potential sources of electric power for automobiles, in addition to potential sources of power for stationary and portable applications. Even though significant progress has been made in recent decades, durability remains the major obstacle that must be overcome before a broad variety of PEMFC applications can be successfully brought to the market for commercial use. According to the Fuel Cell Technical Team (FCTT) road map, the fuel cell systems for vehicles need to meet the requirement of a lifetime and durability of 8000 h with less than 10% performance loss. Currently, their lifespan is around 4100 h in the year 2016. It is quite close to the goal of 5000 h for the year 2020, but it is far from the target of 8000 h for the year 2025 [1]. It is imperative that PEMFCs continually develop to fill the gap between the recent situation and their goals.
Unlike stationary power plant sources, vehicle PEMFCs must satisfy stricter durability limits under dynamic operating conditions. The durability of PEMFCs depends on processes such as the dissolving and sintering of platinum particles, membrane thinning, and carbon-support corrosion. On the other hand, the lifespan of fuel cells depends on the environment and operating policy and can deteriorate under subfreezing temperatures, fuel starvation, impurities in the fuel and oxidant sources, and frequent acceleration/deceleration [2]. The degradation of automotive fuel cells is unavoidable during long-term operation, but it is still necessary to improve the degradation gradient for commercially viable hydrogen fuel cell vehicles [3].
A performance degradation model forecasts how the PEMFC’s performance degrades over time while operating. It also shows how crucial PEMFC model parameters vary over time. Determining the degree of performance degradation of PEMFCs is essential for health assessment and prognostics. Numerous modeling studies have reported assessments of the durability of PEMFCs. Mayur et al. provided a simulation methodology for evaluating PEMFC performance and durability during driving cycles [4]. Han et al. [5] used a model-based approach to describe the durability of fuel cell vehicles under different driving cycles. However, only membrane degradation was considered in these models. Ehlinger et al. introduced a model to study the effects of membrane degradation on the performance of PEMFC [6]. They evaluated the effect of pinhole formation and expansion in the membrane, which increase reactant gas crossing and, as a result, the creation of chemical degradation agents, affecting the membrane’s transport and its mechanical characteristics. The effect of the pinhole formation process during chemical membrane degradation was also modeled by W. Zheng et al. [7]. A comprehensive Pt degradation model was introduced by W. Zheng et al. [8] to study the loss of Pt electrochemical active surface area (ECSA) including the Pt mass loss and particle growth mechanisms. A. Kregar et al. [9] proposed a temperature-dependent model of Pt/C catalyst degradation that covers the temperature influences on the detrimental electrochemical reactions, Pt dissolution, and loss of ECSA. The model showed that it could reproduce the experimental results with the same operating conditions. Even though the presented models are promising, they are limited to describing only one degradation mechanism. This may not be sufficient to accurately reproduce fuel cell behavior under dynamic operation, especially in transport applications. Combining filtering techniques like particle filter (PF) and Kalman filter (KF), the aging model can be utilized for fuel cell stack prognostics and predicting remaining useful life (RUL). Jouin et al. [10] proposed a semi-empirical aging model for health assessment and prognostics of PEMFC using a general polarization curve equation. From the general voltage model, the basic idea is to select the aging parameters and replace them with time-dependent expressions. The model was verified using different data sets with constant current and current ripples and a micro-CHP mission profile. Based on the PF, this model has been used to predict the power degradation process of PEMFCs under constant and dynamic current conditions. Because the aging mechanisms of these parameters remain unclear, most empirical correlations between these parameters and the operation time have been viewed as linear, while others have been viewed as logarithmic. A similar degradation model was proposed by Zhou et al. [11] based on a multi-physics aging model with PF and an extrapolation approach. Several major internal physical aging phenomena of fuel cells are considered in the multi-physical aging model, including fuel cell ohmic losses, activation losses, and mass transfer losses. Degradation characteristics are studied using the PF framework, and aging parameters are updated based on the results. Despite producing satisfactory results, the accuracy of this method varies with the operating conditions. Bressel et al. [12] developed a degradation model to estimate the state of health and the dynamics of the degradations based on an extended Kalman filter (EKF) approach. This model shared the same model as the work of Jouin et al. [10], but it is less complex. Only two parameters in this model change over time, i.e., the ohmic resistance and the limiting current, which are linked by a single parameter. Hao Liu et al. [13] applied this model to estimate the health state and the remaining useful life of PEMFCs. However, in this study, the adaptive unscented Kalman filter (AUKF) algorithm was employed instead of the EKF approach. This model was also used by K. Song et al. [14] to develop a lifetime prediction method for vehicular fuel cells that uses an adaptive extended Kalman filter (AEKF) for data processing. Zhang et al. [15] proposed a similar work based on the use of a physical model to estimate the state of health and to predict its degradation. The fuel cell model is a quasi-static model based on the polarization curve. With the PF method, a variable was predicted to be coupled between open-circuit voltage degradation and internal resistance degradation. These models showed promising results. However, only one degradation coefficient is taken into account, which may not fully represent performance losses. L. Mao et al. [16] evaluated behavior variation of the PEMFC through the evolution of model parameters during the degradation process using collected polarization curves at different times. Utilizing the PF approach, the model parameters can be determined from the polarization curves collected from the PEM fuel cell system. Although this model provided promising results, it still has the disadvantage of failing to consider the effects of concentration loss at zero current density and ignoring activation loss at the anode. Durability studies of fuel cells have primarily considered voltage degradation under steady-state settings and fixed-load electric load situations. Furthermore, there are currently few models for estimating the performance and durability of fuel cells affected by dynamic load variation during the driving cycle. Since the dynamic load demand of a vehicular fuel cell varies severely under the normal operating mode, it is complicated to predict the degradation of PEMFCs in constant mode [17]. As a result, the goal of this research is to bridge that gap and provide practical information for a better understanding of the durability of vehicle fuel cells.
The operating temperature of a PEMFC is an essential factor in its performance and durability. The electrochemical reaction produces water and heat, causing the interior temperature of a stack to vary continuously. Furthermore, because water refills are sluggish, frequent load changes cause a dry membrane electrolyte, accelerating catalyst extraction, flooding, and drying out [17]. When switching from low to high power, operational parameters such as temperature can shift, harming the fuel cell system’s integrity [3]. This causes flooding or local hot spots, which can cause voltage loss and shorten the lifespan of the PEMFC stack [17]. In addition, temperature changes have been demonstrated to influence the catalyst surface area reduction due to the formation of platinum particles [2].
In this paper, a new degradation model was developed to analyze the performance degradation of a PEMFC stack under a dynamic NEDC load cycle. The effects of operating temperatures on fuel cell stack durability were explored. Section 2 describes the durability testing system and procedure. In Section 3, a general PEMFC model, including aging terms, is briefly given. Finally, the simulation model shows the performance degradation during the driving cycle.
The contribution of this study is to develop a new model framework to describe fuel cell voltage degradation under dynamic operation rather than steady-state or fixed load. The degradation model was verified using the experimental data sets of a 3-cell stack under the NEDC cycle operated at 55 °C and 75 °C. Once the model was verified, it was used to predict the PEMFC voltage degradation and lifetime. Simulation results at 55 °C and 75 °C showed PEMFCs to have reached the end of their useful lives after 1100 h and 600 h, respectively. In addition, the PAWN method was introduced to analyze the global sensitivity of the model. It helps identify how uncertainty and variability in input parameters affect model outputs. The sensitivity analysis indicated that the current seems to be the most influential factor on the fuel cell voltage, followed by time.

2. PEM Fuel Cell Model

In this study, the PEMFC was modeled using the diagram shown in Figure 1.

2.1. Modelling of the Gas Diffusion Layer

In the electrodes, the diffusion processes for O2, H2, H2O, and N2 can be modelled using the basic diffusion model:
J i = pD ij eff RT dx i dz
In the cathode electrode, the N2 flux is simply ignored since there is no generation or consumption of N2.
From Equation (1) the transport of H2 and H2O in the anode electrode can be described as:
J H 2 A = p A D H 2 , H 2 O eff RT dx H 2 dz
J H 2 O A = p A D H 2 , H 2 O eff RT dx H 2 O dz
When the hydrogen and water concentrations at the anode-membrane interface (interface 2 in Figure 1) are calculated, the following results are obtained:
x H 2 2 = x H 2 1 t A jRT 2 Fp A D H 2 , H 2 O eff  
x H 2 O 2 = x H 2 O 1 t A jRT 2 Fp A D H 2 , H 2 O eff
In a similar manner, the oxygen and water concentrations at the cathode-membrane interface (interface 3) can be obtained:
x O 2 3 = x O 2 4 t C jRT 4 Fp C D O 2 , H 2 O eff
x H 2 O 3 = x H 2 O 4 + t C jRT 4 Fp A D O 2 , H 2 O eff

2.2. Modelling of Membrane Water Transport

The water transport in the membrane is caused by electro-osmotic drag force and back diffusion. It may be stated as follows (assuming positive values in the anode-cathode direction):
J z = J w , d J w , diff
The electro-osmotic drag force is formulated in terms of current density as follows:
J w , d = 2 n d i 2 F λ 22
where nd can be expressed by the following equation:
n d = 0.1 λ + 0.6  
The diffusion flux in terms of water content (λ) is derived using Fick’s first law:
J w , diff = ρ dry M m D λ d λ d 𝓏
The water diffusivity, Dλ, is defined by the following equation [5]:
D λ = 10 6 exp 2416 1 303 1 T 2.563 0.33 λ + 0.0264 λ 2 0.000671 λ 3
The water content (λ) in Equations (9)–(12) is a function of z.
The membrane is divided into n control volumes. The thickness of the control volume is calculated by:
𝓏 = L n 1   cm
The water content distribution in the membrane from anode to cathode is expressed as:
C w t = ρ dry M m λ t = J z z = 𝓏 J w , d J w , diff = 𝓏 2 n d i 2 F λ 22 ρ dry M m D λ d λ d 𝓏
The boundary conditions are:
    z = 0 ,       λ = λ A z = L ,                   λ = λ C
λA and λC are the water contents at interfaces 2 and 3, respectively, defined through the following equations [5]:
λ = 0.043 + 17.81 a 39.85 a 2 + 36 a 3 0 < a 1  
λ = 14 + 1.4 a 1 1 < a 3

2.3. Modelling of Voltage Degradation

2.3.1. The Basic Voltage Model

From the general voltage model, the basic idea is to select the aging parameters and replace them with time-dependent expressions.
Considering the equation for a general polarization curve, shown in Equation (17) [18], The reversible voltage of the fuel cell can be reduced by voltage losses.
V = E rev RT 4 α c F ln i + i loss i o , c RT 2 α a F ln i + i loss i o , a i R memb + R ele + R cr + B c ln 1 i i L , c + B a ln 1 i i L , a
In a PEMFC, reversible voltage is estimated using Equation (18) [5]:
E rev = 1.229 0.85 × 10 3 T 298.15 + 4.309 × 10 3 T ln P H 2 + 1 2 ln P O 2
The fourth term in Equation (17) is the ohmic loss, which occurs because of ionic, contact, and electronic resistances according to Ohm’s law. According to Frano [19], electronic resistance is essentially nonexistent. It is generally accepted that ionic resistance and contact resistance are of equal magnitude. The model assumes that one parameter captures both mechanisms to reduce the model’s complexity.
The concentration losses are represented by the last two terms in Equation (17). These losses arise when the electrochemical process rapidly consumes reactants at the electrode. As a result, the reactant mass transfer rate is insufficient to supply enough reactants to the electrode surface. Because in an actual fuel cell, the limiting current is almost never observed due to nonuniform conditions throughout the porous electrode surface. A significant reduction in cell voltage at limiting current would require uniform current density across the entire electrode surface, which nearly never occurs [19]. Thus, an improvement in the voltage loss equation due to the mass transfer drop proposed by Kim et al. [20] was used in this study.
η con = m e ni 1
The effect of crossover was not considered in Equation (17). The crossing of H2 or O2 over the membrane causes an immediate reaction with O2 at the cathode or H2 at the anode, resulting in a reversal potential. This voltage drop is mostly due to the Pt and oxygen reaction producing platinum oxide (PtO) [21,22,23]. The value of other parameters is affected when this mechanism is ignored. It yields an inaccurate value, particularly for the parameters of the activation-loss term. Still, the use of a separate model to describe its effect complicates the aging model. Thus, it is assumed to be a constant parameter in the cell voltage model.
Substituting all the above formulas for each term in Equation (17), the voltage model is:
V = E rev V PtO RT 2 α a F ln i + i loss i o , a RT 4 α c F ln i + i loss i o , c iR m e ni 1
The variation of model parameters (VPtO, αa, iloss, io,a, αc, io,c, R, m, and n) can be obtained by curve fitting Equation (20) to the results from the polarization curve.

2.3.2. Introduction of the Degradation Parameters

There are two constant parameters (F and R), four controlled parameters (T, Erev, ioa, and io,c) and seven aging parameters with time as the PEMFC degrades (VPtO, αa, iloss, αc, R, m, and n) in Equation (20).
The anode and cathode charge transfer coefficients (αa and αc) depend on the electrode’s material and microstructure, which degrade during PEMFC operation [10]. The change of electrode with aging would lead to varying charge transfer coefficients. However, with the current knowledge, it seems impossible to determine them or their change with time. Thus, their values were not justified in the degradation model. Their values range from zero to one and their sum equals unity [24]. The higher value shows more reactions and less activation loss [25]. According to L. Mao et al. [16], the charge transfer coefficient is equal to 0.5.
A simple linear relationship of VPtO as a function of the aging time can be expressed as the following equation [22]:
V PtO t = V PtO , o + V PtO , 1 t
The resistance changes as an exponential function of time [26]. Its aging can be defined by:
R t = R o . exp R 1 t
Regarding the degradation formula for the crossover current density, iloss, exponential modeling gives the best fit [27].
i loss t = i loss , o exp i loss , 1 t
The exponential formula relating to the two aging parameters in concentration loss was proposed in [16].
m t = m o . exp m 1 t  
n t = n o . exp n 1 t
The change in current density with time is expressed by the terms of total current (I) and active surface area (A) in the following equation:
i t = I t A t  
Where the active area of the electrode could be expressed as logarithms form in Equation (27) [22].
A t = A o A 1 ln A 2 t + 1  
The voltage aging model is created by substituting the parameters in the voltage model with their degradation formulas:
V = E rev ( V PtO , o + V PtO , 1 t ) RT 2 α a F ln i t + i loss , o exp i loss , 1 t i o , a RT 4 α c F ln i t + i loss , o exp i loss , 1 t i o , c i t ( R o . exp R 1 t m o . exp m 1 t exp i t . n o . exp n 1 t 1

2.4. Energy Conservation of the PEMFC Stack

The temperature of the lumped PEMFC stack is determined by applying the energy conservation equation [28]:
ρ c p V dT dt = Q stack Q coolant Q gas
where Qgas is the heat transfer to the gas and is calculated as:
Q g =   m ˙ c p , c ¯   T g , o T g , in
T g , o = T cell + T g , in T cell exp hA g m g , i ˙ c p  
Qcoolant is the heat rejection of the coolant and is calculated as:
Q c =   m ˙ c p T c , o T c , in = h c A c T cell T c
T c , o = T cell + T c , in T cell exp hA c m c ˙ c p , c

3. PEMFC Durability Test

3.1. Test Bench

The test bench is employed to evaluate the fuel cell’s durability. The PEMFC stack has 3 cells with an active area of 25 cm2. The specifications of the fuel cell stack are briefly reviewed in Table 1.
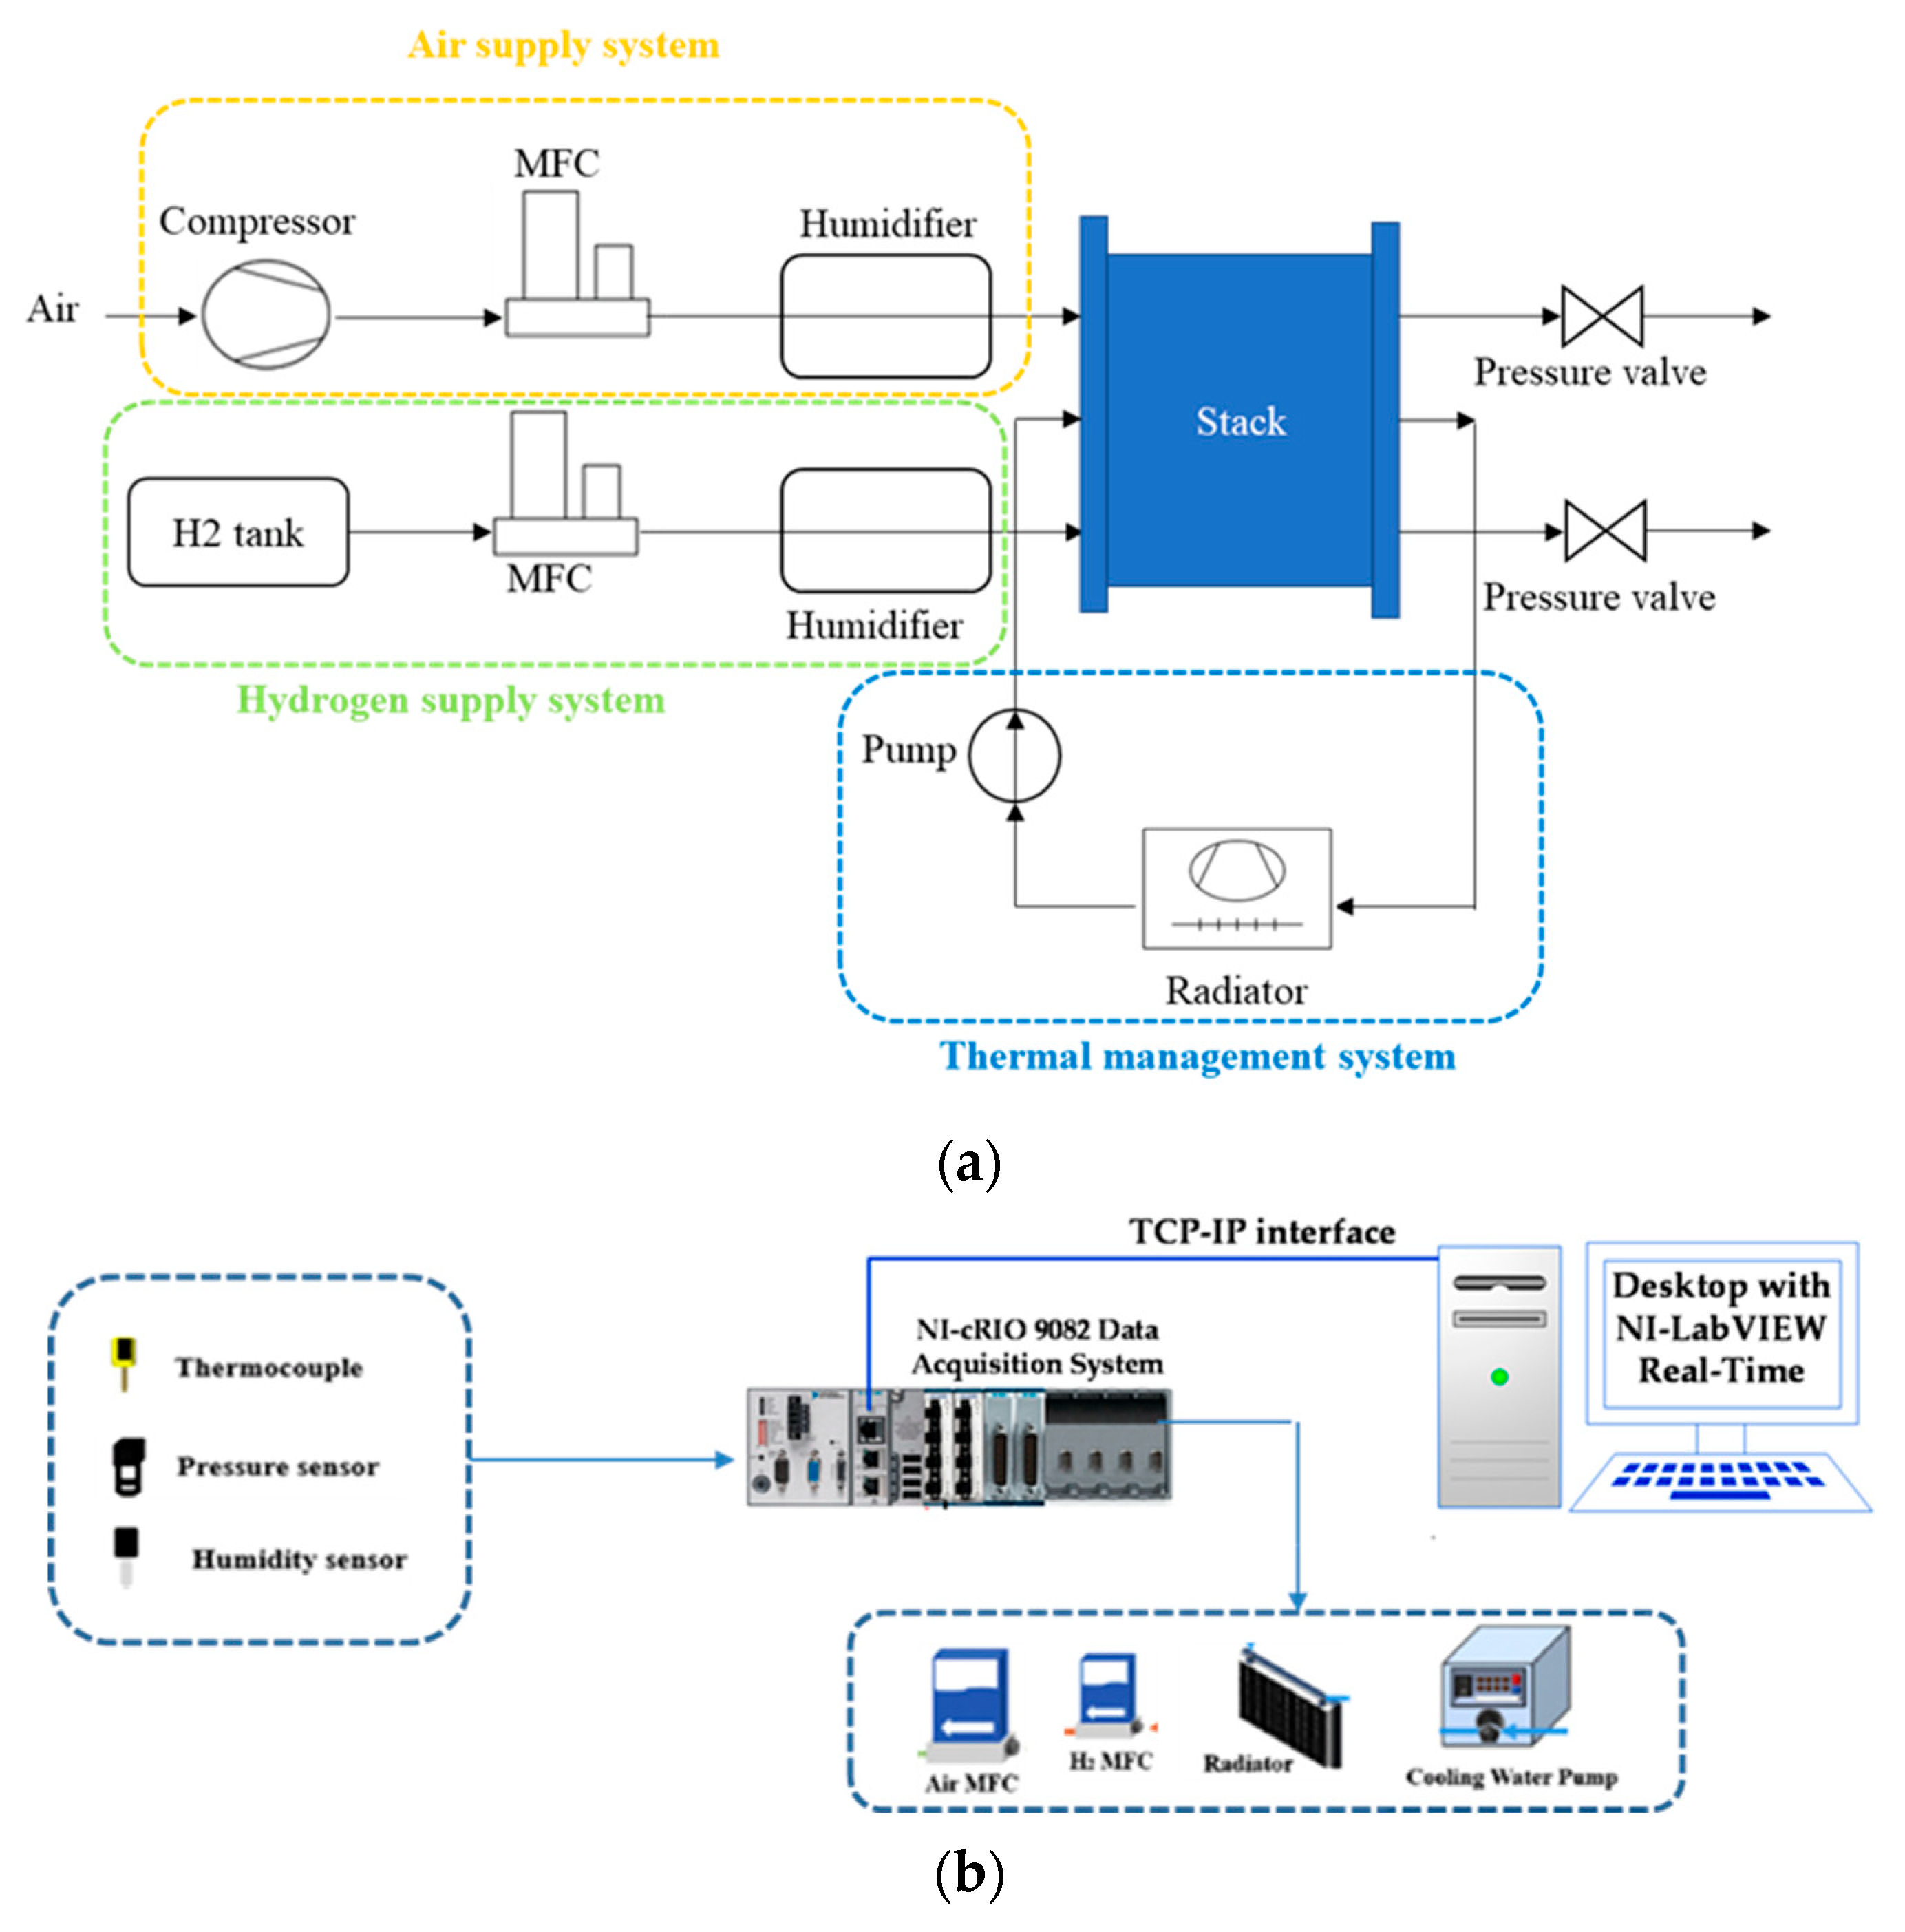
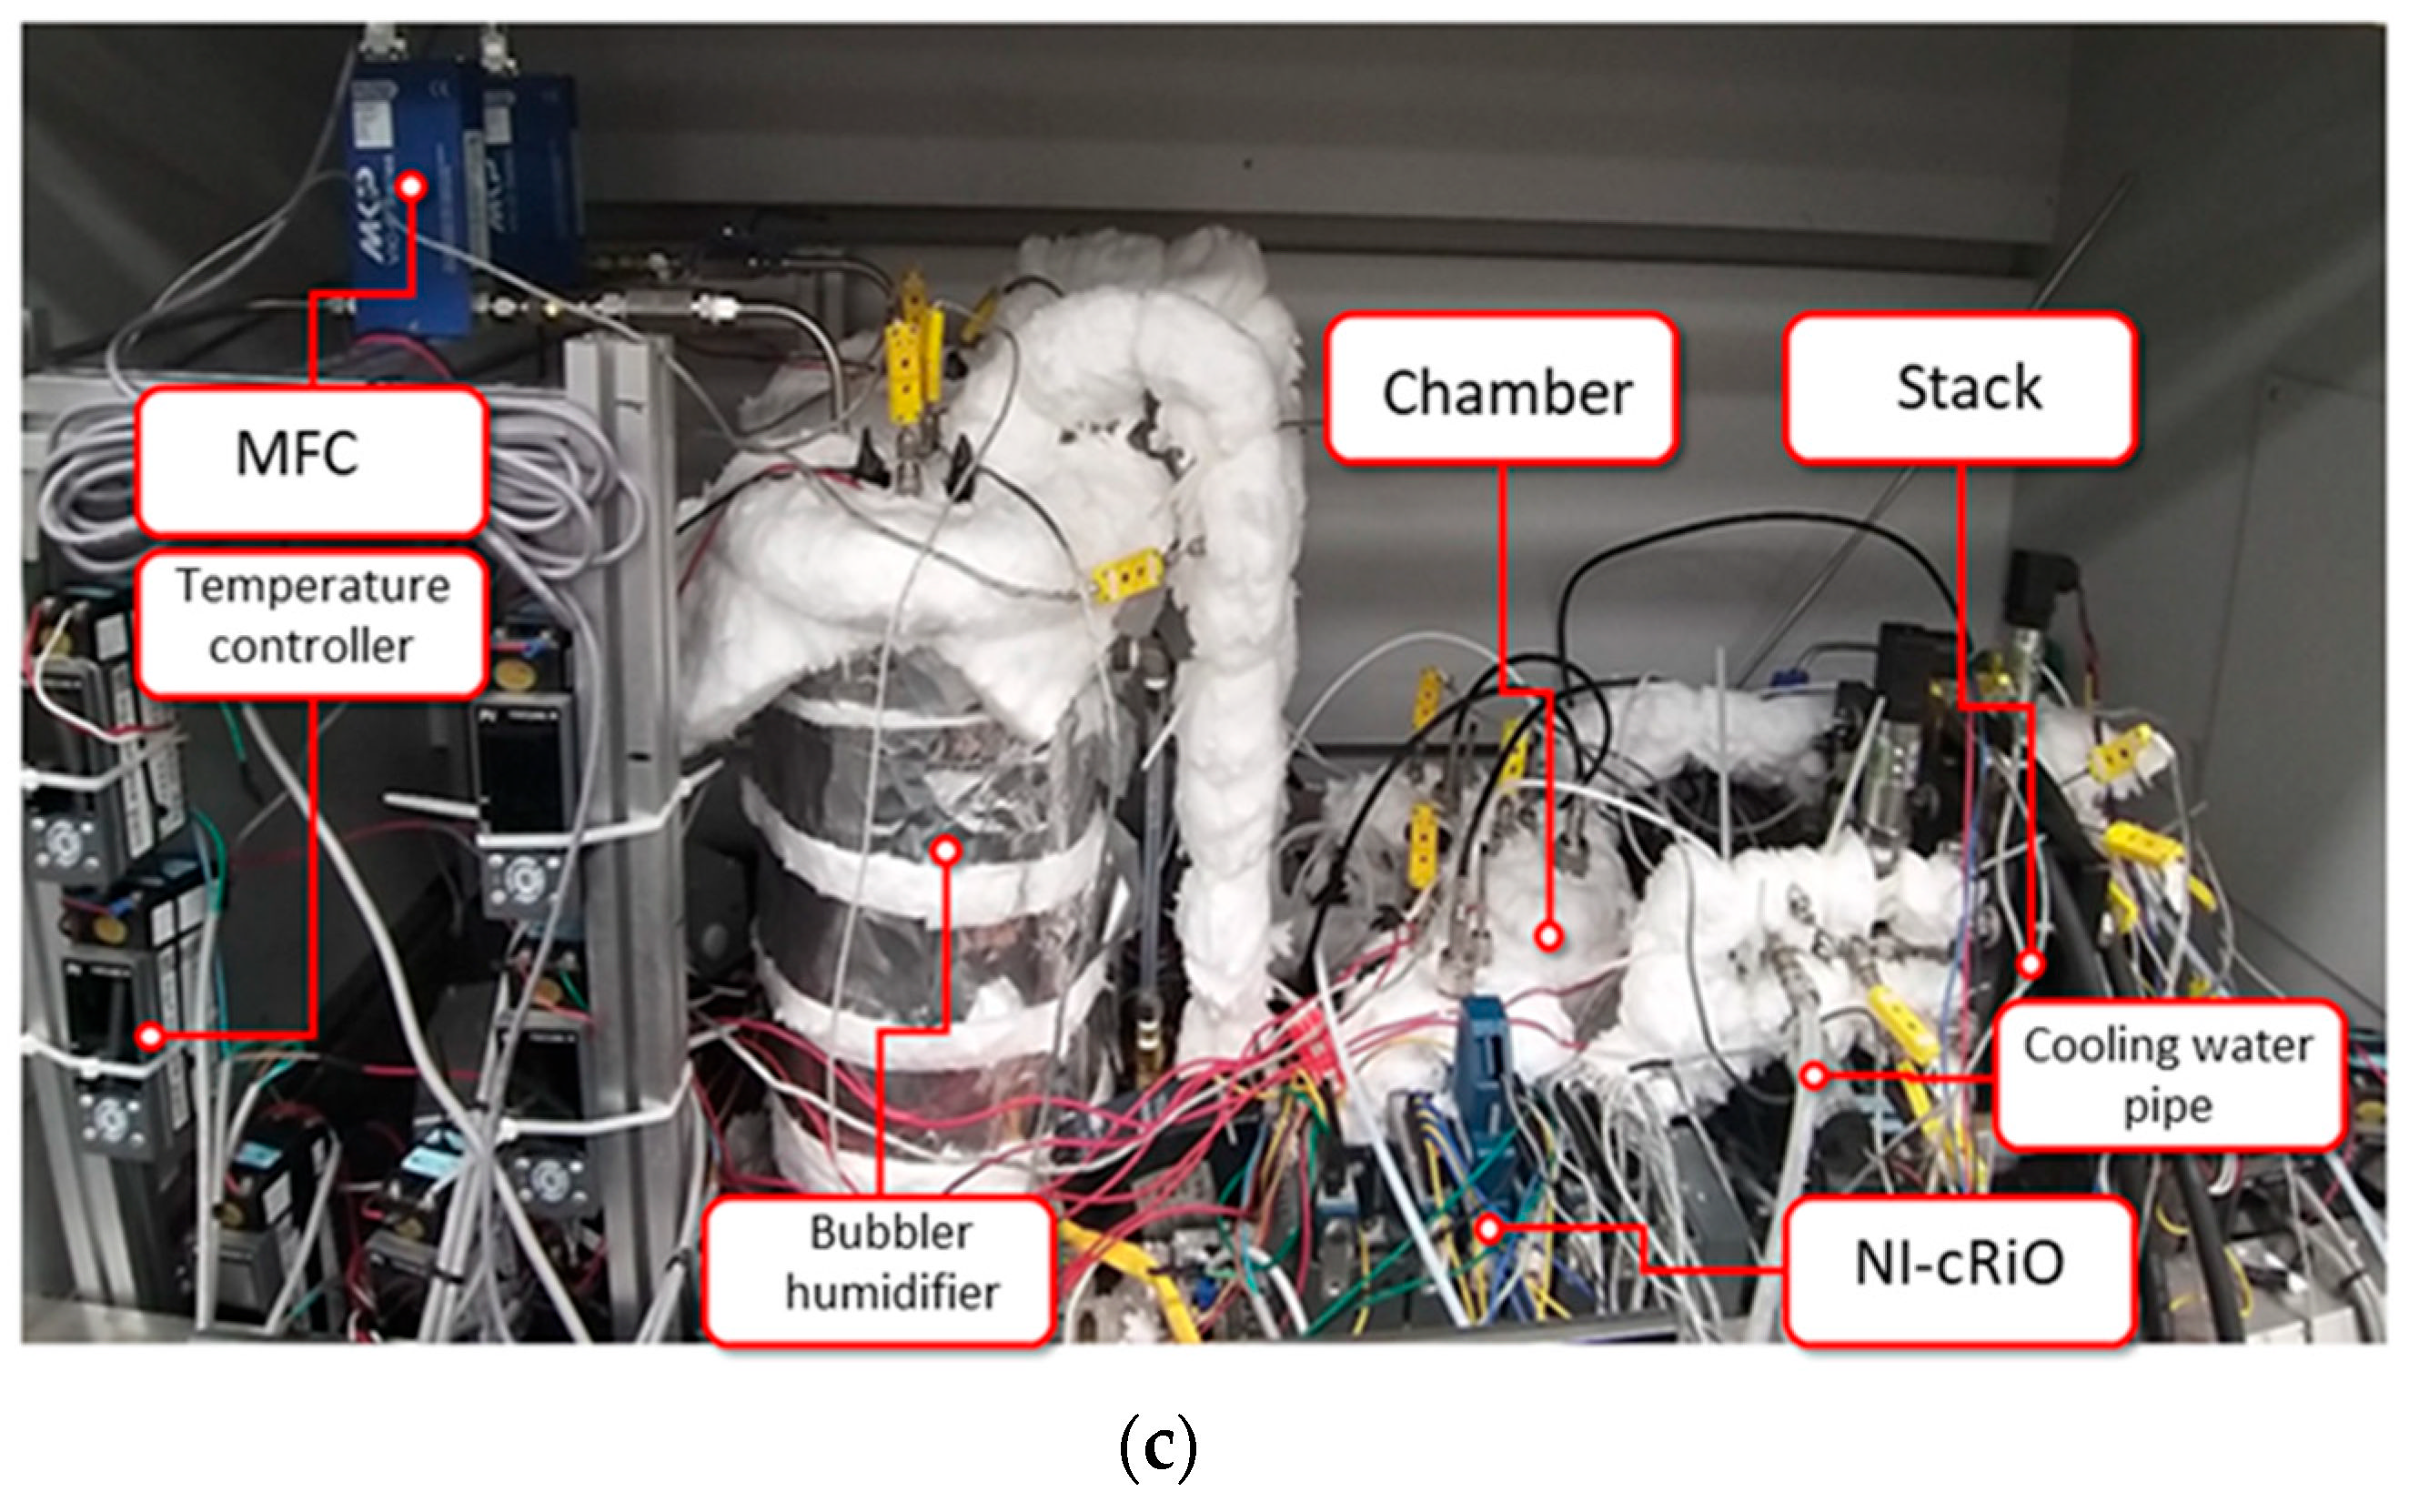
Figure 2a–c depict the schematic diagram, data acquisition, and test bench for the PEMFC durability test. The flow rates of hydrogen and air are regulated by the mass flow controller (MFC). A bubbler humidifier is used to humidify the reactant gases to the required relative humidity level before they reach the fuel cell. In addition, the line heaters are used to heat and hold the temperature of reactant gases 5 K above the fuel cell temperature to prevent water condensation at the intake. The fuel cell temperature is kept steady during the test by the thermal management system. Humidifiers, fuel cells, and fuel cell inlet and outlet pipelines all have K-type thermocouples attached. The sensor signals are recorded using a c-RIO 9082 DAQ device (National Instruments Corp., Seoul, Korea) (Figure 2b). An electric loader is connected to the anode and cathode electrodes to monitor and gather the current and voltage of the fuel cell.

3.2. Durability Test

The modular stack was operated at two different temperatures, 55 °C and 75 °C under ambient pressure. Reactant gases were 50% humidified at operating temperatures. The 3-cell modular stack was operated for about 300 h under NEDC mode. The load cycle was used to test the fuel cell’s endurance over time.
The current required to achieve a cell voltage of 0.65 V was utilized as the cycle’s 100 percent current load value. According to our previous study, the current values at 0.65 V are 13.05 A and 14 A, respectively, when the operating temperatures are 55 °C and 75 °C [17]. The NEDC current profiles were presented in Figure 3. It comprises four 195-s low-speed urban phases, followed by a 400-s motorway (highway) driving period simulation. The NEDC lasts 1180 s in total.
To study the aging behavior of the fuel cell during its lifetime, the polarization curve was selected as it can express fuel cell losses directly, including activation loss, ohmic loss, and concentration loss. Furthermore, with the collection of polarization curves during the durability test, the fuel cell performance can be effectively recovered [16]. This means that the overall voltage degradation of the fuel cell consists of reversible and irreversible factors [17]. In this study, the polarization curves of the fuel cell stack were collected every 100 h during the test from the beginning of test to the end of test. The polarization curves were then used to determine the model parameters in Equation (28) using a least squares approach.

4. Results and Discussion

4.1. PEMFC Degradation Behavior

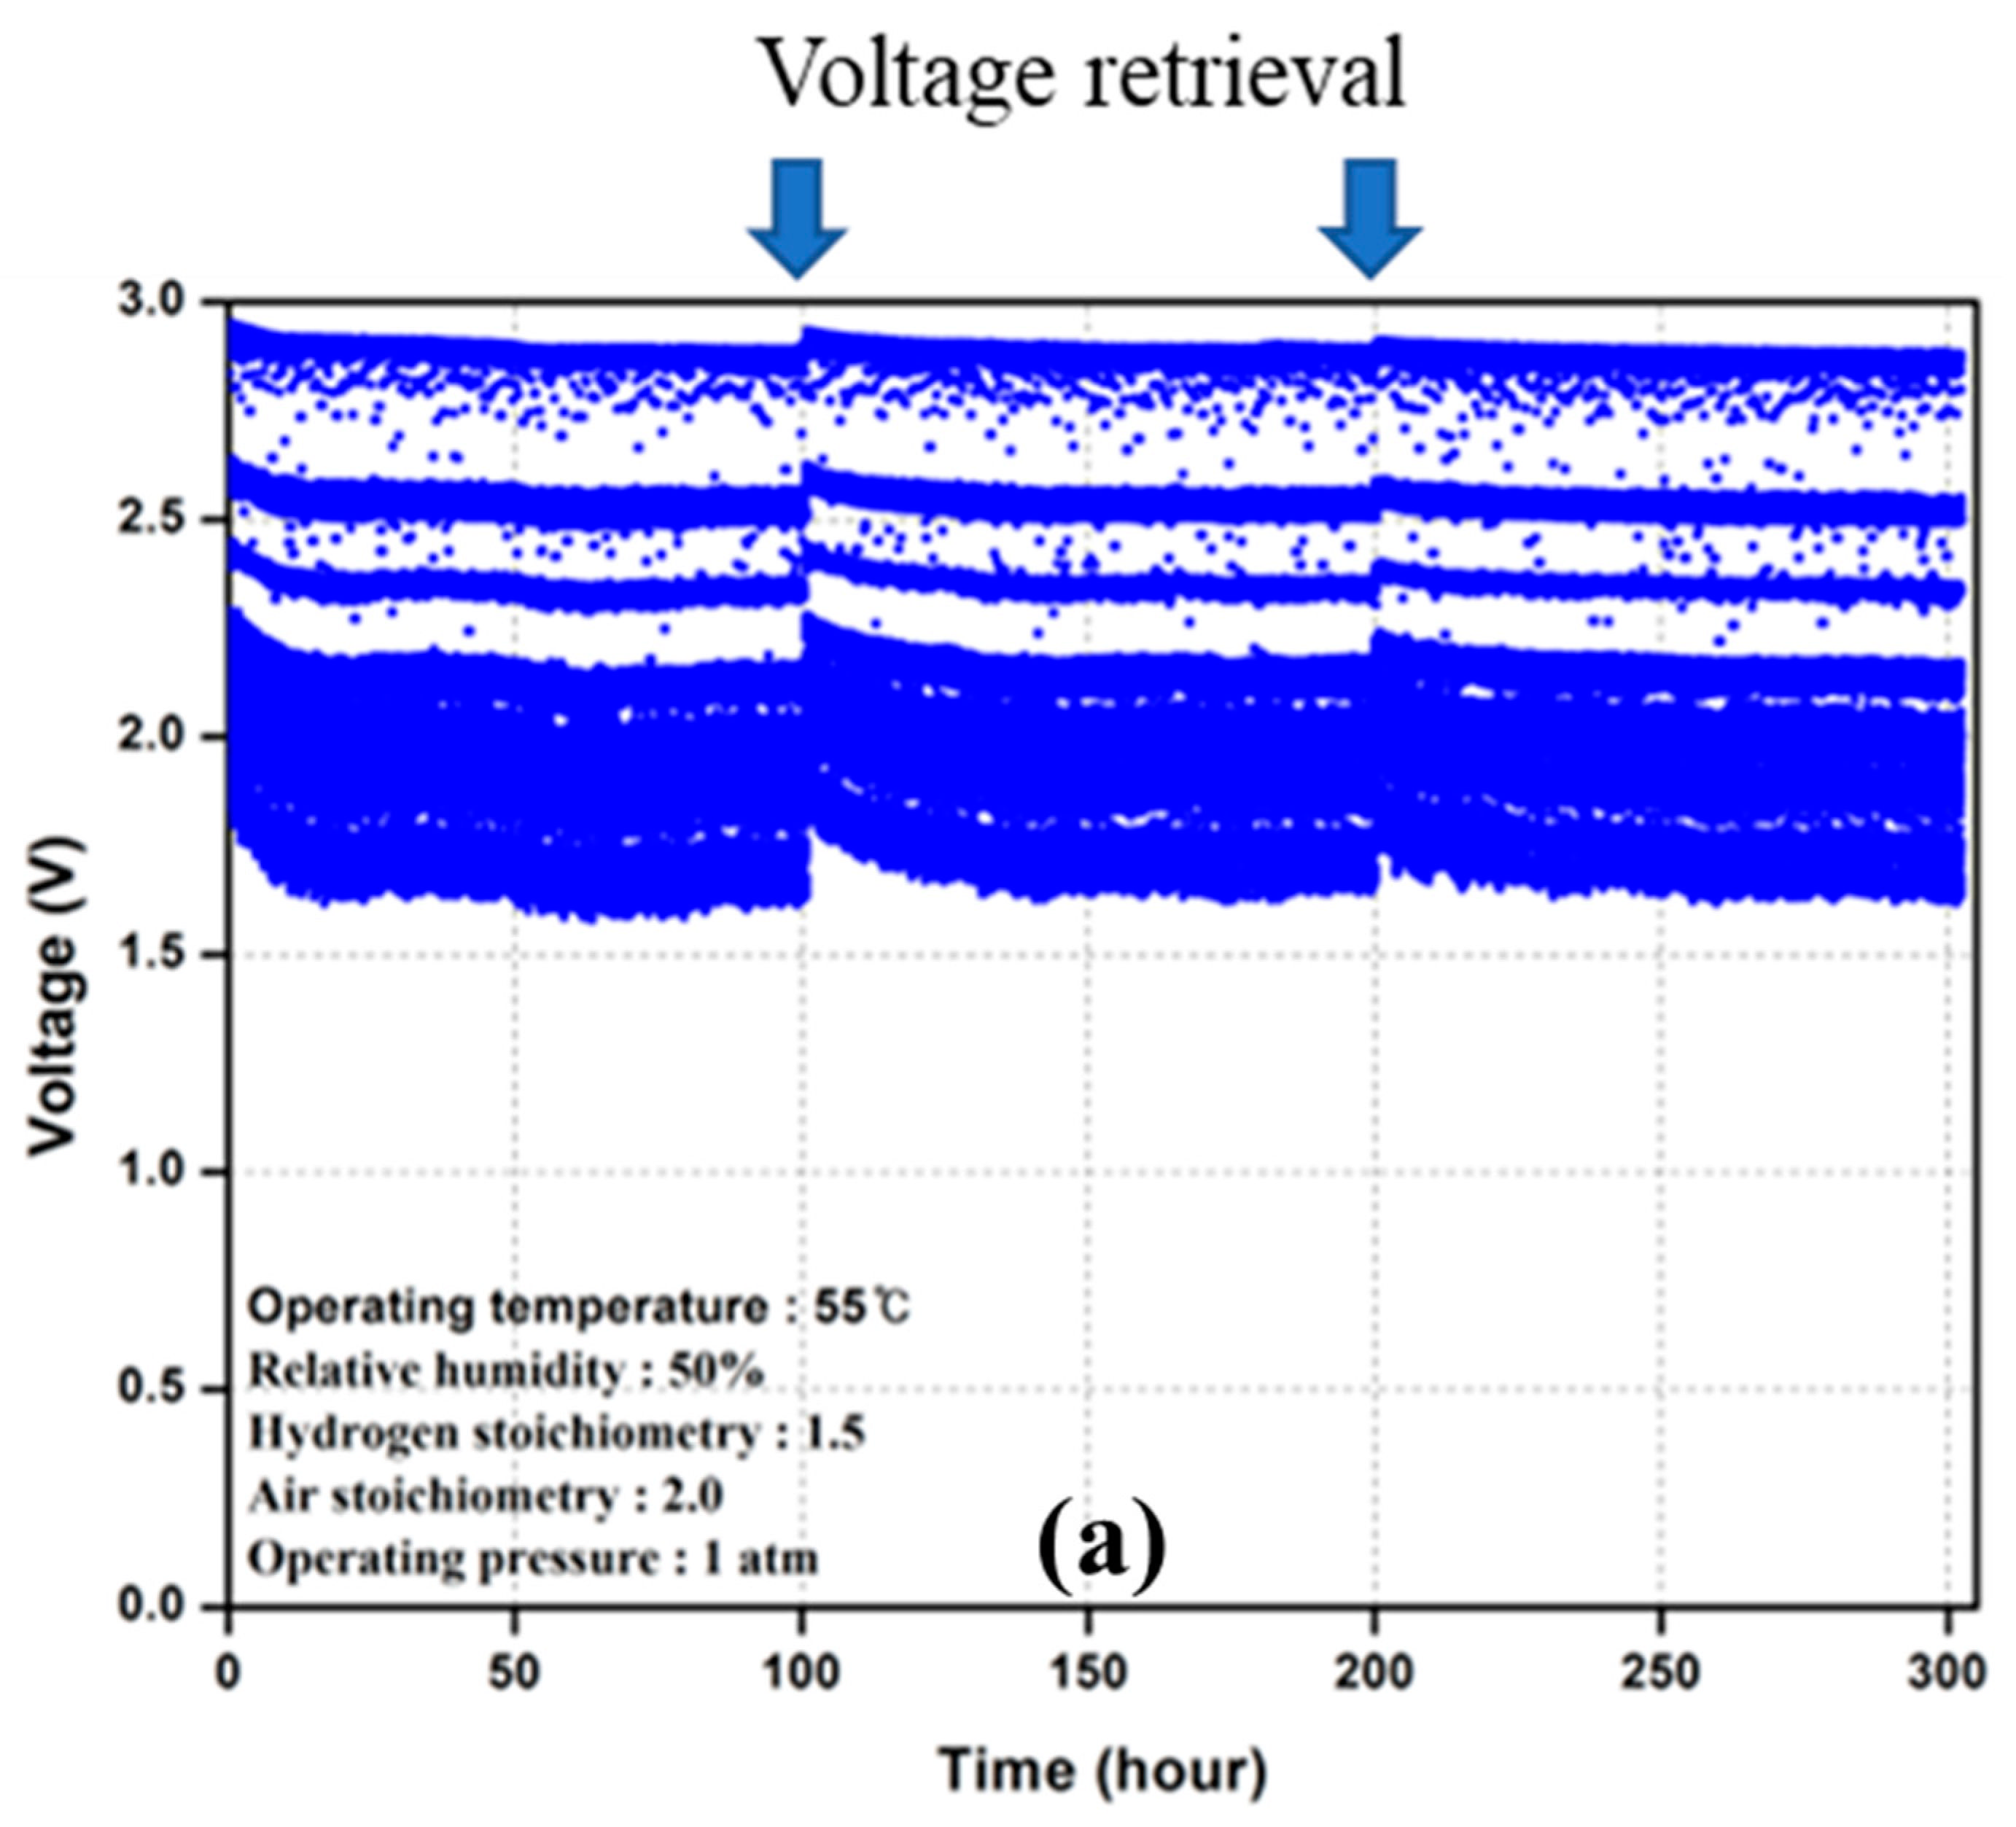
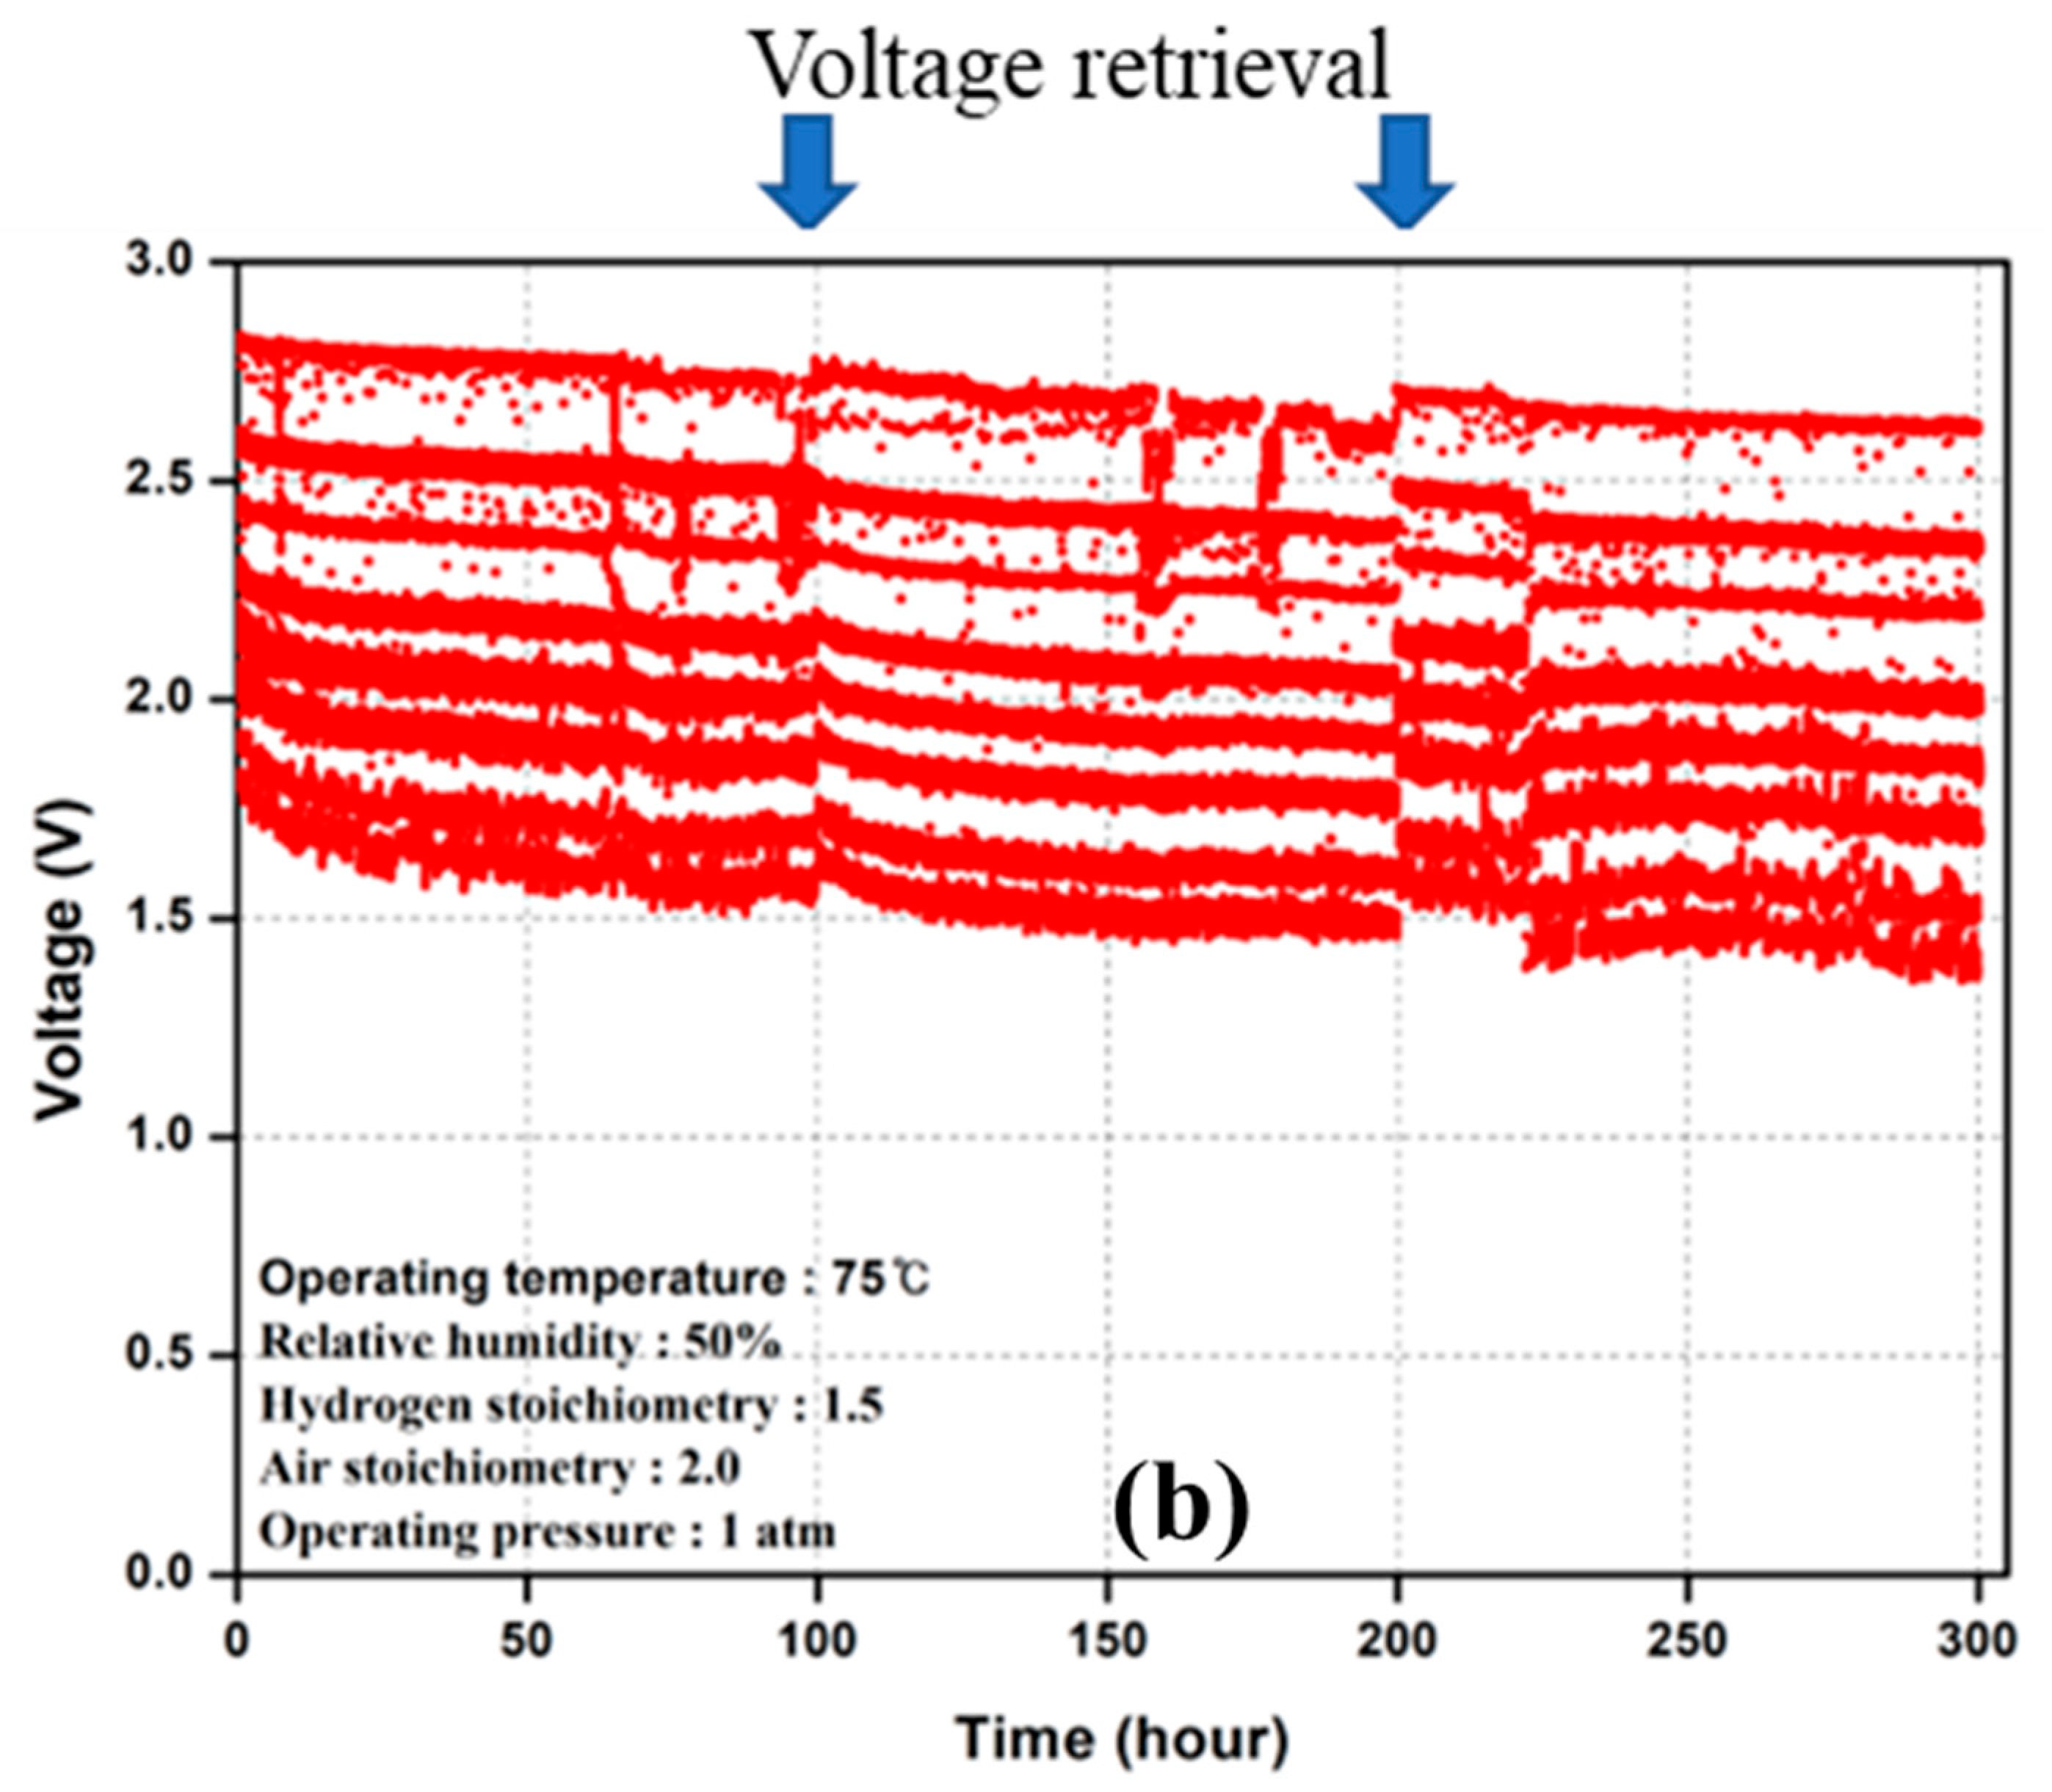
Figure 4 depicts the behavior of the fuel cell stack in a durability test conducted under varied operating conditions, with the fuel cell stack’s performance aging over time. It was discovered that the voltage dropped over time. As can be observed from Figure 4a, voltage degradation was observed more severely at higher voltages (higher current conditions) than at lower voltages (lower current conditions). A sharper decline in voltage was seen in Figure 4b when the operating temperature increased to 75 °C. Another aspect that can be seen in Figure 4 is the voltage retrieval at polarization curve collection periods. Voltage losses were recovered more efficiently under high load conditions than low load conditions. In addition, there was a slighter recovery of voltage when the fuel cell operated at 75 °C compared to 55 °C. Consequently, the degradation slope at 75 °C is much steeper than that at 55 °C.
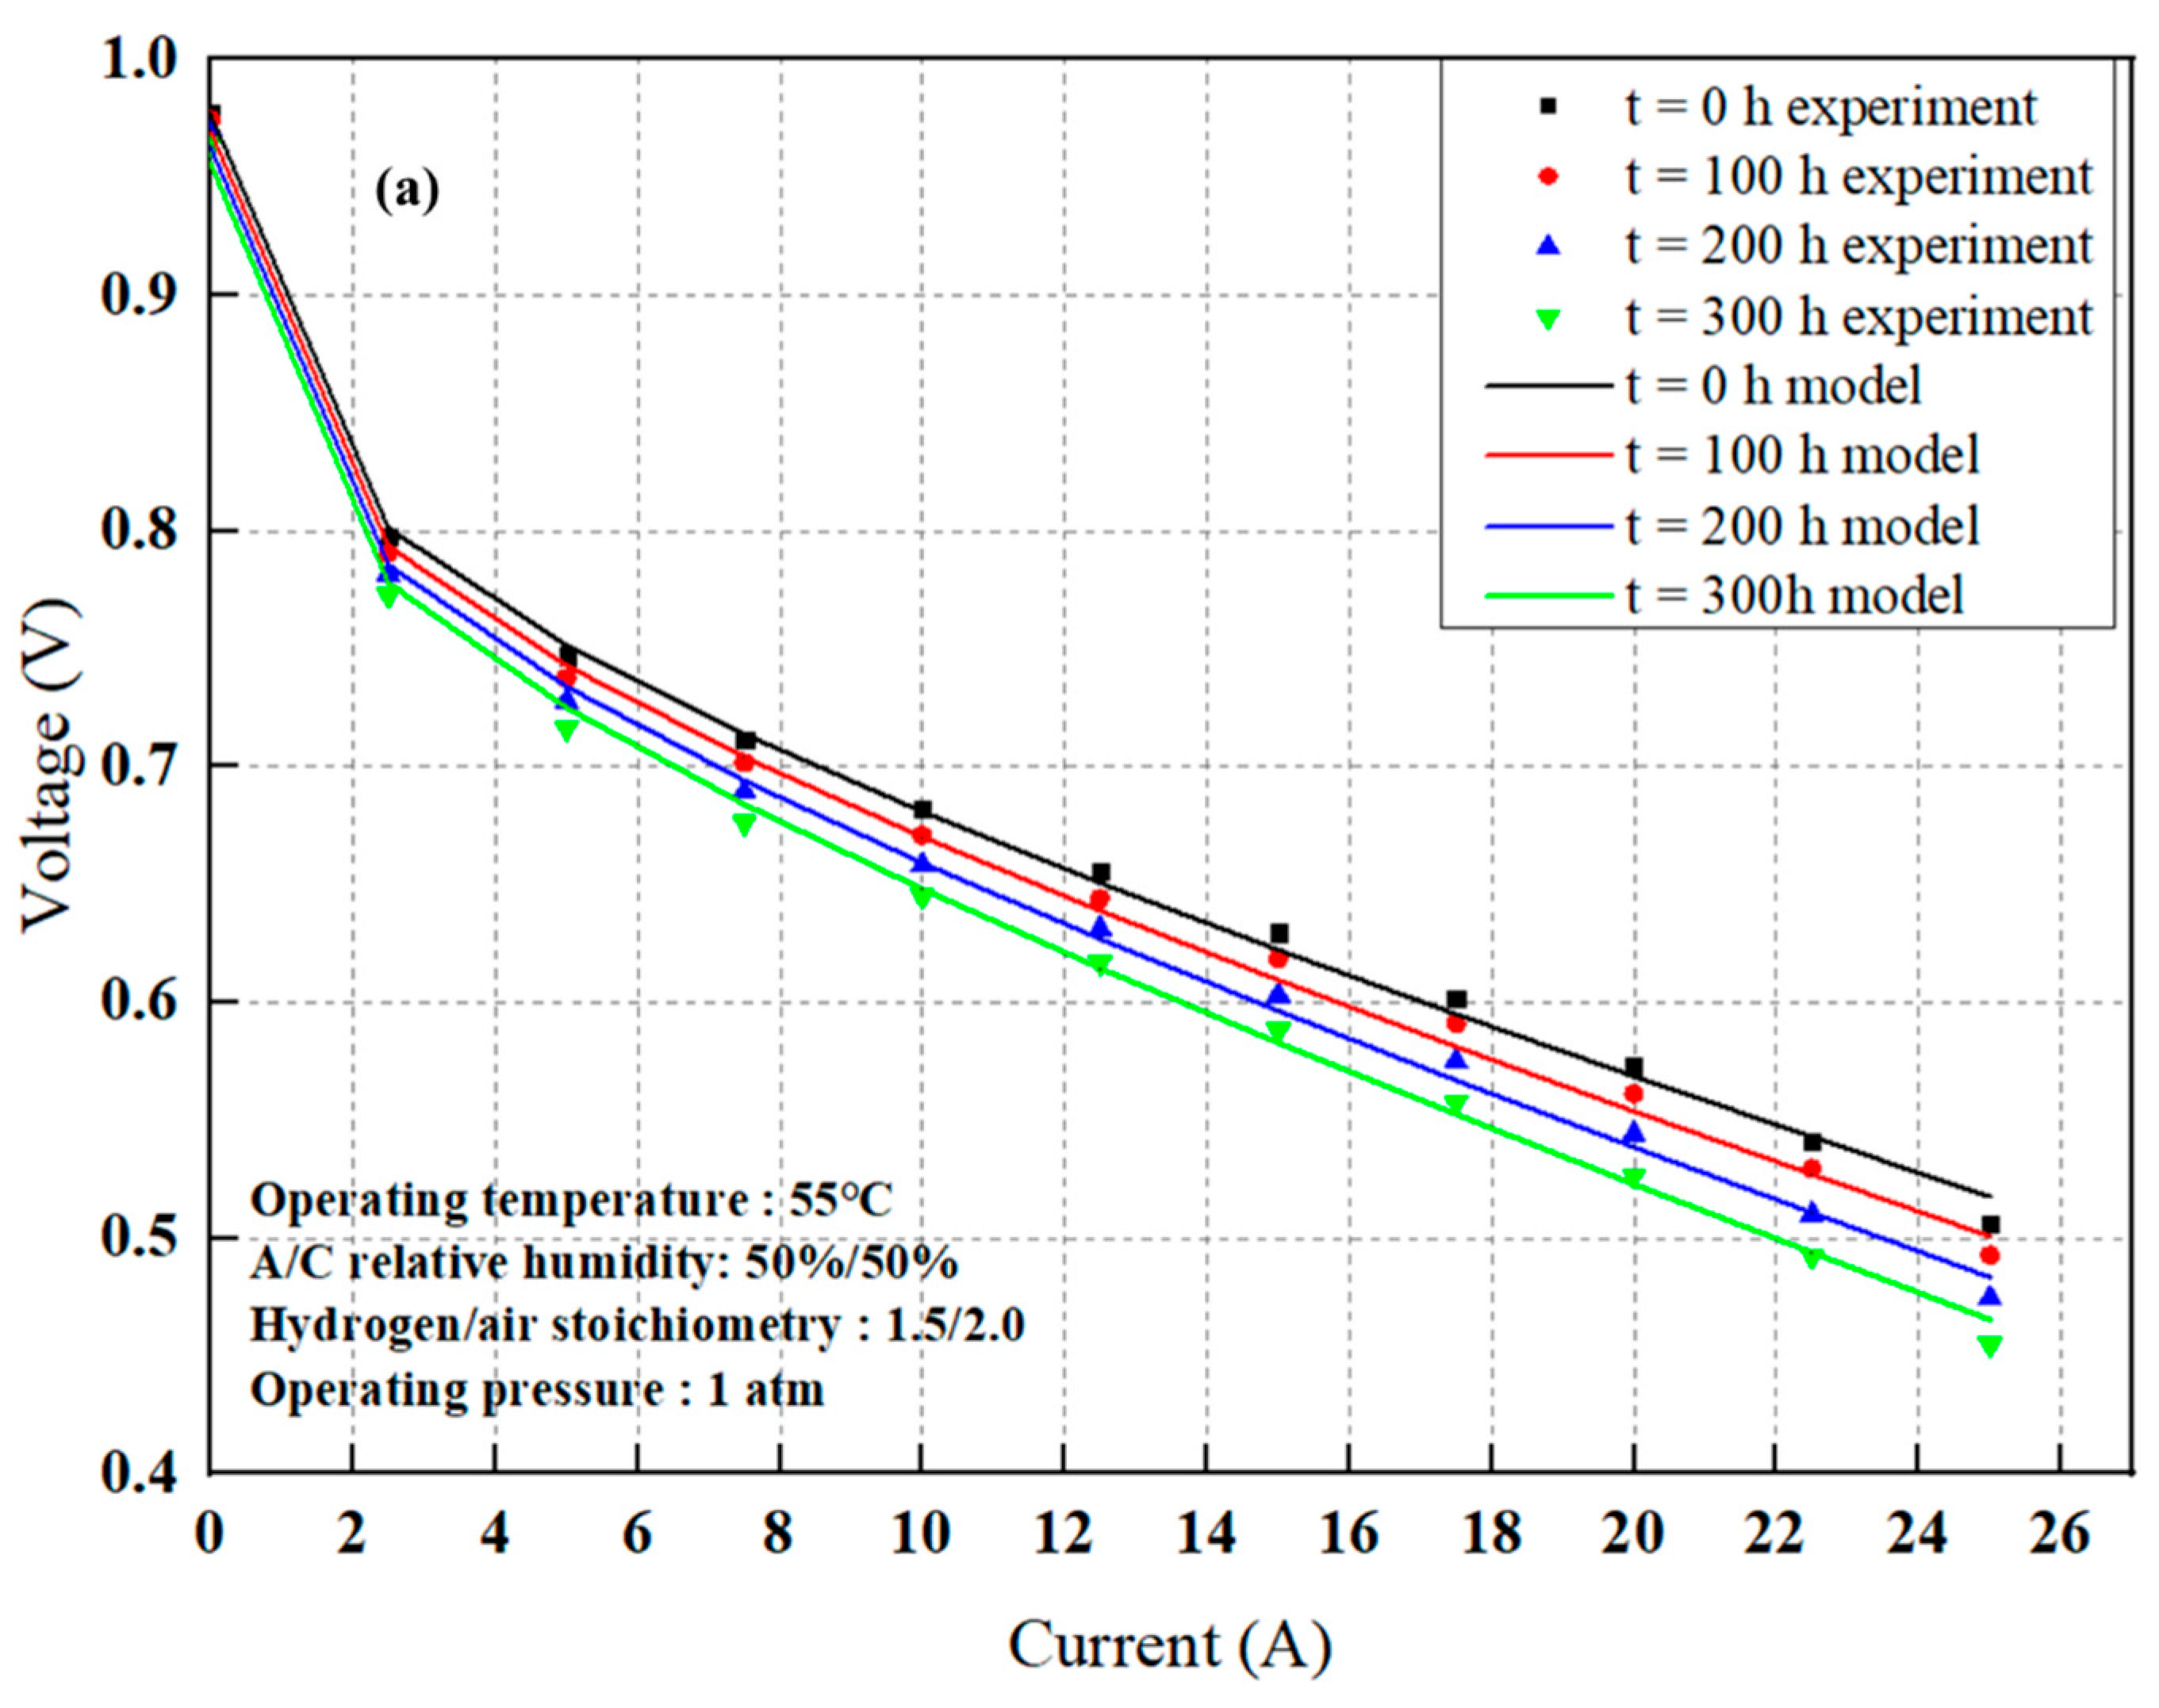
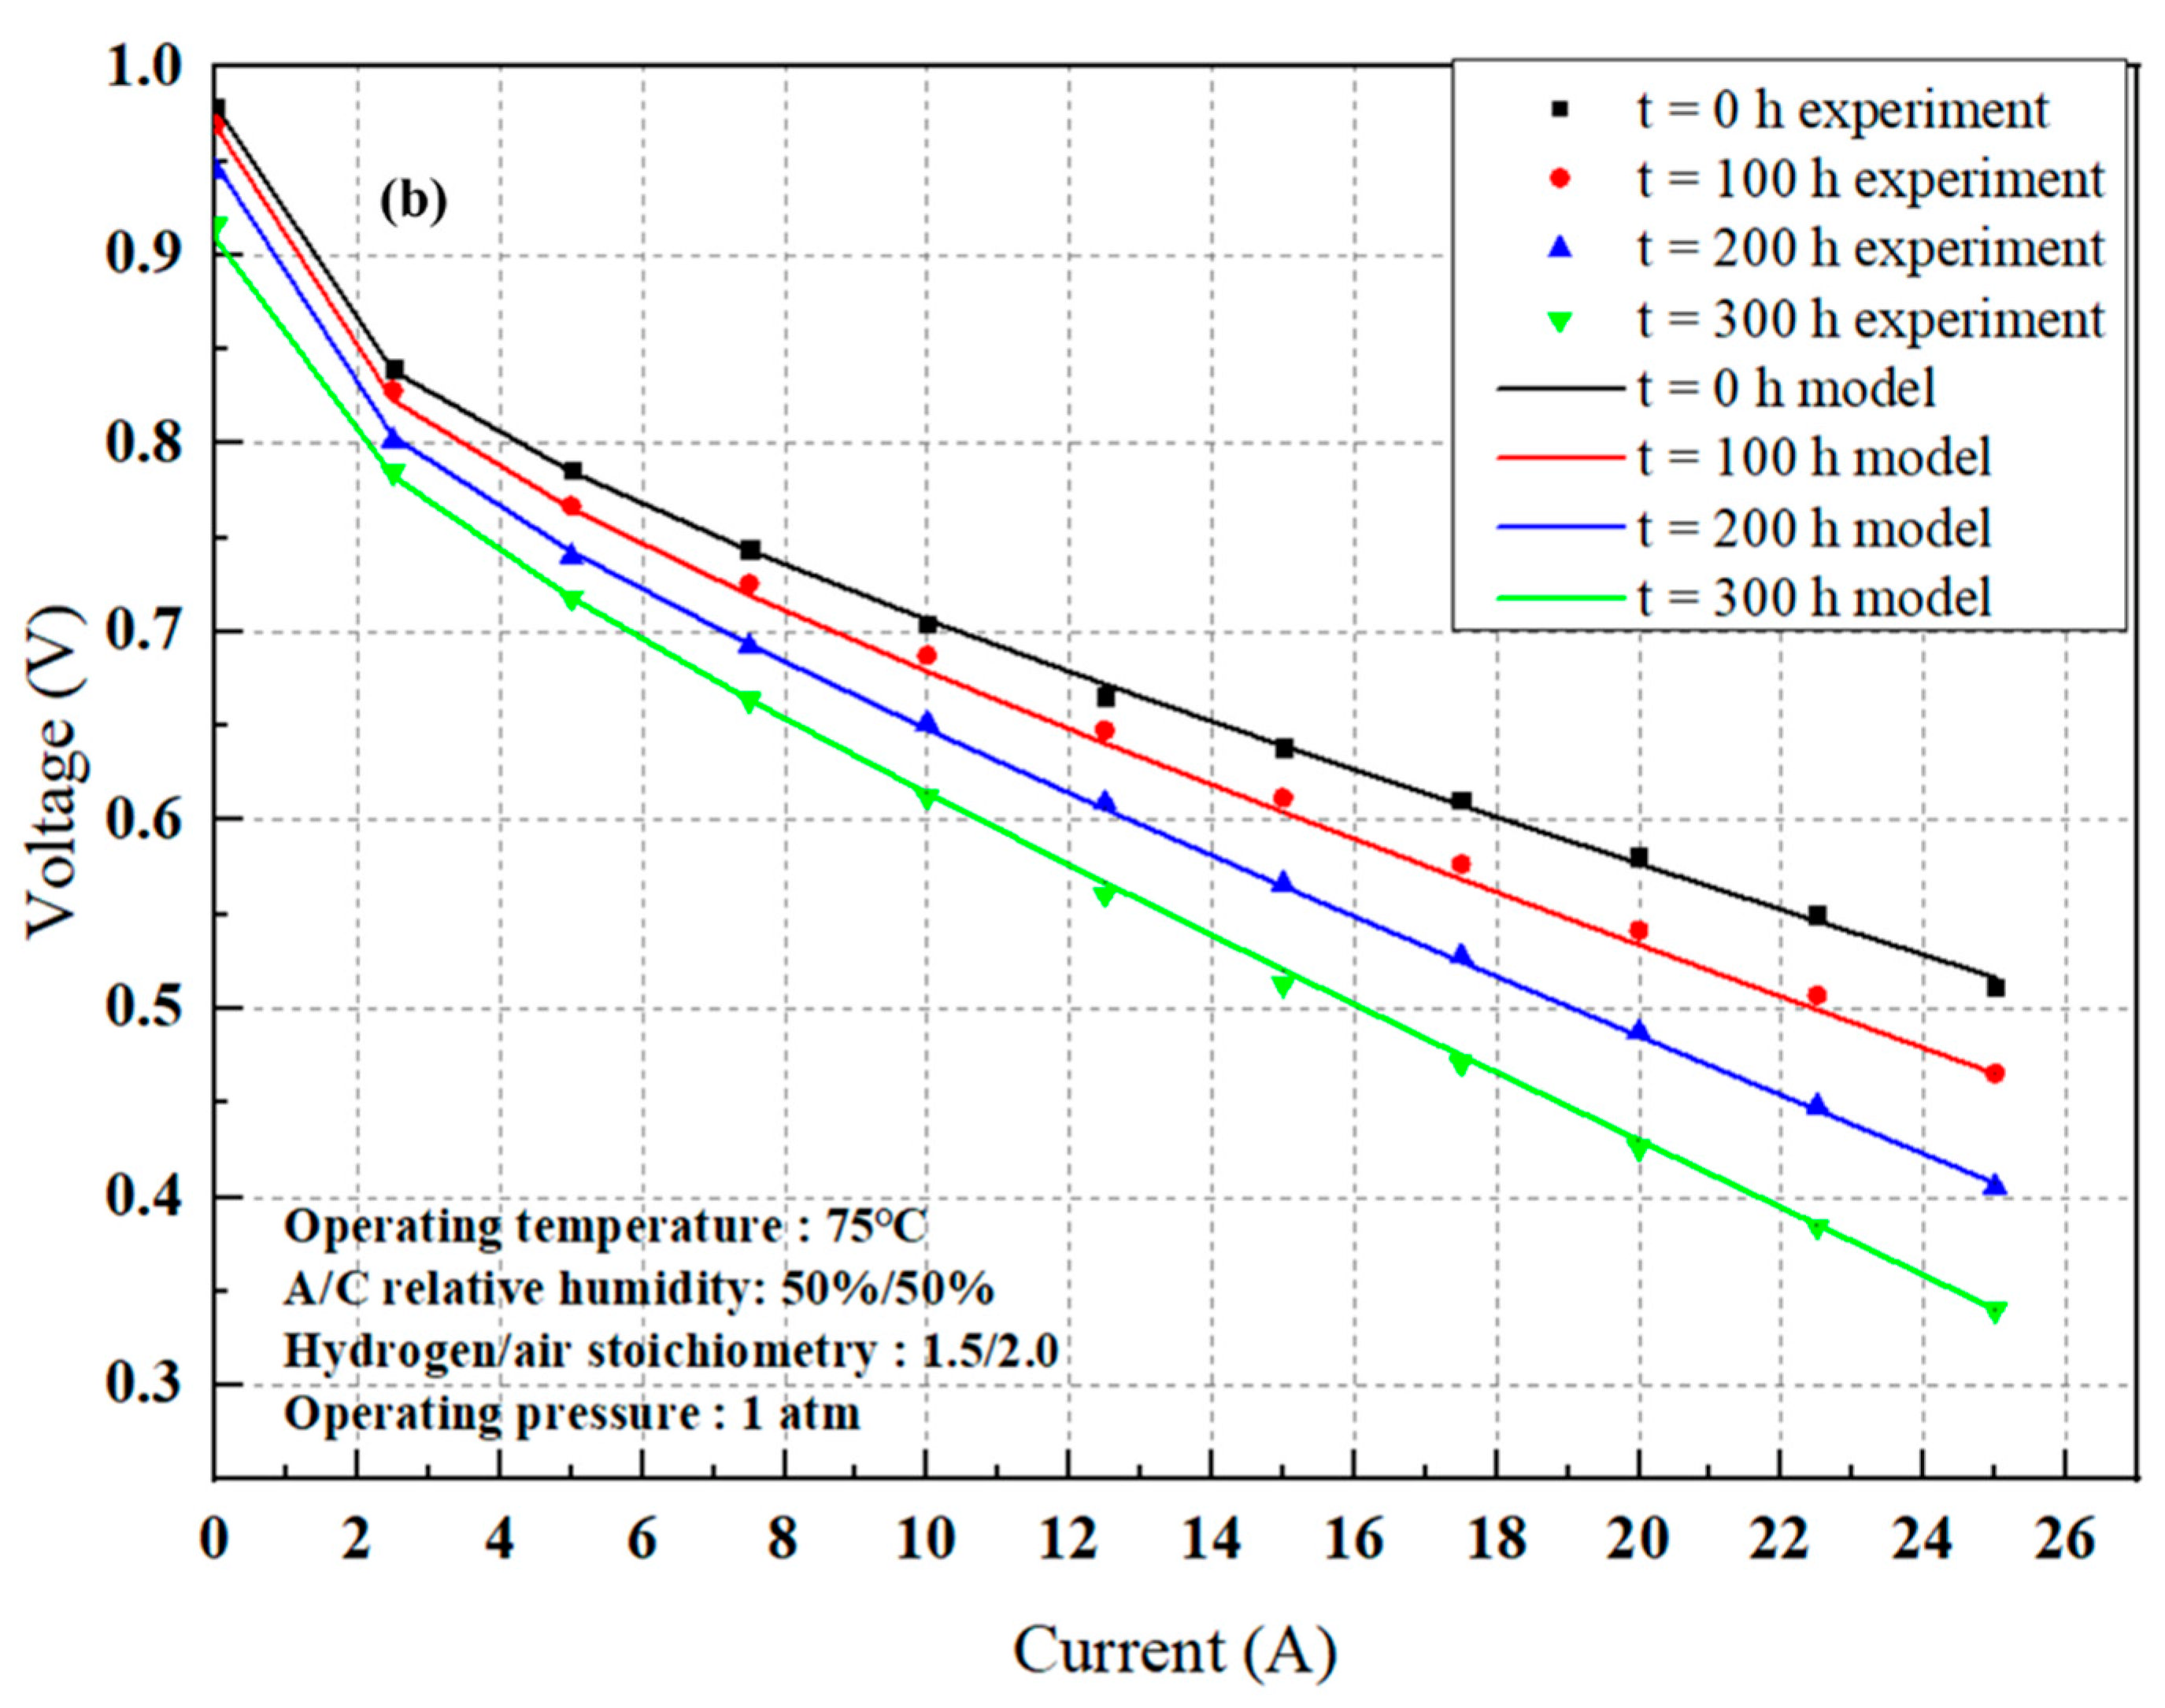
The polarization curve test is performed at 100-h intervals in the PEMFC durability testing described above. Figure 5 shows how the performance of the PEMFC degrades with time under two operating conditions during long-term operations. It is worth noting that in this study, the average voltage is used to analyze the behavior of a single cell rather than the entire stack. As shown in Figure 5, the performance of the modular stack is severely decreased by a longer running period paired with a higher temperature.

4.2. Modeling Results

4.2.1. Model Parameter Estimate

This section is dedicated to model validation. Model parameters in Equation (28) could be identified by fitting the recorded polarization curve data at various times. Equation (28) has two types of parameters: initial and aging parameters. Equation (28) is fitted to the polarization curve at t = 0 h to determine the initial parameters. This removes the time-dependent terms from Equation (28), allowing the parameters of a new PEMFC to be initialized without degradation. The fitting toolbox in MATLAB software R2019a is used to estimate all parameters using a least squares approach. Figure 5 shows the fitted plot as well as the polarization curve data. It is obvious that the model fits the experimental data well.
Equation (28) parameters are determined using the fitting technique outlined above and presented in Table 2 and Table 3. There are a few things to consider. The initial values from the durability test at T = 55 °C in Table 2 are lower than those from the durability test at T = 75 °C, with the exception of VPtO,o and R. Table 3 shows that the aging rate of the fuel cell at 75 °C will be faster (as demonstrated by significantly larger values of VPtO,1 and iloss,1). This might explain why fuel cell stacks degrade quicker and have a shorter lifetime at higher working temperatures, which will be further studied below.
The values of SSE, R-square, and RMSE are used to illustrate the model’s error, as shown in Table 4. The simulation results showed good agreement with the empirical model, with R-squared values greater than 0.99 for all cases. It indicated that the model is capable of accurately representing PEMFC behavior.

4.2.2. Sensitivity Analysis

As part of the validation process, the degradation model is subjected to a global sensitivity analysis (GSA). GSA is a mathematical technique used to study how uncertainty and variability in input parameters affect model outputs [29]. In this paper, a novel GSA method introduced by Francesca Pianosi and Thorsten Wagener [30] called PAWN is chosen for this analysis. It provides a sensitivity index, which measures the relative influence of each model parameter on the output. In this section, the aging parameters, the current, and time are taken as the target factors for the GSA. Figure 6 plots the output distribution of voltage against the inputs. From this figure, the current I seems to be the most influential factor as their influence on the output voltage varies along the horizontal axis, while the other inputs show the roughly evenly scattered points labeled as low influence.
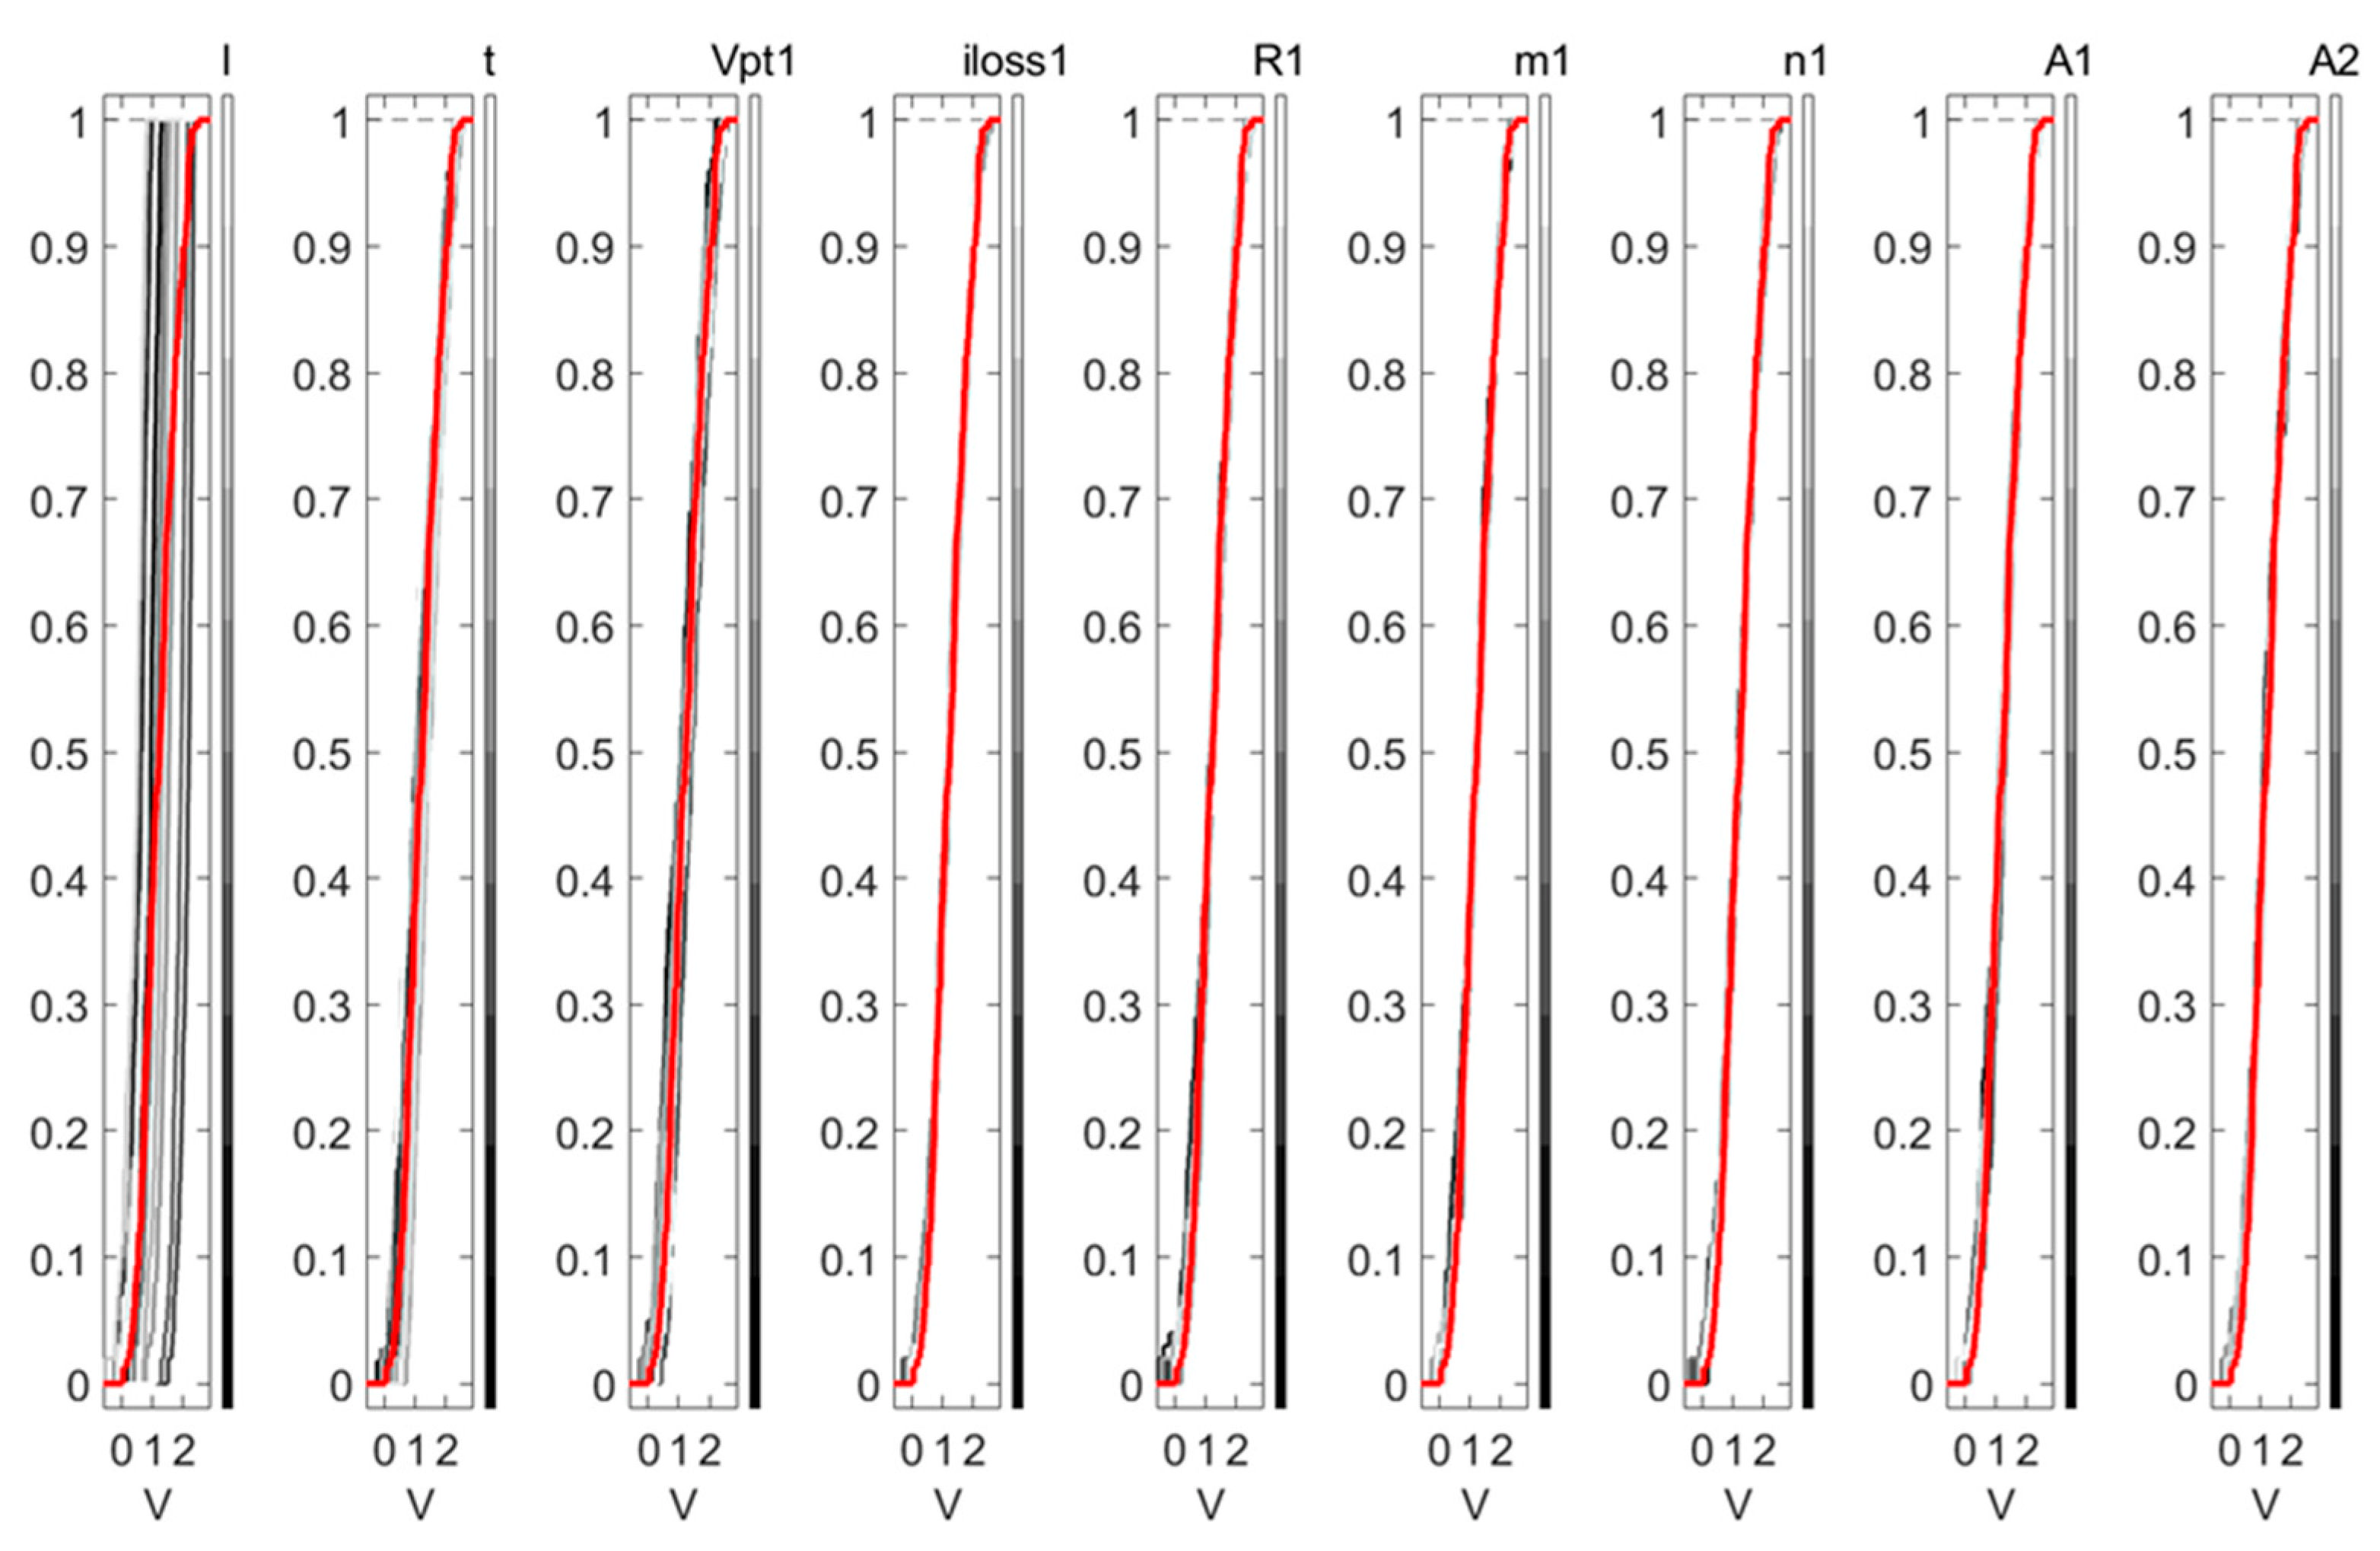
PAWN is based on the principle that the impact of an input factor will be proportional to the amount of change in the output distribution, which is characterized by the Cumulative Distribution Functions (CDFs) [31]. Figure 7 shows the CDFs plots of the model output to inputs. The red line in this picture depicts unconditional CDFs acquired by varying all inputs, whereas the gray lines represent conditional CDFs derived by fixing input xi. This image shows that the input I has the most influence since the conditional CDFs have the largest spread around the unconditional one (red line), but the conditional CDFs of the other inputs almost overlap with the unconditional CDFs.
The sensitivity of output y to input xi is calculated using the Kolmogorov—Smirnov statistic (KSs) based on the difference between the unconditional CDFs of y: F y y , and the conditional CDFs of y: F y | x i y [30]:
KS x i = max F y y F y | x i y
The PAWN sensitivity index is computed by taking a statistic of KSs (e.g., the maximum or median):
T i = stat KS x i
Ti ranges from 0 to 1. The lower the Ti value, the smaller the influence of xi.
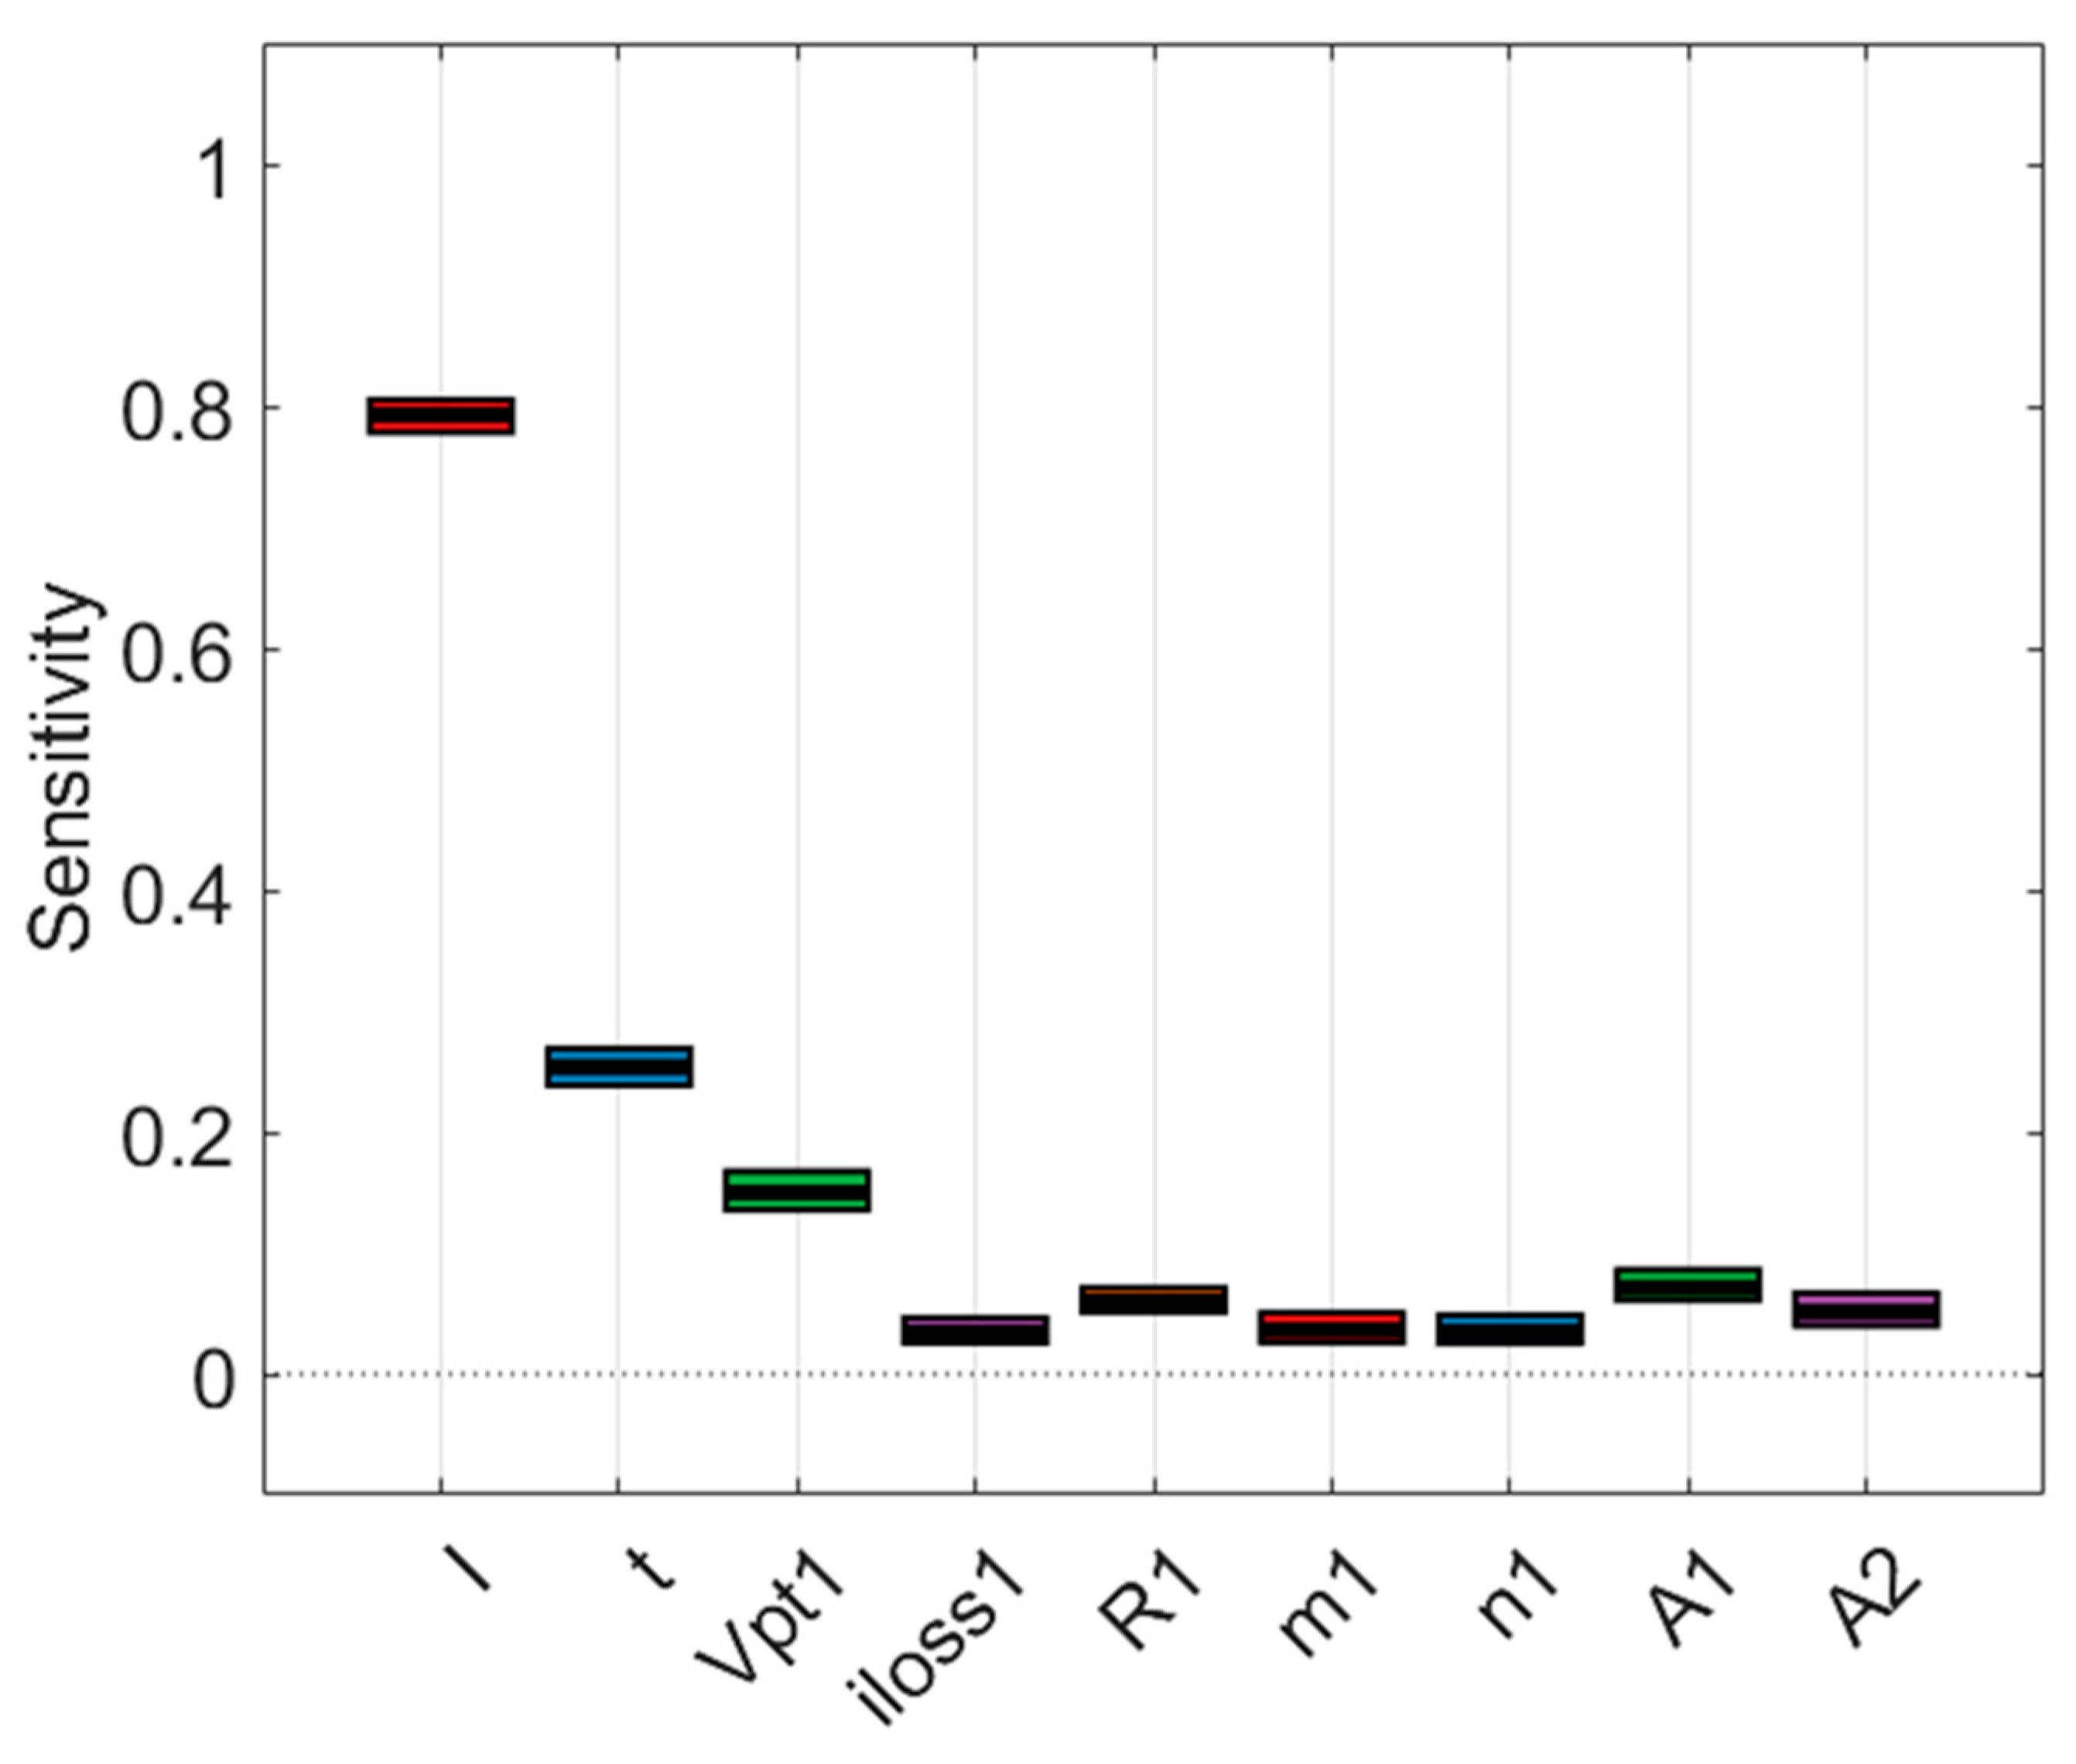
The PAWN sensitivity indices of model parameters are shown in Figure 8. As predicted, the most essential input is current, followed by time. It is consistent with the model’s purpose of evaluating the voltage evolution over time based on the cycle profile. Other parameters can be considered uninfluential, except for VPtO,1, which governs the linear part of the model. These sensitivity analyses reveal that the model presented in this paper may accurately reflect the performance degradation of fuel cells in reality.

4.2.3. Transient Responses of a Modular Stack Model

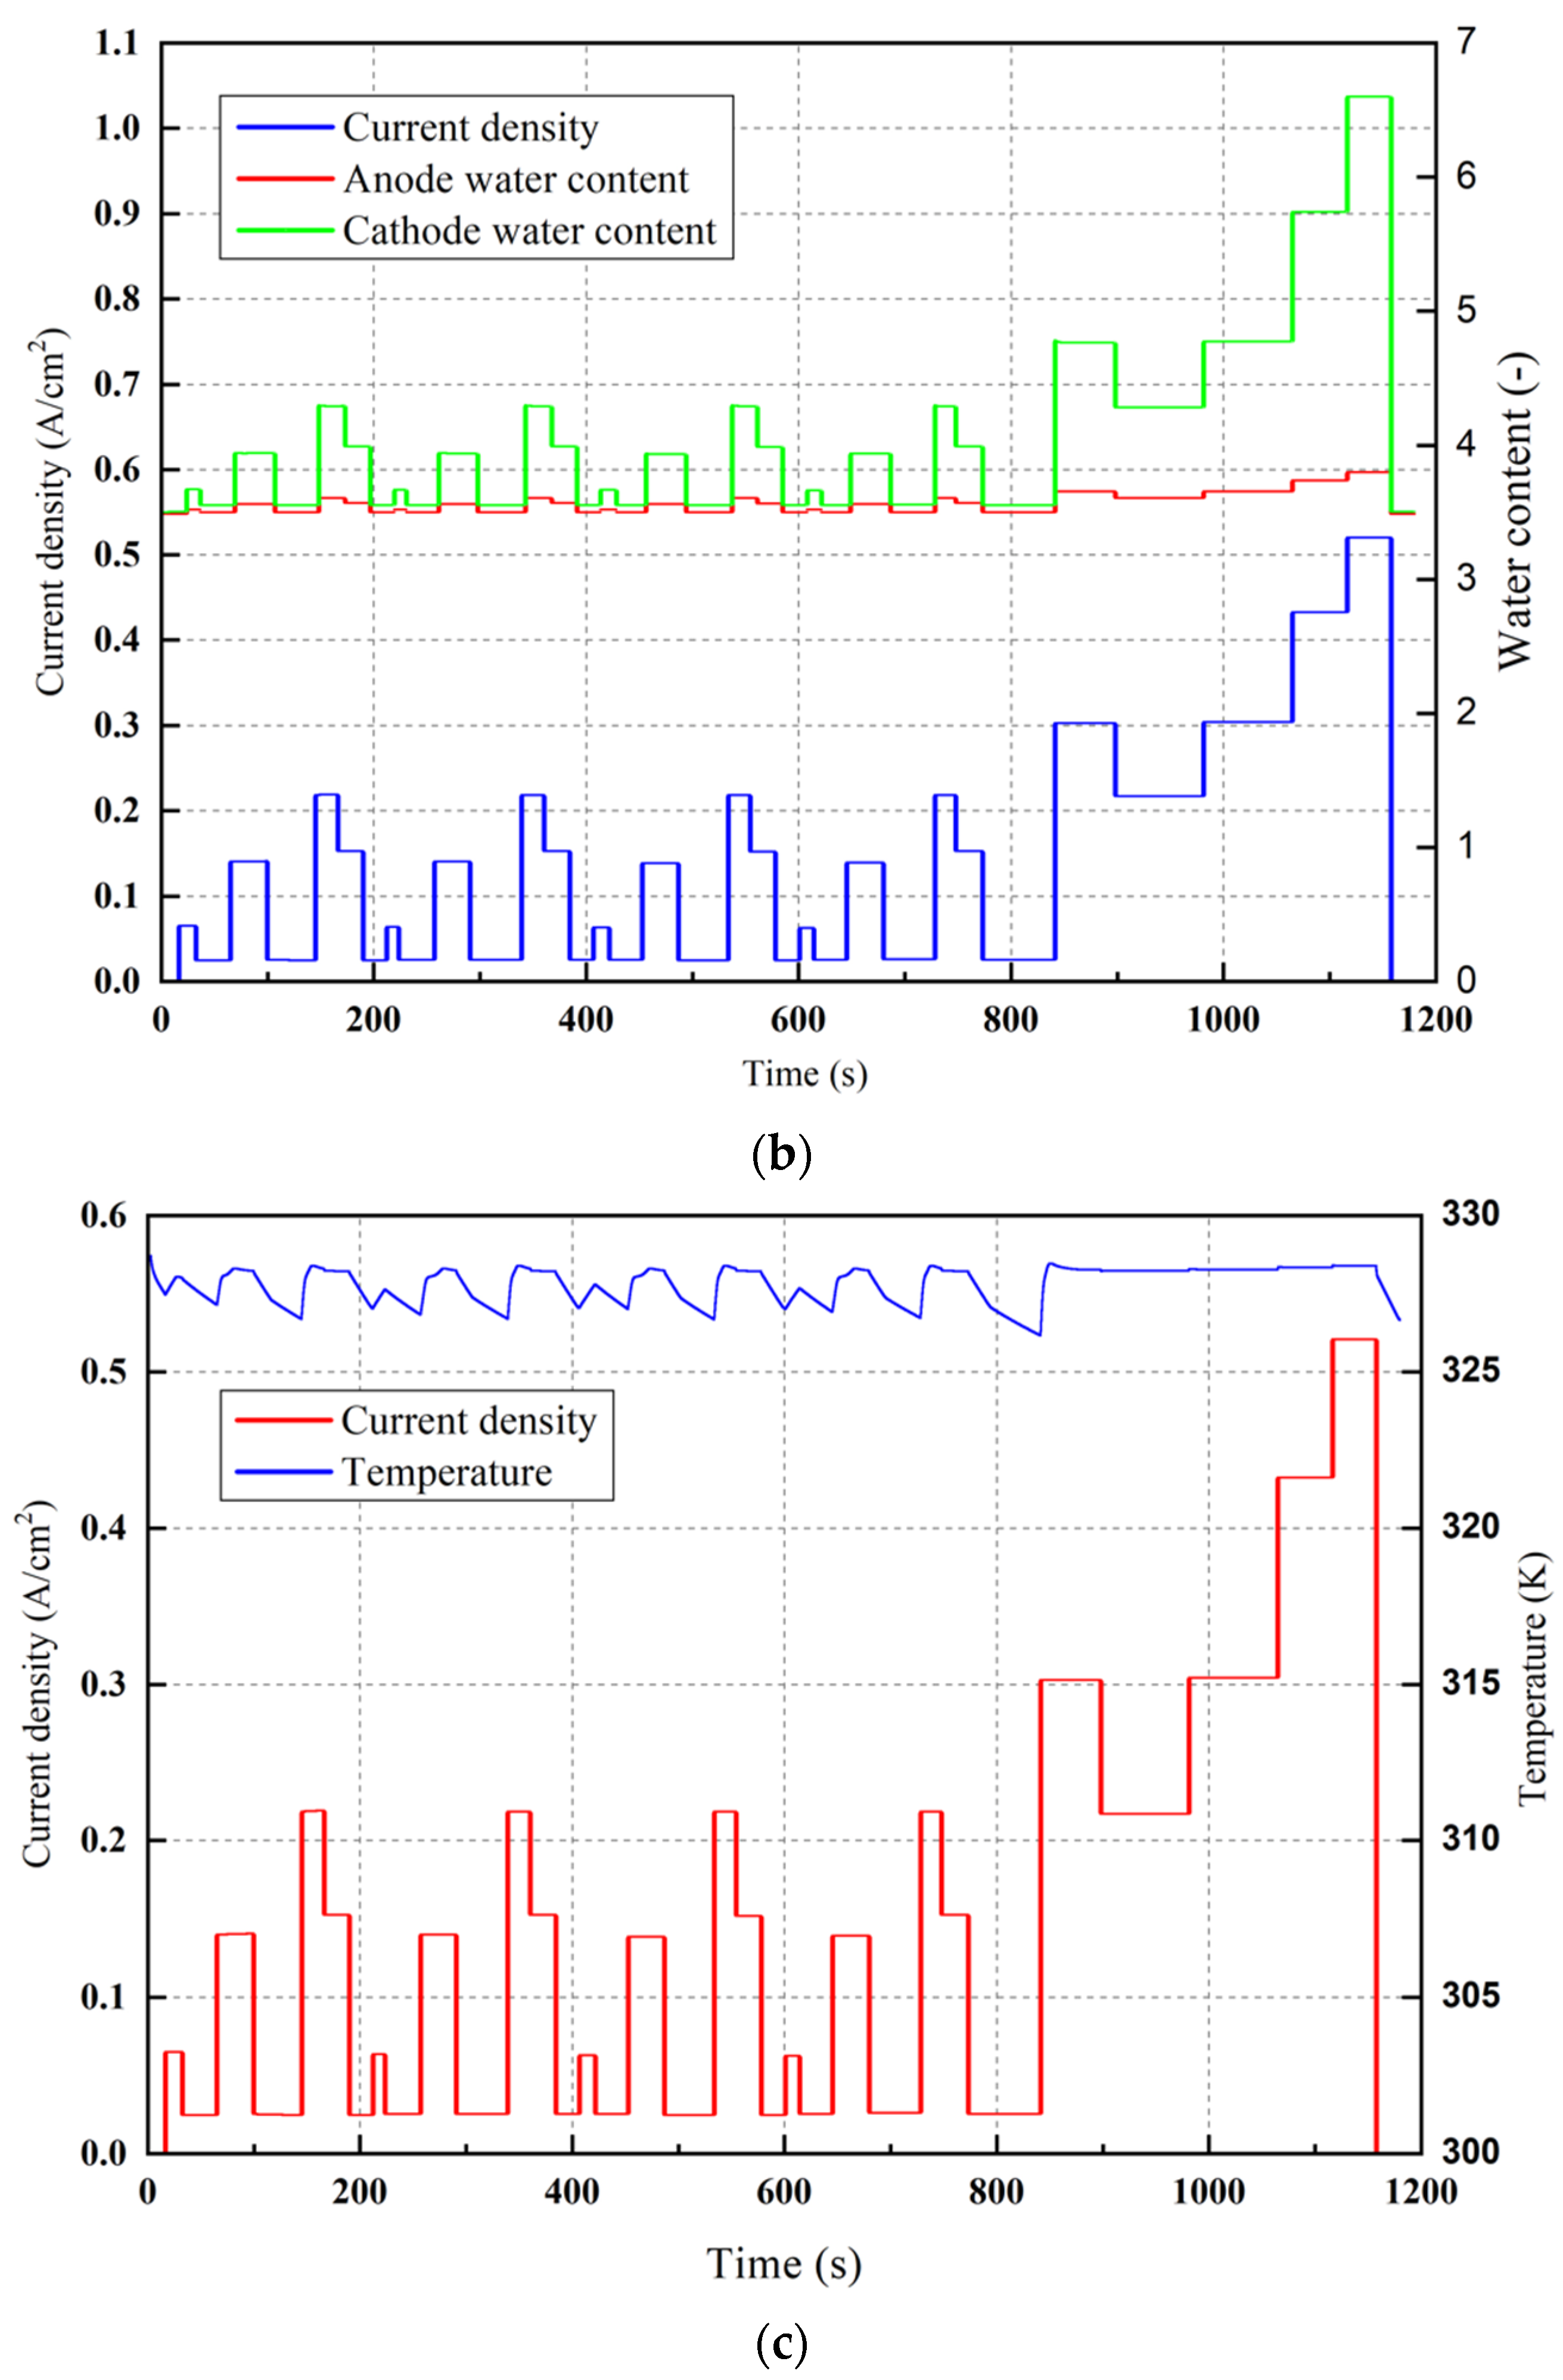
The NEDC driving cycle simulates the driving modes of a real car at various speeds, depending on the fuel cell system’s current demand density. The operation of the fuel stack can be affected by changes in current density. The PEMFC model was used to examine the transient responses of the fuel cell stack under the NEDC operating cycle in this section. Figure 9 depicts the voltage, water content, and temperature transient reactions during NEDC. The responses, as can be observed, closely reflect the current density demand. When the current density rises quickly, the voltage drops sharply, and vice versa. The membrane water content, on the other hand, fluctuates proportionally with the current demand. The cooling system keeps the temperature at the desired level throughout the operation. The temperature changes within a 1-degree margin.

4.2.4. Voltage Degradation and PEMFC Lifetime Prediction

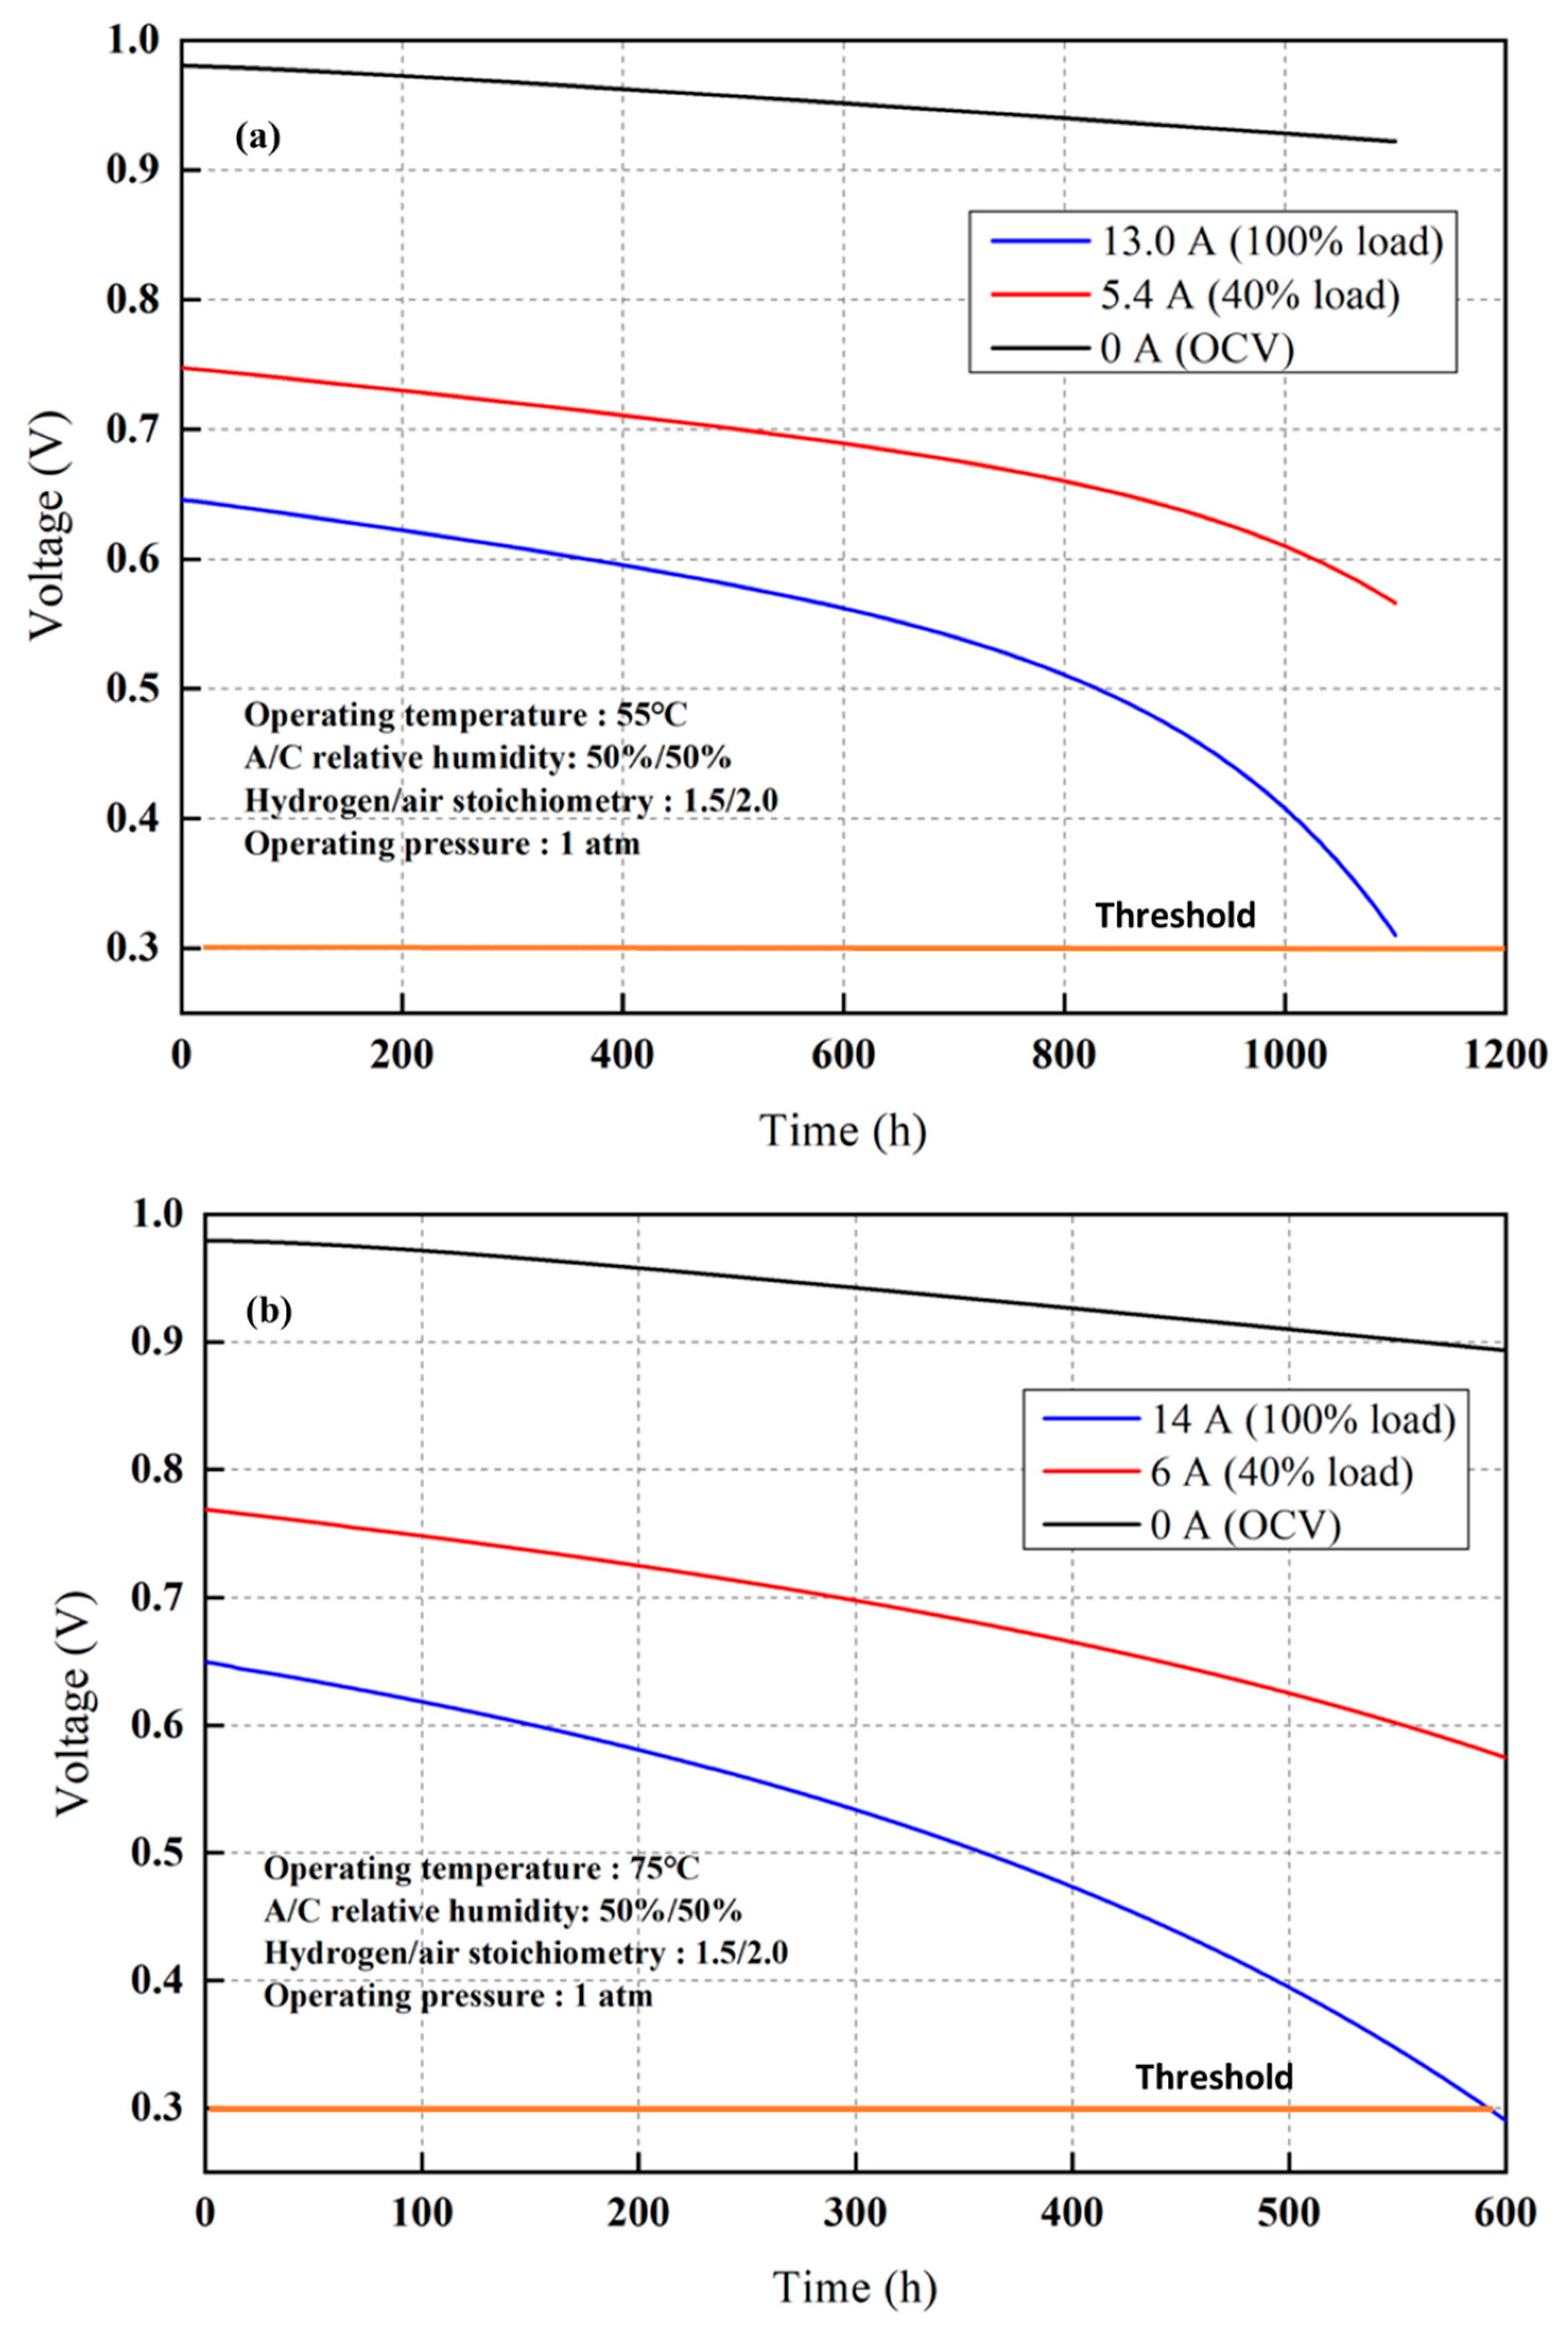
Figure 10 depicts the voltage variations during a single cycle at various times. As seen in Figure 10, the voltage deterioration rate accelerates with prolonged running time, particularly during high load operations (low voltage regimes). Figure 11 depicts voltage degradations of PEMFC with three different currents corresponding to 0%, 40%, and 100% of NEDC cycle load shown. When the fuel cell is run at 75 °C and 55 °C, the voltage degradation profiles show that the PEMFC is basically dead at roughly 600 h and 1100 h, once the voltage of the fuel cell is around 0.3 V at 100% load, which indicates the end of life [32].

4.3. Potential Use of the Model

The voltage degradation model uses the least squares method to fit the model’s parameters with the experimental data. Once the parameter values of the model are identified, it can be used to analyze the degradation of a PEMFC stack under certain operating conditions and vehicle driving cycles. Although the model has already shown satisfactory results, the change in operating conditions affects its accuracy. In fact, as the operating conditions change, the values of the identified parameters will also change. However, this model may be used to examine performance loss and health evaluation for both stationary and mobile applications for any fuel cell stack if the required parameters are available. If not given, a set of experimental tests would be necessary to define the model’s parameters.

5. Conclusions

In this paper, a new voltage degradation model was developed to investigate the multiple degradation mechanisms under dynamic operation. The simulation results presented a good agreement with the empirical model, with R-squared values greater than 0.99 for all datasets collected with NEDC profiles. The dynamic responses of temperature, voltage, and water content in the membrane under the NEDC dynamic driving cycle were captured. They matched well with the changes in the current profile. It proves that this new model can be used to investigate the performance and health of a PEMFC stack under certain operating conditions and driving cycles. The simulation results show that PEMFC is basically dead after 1100 h and 600 h when the fuel cell is operated at 55 °C and 75 °C, respectively, under NEDC mode. In addition, according to the model sensitivity analysis, the voltage degradation model is most sensitive to load current, followed by time under dynamic operation.
The model has already received satisfactory validation and is capable of quickly following the profiles of an automotive driving cycle with rapid current swift but not yet perfect. Despite having severe degradations, the datasets in this paper were only moderately long. More work needs to be done to strengthen the model validation and support the above findings. The next step in this study is to test the model with various vehicle driving cycles over a longer running time.

Author Contributions

H.L.N.: conceptualization, methodology, and writing—original draft preparation. J.H.: resources and writing—original draft preparation. H.N.V.: resources and writing—original draft preparation. S.Y.: supervision. All authors have read and agreed to the published version of the manuscript.

Funding

This work was supported by the Technology Innovation Program (No.20015756), funded by the Ministry of Trade, Industry and Energy (MOTIE, Korea), and by the Korea Institute of Energy Technology Evaluation and Planning (KETEP) and the Ministry of Trade, Industry and Energy (MOTIE) of the Republic of Korea (No.20213030030210).

Data Availability Statement

Not applicable.

Conflicts of Interest

The authors declare no conflict of interest.

Nomenclature

Aarea [m2]
aWater activity [-]
A1Active surface area aging parameter [cm2]
A2Active surface area aging parameter [h−1]
AoActive surface area at t = 0 [cm2]
BaAnode concentration loss parameter [V]
BcCathode concentration loss parameter [V]
cConcentration [mol.cm−3]
cpSpecific heat [J.kg−1.K−1]
cwthe water concentration, in mol/cm3
DijDiffusion coefficient of species i and j [cm2.s−1]
DλWater diffusivity [cm2.s−1]
ErevReversible open-circuit voltage [V]
FFaraday constant [96485 C.mol−1]
hHeat transfer coefficient [W.m−2.K−1]
ICurrent [A]
iCurrent density [A.cm−2]
iL,aLimiting current density at the anode [A.cm−2]
iL,cLimiting current density at the cathode [A/cm−2]
iloss,1Aging parameter of iloss [h−1]
iloss,oInitial parameter of iloss [A.cm−2]
ilossInternal current density [A.cm−2]
io,aExchange current density at the anode [A.cm−2]
io,cExchange current density at the cathode [A.cm−2]
JDiffusion flux [mol.m−2.s−1]
Jw,dElectro-osmotic drag [mol.s−1.cm−2]
Jw,diffBack diffusion drag [mol.s−1.cm−2]
Lmembrane thickness (cm)
mEmpirical parameter in concentration loss equation [V]
mMass flow rate [kg.s−1]
m1Aging parameter of m [h−1]
MmMembrane dry equivalent weight [kg.mol−1]
moInitial parameter of m [V]
nEmpirical parameter in concentration loss equation [cm2.A−1]
n1Aging parameter of n [h−1]
ndElectro-osmotic drag coefficient [-]
noInitial parameter of n [cm2/A]
pPressure [pa]
PH2the partial pressure of H2 [atm]
PO2the partial pressure of O2 [atm]
QdryMembrane dry density [kg.cm−3]
RIdea gas constant [8.314 J.mol−1.K−1]
ROhmic resistance [ohm.cm2]
R1Aging parameter of R [h−1]
RcrContact resistance [ohm.cm2]
ReleElectronic resistance [ohm.cm2]
RHRelative humidity [%]
RmembMembrane resistance [ohm.cm2]
RoInitial parameter of R [ohm.cm2]
sStoichiometry [-]
TTemperature [K]
tAAnode electrode thickness
Tc,inCoolant temperature outlet [K]
Tc,oCoolant temperature outlet [K]
tCCathode electrode thickness
Tg,inGas temperature inlet [K]
Tg,oGas temperature outlet [K]
VPtO,1Aging parameter of VPtO [h−1]
VPtO,oInitial parameter of VPtO [V]
VPtOPlatinum oxide overvoltage [V]
xMole fraction [0~1]
αaCharge transfer coefficient at the anode
αcCharge transfer coefficient at the cathode
λWater content [-]

References

  1. Nguyen, H.L.; Han, J.; Nguyen, X.L.; Yu, S.; Goo, Y.M.; Le, D.D. Review of the Durability of Polymer Electrolyte Membrane Fuel Cell in Long-Term Operation: Main Influencing Parameters and Testing Protocols. Energies 2021, 14, 4048. [Google Scholar] [CrossRef]
  2. Borup, R.; Meyers, J.; Pivovar, B.; Kim, Y.S.; Mukundan, R.; Garland, N.; Myers, D.; Wilson, M.; Garzon, F.; Wood, D.; et al. Scientific Aspects of Polymer Electrolyte Fuel Cell Durability and Degradation. Chem. Rev. 2007, 107, 3904–3951. [Google Scholar] [CrossRef]
  3. Yuan, X.Z.; Li, H.; Zhang, S.; Martin, J.; Wang, H. A Review of Polymer Electrolyte Membrane Fuel Cell Durability Test Protocols. J. Power Sources 2011, 196, 9107–9116. [Google Scholar] [CrossRef] [Green Version]
  4. Mayur, M.; Strahl, S.; Husar, A.; Bessler, W.G. A Multi-Timescale Modeling Methodology for PEMFC Performance and Durability in a Virtual Fuel Cell Car. Int. J. Hydrogen Energy 2015, 40, 16466–16476. [Google Scholar] [CrossRef] [Green Version]
  5. Han, J.; Han, J.; Yu, S. Investigation of FCVs Durability under Driving Cycles Using a Model-Based Approach. J. Energy Storage 2020, 27, 101169. [Google Scholar] [CrossRef]
  6. Ehlinger, V.M.; Kusoglu, A.; Weber, A.Z. Modeling Coupled Durability and Performance in Polymer-Electrolyte Fuel Cells: Membrane Effects. J. Electrochem. Soc. 2019, 166, F3255–F3267. [Google Scholar] [CrossRef]
  7. Zheng, W.; Xu, L.; Hu, Z.; Ding, Y.; Li, J.; Ouyang, M. Dynamic Modeling of Chemical Membrane Degradation in Polymer Electrolyte Fuel Cells: Effect of Pinhole Formation. J. Power Sources 2021, 487, 229367. [Google Scholar] [CrossRef]
  8. Zheng, W.; Xu, L.; Hu, Z.; Zhao, Y.; Li, J.; Ouyang, M. Dynamic Modeling of Pt Degradation and Mitigation Strategies in Polymer Electrolyte Membrane Fuel Cells. eTransportation 2022, 12, 100171. [Google Scholar] [CrossRef]
  9. Kregar, A.; Gatalo, M.; Maselj, N.; Hodnik, N.; Katrašnik, T. Temperature Dependent Model of Carbon Supported Platinum Fuel Cell Catalyst Degradation. J. Power Sources 2021, 514, 230542. [Google Scholar] [CrossRef]
  10. Jouin, M.; Gouriveau, R.; Hissel, D.; Péra, M.C.; Zerhouni, N. Degradations Analysis and Aging Modeling for Health Assessment and Prognostics of PEMFC. Reliab. Eng. Syst. Saf. 2016, 148, 78–95. [Google Scholar] [CrossRef]
  11. Zhou, D.; Wu, Y.; Gao, F.; Breaz, E.; Ravey, A.; Miraoui, A. Degradation Prediction of PEM Fuel Cell Stack Based on Multiphysical Aging Model with Particle Filter Approach. IEEE Trans. Ind. Appl. 2017, 53, 4041–4052. [Google Scholar] [CrossRef]
  12. Bressel, M.; Hilairet, M.; Hissel, D.; Ould Bouamama, B. Extended Kalman Filter for Prognostic of Proton Exchange Membrane Fuel Cell. Appl. Energy 2016, 164, 220–227. [Google Scholar] [CrossRef]
  13. Liu, H.; Chen, J.; Zhu, C.; Su, H.; Hou, M. Prognostics of Proton Exchange Membrane Fuel Cells Using A Model-Based Method. FAC-Pap. 2017, 50, 4757–4762. [Google Scholar] [CrossRef]
  14. Song, K.; Wang, Y.; Hu, X.; Cao, J. Online Prediction of Vehicular Fuel Cell Residual Lifetime Based on Adaptive Extended Kalman Filter. Energies 2020, 13, 6244. [Google Scholar] [CrossRef]
  15. Zhang, D.; Baraldi, P.; Cadet, C.; Yousfi-Steiner, N.; Bérenguer, C.; Zio, E. An Ensemble of Models for Integrating Dependent Sources of Information for the Prognosis of the Remaining Useful Life of Proton Exchange Membrane Fuel Cells. Mech. Syst. Signal Process 2019, 124, 479–501. [Google Scholar] [CrossRef] [Green Version]
  16. Mao, L.; Jackson, L.; Jackson, T. Investigation of Polymer Electrolyte Membrane Fuel Cell Internal Behaviour during Long Term Operation and Its Use in Prognostics. J. Power Sources 2017, 362, 39–49. [Google Scholar] [CrossRef] [Green Version]
  17. Han, J.; Han, J.; Yu, S. Experimental Analysis of Performance Degradation of 3-Cell PEMFC Stack under Dynamic Load Cycle. Int. J. Hydrogen Energy 2020, 45, 13045–13054. [Google Scholar] [CrossRef]
  18. Sharaf, O.Z.; Orhan, M.F. An Overview of Fuel Cell Technology: Fundamentals and Applications. Renew. Sustain. Energy Rev. 2014, 32, 810–853. [Google Scholar] [CrossRef]
  19. Barbir, F. PEM Fuel Cells: Theory and Practice; Elsevier Academic Press: Burlington, NJ, USA, 2005. [Google Scholar]
  20. Kim, J.; Lee, S.; Srinivasan, S.; Chamberlin, C.E. Modeling of Proton Exchange Membrane Fuel Cell Performance with an Empirical Equation. J. Electrochem. Soc. 1995, 142, 2670–2674. [Google Scholar] [CrossRef]
  21. Zhang, J.; Tang, Y.; Song, C.; Zhang, J.; Wang, H. PEM Fuel Cell Open Circuit Voltage (OCV) in the Temperature Range of 23 °C to 120 °C. J. Power Sources 2006, 163, 532–537. [Google Scholar] [CrossRef]
  22. Ahmadi, V. Modeling of Proton Exchange Membrane Fuel Cell Performance Degradation and Operation Life. Master’s Thesis, University of Victoria, Victoria, BC, Canada, 2021. [Google Scholar]
  23. Huang, L.; Zhang, X.; Jiang, Y.; Huang, P.; Lin, L. Modeling-Based Analytics of Degradation Behavior for Fuel Cell Stack under Actual Dynamic Ambient Temperature. Energy Convers. Manag. 2022, 269, 116100. [Google Scholar] [CrossRef]
  24. Abderezzak, B. Introduction to Transfer Phenomena in PEM Fuel Cell; Elsevier Ltd.: Amsterdam, The Netherlands, 2018. [Google Scholar]
  25. Lee, H.; Han, C.; Park, T. Experimental Investigation of Charge Transfer Coefficient and Exchange Current Density in Standard Fuel Cell Model for Polymer Electrolyte Membrane Fuel Cells. Korean J. Chem. Eng. 2020, 37, 577–582. [Google Scholar] [CrossRef]
  26. Jao, T.C.; Jung, G.B.; Kuo, S.C.; Tzeng, W.J.; Su, A. Degradation Mechanism Study of PTFE/Nafion Membrane in MEA Utilizing an Accelerated Degradation Technique. Int. J. Hydrogen Energy 2012, 37, 13623–13630. [Google Scholar] [CrossRef]
  27. Mukundan, R.; Baker, A.M.; Kusoglu, A.; Beattie, P.; Knights, S.; Weber, A.Z.; Borup, R.L. Membrane Accelerated Stress Test Development for Polymer Electrolyte Fuel Cell Durability Validated Using Field and Drive Cycle Testing. J. Electrochem. Soc. 2018, 165, F3085–F3093. [Google Scholar] [CrossRef]
  28. Han, J.; Han, J.; Ji, H.; Yu, S. “Model-Based” Design of Thermal Management System of a Fuel Cell “Air-Independent” Propulsion System for Underwater Shipboard. Int. J. Hydrogen Energy 2020, 45, 32449–32463. [Google Scholar] [CrossRef]
  29. Noacco, V.; Sarrazin, F.; Pianosi, F.; Wagener, T. Matlab/R Workflows to Assess Critical Choices in Global Sensitivity Analysis Using the SAFE Toolbox. MethodsX 2019, 6, 2258–2280. [Google Scholar] [CrossRef]
  30. Pianosi, F.; Wagener, T. A Simple and Efficient Method for Global Sensitivity Analysis Based Oncumulative Distribution Functions. Environ. Model. Softw. 2015, 67, 1–11. [Google Scholar] [CrossRef] [Green Version]
  31. Pianosi, F.; Wagener, T. Distribution-Based Sensitivity Analysis from a Generic Input-Output Sample. Environ. Model. Softw. 2018, 108, 197–207. [Google Scholar] [CrossRef]
  32. FCTESTNET Test Module PEFC SC 5-6, Version 30 04, JRC Scientific and Technical Reports; Publications Office of the European Union: Luxembourg, 2010.
Figure 1. Schematic of the PEMFC model.
Energies 15 09574 g001
Figure 2. Test bench for 3-cell modular stack durability test. (a) Schematic diagram. (b) Data acquisition. (c) Overall test bench.
Energies 15 09574 g002aEnergies 15 09574 g002b
Figure 3. Current profiles of NEDC mode.
Energies 15 09574 g003
Figure 4. Voltage degradation of modular stacks. (a) 55 °C. (b) 75 °C.
Energies 15 09574 g004aEnergies 15 09574 g004b
Figure 5. Performance degradation model fitting results. (a) 55 °C. (b) 75 °C.
Energies 15 09574 g005aEnergies 15 09574 g005b
Figure 6. Scatter plots of output samples.
Energies 15 09574 g006
Figure 7. Cumulative Distribution Functions (CDFs) of the model output V.
Energies 15 09574 g007
Figure 8. PAWN sensitivity indices of the model parameters (The boxes show bootstrapping confidence intervals, and the black lines reflect the mean index estimate).
Energies 15 09574 g008
Figure 9. Example of transient responses of the stack under NEDC cycle at operating temperature of 55 °C. (a) Voltage. (b) Water content in the membrane. (c) Fuel cell temperature.
Energies 15 09574 g009aEnergies 15 09574 g009b
Figure 10. PEMFC voltage profiles at different times with two operating temperatures. (a) 55 °C. (b) 75 °C.
Energies 15 09574 g010
Figure 11. Voltage degradation with time at three different loads: 0%, 40%, and 100% of the NEDC cycle at two operating temperatures. (a) 55 °C. (b) 75 °C.
Energies 15 09574 g011
Table 1. 3-cell modular stack specifications.
ParametersValue
Active area of the fuel cell25 cm2
Number of cells3
Membrane (Nafion 211) thickness23 μm
Catalyst layer thickness42 μm
Gas diffusion thickness320 μm
Table 2. Initial values.
Durability test 1
(T = 55 °C)
VPtO,o (V)αaαaIloss,o (A/cm2)io,a (A/cm2)
0.25820.50.50.00270.0083
io,c (A/cm2)Ro (ohm/cm2)mono
0.00830.20670.00820.1065
Durability test 2
(T = 75 °C)
VPtO,o (V)αaαaIloss,o (A/cm2)io,a (A/cm2)
0.19720.50.50.00800.0095
io,c (A/cm2)Ro (ohm/cm2)mono
0.00910.16590.38720.1872
Table 3. Aging parameters.
Durability test 1
(T = 55 °C)
VPtO,1 (1/h)iloss,1 (1/h)A1 (cm2)A2 (1/h)
6.75 × 10−52.11 × 10−60.03600.0019
R1 (1/h)m1 (1/h)n1 (1/h)
4.29 × 10−40.00550
Durability test 2
(T = 75 °C)
VPtO,1 (1/h)iloss,1 (1/h)A1 (cm2)A2 (1/h)
1.33 × 10−41.32 × 10−30.11721.87 × 10−4
R1 (1/h)m1 (1/h)n1 (1/h)
5.97 × 10−50.00336.54 × 10−5
Table 4. Performance degradation model accuracy evaluation.
SSER-SquareRMSE
Durability test 10.00150.99810.0062
Durability test 20.00060.99940.0041
Publisher’s Note: MDPI stays neutral with regard to jurisdictional claims in published maps and institutional affiliations.