Article

Method for Forecasting the Remaining Useful Life of a Furnace Transformer Based on Online Monitoring Data

by
Andrey A. Radionov
1,*,
Ivan V. Liubimov
2,
Igor M. Yachikov
3,
Ildar R. Abdulveleev
4,
Ekaterina A. Khramshina
4 and
Alexander S. Karandaev
4
1
Department of Automation and Control, Moscow Polytechnic University, 107023 Moscow, Russia
2
Department of Electric Drive and Mechatronics, South Ural State University, 454080 Chelyabinsk, Russia
3
Department of Information-Measuring Equipment, South Ural State University, 454080 Chelyabinsk, Russia
4
Power Engineering and Automated Systems Institute, Nosov Magnitogorsk State Technical University, 455000 Magnitogorsk, Russia
*
Author to whom correspondence should be addressed.
Energies 2023, 16(12), 4630; https://doi.org/10.3390/en16124630
Submission received: 16 May 2023 / Revised: 8 June 2023 / Accepted: 9 June 2023 / Published: 10 June 2023

Abstract

:
Implementing the concept of a “smart furnace transformer” should stipulate its information support throughout its life cycle. This requires improving techniques for estimating the transformer’s health and forecasting its remaining useful life (RUL). A brief review of the problem being solved has shown that the known RUL estimation techniques include processing the results of measuring the facility state parameters using various mathematical methods. Data processing techniques (deep learning, SOLA, etc.) are used, but there is no information on their application in online monitoring systems. Herewith, fast (shock) changes in the resource caused by the failures and subsequent recoveries of the facility’s health have not been considered. This reduces the RUL forecasting accuracy for the repairable equipment, including transformers. It is especially relevant to consider the impact of sudden state changes when it comes to furnace transformers due to a cumulative wear effect determined by their frequent connections to the grid (up to 100 times a day). The proposed approach is based on calculating the RUL by analytical dependencies, considering the failures and recoveries of the facility state. For the first time, an engineering RUL forecasting technique has been developed, based on the online diagnostic monitoring data results provided in the form of time series. The equipment’s relative failure tolerance index, calculated with analytical dependencies, has first been used in RUL forecasting. As a generalized indicator, a relative failure tolerance index considering the facility’s state change dynamics has been proposed. The application of the RUL forecasting technique based on the results of dissolved gas analysis of a ladle furnace unit’s transformer is demonstrated. The changes in the transformer state during the operation period from 2014 to 2022 have been studied. The RUL was calculated in the intensive aging interval; the winding dismantling results were demonstrated, which confirmed developing destructive processes in the insulation. The key practical result of the study is reducing accidents and increasing the service life of the arc and ladle furnace transformers. The techno-economic effect aims to ensure process continuity and increase the metallurgical enterprise’s output (we cannot quantify this effect since it depends on the performance of a particular enterprise). It is recommended to use the technique to forecast the RUL of repairable facilities equipped with online monitoring systems.

1. Introduction

According to [1], “in the era of Industry 4.0, complex production equipment is becoming more integrated and smarter, which poses new challenges for data-driven process monitoring and fault diagnosis”. Implementing the IOT model in industry and energy requires developing a method for diagnostic monitoring and preventive maintenance of power transformers based on the telemetry data analysis. Ref. [2] stresses the relevance of the ‘smart transformer’ concept in the paradigm of digital development of industry and energy. Its implementation is urgent for the transformers of arc furnaces and secondary steel processing units (furnace transformers).
The concept of a “smart furnace transformer”, developed by the leader in the manufacture of this class of equipment—TAMINI (Italy) [3]—along with energy saving and the possibility of automated secondary voltage control, provides for implementing online monitoring systems and information support of the unit during its life cycle. Among other tasks, the continuous monitoring and forecasting of the health by a set of diagnostic features based on statistical and physical–statistical models are provided. This concept can be implemented for operating transformers, provided that the following interrelated problems are solved:
-
Implementing the control hardware and software for a set of parameters, reliably determining the technical condition;
-
Improving the online state diagnosing and RUL forecasting techniques.
According to [4], RUL is defined as “the time for the asset’s health state to reach the failure threshold”. In other words, this is the time from the start of monitoring until the moment the facility’s resource is completely exhausted and cannot be recovered. According to [5], “Currently, techniques for defining the failure threshold are widely used, based on the ISO standards such as ISO7919 and ISO8688”. CIGRÉ interprets any equipment failure as a condition “when the withstand strength is exceeded by operational stresses, which requires the asset’s decommissioning” [6].
Electrical equipment has a rated operating life set by standards, specifications, or manufacturer’s documents. It should be decommissioned no earlier than that period. The probability of degradation failures within the planned full life or time between overhauls should be low. A synonym for RUL is the residual resource (hereinafter, the resource) of the equipment. This indicator is defined as the total operating time of the facility, from the moment of monitoring its health to the transition to the limit state [7]. In many cases, it is equated to service life defined as the practical economic life. Thus, the RUL has several similar definitions given in various regulatory documents; therefore, the terms RUL and resource used herein should have the same semantic meaning.
Operating transformers are exposed to the complex impact of strong electrical, electromagnetic, and thermal fields, as well as electrodynamic forces. This causes their aging, and herewith, defects occur that reduce service life. According to [8], “a harsh working environment gradually reduces the RUL and the equipment reliability, leading to severe accidents”. Reliable forecasting of the real service life of transformers, taking into account the developing defects, failures, and recovery of the technical condition, is a complex scientific and practical problem. Along with the prevention of emergencies, it should be solved to implement modern maintenance strategies. Ref. [9] concludes that “the key way to ensure the operational reliability of power equipment is developing modern techniques based on individual monitoring of real changes in the technical condition”.
Developing techniques to estimate and forecast the resource of operating power equipment has been happening for a long time [10,11,12]. Currently, the solution to this problem is acquiring a new direction—forecasting the transformer RUL in online monitoring systems determined by the widespread implementation of such systems. In this regard, the prospect of implementing algorithms for calculating the RUL by a set of continuously measured parameters using multiparameter diagnostics has arisen [13]. The solution to this problem, first of all, allows for assessing the possibility of adapting known techniques to online systems. Such an approach is applied below.
The literature review shows that when estimating a resource using online monitoring data, it is advisable to develop a physical–statistical technique combining the advantages of statistical and deterministic approaches. The technique for calculating the restored equipment failure tolerance by analytical equations has been used to develop it [14,15]. The technique includes statistical processing of online monitoring results provided as time series (trends). The impact of failures on the facility’s health is also considered.
Thus, this study is aimed at developing a technique for forecasting the RUL by online monitoring results. In this technique, the resource is calculated considering the failures and subsequent full or partial recovery of the facility’s state. The literature review shows that, currently, theoretical solutions in studying the state and forecasting of the transformer RUL are significantly ahead of the practice of their implementation. Therefore, the possibility of the practical implementation of the developed method to forecast the operating transformer’s (and other equipment’s) RUL should be provided. In this regard, data processing should not involve complex mathematical methods, special software, and additional training of technical staff.
This publication describes and discusses the results of applying this technique to calculate the RUL of a secondary steel processing (ladle furnace) unit transformer of an arc furnace shop of a metallurgical plant. The problem of testing it is set and solved by processing the online health monitoring data. The calculation is performed by the moisture content and concentrations of gases dissolved in oil (DGA). One of the most important problems is to check the reliability of calculating the transformer RUL according to the proposed technique. However, under normal operating conditions, this would require several years of continuous monitoring since aging is slow. To resolve this problem, estimating the resource during the period of intensive state deterioration has been proposed when the resource decreases rapidly (similar to accelerated aging tests [16,17]).
The paper content is arranged as follows. Section 2 analyzes literature sources, justifies the relevance of improving RUL forecasting techniques, describes online systems for monitoring the furnace transformer’s health, and analyzes degradation models. Section 3 reviews the dependencies of the transformer failure tolerance during its life cycle, stresses the importance of considering failures and recoveries during the RUL forecasting, characterizes the studied transformer state online monitoring systems, and summarizes the requirements for the developed technique. Section 4 provides analytical dependencies for calculating the RUL and a generalized diagnostic indicator, an example of calculating the RUL for the facility’s various technical conditions. Section 5 shows the impact of the repair on the RUL and describes the defects found after dismantling, confirming the development of destructive processes. Section 6 discusses the study results, and Section 7 draws conclusions on the paper’s content.
The key contribution of the paper are as follows:
1. A technique for forecasting the RUL is proposed using the results of online monitoring of the facility’s health by processing diagnostic data provided as time series;
2. For the first time, the relative equipment’s failure tolerance index calculated by analytical equations is justified as an indicator used in the RUL forecasting. As an integrated indicator, the relative failure tolerance index is proposed, considering the dynamics of changes in the facility’s state;
3. For the first time, practical results are provided, obtained in the modes of intensive deterioration and subsequent recovery of the furnace transformer’s health. The reliability of calculating the RUL by the proposed analytical dependencies has been experimentally confirmed. The technique is recommended for forecasting the RUL of restored facilities equipped with online monitoring systems.

2. Literature Review

2.1. The Relevance of Improving the RUL Forecasting Techniques

Previous studies have shown the relevance of developing techniques for defining the transformer resource in the smart energy paradigm [18,19]. Ref. [1] stresses the importance of “real-time data flow monitoring and control for decision making and fault diagnosis” based on a review of fault diagnosis technologies; similar conclusions were drawn in [20,21,22]. Ref. [23] reviews techniques for assessing the performance of transformers in smart distribution networks.
Currently, stationary systems for online monitoring of the parameters of grid and unit transformers are being developed and actively implemented [24,25,26]. Ref. [27] notes that “online monitoring is performed continuously during operation and allows for recording loads that may affect the service life”. Ref. [28] describes the advantages of online monitoring compared to offline testing, including timely information on the transformer state, detecting incipient faults, and forecasting the RUL.
Ref. [29] provides an overview of the evolution of smart algorithms for estimating the transformer state. Papers [23,30,31,32] provide an overview of and consider prospects for the development of real-time RUL estimation techniques. Currently, two basic approaches are used to estimate and forecast the equipment state—based on the health index (HI) and the RUL. It is believed that HI is a standard tool for the comprehensive assessment of insulation aging [33,34] and load [35] and the analysis of the performance, risk, and reliability of transformers [19,36,37]. Ref. [38] discusses the aging index (AI) concept, which is a “practical tool combining the in-situ test results to estimate aging of oil transformers”. The literature describes in detail the techniques for calculating and results of applying the HI and AI indices.
Artificial intelligence methods are used to analyze the health and forecast the RUL of transformers. Based on the analysis of review papers, [39] notes that the RUL forecasting studies are classified according to different categories. Herewith, statistical models [40], machine learning [34], and hybrid [29] and knowledge-based approaches [35] are common. An approach to preventive maintenance of production lines based on machine learning has been considered. The equipment’s RUL was forecasted using artificial neural networks. The processing of large datasets allowed us to reach an important conclusion: “Although deep learning-based models may ensure better performance for forecasting the RUL, the use of this type of algorithm has some limitations. E.g., it requires a lot of data, configuring hyperparameter, and high computation efforts”.
Ref. [41] estimates the techniques for analyzing the equipment health based on a neural network model [42], a fuzzy complex model [43], a combined weight model [44], and a Bayesian network model [45]. It has been concluded that most of the calculations allow for obtaining the failure probability level but do not ensure forecasting the equipment failure. This does not allow for the recommendation of an effective maintenance schedule. In the listed techniques, “the estimate is vague and cannot meet the precise hardware support requirements” [41]. The industrial equipment state has also been assessed based on the combination of the digital twin model and a smart algorithm. A health assessment model was built based on the digital twin model and the neural network algorithm. The technique is implemented by programming in Python, and it has been concluded that it allows “taking advantage of the digital twin model while processing a lot of historical equipment and real-time data and empirical knowledge, as well as taking full advantage of the smart algorithm”.
To assess and forecast the health of assets, promising state-of-the-art SOTA technologies are used. Ref. [41] states that the RUL forecasting problem “can be solved using SOTA techniques such as fuzzy complex estimation, combined weighting model, and Bayesian network model. However, since these techniques are mainly assessed from a qualitative or probability standpoint, the assessment results are relatively fuzzy, which cannot meet the requirements for accurately maintaining the equipment state”.
SOTA techniques have also been studied in other publications. Ref. [46] proposes a “data-driven approach for accurately estimating the remaining useful life of machines using a hybrid deep recurrent neural network. Layers of long and short-term memory and classical neural networks are combined into a deep structure to draw timing information from serial data”. Ref. [47] notes that the forecasting problem can be solved as a classical regression problem based on tabular data using any SOTA technique. Such approaches require data on the equipment operation (process parameters and sensor signals) and time to failure. Refs. [48,49] also consider applied SOTA issues; Ref. [50] provides a fundamental overview of SOTA–ensemble deep learning techniques.
The following shortcomings of the listed approaches regarding their ability to assess the equipment’s health should be noted:
-
The need for processing large amounts of data, including their historical changes;
-
Complexity determined by the use of special mathematical analysis techniques and software;
-
The need for staff training.
These shortcomings limit the practical implementation of the considered approaches under the equipment operating conditions. The listed techniques are mainly of an academic nature, and thereat, they are not intended for processing the online monitoring results. Therefore, this study is aimed at developing an RUL forecasting technique, free of the listed shortcomings.
Herewith, a promising direction in diagnostic monitoring is implementing prognostic health management (PHM) algorithms based on the analysis of trends in continuously measured parameters. Ref. [51] states that “the current trend in maintenance strategies is supporting a prognostic approach to forecasting further asset degradation”. The authors of [52] believe that the RUL is “one of the key criteria for estimating the state and deciding on the transformer decommissioning”. This highlights the benefits of a prognostic maintenance approach.
In general, the analysis showed that the developed technique for forecasting the health of furnace transformers equipped with online monitoring systems should be based on calculating the RUL. Herewith, ref. [38] notes that this field is understudied.

2.2. Online Monitoring of the Furnace Transformer Health

Enhanced health control is relevant to transformers of heavy-duty arc furnaces and ladle furnace units [53,54,55]. This is determined by their operation under harsh conditions caused by a sharply variable asymmetric load due to the electric arc nonlinearity [56]. The furnace transformer windings are exposed to large electrodynamic loads caused by shock current changes associated with the steel smelting technology. This deteriorates the transformer’s electromechanical characteristics [57]. Ref. [58] analyzes the typical faults of this transformer class.
Refs. [59,60,61] provide an overview of known systems for the online monitoring of the furnace transformer’s health. Ref. [60] proposes a test procedure to identify incipient faults and determine the general state of transformers. A model has also been implemented to assess the insulation wear degree, residual resource, and the possibility of reusing a furnace transformer. Ref. [61] develops a technique and considers an example of diagnosing the health of a ladle furnace unit transformer (studied herein) based on the statistical processing of continuously measured partial discharges (PD). Ref. [2] develops a technique for assessing the diagnostic sensitivity of PD parameters to technical condition changes.
Almost all modern systems for the online monitoring of transformers are equipped with DGA systems [21]. The online DGA benefits are analyzed in [62,63], and the analysis and development of techniques for interpreting the DGA result are considered in [28,64,65]. Ref. [66] notes that “online monitoring of dissolved gases and moisture in power transformers provides real-time data allowing for early warning of developing transformer emergencies”. Along with fault diagnostics, this type of control is aimed at forecasting health [19,67,68,69]. Herein, the online DGA results are applied in developing a technique for forecasting the furnace transformer RUL.

2.3. Analysis of Degradation Models

Ref. [70] proposes dividing the equipment destruction processes into “soft-failure processes subject to gradual degradation” and hard-failure ones caused by “random impacts”. The same approach is applied in [71], “many systems may fail due to two competing modes—soft and hard failures”. The explanations that are given are as follows: “Soft failure occurs when the overall degradation, including continuous one, exceeds a certain critical threshold. A hard failure occurs when the magnitude of any impact (extreme impact model) or the cumulative impact damage (cumulative impact model) exceeds some threshold and causes degradation of performance”.
Taking into account cumulative impact is especially relevant for furnace transformers. This is due to the frequent switching of vacuum switches installed in the primary circuit. They occur up to 100 times a day. Additionally, the on-load tap changer (OLTC) is switched up to 1000 times a day, which is not typical of grid transformers. Obviously, dynamic loads lead to the wear of the winding insulation and premature equipment failures. Given that transformers are recoverable equipment, the developed RUL calculation technique should consider the impact of failures and subsequent recoveries. To simulate a soft failure based on the online monitoring results, it is advisable to present data in the form of time series described by regression equations. When simulating hard processes, it is assumed that the failures and recoveries of the state occur instantly, which is confirmed by the used “shock” term.
To forecast the RUL, degradation was simulated in [70,72,73]. The slow degradation of various equipment and individual components has been studied in the following publications: ref. [74] explores the slow degradation of microelectromechanical systems; the research in ref. [75] regards the forecast and control of the health of aircraft engines; ref. [76] is about aircraft cooling devices; ref. [77] describes the degradation of rotation bearings. Papers [78,79] consider the degradation and recovery of the useful life of lithium-ion batteries during long idle periods. Ref. [80] studies the aging of MV power connectors in power lines. Herewith, literary sources provide no studies on the soft degradation of power transformers.
Short circuits are typical hard shocks leading to power equipment failures. Furnace transformers are also characterized by an open-phase mode, the aforementioned switching, and defects in HV bushings. The maintenance and repairs of the resource recovery through, as a rule, should also be considered and simulated. Ref. [79] draws a similar conclusion while discussing the technique of forecasting the RUL by simulating degradation and recovery. It is noted that “most of the existing degradation models fail to consider the impact of the recovery phenomenon in the course of degradation”.
Conclusions from the literature review:
  • The literary sources fail to provide any technique for calculating the transformer RUL by the online monitoring results, considering failures and subsequent recovery; however, they describe the developments for other assets;
  • Known equipment health analysis techniques, including SOTA, are not used to forecast the RUL based on the online monitoring results. Their practical implementation is limited since they require special software and staff training. Therefore, a technique that is free of these shortcomings and calculates the RUL should be developed;
  • The developed technique should be based on a statistical analysis of the diagnostic parameters that identify the degradation of insulation. The online DGA results are the most informative indicators of such processes;
  • The literature review has shown that when estimating the RUL of furnace transformers, hard failures and cumulative shocks caused by dynamic overloads should be considered. Such overloads are associated with the arc metal melting technology specifics and transient processes during the transformer switches occurring up to 100 times per working day. These conditions set specific requirements for the RUL forecasting technique being created, which are discussed in the next section.

3. Problem Statement

3.1. Dependencies of Transformer Failure Tolerance on the Operating Time

Figure 1 shows the time dependencies of the transformer failure tolerance for normal operation, built by the authors, based on [81,82]. The figure below shows the life cycle of a transformer capable of withstanding intermittent system failures when “the load gradually increases, and the failure tolerance decreases due to normal aging. As soon as the insulation fails to withstand high operating loads, the transformer becomes unserviceable” [82].
When the facility is first put into operation, failure tolerance (FT0) corresponds to design withstand strength, which should ideally be maintained throughout the entire life cycle. High withstand strength in the initial period allows the transformer to withstand stressful situations, such as short circuits or overvoltage, without significant damage. Such processes are shown as short-term increases (impulses) of loads on the actual stress curve at time instants t1, t2, t4. Considering the increase in actual stress, the FT1 and FT2 pulse amplitudes are significantly below the levels limited by the actual withstand curve. The stress reduction in withstand strength at the specified time instants are shown on this curve as downward steps. Given the increase in actual stress and the decrease in actual withstand, the facility reaches normal life expectancy (time instant t5), after which it should be decommissioned. The intersection point of actual withstand and actual stress curves indicates lifetime t6, considering the recovery of the resource (extended life), and the expected RUL, considering failures and recoveries. The figure above shows the definition of the RUL counted from monitoring time instants t1 and t2 (RUL at t1 и RUL at t2). The actual withstand curve crossing point defines the end-of-life (EOL) time when the facility cannot be recovered. Obviously, these dependencies not only characterize the life cycle of the transformer but are applicable to other restored facilities.
For grid transformers, the rated service life is 40 years, but the cases of both premature failure and a significant excess of the period specified are frequent. It should be noted that for furnace transformers, according to the manufacturers’ requirements, this period is 30 years due to harsh operating conditions [83]. At the normal operating stage, failures occur regardless of the transformer age (time instants t1, t2), and the danger degree is low. The actual withstand dependency shows that as the facility ages, the risk of failure increases. This explains the case of premature failure at the time instant t4 when the transformer cannot withstand the momentary overvoltage due to the insulation aging. The FT3 stress pulse amplitude exceeds the failure tolerance (dashed curve), although in the initial period of operation, such overloads (FT1) have only caused a partial decrease in failure tolerance. However, at the time instant t3, the withstand strength increases due to its partial recovery. As a rule, this is ensured through maintenance or repair. As a result, the stress impulse does not reach the failure tolerance and, accordingly, failure does not occur.
Of course, such processes should be considered in the RUL calculations for not only transformers but also other critical equipment.
According to the discussions, equipment failure tolerance means the facility’s ability to uninterruptedly operate under normal conditions, regardless of the aging degree, at external impacts without causing accidents. Such meaning is formulated for the first time; similar well-known definitions condition the “system’s ability to operate uninterruptedly despite the failure of one or more of its components”. Evidently, such a definition is not correct for structurally integral facilities. For a transformer, the failure of any component (winding, HV bushings, OLTC, etc.) inevitably leads to the failure of the entire unit. However, since this equipment is restorable, its service life can be restored through repair.
The figure above gives a general idea of the transformer’s life cycle. Under real conditions, the shape and length of the actual withstand curve are affected by many factors, the study of which is not covered hereby. Herewith, the analysis performed confirms the relevance of the goal set: forecasting the transformer’s RUL, considering failures and recoveries. For furnace transformers, the impact of transients is more significant than insulation aging. Therefore, considering the impact of failures and recoveries on the RUL is of great importance for them.

3.2. Specifics of the System for Online Monitoring of the Furnace Transformer Health

As noted above, this study has been performed using the example of a ladle furnace unit transformer of an arc furnace shop of a metallurgical plant.
The ETTsNKV-40,000/110 Transformer Parameters [2,61] are:
-
Rated Capacity: 26,000–20,282 kVA;
-
Rated Coil Voltage: 110,000 HV; 421–289.5 LV V;
-
Diagram and Group of Coil Connection: Y/Δ-11;
-
Number of OLTC Positions: 9;
-
Cooling System: Suspended “OFWF”;
-
Mass, 80 Tons;
-
Length × Width × Height: 4840 × 3540 × 6200 mm.
The modular TDMS (transformer diagnostics monitor special) diagnostic system performed the health monitoring. The system specifications, purpose, and functionality are considered in [58,84].
The basic diagnostic control types are:
-
DGA, moisture content control;
-
Monitoring of partial discharges;
-
Oil temperature control;
-
Vibration control;
-
Health monitoring of HV bushings, cooling systems, OLTC.
As noted above, the severity of faults occurring in the windings, core, and other modules is most effectively determined by the content of combustible gases (CO, H2, C2H2, C2H4, C2H6, CH2) in the oil and their generation rate. A high concentration of gases is not a danger, but diagnoses destructive processes in insulation [85]:
-
High concentrations of hydrogen (H2) and acetylene (C2H2) may indicate high current arcing;
-
Hydrogen and lower hydrocarbons diagnose discharge phenomena;
-
Significant content of methane (CH4) and ethane (C2H6) indicate local overheating or hot spots;
-
Emissions of carbon monoxide (CO) and carbon dioxide (CO2) occur when the paper insulation is overheated due to prolonged overload, heat transfer disturbance, or cooling system malfunction.
Excess moisture (H2O) in the oil causes a sharp drop in its electric strength, causing the performance to deteriorate and increasing the likelihood of transformer failure.
DGA monitoring is performed using a Kelman Minitrans device [51]. Figure 2a,b show, respectively, the general view and design of the device mounted in the arc furnace shop, and Table 1 provides its specifications. The device is operated in accordance with the principle of photoacoustic spectroscopy, and measures hydrogen, acetylene, carbon monoxide, and moisture contents in oil. These diagnostic types are most important for estimating the transformer’s health, and allow for identifying faults early.
There is a possibility for automatic sampling, according to a given schedule, from 1 time per hour to 1 time per day. The TDMS system’s important feature is its ability to automatically change its polling frequency (rate) depending on the measured parameter growth rate (the higher this rate, the higher the measured parameter reading frequency). This system option is useful but causes certain difficulties when calculating the RUL by coordinates measured with different rates, which is discussed in Section 5.1.
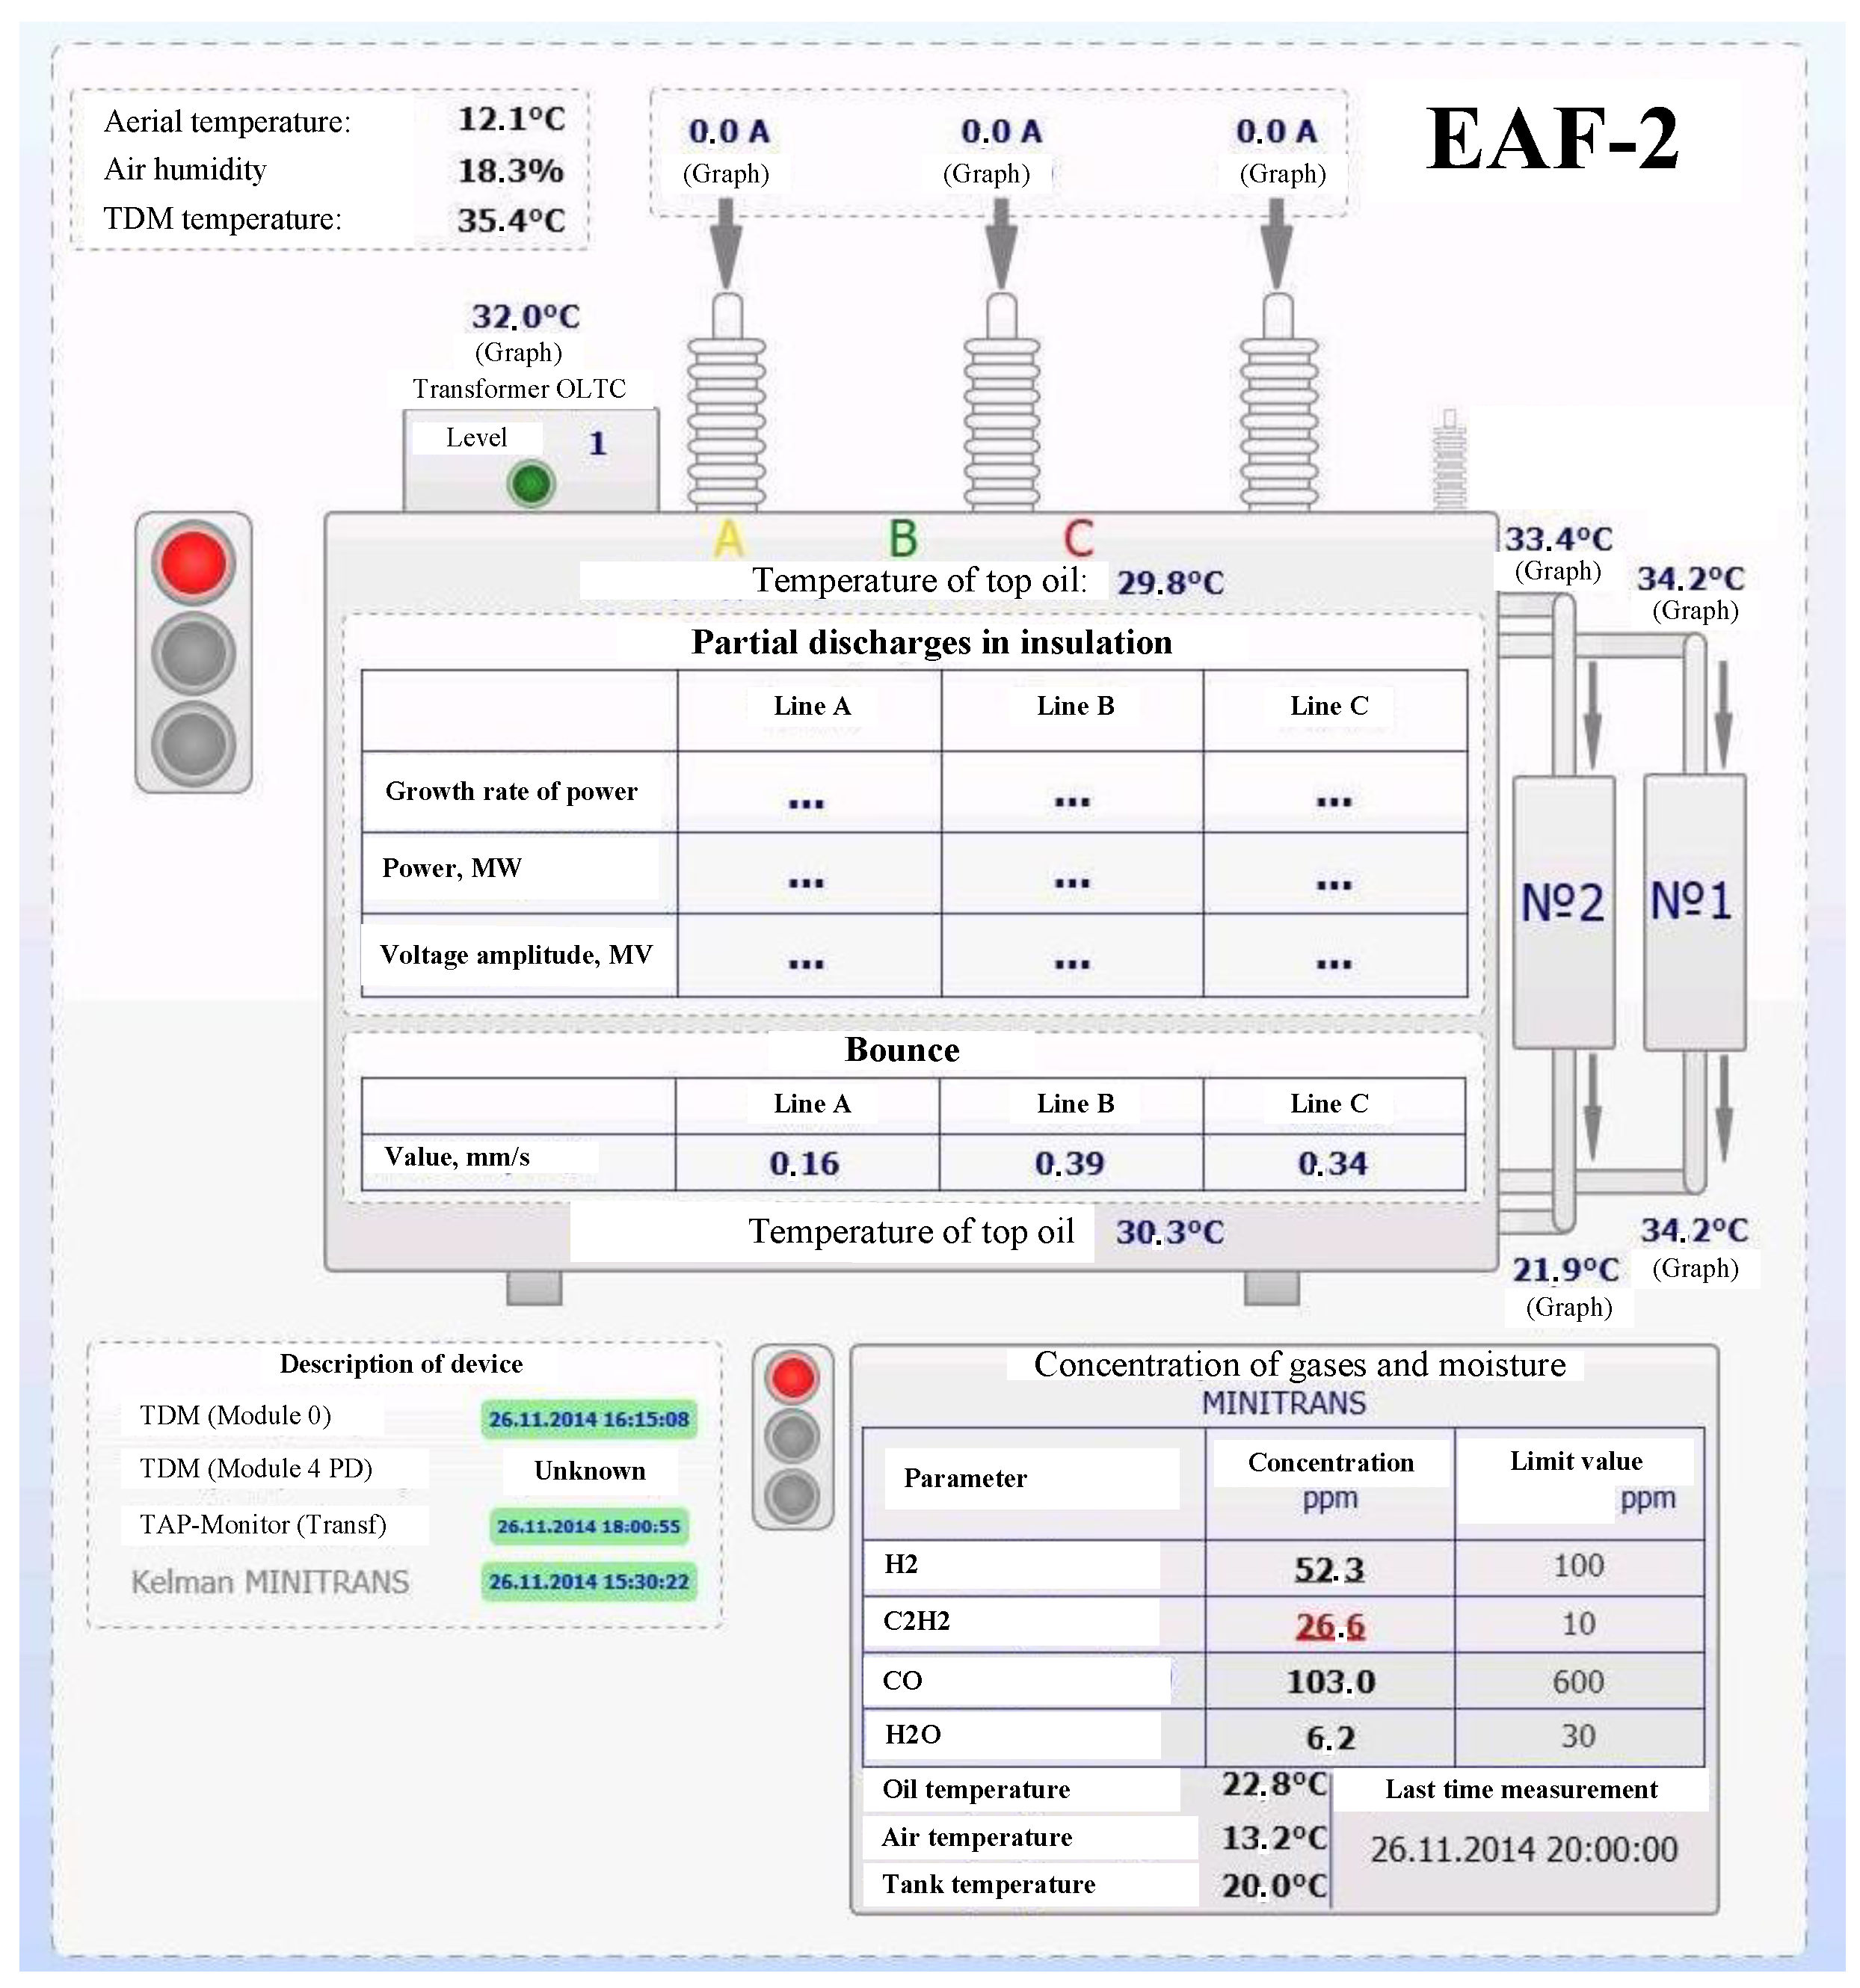
Figure 3 shows the main window of the system software interface. The data on the screen were recorded after their commissioning in 2014. The “Concentration of Gases and Moisture” Table provides averaged DGA results, as well as the limit values of these parameters and the oil, air, and tank temperatures. Note that at the fixed time instant, the acetylene concentration is 26.6 ppm, which is more than 2.5 times higher than the limit value (10 ppm). As a result, a red light alarm was generated, prohibiting the transformer’s operation. Along with averaged data, the measurement results can be displayed in the form of points and trends of controlled parameters.
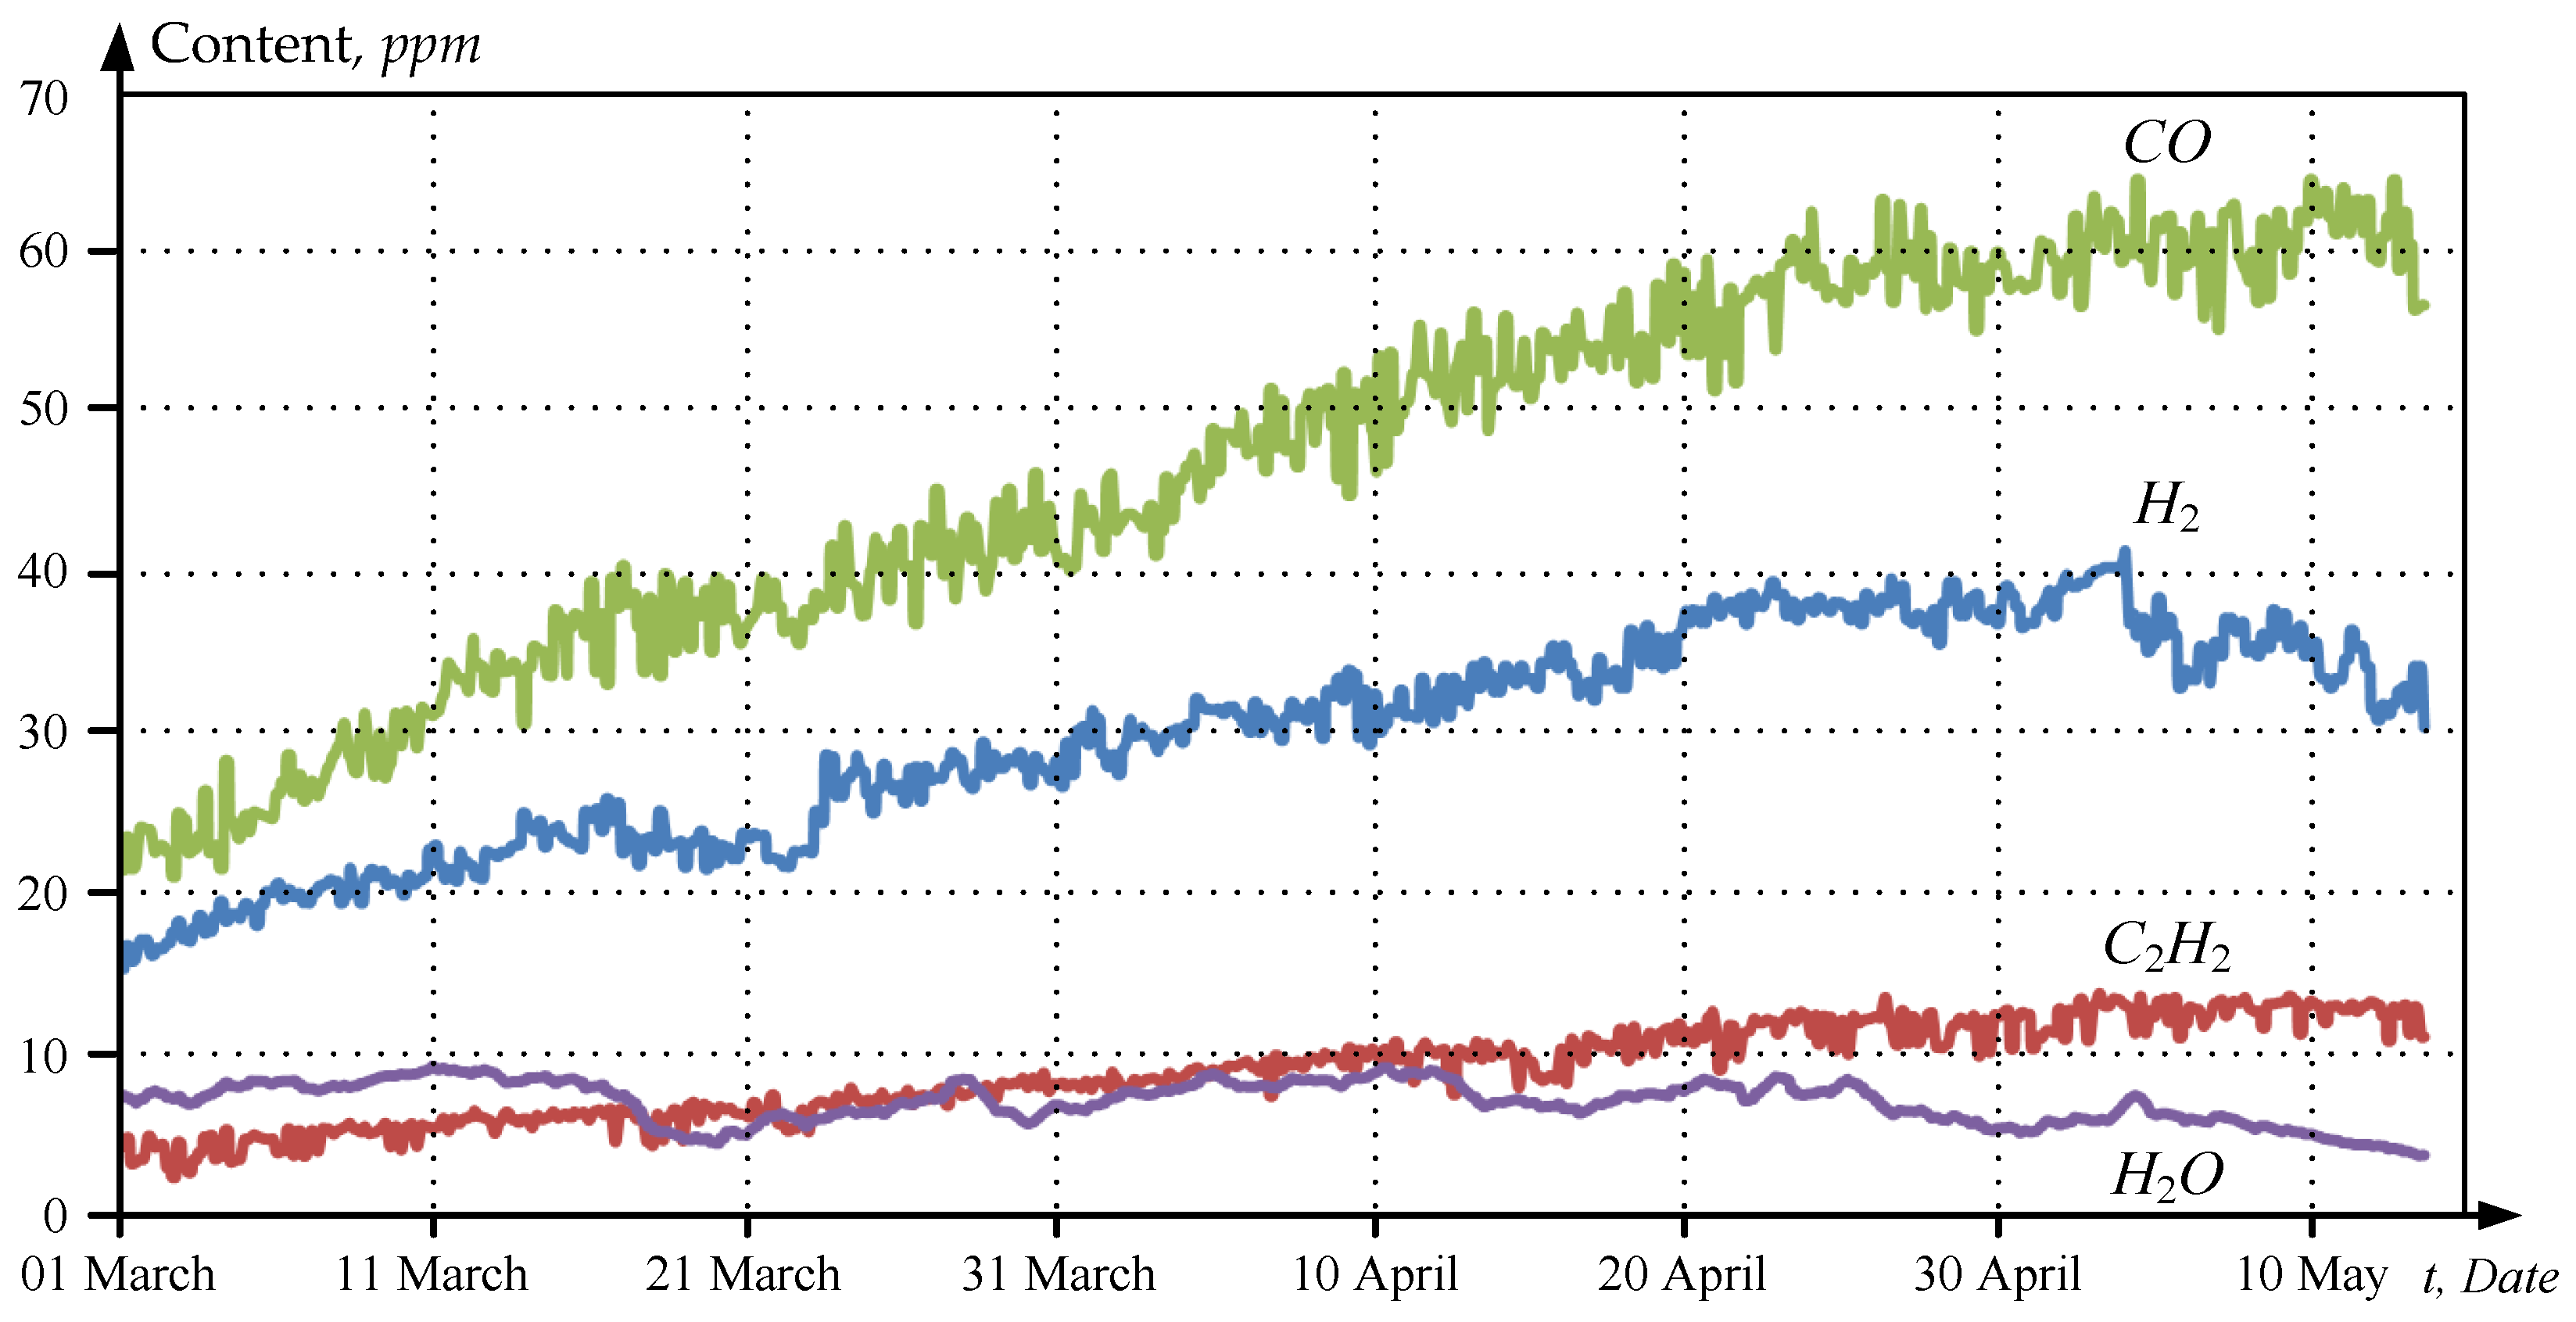
Figure 4 shows the results of monitoring the moisture content and the concentrations of the three gases dissolved in oil, obtained in March–May 2015. The parameters were recorded with a variable time interval of 2 h; the number of points for each gas is N = 825. They demonstrate a monotonous increase in gas concentrations, which indicates destructive processes developing in solid insulation; the DGA results are analyzed in Section 4.2.

3.3. Requirements for the Technique Developed

According to the goal formulated in Section 1, the developed technique should perform two interrelated functions:
-
Forecasting the RUL, considering gradual degradation and wear;
-
Simulating hard impacts—resource changes due to failures and recoveries of the state.
The requirements are as follows:
  • It is advisable to develop the technique using the example of the online DGA results for a furnace transformer, but it should be applicable to other facilities and diagnostic parameters presented in the trend form. Thus, the methodology should be universal;
  • The parameter samples should be uniform, smoothed, and include a net of sharp changes not related to failures and resource recovery;
  • Processing should be based on known statistical methods; the software used should be available. This requirement is important since the technique is intended for use by the operational services of power facilities and industrial enterprises;
  • Sudden state changes should be considered:
    -
    A result of failure, i.e., deterioration of the state, accompanied by a rapid decrease in the resource;
    -
    After repair, as a result of which the state is completely or partially recovered and the resource increases;
  • The health criterion generalized for the total of diagnostic features should be justified. As shown below, it is advisable that such an indicator takes the equipment’s integral failure tolerance index, calculated by the defect development dynamics.
Note: Equipment failure tolerance should not be confused with hardware failure tolerance defined as “the ability of a component or subsystem to perform the required function at one or more dangerous hardware failures” [86].
As recommended in the introduction, the RUL was forecasted for the periods of intense fault development, when the deterioration from normal condition to pre-failure occurred over several months. During the monitoring period since 2014, such situations have occurred twice: in 2015–2016 and 2019–2020. Therefore, to test the technique, data related to these time intervals were taken and analyzed in Section 4.2 and Section 5, respectively. The data stored in the TDMS system database are being processed. This improves reliability due to their ability to analyze further changes in the facility’s health and estimate the maintenance efficiency and the RUL forecast adequacy.

4. Materials and Methods

The technique is illustrated by the RUL calculation examples during time intervals corresponding to the normal and degraded furnace transformer states. Failure tolerance has first been used to forecast the RUL.

4.1. Analytical Dependencies for the RUL Calculation

The concept of equipment failure tolerance is given in [14], with reference to GOST 26883-86, providing for its operability within the service life. In other words, this is the facility’s ability to keep the specified parameters within tolerances and perform its functions under external loads. If the equipment aging regularity and the impact of operational factors are known, its service life can be defined analytically. With continuous monitoring, it can be estimated at any time using a set of diagnostic parameters. When a facility is put into operation, the failure tolerance is taken as being equal to 1, and when the resource is exhausted, it is equal to 0. During the operation period, this parameter is determined by the quantitative indicator 0 < Sf < 1 (the f index corresponds to the ‘failure’ term). When a defect is identified, it characterizes the deterioration of the facility properties and allows for forecasting the failure time.
When calculating the Sf value, the law of facility aging under external impacts causing failures should be known. According to the proposed technique, the relative failure tolerance as a time function is estimated using the following equation:
S f ( t ) = S f 0 ( 1 ( t t E O L ) a ) ,
where Sf0 is failure tolerance in the initial state; tEOL is the time to reach EOL, defined as a statistical lifetime taken from similar equipment operation data; a is a coefficient.
The current Sf(t) value can be represented as the ratio of the failure tolerance at the time instant t to that at the initial time instant. According to the accepted conditions, Sf(0) = 1, Sf(tEOL) = 0. The EOL reached indicates the need for a replacement since the facility’s parameters exceed the permissible limits. The a indicator in Equation (1) determines the Sf(t) function change rate. When a > 1, aging proceeds slowly in the initial period and accelerates closer to the end of the rated service life. For a < 0.5, the ratio is reversed. The HV equipment operating practice shows that with acceptable accuracy, the lifetime is described by the a indicator within 1.3–1.6 [14,15]. With an accuracy sufficient for the estimate, it is recommended to take a = 1.5.
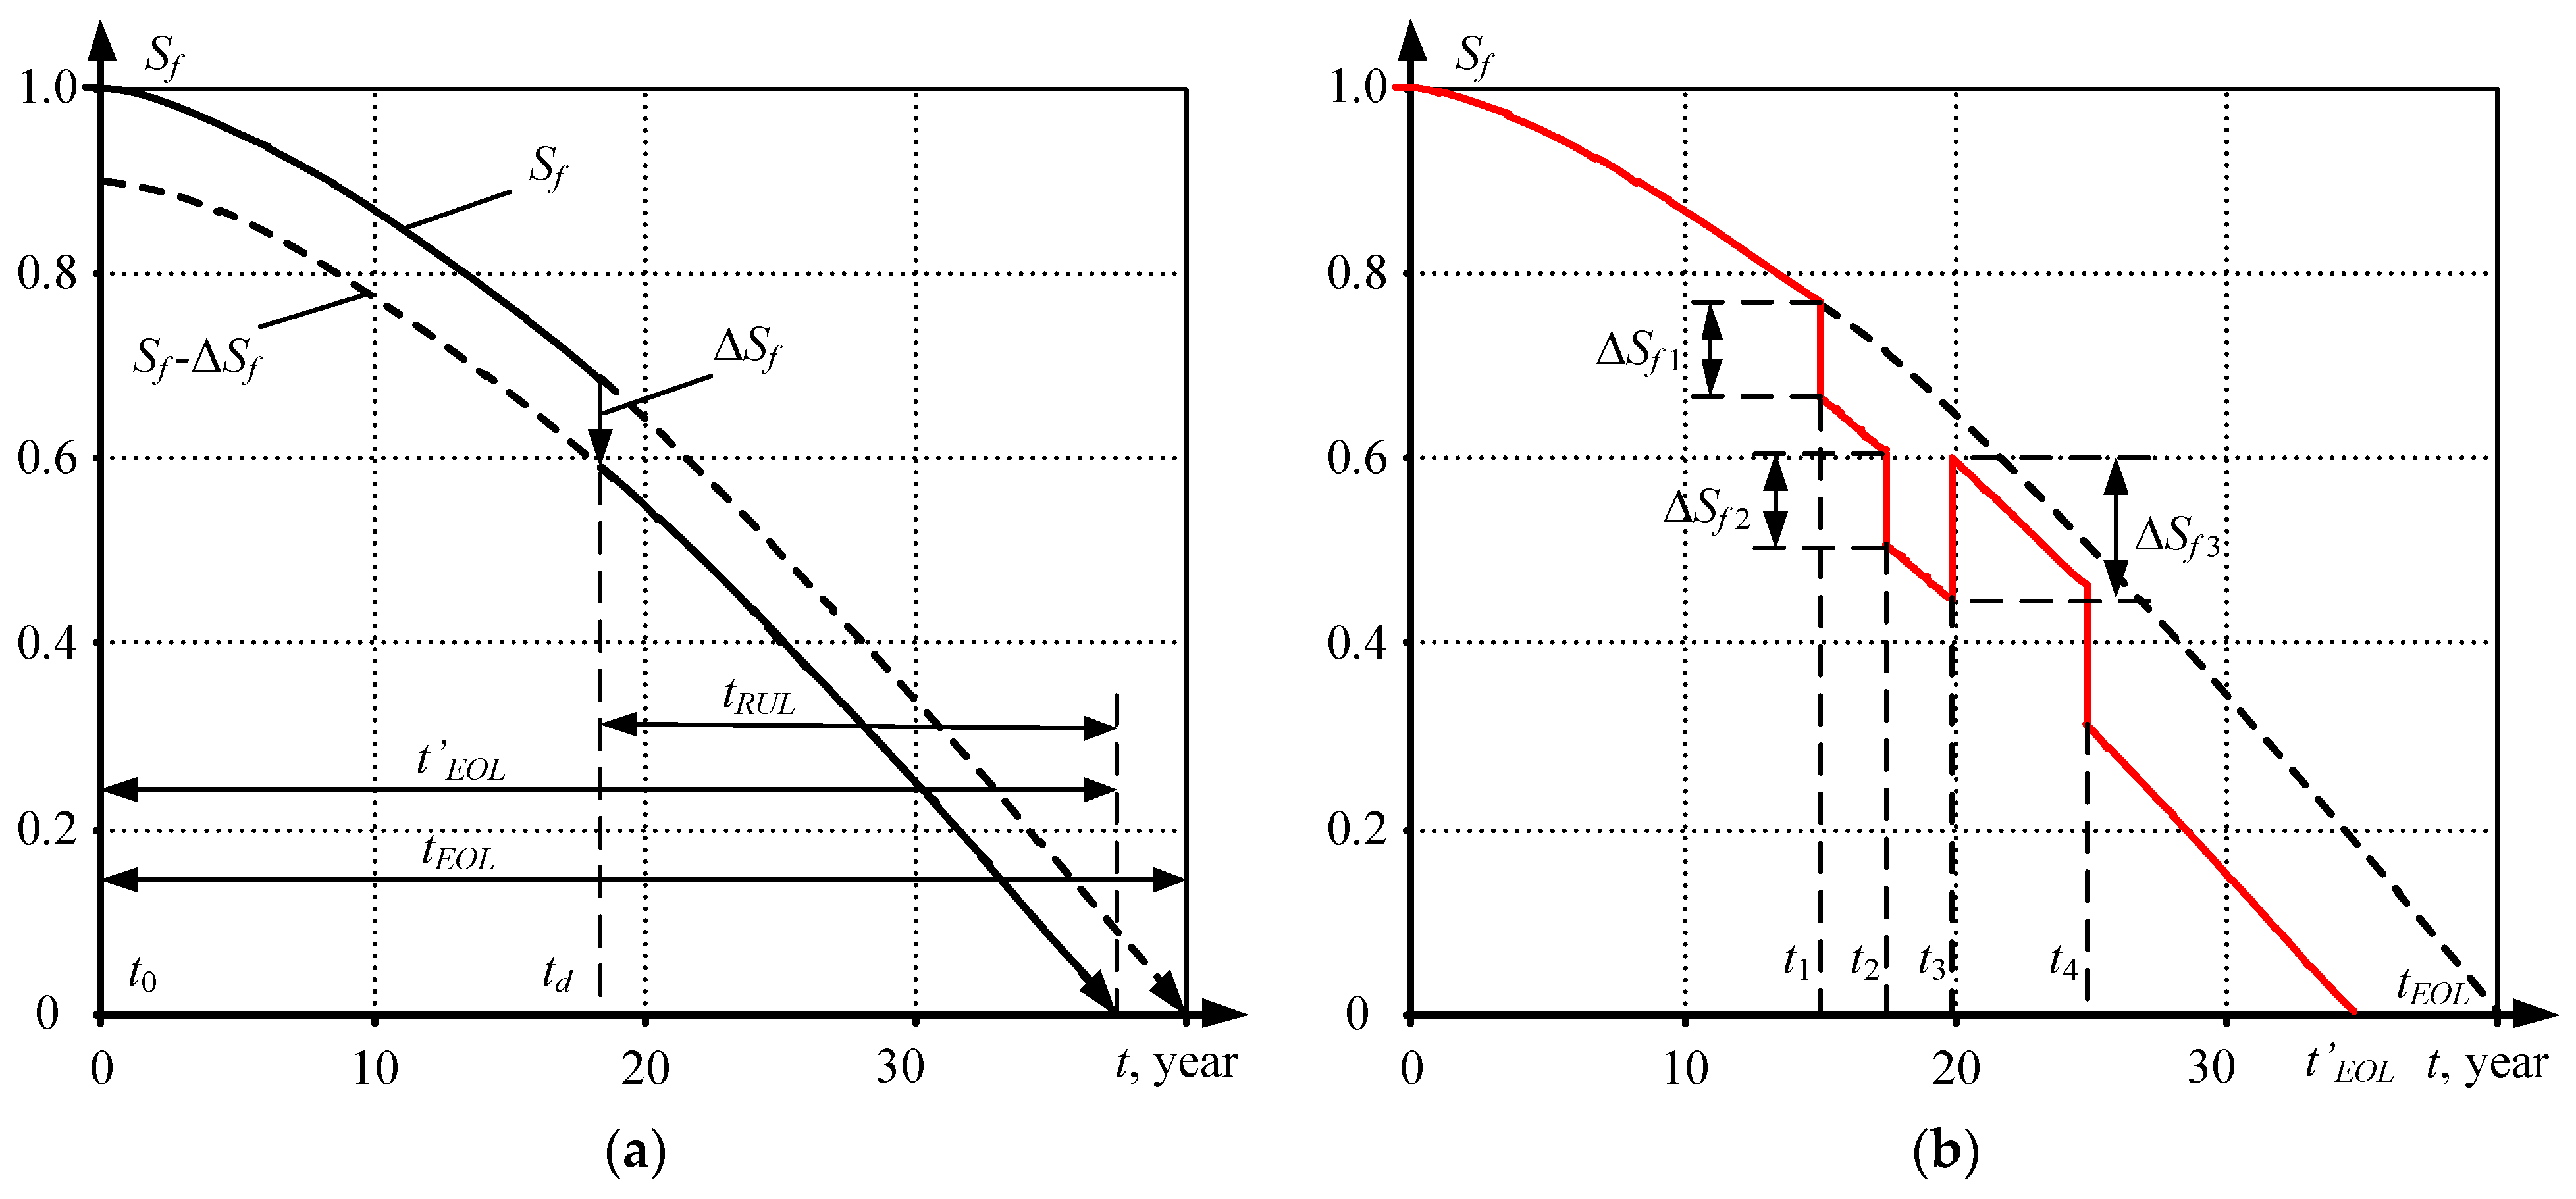
Figure 5a gives a graphical explanation for the resource definition; tRUL is defined as the time interval from a fixed time instant, taken as the reference point, to the t’EOL time instant, considering failures and recoveries [80]. Conventionally, a stepwise decrease in Sf by ΔSf = 0.1 at the td time instant is shown; the same instant is taken as the RUL reference point. After the occurrence of a defect (or failure) at the td time instant, the EOL time decreases (t’EOL < tEOL); accordingly, the failure tolerance and the expected RUL are reduced. The admissibility of the assumption on a shock change in the facility state during failures/recovery is shown in Section 3.1.
In the developed technique, the relative failure tolerance is calculated using the following equation:
S f ( t ) = S f 0 ( 1 ( t t E O L ) a ) Δ S f .
It is assumed that a defect occurring at the td time instant reduces it by ΔSf. The time to reach EOL after the defect occurrence is determined by the following equation
t E O L = t E O L ( 1 Δ S f ) 1 / a ,
accordingly, the useful life from the td defect occurrence instant is
t R U L = t E O L t d .
When taking the monitoring start time t0 as the RUL reference point, then
t R U L = t E O L .
The plot in Figure 5b explains the tRUL definition principle with a constant facility aging pattern, considering several failures and recoveries. It is similar to Figure 1 and represents the dependence Sf(t) when defects occur at the time instants t1, t2, t4, and some defects are eliminated at the t3 time instant [14]. The defect occurrence at the t1 time instant reduces the failure tolerance Sf by ΔSf1; a similar process occurs at the t2 time instant. Partial resource recovery at the t3 time instant increases the tolerance, and the subsequent defect occurrence at the t4 time instant reduces it. As in the previous case, t′EOL < tEOL. Figure 5b shows that the ΔSf value is defined as the algebraic sum of the ΔSfi values from each impact. Considering this, Equation (3) takes the following form:
t E O L = t E O L ( 1 i = 1 k Δ S f i ) 1 / a ,
where k is the number of identified or eliminated defects (impacts).
When eliminating the i-th defect, the corresponding ΔSfi value in the sum is taken with a minus sign (in Figure 5b, this is an ΔSf3 increment). Complete defect elimination at the td time instant (Figure 5a) will increase the tolerance by ΔSf while
t R U L = t E O L t d .
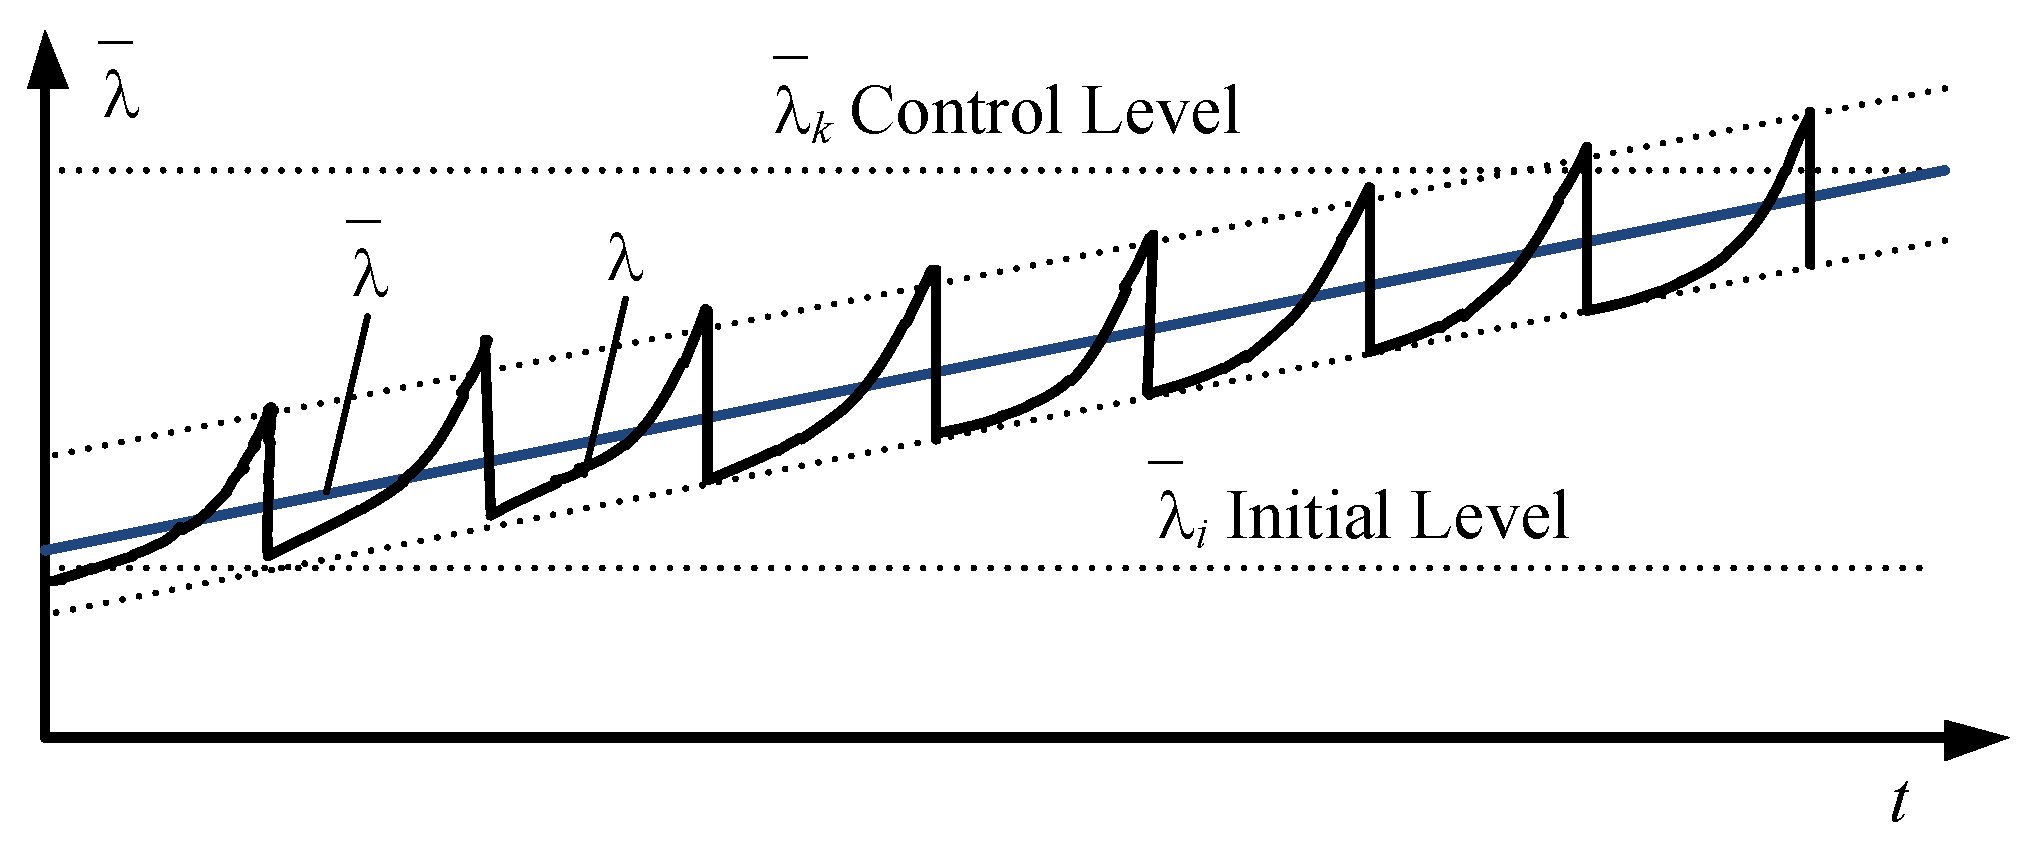
The rapid elimination of the failure consequences provides a theoretical opportunity for saving the resource while t’EOLtEOL; however, even at the initial operation stages, the resource decreases due to aging. This leads to an incomplete restoration of serviceability, which is explained by the time dependence of the failure rate λ(t) in Figure 6 [24].
Figure 5b shows the time tRUL from the start of operation (t = 0), but according to the definition, it can be counted from any other moment conventionally taken as the start of monitoring (see Figure 1). Such a detailed explanation is given herein since in many sources, the RUL is counted only from the moment of commissioning, i.e., it is identified with EOL, which is not rightful.
The most difficult aspect is the fact that in order to define t’EOL and tRUL, ΔSfi should be known for each measured parameter at given thresholds. It is proposed that these indicators are defined as a power function
Δ S f i = 0 ,   1 ( Y i Y i D ) q ,
where Yi and YiD are the current and threshold values of the i-th informative parameter; q is an indicator defined by the type of physical process in the controlled facility.
The authors of [14,15,81,82] replace the failure tolerance plot with a power function and explain it by the actual withstand plot seen in Figure 1. Table 2 provides the q values for calculating ΔSfi of oil-filled equipment by three diagnostic parameters [14]. Below is an example of calculating the resource of the transformer under study.

4.2. Example of Calculating the Furnace Transformer RUL

For the convenience of analysis and mathematical processing, the trends of diagnostic parameters were smoothed using the moving average method [87]. This method is based on the analysis of a time interval covering n diagnostic parameter values and their replacement by the averages of groups consisting of m < n values (m is an odd figure, m = 3, 5, 7 …). The average Y ¯ a is in the center of the interval and is calculated by the following formula:
Y ¯ a = j = t p t + p Y j m ,
where p = (m − 1)/2 is the number of points to the left and right of the midpoint a, included in the calculation, while the duration of the intervals is assumed to be the same; j is the order number of the point in the interval.
Figure 7 shows the smoothed trends of gas concentrations and moisture content for time intervals corresponding to two cases:
-
A deteriorated transformer state accompanied by an intensive increase in gas concentrations (Figure 7a);
-
A normal state after recovery, leading to a multifold decrease in gas concentrations, however, not preventing their further growth (Figure 7b).
Smoothing was performed using the data preprocessing software [88]. The recovery included scheduled maintenance, degassing, and partial oil replacement.
For the transformer under study, the rated resource, tEOL = 30 years, and the service life as of the time of diagnostics, t = 10 years (installed in 2005), are known. The degraded state Y i D 1 and pre-emergency Y i D 2 thresholds, specified in Table 3, were taken as rated values for each parameter in Formula (6) [53].
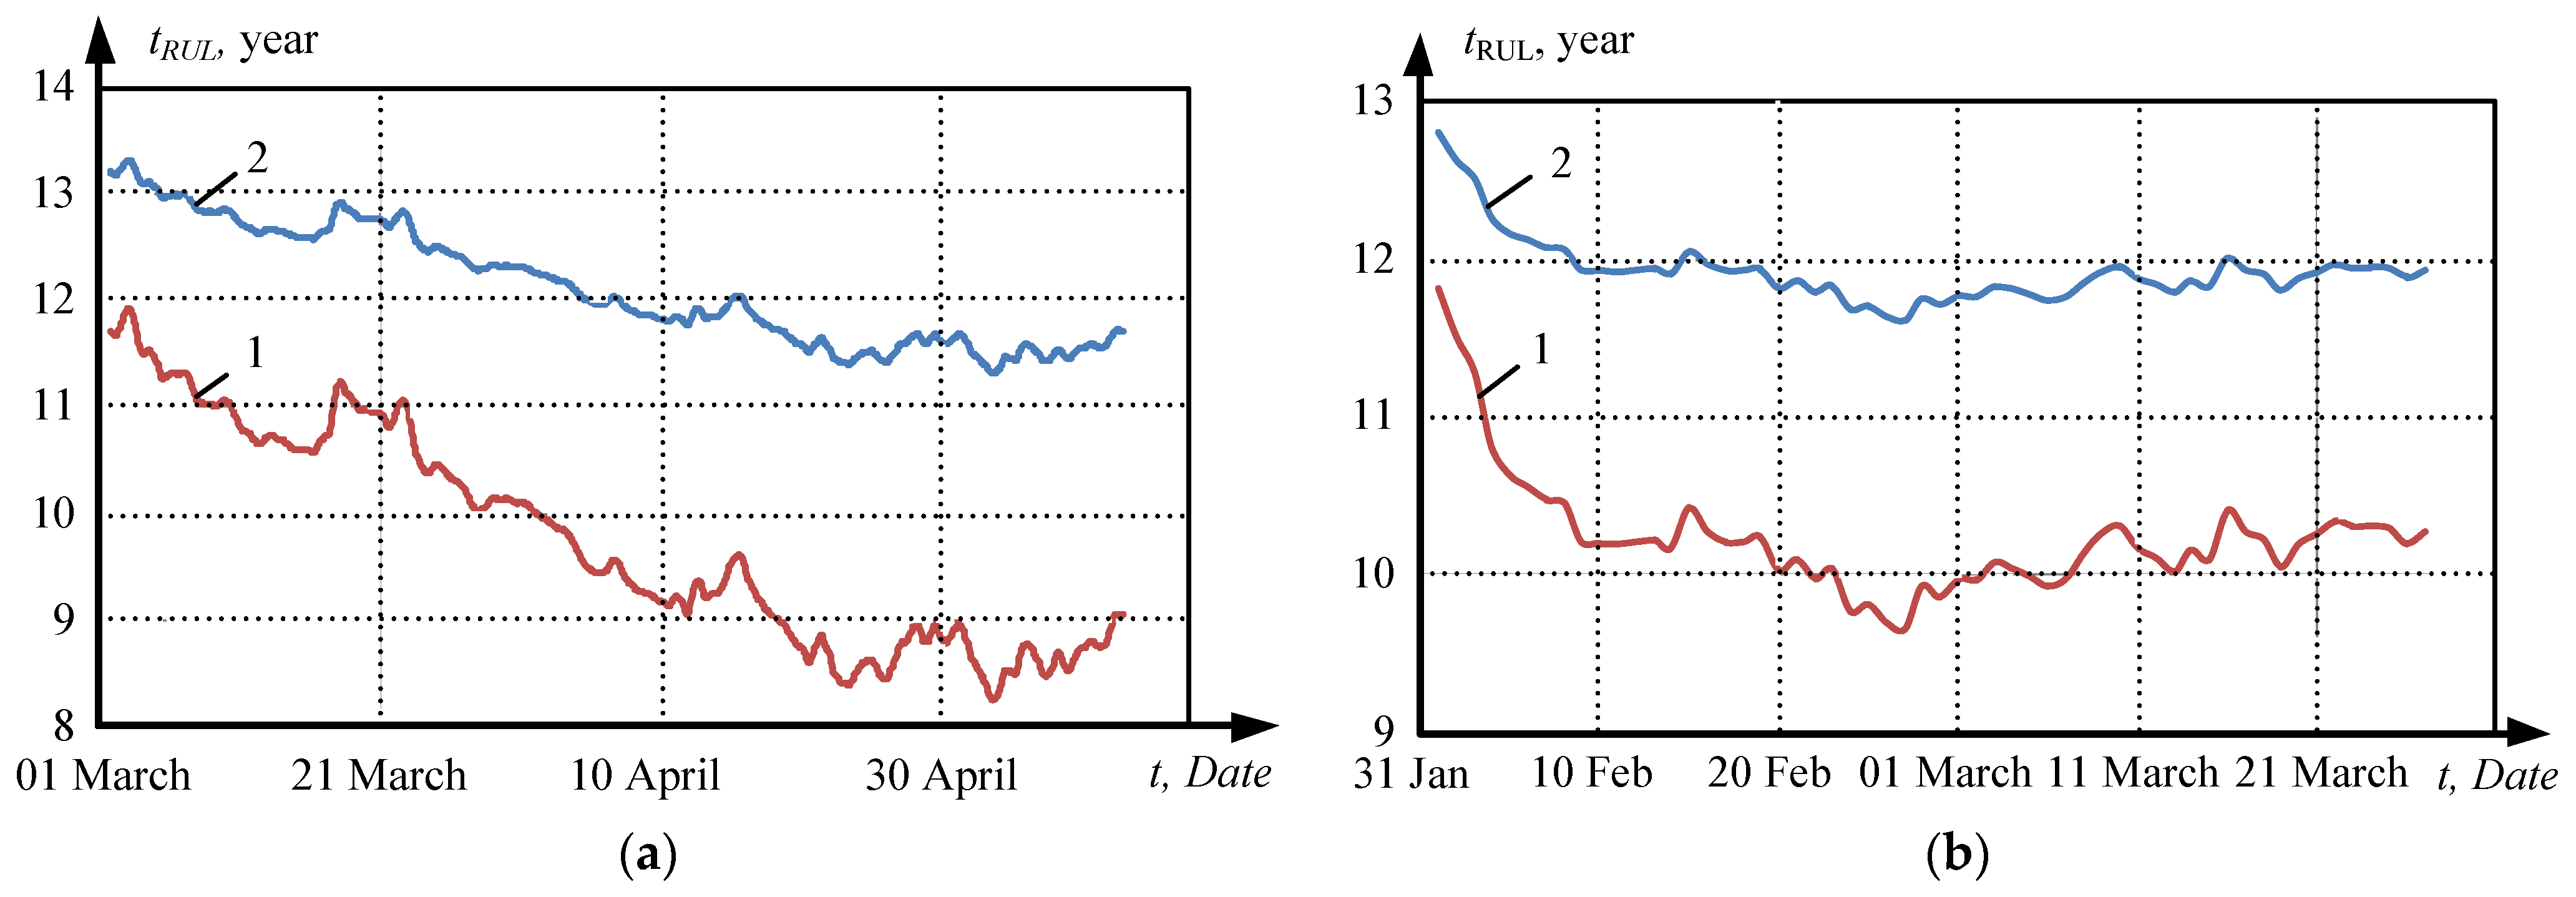
Figure 8 shows the plots of changes in the transformer resource for the studied intervals, calculated according to the considered technique. It can be seen that the RUL in Figure 8a decreases significantly faster compared to the facility operation period. After the transformer operation for a little more than two months, the resource decreased by 4 and 2 years by the degraded state and pre-emergency thresholds, respectively. After the maintenance, the RUL almost completely recovered as of 31 January 2016; the values in Figure 8b correspond to those as of 1 March 2015 (Figure 8a). Further, within the monitored interval in Figure 8b, the RUL makes up 10 and 12 years, which, in sum with the operation period (10 years), do not correspond to the rate of 30 years.
By the end of monitoring, the resource by the pre-emergency threshold before recovery (Dependence 1 in Figure 8a) was 9 years. At the start of monitoring, the resource after recovery (Dependence 1 in Figure 8b) increased to 12 years. A similar change in the resource by the degraded state criterion (Dependency 2 in the same figure) was 1 year (from 11.8 to 12.8 years). Based on these observations, the following conclusions can be drawn:
  • The assumption of a shock change in the resource after repair (and in case of failure) is rightful;
  • After the taken measures, the transformer resource was not fully recovered, i.e., the defect causes were only partially eliminated. This is confirmed by the increase in the concentrations of gases, as seen in Figure 7b;
  • After the resource recovery, the RUL trends calculated according to both boundary criteria (Dependencies 1 and 2 in Figure 8b) are in quasi-steady states.
The analysis confirms the efficiency of the recovery and the RUL forecasting reliability. Herewith, the conclusion on the health recovery is not unambiguous since the interval after the repair is too short (Figure 8b). Further monitoring showed that due to these measures, the transformer operated in normal mode for more than 3 years. As shown in Section 5.1, in May 2019, the transformer state began to deteriorate due to developing defects, and by the end of December, it approached an emergency state. This case is analyzed in Section 5.

4.3. Defining Relative Failure Tolerance

According to the DGA theory, along with the absolute values of the concentrations of gases dissolved in oil, the defect danger degree depends on the concentration growth rate [89,90]. Thus, the author of [89] argues that the corresponding diagnosed defect is considered as fast developing when the relative gas(es)’ concentration(s)’ growth rate(s) exceed(s) 10% per month. The regulatory document [85] classifies defect development rates based on DGA results. In this regard, it is advisable to define a dimensionless indicator: the facility’s relative failure tolerance, not related to time intervals involved in the RUL calculation. The dynamic relative tolerance factor Kd is proposed as such a criterion, characterizing the following ΔSf parameter growth rate:
K d = Δ S f l / Δ t l Δ S f 1 / Δ t 1 ,
where ΔSf1, ΔSfl are the failure tolerance changes recorded in the first Δt1 and last Δtl diagnostic intervals.
Table 4 provides the Kd values determining the developing defect danger degree [14]. In essence, this indicator characterizes the facility’s robustness to external impacts. Therefore, it is proposed to use the concept of “index of the facility’s robustness to the failure tolerance changes” as a synonym for the definition of “the facility’s dynamic relative tolerance factor”. The lower its value, the higher the facility’s stability, so Kd tending to zero is desirable after the state is recovered. When diagnosing several (k) defects, this parameter should be calculated as the algebraic sum of the failure tolerance values for each defect
K d = i = 1 k Δ S f i   l / Δ t l i = 1 k Δ S f i 1 / Δ t 1 .
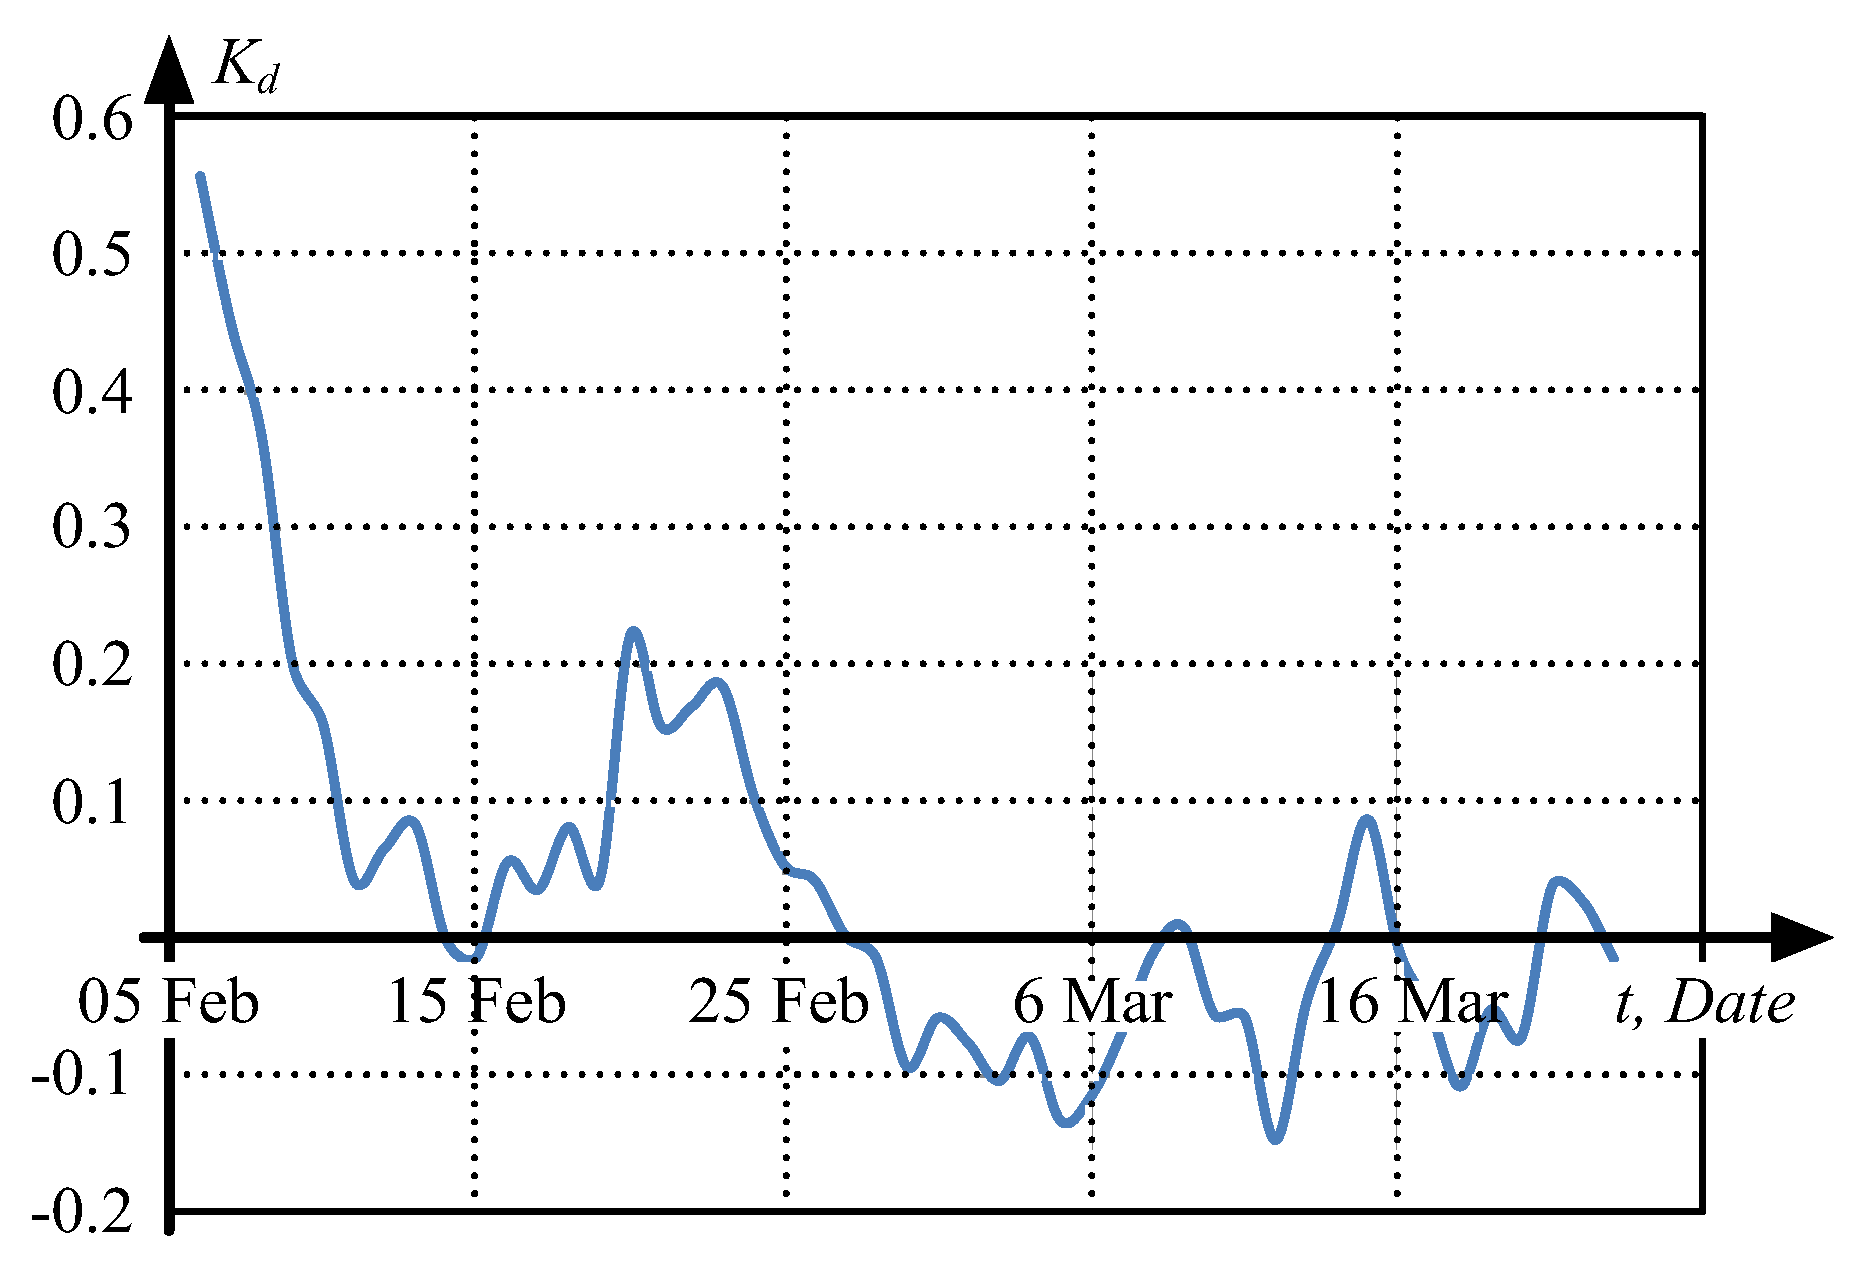
Figure 9 shows a Kd change plot for the transformer under study after maintenance (the source data for the calculation are given in Figure 7b). The smoothed data were obtained using the moving average method with the number of intervals m = 9 (Δt = 9 days); the first day was taken as the Δt1 interval. In this case, the denominator is a constant, so Dependence (9) corresponds to the derivative of the sum of the failure tolerance values over time d S f / d t . It can be seen that after 10 days of operation, the Kd value decreases and then varies within ±10% relative to zero. The conclusion that can be drawn from this is that the developing defect danger degree is low; therefore, the failure tolerance is satisfactory.
Applying the dynamic characteristic Kd is effective since it is dimensionless and allows for defining failure tolerance in different facility operation intervals under different external conditions.

5. Implementation

This section gives an experimental estimation of the health recovery impact on the transformer’s RUL. The defects found after dismantling the windings are also considered, explaining the nature of destruction leading to pre-emergency.

5.1. Analyzing Source Data Arrays

The DGA results recorded by the online monitoring system during the monitoring period were analyzed, including the following intervals:
-
Deterioration of the transformer state from 5 May to 23 December 2019 (each parameter sample is approximately 2400 points);
-
Repair from 23 December 2019 to 10 January 2020;
-
Recovered state from 10 January 2020 to 15 March 2020 (sample of 820 points).
Preliminarily, the time series were smoothed using the moving average method at m = 21.
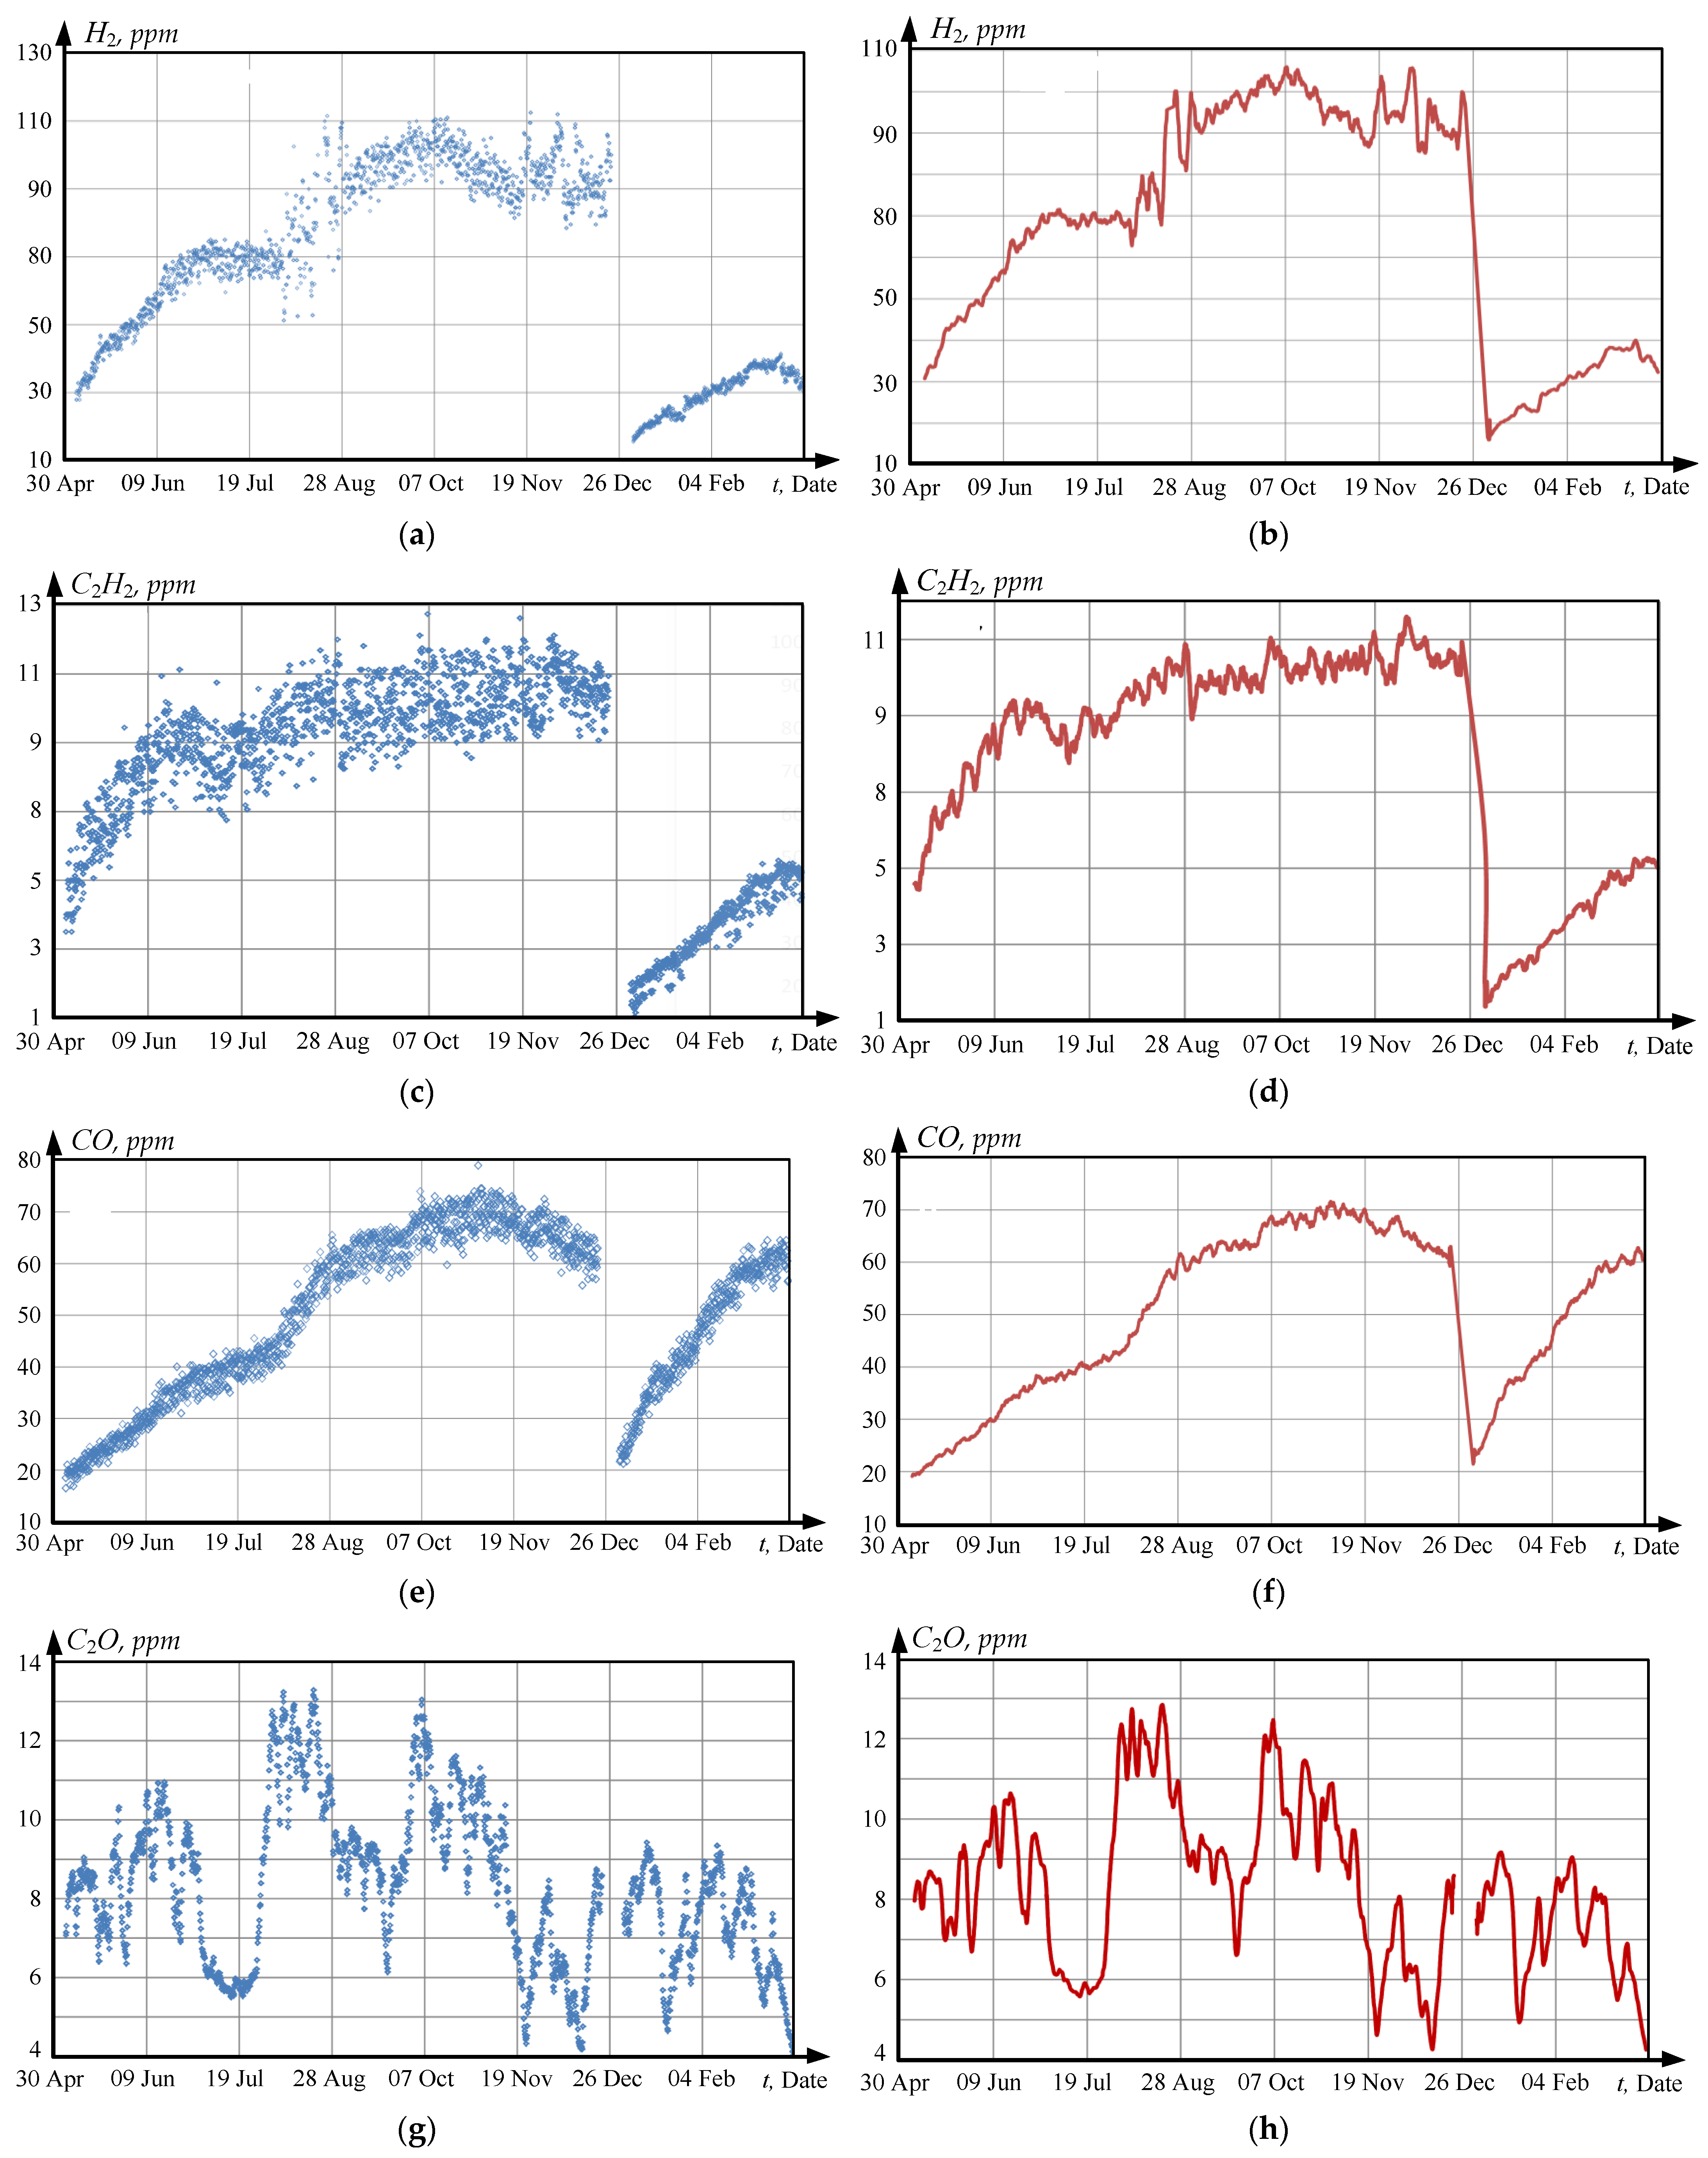
Figure 10 shows the DGA monitoring results as a set of points (left) and smoothed trends (plots on the right), which allow for tracing the trends in parameter changes. Before the start of the study period (5 May 2019), the concentrations of all gases and moisture content met the “normal” criterion, i.e., they were below the degraded state thresholds specified in Table 3. This was due to the maintenance and oil replacement at the end of 2015, as mentioned in Section 4.1. Figure 10a,b shows that the hydrogen concentration exceeded the degraded state threshold (50 ppm) at the end of May, and the pre-emergency threshold (100 ppm) in mid-September 2019. Acetylene concentration (Figure 10c,d) exceeded the degraded state threshold (5 ppm) in mid-May and the pre-emergency threshold (10 ppm) in mid-August of the same year. The concentrations of carbon monoxide and moisture during the monitoring did not exceed the set thresholds.
Gas concentrations at fixed time instants: at the start of monitoring (5 May 2019), before repair (23 December 2019), and after repair (10 January 2020) are given in Table 5. They show that as a result of the repair, gas concentrations have significantly decreased, which, obviously, had a positive impact on the facility’s failure tolerance and the transformer RUL. This is confirmed in Section 5.2 below.
When analyzing the state by a set of parameters, various polling rates of the time series of rated values create a serious problem. In the case under study, the hydrogen and acetylene concentration arrays are non-periodic and have a different number of points within a common time interval. Thus, the smoothed hydrogen and acetylene series are represented by 2375 and 2410 points, respectively. According to Section 3.2, this is due to the automatic configuration of polling rates in the TDMS system, when the set rate depends on the diagnosed parameter change rate. In the proposed technique, to reduce data to a common time scale, a time series with a smaller number of points is taken as a basis, and the next series values are recalculated using linear interpolation. It is assumed that between fixed points, the function is approximated by straight segments.

5.2. RUL Calculation Results

Figure 11a shows the change in the transformer’s tRUL, calculated according to the developed technique for the study’s monitoring period. It is seen that in the t1t2 time interval, the resource reduces much faster compared to the facility operation period. During this interval of about 8 months, the RUL has decreased by more than 8 years (from 15 to 6.5 years). Due to the deterioration of the state, the transformer was shut down on 23 December 2019 (t2 time instant) and put into operation after repair on 10 January 2020 (t3 time instant). The repair facilitates the health recovery (Figure 11a) and the increase in failure tolerance (Figure 11b). The RUL recovered almost to its initial value (14 years) and remained at this level (with acceptable deviations) until the end of monitoring in 2022 (not shown in the figure).
Note that the Sf(t) curve in Figure 11b does not correspond to the power dependence in Figure 5a. This is because the RUL is calculated not by one but by two parameters specified in Table 5. The aforementioned reduction in data to a common time scale also impacts the dependence. The correlation of dependencies RUL(t) and Sf(t) in Figure 11a,b confirms the calculation reliability.
In general, considering the studies described in Section 4.2, we can state that the transformer’s failure tolerance and RUL have been experimentally analyzed for 8 years of operation (from 2014 to 2022) using the developed technique. Similar studies are not available in the literature.
Defects reducing the transformer’s resource in the t1t2 interval are considered below. Their occurrence is caused by the insulation destruction, which has led to an increase in the hydrogen and acetylene concentrations. According to Section 3.2, their simultaneous growth may indicate thermal decomposition and even the arc breakdown of the insulation.

5.3. Defects Identified when Dismantling the Windings

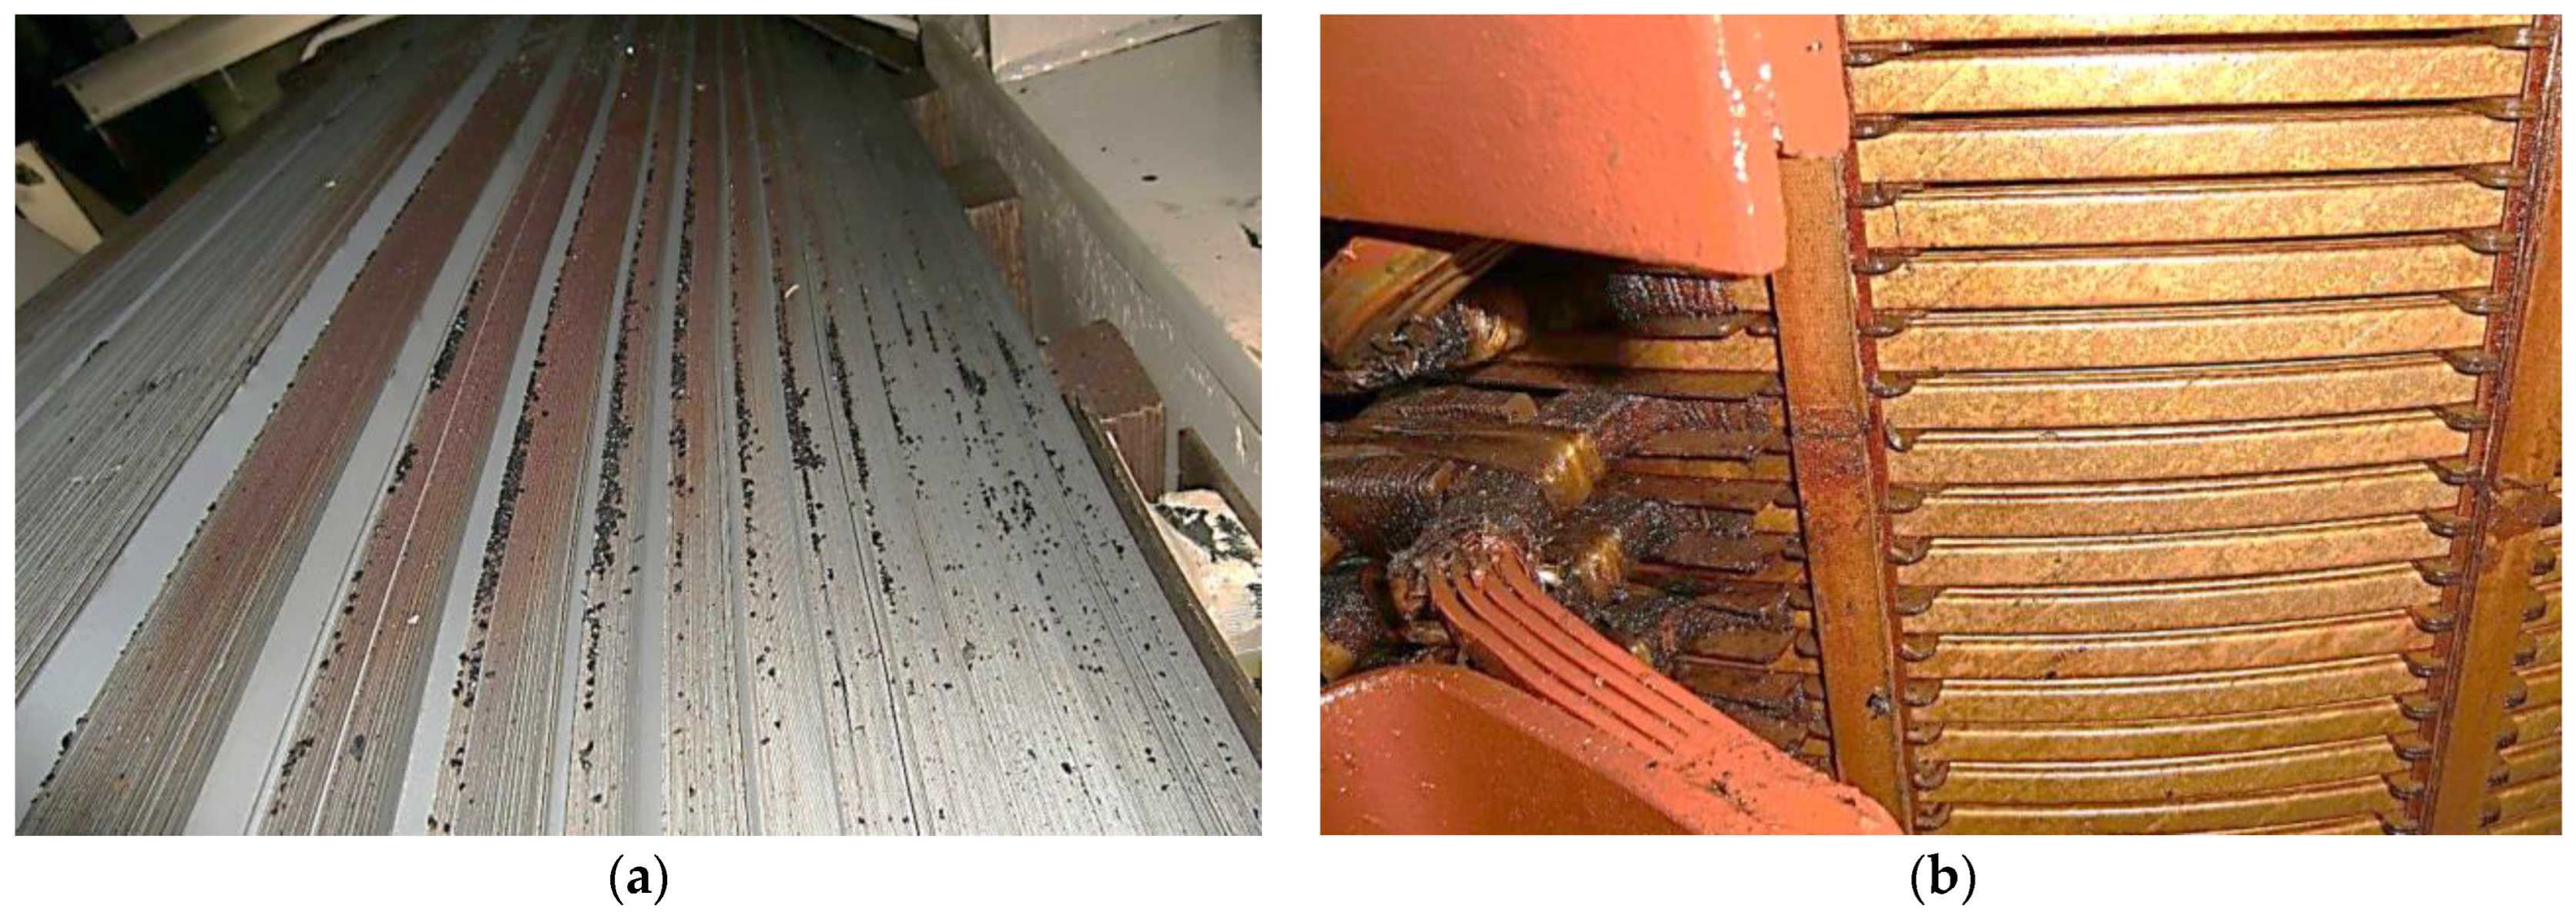
Figure 12 shows photos of windings after dismantling. Their general view indicates a lack of serious damage, but the examination results identified signs of destruction. Specifically, carbon-like debris was found on the transformer iron (Figure 13a), and the insulation was damaged at the winding connection points (Figure 13b). Local insulation destruction and other defects were also diagnosed, which confirmed the deterioration of the state (not shown in the photos). Thus, the alleged cause for decreasing the transformer’s failure tolerance and, accordingly, the RUL thermal destruction of the insulation were confirmed.
Quantifying the developing defect danger degree is difficult; however, the state is assessed as a pre-emergency according to the RUL decrease rate. The almost complete resource recovery after the repair indicates a reliable forecast of the RUL and confirms the repair’s timeliness. Thus, the RUL is not only a criterion for the duration of a trouble-free operation but also an indirect indicator of health. A detailed analysis of this issue requires additional research, the results of which may be the subject of a separate publication.

6. Discussion of the Results

Dependencies (1)–(6) are deterministic, while the informative parameter values, e.g., ti time instants in Figure 5 are probabilistic quantities. The resource calculation algorithm implementing the sequence of actions according to the developed methodology, along with the RUL calculations, comprises statistical techniques for smoothing and reducing the normalized parameters to a single scale. Therefore, the technique under study is a physical–statistical one. The impact of physical factors causing the development of degradation considered therein confirms this conclusion. Regression equations are built for diagnostic parameters (gas concentrations) closely related to physical processes such as sparking, arc discharges, etc. Physical and statistical process analysis models have the benefits of both deterministic and statistical techniques for assessing and forecasting the resource of complex equipment.
The material contains examples of calculating the furnace transformer RUL based on the online DGA results. Obviously, the RUL can also be defined by other informative parameters. These first include the PD characteristics (intensity and apparent charge) controlled by the TDMS system [2,61]. The destructive process development rate is also considered, which is among the technique’s advantage.
Advantages of using the developed technique in online monitoring:
  • Samples are complete since each parameter is measured several hundred times, and this number can be increased by increasing the polling duration or frequency. The possibility of building the trends of changes in the resource and estimating them at any time should also be noted, which is important with the intensive development of destructive processes;
  • Since analytical dependencies are used to calculate the RUL, there is no need to provide statistical data on failures and the run-to-failure of healthy equipment (most known techniques require such data). The state is assessed by comparing current data with settings for each controlled parameter. In this case, the state gradation can be set by not only the criteria “normal”, “degraded”, “pre-emergency” adopted in the examples given but also an extended list of criteria. Thus, the five-level classification recommended by IEC 997 [91] can be applied, as shown in Table 4 (without considering the “normal” state);
  • The technique’s algorithms can be integrated into the software of existing online monitoring systems with virtually no complication. Thereat, the algorithmic language of the software does not matter.
Herewith, the following limitations should be considered:
1. Limitation associated with the unsatisfactory scale of implementing online systems for monitoring the state of power transformers and other electrical equipment. The literature review has shown that a situation has developed in power and other industries when theoretical developments are far ahead of their practical implementation. This paper demonstrates the industrial implementation of the RUL forecasting technique, and therefore, is aimed at eliminating this discrepancy;
2. Understudying the issues of applying the proposed approach for various state monitoring techniques. The issues of forecasting the RUL based on the regular measurement results are believed to be promising. Considering that the state of most transformers is monitored just in this way, adapting the proposed technique for processing the regular measurement results is relevant.
The methodological approach considered can also be used to estimate the resource by the results of regular measurements of diagnostic parameters. In this case, a database for storing information and special software written according to this technique’s algorithm should be developed. The failure tolerance and RUL are calculated for a specific monitoring time instant, so the requirements for the statistical stability and homogeneity of the measurement result distribution functions are not relevant.

7. Conclusions and Future Work

A technique for calculating the transformer RUL has been developed, and examples of its implementation are given. This technique facilitates calculating the resource according to the criteria of the degraded state and pre-emergency and by a generalized parameter determining the integral dynamic failure tolerance of the technical system.
The key points of the RUL calculation technique are:
  • Presentation of the online monitoring results as a time series, reduction to a single time scale, and smoothing using the moving average method;
  • Direct calculation of the transformer’s failure tolerance and RUL by Equations (2)–(5);
  • Analyzing the impact of shock state changes (failures and recoveries) on the facility’s RUL. Calculating ΔSfi by Equation (6);
  • Defining the generalized dynamic index by Equation (8). Justifying the acceptance of the facility’s relative failure tolerance index called the “external impact robustness index” as a generalized parameter;
  • Estimating the reliability by comparison with the results of an experimental assessment or the analysis of the state by other diagnostic methods (where appropriate).
The developed technique was applied to analyze the failure tolerance and RUL of the ladle furnace transformer during the operation period from 2014 to 2022. The cases of an intensive decrease and subsequent recovery of failure tolerance have been studied. The reliability of calculating the RUL by the online DGA results has been experimentally confirmed; the possibility of a stepwise (shock) representation of the facility state changes during failures and recoveries has been proven. The expediency of implementing the developed technique for estimating the RUL during periods of active development of degradation processes (intensive aging) has been confirmed. The defects found after the transformer dismantling are demonstrated, which confirms the destruction developing in solid insulation. Conclusions have been drawn on the reliability of estimating the health and forecasting failure tolerance.
The “failure tolerance” term has been redefined for the integral facilities. It is understood as the ability to uninterruptedly operate under normal conditions, regardless of the aging degree, under external impacts not causing accidents.
The developed method is aimed at eliminating the following common shortcomings of the existing RUL forecasting techniques:
  • The known techniques are not intended for use in online health monitoring systems, the implementation of which is a priority IOT area;
  • The known techniques are aimed at developing methods for processing diagnostic data arrays. It assumes collecting the necessary data over a long period (usually many years), and the only problem is their efficient processing. However, a literature review and the transformer (and other industrial) equipment’s operating practice shows that the necessary data arrays are usually unavailable. Therefore, there is a huge gap between the theoretical development of the RUL forecasting techniques and their industrial implementation;
  • Complexity, since all existing RUL forecasting techniques require special mathematical data processing methods (deep learning methods, etc.) and highly qualified staff. This limits the possibility of implementing them in production;
  • The known techniques fail to consider the shock RUL change during accidents or resource recovery due to maintenance and repairs. The cumulative failure impact are not considered. This reduces the RUL forecast’s reliability for operating facilities.
A comparison of the proposed method with the existing techniques described in Section 2 shows the following advantages:
  • The developed technique is intended for use in the transformer health online monitoring systems (for the first time). Considering that almost all newly commissioned transformers are equipped with such systems, this field has broad prospects;
  • The technique has been developed using the example of a furnace transformer which is the specific industrial facility, at which this technique was implemented. Its reliability and technical efficiency have been verified experimentally, which is something that the available literature was lacking. This stresses the practical orientation of the study;
  • The technique is based on analytical equations, it is simple, and does not require special software or staff knowledge. Therefore, it is rightfully related to engineering techniques.
Automatically defining the resource in online systems is a desirable function when solving the following problems:
-
Developing maintenance and repair schedules;
-
Justifying the replacement of equipment;
-
Justifying the transition to advanced maintenance technologies based on the state;
-
Forming SPTA for equipment.
The proposed methodological approach is not only applicable to transformer health monitoring systems. The developed technique is suitable for analyzing the state of any facility, the information on which is presented in the form of time series.
Developing algorithms and software for calculating the facility’s resource by the online monitoring results is expedient. Along with the RUL calculations, the algorithm should include the procedures of smoothing using the moving average method and reducing the normalized parameters to a single scale. Such software does not include complex operations; therefore, it can be implemented in any available programming language, including the Excel pack.
The benefits of the developed technique are simplicity and versatility. Both operations with pre-recorded parameters and online data processing are possible, so they can be widely used under operating conditions. Specifically, the technique is recommended for use in estimating the health and forecasting the RUL of HV switchgear equipment (vacuum and SF6 breakers, surge arresters, couplings, etc.) and mechatronic complexes comprising motors, gearboxes, converters, and other recoverable equipment.
The are no available studies in the literature that have continuously monitored RUL of the operating technical facility health over several years. Therefore, we can argue that the developed technique for calculating the RUL by the online monitoring results is original. Accordingly, the results obtained have features of novelty and practical significance, which confirms the scientific contribution hereof.
As a promising area of research, we have planned to perform a comparative analysis of techniques for assessing and forecasting transformers’ health, based on the RUL, calculating the health index (HI) and fuzzy methods.
Implementing the developed technique for assessing the furnace transformer RUL based on the results of online monitoring of partial discharges, provided in [2,64], is also relevant. This will expand the list of coordinates used in forecasting the RUL and facilitate implementing techniques for the multi-parameter diagnostics of the transformer state.
Developing a universal algorithm for calculating the RUL in online operated monitoring systems is expedient. This will allow for not only assessing its health online but also forecasting its change, considering failures and predictive maintenance. As noted above, this will contribute to the implementation of promising technologies for the maintenance and repair of HV equipment.
The development and implementation of online monitoring systems combined with special data processing software contribute to implementing modern Smart-Grid technologies in the grids of energy and power supply systems of industrial enterprises [92]. The presented technique is a fragment of a set of solutions for the diagnostic monitoring of the HV equipment’s health [93,94,95,96,97].

Author Contributions

Conceptualization, A.A.R. and A.S.K.; methodology, I.M.Y. and I.R.A.; writing—original draft preparation, A.S.K.; writing—review and editing, A.S.K. and E.A.K.; visualization, I.V.L. and E.A.K.; project administration, A.A.R. All authors have read and agreed to the published version of the manuscript.

Funding

This research received no external funding.

Institutional Review Board Statement

Not applicable.

Data Availability Statement

Not applicable.

Conflicts of Interest

The authors declare no conflict of interest.

References

  1. Yan, W.; Wang, J.; Lu, S.; Zhou, M.; Peng, X. A Review of Real-Time Fault Diagnosis Methods for Industrial Smart Manufacturing. Processes 2023, 11, 369. [Google Scholar] [CrossRef]
  2. Karandaev, A.S.; Yachikov, I.M.; Radionov, A.A.; Liubimov, I.V.; Druzhinin, N.N.; Khramshina, E.A. Fuzzy Algorithms for Diagnosis of Furnace Transformer Insulation Condition. Energies 2022, 15, 3519. [Google Scholar] [CrossRef]
  3. Reboldi, R.; Zanoni, S.; Mazzoldi, L.; Marchi, B. TAMINE TES. EAF Smartrafo Solution. Available online: http://www.tamini.it/public/EN/document/attach/eec_20160424%20def.pdf (accessed on 1 April 2023).
  4. Liu, C.; Cichon, A.; Królczyk, G.; Li, Z. Technology development and commercial applications of industrial fault diagnosis system: A review. Int. J. Adv. Manuf. Technol. 2022, 118, 3497–3529. [Google Scholar] [CrossRef]
  5. Lei, Y.; Li, N.; Guo, L.; Li, N.; Yan, T.; Lin, J. Machinery health prognostics: A systematic review from data acquisition to RUL prediction. Mech. Syst. Signal Process. 2018, 104, 799–834. [Google Scholar] [CrossRef]
  6. Wang, M.; Vandermaar, A.J.; Srivastava, K.D. Review of Condition Assessment of Power Transformers in Service. IEEE Electr. Insul. Mag. 2002, 6, 12–25. [Google Scholar] [CrossRef]
  7. Tsvetaev, S.K.; Pershina, N.F.; Smekalov, S.V.; Dolin, A.P.; Smekalov, V.V. Practice of Diagnostics and Repairs of Power Transformers to Improve the Reliability of Operation and Extend the Service Life. Electronic 2006, 5, 27–31. [Google Scholar]
  8. Cao, X.; Li, P.; Ming, S. Remaining Useful Life Prediction-Based Maintenance Decision Model for Stochastic Deterioration Equipment under Data-Driven. Sustainability 2021, 13, 8548. [Google Scholar] [CrossRef]
  9. Matusevych, O.; Kuznetsov, V.; Sychenko, V. The method for increasing the efficiency of equipment’s maintenance in railway traction power supply systems. Arch. Transp. 2018, 47, 39–47. [Google Scholar] [CrossRef]
  10. Illias, H.A.; Chai, X.R.; Abu Bakar, H.R.; Mokhlis, H. Transformer Incipient Fault Prediction Using Combined Artificial Neural Network and Various Particle Swarm Optimisation Techniques. PLoS ONE 2015, 10, e0129363. [Google Scholar] [CrossRef] [PubMed]
  11. Badune, J.; Vitolina, S.; Maskalonok, V. Methods for Predicting Remaining Service Life of Power Transformers and Their Components. Power Electr. Eng. 2013, 31, 123–126. [Google Scholar]
  12. Saha, T.K. Review of Modern Diagnostic Techniques for Assessing Insulation Condition in Aged Transformers. IEEE Trans. Dielectr. Electr. Insul. 2003, 5, 903–917. [Google Scholar] [CrossRef] [Green Version]
  13. Karandaev, A.S.; Yachikov, I.M.; Khramshin, V.R. Methods of Multi-Parameter Diagnostics of Electric Equipment Condition within On-line Monitoring Systems. Procedia Eng. 2016, 15, 32–38. [Google Scholar] [CrossRef] [Green Version]
  14. Vdoviko, V.P. Failure Tolerance of Operating High-Voltage Equipment. Electronic 2011, 1, 36–41. [Google Scholar]
  15. Vdoviko, V.P. Methodology of the System for Diagnosing Operating High-Voltage Electrical Equipment. Energy Saf. Energy Sav. 2010, 1, 25–32. [Google Scholar]
  16. Mtetwa, S.; Cormack, R. Addressing the Requirements of an Ageing Fleet of Transmission Transformers on the Eskom Transmission Network. In Proceedings of the CIGRE 6th Southern Africa Regional Conference, Cape Town, South Africa, 17–21 August 2009. [Google Scholar]
  17. C57.92-1981; IEEE Guide for Loading Mineral-Oil-Immersed Power Transformers up to and Including 100 MVA with 55 Degrees C or 65 Degrees C Average Winding Rise, ANSI/IEEE Std. Available online: https://ieeexplore.ieee.org/document/27793 (accessed on 11 May 2023).
  18. Laayati, O.; El Hadraoui, H.; El Magharaoui, A.; El-Bazi, N.; Bouzi, M.; Chebak, A.; Guerrero, J.M. An AI-Layered with Multi-Agent Systems Architecture for Prognostics Health Management of Smart Transformers: A Novel Approach for Smart Grid-Ready Energy Management Systems. Energies 2022, 15, 7217. [Google Scholar] [CrossRef]
  19. Ivanov, G.; Spasova, A.; Mateev, V.; Marinova, I. Applied Complex Diagnostics and Monitoring of Special Power Transformers. Energies 2023, 16, 2142. [Google Scholar] [CrossRef]
  20. Poonnoy, N.; Suwanasri, C.; Suwanasri, T. Fuzzy Logic Approach to Dissolved Gas Analysis for Power Transformer Failure Index and Fault Identification. Energies 2021, 14, 36. [Google Scholar] [CrossRef]
  21. Su, C.Q. A new fuzzy logic method for transformer incipient fault diagnosis. In Proceedings of the IEEE International Conference on Fuzzy Systems (FUZZ-IEEE), Vancouver, BC, Canada, 24–29 July 2016. [Google Scholar] [CrossRef]
  22. Husain, Z.; Malik, H.; Khan, M.A. Recent Trends in Power Transformer Fault Diagnosis and Condition Assessment. Bull. Electr. Eng. Inform. 2013, 2, 101–111. [Google Scholar] [CrossRef]
  23. Tran, Q.T.; Davies, K.; Roose, L.; Wiriyakitikun, P.; Janjampop, J.; Riva Sanseverino, E.; Zizzo, G. A Review of Health Assessment Techniques for Distribution Transformers in Smart Distribution Grids. Appl. Sci. 2020, 10, 8115. [Google Scholar] [CrossRef]
  24. Karandaev, A.S.; Khramshin, V.R.; Evdokimov, S.A.; Kondrashova, Y.N.; Karandaeva, O.I. Metodology of Calculation of the Reliability Indexes and Life Time of the Electric and Mechanical Systems. In Proceedings of the International Conference on Mechanical Engineering, Automation and Control Systems (MEACS), Tomsk, Russia, 16–18 October 2014. [Google Scholar] [CrossRef]
  25. Barrios, S.; Buldain, D.; Comech, M.P.; Gilbert, I.; Orue, I. Partial Discharge Classification Using Deep Learning Methods—Survey of Recent Progress. Energies 2019, 12, 2485. [Google Scholar] [CrossRef] [Green Version]
  26. Karandaev, A.S.; Panferov, V.I.; Yachikov, I.M.; Khramshina, E.A.; Khramshin, R.R. Application of the Method for Identification of Developing Defects in a High-Voltage Transformer. In Proceedings of the 18 International Russian Automation Conference (RusAutoCon), Sochi, Russia, 9–16 September 2018. [Google Scholar] [CrossRef]
  27. Tenbohlen, S.; Coenen, S.; Djamali, M.; Müller, A.; Samimi, M.H.; Siegel, M. Diagnostic Measurements for Power Transformers. Energies 2016, 9, 347. [Google Scholar] [CrossRef] [Green Version]
  28. Jin, L.; Kim, D.; Abu-Siada, A.; Kumar, S. Oil-Immersed Power Transformer Condition Monitoring Methodologies: A Review. Energies 2022, 15, 3379. [Google Scholar] [CrossRef]
  29. Wang, J.; Zhang, X.; Zhang, F.; Wan, J.; Kou, L.; Ke, W. Review on Evolution of Intelligent Algorithms for Transformer Condition Assessment. Front. Energy Res. 2022, 10, 904109. [Google Scholar] [CrossRef]
  30. Samaitis, V.; Mažeika, L.; Jankauskas, A.; Rekuvienė, R. Detection and Localization of Partial Discharge in Connectors of Air Power Lines by Means of Ultrasonic Measurements and Artificial Intelligence Models. Sensors 2021, 21, 20. [Google Scholar] [CrossRef]
  31. Mharakurwa, E.T. In-Service Power Transformer Life Time Prospects: Review and Prospects. J. Electr. Comput. Eng. 2022, 2022, 9519032. [Google Scholar] [CrossRef]
  32. Jahromi, A.; Piercy, R.; Cress, S.; Service, J.; Fan, W. An approach to power transformer asset management using health index. IEEE Electr. Insul. Mag. 2009, 2, 20–34. [Google Scholar] [CrossRef]
  33. Mohmad, A.; Shapiai, M.I.; Shamsudin, M.S.; Abu, M.A.; Hamid, A.A. Investigating performance of transformer health index in machine learning application using dominant features. J. Phys. Conf. Ser. 2021, 2128, 012025. [Google Scholar] [CrossRef]
  34. Jürgensen, J.H.; Godin, A.S.; Hilber, P. Health index as condition estimator for power system equipment: A critical discussion and case study. CIRED Open Access Proc. J. 2017, 1, 202–205. [Google Scholar] [CrossRef] [Green Version]
  35. Bohatyrewicz, P.; Płowucha, J.; Subocz, J. Condition Assessment of Power Transformers Based on Health Index Value. Appl. Sci. 2019, 9, 4877. [Google Scholar] [CrossRef] [Green Version]
  36. Bohatyrewicz, P.; Mrozik, A. The Analysis of Power Transformer Population Working in Different Operating Conditions with the Use of Health Index. Energies 2021, 14, 5213. [Google Scholar] [CrossRef]
  37. Zaldivar, D.A.; Romero, A.A.; Rivera, S.R. Risk Assessment Algorithm for Power Transformer Fleets Based on Condition and Strategic Importance. Algorithms 2021, 14, 319. [Google Scholar] [CrossRef]
  38. Li, Y.; Tang, M.-J.; Wu, F.-J.; Zhang, G.; Wang, S.-H.; Suwarno, S. Aging Assessment of Power Transformer Using Multi-parameters. Int. J. Electr. Eng. Inform. 2013, 5, 34–44. [Google Scholar] [CrossRef]
  39. Kang, Z.; Catal, C.; Tekinerdogan, B. Remaining Useful Life (RUL) Prediction of Equipment in Production Lines Using Artificial Neural Networks. Sensors 2021, 21, 932. [Google Scholar] [CrossRef]
  40. Jia, C.; Zhang, H. RUL Prediction: Reducing Statistical Model Uncertainty Via Bayesian Model Aggregation. In Proceedings of the CAA Symposium on Fault Detection, Supervision and Safety for Technical Processes (SAFEPROCESS), Xiamen, China, 5–7 July 2019; pp. 602–607. [Google Scholar] [CrossRef]
  41. Wang, S.; Wang, Y.; Liu, X.; Wang, J.; Wang, Z. Health State Assessment of Industrial Equipment Driven by the Fusion of Digital Twin Model and Intelligent Algorithm. Comput. Intell. Neurosci. 2022, 2022, 7324121. [Google Scholar] [CrossRef] [PubMed]
  42. Pei, J.; An, J.; Wang, W. Navy missile quality status hierarchy and evaluation. Comput. Digit. Eng. 2016, 12, 2309–2313. [Google Scholar]
  43. Zhou, L.; Feng, Y.; Gu, J. Missile quality assessment based on fuzzy theory. Ordnance Ind. Autom. 2020, 8, 60–66. [Google Scholar]
  44. An, J.; Xu, T.; Zeng, X.; Li, Z.; Zhu, G. Equipment quality condition assessment under fusion information based on combination weighting. Control. Decis. 2018, 9, 1693–1698. [Google Scholar] [CrossRef]
  45. Hao, D.; Zhao, J.; Zhang, S.; Fang, Y. Research on military equipment quality evaluation method based on bayes theory. Equip. Environ. Eng. 2016, 4, 168–175. [Google Scholar]
  46. Xia, M.; Zheng, X.; Imran, M.; Shoaib, M. Data-driven prognosis method using hybrid deep recurrent neural network. Appl. Soft Comput. 2020, 93, 106351. [Google Scholar] [CrossRef]
  47. Tian, Q.; Wang, H. An Ensemble Learning and RUL Prediction Method Based on Bearings Degradation Indicator Construction. Appl. Sci. 2020, 10, 346. [Google Scholar] [CrossRef] [Green Version]
  48. Mustaqeem; Ishaq, M.; Kwon, S. Short-Term Energy Forecasting Framework Using an Ensemble Deep Learning Approach. IEEE Access 2021, 9, 94262–94271. [Google Scholar] [CrossRef]
  49. Shaikh, A.K.; Nazir, A.; Khan, I.; Shah, A.S. Short term energy consumption forecasting using neural basis expansion analysis for interpretable time series. Sci. Rep. 2022, 12, 22562. [Google Scholar] [CrossRef] [PubMed]
  50. Klaiber, M. A Fundamental Overview of SOTA-Ensemble Learning Methods for Deep Learning: A Systematic Literature Review. Sci. Inf. Technol. Lett. 2021, 2, 1–14. [Google Scholar] [CrossRef]
  51. Bustamante, S.; Manana, M.; Arroyo, A.; Castro, P.; Laso, A.; Martinez, R. Dissolved Gas Analysis Equipment for Online Monitoring of Transformer Oil: A Review. Sensors 2019, 19, 4057. [Google Scholar] [CrossRef] [Green Version]
  52. Walker, C.; Walker, D. Creation & Validation of Transformer Residual Life Models. In Proceedings of theIEEE 21st International Conference on Dielectric Liquids (ICDL), Sevilla, Spain, 29 May–2 June 2022. [Google Scholar] [CrossRef]
  53. Karandaev, A.S.; Radionov, A.A.; Tverskoi, M.M.; Yachikov, I.M.; Nikolaev, A.A. Methods of Estimation of Electrical Equipment Condition Based on Integral Diagnostic Attribute. In Proceedings of the 2nd International Ural Conference on Measurements (UralCon), Chelyabinsk, Russia, 16–19 October 2017. [Google Scholar] [CrossRef]
  54. Radionov, A.A.; Karandaeva, O.I.; Evdokimov, S.A.; Gallyamova, M.S.; Kondrashova, Y.N. Monitoring Partial Discharges in Stationary Condition Monitoring System of Furnace Transformer. In Proceedings of the IEEE NW Russia Young Researchers in Electrical and Electronic Engineering Conference (EIConRus), St. Petersburg and Moscow, Russia, 1–3 February 2017. [Google Scholar] [CrossRef]
  55. Karandaev, A.S.; Khramshin, V.R.; Evdokimov, S.A.; Larina, T.P.; Yachikov, I.M. Practical Diagnostics of Power Transformers with Acoustic Radar Method of Partial Discharge Determination. In Proceedings of the IEEE NW Russia Young Researchers in Electrical and Electronic Engineering Conference (EIConRusNW), St. Petersburg, Russia, 2–3 February 2016. [Google Scholar] [CrossRef]
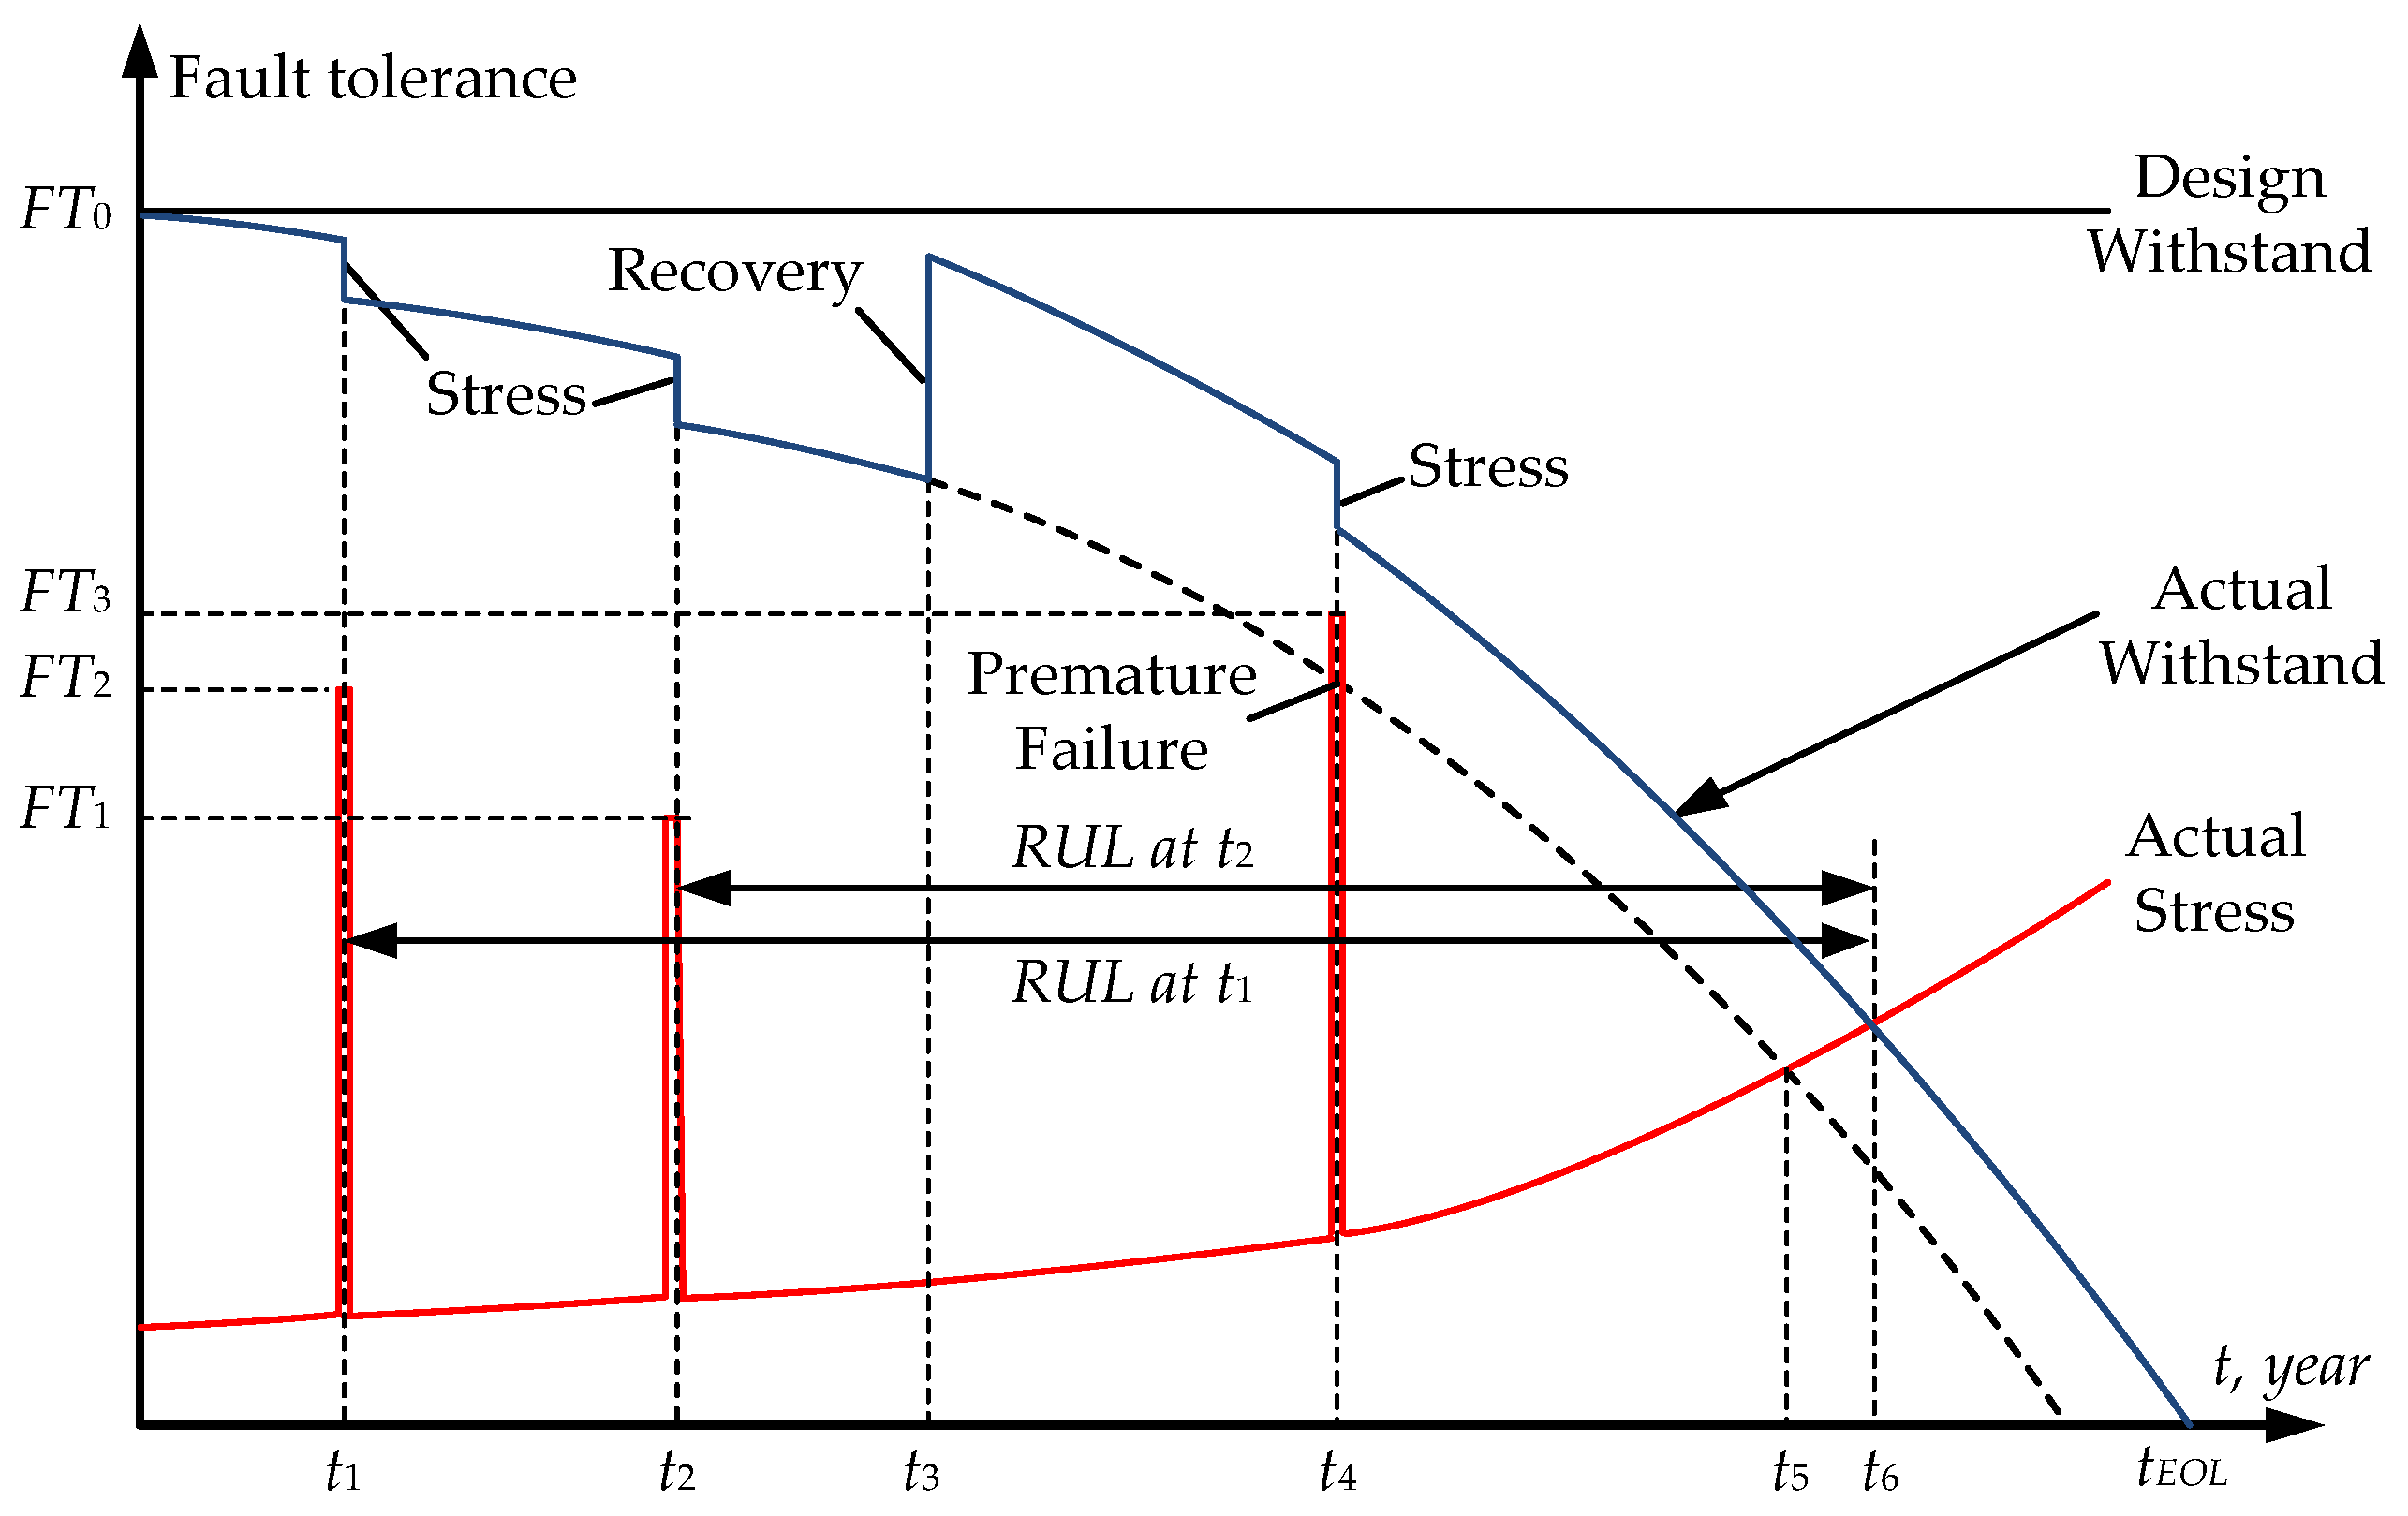
  56. Panoiu, M.; Panoiu, C.; Sora, I.; Osaci, M. About the Possibility of Power Controlling in the Three-Phase Electric Arc Furnaces Using PSCAD EMTDC Simulation Program. Adv. Electr. Comput. Eng. 2007, 7, 38–43. [Google Scholar] [CrossRef]
  57. Ge, W.; Zhang, C.; Xie, Y.; Yu, M.; Wang, Y. Analysis of the Electromechanical Characteristics of Power Transformer under Different Residual Fluxes. Energies 2021, 14, 8244. [Google Scholar] [CrossRef]
  58. Karandaev, A.S.; Evdokimov, S.A.; Khramshin, V.R.; Lednov, R.A. Diagnostic Functions of a System for Continuous Monitoring of the Technical Condition of the Transformers of Arc Steelmaking Furnaces. Metallurgist 2014, 7–8, 655–663. [Google Scholar] [CrossRef]
  59. Karandaev, A.S.; Evdokimov, S.A.; Khramshin, V.R.; Karandaeva, O.I. Information and Measuring System for Electric Arc Furnace Transformer Monitoring. In Proceedings of the 12th International Conference on Actual Problems of Electronic Insrument Engineering (APEIE), Novosibirsk, Russia, 2–4 October 2014. [Google Scholar] [CrossRef]
  60. Cano-Plata, E.A.; Soto-Marin, O.J.; Ustariz-Farfan, A.J. Life Assessment of Electric Arc Furnace Transformers. IEEE Trans. Ind. Appl. 2017, 53, 4125–4135. [Google Scholar] [CrossRef]
  61. Karandaeva, O.I.; Yakimov, I.A.; Filimonova, A.A.; Gartlib, E.A.; Yachikov, I.M. Stating Diagnosis of Current State of Electric Furnace Transformer on the Basis of Analysis of Partial Discharges. Machines 2019, 7, 77. [Google Scholar] [CrossRef] [Green Version]
  62. Singh, R.P.; Sonawane, A.V.; Satpute, M.S.; Shirsath, D.Y.; Thakre, M.P. A Review on Traditional Methods of Condition Monitoring of Transformer. In Proceedings of the International Conference on Electronics and Sustainable Communication Systems (ICESC), Coimbatore, India, 2–4 July 2020. [Google Scholar] [CrossRef]
  63. Wani, S.A.; Rana, A.S.; Sohail, S.; Rahman, O.; Parveen, S.; Khan, S.A. Advances in DGA based condition monitoring of transformers: A review. Renew. Sustain. Energy Rev. 2021, 149, 111347. [Google Scholar] [CrossRef]
  64. Das, B. Transformer Magazine Special Issue: Digitalization—Demystifying Online DGA Monitor Specification. Available online: https://www.researchgate.net/publication/347623087_Transformer_Magazine_Special_Issue_Digitalization_-_Demystifying_online_DGA_monitor_specification (accessed on 11 May 2023).
  65. Barkas, D.A.; Kaminaris, S.D.; Kalkanis, K.K.; Ioannidis, G.C.; Psomopoulos, C.S. Condition Assessment of Power Transformers through DGA Measurements Evaluation Using Adaptive Algorithms and Deep Learning. Energies 2023, 16, 54. [Google Scholar] [CrossRef]
  66. Mark Gross Leveraging Online DGA to Optimize End-of-Life Operations for Aging Power Transformers. Available online: https://www.tdworld.com/test-and-measurement/article/21251830/leveraging-online-dga-to-optimize-endoflife-operations-for-aging-power-transformers (accessed on 11 May 2023).
  67. Shamsudin, M.S.; Yakub, F.; Shapiai, M.I.; Mohmad, A.; Abd, N.A. Hamid Investigation on Online DGA Monitoring to Determine Transformer Health Index Using Machine Learning. J. Phys. Conf. Ser. 2021, 2128, 012024. [Google Scholar] [CrossRef]
  68. Almoallem, Y.D.; Taha, I.B.M.; Mosaad, M.I.; Nahma, L.; Abu-Siada, A. Application of Logistic Regression Algorithm in the Interpretation of Dissolved Gas Analysis for Power Transformers. Electronics 2021, 10, 1206. [Google Scholar] [CrossRef]
  69. Apte, S.; Somalwar, R.; Wajirabadkar, A. Incipient Fault Diagnosis of Transformer by DGA Using Fuzzy Logic. In Proceedings of the IEEE International Conference on Power Electronics, Drives and Energy Systems (PEDES), Chennai, India, 18–21 December 2018. [Google Scholar] [CrossRef]
  70. Yan, T.; Lei, Y.; Li, N.; Wang, B.; Wang, W. Degradation modeling and remaining useful life prediction for dependent competing failure processes. Reliab. Eng. Syst. Saf. 2021, 212, 107638. [Google Scholar] [CrossRef]
  71. Hao, S.; Yang, J.; Ma, X.; Zhao, Y. Reliability modeling for mutually dependent competing failure processes due to degradation and random shocks. Appl. Math. Model. 2017, 51, 232–249. [Google Scholar] [CrossRef]
  72. Zhang, Z.; Si, X.; Hu, C.; Kong, X. Degradation modeling–based remaining useful life estimation: A review on approaches for systems with heterogeneity. J. Risk Reliab. 2015, 229, 343–355. [Google Scholar] [CrossRef]
  73. Bejaoui, I.; Bruneo, D.; Xibilia, M.G. Remaining Useful Life Prediction of Broken Rotor Bar Based on Data-Driven and Degradation Model. Appl. Sci. 2021, 11, 7175. [Google Scholar] [CrossRef]
  74. Rafiee, K.; Feng, Q.; Coit, D.W. Reliability modeling for dependent competing failure processes with changing degradation rate. IIE Trans. 2014, 46, 483–496. [Google Scholar] [CrossRef]
  75. Li, Z.; Goebel, K.; Wu, D. Degradation Modeling and Remaining Useful Life Prediction of Aircraft Engines Using Ensemble Learning. ASME J. Eng. Gas Turbines Power 2019, 141, 041008. [Google Scholar] [CrossRef] [Green Version]
  76. Mitici, M.; de Pater, I. Online Model-Based Remaining-Useful-Life Prognostics for Aircraft Cooling Units Using Time-Warping Degradation Clustering. Aerospace 2021, 8, 168. [Google Scholar] [CrossRef]
  77. Chen, N.; Tsui, K.L. Condition monitoring and remaining useful life prediction using degradation signals: Revisited. IIE Trans. 2013, 9, 939–952. [Google Scholar] [CrossRef]
  78. Xu, X.; Yu, C.; Tang, S.; Sun, X.; Si, X.; Wu, L. Remaining Useful Life Prediction of Lithium-Ion Batteries Based on Wiener Processes with Considering the Relaxation Effect. Energies 2019, 12, 1685. [Google Scholar] [CrossRef] [Green Version]
  79. Zhang, S.-J.; Kang, R.; Lin, Y.-H. Remaining useful life prediction for degradation with recovery phenomenon based on uncertain process. Reliab. Eng. Syst. Saf. 2021, 208, 107440. [Google Scholar] [CrossRef]
  80. Gómez-Pau, Á.; Riba, J.-R.; Moreno-Eguilaz, M. Time Series RUL Estimation of Medium Voltage Connectors to Ease Predictive Maintenance Plans. Appl. Sci. 2020, 10, 9041. [Google Scholar] [CrossRef]
  81. Zhong, Q. Power Transformer End-of-Life Modelling: Linking Statistics with Physical Ageing. Available online: https://www.escholar.manchester.ac.uk/item/?pid=uk-ac-man-scw:153730 (accessed on 11 May 2023).
  82. Francheck, M.A.; Woodcock, D.J. Life-Cycle Consideration of Loading Transformers above Nameplate Rating. Available online: https://studylib.net/doc/18859208/life-cycle-considerations-of-loading-transformers-above-n (accessed on 11 May 2023).
  83. Marchi, B.; Zanoni, S.; Mazzoldi, L.; Reboldi, R. Energy Efficient EAF Transformer—A Holistic Life Cycle Cost Approach. Procedia CIRP 2016, 48, 319–324. [Google Scholar] [CrossRef] [Green Version]
  84. Karandaev, A.S.; Evdokimov, S.A.; Khramshin, V.R.; Sarlybaev, A.A. System for Real-Time Monitoring of the Technical State of a Transformer on an Ultrahigh-Power Electric-Arc Steelmaking Furnace. Metallurgist 2014, 9–10, 872–879. [Google Scholar] [CrossRef]
  85. RD 153-34.0-46.302-00. Guidelines for Diagnosing Defects Developing in Transformer Equipment by the Results of Chromatographic Analysis of Gases Dissolved in Oil. Available online: https://sibenedia.ru/assets/images/RD_153-34_0-46_302-00.pdf (accessed on 11 May 2023).
  86. ISO/DIS 13849-1.2 (en) Safety of Machinery—Safety-Related Parts of Control Systems—Part 1: General Principles for Design. Available online: https://www.iso.org/obp/ui/#iso:std:iso:13849:-1:dis:ed-4:v2:en (accessed on 11 May 2023).
  87. Malkin, V.S. Technical Diagnostics; Lan: St. Petersburg, Russia, 2013; 272p. [Google Scholar]
  88. Radionov, A.A.; Karandaev, A.S.; Yachikov, I.M.; Karandaeva, O.I.; Gasyarov, V.R. Power Transformer Condition Forecast with Time-series Extrapolation. In Proceedings of the 9th International Conference on Computer and Automation Engineering (ICCAE), Sydney, Australia, 18–21 February 2017. [Google Scholar] [CrossRef]
  89. Rusov, V.A. Diagnostic Monitoring of High-Voltage Power Transformers; DIM-RUS: Perm, Russia, 2012; 159p. [Google Scholar]
  90. Thang, K.F.; Aggarwal, R.K.; McGrail, A.J.; Esp, D.G. Analysis of Power Transformer Dissolved Gas Data Using the Self-Organizing Map. IEEE Trans. Electr. Power Deliv. 2003, 4, 349–354. [Google Scholar] [CrossRef]
  91. Methodical Directions for to Diagnostic of Mains Transformers, the Autotransformers, Bypassing Chokes and Their Feedings into MУ 0634-2006. Concern «ROSENERGOATOM». Available online: http://leg.co.ua/knigi/oborudovanie/diagnostika>-transformatorov-i-shuntiruyuschih-reaktorov.htm (accessed on 11 May 2023).
  92. Khramshin, V.R.; Evdokimov, S.A.; Nikolaev, A.A.; Nikolaev, A.A.; Karandaev, A.S. Monitoring Technical State of the Power Transformers Is a Necessary Condition of the Smart-Grid Technology Introduction within the Industrial Electric Networks. In Proceedings of the IEEE NW Russia Young Researchers in Electrical and Electronic Engineering Conference (EIConRusNW), St. Petersburg, Russia, 2–4 February 2015. [Google Scholar] [CrossRef]
  93. Karandaev, A.S.; Mugalimov, R.G.; Petushkov, M.Y.; Lukyanov, S.I.; Sarvarov, A.S. Design of smart technical condition analysis systems for electric equipment of an iron-and-steel. In Proceedings of the International Ural Conference on Electrical Power Engineering (UralCon), Chelyabinsk, Russia, 1–3 October 2019. [Google Scholar] [CrossRef]
  94. Radionov, A.A.; Evdokimov, S.A.; Karandaev, A.S.; Khramshin, V.R. Information and Measurement System for Control of Technical State of Asynchronous Electric Motors with Group Supply from Frequency Converter. In Proceedings of the 12th International Conference on Actual Problems of Electronic Insrument Engineering (APEIE), Novosibirsk, Russia, 2–4 October 2014. [Google Scholar] [CrossRef]
  95. Khramshin, V.R.; Evdokimov, A.S.; Evdokimov, S.A.; Karandaev, A.S. Development and Industrial Introduction of Systems for Monitoring Technical State of the Rolling Mills’ Electrical Equipment. In Proceedings of the IEEE NW Russia Young Researchers in Electrical and Electronic Engineering Conference (EIConRusNW), St. Petersburg, Russia, 2–4 February 2015. [Google Scholar] [CrossRef]
  96. Evdokimov, A.S.; Evdokimov, S.A.; Karandaev, A.S.; Radionov, A.A. Strategy of vibration diagnostic control of mill equipment condition. In Proceedings of the International Conference on Mechanical Engineering, Automation and Control Systems (MEACS), Tomsk, Russia, 1–4 December 2015. [Google Scholar] [CrossRef]
  97. Khramshin, V.R.; Nikolayev, A.A.; Evdokimov, S.A.; Kondrashova, Y.N.; Larina, T.P. Validation of Diagnostic Monitoring Technical State of Iron and Steel Works Transformers. In Proceedings of the IEEE NW Russia Young Researchers in Electrical and Electronic Engineering Conference (EIConRusNW), St. Petersburg, Russia, 2–3 February 2016. [Google Scholar] [CrossRef]
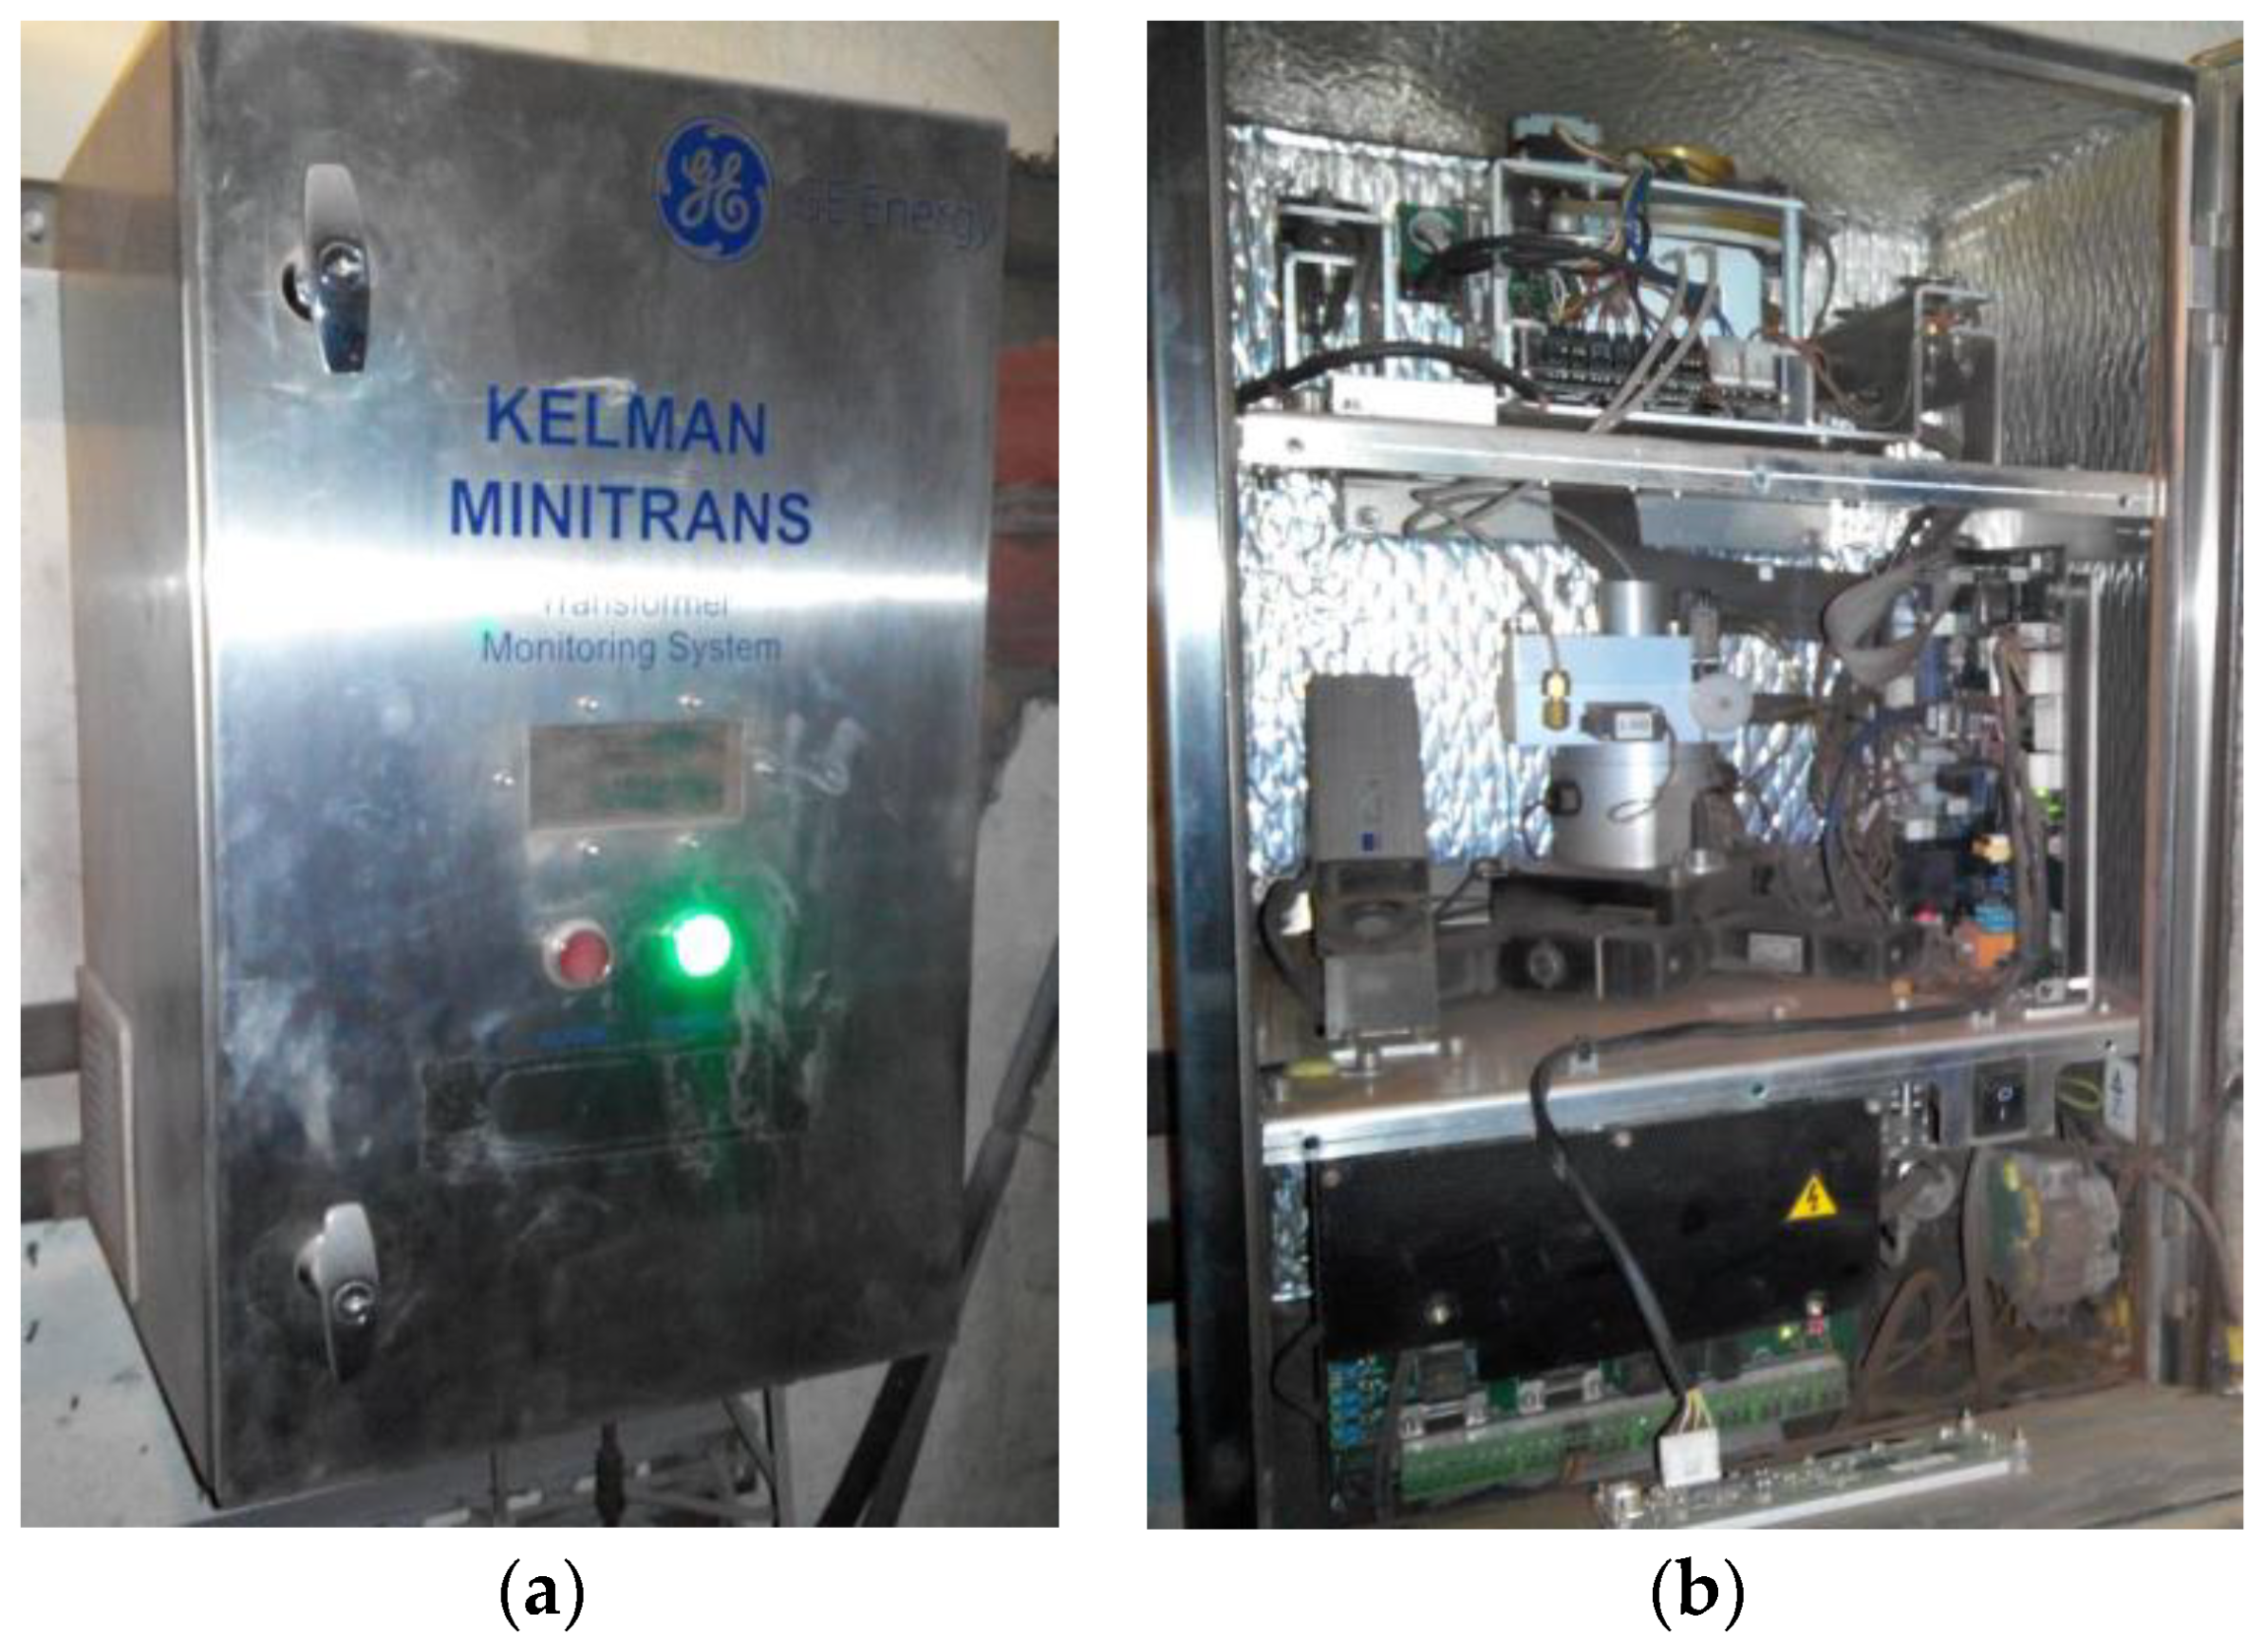
Figure 1. Change in failure tolerance during life cycle.
Energies 16 04630 g001
Figure 2. Minitrans gas analyzer: (a) General view; (b) Design.
Energies 16 04630 g002
Figure 3. Main window of the monitoring software interface.
Energies 16 04630 g003
Figure 4. Online DGA results in the form of points at fixed time instants.
Energies 16 04630 g004
Figure 5. Change in the failure tolerance function at the occurrence of a single defect (a) and several defects and the partial state recovery (b).
Energies 16 04630 g005
Figure 6. The failure rate λ ( t ) and average rate λ ¯ ( t ) change nature, considering repairs and recoveries.
Energies 16 04630 g006
Figure 7. Trends in the online DGA results before and after the recovery: (a) from 1 March 2015 to 13 May 2015; (b) from 1 February 2016 to 27 March 2016.
Energies 16 04630 g007
Figure 8. Changing the transformer resource during the operation before (a) and after (b) maintenance. Curves 1 and 2 correspond to the criteria for the degraded state and pre-emergency.
Energies 16 04630 g008
Figure 9. Change in the relative failure tolerance from 5 February 2016 to 27 March 2016 after the recovery.
Energies 16 04630 g009
Figure 10. Initial (a,c,e,g) and smoothed (b,d,f,h) online DGA results during the monitoring period (5 May 2019–15 March 2020).
Energies 16 04630 g010
Figure 11. Changes to the transformer’s resource (a) and failure tolerance (b), considering the recovery after repair.
Energies 16 04630 g011
Figure 12. View of the furnace transformer windings after dismantling.
Energies 16 04630 g012
Figure 13. Visual examination results: carbon-like debris on the core surface (a) and degradation of the insulation at the windings connection points (b).
Energies 16 04630 g013
Table 1. The Minitrans specifications.
Measured GasMeasurement Limit, ppm
Hydrogen (H2)5–5000
Acetylene (C2H2)3–50,000
Carbon monoxide (CO)10–50,000
Accuracy±10%
Humidity (H2O)0–100% RS (at 25 °C, or measured oil temperature)
Table 2. Diagnostic parameters and the corresponding q values.
Measured   Diagnostic   Parameters ,   Y i q Indicator
Top oil layer temperature0.8
Moisture content in oil1.0
Concentration of gases dissolved in oil0.8
Table 3. Degraded state and pre-emergency thresholds based on DGA results.
No.Parameter Y i D 1 Y i D 2
1Hydrogen content, H250 ppm100 ppm
2Carbon monoxide content, CO300 ppm600 ppm
3Moisture content, H2015 ppm30 ppm
4Acetylene content, C2H25 ppm10 ppm
Table 4. Dynamic factor Kd for controlled parameters.
Diagnostic   Parameter ,   Y i Maximum Kd Corresponding to the Danger Degree
IncreasedHighDangerousCritical
Concentration of gases dissolved in oil1.53.545
Moisture content in oil1.53.545
Top oil layer temperature1.11.21.41.5
Table 5. Gas concentrations before and after repair according to the trends shown in Figure 10.
Measured Gas5 May 201923 December 201910 January 2020
ppmMultiplicityppmMultiplicityppmMultiplicity
Degraded StatePre-EmergencyDegraded StatePre-EmergencyDegraded StatePre-Emergency
Hydrogen (H2)300.60.3901.80.9180.60.18
Acetylene (C2H2)40.80.4102120.40.2
Disclaimer/Publisher’s Note: The statements, opinions and data contained in all publications are solely those of the individual author(s) and contributor(s) and not of MDPI and/or the editor(s). MDPI and/or the editor(s) disclaim responsibility for any injury to people or property resulting from any ideas, methods, instructions or products referred to in the content.