1. Introduction
Transformers are highly efficient electrical machines, with large power transformers boasting efficiencies of over 99%. However, due to their size, losses can still be significant—for example, 0.2% of 500 MVA equates to 1 MW. The standard [
1] specifies that the load losses should be calculated based on the rated power, temperature, and frequency, and provides well-defined methods for measuring and recalculating losses to ensure comparability between units at reference temperatures, regardless of their operating temperature.
Currently, many countries have regulations in place governing transformer efficiency, and others are considering introducing similar regulations. A comprehensive comparison of the different regulations can be found in a report produced for the EU during the regulatory introduction process [
2]. However, new transformers make up only a small percentage of the overall population of transformers, accounting for as little as 1% in some developed countries. Considering the long lifetimes of transformers—which can exceed 50 years—the effects of these regulations may not be measurable for decades. Therefore, improving the efficiency of existing units could have a significant impact. The aim of this paper is to examine the existing fleet of transformers and analyse how different cooling setups and ambient temperatures can influence losses. In addition, the study investigates a novel approach to use the transformer load to trigger the cooling and the potential benefits of using variable speed fans in transformer cooling systems. To the authors’ knowledge, no similar papers have been published on these specific topics.
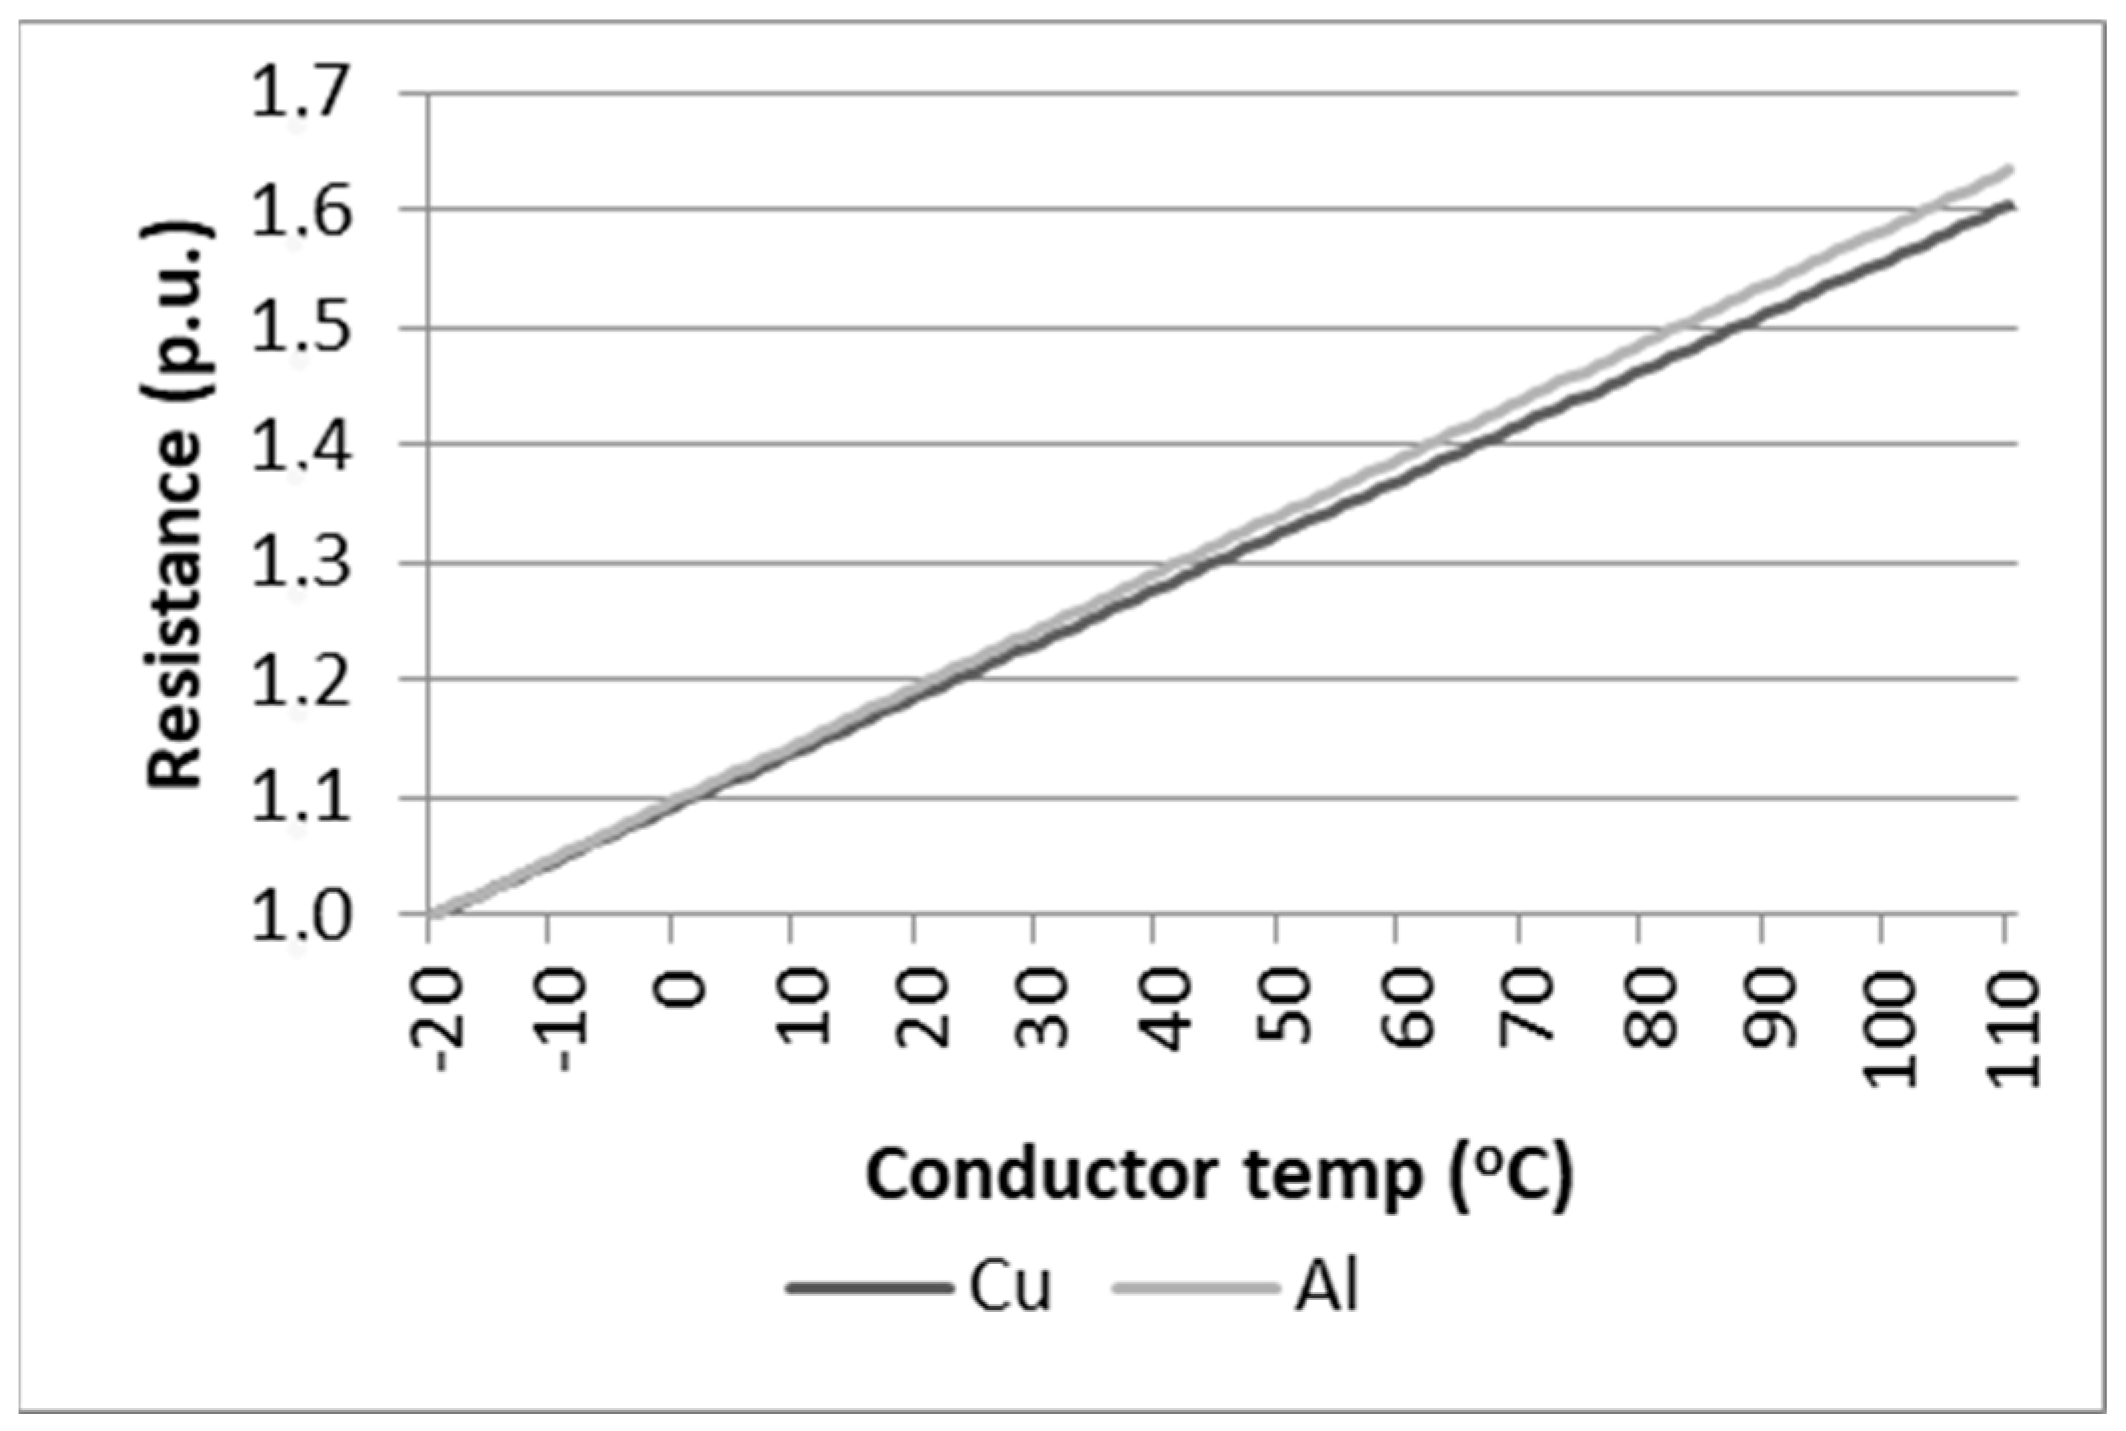
The majority of transformer losses are generated in the copper or aluminium conductors. Both materials have electrical conductivity that is temperature dependent, as illustrated in
Figure 1. Roughly speaking, a temperature increase of 10 K can lead to a 2–3% increase in losses.
During operation, the temperature of the conductor depends not only on the transformer’s loading, but also on the ambient temperature and cooling power. Transformers equipped with only radiators without fans, i.e., one cooling stage, will experience little difference in cooling, but for those equipped with fans, i.e., two cooling stages, the temperatures can be greatly influenced by whether the fans are turned on or off. There is no unique standard on the user side regarding how to set up cooling equipment, and different practices exist even within the different regions of some large companies. Fans mainly function to prevent overheating of the transformer insulation, which can cause accelerated aging.
The influences of temperatures on ageing have been studied in the literature a lot as this is the key to ensuring a long lifetime of a transformer. For example, in ref. [
3] is studied the ageing on actual transformers, while in [
4], extensive small scale laboratory model data are presented. There is research looking into the optimization of cooling equipment setup. In ref. [
5] a CFD study is carried out in which the radiator setup (number of radiators, heights, position of fan) influences the cooling capacity of the cooling battery. Similar research is also carried in [
6], but on a distribution transformer corrugated tank where the transformer tank is also designed for cooling. The influence of hot spot to ageing based on different scenarios was studied in [
7]. In ref. [
8], there is shown a comparison of the influence of ambient temperature on the efficiency of transformer using two different locations—a colder and a hotter one. The calculation was carried out based on representative days for each month without any changes in the cooling setup. It shows a better performance of the transformer in the colder region. Paper [
9] describes a dynamic and static calculation of a transformer with a changing ambient temperature and different cooling setup. The paper is not focused on efficiency, but on temperatures and ageing.
There are several papers discussing the influence of solar radiation to transformer temperature rise. In ref. [
10], it is presented how a shed was used in Oman in order to reduce the temperature around the transformer and transformer oil temperature. Paper [
11] calculates the temperature increase caused by sun radiation; the increase in loss is mentioned but not calculated. The focus is on accelerated ageing. In ref. [
12] a distribution transformer is studied. It shows the effect of sun radiation on the temperature rise in the transformer and the accelerated ageing caused by this. Only a single day curve is analysed. The effect of adding a shed is studied. The comparison of transformer placed outside or inside is given in Ref. [
13]. The influences of wind and solar radiation are included in the analysis. The focus of the paper is the difference in the temperatures of the oil. A more practical work is shown in [
14], where a group of transformers is analysed to estimate the influence of solar radiation. The paper also gives some ranges of possible savings.
Different calculation approaches are studied in order to simplify the dynamic calculations. Such efforts are shown in [
15]. Dynamic modelling of a transformer with a simplified loading curve is presented in [
16]. Different scenarios are analysed in order to find an optimum. Both the energy efficiency and ageing are taken into consideration. Paper [
17] brings the idea of controlling the coolers via the loading level of transformer. It brings simulation results for a 24-h period. In the studied 24-h period, it can be seen that the ageing is reduced. Paper [
18] describes a possible implementation of such a system as a backup solution in case the temperature sensors fail. How the data about actual transformer temperatures can be used in order to increase overloadability of transformers is described in [
19]; this paper shows the practical value from optimizing the cooling beyond the requirements for ageing. A system such as the one shown in [
20] can assure that the decision can be made in real time and that there can be additional optimizations on a fleet level, such as predicting power surges, weather, or similar.
This paper aims to study how transformer efficiency is influenced by ambient temperatures and cooling settings in order to understand if and how the users of existing transformers can influence the transformer efficiency. Special care will also be taken to assess the accuracy of the nameplate data in calculating efficiency. The study will be conducted over a period of more than a year to better assess the overall influence of all combinations of load and ambient temperatures. The same transformer will be studied using two different ambient temperature datasets and three different loading curves. As shown in the literature overview, previous research was focused mainly on the influence of cooling setup on ageing. In this paper, all those influences will be studied to see the influence on the power efficiency. In addition, different concepts such as the load driven cooling operation shown in [
16] will be studied in detail, as well as variable speed fans. It will be possible to compare the influences and have a better understanding on how to improve the energy efficiency for a transformer. It is well known that cooler transformers have lower losses in the conductors, but as it requires energy for the fans to cool the transformer, it is needed to check when it is economically wise to turn the fans on.
2. Materials and Methods
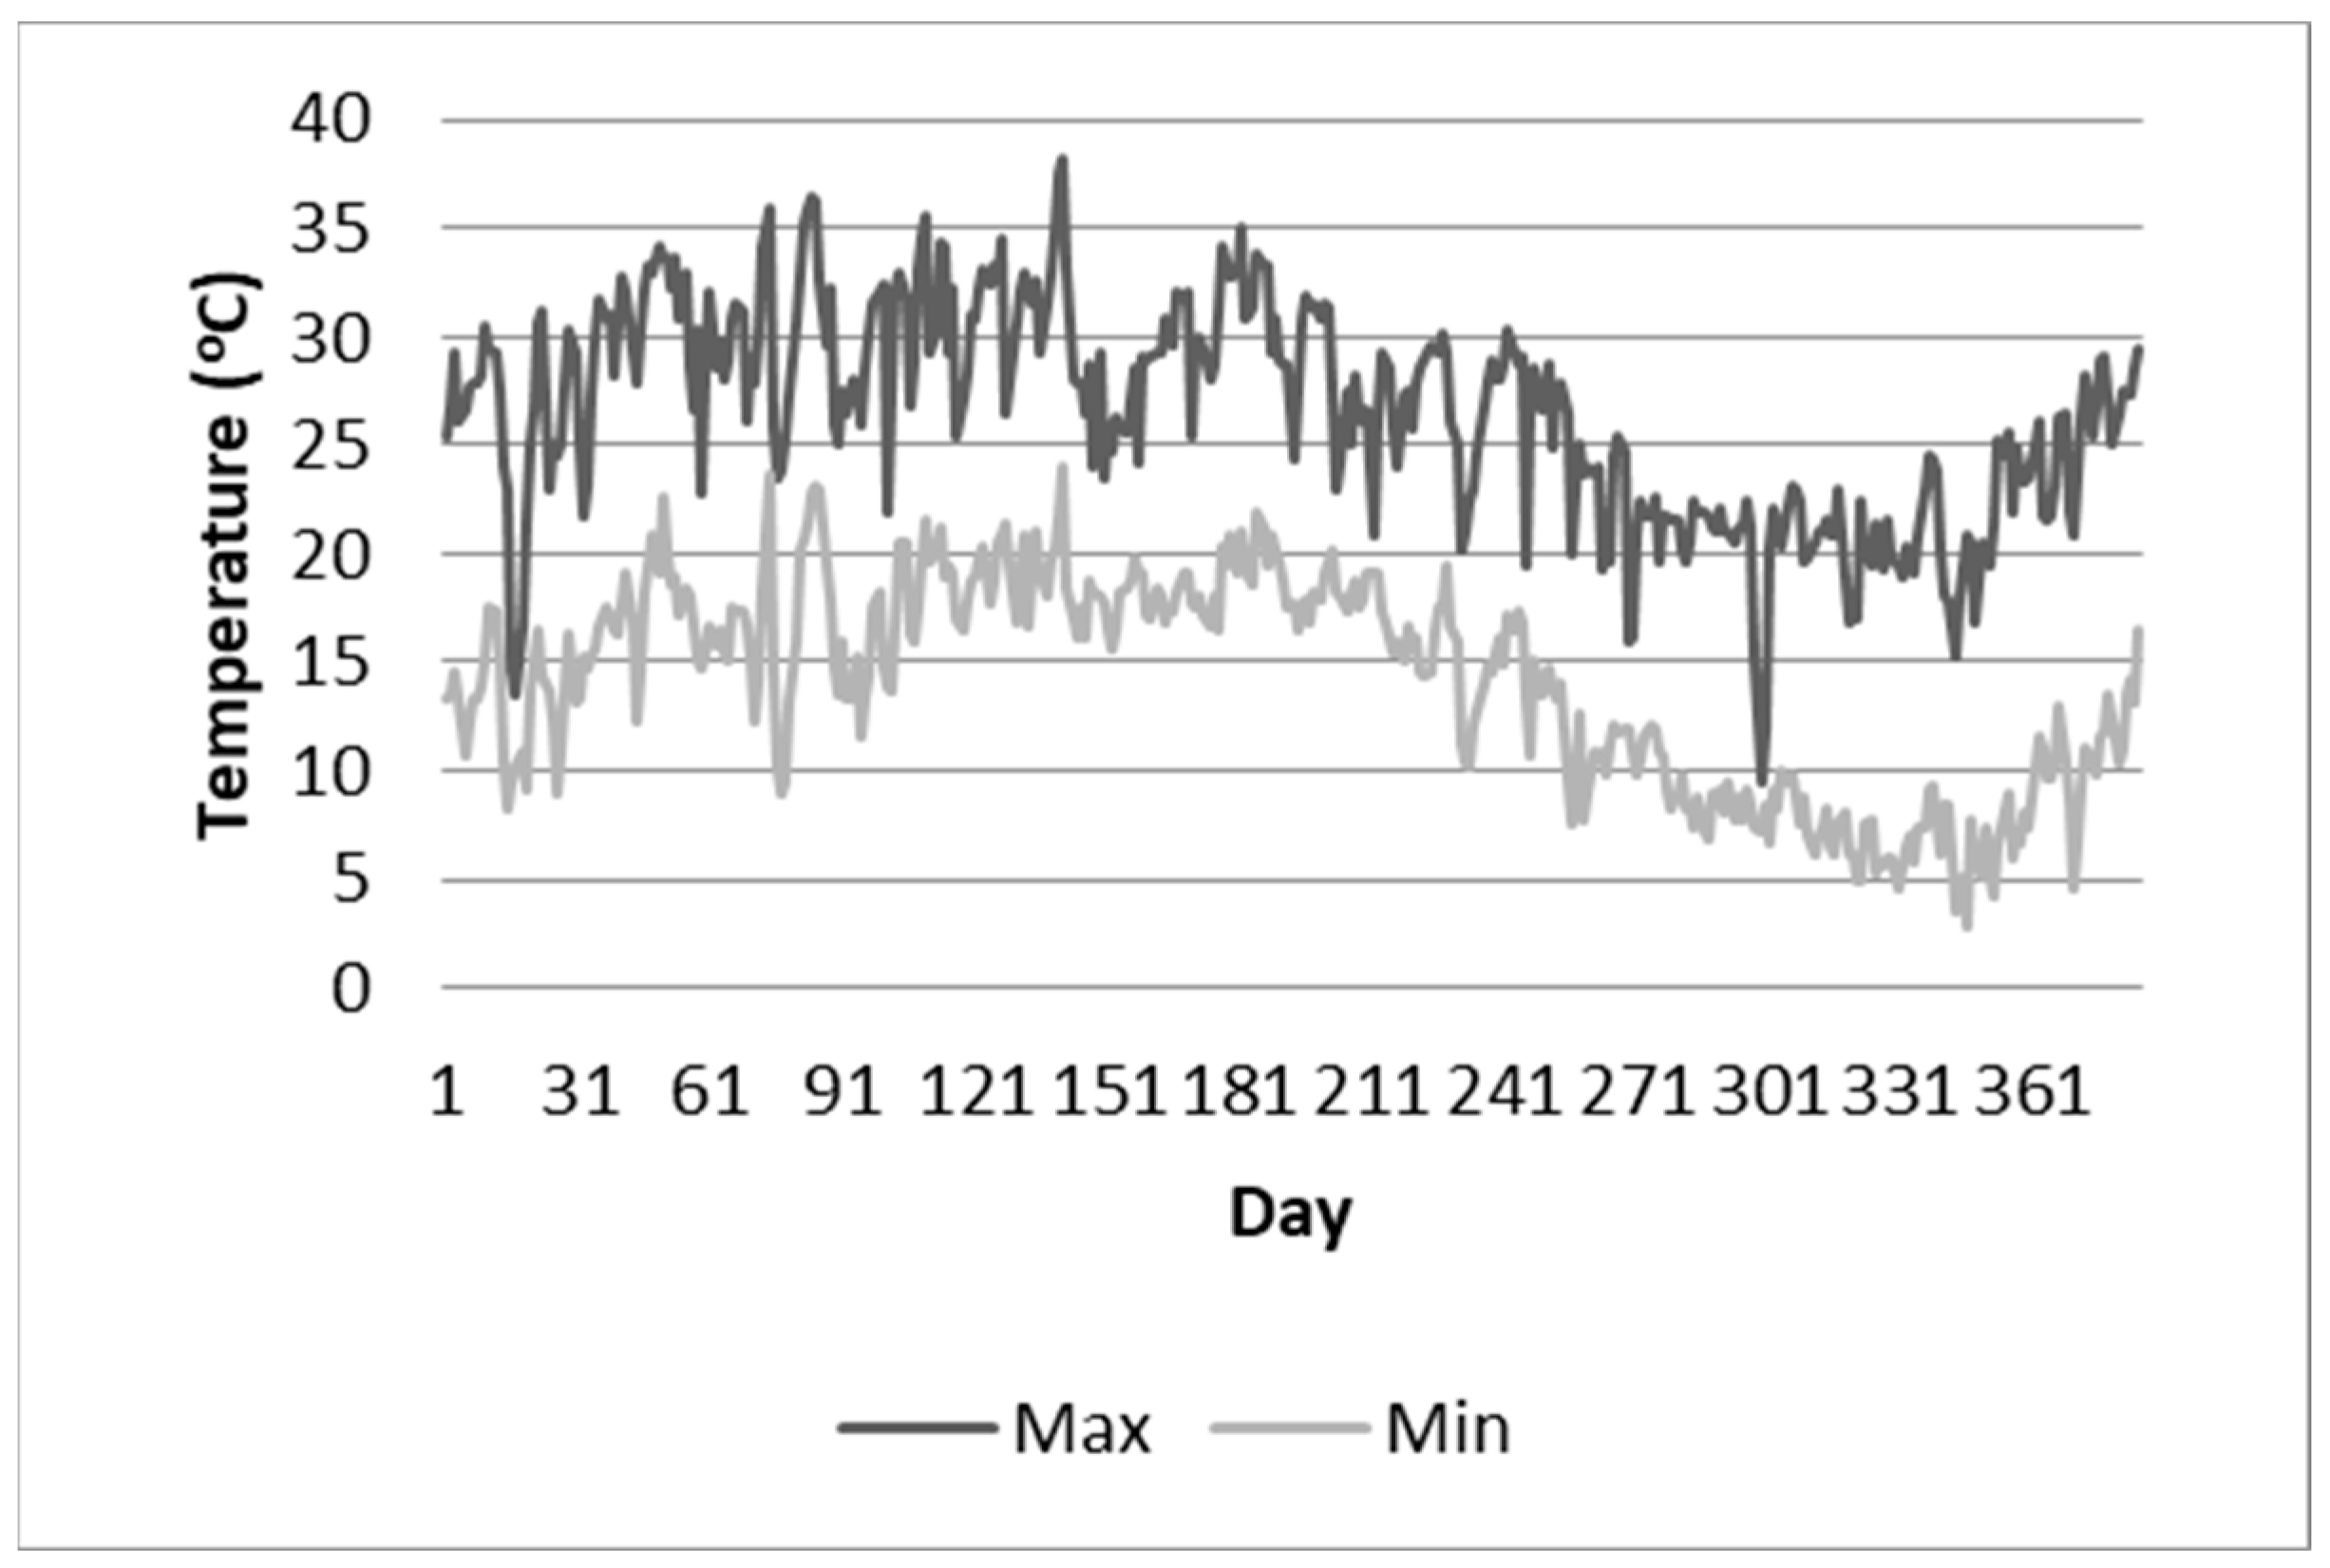
The analysis presented in this paper was conducted as part of a study within the framework of the CIGRE Working Group A2.56 Power Transformer Efficiency. To provide a comprehensive understanding of the impact of the ambient temperature and cooling settings on transformer efficiency, two temperature profiles were selected. The first profile represents a hot ambient environment based on temperature measurements in the Republic of South Africa (
Figure 2), while the second profile represents a cooler ambient environment measured in Canada (
Figure 3). In order to compare the results accurately, all ambient loading data and loading curves were adjusted to start with the same season, given the two locations are on different hemispheres. To ensure the analysis was based on realistic scenarios, the loading profiles were collected from various utilities over a period of 13 months, and three loading cases were selected for the calculations.
The temperature and loading measurements were taken at hourly intervals, and steady-state calculations were performed at each point to determine the losses based on the actual loading and ambient temperature. The fans were turned on or off at each point to simulate the different cooling system settings.
Surely, a transient calculation would be more precise, but currently such models are still very time expensive. The selected model was able to calculate a big number of variants with a good quality to provide a picture of the influence. The main purpose of the analysis was to indicate the trends and potential for improvement and not to give an exact figure.
Three loading cases were selected for the calculation. The characteristics are shown in
Table 1. It is apparent that loading case 1 (LC1) is a very highly loaded transformer, loading case 2 (LC2) is moderately loaded, and loading case 3 (LC3) is a lower loaded transformer.
For all calculations, a 520 MVA transformer was used. Its parameters are shown in
Table 2.
In reality, there are various means of managing the status of fans in a transformer, such as the:
Oil Temperature Indicator (OTI),
Windings Temperature Indicator (WTI), or
fibreoptics installed in the windings to show the real winding temperature/hot spot temperature.
For the purpose of this analysis, the cooling system will be simulated as being operated by the means of the top oil temperature. Normally, the turn-on temperature is set to a lower value than the turn-off temperature to prevent any loops in turning on and off the cooling. However, for our analysis, there will be only one temperature considered. A check was conducted to ensure that this simplification did not have any significant influence on the results.
3. Results
3.1. Ambient Influence
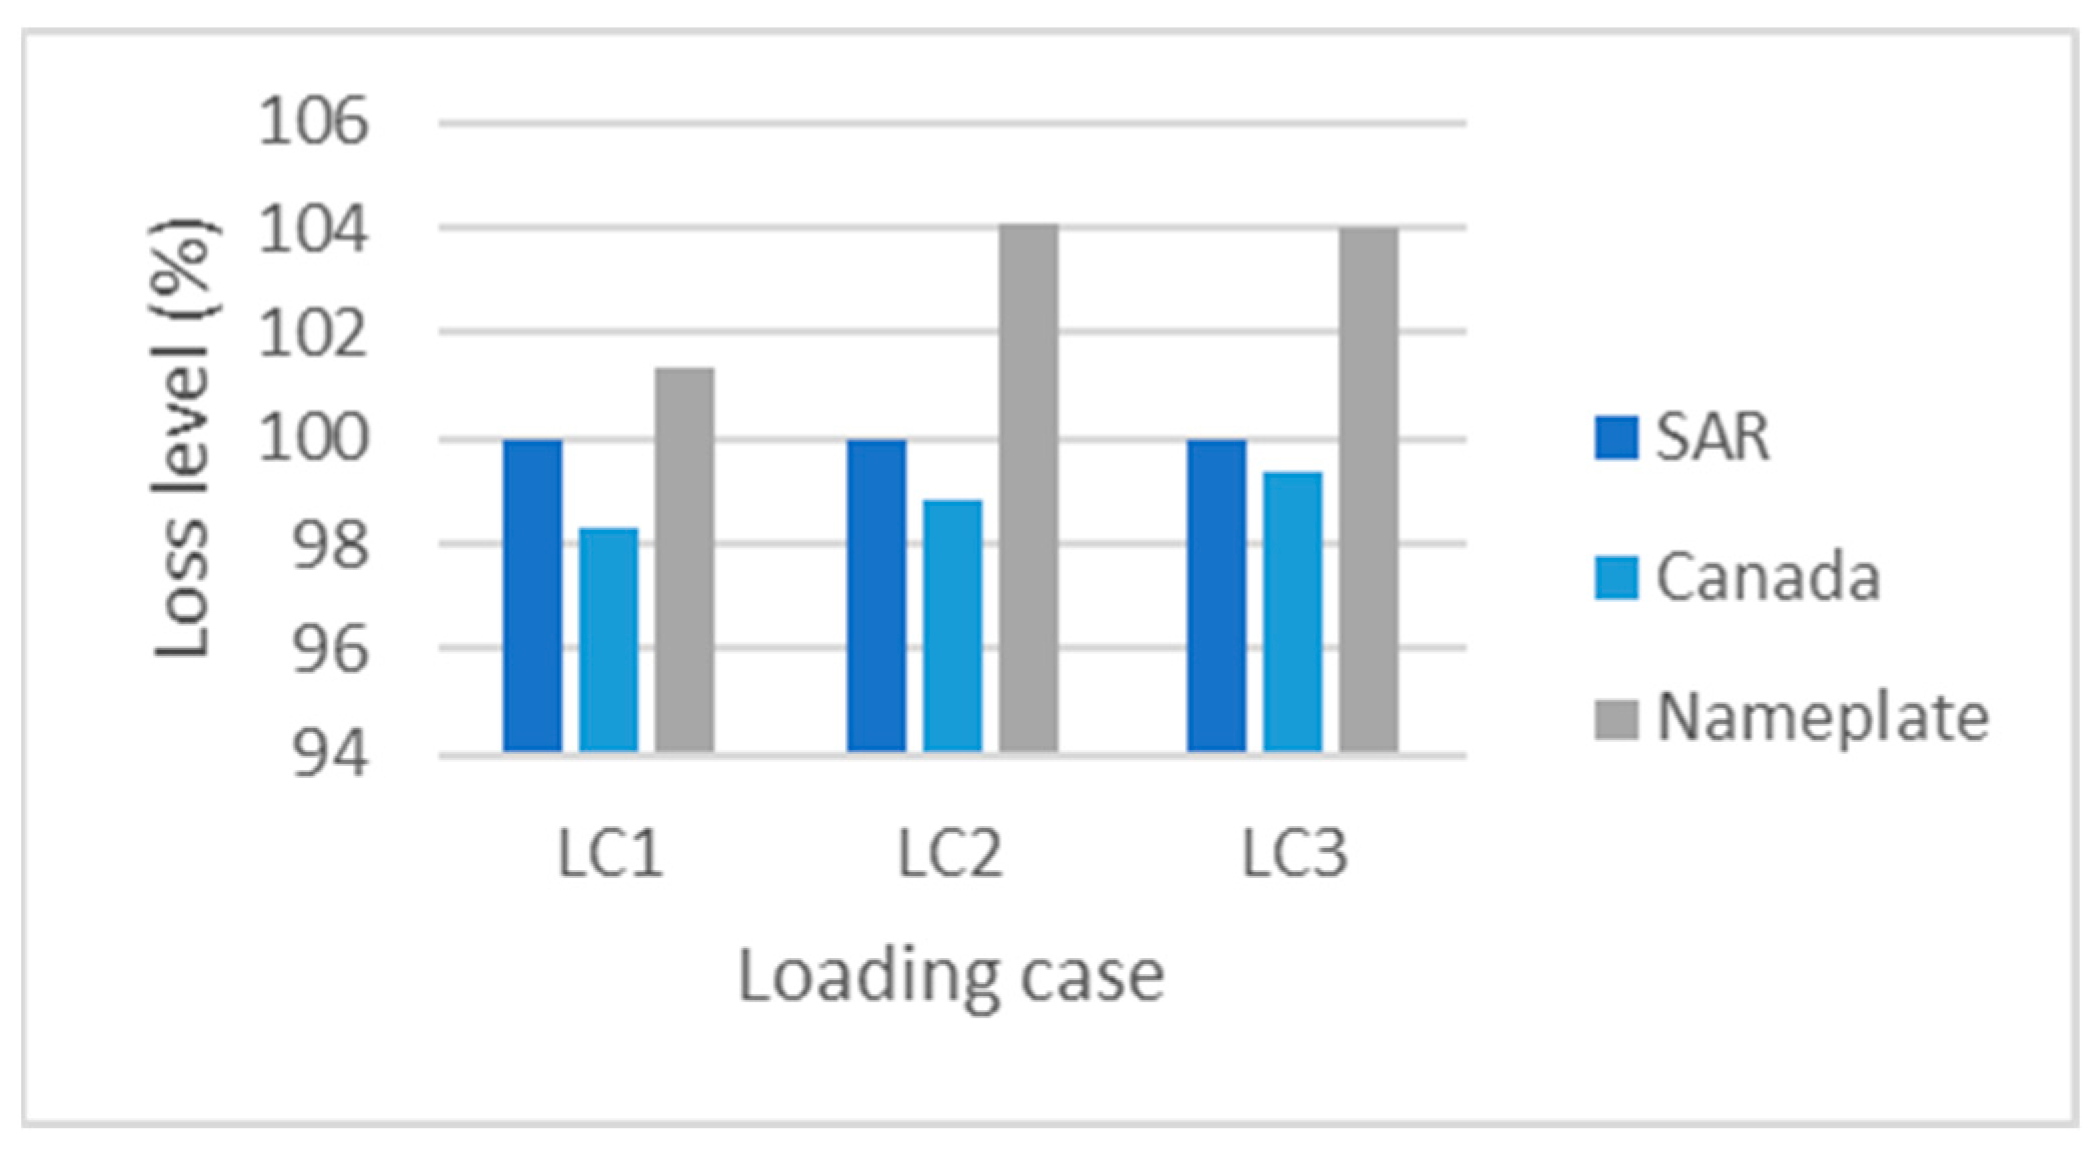
Firstly, a preliminary investigation was conducted to assess the impact of using real winding temperatures on efficiency and how different ambient temperatures influence the results. It is important to note that the transformer design considers multiple requirements such as dielectrics, forces, cooling, losses, and noise. Some of these requirements are in direct contrast with each other, and the optimal design is achieved by finding a balance between them without pushing any individual parameter to its limit. Therefore, in some cases, windings may be less thermally loaded, resulting in lower losses in service, the standard is recalculating losses on the referent temperature, typically it is 75 or 85 °C. However, due to the calculation method, these lower losses are not directly visible to the customer and are instead represented on the transformer’s nameplate and used for the calculations. In reality, the winding temperature changes during operation, affecting the resistance of conductors and losses. For this analysis, the fans, representing the second cooling stage, were turned on when the oil temperature reached 65 °C. The results of this analysis are illustrated in
Figure 4.
The analysis shows that the losses in the hot ambient temperature for the highly loaded transformer LC1 can be almost 2% higher than those in the cold ambient temperature. However, more striking is the fact that the losses calculated using the nameplate data can be up to 4% higher than those in the hot ambient or over 5% for the cool ambient (LC2). It should be noted that fan losses are not considered for the case of nameplate losses, so the difference would be even greater if they were included. The loss structure, which will be presented in the next section, also affects the differences in losses.
The significant difference in losses should be taken into account when making calculations. It is clear that the ambient temperature has a visible influence on losses and that actual losses may be considerably lower than those calculated from the nameplate.
Table 3 shows the absolute difference in losses, as well as the structure of the losses (QNLL—no load loss, QLL—load loss, Qaux—auxiliary losses). The differences in the no load losses between the loading cases are due to the varying number of hours the transformer was in operation. No load losses range from 29% up to 47%. This information is important because the no load losses are not temperature dependent, and all future calculations will not affect this part of the losses.
The analysis of the transferred energy during the 13-month period revealed that LC1 transferred 2901 GWh, LC2 transferred 1805 GWh, and LC3 transferred 1395 GWh. This indicates that the losses were approximately 0.2% for LC1, 0.17% for LC2, and 0.1% for LC3. Assuming a price of electricity of EUR 35/MWh, the cost of losses ranges from EUR 84,000 to EUR 196,000, which highlights the importance of minimizing losses.
It is worth noting that the ambient temperature is highly dependent on the position of the transformer in the plant area. Therefore, the logical question arises of whether a different orientation of the transformer box, with higher walls or protection from cooler winds, could significantly impact efficiency. In practical experience presented in [
10,
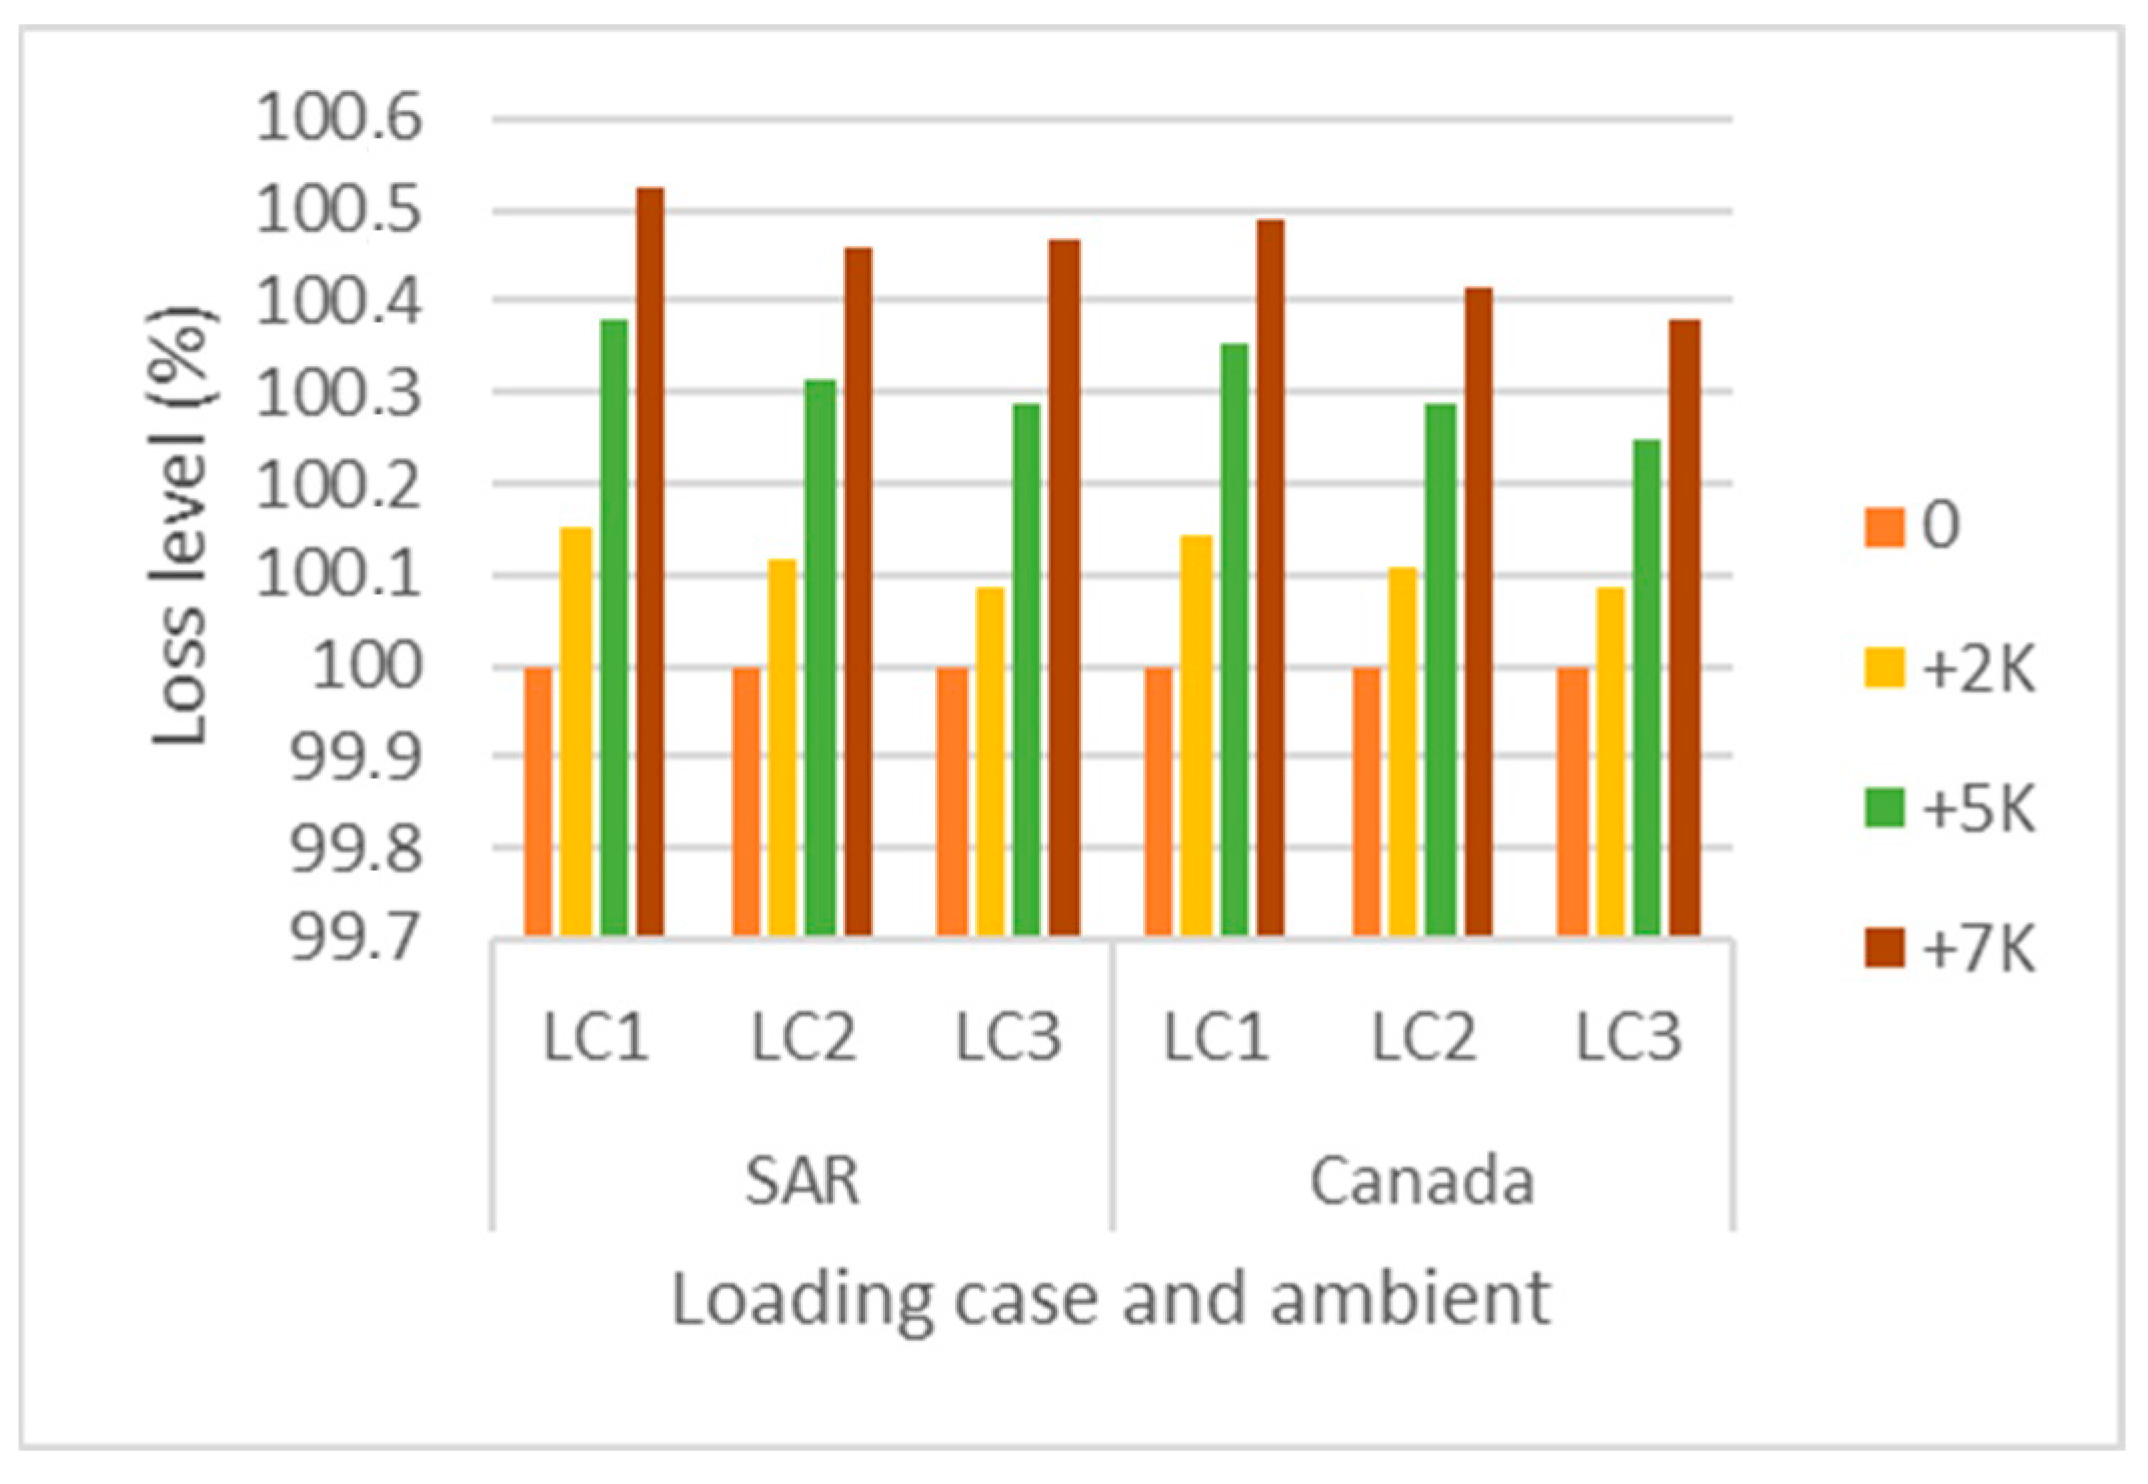
11], the application of sheds was shown to lower the temperature around the transformer and increase efficiency. To simulate this condition, a simplified case was analysed, increasing the temperature in the period of 9 to 19 by 2, 5, and 7 K each day. The results, presented in
Figure 5, showed that such an increase has a much lower influence than the difference in the ambient temperature profile. Although the difference in this case is small, it is worth considering such topics during construction, as some changes might not incur additional costs and could provide benefits for the total lifetime of the transformer.
3.2. Two-Stage Cooling Temperature
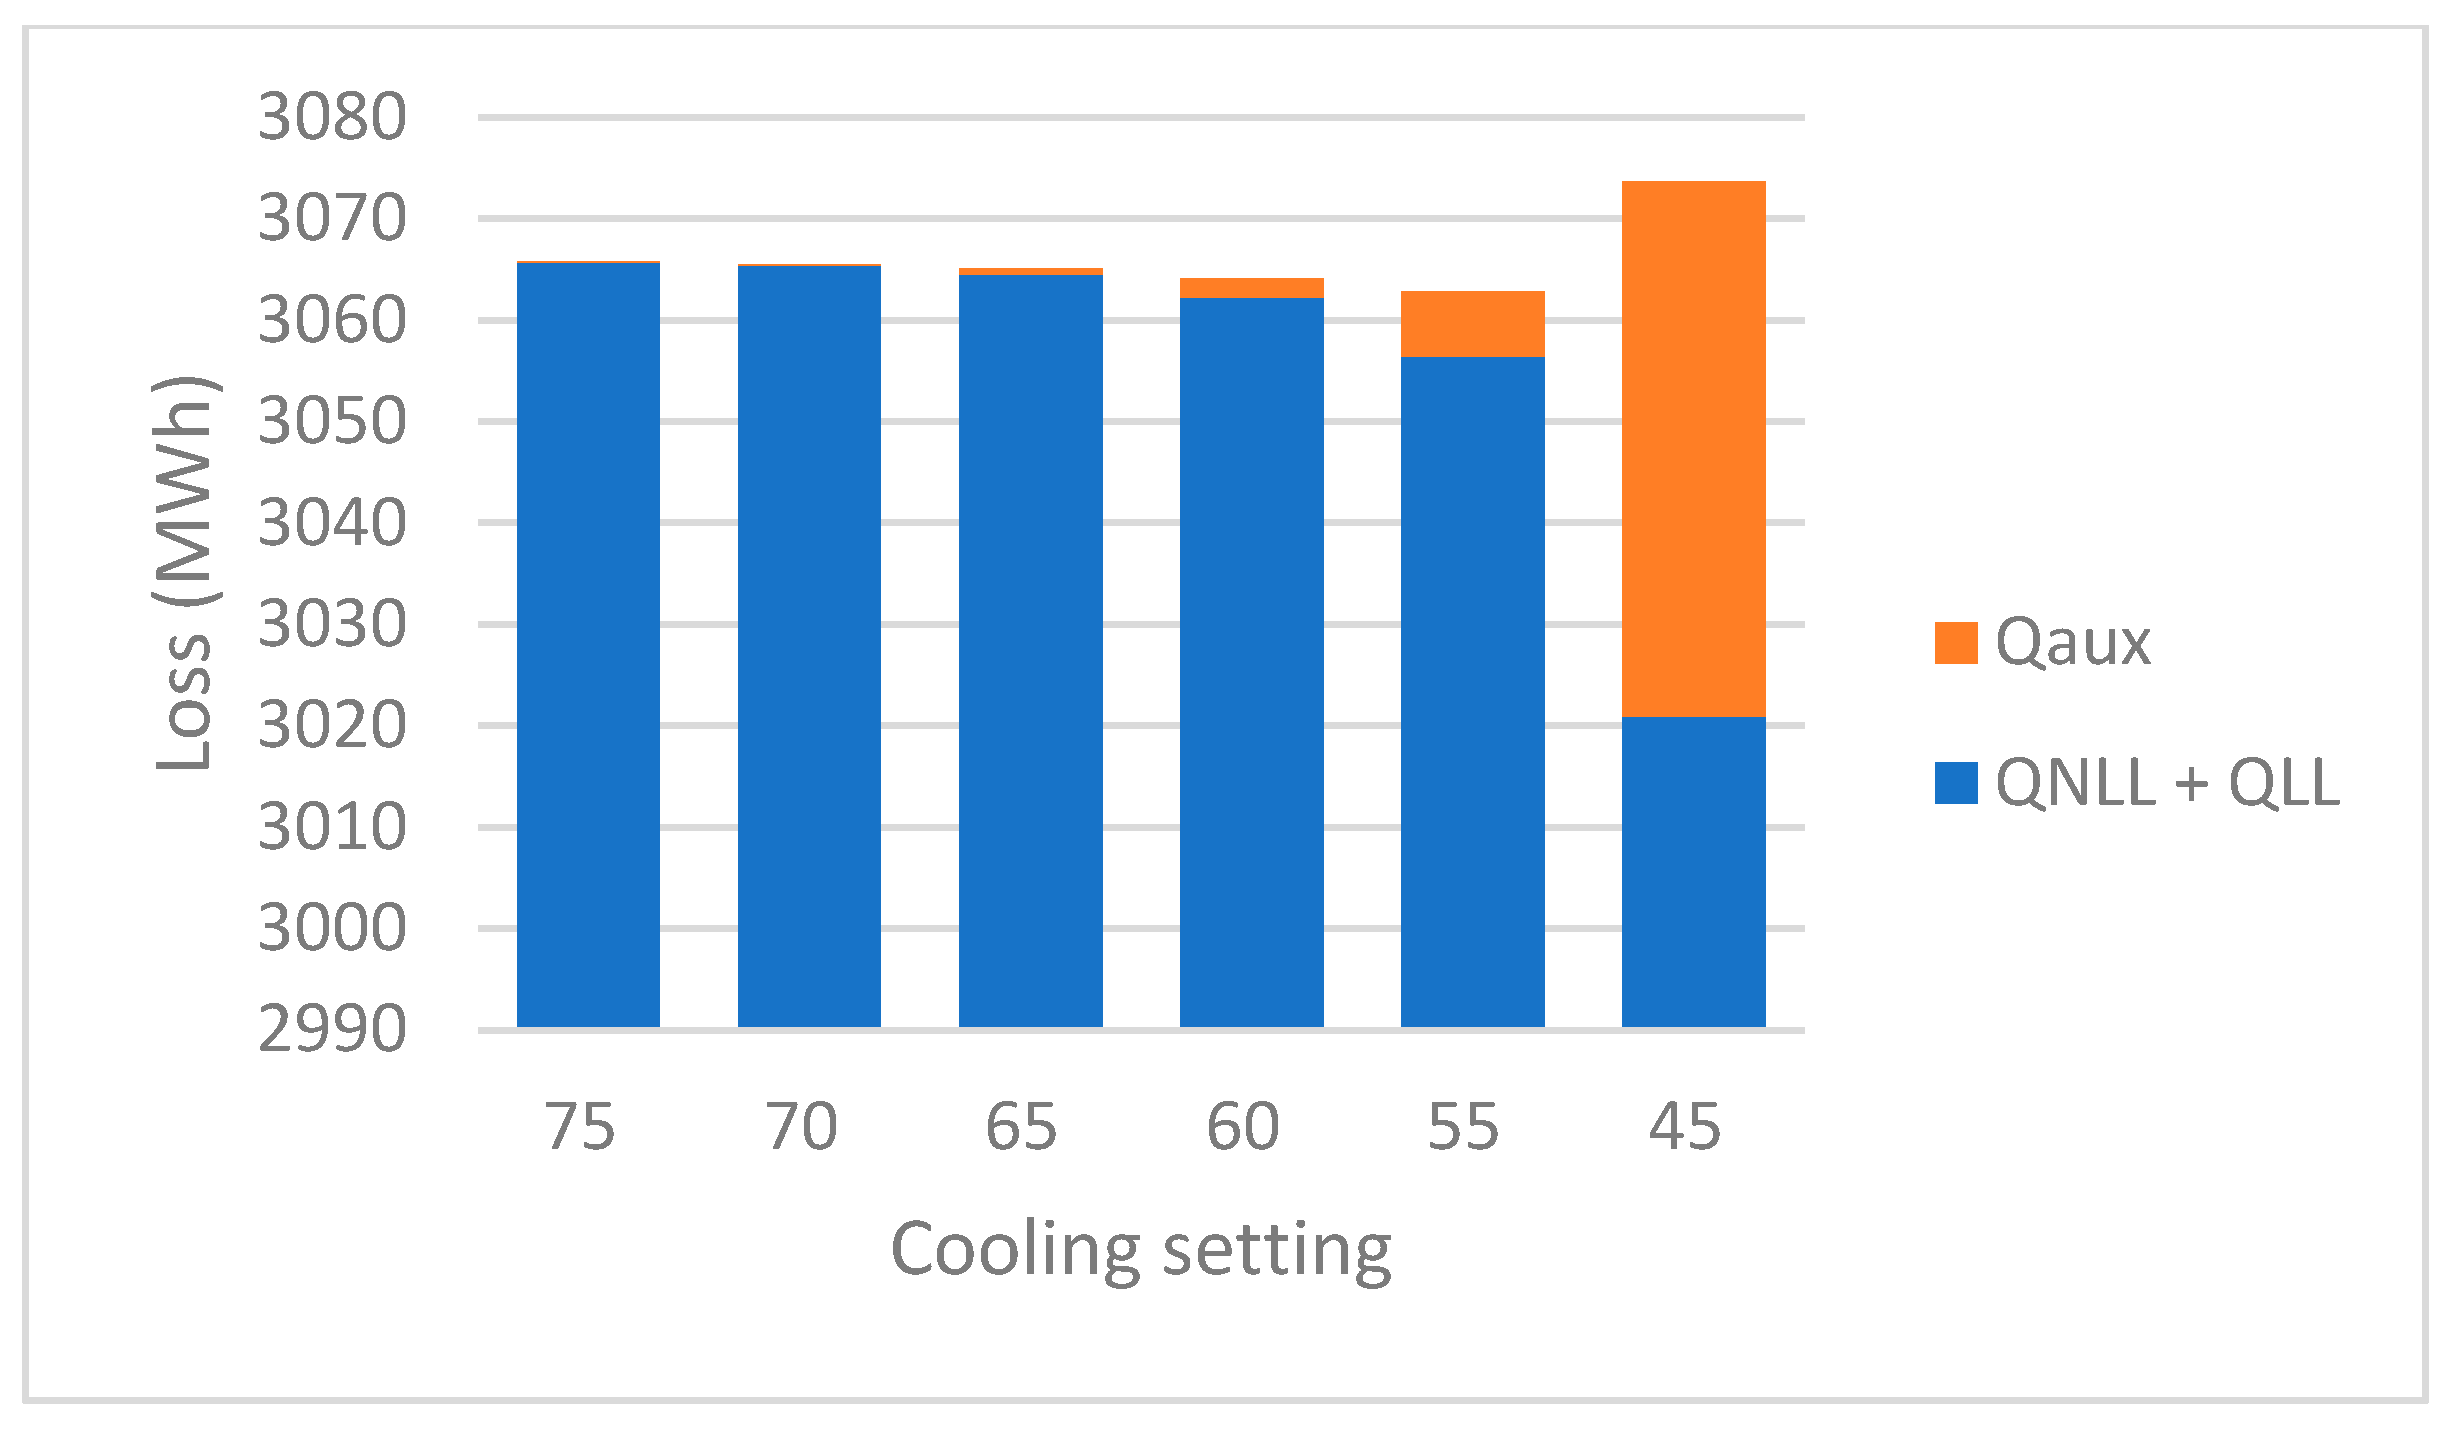
The study also investigated the impact of different temperature settings for the second cooling stage on losses in the same transformer. Turning on the fans results in a temperature decrease of 10–20 K for both the oil and conductor, leading to a reduction in conductivity and losses of around 2–6%. The losses were analysed for both hot and cold ambient temperatures, with turn-on temperatures ranging from 45 to 75 °C. Typically, the turn-on temperature is set between 60 and 70 °C.
As shown in
Figure 6 for hot ambient and
Figure 7 for cold ambient, the difference in losses is up to 1% for the extreme temperature settings, but within the typical range, the differences are smaller. Interestingly, the change in losses does not always follow the same direction in all loading cases, suggesting that there is no one-size-fits-all solution. However, it is worth noting that adjusting the temperature setting is a relatively simple task that can be performed by any maintenance team.
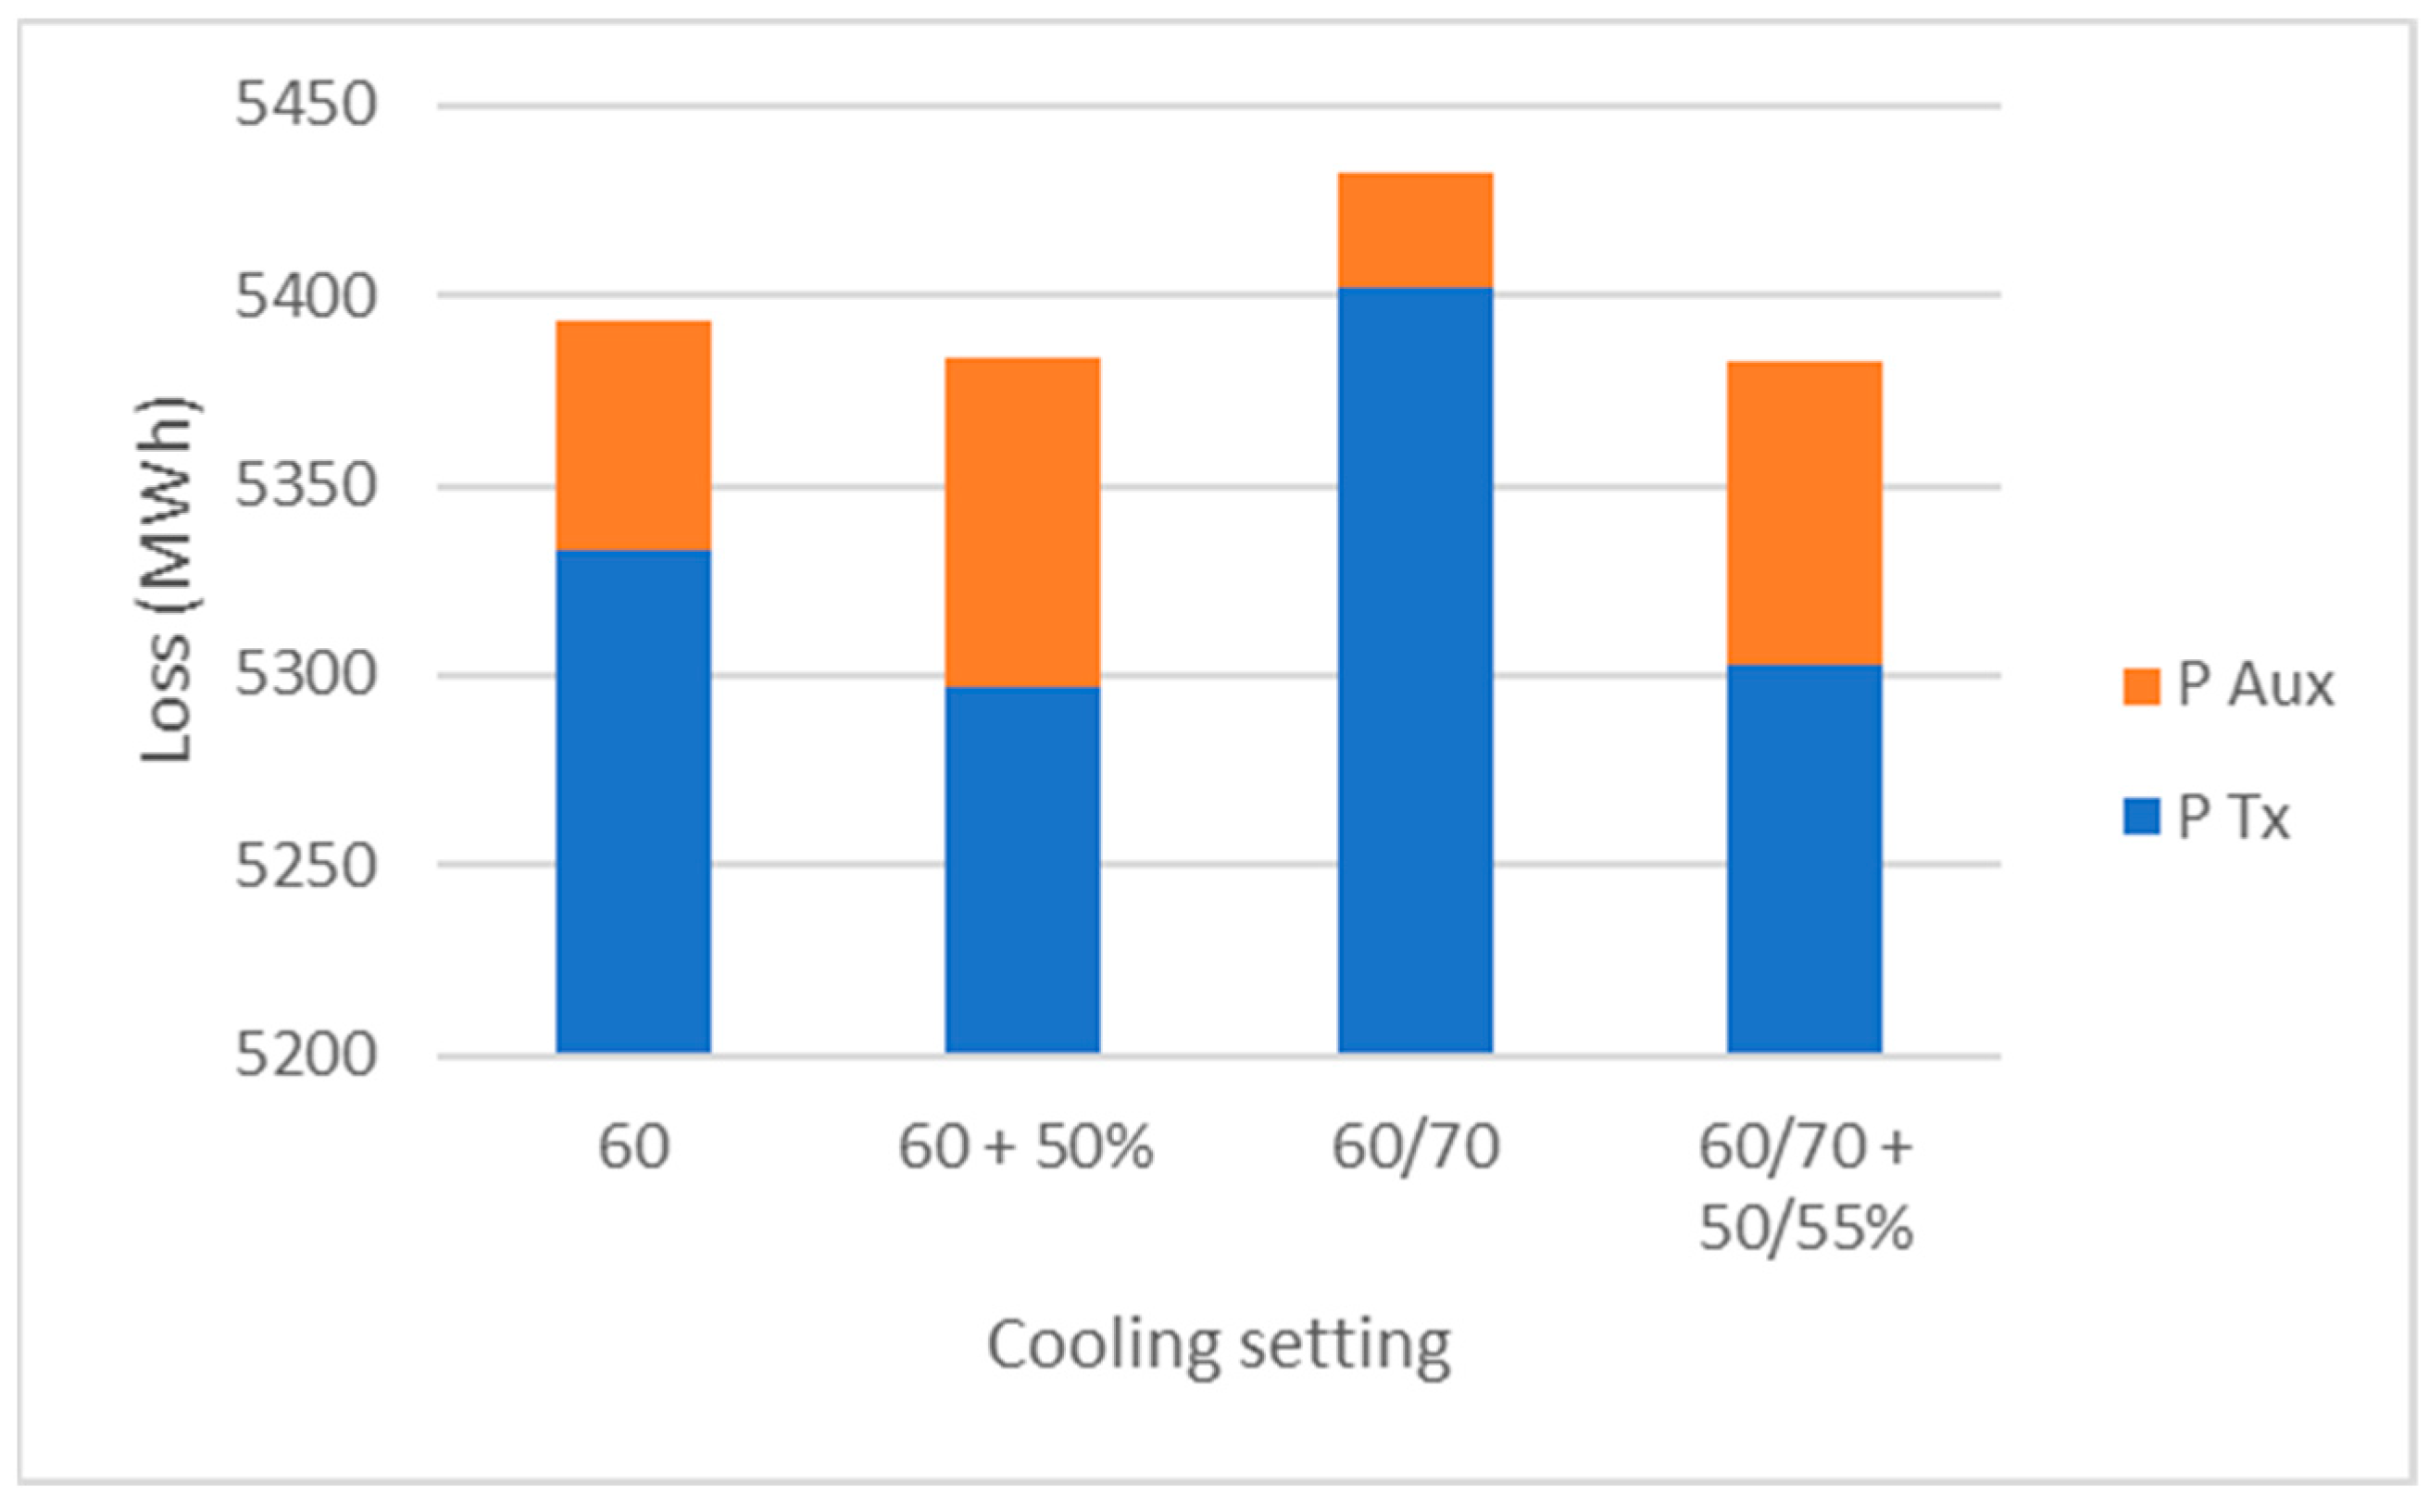
To gain a better understanding of how the different temperature settings for the second cooling stage can impact the transformer, the losses’ structure is presented in
Figure 8. Although the overall losses remain the same or close to it, the load losses decrease while the energy consumed by fans increases. It is worth noting that although losses in the transformer decrease with lower temperature settings, the decrease in losses is offset by the increase in losses generated by fan energy consumption. The ratio of no-load losses, load losses, and cooling (auxiliary) losses plays a significant role in how the efficiency changes with the cooling setup. As demonstrated in the next graph, the overall losses may remain the same, but the losses inside the tank differ.
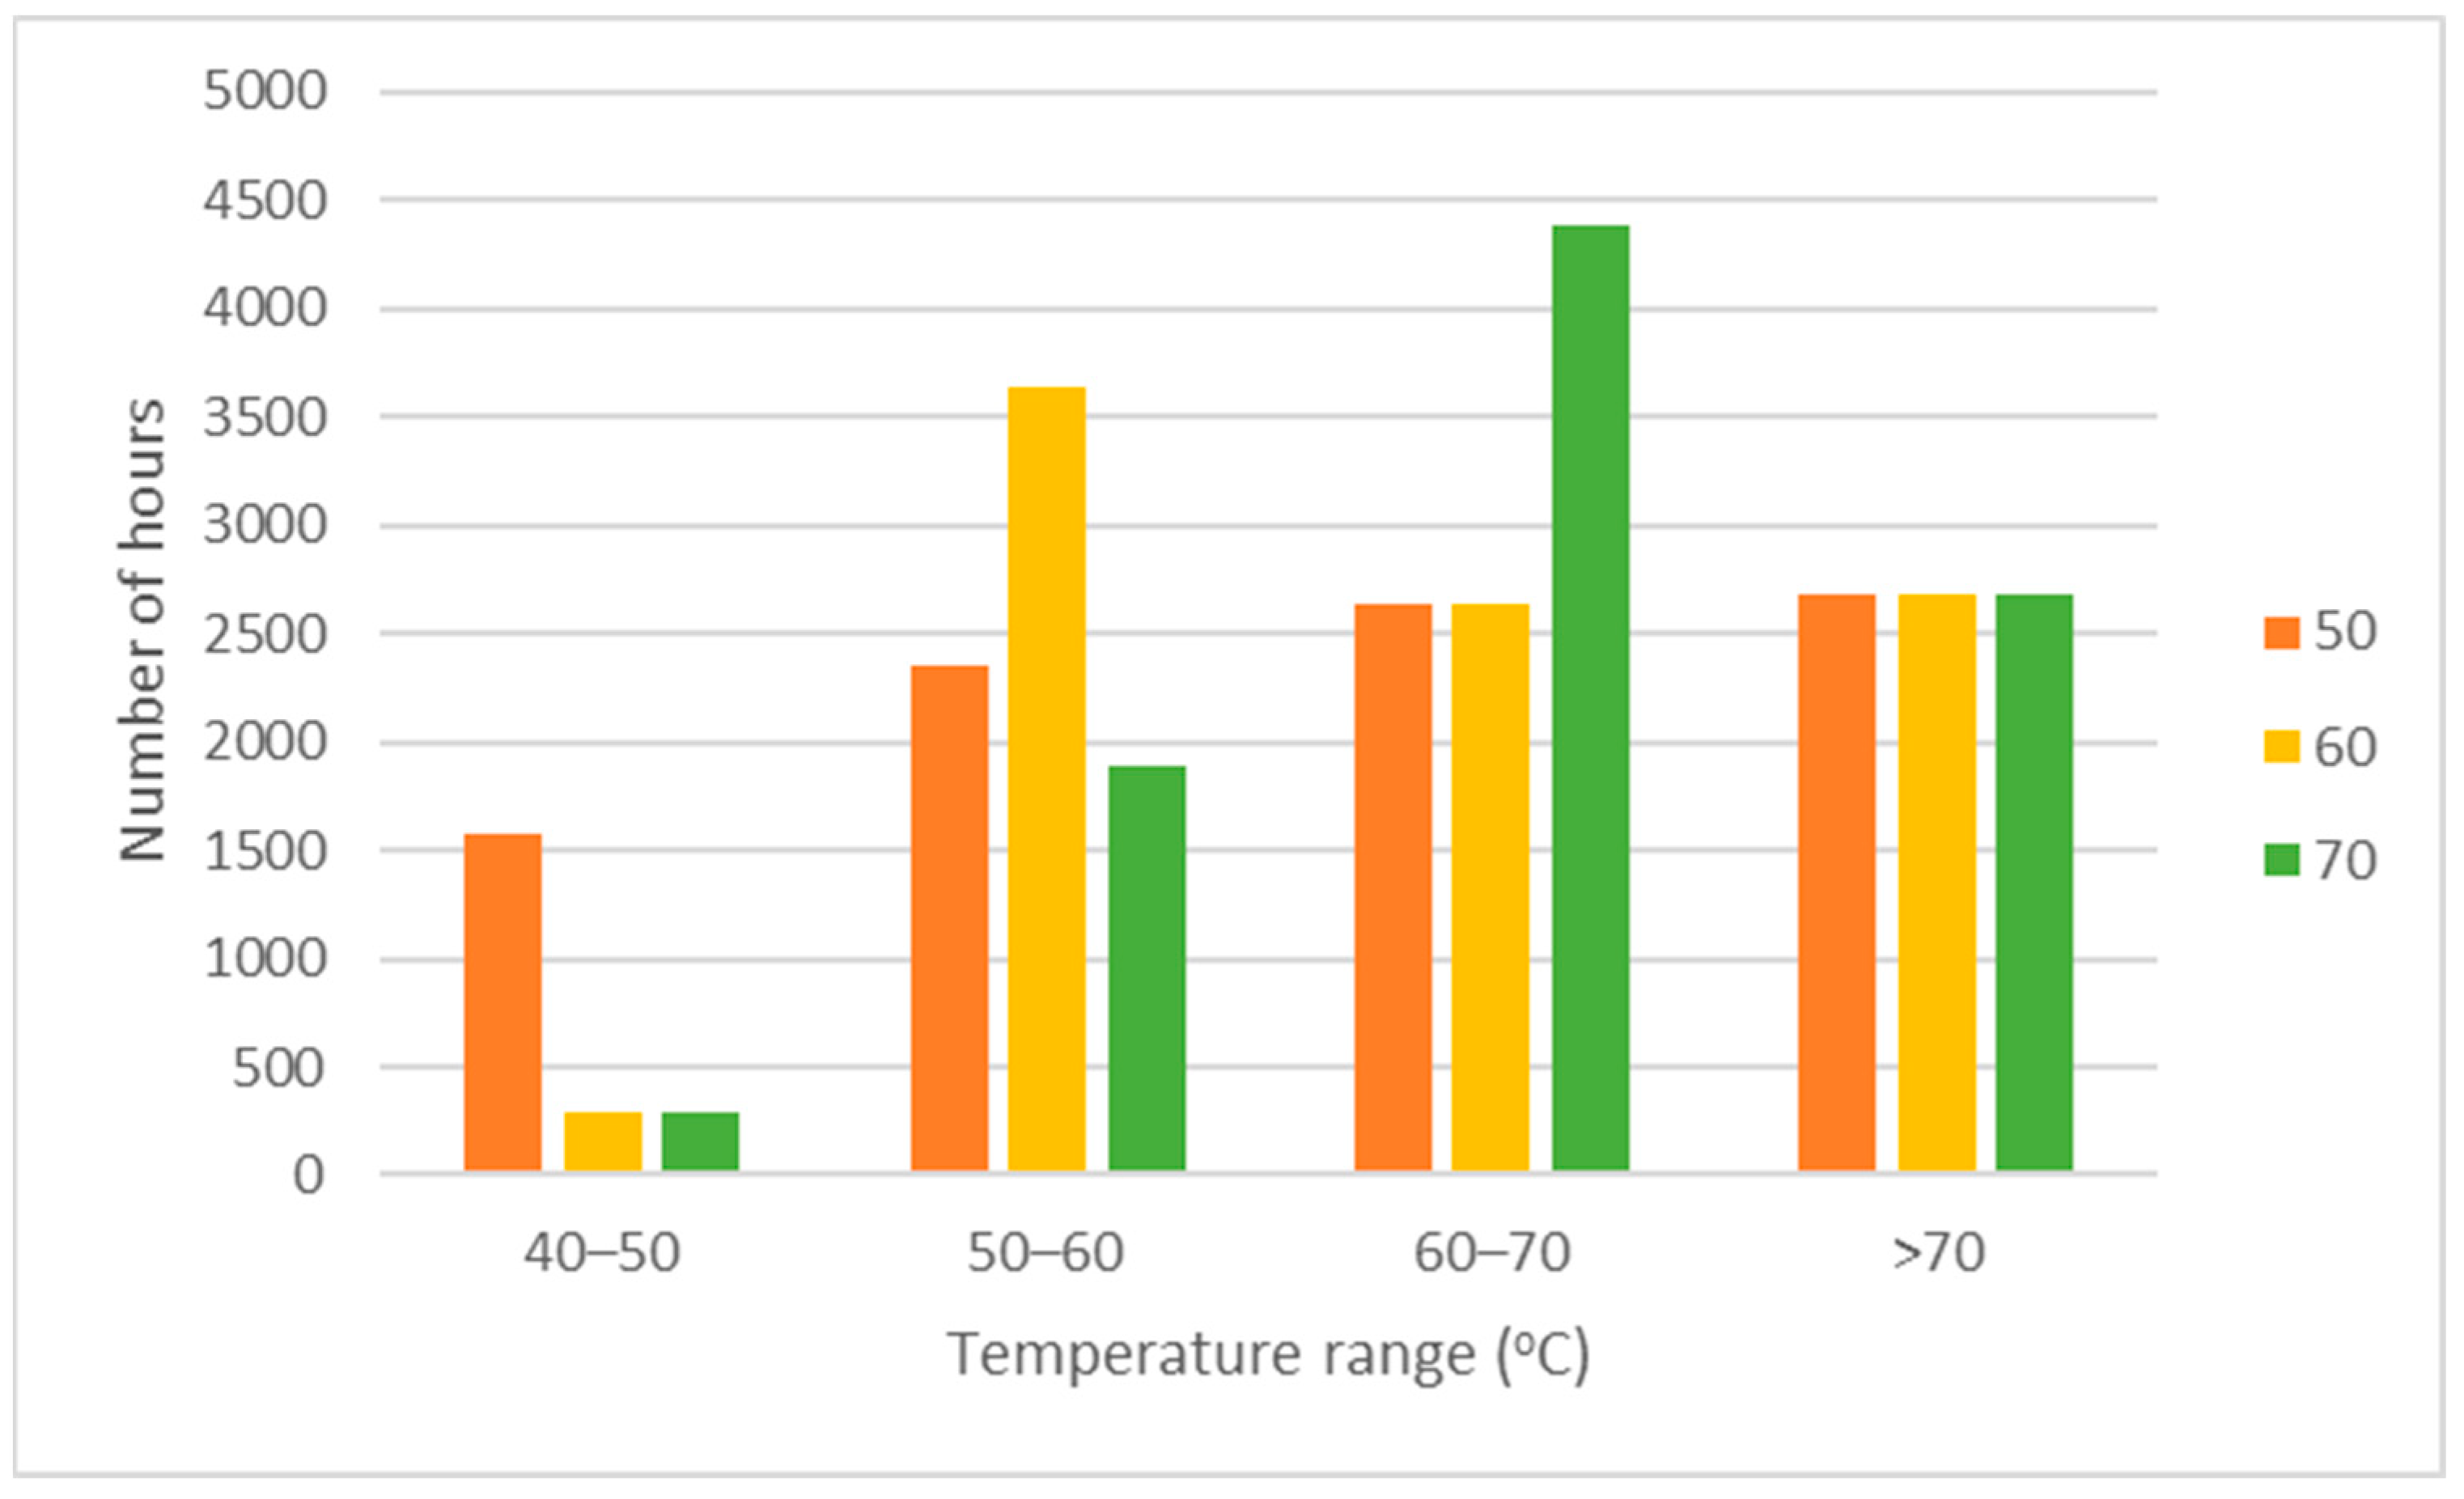
It is crucial to understand the impacts of these differences on the transformer, especially with regard to aging. As previously explained, aging is a crucial factor to control temperature in the transformer. In
Figure 9, the top oil temperature distribution during the analysed period changes for different cooling settings for LC2 in the cold ambient temperature. With lower top oil temperature settings in the cooling equipment (50 °C), the number of hours in the higher top oil temperature range (50–70 °C) decreases and switches to a moderate top oil temperature range (40–50 °C). If we consider that each 6 K doubles the speed of aging [
21], the reduced number of hours’ influence on the transformer’s aging can be significant.
Moreover, a cooler transformer allows for a longer period of overload without risking damage or excessive aging of the transformer, thereby providing greater safety and flexibility for network operators.
Figure 10 shows the top oil temperature distribution for LC1 during hot ambient temperatures, where the impact of different top oil temperature settings for the cooling equipment appears to be less significant. Regardless of the temperature setting, the number of hours when the transformer experiences top oil temperatures over 70 °C remains the same. However, the differences can be observed in the lower top oil temperature range (50–70 °C). This is because the loading case has a long period of high load, during which the cooling is always active and no difference can be seen. However, for the lower top oil temperature range (60–70 °C), the number of hours is reduced, and the transformer is switched to the moderate top oil temperature range (50–60 °C). This decrease in the number of hours spent in the 60–70 °C range also compensates for the accelerated aging during the overload period, as explained in [
22].
3.3. Three-Stage Cooling Temperature
An additional simulation was conducted to investigate the performance of a three-stage cooling setup on the same transformer. In this setup, all the fans are turned off in the first stage, and when the temperature reaches a certain limit, only half of the fans turn on. When the temperature reaches another threshold, all fans are turned on. The fans are considered to be completely equal in terms of losses and efficiency. As the losses of half of the fans are half of the overall fan losses, it was expected that this cooling setup might result in a more efficient transformer in a part of the loading range.
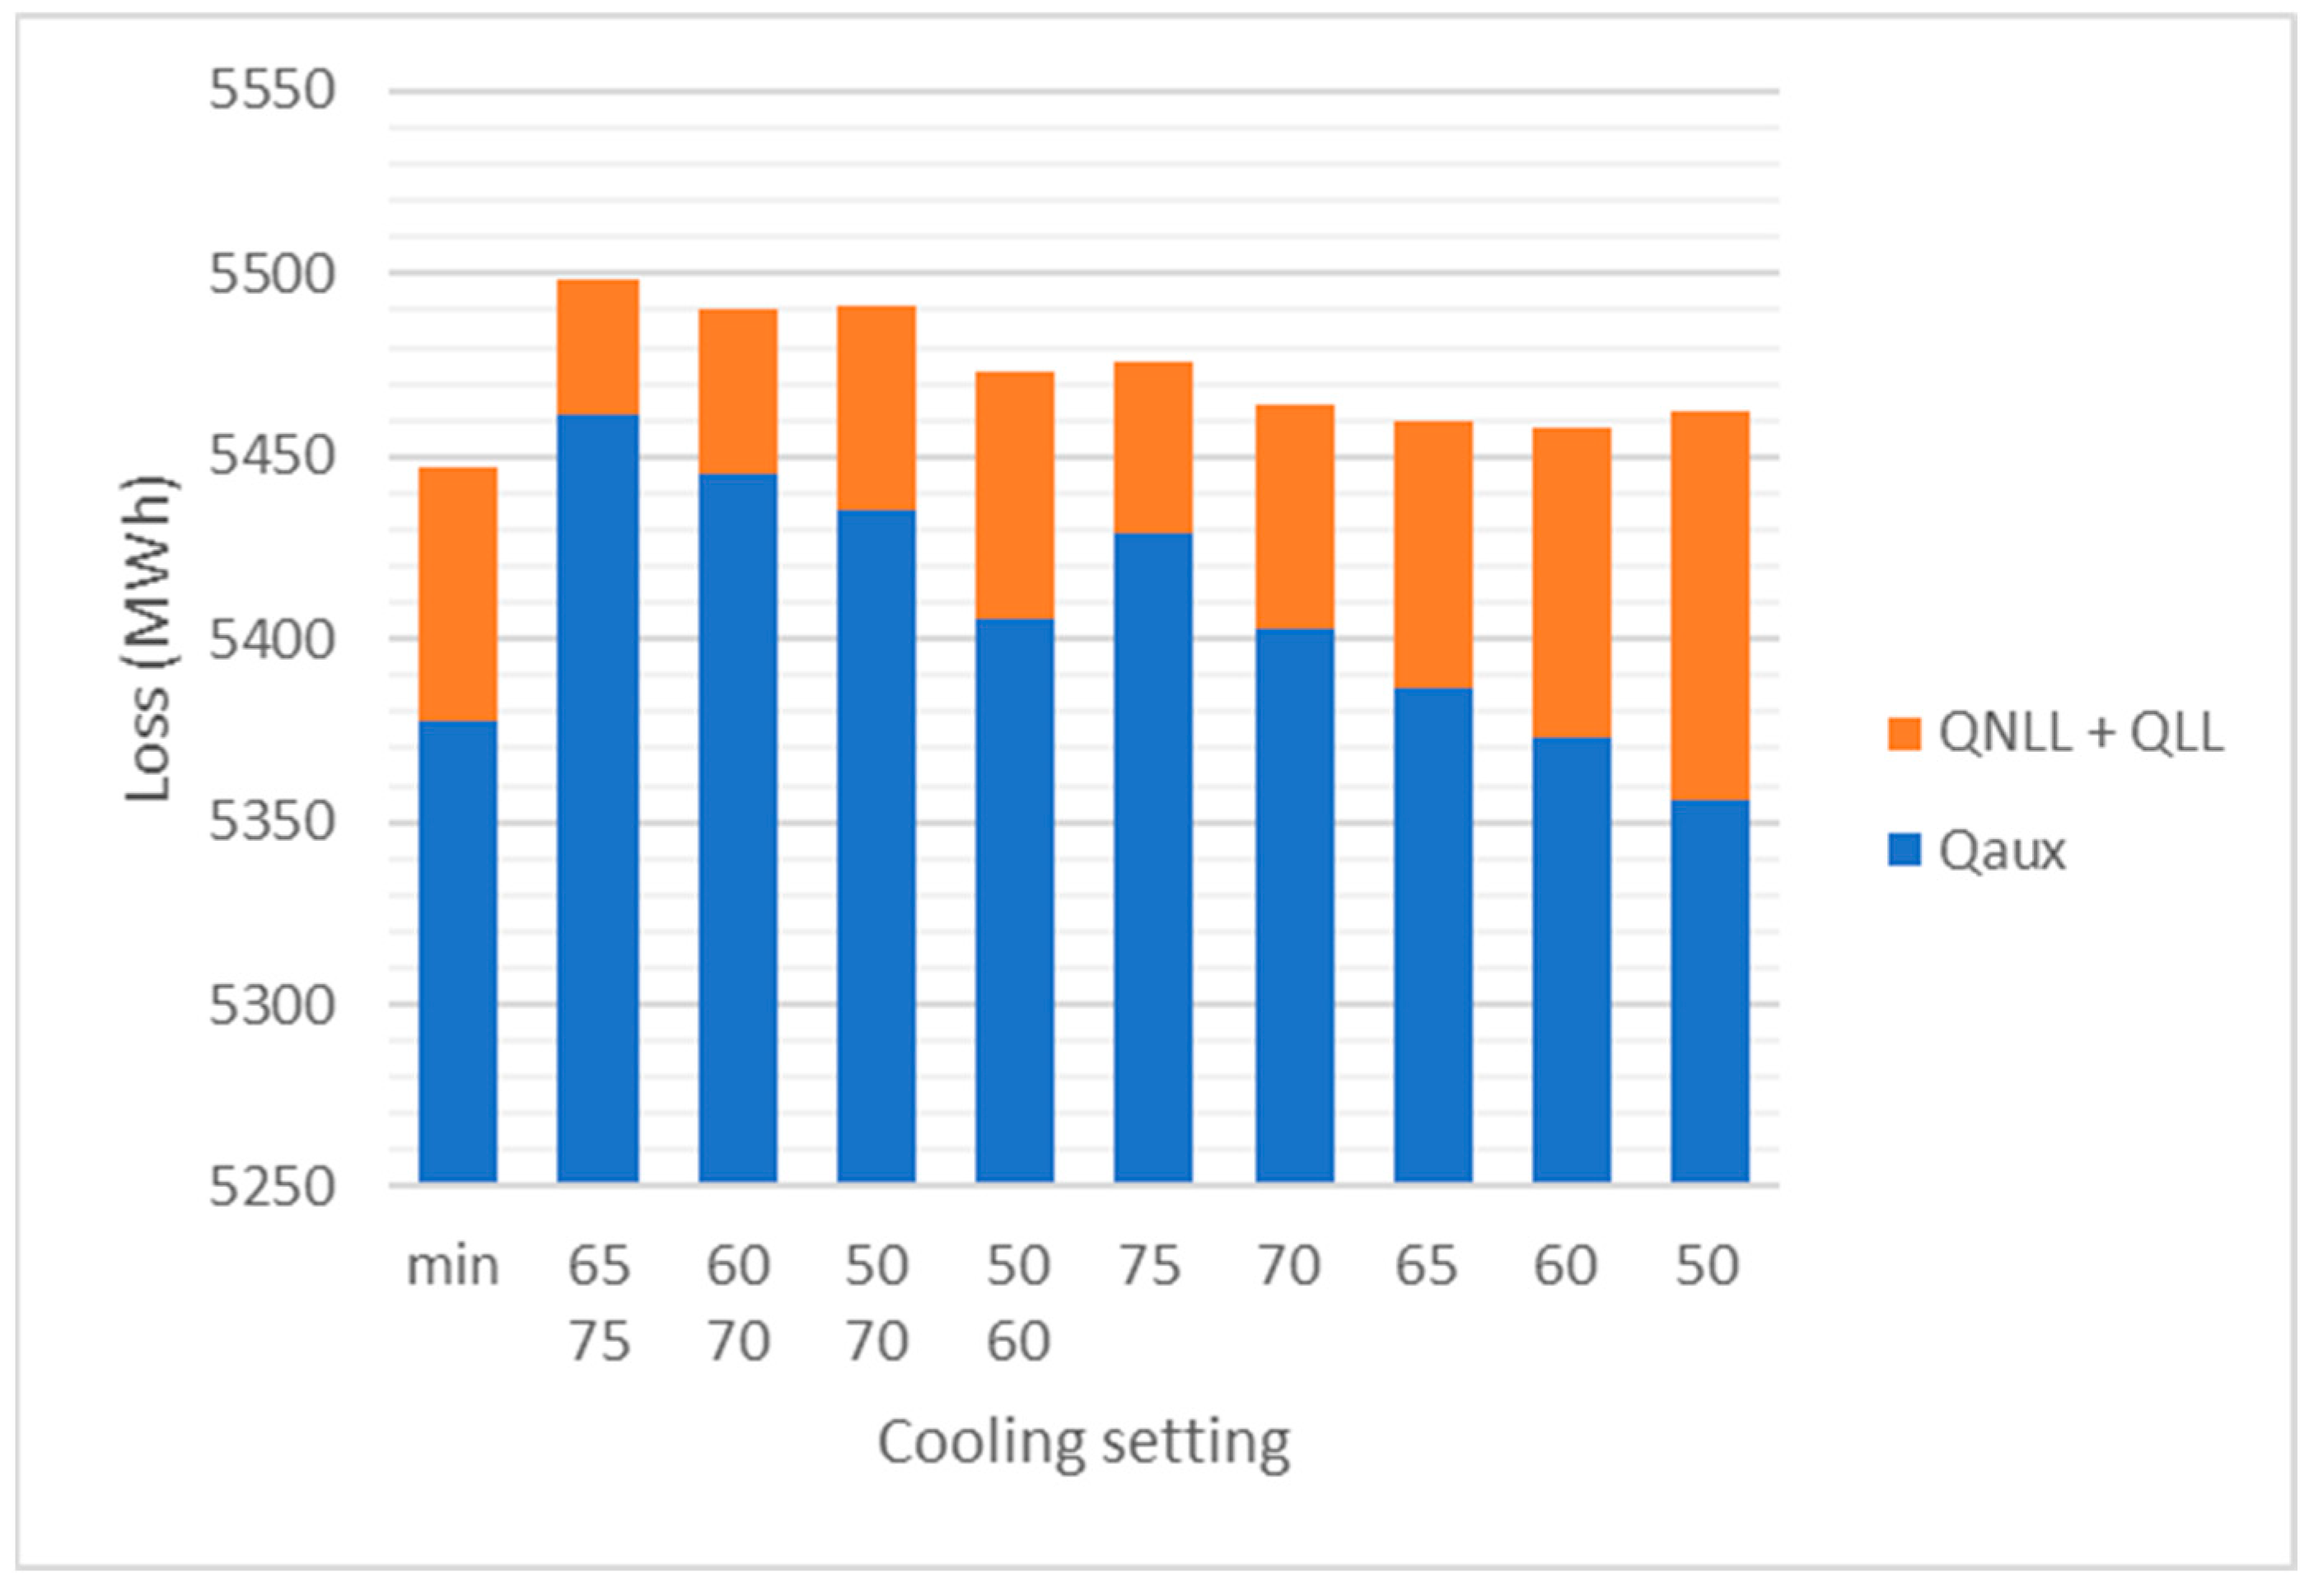
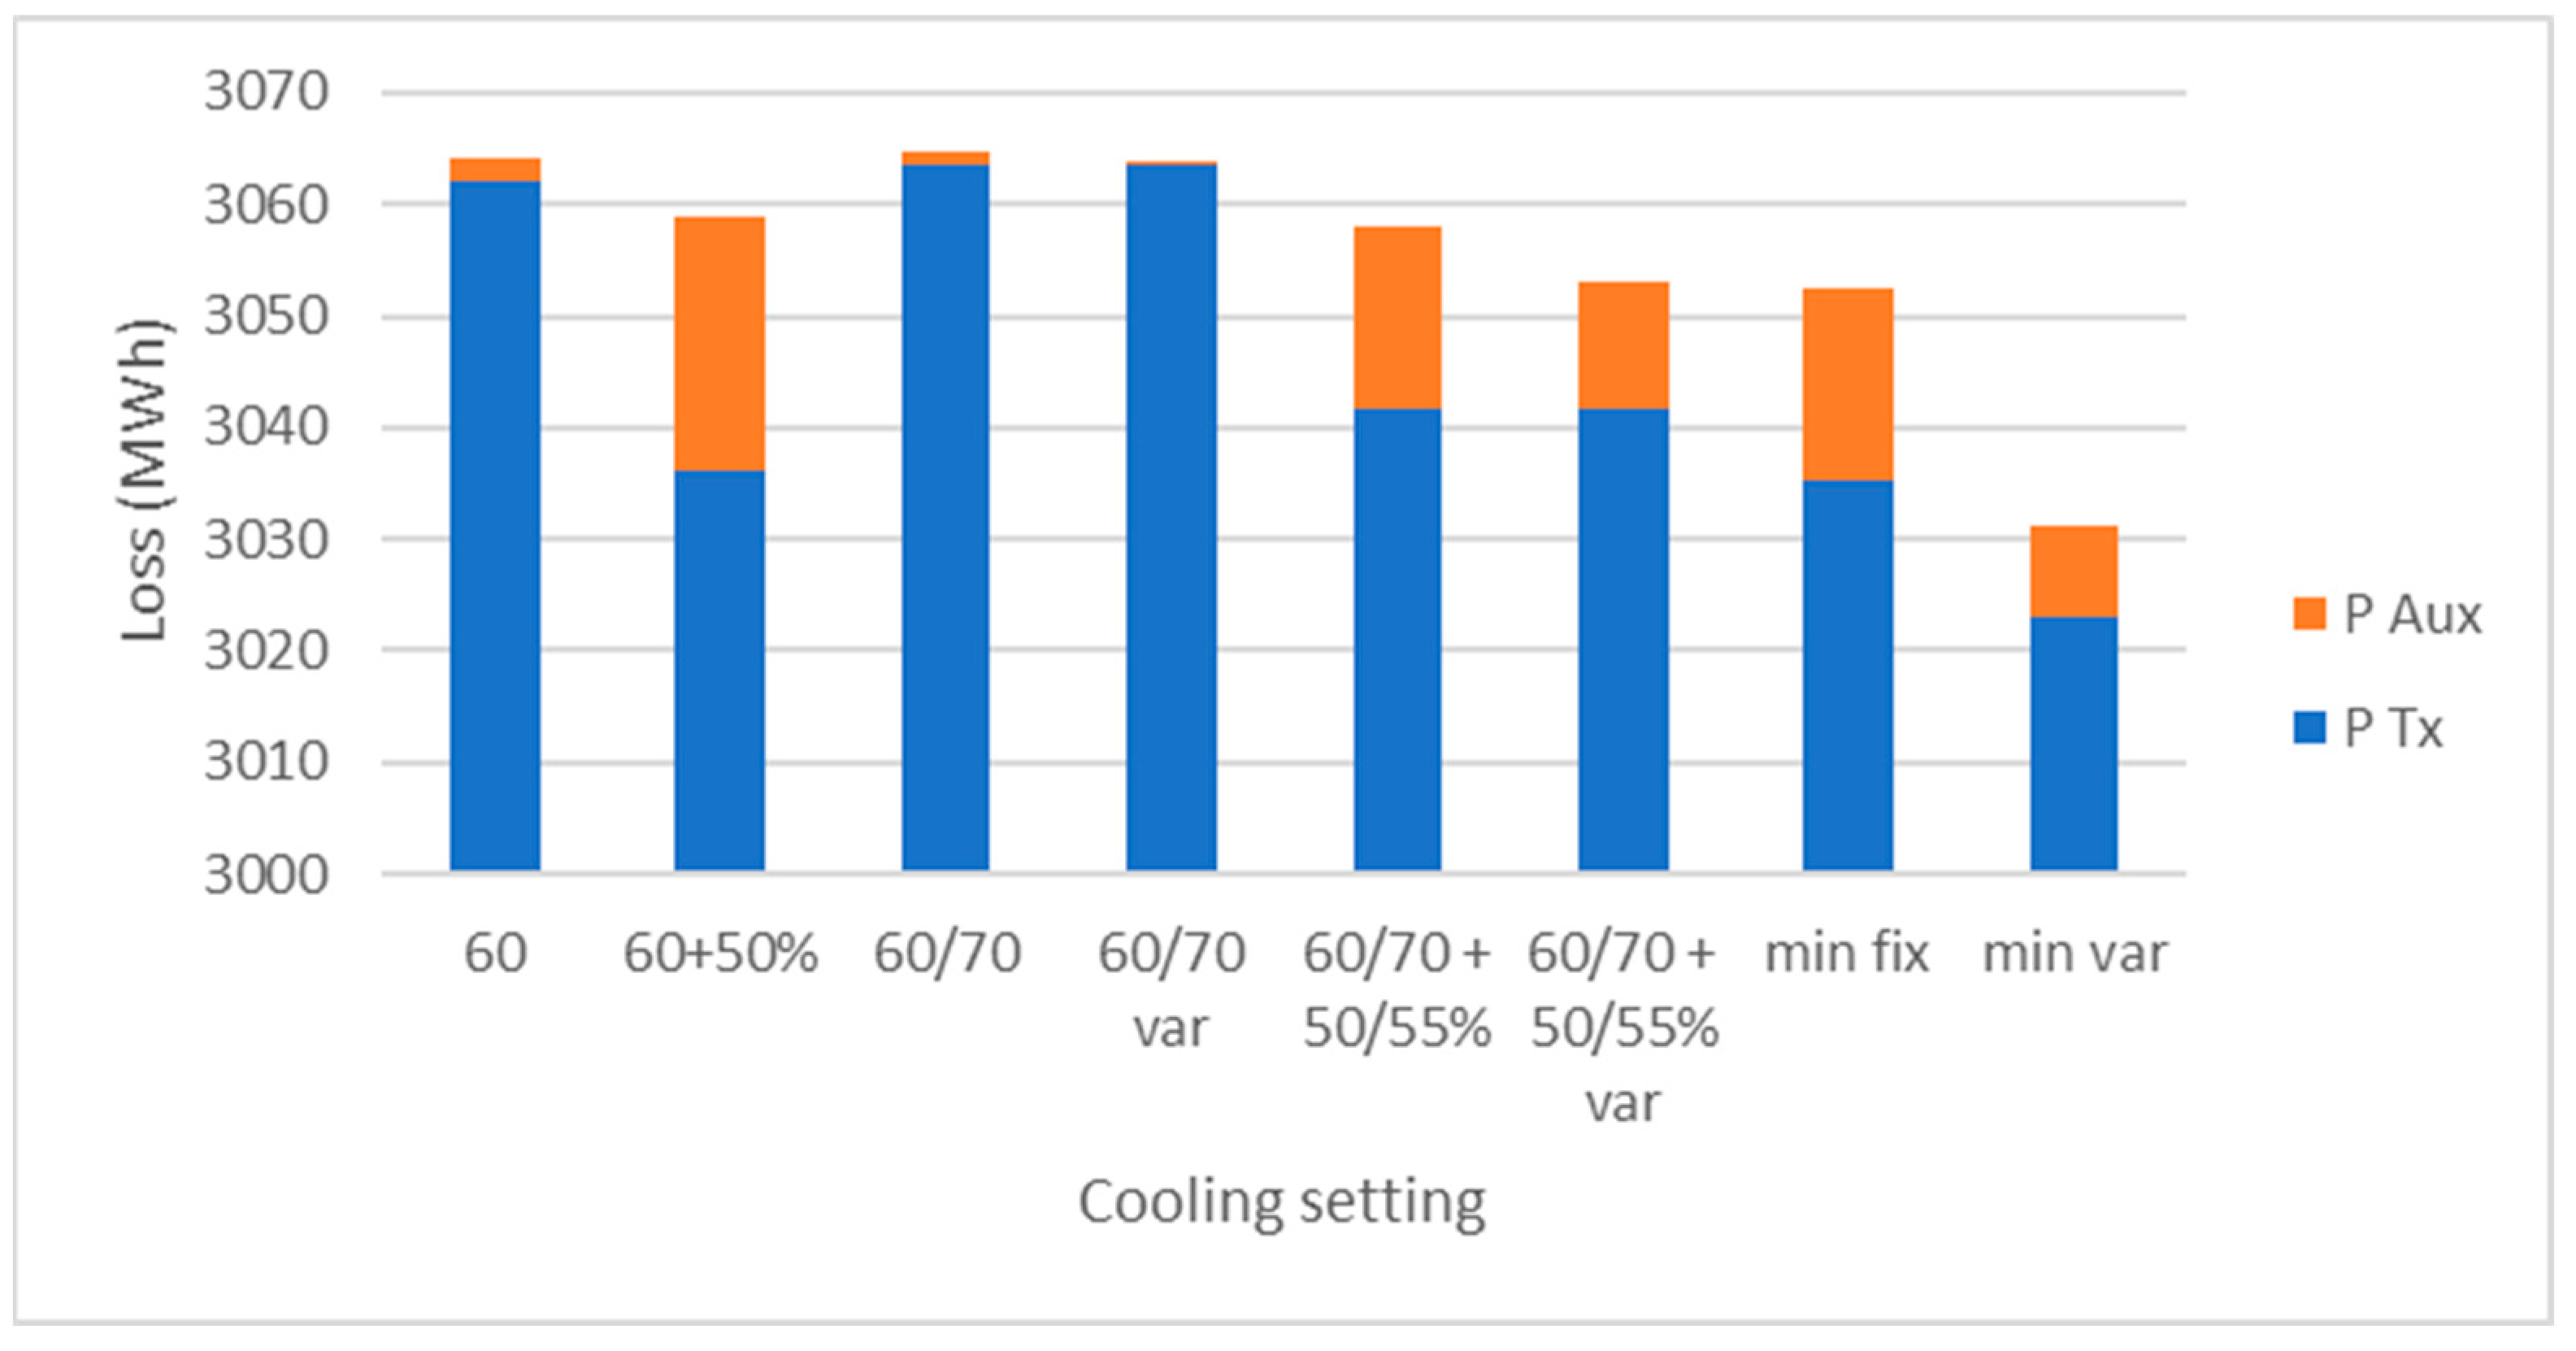
The results, shown in
Figure 11 along with the results of the two-cooling stage setup, indicate that the setup where the second stage turns on at 60 °C and the third on at 70 °C is less efficient than the previously described cases, where there are only two stages and the turn-on temperature is either 60 °C or 70 °C. At first, the results may seem illogical, but the issue lies in the fact that the third stage is turned on when the transformer oil reaches 70 °C, with only half of the fans running. This means that the transformer needs to be loaded much more and run for longer in a non-efficient setup to turn on all the fans. Of course, the conclusions heavily depend on the loading case, and in some cases, this might be more efficient, but this would be only for a very specific, seldom case when the transformer reaches higher loadings. Other combinations of temperatures give similar conclusions.
Also displayed in
Figure 11 is the theoretical minimum achievable. This is carried out by selecting when to turn on the cooling based on the efficiency and no temperature rule. This is not possible to use in practice but only displayed as a potential. Interestingly, although the three-stage cooling setup may sound like a clever way to save on fan losses, it actually increases the overall losses, making it a questionable approach from an efficiency perspective.
3.4. Power-Based Cooling Operation
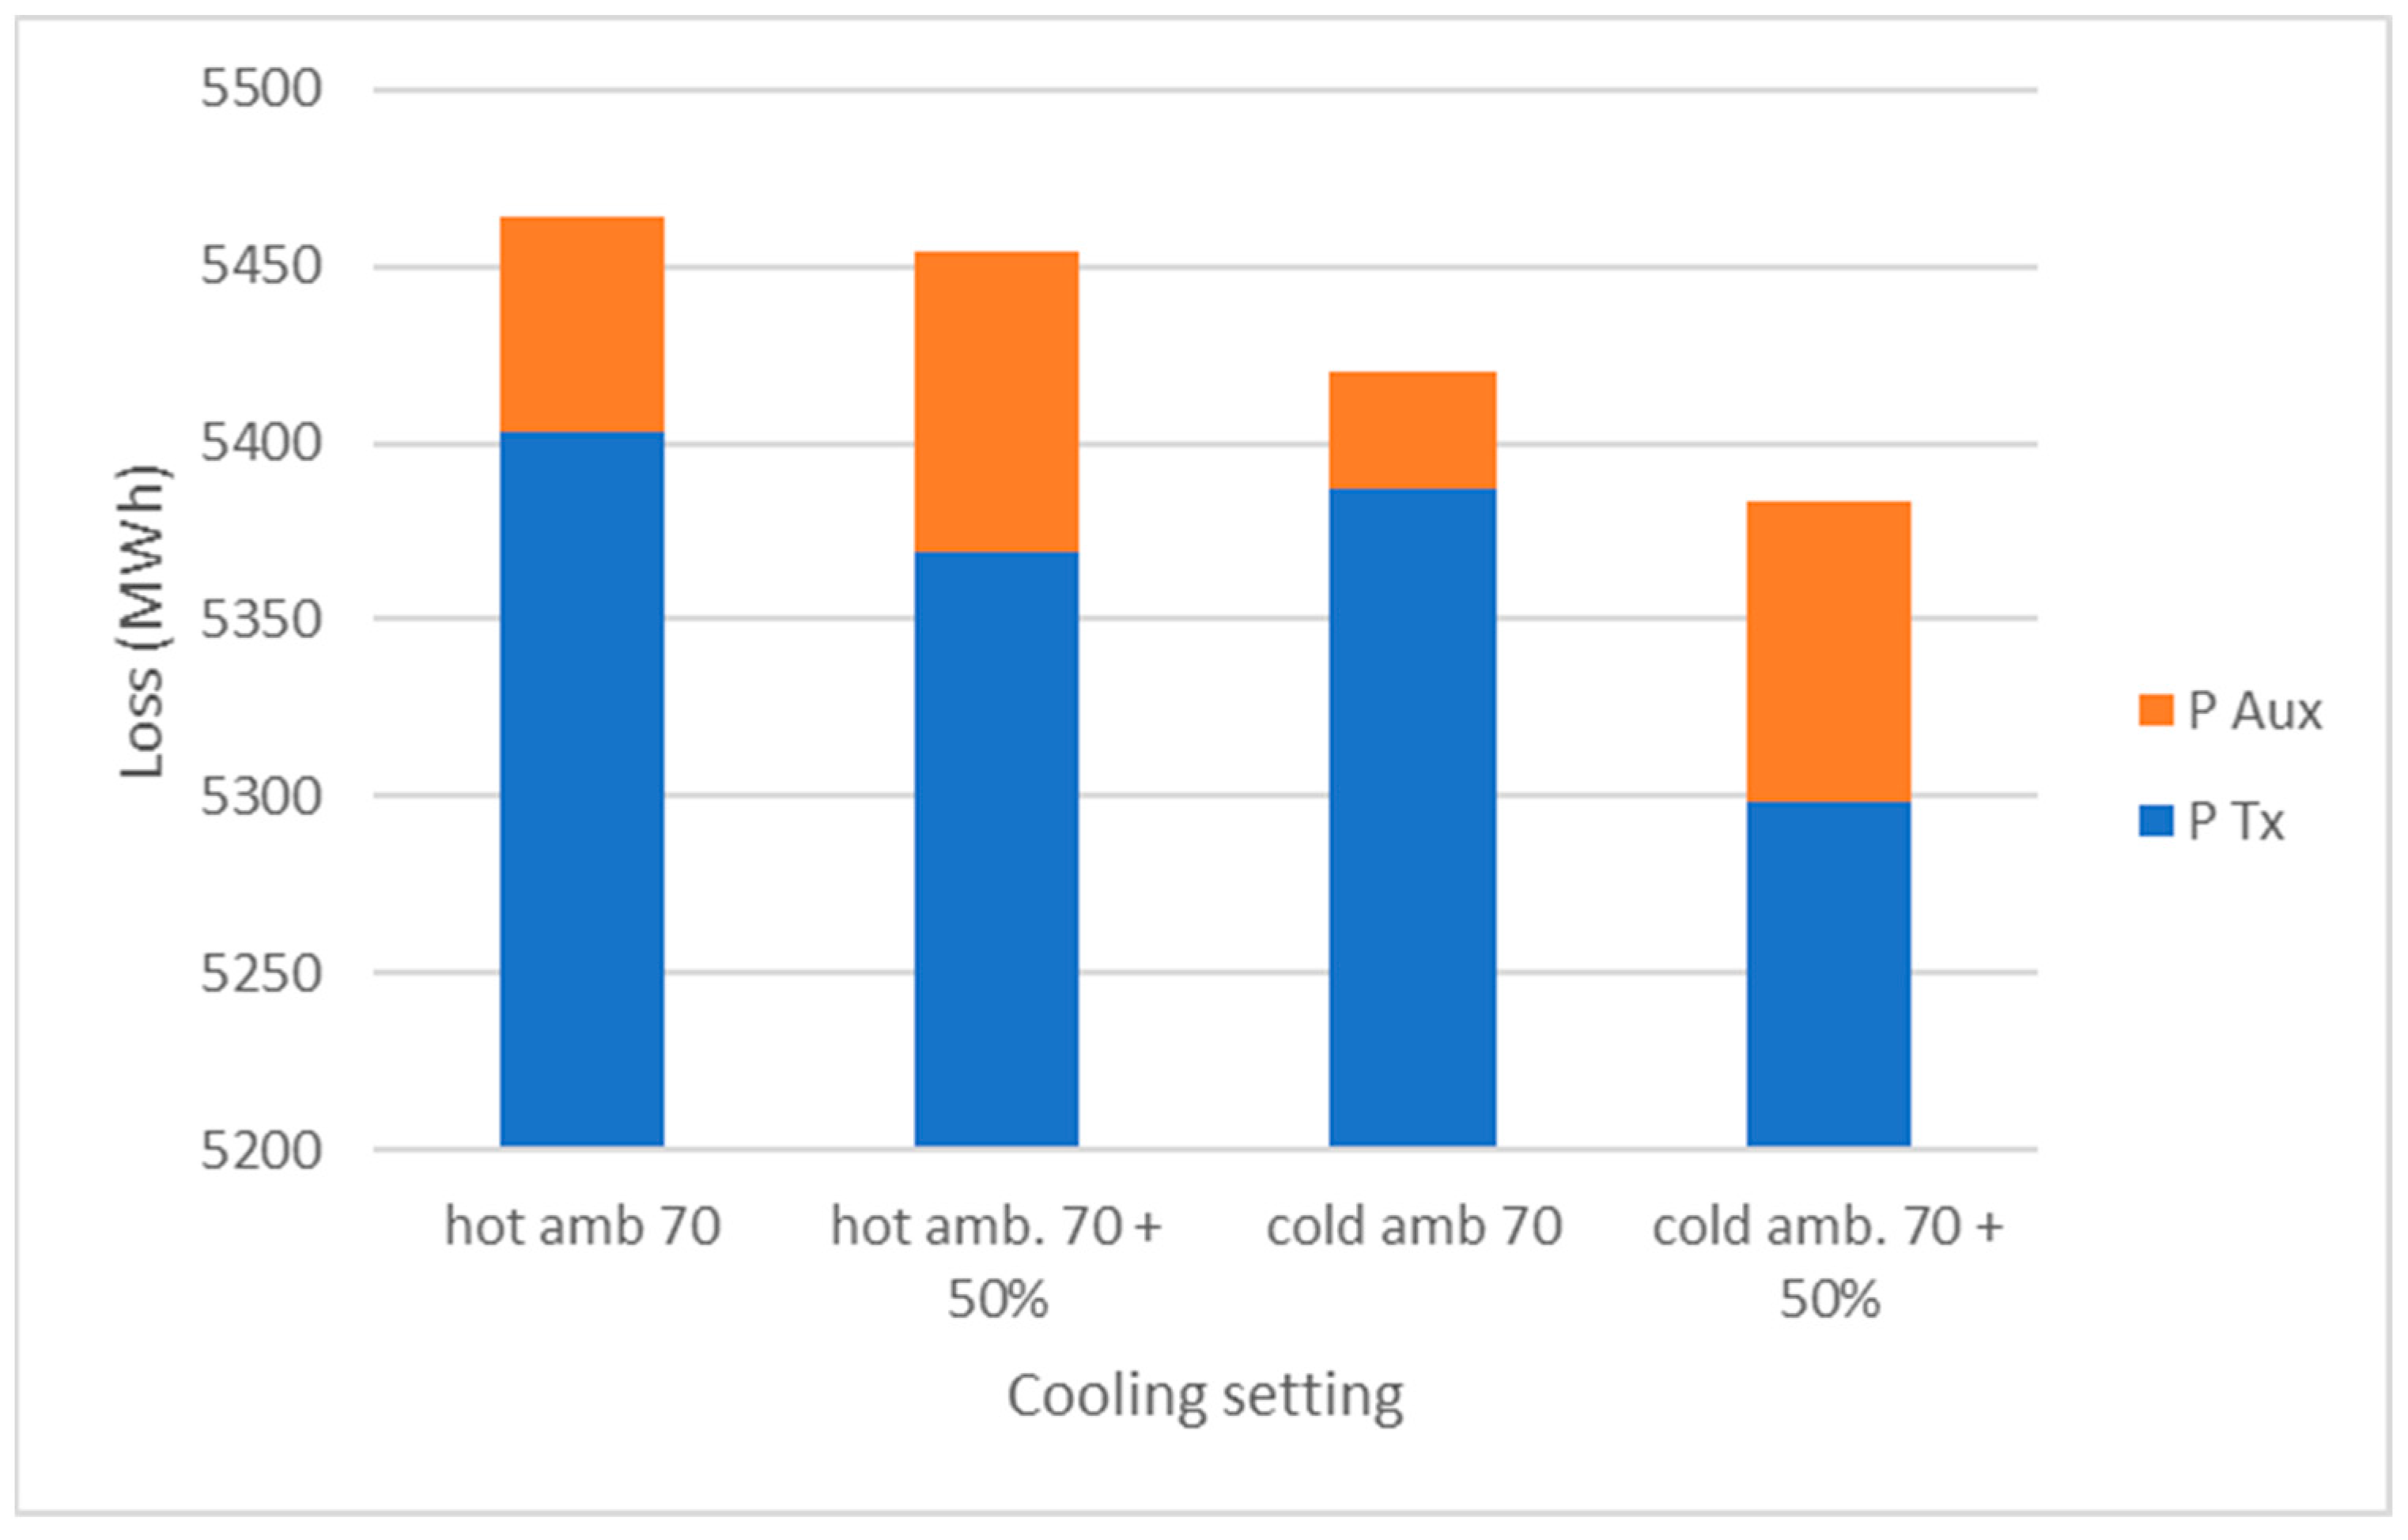
In the previous sections, different cooling setups were shown. All of those were based on absolute temperatures, which is influenced by both the loading of the transformer and the ambient temperature. This means that when the ambient temperatures are low and the loading of the transformer is high, it could be that the absolute oil temperature is low enough so that higher cooling stage is not active, i.e., fans are not turned on. In order to test the efficiency increase, a new concept described in [
17] is introduced— the fans are turned on when the temperature limit exceeds the predetermined threshold as in previous text, but also when the loading exceeds a certain limit. This is currently not in use, but with the modern monitoring systems and other smart devices it could be achieved.
For the studied transformer the cooling was designed so that it can work without fans at 50% load. This setting was selected to test the behaviour.
As it can be seen on
Figure 12, the loss level with the additional setting has changed only marginally (0.2%) for the hot ambient. This was also expected as there the occurrence of low temperature and high load is less likely. On the other hand, the loss decrease for the cold ambient is about 0.7%. This is the equivalent of a load of 4 kW working the whole year, 24 h per day.
This concept could produce gains with a limited effort and cost in the implementation, both for existing and new transformers.
A similar principle was also applied to the three-stage cooling, where the power setting was also made in two steps—where half of the fans turned on at 50% load and all fans at 55%. Results are shown in
Figure 13. The additional cooling settings decreases the losses by 1%. A bit surprisingly this is also marginally better than the setting with 60 degrees and 50% power.
This shows that the principle to control cooling by loading level of the transformer to be a more efficient one.
3.5. Variable Speed Fans
In the previous section, it is visible that by using fans the losses decrease. In
Figure 12, it can be seen that the losses in the transformer fell for cold ambient by almost 2%, but the consumption of the fans reduced that gain in efficiency lowering it to only 0.7%.
One additional study was carried out to see if fan losses can be reduced. On the market, there are fans with a variable speed. The main characteristic is that the speed of the fans can be controlled but the consumption of the fan is much lower at lower speeds/flows. The consumption is proportional at the speed to the power 3, this means that the consumption drops fast at lower speeds. Transformers have multiple fans installed. At three-stage cooling, the second stage is achieved by operating half of the fans to have half of the airflow through the radiators. Almost the same result is achieved if all of the fans are operated at 50% speed.
Table 4 shows the comparison for the case when one fixed speed fan is operated or two variable speed fans are operated at 50% power. The consumption in that case is 75% lower. The question is how can this be exploited in order to make transformers more efficient [
22].
Two additional cases were studied to see the influence. On top of the cases presented in
Figure 13, the cases for the three-stage operation were calculated using the variable speed characteristics for the second stage. Results are shown in
Figure 14. It can be seen that for the case when the fans are operated only by temperature, there is a big decrease in the losses of the fans. For the case when the fans operation is controlled also by load, there is a small influence. The reason for that is that there is just a limited load slot where the fans are operated at 50%, only for loading between 50 and 55%, so the improvement is very small.
In
Figure 15 are the results for the same cases such as in
Figure 14, with the additional information regarding the minimum possible losses. This was achieved by selecting for each moment the most efficient setup without specific rules on temperature or load. It can be seen that the setups with the power settings are close to optimum for fixed speed fans, but the variable speed solution could provide about 0.7% than the minimum for fixed fans, or 1.1% less than the 60 °C setting.
Variable speed fans provide the possibility to provide a further optimization. As the consumption decreases with the airflow, it opens the possibility to operate fans at low load levels.
Figure 16 shows such a study. It can be seen that it is possible to achieve even higher efficiencies at lower levels of loads, which is not possible for conventional fixed speed fans as the fan consumption is higher than the loss decrease.
With a smart system of cooling management, the speed of the fans could be adjusted not in just two steps but several, which could provide additional improvements.
4. Conclusions
In this paper, the impact of ambient temperature and cooling setup on transformer efficiency was analysed. The results showed that hot ambient temperatures decrease efficiency, highlighting the importance of protecting transformers from direct sun or local heat build-up. Additionally, the efficiency of transformers can be affected by different turn-on temperatures of cooling stages, but there is no one-size-fits-all rule as it depends on the transformer’s characteristics and loading curves.
While the conclusions were based on a single transformer case study, the findings can vary depending on the cooling design and loss ratios of the transformer. It was found that a three-stage cooling setup is less efficient, and although the difference in losses may be small, it can add up significantly if applied across a fleet of transformers without additional investments.
Moreover, the analysis demonstrated the potential benefits of power-based cooling operation, where fans are turned on not only based on temperature thresholds, but also on loading conditions. This approach showed a marginal decrease in losses for the hot ambient conditions and a more significant reduction of approximately 0.7% for the cold ambient temperatures. Implementing a power-based cooling operation could offer efficiency gains with minimal effort and cost, presenting an opportunity for both existing and new transformers.
Furthermore, the study explored the use of variable speed fans, which showed promising results in reducing losses. The lower power consumption of variable speed fans contributes to improved efficiency and energy savings. Continued research and development in this area could lead to advancements in transformer cooling technology, enhancing overall grid performance and sustainability.
In conclusion, this study emphasizes the importance of assessing transformer fleets to identify the opportunities for increasing efficiency. The findings highlight the potential for minimizing losses by considering the ambient temperature, optimizing cooling setups, implementing power-based cooling operation, and exploring the use of variable speed fans. By proactively addressing these factors, transformer operators can achieve higher efficiency, slower aging, and improved safety and flexibility in the power grid. Overall, this paper provides valuable insights for both the transformer industry and grid operators, paving the way for a more efficient and sustainable power infrastructure.
