Abstract
In China, the post-Winter Olympics era has seen the rapid development and promotion of ice rinks with air-supported membrane structures. With the rise of large indoor spectator areas in ice rinks, thermal comfort needs in spectator areas are receiving more and more attention. The satisfaction of thermal comfort needs is crucial to people’s health and well-being, so further study of the issue of thermal comfort in such spectator areas is needed. Unfortunately, models currently used to evaluate the thermal comfort of traditional building envelopes are not applicable to air-supported membrane-envelope ice rinks. Researchers need to focus on the internal thermal comfort needs of air-supported membrane envelopes for spectator areas. The aim of this research was to establish a thermal comfort model to provide exact temperature-range recommendations for spectator areas in air-supported membrane ice rinks. The indoor thermal-environment parameters of the ice rink in Harbin were measured from 2 January to 15 January 2023. To elicit data on spectators’ actual thermal sensations in the ice rink, a field questionnaire was administered. By modifying the expectancy factor, an extended predicted thermal comfort model was established. The results suggested that the operative temperature required to meet spectators’ thermal comfort needs in the case study ice rink ranged from 17 °C to 26 °C. The results of the study offer specific insights into the indoor thermal comfort needs of air-supported ice rinks and provide a more accurate temperature-setting reference for the healthy and energy-efficient development of such rinks.
1. Introduction
1.1. Thermal Performance of Air-Supported Membrane Envelope
As the sixth most commonly used building material in the 21st century [1], building membranes constitute the main interface of air-supported membrane structures. With their significant advantages, such as a short construction period [2], low cost [3], and large span [4], building membranes can make up for the shortcomings of traditional building materials. For example, air-supported membrane structures offer an effective mode of construction for ice-sports facilities. Given this, they have a broad range of development prospects.
However, due to its inherent nature, the interface of a membrane material has limited thermal storage and insulation capacity, reducing the stability of the internal thermal environment [5]. The indoor thermal environment differs significantly when different layers of membrane materials are used [6]. However, relatively little research has been conducted on the thermal environment inside membrane structures, especially in the context of sports stadiums. One study conducted on-site measurements of the thermal environment inside a large semi-enclosed multi-purpose stadium with a membrane enclosure [7] and found that the interior of the membrane structure building was susceptible to solar radiation. Hu et al. [4] evaluated the thermal comfort of an enclosed large-span membrane stadium using a modified predicted mean vote (PMV)–predicted percentage of dissatisfied (PPD) method with data obtained in the winter and summer. The results indicated that thermal comfort in the interior of the membrane stadium usually needed to be improved by implementing additional measures. In addition, studies have shown that the indoor thermal environment of buildings differs when different envelope materials are used [8]. As a result, the indoor thermal environment of membrane structures differs from that of conventional buildings. Targeted studies need to be conducted.
An air-supported membrane structure is a membrane structure whose stability is maintained permanently by air pressure [9]. Suo et al. [10] quantitatively evaluated the effectiveness of double-layered air-supported membrane structures in improving thermal comfort conditions by carrying out on-site measurements of the indoor thermal environment of an air-supported membrane stadium. The results demonstrated the effects of different envelopes on the internal thermal environment. In addition, when a membrane is used as the main envelope, the internal thermal environment is extremely different from traditional structure types. The difference between air-supported membrane structures and concrete structures has been empirically shown to lead to different indoor thermal-environment characteristics [11]. In this study, Lin et al. demonstrated that the temperature and humidity in the ice field of a concrete-structure rink remained stable in different outdoor parameters while those in the air-supported membrane-structure rink fluctuated widely. Another study conducted louvered non-physical measurements of temperature changes inside an air-supported membrane stadium and concluded that its indoor thermal environment was more uncomfortable than that of conventional structural buildings [12]. Different indoor thermal environments can have a direct impact on the thermal comfort of users. However, the models currently used to evaluate the thermal comfort of traditional building structures do not apply to air-supported membrane structures. More in-depth exploration of thermal comfort problems inside air-supported membrane structures is necessary.
1.2. Thermal Comfort of Spectator Areas in Ice Rinks
“Thermal comfort” describes an individual’s comprehensive perceptual assessment of their body’s thermal state. ASHRAE 55-2017 defines [13] thermal comfort as a psychological state that indicates satisfaction with the thermal environment. An environment that fails to meet thermal comfort needs may impair health and reduce body satisfaction [14]. The grid-developed PMV method [15] is widely used to predict and evaluate indoor thermal comfort in buildings [16,17,18,19]. PMV thermal comfort models are used as national standards to calculate thermal comfort, such as ASHRAE 55 [20] and ISO 7730 [21]. The PMV model can be calculated using four environmental parameters as well as two personal factors [22]. However, Fanger’s PMV index is based on laboratory data and sees humans as passive recipients of environmental influences [23]. Therefore, the PMV method only applies to steady-state, uniform thermal environments [24]. The PMV model was specifically conceived for environments provided with HVAC systems, so it predicts thermal sensation well for environments with HVAC systems [25]. However, in terms of non-stationary and non-uniform thermal environments, there are differences between the predicted thermal sensation of PMV and the actual average voting [26,27,28]. In addition, for different regional environments and populations, PMV gradually overestimates the average perceived temperature in cool environments [29]. Studies [30] have found that prolonged exposure to severe cold increases people’s cold tolerance and lowers their heat expectations. Experimental results [31] have indicated the strong dependence of thermal sensation on exposure history. People exhibit different thermal-adaptation behaviors under different climatic conditions [32]. Therefore, specific thermal sensation models are needed for a more accurate assessment.
To improve the accuracy of such models and expand their application range, adaptive thermal comfort theory was proposed, based on the results of a thermal comfort survey conducted through on-site measurements [33]. This theory suggests that people can adapt to the surrounding thermal environment through corresponding behavioral adjustments [34]. Adaptive thermal comfort models have great potential in evaluating and predicting the actual thermal comfort sensations of people. The most commonly used method involves changing existing coefficients or constants in the model using new findings from field surveys, such as the ePMV model developed by Fanger and Toftum [25], to correct the PMV model calculated under equivalent steady-state air conditioning conditions; the aPMV model introduced by Yao et al. [33] to evaluate the thermal environments of buildings without mechanical cooling or heating; and the nPMV model proposed by Humphreys and Nicol [29], which are mostly used in air-conditioned buildings. These widely used revised PMV models maintain the calculation procedure of the original PMV model but correct the resulting PMV value to reduce the discrepancy between predictions and actual thermal sensation votes [35]. These models are developed for different environmental conditions to better reflect occupants’ actual thermal sensations in everyday life.
In severe cold regions, where ice sports flourish, the indoor environment of sports arenas is highly susceptible to the influence of severe cold outdoor environments, particularly in winter, making it crucial to guarantee thermal comfort in these environments. Providing an environment for spectators that meets their thermal comfort needs has also become a necessity for the development of ice sports. Based on this, some scholars have used numerical simulations for prediction [36,37,38], combined with the use of models, to investigate problems related to the indoor thermal environment of ice rinks. Some studies have also involved field research and case studies of the thermal environment of ice rinks [39,40,41], combined with field-measurement surveys of the rinks, to develop design recommendations that are as close as possible to the real situation. However, although issues related to the thermal environment of ice rinks have been discussed, insufficient attention has been paid to the thermal comfort of ice rinks. In particular, there are many gaps in the research on spectators at rinks, which require further discussion.
1.3. Literature Gap and Research Objective
Due to the special climatic characteristics and site requirements of ice sports, studies have tended to focus on performing simulations and taking measurements rather than conducting field studies with subject feedback. In comparison with those of traditional building structures, the internal thermal-comfort properties of air-supported membrane structures have been less well investigated due to the recency of their development and application in ice rinks. Although studies have addressed the thermal comfort of spectator areas in ice rinks, they have focused on the upper or lower limits of acceptable temperature, lacking specific thermal comfort models to provide exact temperature-range recommendations for specific types of people. Studies are especially lacking in design references for specific thermal comfort models for spectator groups.
The objective of this study was to establish a thermal comfort model for spectator areas in air-supported membrane ice rinks. The thermal-environmental parameters of the spectator area in an ice rink in Harbin, China were measured from 2 January to 15 January 2023. In the same period, questionnaires were conducted to obtain the thermal-sensation votes (TSVs) of spectators and data from 905 questionnaire responses were used to validate thermal comfort models for two types of spectators. Based on the mean thermal sensation (MTS) data for operative temperatures, extended PMV models were established using the expectancy factor. Finally, recommendations were made for the range of operative temperatures and the neutral temperature to meet the thermal comfort needs of spectators.
2. Materials and Methods
Measurements were performed to obtain the parameters to establish the thermal comfort model. A questionnaire was administered to obtain actual field feedback. This study centered on the thermal comfort model for the spectator area in ice rinks in winter. The framework of the study is shown in Figure 1.
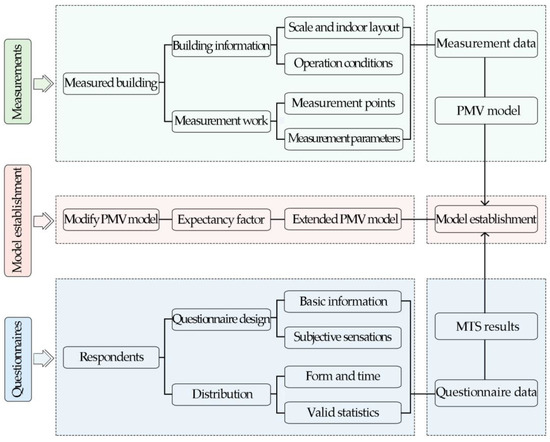
Figure 1.
Framework of the study.
2.1. Measurements
2.1.1. Description of the Case Building
The measurement site was located in the city of Harbin, Heilongjiang province, China (126.77° E, 45.75° N) [42]. Of China’s five climate zones, Harbin belongs to the severe cold climate zone and is representative of this climate zone. The winter is long and cold, and the summer is short and hot. The four seasons are distinct throughout the year and seasonal variability is significant.
Ice rinks in Harbin typically have air-supported membrane structures, and these rinks are highly similar in terms of their materials, facilities, and scale. One of these rinks was selected as a case study for the actual field research. The conditions of the rink and its constructions are shown in Figure 2. The selected rink has a standard air-supported membrane structure, with a building length of 68 m, width of 40.8 m, and height of 19 m. Its characteristics are typical of a large stadium. The outdoor area of the rink is relatively wide, and no tall buildings are blocked in the surrounding area. The main envelope of the rink is made of a double-layer membrane material, filled with rockwool and double-sided aluminum foil for insulation. There is a 60 m × 30 m standard skating area in the center of the rink, which can be used for curling, hockey, figure-skating, and other ice sports. A few seats are set on the west side of the rink. There are no seats in the non-ice area around the periphery of the rink, but spectators can stand and watch training and competitions in this area. Indoor air supply and return vents are located on the east side of the rink floor. As the outdoor temperature is too low for comfort in winter, the air sent into the room is treated appropriately to ensure that the internal temperature is not too low and remains within the range of safety and normal operation. The research period for this field investigation lasted for 14 days, from 2 January to 15 January 2023, with the daily study interval from 08:00 to 20:00. During this period, the rink operated normally, with regular daily personnel access and equipment operation.
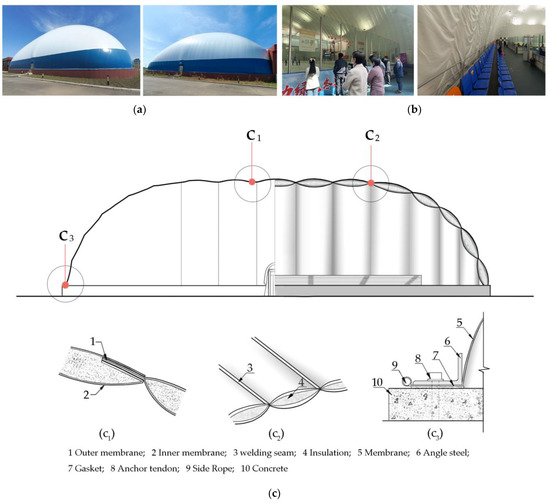
Figure 2.
The case building structure of the air-supported membrane ice rink: (a) status of the case building; (b) indoor spectator areas; and (c) constructions of the air-supported membrane ice rink.
2.1.2. Measurement
The field-measured indoor thermal-environment parameters included air temperature, relative humidity, globe temperature, and air velocity. The outdoor environmental parameters included outdoor air temperature and relative humidity. All the measurement instruments (Figure 3) used in this study were in accordance with the requirements of ISO 7726 [43] and the Chinese standard JGJ/T 347 [44] for the measurement range and accuracy of sensors, and Table 1 lists the specific measurement ranges and accuracy of the measurement instruments.
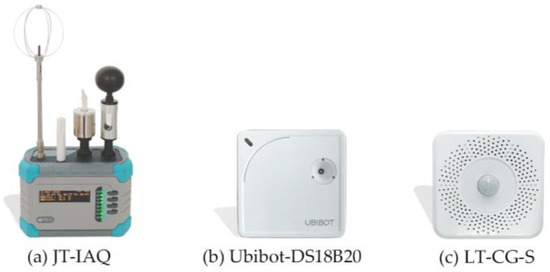
Figure 3.
Measurement instruments used in the study.

Table 1.
Parameters of the measurement instruments.
In the study, the diameter value of the black globe thermometer was 50 mm. Using a small globe for measuring the mean radiant temperature can result in high uncertainties [45]. In the field-investigated conditions, the case building was characterized by a low radiative load, which was different from work activities with high radiative loads [46]. The difference between the globe temperatures measured by thermometers with standard and smaller globes is small in indoor measurements related to thermal comfort without significant radiation [47]. Therefore, under these conditions, the mean radiant temperature errors should be negligible.
As the main objects of the field research were the rink’s spectators, the measurement instruments were placed in the seating area and the non-ice area outside the rink in different locations, and the measurement points were all close to the spectators. The rink measurement points were laid out in horizontal and vertical directions, as shown in Figure 4. In the horizontal direction, the seating area was measured using 5 points. There were 8 points in the horizontal direction on the outer side of the ice rink’s non-ice watching area. The east and west directions covered the watching area used by the largest number of spectators for the longest duration of stay. Each side was monitored using 3 points. The number of spectators on the north and south sides is relatively small, so only 1 measurement point was used for each side. Due to the poor visibility of the ice rink around the outside of the bend, few spectators choose these locations, so no measurement points were used there. In the vertical direction, spectators in the seating area remain seated, so data were collected at 0.1 m, 0.6 m, and 1.1 m in this area. In contrast, spectators in the non-ice area on the outside of the rink remain standing. Data were obtained from vertical measurement points at 0.1 m, 1.1 m, and 1.7 m from the ground in this area [48]. Data from different measurement points were collected every 30 min and the resulting datasets were used to calculate the PMV equation.
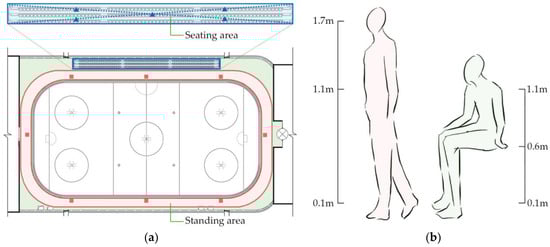
Figure 4.
Position of measurement points: (a) measurement points of horizontal directions; and (b) measurement points of vertical directions.
2.2. Questionnaires
The subjective questionnaires were written in parallel with the measurement of the objective parameters. The respondents stayed indoors for at least 30 min to eliminate the previous thermal experience effect [49]. The questionnaire was developed based on ASHRAE Standard 55 [50] and the ISO 7730 7-level heat sensation scale [21]. The main information collected in the questionnaire was as follows: (1) The respondents’ individual characteristics, including gender, age, height, and weight; (2) The spectators’ actual thermal sensation votes, which were determined using a scale to help the respondents express their actual thermal sensation, as follows: “cold” (−3), “cool” (−2), “slightly cool” (−1), “neutral” (0), “slightly warm” (+1), “warm” (+2), and “hot” (+3); (3) Details regarding clothing checklists and activity rates in the field were obtained by calculating the clothing insulation and metabolic rate of the subjects at that time; (4) The positions (seated or standing) of the respondents, which were collected to classify the spectators into types; and (5) Data on dwelling time and adjustment behaviors in the ice rink, which were used to clarify the subjects’ behavioral adjustment to adapt to the environment.
Spectators entering the ice rink arena, defined as people in the rink who were not playing sports, were selected as the subject sample. There were two groups of spectators. One group chose to remain seated while watching the skating. The others chose to watch the skating closer to the ice surface, where there were no seats, so they remained standing. During the research process, the investigation team distributed paper copies of the questionnaire to the two groups of spectators randomly. The team measured the physical parameters and recorded the field data while the spectators were filling out the questionnaires. The investigation period was from 08:00 to 20:00 daily during the normal operation hours of the rink.
A total of 905 questionnaire responses were collected during the field study, of which 391 were from seated spectators and 514 were from standing spectators. Sample information was collected through field questionnaires. There were 281 male respondents (31%) and 624 female respondents (69%). The majority of the respondents were between 30 and 40 years old. The basic information on the subject sample is summarized in Table 2.
Table 2.
Basic information on the subject sample.
2.3. Calculation
In this study, the PMV was calculated using ASHRAE’s thermal comfort tool [51], and the MTS was calculated as the mean value of the TSV. The operative temperature (top) was used as the index for evaluating the spectators’ thermal comfort. The operative temperature is the weighted average of the air temperature and the mean radiation temperature on the respective heart transfer coefficients and is considered as the sum of convective heat transfer and radiation heat transfer between the environment and the human body, which can be calculated as follows:
where represents the operative temperature, represents the air temperature. A represents the coefficient determined by the average air velocity va. If va is less than 0.2 m/s, the value of A is 0.5; if va is between 0.2 and 0.6 m/s, the value is 0.6; if the value is between 0.6 and 1.0 m/s, the value of A is 0.7. represents the mean radiant temperature, and it can be calculated according to the following equation:
where represents the mean radiant temperature, represents the globe temperature, represents the air velocity of the globe, represents the diameter of the black globe thermometer, and represents the emission of the globe.
The expectancy factor e of the extended PMV model was introduced to modify the original PMV model calculated under equivalent steady-state air conditioning conditions. Two methods of calculating the values of the expectancy factors were used in the study. The expectancy factor e can be calculated from linear regressions of PMV-MTS values. However, the expectancy factor can also be calculated based on the least square method, and the extended PMV model was established using the following equations [52]:
where ePMV is the extended PMV and e is the expectancy factor, which is estimated to vary between 0.5 and 1. N is the total number of the calculated groups. PMVi is the predicted mean vote for each dataset. MTSi is the mean thermal sensation vote of each dataset.
3. Results
3.1. Measurement Data
The parameters of the indoor and outdoor thermal environments of the arena were obtained at the actual measurement site. Table 3 provides statistical data on the average, maximum, and minimum values of each parameter measured during the research period, while Figure 5 shows the variation curves of indoor air temperature, globe temperature, relative humidity, and wind speed during the period of measurement. Based on the graphical analysis, the daily fluctuation and variation of indoor air temperature were highly regular, with a range of 2.9–9.0 °C and an average value of 6.2 °C. The range of relative humidity variation was more stable; it basically remained between 32.4% and 58.7%, with an average value of 45.7%. The range of variation of the globe temperature was similar to that of the air temperature, distributed from 2.1 °C to 11.0 °C. The overall fluctuation of indoor air velocity was lower, with a minimum value of 0 m/s and a maximum value of 0.6 m/s, and the average air velocity was 0.16 m/s.
Table 3.
Summary of measurement data.
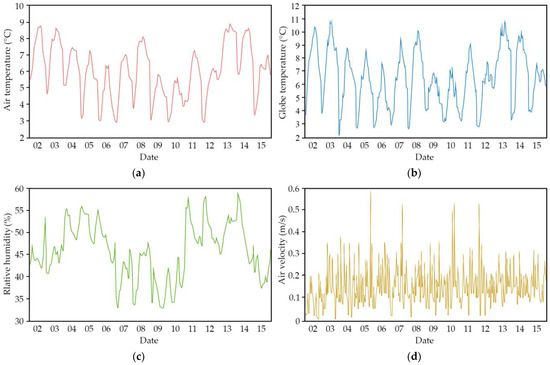
Figure 5.
Indoor thermal environment variation curves: (a) air temperature; (b) globe temperature; (c) relative humidity; and (d) air velocity.
3.2. Questionnaire Responses
The subjective TSVs during the field survey varied from “cold” (−3) to “neutral” (0). The frequency distribution of the TSVs is presented in Table 4. As is shown, the highest percentage of spectators gave “cold” votes (35%) followed by votes of “cool” (27%), “slightly cool” (17%), and “neutral” (21%). Only about 38% of the votes were in the range of (−1, 1), which meant that the thermal sensation of about 62% of the spectators was not in the thermal comfort zone recommended by ISO. The thermal sensation evaluation distribution of the two groups was similar, but the proportion of seated spectators who voted for “cold” (36%) was 2% higher than that of the standing spectators (34%). The proportion of seated spectators who voted for “neutral” (0) (22%) was 2% higher than that of the standing spectators (20%). The thermal sensation evaluation of the standing spectators was higher than that of the seated spectators.
Table 4.
Results of thermal sensation votes.
The questionnaire of the details regarding clothing checklists was developed based on ASHRAE Standard 55. Details regarding clothing checklists in the field were obtained by calculating the clothing insulation of the subjects at that time. Using the data of clothing insulation listed in ASHRAE Standard 55, the complete clothing ensemble could be determined. The insulation of the clothing of the two groups of spectators ranged from 1.32 clo to 1.56 clo, with an average value of 1.48 clo (Figure 6). The metabolic rates in the study were estimated approximately using ASHRAE Standard 55. According to the activity of the spectators, the metabolic rates of the seated spectators was 1.0 met and that of the standing spectators was 1.2 met.
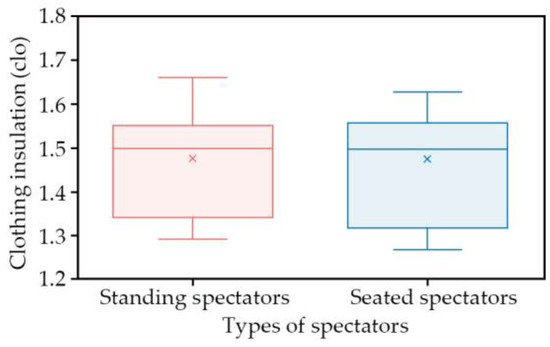
Figure 6.
Clothing insulation of the spectators.
Metabolic rates are closely related to the temperature. In cold conditions, there is an increasing risk of hypothermia with progressive exposure; high levels of metabolic heat production will help to reduce the cold strain in these situations. According to air temperature, the metabolic rates used in the present investigation, and the low TSV values (up to −3), the evaluation of the conditions for heat balance was needed before establishing the thermal comfort model. According to ISO 11079 [53], the values of IREQ and DLE were calculated to verify the onset of cold stress. However, the incongruities implementation of the IREQ model and errors in the code suggested by ISO 11079 Standard prevent a reliable assessment of cold environments, with DLE systematically overestimated. Therefore, the proper use of the method should be followed for the assessment of cold environments [54]. The results indicated that there was no onset of cold stress in the study by verification and that the high levels of metabolic rates did not occur in the environment.
3.3. Establishment of the Thermal Comfort Model
3.3.1. Validation of the Original Thermal Comfort Model
The operative temperature was divided into several temperature intervals of 0.5 °C, using the temperature frequency method. The central temperature of each temperature interval was used as the independent variable, and the PMVs and MTS votes of the two groups of spectators in each temperature interval were used as the dependent variables. Linear regression analysis was conducted. The fitted curves of the variables are plotted in Figure 7, and the related thermal comfort equations and statistical data are shown in Table 5.
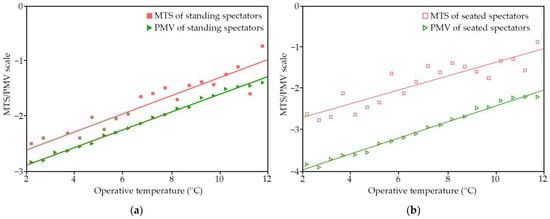
Figure 7.
PMV and MTS curves for standing and seated spectators: (a) MTS and PMV of standing spectators; and (b) MTS and PMV of seated spectators.
Table 5.
Thermal comfort equation for standing and seated spectators.
Compared with the MTS curve, the PMV overall distribution curves for the two groups of spectators, standing and seated, shifted in a colder direction. The slope of the PMV curve was similar to the MTS curve for standing spectators, but there was a large difference between the slopes of the two curves for seated spectators. When the air temperature of the condition is within the interval from 10 °C to 30 °C, and the mean radiant temperature within the interval is from 10 °C to 40 °C, the PMV model can be well applied [21]. However, in the study, some of the measurement data of temperature were lower than the minimum air temperature and mean radiant temperature for which the PMV model has been validated. These results indicated that the current PMV model did not reflect the real thermal sensation of indoor spectators accurately; further modification was needed.
3.3.2. Establishment of the Extended PMV Model
Using the linear regressions, the values of the expectancy factor e for seated and standing spectators can be calculated as 0.85 and 1.02, respectively. The value of the expectancy factor for standing spectators was not in the correct range of values. Using the calculation based on the least square method, the values of the expectancy factor were calculated as 0.87 for standing spectators and 0.63 for seated spectators. The second method was more suitable for the study.
By bringing the expectation factor into the PMV equation for calculation, an extended PMV model was obtained to verify the thermal comfort equation after modification. Figure 8 shows the MTS and ePMV results for standing and seated spectators at different operative temperatures. The ePMV model was validated using the actual questionnaire data on MTS. Correlation analysis was performed, and the two were significantly correlated at p < 0.01. The goodness-of-fit R2 was 0.867 and 0.805, respectively. This showed that the ePMV model was an accurate method of predicting the thermal comfort sensation. The ePMV curves at different operative temperatures were normally distributed around the MTS model values and well fitted the MTS values, demonstrating the reliability of the ePMV thermal comfort model.
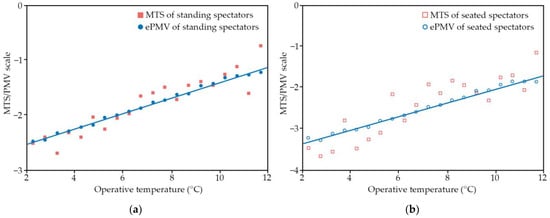
Figure 8.
Comparison of modified ePMV and MTS model: (a) MTS and ePMV of standing spectators; and (b) MTS and ePMV of seated spectators.
The ePMV models can be represented by the following equations:
By solving the two equations above for a thermal sensation of 0, the neutral temperatures for the two groups of spectators were obtained as 20 °C and 22 °C, respectively. This showed that the neutral temperature of the standing spectators was lower than that of the seated spectators. Using the acceptable thermal comfort range evaluation index of ASHRAE Standard 55 [13] as a reference, the thermal comfort range of standing spectators was found to be 17–24 °C, and the thermal comfort range of seated spectators was 18–26 °C. The results showed that the seated spectators had a higher neutral temperature and operative temperature range.
Accordingly, as the current temperature of the spectator area did not meet the thermal comfort requirements of both groups of spectators, we can draw the conclusion that to make both groups of people feel comfortable, the operative temperature in the spectator area of the ice rink should range from 17 °C to 26 °C.
4. Discussion
4.1. Analysis of the Validity and Differences of the Thermal Comfort Model Compared with Existing Studies
The thermal comfort model of the air-membrane structure investigated in this study was analyzed by comparing its results with those of other studies to discuss their validity and differences. However, direct model validation and comparison are not sufficiently intuitive, so the validity of the model was verified indirectly by comparing it with the temperature results in existing studies. It was also easier to see the differences and gaps numerically.
In another study that conducted field measurements of the spectator area of an ice rink [40], the temperature in the spectator-admission area of the ice rink site was 17–21 °C. The building envelope was a double-layer air cushion made of ETFE membrane, similar to the air-supported membrane structure investigated in this study. The temperature range that satisfied the thermal comfort of the previous case was slightly smaller than that obtained in the current study. The upper limit of the temperature range in this study was about 5 °C higher than that of the case study, which indicates that our study had a more generous temperature range.
Another previous study found that the presence of the ice rink had almost no effect on the thermal comfort of the spectators [39]. Therefore, the results of the indoor thermal comfort calculations were also compared here with those of ordinary stadiums. In our study, thermal neutrality temperatures of 20 °C and 22 °C were calculated for the two groups of spectators. These results were very similar to the thermal neutrality temperature calculated by Berquist et al. [55], demonstrating that the temperature range of 17–26 °C derived from the thermal comfort model in this study was reasonable. Bai et al. [12] calculated an indoor spectator thermal comfort temperature range of 8.91–16.76 °C in a gymnasium that also had an air-supported membrane structure, which showed a large difference from our results. Although an air-supported membrane structure was investigated in both studies, the comparison results also confirm the difference in indoor thermal comfort requirements between the air-supported membrane structures in this study and ordinary light-transmitting membrane materials. The structure of the reference building incorporated a light-transmitting interface that was more susceptible to solar radiation. This is likely to have caused changes in the mean radiant temperature, leading directly to changes in the calculation of the PMV data and the thermal comfort model establishment. Therefore, the internal temperature-setting requirements may have been lower. However, in our study, the membrane structure was filled with insulation material. The indoor environment was less affected by solar radiation, so the PMV was lower and the thermal comfort needs were higher, leading the results to differ from those of the reference study. The comparison results also confirmed the difference in indoor thermal comfort requirements between the air-supported membrane structures in this study and ordinary light-transmitting membrane materials.
However, the temperature range results obtained in this study, such as a temperature no lower than 19 °C [56] and a range from 14 °C to 23 °C [57], were not much different from the results of studies of different enclosure structures. However, air-supported membrane structures tend to require a high temperature range to reduce environmental differences through temperature adjustment to ensure good thermal comfort inside. Therefore, in the actual construction of air-supported membrane rinks, more attention should be paid to this characteristic to ensure the thermal comfort inside the building through reasonable temperature settings.
The results of this study were examined further in comparison with existing studies. The established thermal comfort model was found to provide clearer guidance on the thermal comfort of air-supported membrane structure ice rinks. Comparison of the calculation results revealed that the temperature setting in traditional membrane structures was not applicable in the case of the air-supported membrane structures in this study. In addition, compared with the usual limit of the temperature-setting requirements and the broad temperature range, the calculation results of this study fully considered the actual thermal sensation of the spectators on site. The established thermal comfort model was modified and improved by combining the actual thermal sensation vote average to obtain a temperature reference range that better suited the actual thermal comfort requirements of the indoor spectators and to provide more accurate guidance for the temperature settings of air-supported membrane ice rinks. In addition, by reducing the energy consumption caused by the previous broad temperature setting, energy waste can be reduced, providing a more targeted path for the healthy energy-saving development of ice-sports buildings.
4.2. Potential Factors Influencing the TSV Questionnaire Data in the Field
The thermal comfort model was validated, and a modified extended PMV model was obtained, using data from the field study. The influence of the field data on the results was evident. Some potential factors influencing the actual field feedback results are listed here for discussion.
Adaptive self-adjustment behaviors, representing physiological acclimatization, were commonly observed among the spectators. There were corresponding adaptive adjustment behaviors among the subjects. The effect of the behavioral adjustment style was more pronounced than of that of the adaptive style [23]. Although the temperature inside the pavilion was higher than that outside, the overall indoor air temperature at the site was still very low. The more time spectators spent in the rink, the more likely they were to adjust their clothing to the cold, such as putting on gloves or hats to better adapt to the indoor thermal environment. Moreover, influenced by the different ranges of activities, the spectators also adopted simple behavioral activities to improve their adaptation to the environment. As the range of activity of the standing spectators was less restricted than that of the seated spectators, it was easier for them to increase their metabolic rate through more adaptive behaviors and simple activities. Therefore, their adaptability to the surrounding environment was better, which may have had a large impact on the results.
The frequency with which spectators left and re-entered the rink in this study varied. People who left and re-entered the rink more frequently may have developed physiological and psychological adaptations to the internal environment after long-term exposure to the same environment [57]. The analysis of the questionnaire data on the spectators’ duration of stay in the rink showed that the actual thermal sensation of people who stayed in the rink for a long time was higher than that of the spectators who stayed in the rink for a short time (Figure 9). Long-term exposure to an environment often reduces the body’s sensitivity to that environment [33], in turn influencing expectations of the thermal environment. A prolonged duration of stay caused the spectators to physiologically develop certain adaptations, although these could not be easily measured and quantified directly, causing a shift in the subjects’ expectations of the thermal environment [58] and influencing their thermal sensation votes.
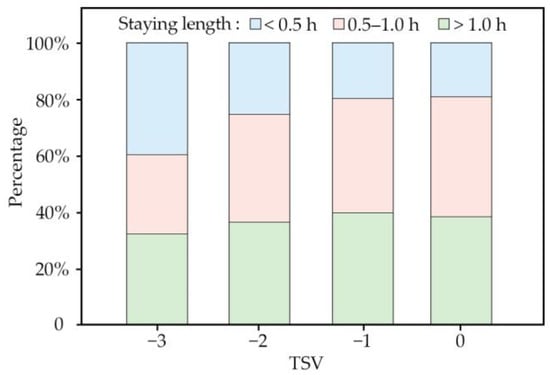
Figure 9.
Different thermal sensations of different staying lengths.
Individual factors may also affect thermal sensation. Differences in individual factors such as the subject’s age [59], gender [60], and weight [61] may also have led to differences in the findings. According to the results of the questionnaire, the average age of the respondents was concentrated between 30 and 40, the average height was about 1.60–1.70 m, weight was distributed in the range of 53–64 kg, and the majority of the spectators were female, with men representing only 45.6% of the respondents. All these factors may have influenced the statistical results. Taking the gender difference in individual factors as an example for in-depth analysis, the statistical results of heat-sensation voting by gender are shown in Figure 10. Female respondents’ percentage of “cold” thermal sensation votes was significantly higher than that of the male respondents. Men’s percentage of “moderate” thermal sensation votes was significantly higher than that of women. Women generally perceived the environment to be colder than men did. The data suggested that women preferred warmer environments and men were more adaptable to cold environments. The gender difference in thermal comfort demand was similar to that in the experimental investigation of Lan et al. [62]. Thus, according to the data obtained from the field questionnaires, the calculated range of the operative temperature and neutral temperature might be more suitable for female spectators, as the dominant group in this study.
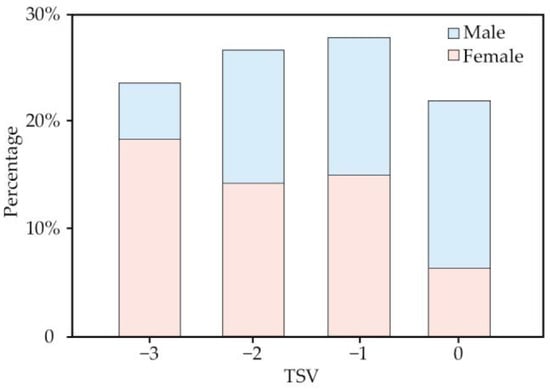
Figure 10.
Thermal sensation comparison between genders.
4.3. Limitations and Future Studies
- (1)
- The measurement period of this study was limited by the operation and management of the ice rink. Extending the measurement period could make the study results more accurate;
- (2)
- The metabolic rates for spectators in the study were determined using metabolic rates for typical person activity types in ASHRAE Standard 55. The specific data in realistic conditions were not taken into account in the study, and specific metabolic rates in realistic conditions are required for future experiments;
- (3)
- With regard to the group of spectators in the arena, the demand for thermal comfort differs in various factors such as gender and age. These factors resulted in differences in the thermal comfort demands of different groups. The differences between different types of people should be concentrated on and further investigations and analyses should be conducted in future studies.
5. Conclusions
In this study, a thermal comfort model of the winter indoor spectator area of an air-supported ice rink in a severe cold region was established by field measurements and questionnaire data validation. An extended PMV model was established by modifying the expectation factor. Through comparison with existing studies, the validity and differences of the study were analyzed. Factors that may have influenced the actual thermal sensation data obtained in the field were also analyzed and discussed. The main findings can be summarized as follows:
- (1)
- The parameters used to calculate the thermal comfort model were obtained through field measurements. The modified extended PMV model for standing spectators and seated spectators was obtained when the expectation factor was introduced, as 0.87 and 0.63, respectively. The extended PMV equations for the indoor spectator area were obtained by the temperature-frequency method as ePMVStanding = 0.139top − 2.80, ePMVSeated = 0.126top − 2.76, respectively;
- (2)
- To ensure the thermal comfort of the spectator area in the ice rink, the temperature range for calculating the thermal comfort demand was calculated, with a range from 17 °C to 26 °C. This temperature range provides an accurate reference for thermal comfort temperature settings and energy-saving operations for ice rinks;
- (3)
- The results of this study address the issue of thermal comfort in spectator areas in ice rinks in severe cold regions, based on the analysis of the special envelope structure of an air-supported membrane ice rink. The research results have reference value and will provide ideas for creating a healthy thermal environment and guaranteeing the thermal comfort of spectators in air-supported membrane ice rinks.
Author Contributions
Conceptualization, R.L. and Y.L.; methodology, R.L.; formal analysis, R.L.; data curation, R.L. and G.Y.; investigation, R.L., S.Q. and G.Y.; writing—original draft preparation, R.L.; writing—review and editing, R.L.; visualization, H.G.; supervision, H.G.; project administration, Y.L.; funding acquisition, Y.L. All authors have read and agreed to the published version of the manuscript.
Funding
This research was funded by National Natural Science Foundation of China, grant number 52238002.
Data Availability Statement
Not applicable.
Conflicts of Interest
The authors declare no conflict of interest.
References
- Houtman, R. Fabric Structures in Architecture: 3-Materials Used for Architectural Fabric Structures; Woodhead Publishing Limited: Oxford, UK, 2015; pp. 229–231. [Google Scholar]
- Hahn, L.; Rittner, S.; Bauer, C.; Cherif, C. Development of alternative bondings for the production of stitch-free non-crimp fabrics made of multiple carbon fiber heavy tows for construction industry. J. Ind. Text. 2018, 48, 660–681. [Google Scholar] [CrossRef]
- Tian, G.; Fan, Y.; Wang, H.; Zheng, H.; Gao, M.; Liu, J.; Liu, C. Studies on the thermal optical properties and solar heat gain of thin membrane structure industrial building. Sol. Energy 2021, 213, 81–90. [Google Scholar] [CrossRef]
- Hu, J.; Chen, W.; Zhang, S.; Yin, Y.; Li, Y.; Yang, D. Thermal characteristics and comfort assessment of enclosed large-span membrane stadiums. Appl. Energy 2018, 229, 728–735. [Google Scholar] [CrossRef]
- Tian, G.; Fan, Y.; Wang, H.; Peng, K.; Zhang, X.; Zheng, H. Studies on the thermal environment and natural ventilation in the industrial building spaces enclosed by fabric membranes: A case study. J. Build. Eng. 2020, 32, 101651. [Google Scholar] [CrossRef]
- Kostic, D.; Milosevic, V.; Bogdanovic, V.; Vasov, M.; Vucur, A. Influence of single and double membrane roofs on thermal behaviour of enclosed space. Teh. Vjesn. 2018, 25 (Suppl. 1), 188–196. [Google Scholar] [CrossRef]
- Van Hooff, T.; Blocken, B. Full-scale measurements of indoor environmental conditions and natural ventilation in a large semi-enclosed stadium: Possibilities and limitations for CFD validation. J. Wind. Eng. Ind. Aerodyn. 2012, 104, 330–341. [Google Scholar] [CrossRef]
- Li, Y.; He, J. Evaluating the improvement effect of low-energy strategies on the summer indoor thermal environment and cooling energy consumption in a library building: A case study in a hot-humid and less-windy city of China. Build. Simul. 2021, 14, 1423–1437. [Google Scholar] [CrossRef]
- Kröplin, B. Inflated membrane structures on the ground, in the air and in space-a classification. Text. Compos. Inflatable Struct. 2005, 3, 213–220. [Google Scholar] [CrossRef]
- Suo, H.; Angelotti, A.; Zanelli, A. Thermal-physical behavior and energy performance of air-supported membranes for sports halls: A comparison among traditional and advanced building envelopes. Energ. Build. 2015, 109, 35–46. [Google Scholar] [CrossRef]
- Lin, W.Y.; Liu, X.H.; Li, S.J.; Zhang, T. Investigation on thermal environment and heat transfer characteristics in ice rinks with different envelopes. Build. Environ. 2022, 219, 109250. [Google Scholar] [CrossRef]
- Bai, Y.; Zhao, L.; Tang, R.N.; Kang, X. Study on winter thermal comfort of membrane structure gymnasium in severe cold region of China. Sci. Technol. Built Environ. 2022, 28, 499–512. [Google Scholar] [CrossRef]
- ASHRAE Standard 55–2017; Thermal Environmental Conditions for Human Occupancy. Ashrae: Atlanta, GA, USA, 2017.
- Kamar, H.M.; Kamsah, N.; Ghaleb, F.; Alhamid, M.I. Enhancement of thermal comfort in a large space building. Alex. Eng. J. 2019, 58, 49–65. [Google Scholar] [CrossRef]
- Fanger, P.O. Thermal comfort. In Analysis and Applications in Environmental Engineering; Danish Technical Press: Copenhagen, Denamrk, 1970. [Google Scholar]
- Han, J.; Zhang, G.; Zhang, Q.; Zhang, J.; Liu, J.; Tian, L.; Zheng, C.; Hao, J.; Lin, J.; Liu, Y. Field study on occupants’ thermal comfort and residential thermal environment in a hot-humid climate of China. Build. Environ. 2007, 42, 4043–4050. [Google Scholar] [CrossRef]
- Zhao, O.; Zhang, W.; Xie, L.; Wang, W.; Chen, M.; Li, Z.; Li, J.; Wu, X.; Zeng, X.; Du, S. Investigation of indoor environment and thermal comfort of building installed with bifacial PV modules. Sustain. Cities Soc. 2022, 76, 103463. [Google Scholar] [CrossRef]
- Almeida, R.M.; Ramos, N.M.; De Freitas, V.P. Thermal comfort models and pupils’ perception in free-running school buildings of a mild climate country. Energ. Build. 2016, 111, 64–75. [Google Scholar] [CrossRef]
- Van Gaever, R.; Jacobs, V.A.; Diltoer, M.; Peeters, L.; Vanlanduit, S. Thermal comfort of the surgical staff in the operating room. Build. Environ. 2014, 81, 37–41. [Google Scholar] [CrossRef]
- ASHRAE Standard 55; Thermal Environmental Conditions for Human Occupancy. American Society of Heating, Refrigerating and Air Conditioning Engineers: Atlanta, GA, USA, 1992; Volume 145.
- ISO 7730; Ergonomics of the Thermal Environment Analytical Determination and Interpretation of Thermal Comfort Using Calculation of the PMV and PPD Indices and Local Thermal Comfort Criteria. ISO: Geneva, Switzerland, 2005; Volume 3, p. e615.
- Revel, G.M.; Arnesano, M. Perception of the thermal environment in sports facilities through subjective approach. Build. Environ. 2014, 77, 12–19. [Google Scholar] [CrossRef]
- Brager, G.S.; De Dear, R.J. Thermal adaptation in the built environment: A literature review. Energ. Build. 1998, 27, 83–96. [Google Scholar] [CrossRef]
- De Dear, R.; Brager, G.S. Developing an adaptive model of thermal comfort and preference. ASHRAE Trans. 1998, 104, 145–167. [Google Scholar]
- Fanger, P.O.; Toftum, J. Extension of the PMV model to non-air-conditioned buildings in warm climates. Energ. Build. 2002, 34, 533–536. [Google Scholar] [CrossRef]
- Cao, B.; Zhu, Y.; Ouyang, Q.; Zhou, X.; Huang, L. Field study of human thermal comfort and thermal adaptability during the summer and winter in Beijing. Energ. Build. 2011, 43, 1051–1056. [Google Scholar] [CrossRef]
- Schiller, G.E. A comparison of measured and predicted comfort in office buildings. ASHRAE Trans. 1990, 96, 609–622. [Google Scholar]
- De Dear, R. Validation of the predicted mean vote model of thermal comfort in six Australian field studies. ASHRAE Trans. B 1985, 91, 452–468. [Google Scholar]
- Humphreys, M.A.; Nicol, J.F. The validity of ISO-PMV for predicting comfort votes in every-day thermal environments. Energ. Build. 2002, 34, 667–684. [Google Scholar] [CrossRef]
- Yao, F.; Fang, H.; Han, J.; Zhang, Y. Study on the outdoor thermal comfort evaluation of the elderly in the Tibetan plateau. Sustain. Cities Soc. 2022, 77, 103582. [Google Scholar] [CrossRef]
- Velt, K.; Daanen, H. Thermal sensation and thermal comfort in changing environments. J. Build. Eng. 2017, 10, 42–46. [Google Scholar] [CrossRef]
- Han, Y.; Wang, X.; Lu, L.; Mai, X. Adaptive thermal sensation evaluation model in tents for Western Sichuan Plateau of China: A field study. Energ. Build. 2023, 286, 112952. [Google Scholar] [CrossRef]
- Yao, R.; Li, B.; Liu, J. A theoretical adaptive model of thermal comfort–Adaptive Predicted Mean Vote (aPMV). Build. Environ. 2009, 44, 2089–2096. [Google Scholar] [CrossRef]
- Nicol, J.F.; Humphreys, M.A. Adaptive thermal comfort and sustainable thermal standards for buildings. Energ. Build. 2002, 34, 563–572. [Google Scholar] [CrossRef]
- Du, H.; Lian, Z.; Lai, D.; Duanmu, L.; Zhai, Y.; Cao, B.; Zhang, Y.; Zhou, X.; Wang, Z.; Zhang, X. Evaluation of the accuracy of PMV and its several revised models using the Chinese thermal comfort Database. Energ. Build. 2022, 271, 112334. [Google Scholar] [CrossRef]
- Bellache, O.; Ouzzane, M.; Galanis, N. Coupled conduction, convection, radiation heat transfer with simultaneous mass transfer in ice rinks. Numer. Heat Transf. Part A Appl. 2005, 48, 219–238. [Google Scholar] [CrossRef]
- Omri, M.; Galanis, N. Prediction of 3D airflow and temperature field in an indoor ice rink with radiant heat sources. Build. Simul. 2010, 3, 153–163. [Google Scholar] [CrossRef]
- Palmowska, A.; Lipska, B. Research on improving thermal and humidity conditions in a ventilated ice rink arena using a validated CFD model. Int. J. Refrig. 2018, 86, 373–387. [Google Scholar] [CrossRef]
- Li, L.; Lin, W.; Zhang, T.; Liu, X. On-site measurement of thermal environment and heat transfer analysis in a curling arena. J. Build. Eng. 2021, 34, 101691. [Google Scholar] [CrossRef]
- Li, L.S.; Liu, X.H.; Zhang, T.; Lin, W.Y. Utilization of displacement ventilation and on-site measurement of thermal environment in an ice arena. Build. Environ. 2020, 186, 107391. [Google Scholar] [CrossRef]
- Lin, W.; Liu, X.; Zhang, T.; Zhou, Z. Investigation of displacement and jet ventilation systems applied in an ice rink. J. Build. Eng. 2022, 50, 104179. [Google Scholar] [CrossRef]
- GB 50176-2016; Code for Thermal Design of Civil Building. Ministry of Housing and Urban—Rural Development of the People’s Republic of China: Beijing, China, 2016. (In Chinese)
- ISO 7726; Ergonomics of the Thermal Environment-Instruments for Measuring Physical Quantities. International Organization for Standardization: Geneva, Switzerland, 1998.
- JGJ/T 347-2014; Standard of Test Methods for Thermal Environment of Building. Ministry of Housing and Urban-Rural Development of the People’s Republic of China: Beijing, China, 2014. (In Chinese)
- Oliveira, A.V.M.; Raimundo, A.M.; Gaspar, A.R.; Quintela, D.A. Globe temperature and its measurement: Requirements and limitations. Ann. Work. Expo. Health 2019, 63, 743–758. [Google Scholar] [CrossRef]
- Alfano, F.R.d.A.; Dell’Isola, M.; Ficco, G.; Palella, B.I.; Riccio, G. Small globes and pocket heat stress meters for WBGT and PHS evaluations—A critical analysis under controlled conditions. Build. Environ. 2022, 226, 109781. [Google Scholar] [CrossRef]
- Humphreys, M.A. The optimum diameter for a globe thermometer for use indoors. Ann. Occup. Hyg. 1977, 20, 135–140. [Google Scholar] [CrossRef]
- GB/T 50785-2012; Evaluation Standard for Indoor Thermal Environment in Civil Buildings. Ministry of Housing and Urban-Rural Development of the People’s Republic of China: Beijing, China, 2012. (In Chinese)
- Liu, H.; Wu, Y.; Lei, D.; Li, B. Gender differences in physiological and psychological responses to the thermal environment with varying clothing ensembles. Build. Environ. 2018, 141, 45–54. [Google Scholar] [CrossRef]
- ASHRAE Standard 55-2020; Thermal Environmental Conditions for Human Occupancy. American Society of Heating, Refrigerating and Air Conditioning Engineers, Ventilation: Atlanta, GA, USA, 2020.
- GB/T 18049; Moderate Thermal Environments—Determination of the PMV and PPD Indices and Specification of the Conditions for Thermal Comfort. State Bureau of Quality and Technical Supervision: Beijing, China, 2000. (In Chinese)
- Liu, G.; Cen, C.; Zhang, Q.; Liu, K.; Dang, R. Field study on thermal comfort of passenger at high-speed railway station in transition season. Build. Environ. 2016, 108, 220–229. [Google Scholar] [CrossRef]
- ISO 11079-2007; Ergonomics of the Thermal Environment—Determination and Interpretation of Cold Stress When Using Required Clothing Insulation (IREQ) and Local Cooling Effects. International Standard Organization: Geneva, Switzerland, 2007.
- Alfano, F.R.d.A.; Palella, B.I.; Riccio, G. Notes on the implementation of the IREQ model for the assessment of extreme cold environments. Ergonomics 2013, 56, 707–724. [Google Scholar] [CrossRef] [PubMed]
- Berquist, J.; Ouf, M.M.; O’Brien, W. A method to conduct longitudinal studies on indoor environmental quality and perceived occupant comfort. Build. Environ. 2019, 150, 88–98. [Google Scholar] [CrossRef]
- Burkov, I.; Kolosov, M.; Zharov, A.; Kolishkin, L.; Andreev, N. Numerical modeling of heat and mass transfer processes in rooms with an ice rink. In AIP Conf. Proc.; 2019; Volume 2195. [Google Scholar]
- Zhang, N.; Cao, B.; Wang, Z.; Zhu, Y.; Lin, B. A comparison of winter indoor thermal environment and thermal comfort between regions in Europe, North America, and Asia. Build. Environ. 2017, 117, 208–217. [Google Scholar] [CrossRef]
- Toulmin, S. Human adaptation. In The Philosophy of Evolution; Harvester Press: London, UK, 1981; pp. 176–195. [Google Scholar]
- Fabbri, K. Thermal comfort evaluation in kindergarten: PMV and PPD measurement through datalogger and questionnaire. Build. Environ. 2013, 68, 202–214. [Google Scholar] [CrossRef]
- Chow, T.T.; Fong, K.; Givoni, B.; Lin, Z.; Chan, A. Thermal sensation of Hong Kong people with increased air speed, temperature and humidity in air-conditioned environment. Build. Environ. 2010, 45, 2177–2183. [Google Scholar] [CrossRef]
- Leites, G.T.; Sehl, P.L.; Cunha, G.D.S.; Filho, A.D.; Meyer, F. Responses of obese and lean girls exercising under heat and thermoneutral conditions. J. Pediatr. 2013, 162, 1054–1060. [Google Scholar] [CrossRef]
- Lan, L.; Lian, Z.W.; Liu, W.W.; Liu, Y.M. Investigation of gender difference in thermal comfort for Chinese people. Eur. J. Appl. Physiol. 2008, 102, 471–480. [Google Scholar] [CrossRef]
Disclaimer/Publisher’s Note: The statements, opinions and data contained in all publications are solely those of the individual author(s) and contributor(s) and not of MDPI and/or the editor(s). MDPI and/or the editor(s) disclaim responsibility for any injury to people or property resulting from any ideas, methods, instructions or products referred to in the content. |
© 2023 by the authors. Licensee MDPI, Basel, Switzerland. This article is an open access article distributed under the terms and conditions of the Creative Commons Attribution (CC BY) license (https://creativecommons.org/licenses/by/4.0/).