Article

Material Balance Method and Dynamic Pressure Monitoring for Water-Bearing Gas Reservoirs with CO2 Injection

1
State Key Laboratory of Oil and Gas Reservoir Geology and Exploitation, Southwest Petroleum University, Chengdu 610500, China
2
PetroChina Southwest Oilfield Company, Chengdu 610500, China
*
Author to whom correspondence should be addressed.
Energies 2023, 16(12), 4592; https://doi.org/10.3390/en16124592
Submission received: 23 March 2023 / Revised: 3 June 2023 / Accepted: 6 June 2023 / Published: 8 June 2023
(This article belongs to the Section H: Geo-Energy)

Abstract

:
The storage of carbon dioxide by injecting carbon dioxide into gas reservoirs has become an important technique for achieving carbon capture, utilization, and storage. However, most studies have focused on tight gas reservoirs, and there are still few studies on the injection of carbon dioxide into water-bearing gas reservoirs. This paper analyzes the variation of reservoir pressure during CO2 injection and points out the optimal amount of CO2 injection in the reservoir, which can provide theoretical guidance in practical applications. The relationship is plotted between the formation pressure and the volume of injected carbon dioxide. The effects of reservoir inhomogeneity and the water content on the formation pressure are discussed. Dynamic monitoring of the formation pressure during carbon dioxide injection is achieved. The optimal volume of injected carbon dioxide for water-bearing gas reservoirs is determined. The results show that the formation pressure increases with an increase in the volume of injected carbon dioxide, and the curve exhibits a trend of steep increases at both ends and a gentle increase in the middle. Enhanced reservoir inhomogeneity and a low reservoir water content are favorable for carbon dioxide injection.

1. Introduction

Carbon capture, utilization, and storage (CCUS) is an important initiative for achieving carbon neutrality and mitigating global warming [1,2]. The underground storage of carbon dioxide in gas and oil reservoirs or unminable coal seams has become a worthwhile approach to reduce the greenhouse effect. For subsurface storage of carbon dioxide, in addition to stratigraphic traps, carbon dioxide can react with water to form carbonate mineral traps or form hydrodynamic traps in aquifers with very low permeability [3,4,5]. And an interdisciplinary and integrated study of CO2-related issues with the goal of increasing the potential for CO2 sequestration was conducted [6]. Liwei Zhang et al proposed a pore-scale model of multiphase reactive flow to better describe the flow during CO2 storage [7]. With the injection of carbon dioxide, gas recovery can be enhanced via the displacement of natural gas by carbon dioxide, or geological storage of carbon dioxide can be carried out via the mutual dissolution of carbon dioxide and crude oil, thus achieving the goal of increasing crude oil production and reducing carbon dioxide emissions [8]. Specifically, in tight gas or oil reservoirs, there is significant potential to enhance recovery by hydraulic fracturing and injecting carbon dioxide or other fluids into the reservoir [9]. Adsorption experiments using shale show that in more homogeneous reservoirs, carbon dioxide is more readily adsorbed on the rock surface and thereby displaces methane [10]. Numerical simulations can be used to study the CO2-enhanced gas recovery process or the storage efficiency and to investigate the effects of carbon dioxide injection on reservoirs with different parameters, such as different permeabilities, different injection rates, and different injection durations. Eshkalak et al. analyzed the effect of CO2 injection and hydraulic re-fracturing measures on CO2-EGR and simulated no-linear pressure drop using local grid refinement and concluded that both CO2 injection and repetitive hydraulic fracturing could enhance shale gas production [11]. Biagi et al. used a multi-objective optimization code based on a genetic algorithm to accurately determine the optimal CO2 injection rate to maximize CH4 recovery through a series of simulations of the CS-EGR process [12]. Song Z. et al. used numerical simulations to study CO2 storage in saline aquifers, and the proposed model allows for a more accurate assessment of CO2 storage efficiency [13]. The large amount of CO2 injected into the reservoir increases the formation pressure, which may induce earthquakes or rupture the formation and increase the risk of CO2 leakage; therefore, monitoring the formation pressure in the reservoir is an important part of CCS technology [14]. Effective monitoring of CO2 storage status can be achieved through geophysical, geochemical, remote sensing surveys, and other technical means [15]. Monitoring tools, monitoring time, and monitoring methods will also affect the monitoring effect. It is unrealistic to achieve monitoring of the CO2 storage status through only one aspect, and to achieve better monitoring results, a combination of multi-disciplinary techniques in monitoring is needed [16]. Improvements in monitoring tools are also necessary. In response to the limitations of existing monitoring instruments, Seshia et al. proposed an emerging platform technology based on resonant vibrating beam MEMS gravimeters that enables more accurate and economical monitoring of surface and wellbore environments during CO2 storage and reduces the risk of CO2 leakage [17].
The geological storage of carbon dioxide occurs in four main forms: structural storage, dissolved storage, free phase storage, and mineral storage [18,19,20]. Dissolved storage refers to the contact of carbon dioxide with crude oil, natural gas, and formation water in oil and gas reservoirs and its subsequent dissolution to enable storage. The storage capacity is associated with the heterogeneity of the gas reservoir [21,22]. The solubility of carbon dioxide is dependent on the temperature, pressure, and composition of the formation fluids. Research on the solubility of carbon dioxide has included experimental and theoretical approaches. The solubility of carbon dioxide in water or brine has been measured experimentally via the pressure–volume–temperature method in different temperatures and different pressure ranges, which gives values of the volume distribution coefficient. It has also been measured by directly measuring the gas pressure in the containing vessel and the content of carbon dioxide in a sample of the liquid phase [23,24,25,26,27,28]. Diagrams plotted using experimental data or prediction data from theoretical models show that the solubility of carbon dioxide decreases as the formation pressure decreases [29,30,31]. Duan and Sun and Duan et al. carried out a comprehensive summary and evaluation of the existing experimental data and calculation models and established a theoretical model for accurate calculation of the solubility of carbon dioxide [32,33]. Chang et al. and Kiepe et al. used data from numerous experiments on the solubility of carbon dioxide conducted by previous authors to fit a regression model. Experimental values of the solubility of carbon dioxide measured by previous authors were fitted by regression, and a more convenient empirical model was obtained [34,35].
The material balance method is widely used in oil or gas reservoirs to evaluate reservoir reserves in formations, and the basic material balance equation has been refined for application to different types of complex reservoirs. These include high-temperature and high-pressure gas reservoirs [36,37], gas reservoirs with water intrusion [38,39], and depleted gas reservoirs with carbon dioxide sequestration. An analysis of the effect of heterogeneity on water-bearing gas reservoirs using the material balance method revealed that strong heterogeneity leads to an increase in the volume of sealed gas [40]. In gas reservoirs that contain carbon dioxide, carbon dioxide occurs naturally in the subsurface region—often in large volumes—and reacts with water when water influx occurs [41,42]. When the edge water or bottom water intrudes into the gas reservoir, formation water enters the high permeability area preferentially, thus sealing the gas in the low permeability area and forming water-sealed gas, which causes the low ultimate recovery of the gas reservoir [43].
Few studies have been conducted on the injection of carbon dioxide into water-bearing gas reservoirs. In this paper, the inhomogeneity of gas reservoirs and the characteristics of carbon dioxide dissolved in water are considered. The material balance method is used to analyze the influence of carbon dioxide injection on the pressure in water-bearing gas reservoirs, and the optimal injection volume for water-bearing gas reservoirs is determined. Moreover, dynamic monitoring of the formation pressure is achieved. This paper thus provides new research methods for the study of CCUS with regard to water-bearing gas reservoirs.

2. Physical Model

The injection of carbon dioxide into abandoned water-bearing gas reservoirs to achieve storage of carbon dioxide is an important process in CCUS. In most cases, when a gas reservoir is invaded by water, gas well production decreases rapidly, which is accompanied by a decrease in formation pressure. Owing to the heterogeneity of the reservoir, water principally advances into high-permeability regions, while the gas present in low-permeability regions is sealed by the invading water to form water-sealed gas. Carbon dioxide is injected into the gas reservoir, and the storage and confinement of carbon dioxide are achieved due to carbon dioxide being soluble in water.
A physical model of the gas reservoir with injected carbon dioxide can, therefore, be established (Figure 1), assuming the following conditions: (1) the volume of the rock pores in the reservoir and the volume of the original formation water change with pressure during the process of production; (2) during the production process, owing to the inhomogeneity of the reservoir, some of the gas presents cannot be produced, and water-sealed gas is formed; (3) the injection of carbon dioxide into abandoned water-bearing gas reservoirs occurs when the carbon dioxide is in a supercritical state and dissolved in water, without considering the absorption of carbon dioxide; (4) the flow of fluid in the reservoir follows Darcy’s law, the viscosity of the fluid is constant, and the effects of gravity, capillary force, and viscous force are not considered.

3. Mathematical Model

3.1. Derivation of Mathematical Model

On the basis of the above physical model, the material balance equation for a water-bearing gas reservoir with carbon dioxide injection was derived.
When carbon dioxide is injected into the reservoir, some of the carbon dioxide dissolves in water to achieve carbon dioxide storage. In a water-bearing gas reservoir, the sum of the original gas volume and the original formation water volume is, therefore, equal to the sum of the remaining gas volume, the expansion volume of bound water and rock, the volume of injected carbon dioxide minus the volume of dissolved carbon dioxide, and the remaining formation water volume. The expression of the mathematical model is thus given by the following:
G i + W i = Δ V 1 + Δ V 2 + Δ V 3 Δ V 4 + W
where Gi is the original gas volume, m3; Wi is the original formation water volume, m3; ΔV1 is the remaining gas volume, m3; ΔV2 is the expansion volume of rock and bound water, m3; ΔV3 is the volume of injected carbon dioxide, m3; ΔV4 is the volume of dissolved carbon dioxide, m3; and W is the remaining formation water volume, m3.
The original gas volume is given by the following:
G i = G B gi
where G is the original reserve of gas, m3; and Bgi is the volume factor of gas at the original formation pressure, dimensionless.
The original formation water volume is given by the following:
W i = G B gi S wi / S gi
where Swi is the original formation water saturation, and Sgi is the original formation gas saturation, dimensionless.
During the development of the gas reservoir, the cumulative gas production increases with the production time. At the same time, as a result of the intrusion of edge/bottom water and the heterogeneity of the reservoir, the water in high-permeability regions advances first, which leads to the sequestration of gas in low-permeability regions. The remaining gas volume is given by the following:
Δ V 1 = G G B G p B g
where GB is the volume of gas in water-sealed regions, m3; Gp is the cumulative gas production, m3; and Bg is the volume factor of gas at the current pressure, dimensionless.
As the reservoir pressure decreases and water intrudes into the reservoir, the volume of the remaining formation water is given by the following:
W = W i B w / B wi + W e B w W p B w
where Bw is the volume factor of formation water at the current pressure, dimensionless; Bwi is the volume factor of formation water at the original pressure, dimensionless; We is the volume of intruded water, m3; and Wp is the cumulative water production, m3.
The expansion volume of rock and bound water is given by the following:
Δ V 2 = G B gi / S gi C f + C w S wi p i p
where Cf is the compression factor of rock, MPa−1; Cw is the compression factor of bound water, MPa−1; pi is the original formation pressure, MPa; and p is the current formation pressure, MPa.
The volume of injected carbon dioxide is given by the following:
Δ V 3 = G in B gCO 2
where Gin is the cumulative volume of injected carbon dioxide at ground level, m3; and B gCO 2 is the volume factor of carbon dioxide at the current pressure, dimensionless.
Carbon dioxide dissolves in water, and the volume of water-soluble carbon dioxide that escapes is given by the following:
Δ V 4 = W r CO 2 = W i B w / B wi + W e B w W p B w r CO 2
where r CO 2 is the ratio of dissolved carbon dioxide to water at the current formation pressure.
Substituting Equations (2)–(8) into Equation (1) yields the material balance equation for a water-bearing gas reservoir with carbon dioxide injection as follows:
G B gi + W i   = G G B G p B g + G B gi C f + C w S wi p i p S gi + G in B gCO 2 W i B w / B wi + W e B w W p B w r CO 2 + W i B w B wi + W e B w W p B w
The volume of gas in water-sealed regions is related to the volume of intruded water as follows [40]:
G B = K + V + K + + 1 × W e B w W p B w B gi
where V+ is the volume ratio, dimensionless; and K+ is the permeability ratio, dimensionless.
By substituting Equation (10) into Equation (9), the material balance equation becomes the following:
B gi B g = 1 G p G K + V + K + + 1 W e B w W p B w G B gi + G in B gCO 2 G B g 1 + S wi S gi B w B wi r CO 2 C f + C w S wi p i p S gi + r CO 2 1 W e B w W p B w G B gi
The volume factors are related to the pressure as follows:
B g = Z T 293.15 p sc p
B gi = Z i T i 293.15 p sc p i
B gCO 2 = Z CO 2 T 293.15 p sc p
where Z is the gas deviation factor at the current formation pressure, dimensionless; T is the reservoir temperature at the current formation pressure, K; psc is the pressure under standard conditions, i.e., 0.1013 MPa; Zi is the gas deviation factor at the original formation pressure; Ti is the reservoir temperature at the original formation pressure, K; and Z CO 2 is the deviation factor of carbon dioxide, which can be calculated by the model established by Duan and Sun [33].
By substituting Equations (12)–(14) into Equation (11) and treating the reservoir temperature as a constant, Equation (11) becomes the following:
p / Z p i / Z i = 1 G p G K + V + K + + 1 W e B w W p B w G B gi + G in G Z CO 2 Z 1 + S wi S gi B w B wi r CO 2 C f + C w S wi p i p S gi + r CO 2 1 W e B w W p B w G B gi
Because the pressure has little effect on the volume factor of water, Bw is approximately equal to Bwi.
The volume factor of stored water (ω) has the following relationship with the volume of intruded water:
ω = W e B w W p B w G B gi
Let
A = K + V + K + + 1
where A is the reservoir heterogeneity factor, which represents the degree of heterogeneity of the reservoir and the lateral heterogeneity of the reservoir permeability.
By substituting Equations (16) and (17) into Equation (15) and treating the reservoir temperature as a constant, Equation (11) becomes the following:
p / Z p i / Z i = 1 G p G A ω + G in G Z CO 2 Z 1 + S wi S gi r CO 2 C f + C w S wi p i p S gi + r CO 2 1 ω
Equation (18) is thus the material balance formula for a water-bearing gas reservoir with carbon dioxide injection.
In addition, Equation (18) can describe the material balance of an acid gas reservoir (containing carbon dioxide), i.e., the material balance when the volume of injected carbon dioxide is 0, as follows:
p / Z p i / Z i = 1 G p G A ω 1 + S wi S gi r CO 2 C f + C w S wi p i p S gi + r CO 2 1 ω
When there is no water intrusion in the gas reservoir, the volume factor of stored water (ω) is 0, and the ratio of dissolved carbon dioxide to water ( r CO 2 ) is also 0. Equation (19), therefore, becomes the following:
p / Z p i / Z i = 1 G p G 1 C f + C w S wi p i p S gi
Equation (20) is the material balance formula for a gas reservoir if pressure sensitivity is considered.
If the pressure sensitivity of the reservoir is not considered, Equation (20) becomes the following:
p / Z p i / Z i = 1 G p G
Equation (21) is the material balance formula for a pure gas reservoir, and the proposed pressure is linearly related to the production degree of the gas reservoir.

3.2. Calculation of Ratio of Dissolved Carbon Dioxide to Water

The number of moles (n) of carbon dioxide dissolved in formation water can be calculated from the solubility of carbon dioxide:
n = V w × ρ w × m CO 2
where Vw is the subsurface volume of formation water containing carbon dioxide, m3; ρw is the density of formation water, kg/m3; and m CO 2 is the solubility of carbon dioxide [33], mol/kg.
According to the equation of state of carbon dioxide gas, it can be expressed as follows:
p V CO 2 = Z CO 2 n R T
V CO 2 = Z CO 2 n R T p
where V CO 2 is the subsurface volume of carbon dioxide dissolved in formation water, m3; and R is the universal gas constant, i.e., 8.314 Pa·m3/(mol·K).
Substituting Equation (22) into Equation (24) gives the following:
V CO 2 = Z CO 2 V w ρ w m CO 2 R T p
The ratio of dissolved carbon dioxide to water can thus be expressed as follows:
r CO 2 = V CO 2 V W = Z CO 2 ρ w m CO 2 R T p
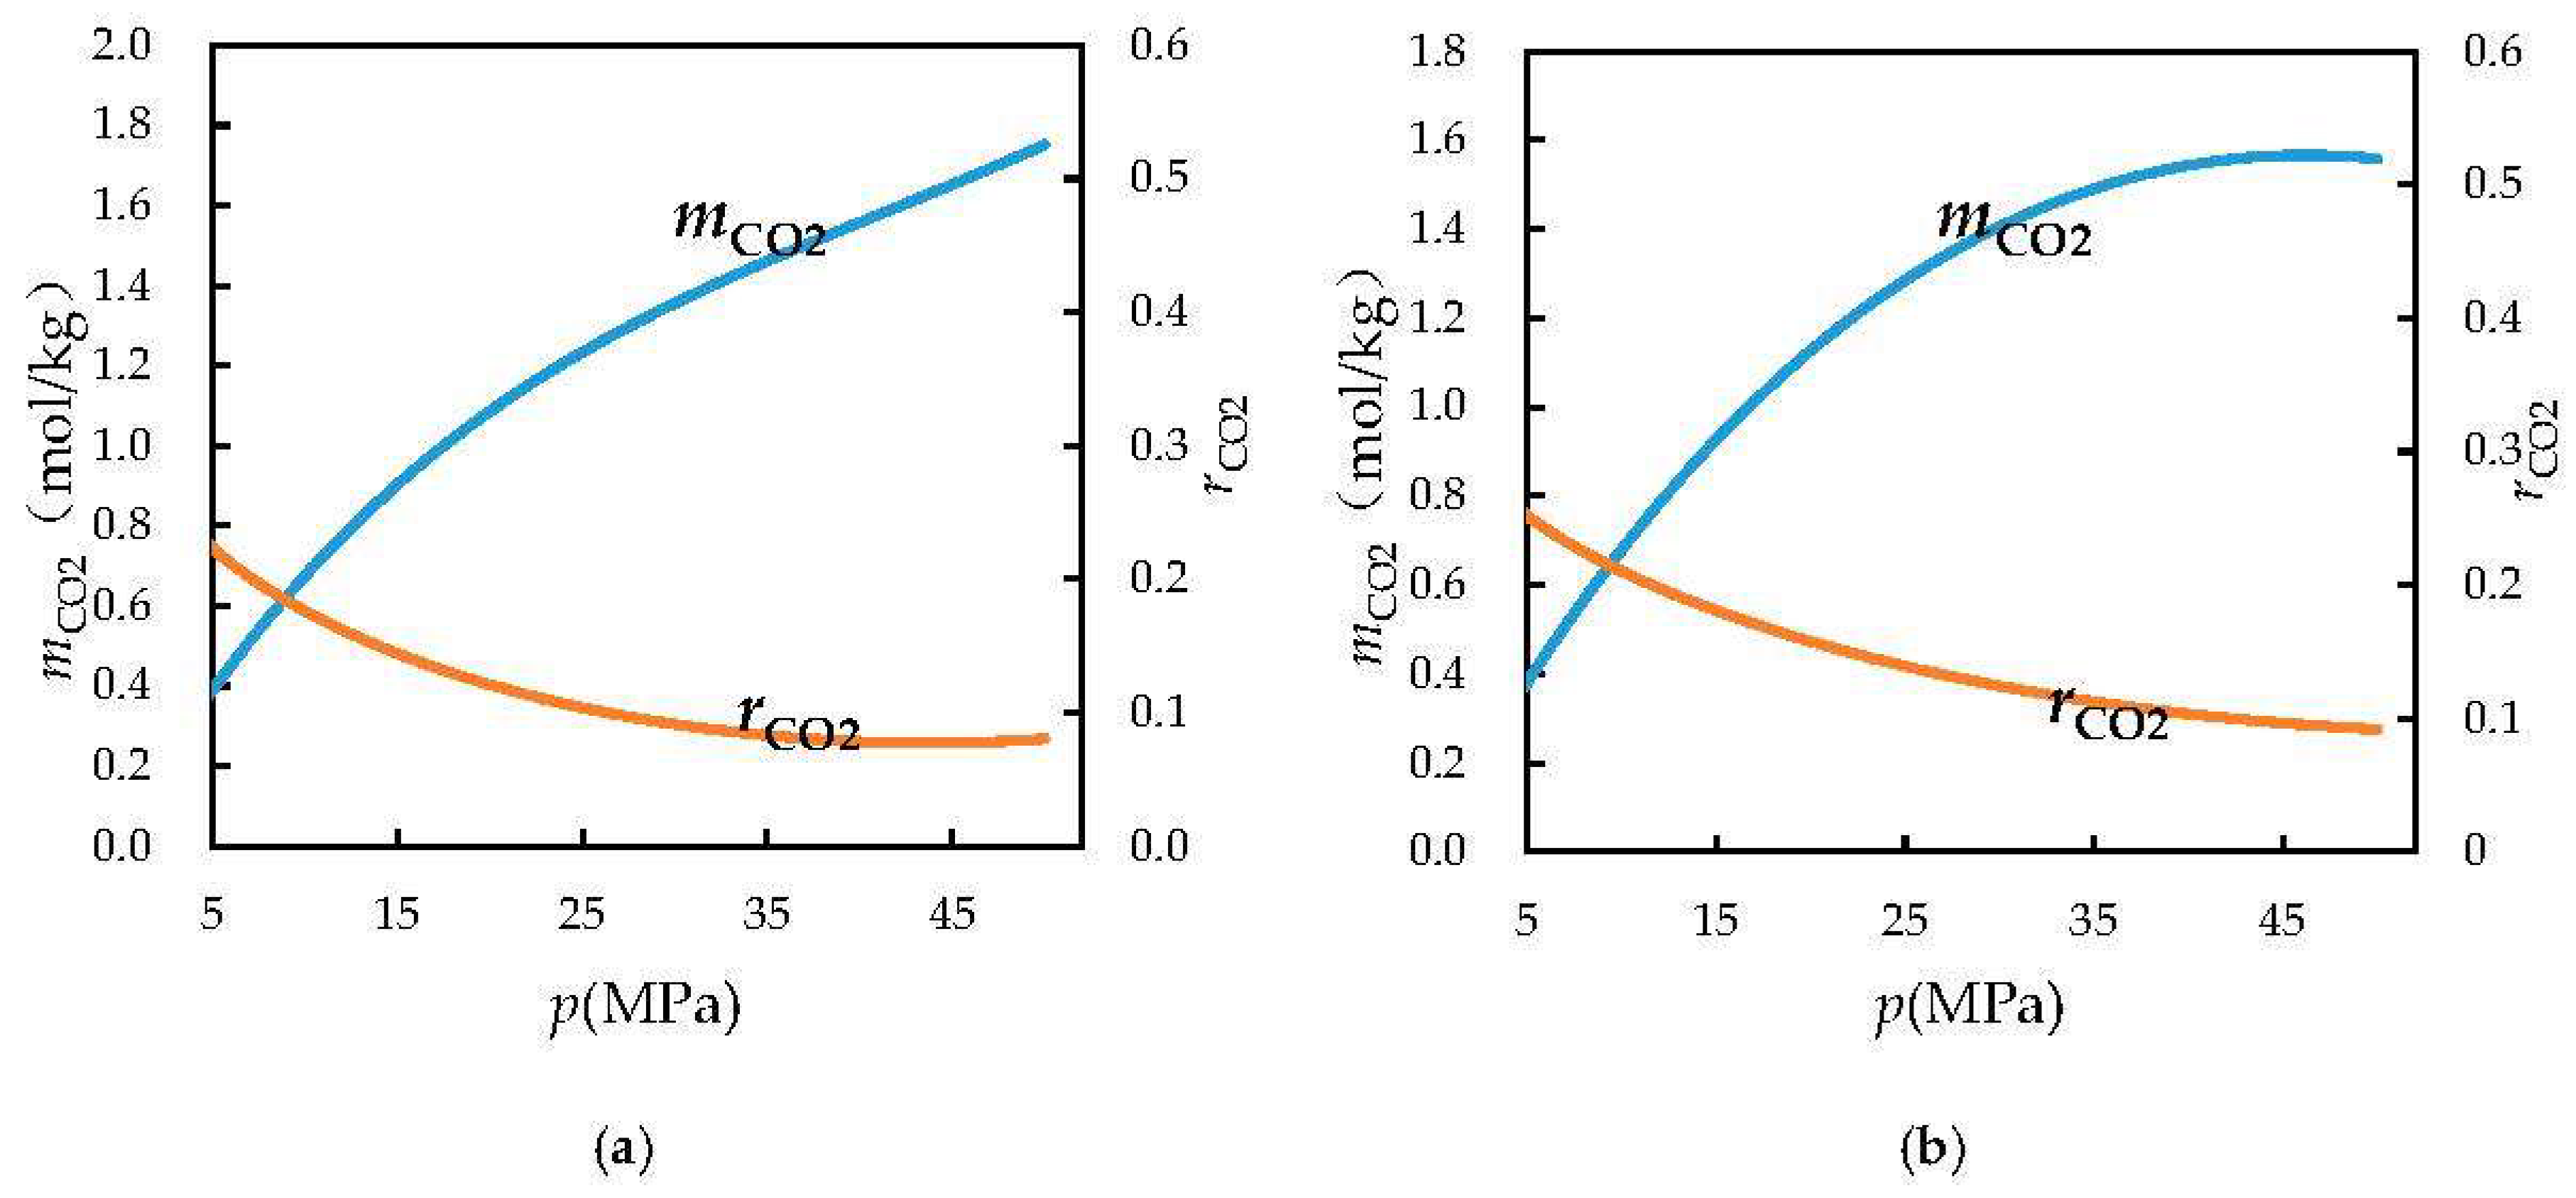
According to the equation for the ratio of dissolved carbon dioxide to water as a function of the formation pressure, the ratio of dissolved carbon dioxide to water was plotted versus the formation pressure (Figure 2 and Figure 3).
Here, the ratio of dissolved carbon dioxide to water is the ratio of the volume of carbon dioxide dissolved in water to the volume of water. The solubility of carbon dioxide in water is calculated from the model devised by Duan and Sun and substituted into Equation (26). The ratio of dissolved carbon dioxide to water is calculated to obtain the equation for the ratio of dissolved carbon dioxide to water as a function of the formation pressure and to plot the corresponding curve. In the model devised by Duan and Sun, the calculated values of the solubility of carbon dioxide have small errors with regard to experimental values, and the supercritical state of carbon dioxide has been taken into account.

3.3. Solution of the Mathematical Model

The cumulative gas production (Gp), an original reserve of gas (G), the cumulative volume of injected carbon dioxide (Gin), original formation water saturation (Swi), original formation gas saturation (Sgi), compression factor of rock (Cf), and compression factor of bound water (Cw) are known. The deviation factor of carbon dioxide ( Z CO 2 ) and the gas deviation factor (Z) can be calculated using the model devised by Duan and Sun (2003) and the DAK method. In combination with the reservoir heterogeneity factor (A), the ratio of dissolved carbon dioxide to water ( r CO 2 ), and the volume factor of stored water (ω), Equation (18) can be solved. Finally, the curve of variations in the formation pressure during CO2 injection can be plotted.
The left and right sides of Equation (18) are pressure-related functions that cannot be directly calculated by substituting pressure. An iterative algorithm is, therefore, used to find the optimal solution of Equation (18). The derived method for solving the material balance equation with regard to carbon dioxide injection in a water-bearing gas reservoir is as follows:
  • Let p0 = pi;
  • Let the initial value of Gin be 0;
  • Obtain the values of Z CO 2 , Z, and r CO 2 by substituting p0; combine Gp, G, Swi, Sgi, Cf, Cw, A, and ω and substitute them into the right part of Equation (18); then calculate the pressure on the left part of Equation (18), and let the pressure be p1;
  • Obtain the values of Z CO 2 1 , Z1, and r CO 2 1 by substituting p1; combine Gp, G, Swi, Sgi, Cf, Cw, A, and ω and substitute them into the right part of Equation (18); then, calculate the pressure on the left part of Equation (18), and let the pressure be p2;
  • Make p2 equal to p0;
  • Repeat steps (3)–(5) until p2p1 < 0.0001;
  • Output the value of p at this point;
  • Increase Gin by 0.1 and repeat steps (3)–(8) until the formation pressure reaches the overlying formation pressure (ps; assuming that ps = 1.1pi);
  • On the basis of the value of Gin and the corresponding value of p, changes in formation pressure during carbon dioxide injection can be characterized.

4. Results and Discussion

The material balance formula for a water-bearing gas reservoir with carbon dioxide injection was derived from the physical and mathematical models. From the solution of the material balance equation, the volume of injected carbon dioxide can be plotted against the formation pressure. This method enables monitoring of the formation pressure during the storage of carbon dioxide in an abandoned water-bearing gas reservoir and the estimation of the maximum volume of injected carbon dioxide.
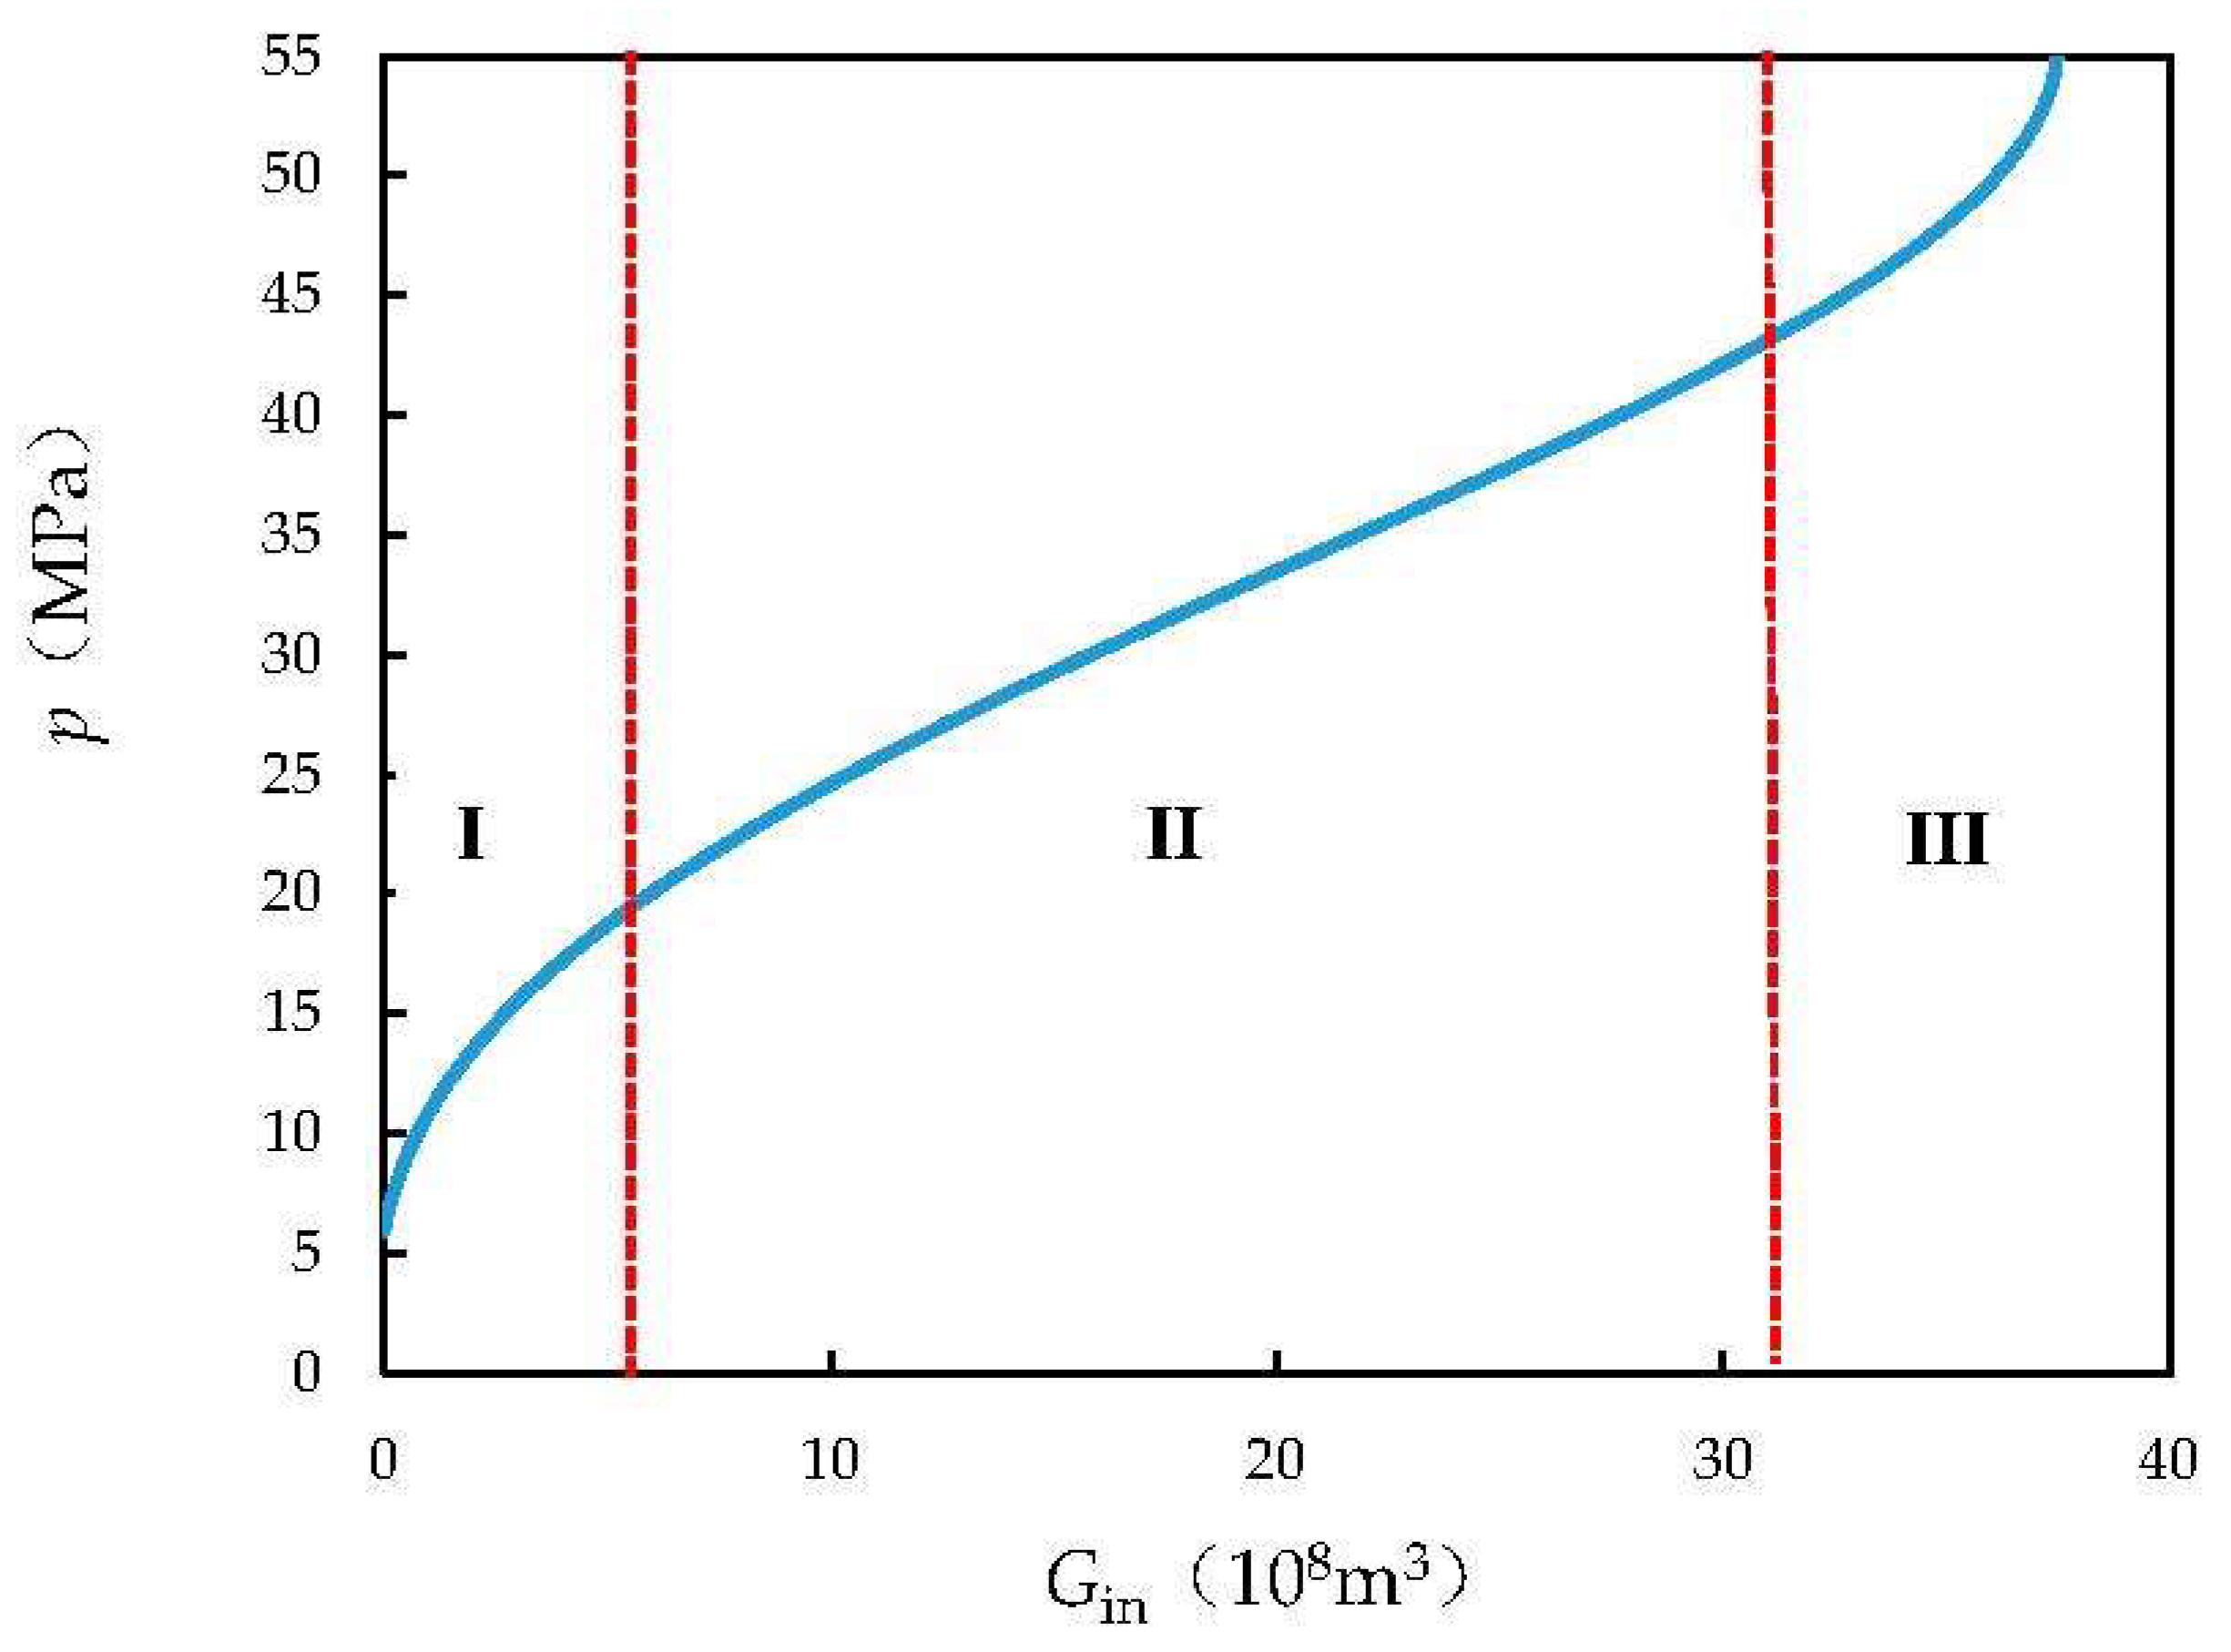
A typical curve of the formation pressure during carbon dioxide injection is shown in Figure 4 and has the characteristics of steep increases at both ends and a gentle increase in the middle. It can, therefore, be divided into three parts: the initial part I, the middle part II, and the final part III.
In the initial part I, the initial steep section indicates a rapid increase in the formation pressure with an increase in the volume of injected carbon dioxide. At this time, the formation pressure deficit is large, and carbon dioxide is not dissolved in water in large quantities. Carbon dioxide injection, therefore, plays a vital role in replenishing the reservoir energy, and the formation pressure recovers rapidly.
The middle part II is the main stage of formation pressure recovery. The main reason for the slowdown in formation pressure recovery is the fact that as a large amount of carbon dioxide is injected, some of the carbon dioxide dissolves in water, and the dissolution rate tends to be uniform. Therefore, the formation pressure in this stage exhibits a linear relationship with the amount of injected carbon dioxide.
In the final part III, the steeply curved section at the end of the curve indicates a dramatic increase in pressure with the injection of carbon dioxide. At this time, the reservoir is not in a stable state. Continued injection of carbon dioxide will increase the risk of reservoir rupture and lead to leakage of carbon dioxide. At the end of the second stage and the beginning of the third stage, the volume of carbon dioxide injected can be regarded as the maximum volume of carbon dioxide injected into the reservoir.
The variations in formation pressure under different conditions during carbon dioxide injection were plotted. The curves shown in Figure 5 still satisfy the characteristics of steep increases at both ends and a slow increase in the middle, as shown in Figure 4. This reflects the effects of different reservoir parameters on formation pressure recovery. As shown in Figure 5a, the higher the cumulative gas production, the faster the formation pressure recovery when carbon dioxide is injected and the higher the maximum volume of injected carbon dioxide. Figure 5b shows that at the same production level, when the homogeneity of the reservoir is greater, the formation pressure is higher when the same volume of carbon dioxide is injected. Moreover, the formation pressure recovers more rapidly, while the volume of carbon dioxide that can be stored in the reservoir decreases. As shown in Figure 5c, when the volume factor of stored water increases, the water content in the reservoir increases, and the volume of gas that can be held decreases. Therefore, when the same amount of carbon dioxide is injected, the larger the volume factor of water, the faster the rise in the formation pressure, and the lower the maximum volume of injected carbon dioxide. This method enables the determination of the maximum amount of carbon dioxide injected into an abandoned water-bearing reservoir, as well as dynamic monitoring of the formation pressure.

5. Instance Analysis

The objective of this ORC (Offshore Reinjection of CO2) project is to assess the feasibility of injecting CO2 into depleted or near-depleted natural gas fields to establish a long-term, industrial-scale CO2 injection and storage facility. The project investigates the necessary surface and subsurface equipment, the behavior of the gas field, the economic feasibility of subsurface injection and storage, and the legal, regulatory, and social impacts of the project. It also assesses any potential health, safety, and environmental impacts associated with CO2 injection and storage. GPN’s(GDF SUEZ E&P Nederland B.V.) K12-B gas field is a well-known CO2 reinjection project. Since the K12-B field produces up to 13 percent CO2 in natural gas, GPN chose to reinject CO2 into the reservoir in order to control CO2 emissions. The K12-B gas field is located in the Dutch sector of the North Sea and is a sandstone gas field. The porosity of sandstone is generally 13% and the average permeability is 2-10 md (extreme values up to 1000 md). The depth and temperature of the gas field are 3800 m and 400.15 K respectively. Gas production from the reservoir is approximately 300,000 Nm3/day. The K12-B6 gas well has been injecting CO2 since 2005 and continued until mid-2012 [44].
According to the information in Ref. [44], the basic injection parameters of well K12-B6 can be obtained (Table 1).
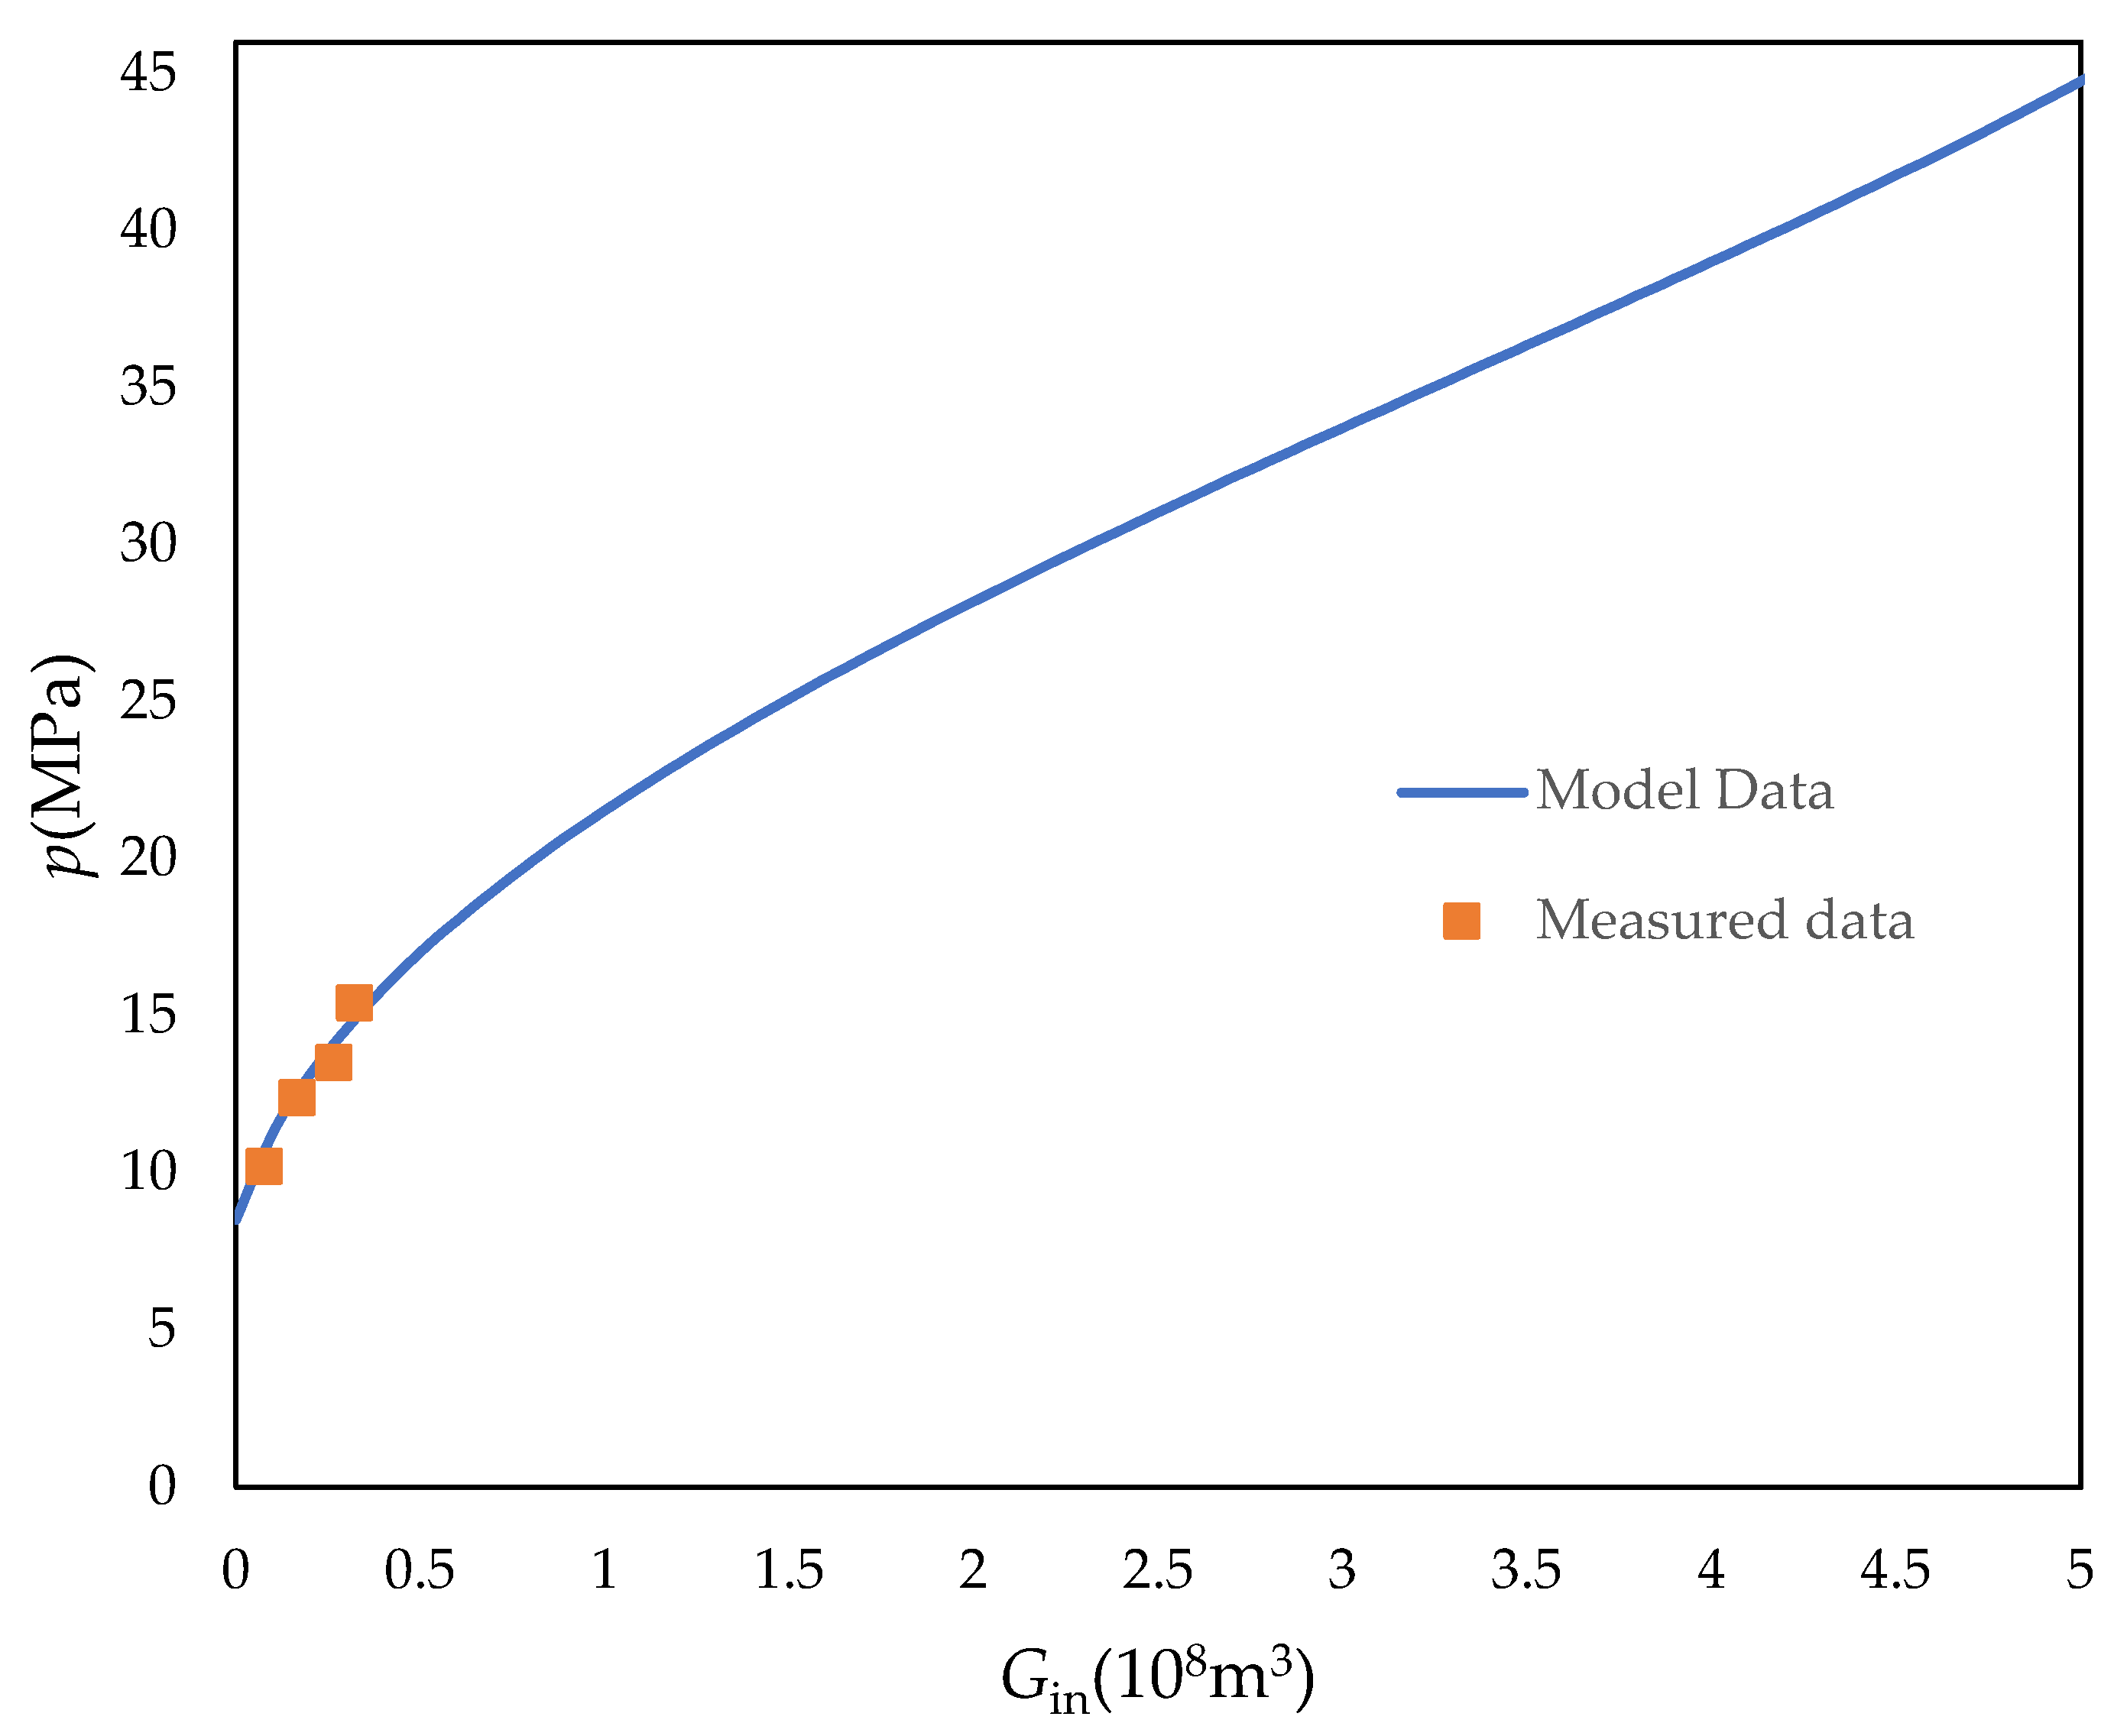
As shown in Figure 6, the model proposed in this paper is validated according to the example, and it can be found that the relationship between the actual injected CO2 volume and pressure of this injection well has a good correspondence with the fitted curve in the model. This also further verifies the accuracy of the model. Also, the model proposed in this paper can predict the pressure in the next time period, which can help guide the application of CO2 injection technology.

6. Conclusions

In this paper, the material balance equation for a water-bearing gas reservoir with carbon dioxide injection has been derived, and the characteristic curve for the formation pressure during carbon dioxide injection has been plotted. The factors affecting the recovery of the formation pressure in a water-bearing gas reservoir with carbon dioxide injection have also been analyzed. The following conclusions are thus obtained.
The typical curve of the relationship between the injected carbon dioxide volume and formation pressure satisfies the characteristics of steep increases at both ends and a gentle increase in the middle. When carbon dioxide is first injected into the gas reservoir, the reservoir is in a pressure deficit state, and the pressure recovers quickly. As carbon dioxide continues to be injected, the energy in the reservoir gradually reaches dynamic equilibrium, and the formation pressure exhibits a linear relationship with the volume of injected carbon dioxide. As the volume of injected carbon dioxide continues to increase, the reservoir reaches saturation, and the formation pressure increases steeply. At this time, the reservoir is at risk of rupture, and it is not suitable to continue injecting carbon dioxide. The volume of carbon dioxide injected at the end of the stage when there is a linear relationship between the formation pressure and the volume of injected carbon dioxide is regarded as the maximum volume of injected carbon dioxide.
Different parameters of the reservoir can also affect formation pressure recovery. As the cumulative gas production from the reservoir increases, the reservoir can hold more carbon dioxide, and the greater the maximum volume of injected carbon dioxide. When the reservoir is more inhomogeneous, and the formation pressure recovers more slowly, more carbon dioxide can be accommodated. When water content in the reservoir is high, the volume of injected carbon dioxide that can be accommodated decreases, and the formation pressure recovers more quickly.
This method can be applied to the study of carbon dioxide injection in abandoned water-bearing gas fields. It can also provide a new direction in monitoring the formation pressure during CCUS and determine the maximum volume of injected carbon dioxide for the practical application of CCUS.

Author Contributions

Conceptualization, X.T.; Writing—original draft preparation, J.S.; Investigation, D.H.; Resources, Q.L.; Data curation, T.W. All authors have read and agreed to the published version of the manuscript.

Funding

This research was funded by the Science and Technology Cooperation Project of the CNPC-SWPU Innovation Alliance (grant number 2020CX01000).

Data Availability Statement

Not applicable.

Conflicts of Interest

The authors declare that there are no conflict of interest regarding the publication of this article.

References

  1. Che, X.; Yi, X.; Dai, Z.; Zhang, Z.; Zhang, Y. Application and Development Countermeasures of CCUS Technology in China’s Petroleum Industry. Atmosphere 2022, 13, 1757. [Google Scholar] [CrossRef]
  2. Zhang, L.; Wang, Y.; Miao, X.; Gan, M.; Li, X. Geochemistry in geologic CO2 utilization and storage: A brief review. Adv. Geo-Energy Res. 2019, 3, 304–313. [Google Scholar] [CrossRef]
  3. Bachu, S.; Gunter, W.; Perkins, E. Aquifer disposal of CO2: Hydrodynamic and mineral trapping. Energy Convers. Manag. 1994, 35, 269–279. [Google Scholar] [CrossRef]
  4. Baines, S.J.; Worden, R.H. Geological Storage of Carbon Dioxide; Special Publications; Geological Society: London, UK, 2004; Volume 233, pp. 1–6. [Google Scholar]
  5. Gilfillan, S.M.; Ballentine, C.J.; Holland, G.; Blagburn, D.; Lollar, B.S.; Stevens, S.; Schoell, M.; Cassidy, M. The noble gas geochemistry of natural CO2 gas reservoirs from the Colorado Plateau and Rocky Mountain provinces, USA. Geochim. Cosmochim. Acta 2008, 72, 1174–1198. [Google Scholar] [CrossRef] [Green Version]
  6. Xu, T.; Tian, H.; Zhu, H.; Cai, J. China actively promotes CO2 capture, utilization and storage research to achieve carbon peak and carbon neutrality. Adv. Geo-Energy Res. 2022, 6, 1–3. [Google Scholar] [CrossRef]
  7. Zhang, L.; Chen, L.; Hu, R.; Cai, J. Subsurface multiphase reactive flow in geologic CO2 storage: Key impact factors and characterization approaches. Adv. Geo-Energy Res. 2022, 6, 179–180. [Google Scholar] [CrossRef]
  8. Al-Abri, A.; Sidiq, H.; Amin, R. Mobility ratio, relative permeability and sweep efficiency of supercritical CO2 and methane injection to enhance natural gas and condensate recovery: Coreflooding experimentation. J. Nat. Gas Sci. Eng. 2012, 9, 166–171. [Google Scholar] [CrossRef]
  9. Andersen, P.Ø. Carbon capture utilization and storage (CCUS) in tight gas and oil reservoirs. J. Nat. Gas Sci. Eng. 2020, 81, 103458. [Google Scholar] [CrossRef]
  10. Chima, F.U.; Mengdi, S.; Zhejun, P.; Mehdi, O.; Bo, L.; Yanran, X.; Agwom, I.M.; Happiness, I.U.; Mohammed, D.A.; Baolin, Y. An insight into CO2 sequestration and EGR in Longmaxi and Niutitang shale formations via experimental analysis. Fuel 2022, 324, 124776. [Google Scholar]
  11. Eshkalak, M.O.; Al-Shalabi, E.W.; Sanaei, A.; Aybar, U.; Sepehrnoori, K. Simulation study on the CO2-driven enhanced gas recovery with sequestration versus the re-fracturing treatment of horizontal wells in the U.S. unconventional shale reservoirs. J. Nat. Gas Sci. Eng. 2014, 21, 1015–1024. [Google Scholar] [CrossRef]
  12. Biagi, J.; Agarwal, R.; Zhang, Z. Simulation and optimization of enhanced gas recovery utilizing CO2. Energy 2016, 94, 78–86. [Google Scholar] [CrossRef]
  13. Song, Z.; Song, H.; Cao, Y.; Killough, J.; Leung, J.; Huang, G.; Gao, S. Numerical research on CO2 storage efficiency in saline aquifer with low-velocity non-Darcy flow. J. Nat. Gas Sci. Eng. 2015, 23, 338–345. [Google Scholar] [CrossRef]
  14. Saptharishi, P.; Makwana, M. Technical and Geological review of Carbon dioxide Geo Sequestration along with analysis and study of various Monitoring Techniques. In Proceedings of the International Petroleum Technology Conference, Bangkok, Thailand, 15–17 November 2011. [Google Scholar]
  15. Oppert, S.; Adachi, J.; Thornton, D.; Royle, A. Monitoring technology to enable characterization of CCUS reservoirs. In Proceedings of the SEG/AAPG International Meeting for Applied Geoscience & Energy, Houston, TX, USA, 28 August–1 September 2022. [Google Scholar]
  16. Fibbi, G.; Del Soldato, M.; Fanti, R. Review of the Monitoring Applications Involved in the Underground Storage of Natural Gas and CO2. Energies 2023, 16, 12. [Google Scholar] [CrossRef]
  17. Seshia, A.A.; Neill, F. MEMS-based gravity imaging for CO2 storage monitoring. In Proceedings of the SEG/AAPG International Meeting for Applied Geoscience & Energy, Houston, TX, USA, 28 August–1 September 2022. [Google Scholar]
  18. Montes-Hernandez, G.; Pérez-López, R.; Renard, F.; Nieto, J.; Charlet, L. Mineral sequestration of CO2 by aqueous carbonation of coal combustion fly-ash. J. Hazard. Mater. 2009, 161, 1347–1354. [Google Scholar] [CrossRef] [PubMed] [Green Version]
  19. Zhang, R.; Yin, X.; Winterfeld, P.H.; Wu, Y.-S. A fully coupled thermal-hydrological-mechanical-chemical model for CO2 geological sequestration. J. Nat. Gas Sci. Eng. 2016, 28, 280–304. [Google Scholar] [CrossRef] [Green Version]
  20. Celia, M.A.; Nordbotten, J.M. Practical modeling approaches for geological storage of carbon dioxide. Groundwater 2009, 47, 627–638. [Google Scholar] [CrossRef]
  21. Stein, M.H.; Ghotekar, A.L.; Avasthi, S. CO2 sequestration in a depleted gas field: A material balance study. In Proceedings of the SPE EUROPEC/EAGE Annual Conference and Exhibition, Barcelona, Spain, 14–17 June 2010; OnePetro: Richardson, TX, USA, 2010. [Google Scholar]
  22. Teng, H.; Masutani, S.; Kinoshita, C.; Nihous, G. Solubility of CO2 in the ocean and its effect on CO2 dissolution. Energy Convers. Manag. 1996, 37, 1029–1038. [Google Scholar] [CrossRef]
  23. Spycher, N.; Pruess, K.; Ennis-King, J. CO2-H2O mixtures in the geological sequestration of CO2. Assessment and calculation of mutual solubilities from 12 to 100 C and up to 600 bar. Geochim. Cosmochim. Acta 2003, 67, 3015–3031. [Google Scholar] [CrossRef]
  24. Ellis, A.; Golding, R. The solubility of carbon dioxide above 100 degrees C in water and in sodium chloride solutions. Am. J. Sci. 1963, 261, 47–60. [Google Scholar] [CrossRef]
  25. Hu, J.; Duan, Z.; Zhu, C.; Chou, I.-M. PVTx properties of the CO2–H2O and CO2–H2O–NaCl systems below 647 K: Assessment of experimental data and thermodynamic models. Chem. Geol. 2007, 238, 249–267. [Google Scholar] [CrossRef]
  26. Yan, W.; Huang, S.; Stenby, E.H. Measurement and modeling of CO2 solubility in NaCl brine and CO2–saturated NaCl brine density. Int. J. Greenh. Gas Control 2011, 5, 1460–1477. [Google Scholar] [CrossRef]
  27. Mohammadian, E.; Hamidi, H.; Asadullah, M.; Azdarpour, A.; Motamedi, S.; Junin, R. Measurement of CO2 solubility in NaCl brine solutions at different temperatures and pressures using the potentiometric titration method. J. Chem. Eng. Data 2015, 60, 2042–2049. [Google Scholar] [CrossRef]
  28. Salaheddine, C.; Pezhman, A.; Pascal, T.; Christophe, C.; Antonin, C.; Jerome, C.; Patrice, P. Measurements and Modeling of High-Pressure O2 and CO2 Solubility in Brine (H2O + NaCl) between 303 and 373 K and Pressures up to 36 MPa. J. Chem. Eng. Data 2021, 66, 609–620. [Google Scholar]
  29. King, M.; Mubarak, A.; Kim, J.; Bott, T. The mutual solubilities of water with supercritical and liquid carbon dioxides. J. Supercrit. Fluids 1992, 5, 296–302. [Google Scholar] [CrossRef]
  30. Zheng, D.-Q.; Guo, T.-M.; Knapp, H. Experimental and modeling studies on the solubility of CO2, CHC1F2, CHF3, C2H2F4 and C2H4F2 in water and aqueous NaCl solutions under low pressures. Fluid Phase Equilibria 1997, 129, 197–209. [Google Scholar] [CrossRef]
  31. Bando, S.; Takemura, F.; Nishio, M.; Hihara, E.; Akai, M. Solubility of CO2 in aqueous solutions of NaCl at (30 to 60) C and (10 to 20) MPa. J. Chem. Eng. Data 2003, 48, 576–579. [Google Scholar] [CrossRef]
  32. Duan, Z.; Sun, R. An improved model calculating CO2 solubility in pure water and aqueous NaCl solutions from 273 to 533 K and from 0 to 2000 bar. Chem. Geol. 2003, 193, 257–271. [Google Scholar] [CrossRef]
  33. Duan, Z.; Sun, R.; Zhu, C.; Chou, I.-M. An improved model for the calculation of CO2 solubility in aqueous solutions containing Na+, K+, Ca2+, Mg2+, Cl, and SO42−. Mar. Chem. 2006, 98, 131–139. [Google Scholar] [CrossRef]
  34. Chang, Y.-B.; Coats, B.K.; Nolen, J.S. A compositional model f or CO2 floods including CO2 solubility in water. In Proceedings of the Permian Basin Oil and Gas Recovery Conference, Midland, TX, USA, 27–29 March 1996; OnePetro: Richardson, TX, USA, 1996. [Google Scholar]
  35. Kiepe, J.; Horstmann, S.; Fischer, K.; Gmehling, J. Experimental determination and prediction of gas solubility data for CO2 + H2O mixtures containing NaCl or KCl at temperatures between 313 and 393 K and pressures up to 10 MPa. Ind. Eng. Chem. Res. 2002, 41, 4393–4398. [Google Scholar] [CrossRef]
  36. Sun, H.; Cao, W.; Li, J.; Jia, W.; Li, Y.; Wu, Y.; Zhu, S.; Fu, X.; Yang, M.; Meng, G. A material balance based practical analysis method to improve the dynamic reserve evaluation reliability of ultra-deep gas reservoirs with ultra-high pressure. Nat. Gas Ind. B 2021, 8, 79–87. [Google Scholar] [CrossRef]
  37. Zhang, L.; He, Y.; Guo, C.; Yu, Y. Dynamic Material Balance Method for Estimating Gas in Place of Abnormally High-Pressure Gas Reservoirs. Lithosphere 2021, 2021, 6669012. [Google Scholar] [CrossRef]
  38. Carter, R.; Tracy, G. An improved method for calculating water influx. Trans. AIME 1960, 219, 415–417. [Google Scholar] [CrossRef]
  39. Jiao, Y.; Xia, J.; Liu, P.; Zhang, J.; Li, B.; Tian, Q.; Wu, Y. New material balance analysis method for abnormally high-pressured gas-hydrocarbon reservoir with water influx. Int. J. Hydrogen Energy 2017, 42, 18718–18727. [Google Scholar] [CrossRef]
  40. Tan, X.; Peng, G.; Li, X.; Chen, Y.; Xu, X.; Kui, M.; Li, Q.; Yang, G.; Xiao, H. Material balance method and classification of non-uniform water invasion mode for water-bearing gas reservoirs considering the effect of water sealed gas. Nat. Gas Ind. B 2021, 8, 353–358. [Google Scholar] [CrossRef]
  41. Hawthorne, S.B.; Miller, D.J.; Holubnyak, Y.; Harju, J.A.; Kutchko, B.G.; Strazisar, B.R. Experimental investigations of the effects of acid gas (H2S/CO2) exposure under geological sequestration conditions. Energy Procedia 2011, 4, 5259–5266. [Google Scholar] [CrossRef] [Green Version]
  42. Feng, Y.; Hu, S.; Liu, X.; Luo, G.; Zhu, G. Prevention and disposal technologies of gas hydrates in high-sulfur gas reservoirs containing CO2. J. Nat. Gas Sci. Eng. 2014, 19, 344–349. [Google Scholar] [CrossRef]
  43. Xiong, W.; Zhu, Z.; Gao, S. Material balance equation of waterflooding gas reservoir considering trapped gas. Pet. Drill. Tech. 2012, 40, 93–97. [Google Scholar]
  44. Van der Meer, L.G.H. The K12-B CO2 injection project in The Netherlands. In Geological Storage of Carbon Dioxide (CO2); Woodhead Publishing: Sawston, UK, 2013; pp. 301–327. [Google Scholar] [CrossRef]
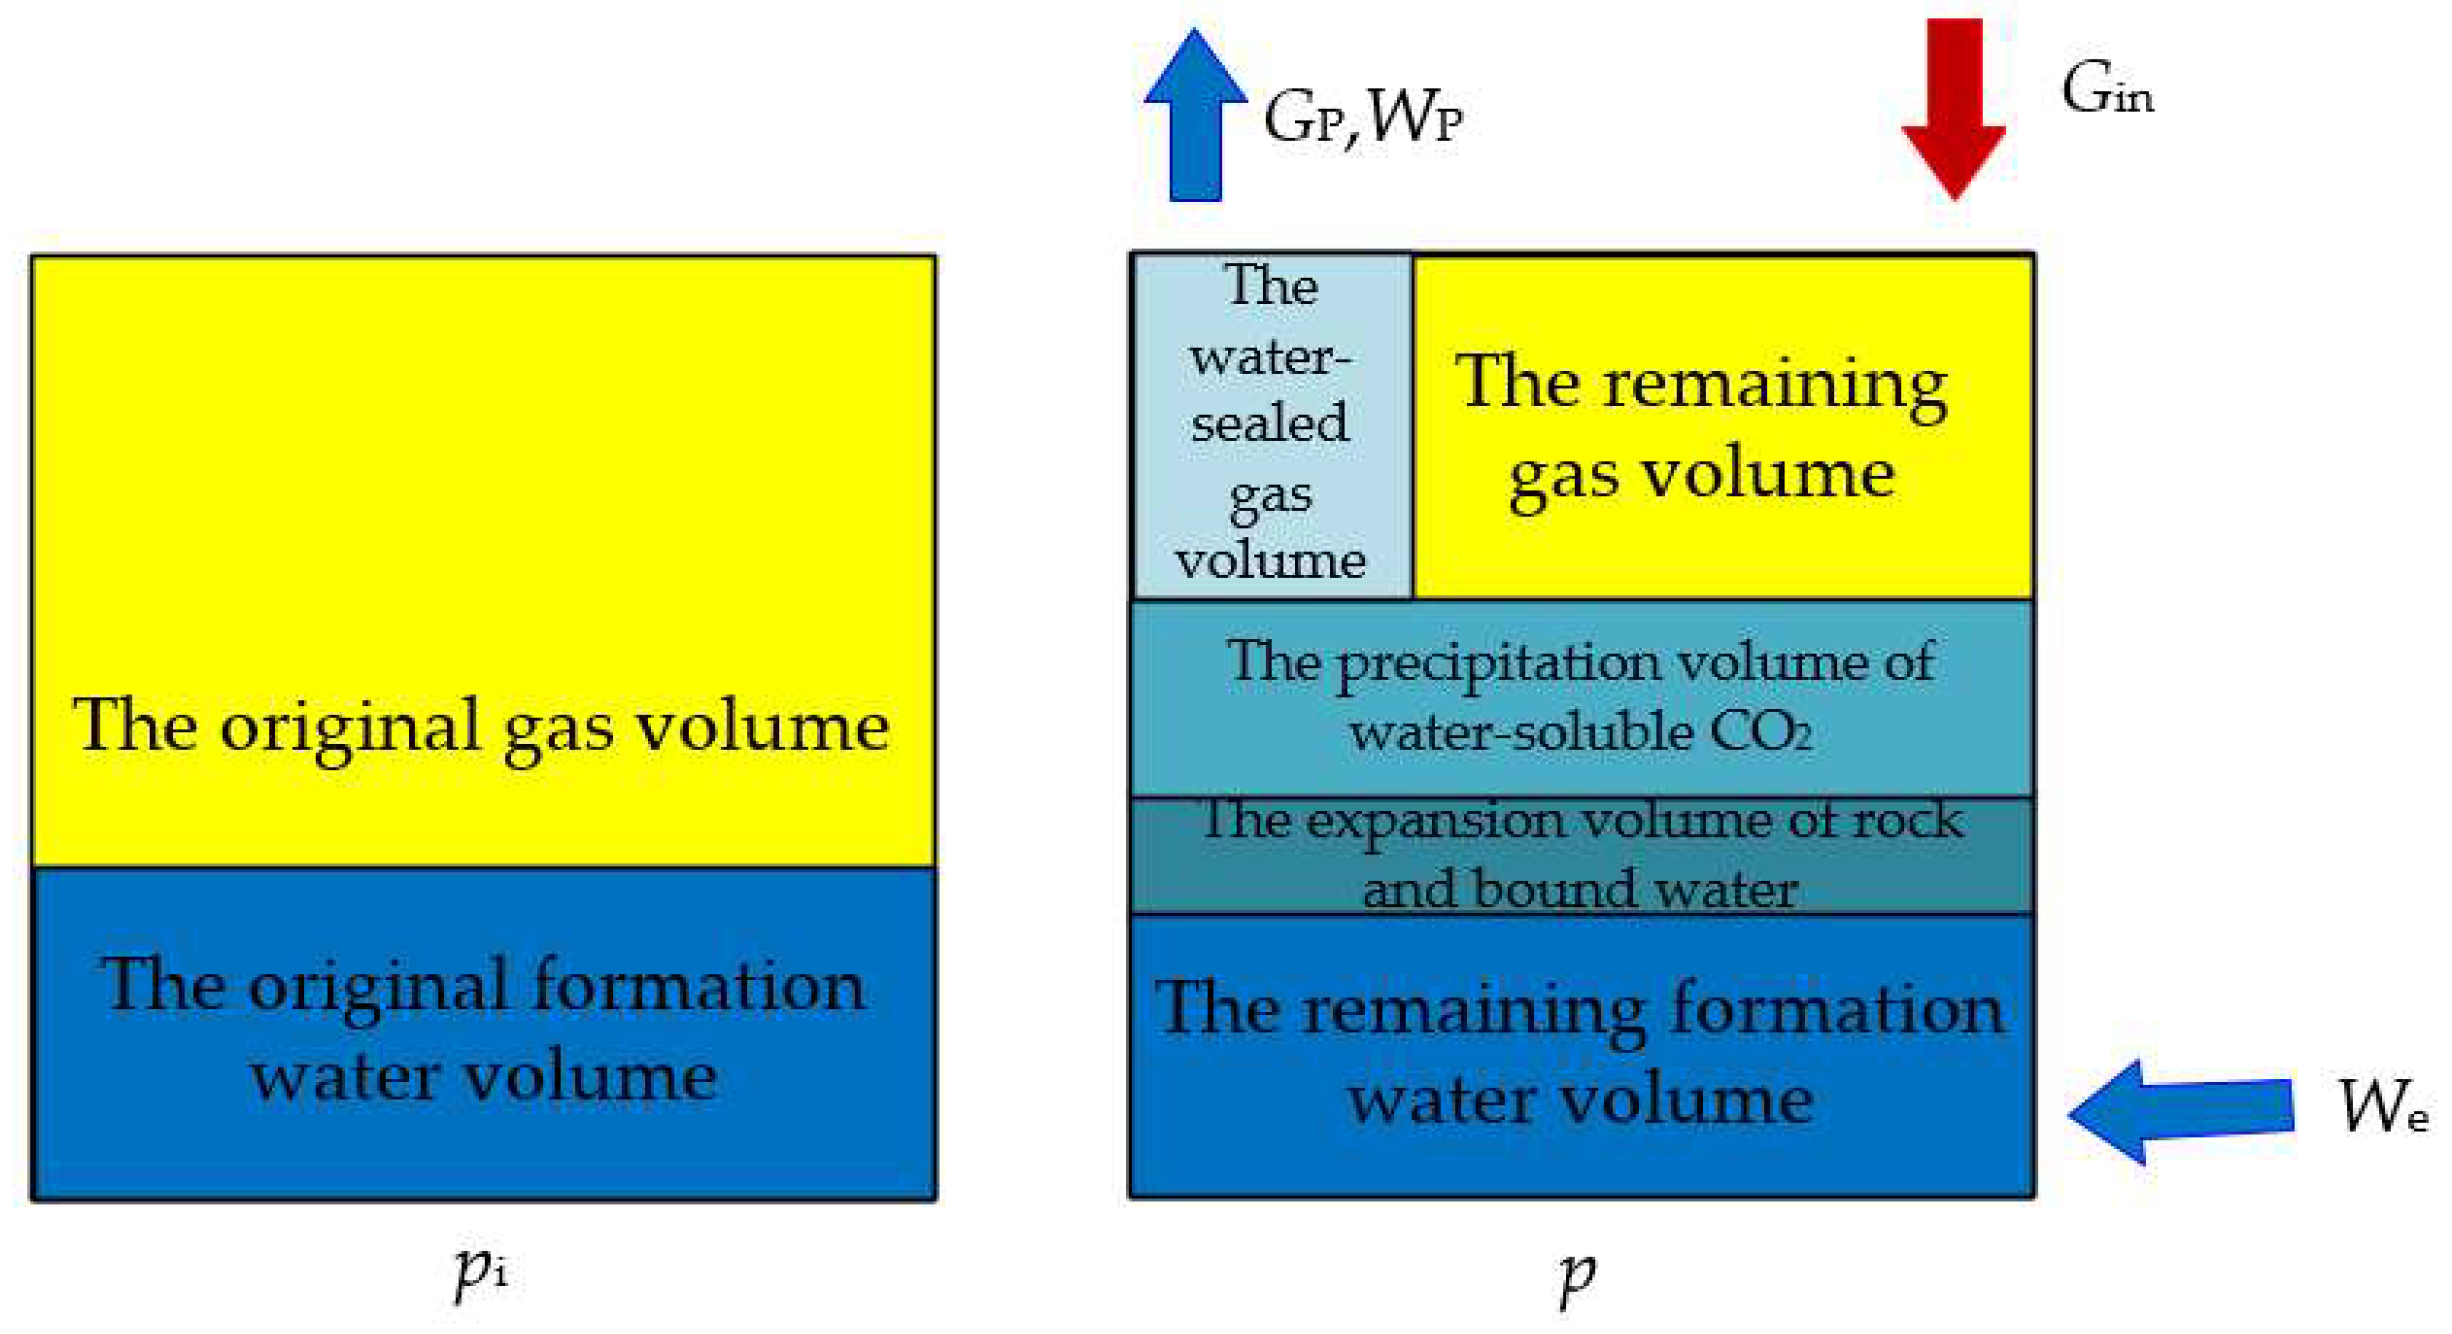
Figure 1. Schematic diagram of physical model of material balance in a water-bearing gas reservoir with the injection of CO2. Gin = cumulative volume of injected carbon dioxide at ground level; Gp = cumulative gas production; p = current formation pressure; pi = original formation pressure; We = volume of intruded water; Wp = volume of produced water.
Energies 16 04592 g001
Figure 2. Ratio of dissolved CO2 to water and solubility of CO2 versus formation pressure (a) T = 383.15 K; (b) T = 423.15 K.
Energies 16 04592 g002
Figure 3. Variations in ratio of dissolved CO2 to water with pressure for different fractional concentrations of CO2 (a) T = 383.15 K; (b) T = 423.15 K. yi = fractional concentration of CO2.
Energies 16 04592 g003
Figure 4. Typical curve of formation pressure during CO2 injection (pi = 50 MPa, T = 383.15 K, ps = 55 MPa, Swi = 0.25, Cf = 4.95 × 10⁻⁴ MPa−1, Cw = 10.25 × 10⁻⁴ MPa−1, Gp = 20 × 108 m3, G = 30 × 108 m3, A = 0.5, ω = 0.1).
Energies 16 04592 g004
Figure 5. Changes in formation pressure under different conditions during CO2 injection (pi = 50 MPa, T = 383.15 K, ps = 55 MPa, Swi = 0.25, Cf = 4.95 × 10⁻⁴ MPa−1, Cw = 10.25 × 10⁻⁴ MPa−1). (a) G = 30 × 108 m3, A = 0.5, ω = 0.1; (b) G = 30 × 108 m3, Gp = 20 × 108 m3, ω = 0.1; (c) G = 30 × 108 m3, Gp = 20 × 108 m3, A = 0.5.
Energies 16 04592 g005
Figure 6. Model fitting curve for well K12-B6 (pi = 48.5 MPa, T = 400.15 K, Swi = 0.23, Cf = 5 × 10⁻⁴ MPa−1, Cw = 9.5 × 10⁻⁴ MPa−1, Gp = 34 × 108 m3, G = 46.2 × 10⁸ m3, A = 0.28, ω = 0.4).
Energies 16 04592 g006
Table 1. Injection parameters for well K12-B6.
Date (Year)Injection Time (d)Average Injection Rate (m3/d)Injection Volume (108 m3)Cumulative Injection Volume (108 m3)Average Formation Pressure (MPa)
2005~200630026,0000.07800.078010.2
2006~200733027,0000.08910.167112.4
2008~200935028,5000.09970.266813.5
2009~201020028,0000.05600.322815.4
Disclaimer/Publisher’s Note: The statements, opinions and data contained in all publications are solely those of the individual author(s) and contributor(s) and not of MDPI and/or the editor(s). MDPI and/or the editor(s) disclaim responsibility for any injury to people or property resulting from any ideas, methods, instructions or products referred to in the content.