Communication

Operational Stability of Hydropower Plant with Upstream and Downstream Surge Chambers during Small Load Disturbance

1
State Key Laboratory of Simulation and Regulation of Water Cycle in River Basin, China Institute of Water Resources and Hydropower Research, Beijing 100038, China
2
College of Water Conservancy and Hydropower Engineering, Hohai University, Nanjing 210098, China
3
Institute of Water Science and Technology, Hohai University, Nanjing 211106, China
*
Authors to whom correspondence should be addressed.
Energies 2023, 16(11), 4517; https://doi.org/10.3390/en16114517
Submission received: 24 April 2023 / Revised: 31 May 2023 / Accepted: 2 June 2023 / Published: 4 June 2023
(This article belongs to the Section F: Electrical Engineering)

Abstract

:
A surge chamber is a common pressure reduction facility in a hydropower plant. Owing to large flow inertia in the upstream headrace tunnel and downstream tailrace tunnel, a hydropower plant with upstream and downstream surge chambers (HPUDSC) was adopted. This paper aimed to investigate the operational stability and nonlinear dynamic behavior of a HPUDSC. Firstly, a nonlinear dynamic model of the HPUDSC system was built. Subsequently, the operational stability and nonlinear dynamic behavior of the HPUDSC system were studied based on Hopf bifurcation theory and numerical simulation. Finally, the influencing factors of stability of the HPUDSC system were investigated. The results indicated the nonlinear HPUDSC system occurred at subcritical Hopf bifurcation, and the stability domain was located above the bifurcation curve, which provided a basis for the tuning of the governor parameters during operation. The dominant factors of stability and dynamic behavior of the HPUDSC system were flow inertia and head loss of the headrace tunnel and the area of the upstream surge chamber. Either increasing the head loss of the headrace tunnel and area of the upstream surge chamber or decreasing the flow inertia of the headrace tunnel could improve the operational stability of the HPUDSC. The proposed conclusions are of crucial engineering value for the stable operation of a HPUDSC.

1. Introduction

Hydropower plays a vital role in realizing sustainable development and improving the energy mix [1,2,3]. With the development of modern water conservancy and hydropower technology, hydropower plants are developing towards the direction of high head and large capacity [4,5,6]. The flexibility and reliability of hydropower plants are vital to guarantee the safety of power grids and the quality of power supply. Therefore, the safe operation of hydropower plants attracts much attention [7,8,9].
Due to the location of the powerhouse and the geological conditions, the headrace tunnel and the tailrace tunnel of hydropower plants would be relatively long [10,11]. To relieve serious water-hammer pressure in hydropower systems, surge chambers should be set both in the upstream headrace tunnel and the downstream tailrace tunnel. Nowadays, hydropower plants with upstream and downstream surge chambers (HPUDSC) are becoming more and more widespread [12].
The operational stability of hydropower plants is a significant issue in engineering [13,14,15,16]. In general, the stability and operational quality of hydropower plants are studied through theoretical analysis and numerical simulations. Yu et al. [17] applied the graph theory to build a state-space model of a hydropower plant with a complicated arrangement, which facilitated the stability analysis. Liu et al. [18] deduced the formula for a critical stable area of the surge chamber considering the impact of governor characteristics and penstock, defining the quantitative impact of multi-factor on the stable area of the surge chamber. Chaudhry [19] studied the limit cycle of surge tank water level oscillation by using the phase plane method. Vereide et al. [20] concluded that head loss of impedance holes is conducive to the stability of water level oscillation in the surge chamber. Zhu et al. [21] analyzed the influence of nonlinearity of the head loss and unit output on the critical area of the surge chamber. Zhang et al. [22] studied the stability of a hydropower plant during hydraulic interference based on numerical simulation. Liu et al. [23] investigated the multi-frequency oscillation stability of a hydropower plant with the surge chamber under grid-connected operation. From the above references, previous studies have focused on hydropower plants with the upstream surge chamber (USC) or downstream surge chamber (DSC).
In addition, several contributions were made on the operational stability of HPUDSC. Chen et al. [24] concluded that increasing the governor parameters can improve the stability of HPUDSC. Cao et al. [25] studied the dynamic quality of HPUDSC, and proposed that reducing the distance between the USC and the DSC could reduce the amplitude of the unit speed oscillation. Wu et al. [26] applied the transfer function method to analyze the coupled oscillation characteristics of HPUDSC, and proposed the concepts of coupled oscillation domain and hydraulic resonance domain. From the aforementioned references, the linear model is normally used to analyze the operational stability of HPUDSC, so that the nonlinear characteristic of head loss is ignored. However, the long headrace tunnel has huge head loss, whose nonlinear characteristic would have great impact on the stability of HPUDSC. Hence, it is essential to build a reasonable mathematical model of HPUDSC for stability analysis.
A HPUDSC is mainly composed of the headrace tunnel, USC, penstock, unit, DSC and the tailrace tunnel. Under load adjustment, the action of the guide vane results in the penstock discharge change, then causing the water level oscillations in the USC and DSC. In turn, the water level oscillations in the USC and DSC affects the penstock discharge, then affecting the hydraulic characteristics of the unit. Based on the above analysis, two water level oscillations of the USC and DSC and unit oscillation interact with each other, resulting in complex dynamic behaviors of the HPUDSC system. Hence, it is vital to study the operational stability of a HPUDSC and its influencing factors.
Aimed at the gaps in previous studies, this paper makes the following main innovations: (1) A nonlinear dynamic model of a HPUDSC system is built. (2) The operational stability of a HPUDSC system is studied based on Hopf bifurcation theory and numerical simulation. (3) The influencing factors of stability in the HPUDSC system are revealed.
The rest of this paper is as follows: Section 2 establishes the nonlinear dynamic model of a HPUDSC system. Section 3 investigates the stability of a HPUDSC system through Hopf bifurcation theory. Section 4 analyzes the influencing factors of stability of a HPUDSC system. Section 5 concludes this paper.

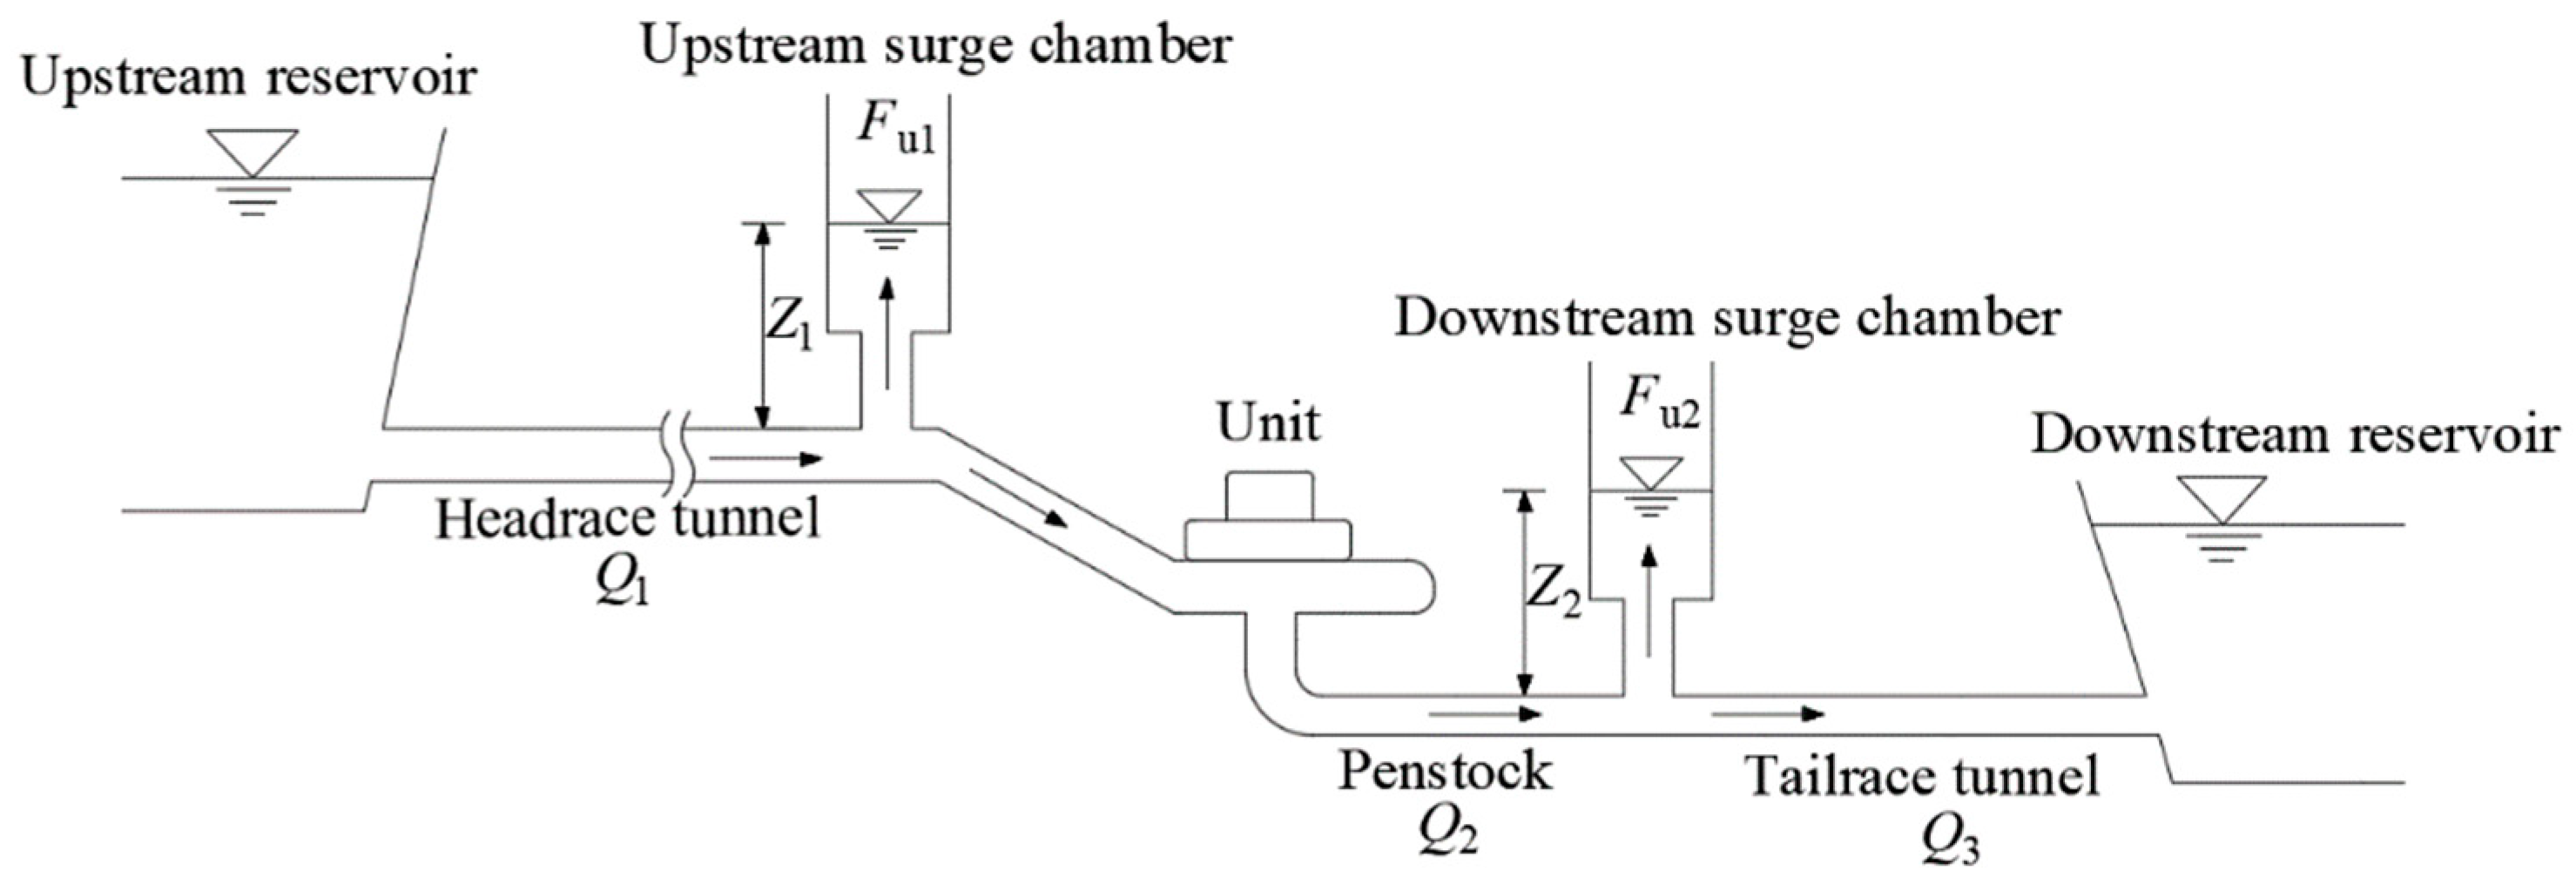
2. Mathematical Model

Figure 1 displays the sketch map of a HPUDSC. The definitions of the parameters are presented as follows: Parameter Q1 denotes the headrace tunnel discharge. Parameters Fu1 and Z1 denote the area and water level of UST. Parameter Q2 denotes the penstock discharge. Parameters Fu2 and Z2 denote the area and water level of DST. Parameter Q3 denotes the tailrace tunnel discharge. For modeling of a HPUDSC, the following three assumptions are mainly adopted [27]: (1) The water column is rigid and incompressible. (2) the HPUDSC is subject to small load disturbance. (3) the HPUDSC operates under an isolated grid condition.
Momentum equation in the headrace tunnel is:
L 1 A 1 g g d V 1 d t = A 1 g ( H u - Z 1 - α 1 Q 1 2 )
where A1, L1, Q1, V1 and α1 denote the area, length, discharge, velocity and head loss coefficient in the headrace tunnel, respectively; γ denotes water weight; Hu denotes upstream reservoir level; and Z1 denotes USC water level.
At t = 0 s, we can get H u 0 = Z 10 + α 1 Q 10 2 , where subscript 0 denotes the initial steady-state value. Then, substituting H u 0 = Z 10 + α 1 Q 10 2 into Equation (1) yields:
L 1 g A 1 d Q 1 d t = Δ Z 1 α 1 Q 1 2 + α 1 Q 10 2
where Δ Z 1 denotes the water level variation in USC.
Let q 1 = ( Q 1 Q 10 ) / Q 10 , and then substituting Q 1 = q 1 Q 10 + Q 10 into Equation (2) yields:
L 1 Q 10 g A 1 d q 1 d t = 2 α 1 Q 10 2 q 1 Δ Z 1 α 1 Q 10 2 q 1 2
Dividing both sides of Equation (3) by H T 0 , the dimensionless momentum equation in the headrace tunnel is obtained:
T w 1 d q 1 d t = Z u 2 α 1 Q 10 2 H T 0 q 1 α 1 Q 10 2 H T 0 q 1 2
where H T 0 denotes initial turbine head; T w 1 denotes the flow inertia constant of the headrace tunnel; q 1 denotes the dimensionless discharge deviation of the headrace tunnel; and Z u 1 denotes the dimensionless water level deviation in USC.
The continuity equation of USC is:
d Z u 1 d t = Q 10 F u 1 H T 0 q 1 Q 20 F u 1 H T 0 q 2
where F u 1 denotes the area of USC; and q 2 denotes the dimensionless discharge deviation in the penstock.
The momentum equation in the penstock is:
L 2 A 2 γ g d V 2 d t = A 2 γ ( Z 1 Z 2 H T α 2 Q 2 2 )
where A2, L2, Q2, V2 and α2 denote area, length, discharge, velocity and head loss coefficient in the penstock, respectively; and Z2 denotes the DSC water level.
Let q 2 = ( Q 2 Q 20 ) / Q 20 , and we can get the dimensionless momentum equation of the penstock:
T w 2 d q 2 d t = Z u 1 Z u 2 h t 2 α 2 Q 20 2 H T 0 q 2
where T w 2 denotes the flow inertia constant of the penstock; h denotes the dimensionless turbine head; and Z u 2 denotes the dimensionless water level deviation in the DSC.
Continuity equation of the DSC is:
d Z u 2 d t = Q 20 F u 2 H T 0 q 2 Q 30 F u 2 H T 0 q 3
Momentum equation of the tailrace tunnel is:
T w 3 d q 3 d t = Z u 2 2 α 3 Q 30 2 H T 0 q 3
Equations of the turbine [28,29] are:
h t = S 5 q t + S 6 φ + S 7 μ
m t = S 8 q t + S 9 φ + S 10 μ
where φ denotes the dimensionless turbine rotational speed deviation; n denotes the turbine rotational speed; μ denotes the dimensionless guide vane open degree deviation; τ denotes the guide vane open degree; m t denotes the dimensionless kinetic moment deviation; Mt denotes kinetic moment; and S 5 - 10 are the characteristic parameters of the turbine, which can be obtained based on the turbine characteristic curves [28,29].
The equation of the generator is:
T a d φ d t = m t ( m g + S p φ )
where T a denotes the mechanical starting constant; m g denotes the step load variation; and Sp denotes the load self-regulation coefficient.
The equation of the governor is:
d μ d t = 1 b t d φ d t 1 b t T d φ
where b t denotes the temporary speed droop constant; and T d denotes the dashpot time constant.
By combing Equations (4), (5) and (7)–(13), the dynamic model of the HPUDSC is presented as follows:
d q 1 d t = 2 α 1 Q T 0 2 T w 1 H T 0 q 1 1 T w 1 Z u 1 α 1 Q T 0 2 T w 1 H T 0 q 1 2 d Z u 1 d t = Q T 0 F u 1 H T 0 q 1 Q T 0 F u 1 H T 0 q 2 d q 2 d t = 1 T w 2 Z u 1 ( 2 α 2 Q T 0 2 T w 2 H T 0 + S 5 T w 2 ) q 2 1 T w 2 Z u 2 S 6 T w 2 φ S 7 T w 2 μ d φ d t = S 8 T a q 2 + S 9 S p T a φ + S 10 T a μ m g T a d μ d t = S 8 b t T a q 2 ( S 9 S p b t T a + 1 b t T d ) φ S 10 b t T a μ + m g b t T a d Z u 2 d t = Q T 0 F u 2 H T 0 q 2 Q T 0 F u 2 H T 0 q 3 d q 3 d t = 1 T w 3 Z u 2 2 α 3 Q T 0 2 T w 3 H T 0 q 3
Equation (14) is a seventh-order equation, reflecting the nonlinear dynamic characteristics of the HPUDSC under small load disturbance mg.

3. Stability Analysis of the HPUDSC System

In this section, stability of the HPUDSC system is analyzed through Hopf bifurcation theory. Subsequently, the stability domain of the HPUDSC is drawn based on a case study.

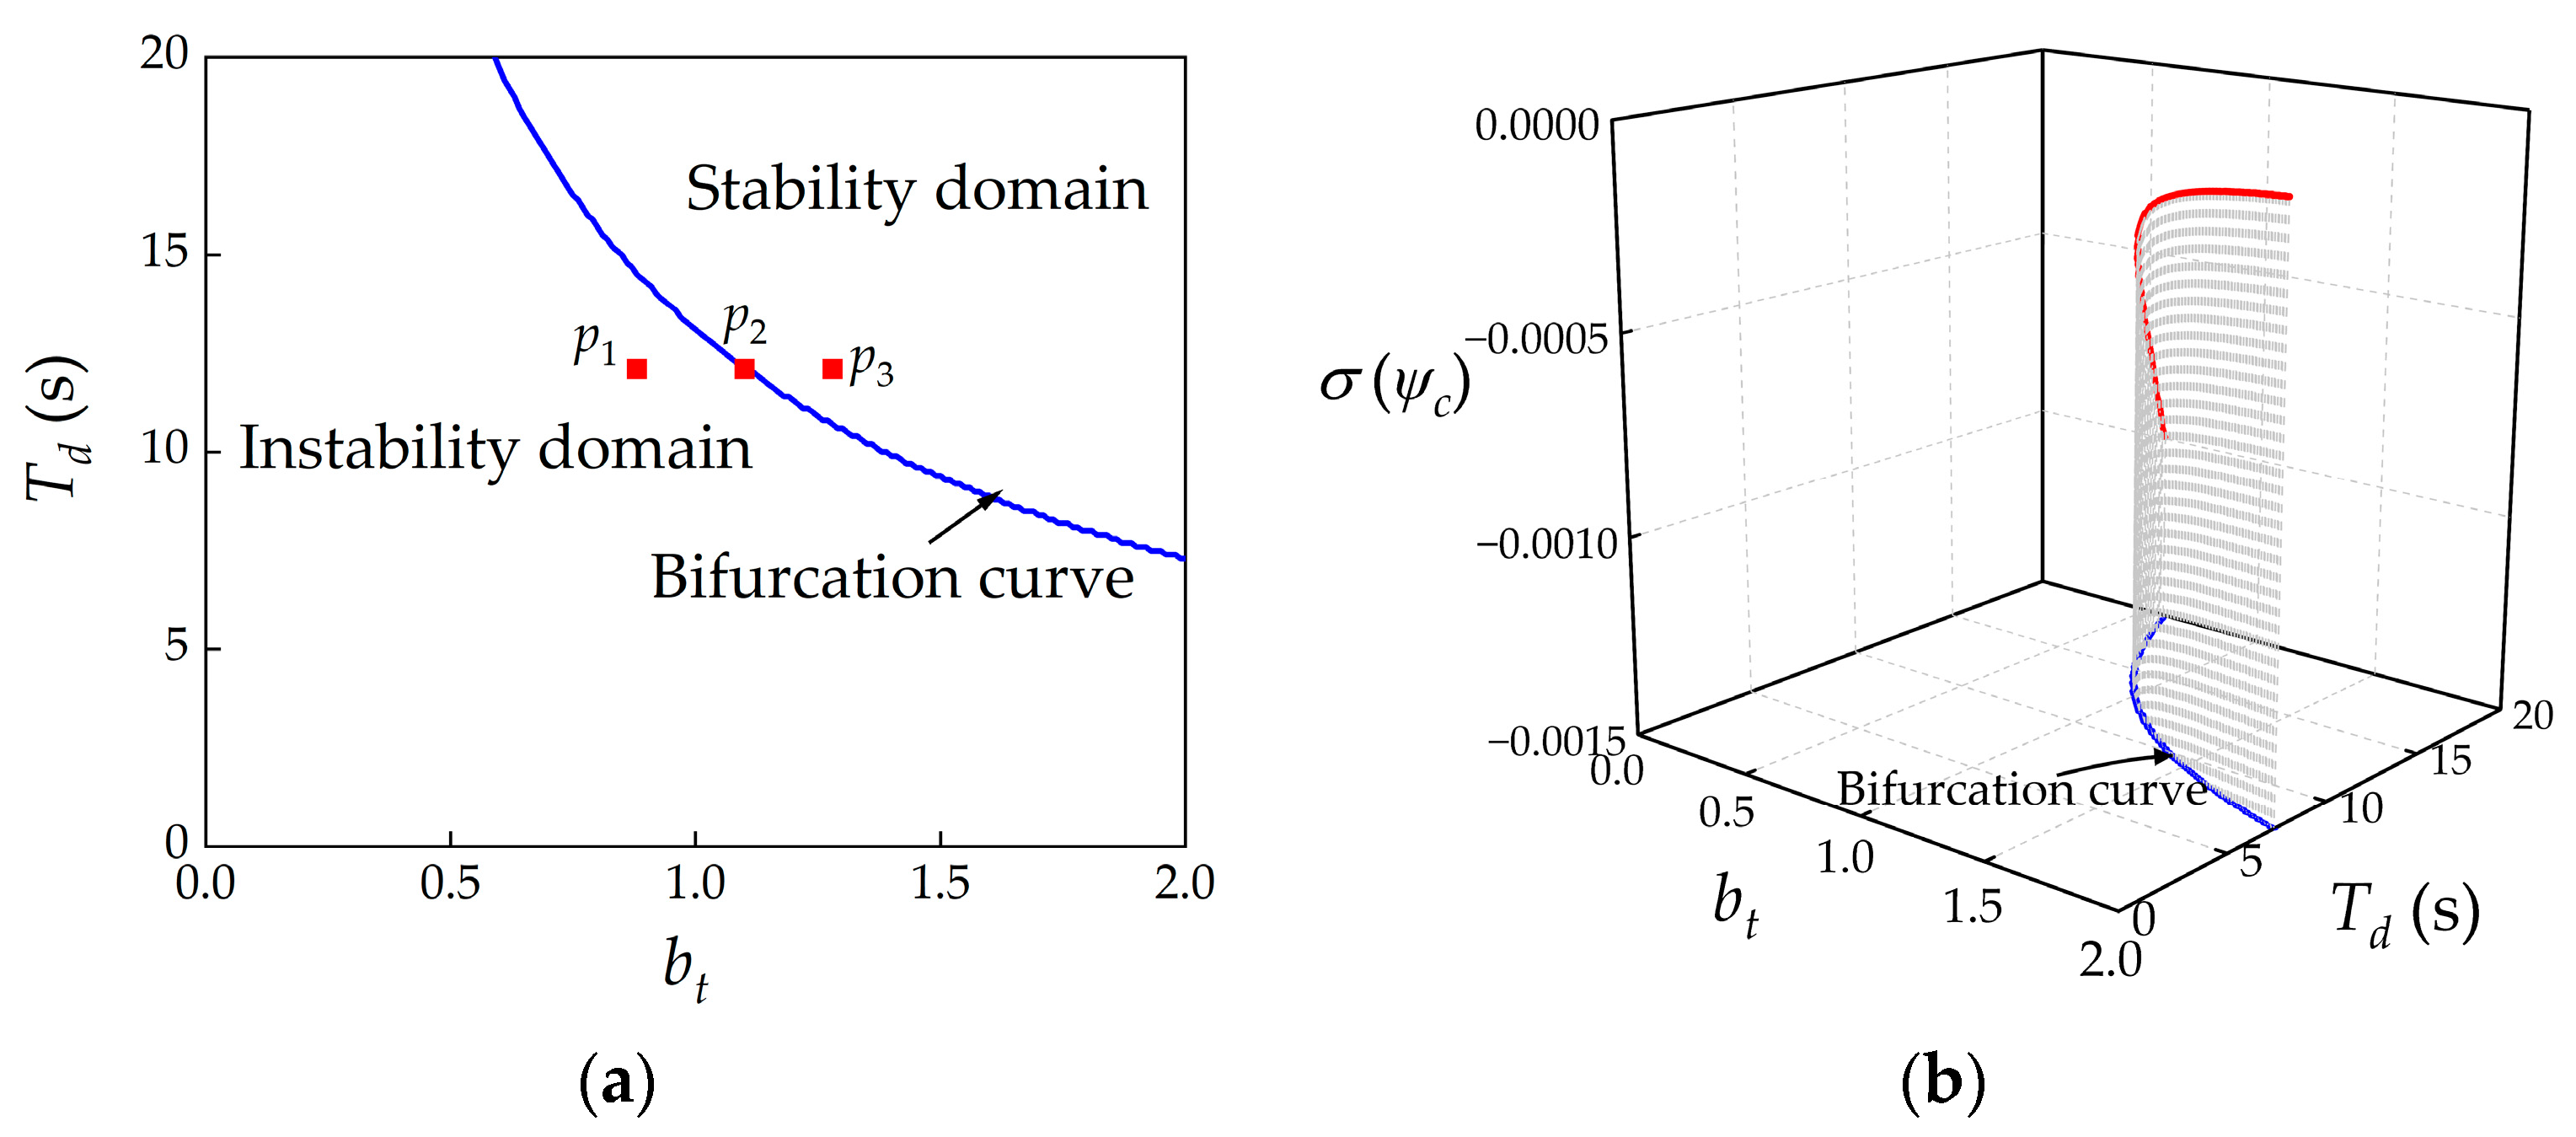
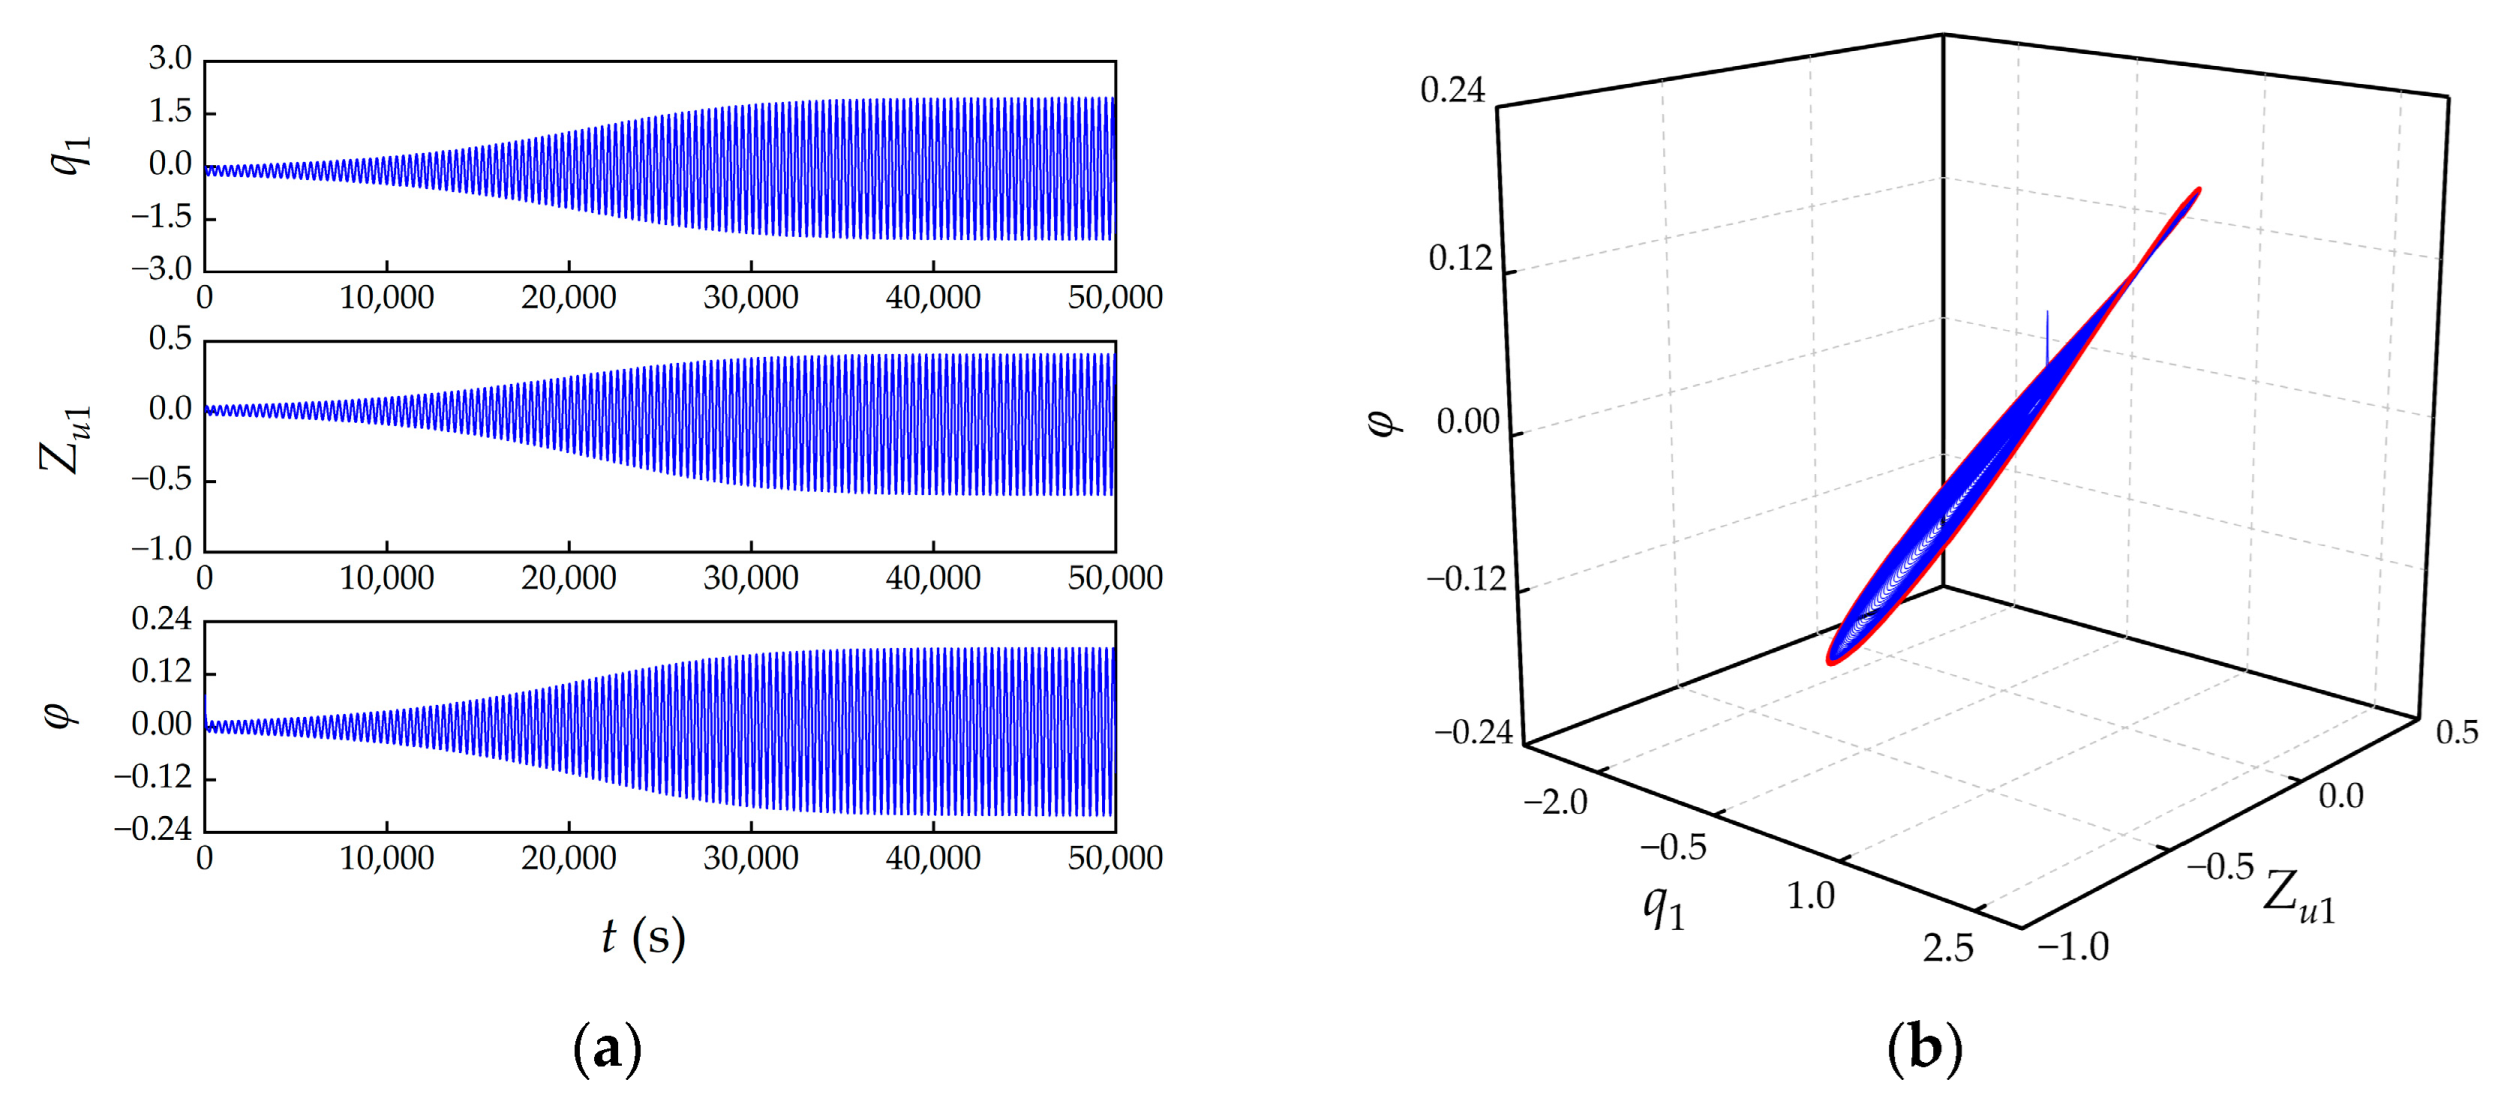
3.1. Hopf Bifurcation Analysis

Hopf bifurcation theory is extensively utilized in nonlinear system stability analysis, which is characterized by simple operation and clear physical meaning [30]. This paper applied Hopf bifurcation theory to analyze the stability of the HPUDSC system.
Equation (14) can be transformed into the form x · = f ( x , ψ ) , where x = ( q 1 , Z u 1 , q 2 , φ , μ , Z u 2 , q 3 ) T and ψ denotes the bifurcation parameter. At x · = 0 , the equilibrium state of the HPUDSC was obtained:
q 1 E = q 2 E = q 3 E = m 2 m 2 2 4 m 1 m 3 2 m 1 Z u 1 E = [ 2 ( α 2 + α 3 ) Q T 0 2 H T 0 + S 5 S 7 S 8 S 10 ] q 1 E + S 7 m g S 10 φ E = 0 μ E = m g S 8 q 1 E S 10 Z u 2 E = 2 α 3 Q T 0 2 H T 0 q 1 E
where m 1 = α 1 Q T 0 2 H T 0 ; m 2 = 2 ( α 1 + α 2 + α 3 ) Q T 0 2 H T 0 + S 5 S 7 S 8 S 10 ; and m 3 = S 7 m g S 10 .
Jacobian matrix of the HPUDSC is expressed as follows:
J ( ψ ) = q 1 · q 1 q 1 · Z u 1 q 1 · q 2 q 1 · φ q 1 · μ q 1 · Z u 2 q 1 · q 3 Z u 1 · q 1 Z u 1 · Z u 1 Z u 1 · q 2 Z u 1 · φ Z u 1 · μ Z u 1 · Z u 2 Z u 1 · q 3 q 2 · q 1 q 2 · Z u 1 q 2 · q 2 q 2 · φ q 2 · μ q 2 · Z u 2 q 2 · q 3 φ · q 1 φ · Z u 1 φ · q 2 φ · φ φ · μ φ · Z u 2 φ · q 3 μ · q 1 μ · Z u 1 μ · q 2 μ · φ μ · μ μ · Z u 2 μ · q 3 Z u 2 · q 1 Z u 2 · Z u 1 Z u 2 · q 2 Z u 2 · φ Z u 2 · μ Z u 2 · Z u 2 Z u 2 · q 3 q 3 · q 1 q 3 · Z u 1 q 3 · q 2 q 3 · φ q 3 · μ q 3 · Z u 2 q 3 · q 3
where q 1 · q 1 = 2 α 1 Q T 0 2 T w 1 H T 0 2 α 1 Q T 0 2 T w 1 H T 0 q 1 E ; q 1 · Z u 1 = 1 T w 1 ; q 1 · q 2 = 0 ; q 1 · φ = 0 ; q 1 · μ = 0 ; q 1 · Z u 2 = 0 ; q 1 · q 3 = 0 ; Z u 1 · q 1 = Q T 0 F u 1 H T 0 ; Z u 1 · Z u 1 = 0 ; Z u 1 · q 2 = Q T 0 F u 1 H T 0 ; Z u 1 · φ = 0 ; Z u 1 · μ = 0 ; Z u 1 · Z u 2 = 0 ; Z u 1 · q 3 = 0 ; q 2 · q 1 = 0 ; q 2 · Z u 1 = 1 T w 2 ; q 2 · q 2 = 1 T w 2 ( 2 α 2 Q T 0 2 H T 0 + S 5 ) ; q 2 · φ = S 6 T w 2 ; q 2 · μ = S 7 T w 2 ; q 2 · Z u 2 = 1 T w 2 ; q 2 · q 3 = 0 ; φ · q 1 = 0 ; φ · Z u 1 = 0 ; φ · q 2 = S 8 T a ; φ · φ = S 9 S p T a ; φ · μ = S 10 T a ; φ · Z u 2 = 0 ; φ · q 3 = 0 ; μ · q 1 = 0 ; μ · Z u 1 = 0 ; μ · q 2 = S 8 b t T a ; μ · φ = ( S 9 S p b t T a + 1 b t T d ) ; μ · μ = S 10 b t T a ; μ · Z u 2 = 0 ; μ · q 3 = 0 ; Z u 2 · q 1 = 0 ; Z u 2 · Z u 1 = 0 ; Z u 2 · q 2 = Q T 0 F u 2 H T 0 ; Z u 2 · φ = 0 ; Z u 2 · μ = 0 ; Z u 2 · Z u 2 = 0 ; Z u 2 · q 3 = Q T 0 F u 2 H T 0 ; q 3 · q 1 = 0 ; q 3 · Z u 1 = 0 ; q 3 · q 2 = 0 ; q 3 · φ = 0 ; q 3 · μ = 0 ; q 3 · Z u 2 = 1 T w 3 ; and q 3 · q 3 = 2 α 3 Q T 0 2 T w 3 H T 0 .
Based on det [ J ( ψ ) - λ I ] = 0 , the characteristic equation is obtained:
λ 7 + a 1 λ 6 + a 2 λ 5 + a 3 λ 4 + a 4 λ 3 + a 5 λ 2 + a 6 λ + a 7 = 0
where λ is eigenvalue.
Assume that the following Equations (18)–(21) are satisfied under ψ = ψ c .
a i ( ψ c ) > 0 ,   i = 1 , 2 , 3 , 4 , 5 , 6 , 7
Δ i ( ψ c ) > 0 ,   i = 1 , 2 , 3 , 4 , 5
Δ 6 ( ψ c ) = 0
σ ( ψ c ) = Re ( d λ d ψ ψ = ψ c ) 0
where Δ i ( ψ c ) = a 1 1 0 0 a 3 a 2 a 1 0 a 5 a 4 a 3 0 a 2 i 1 a 2 i 2 a 2 i 3 a i (i = 1, 2, 3, 4, 5 and 6).
The HPUDSC system (Equation (14)) goes through Hopf bifurcation under ψ = ψ c .
The direction of the Hopf bifurcation is judged based on the transversal coefficient σ ( ψ c ) :
σ ( ψ c ) = Re ( d λ d ψ ψ = ψ c )
When σ ( ψ c ) > 0 , Hopf bifurcation is supercritical. The system is asymptotically stable under ψ < ψ c , and produces limited cycles under ψ > ψ c . In contrast, when σ ( ψ c ) > 0 , Hopf bifurcation is subcritical. The system is asymptotically stable under ψ > ψ c , and produces limited cycles under ψ < ψ c .

3.2. Case Study

The example in this study is of a practical HPUDSC, whose data are presented in Table 1.
As the governor parameters are changeable in the operation of a HPUDSC, this paper selected T d as the bifurcation parameter. Based on Equations (18)–(21), the bifurcation curve was obtained on the bt-Td plane, as demonstrated in Figure 2a. Subsequently, σ ( ψ c ) for all the bifurcation points were solved from Equation (22), as demonstrated in Figure 2.
As shown in Figure 2b, σ ( ψ c ) for all the bifurcation points was less than zero, showing that Hopf bifurcation was subcritical. Hence, the stability domain was above the bifurcation curve, as demonstrated in Figure 2a.
To verify the accuracy of the stability domain, three points P1, P2 and P3 were selected for numerical simulation. Detailed data are shown in Table 2.
Based on the data of the three points, the Runge–Kutta method was adopted to solve the dynamic process of the HPUDSC. The time domain processes of the state variables (q1, Zu1 and φ) and the phase space trajectories (q1-Zu1-φ) under P1, P2 and P3 are demonstrated in Figure 3.
Under the unstable point P1, the time domain processes gradually diverged and entered a persistent oscillation state at last. Accordingly, the phase space trajectory went through emanative motion and eventually entered a limit cycle as shown by the red curve in Figure 3b. Under the bifurcation point P2, the time domain processes instantly entered the persistent oscillation. Accordingly, the phase space trajectory eventually entered a limited cycle. Under the stable point P3, the time domain processes experienced attenuated oscillations and converged at the equilibrium state at last. Accordingly, the phase space trajectory shrunk gradually and stabilized at the equilibrium state at last. To sum up, the numerical simulation results were identical to the stability domain based on theoretical analysis.

4. Influencing Factors on the Stability of the HPUDSC System

In this section, the influence of system parameters, i.e., the flow inertia of the pipeline, and the head loss of the pipeline and areas of the USC and DSC on the stability domain and dynamic behavior of the HPUDSC is analyzed in detail.

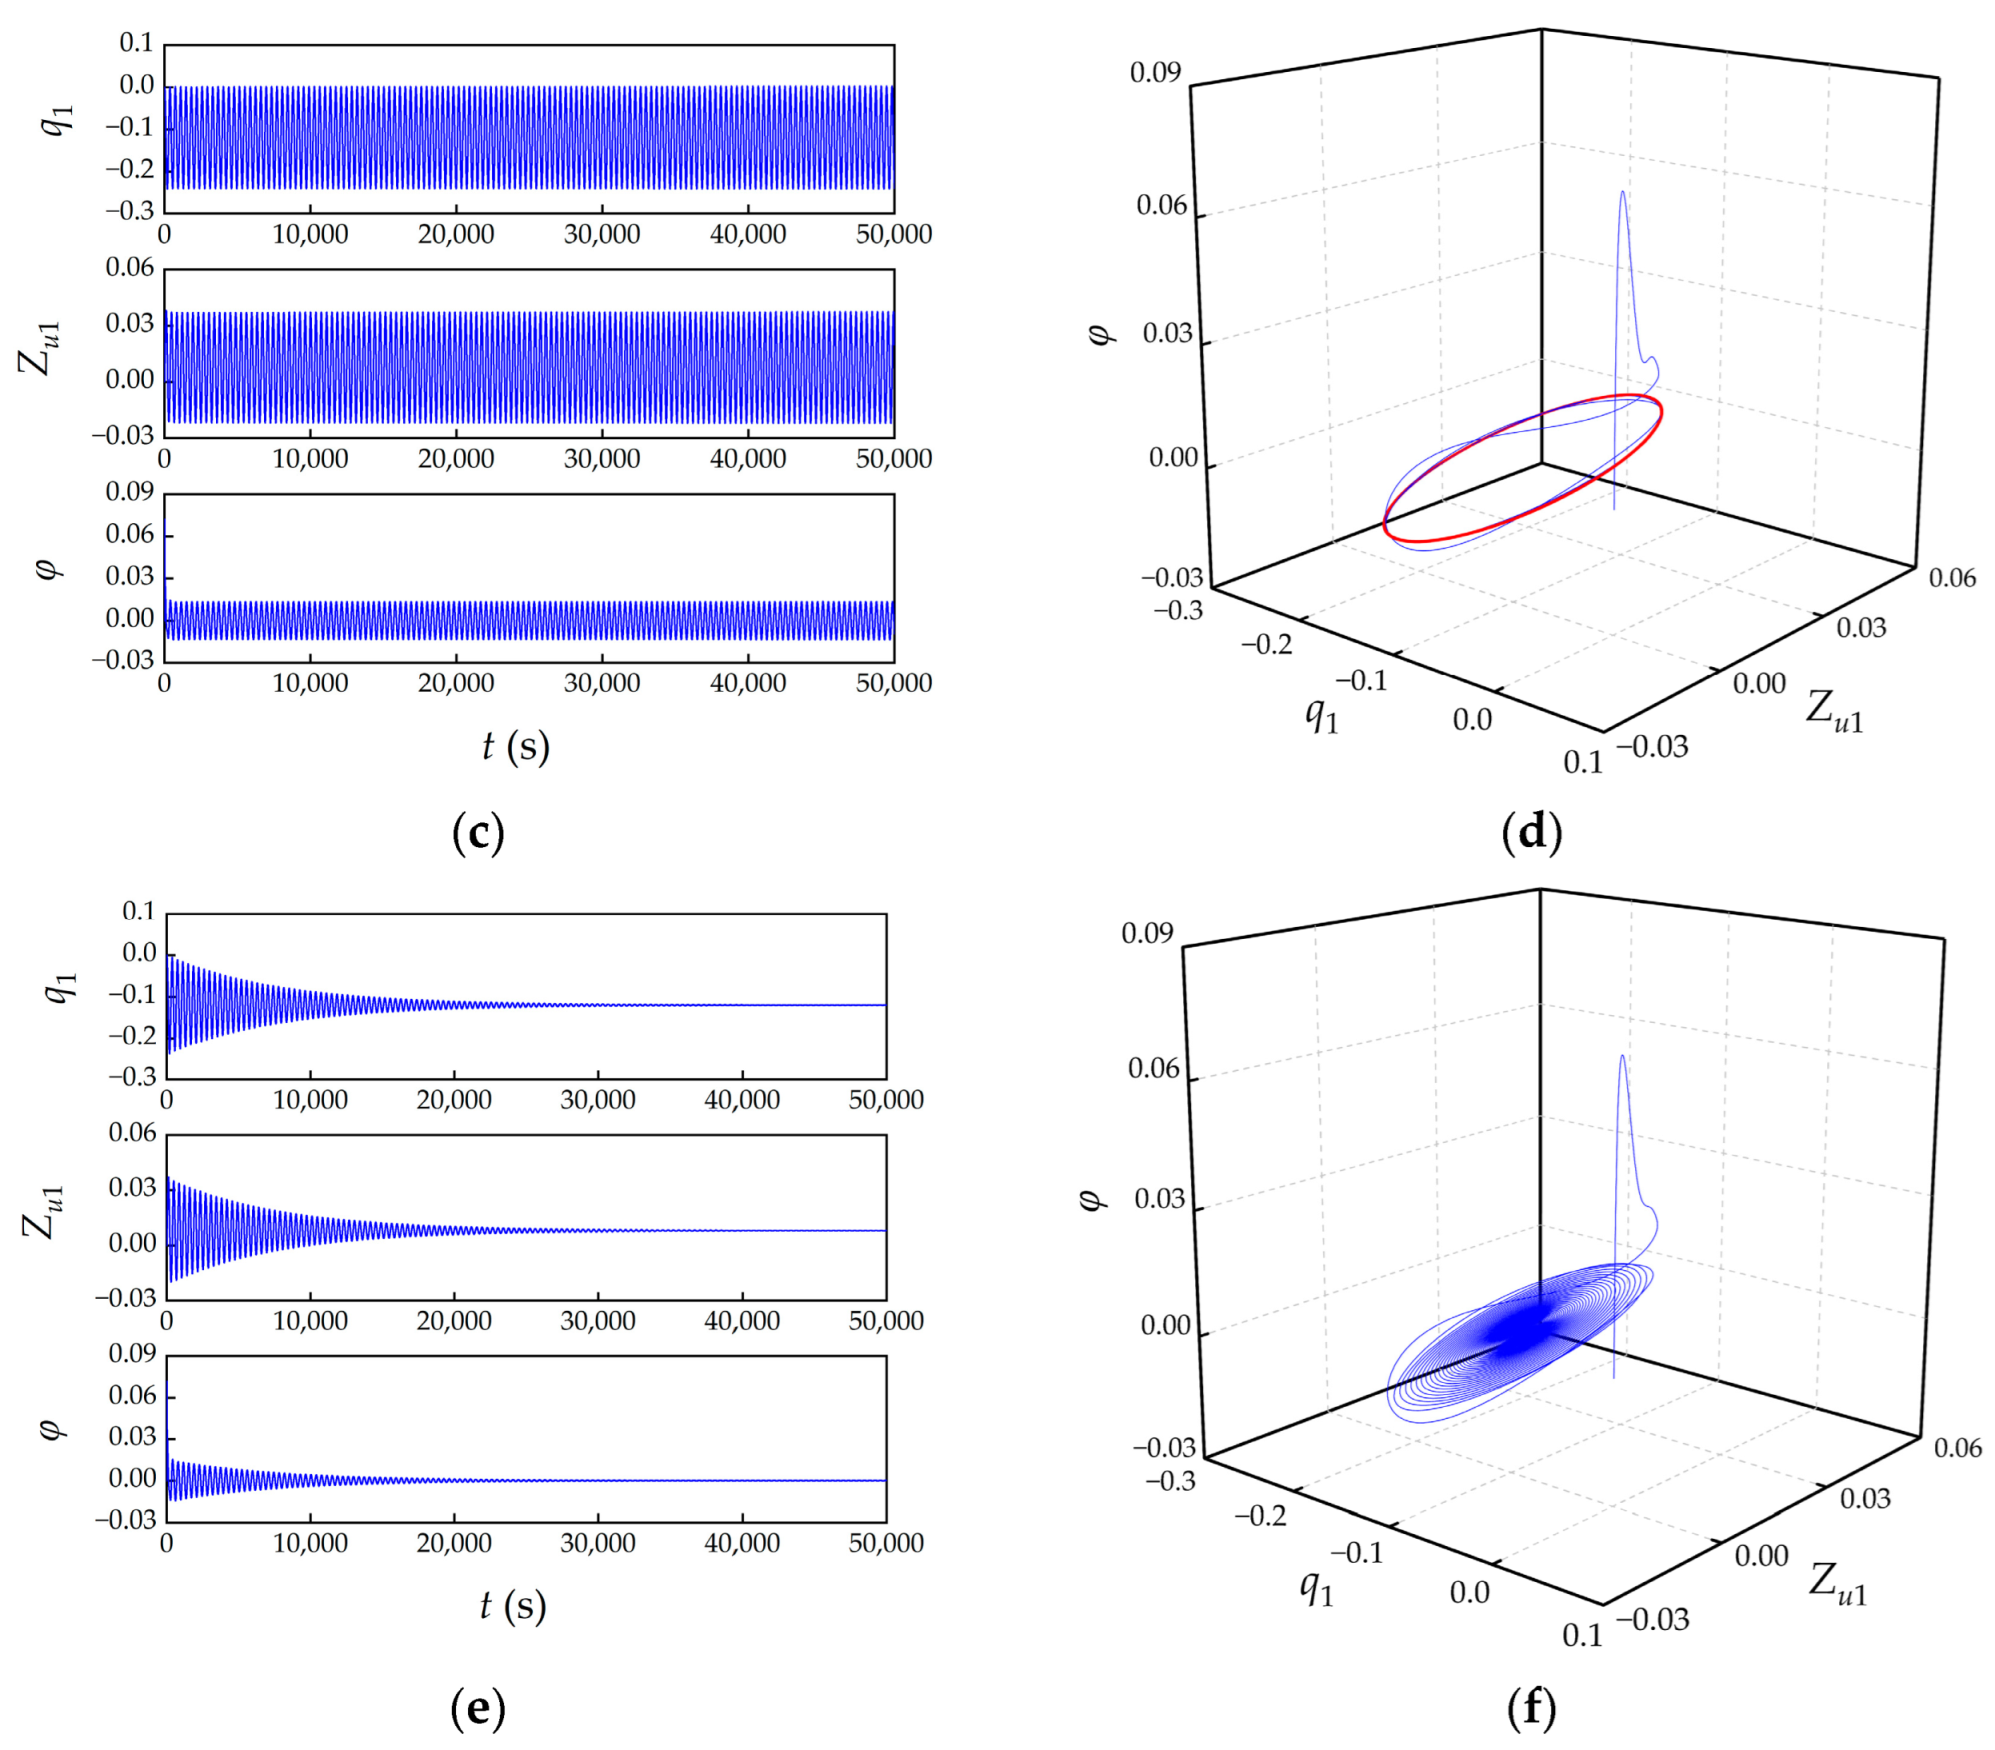
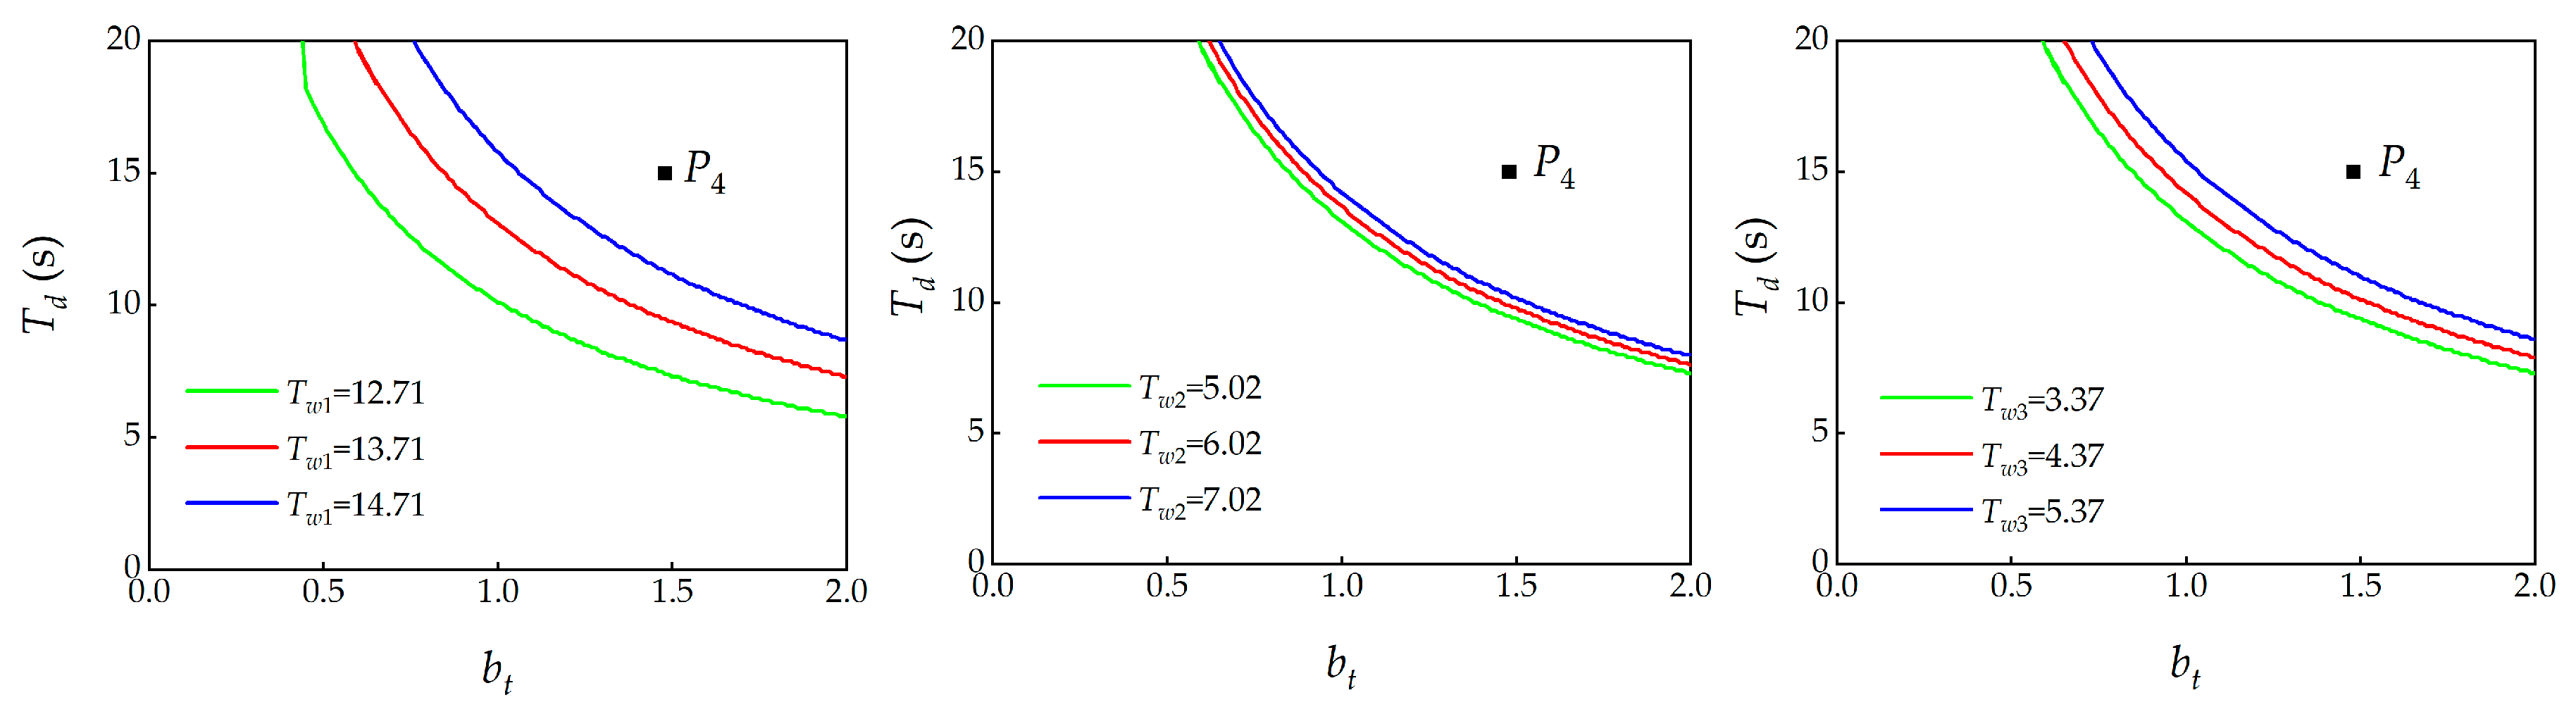
4.1. Influence of Flow Inertia on the Stability Domain and Dynamic Behavior

Table 1 demonstrates the default data of the HPUDSC. The stability domains under different Tw1, Tw2 and Tw3 were solved based on Hopf bifurcation theory. The results are demonstrated in Figure 4.
As shown in Figure 4, as the flow inertia constant of the pipelines increased, the stability domain gradually decreased, indicating that the flow inertia was unfavorable for the stability of the HPUDSC. In addition, the flow inertia of the headrace tunnel had noticeable impact on the stability domain, while the flow inertia of the penstock and tailrace tunnel had little impact on the stability domain. The above results showed that the stability of the HPUDSC was mainly affected by the flow inertia of the headrace tunnel.
To further study the dynamic behavior of the HPUDSC under different flow inertia, the governor parameter P4 (bt = 1.5, Td = 15 s) was chosen for numerical simulation. The time domain processes of the turbine rotational speed deviation φ are demonstrated in Figure 5.
Figure 5 shows the time domain process of φ consisted of head wave and tail wave. The head wave occurred in the initial stage and attenuated quickly. The tail wave occurred after the head wave disappeared and attenuated slowly, which was the main factor affecting the dynamic quality of the HPUDST. With the increase of flow inertia of the headrace tunnel, the head wave remained unchanged, and the attenuation of the tail wave gradually slowed down. Additionally, the flow inertia of the penstock and the tailrace tunnel had little influence on the time domain process of φ. The above results showed that the dynamic behavior of the HPUDST was mainly affected by the flow inertia of the headrace tunnel.

4.2. Influence of Head Loss on the Stability Domain and Dynamic Behavior

Table 1 demonstrates the default data of the HPUDSC. The stability domains under different α1, α2 and α3 were solved as demonstrated in Figure 6.
As shown in Figure 6, with the increase of the headrace tunnel head loss and the decrease of the penstock head loss and tailrace tunnel head loss, the stability domain gradually increased. The above result indicated that the headrace tunnel head loss was conductive to the stability of the HPUDSC, while the penstock head loss and tailrace tunnel head loss was adverse to the stability of the HPUDSC. In addition, the headrace tunnel head loss had obvious impact on the stability domain, while the penstock head loss and tailrace tunnel head loss had little impact on the stability domain. The above results indicate that the stability of the HPUDSC was mainly affected by the headrace tunnel head loss.
To further study the dynamic behavior of the HPUDSC under different head loss, the governor parameter P4 (bt = 1.5, Td = 15 s) was chosen for the numerical simulation. The time domain processes of the turbine rotational speed deviation φ are demonstrated in Figure 7.
As shown in Figure 7, with the reduction of headrace tunnel head loss, the attenuation of the tail wave gradually slowed down. Additionally, the head loss of the penstock and tailrace tunnel had little influence on the time domain process of φ. The above results showed that the dynamic behavior of the HPUDST was mainly affected by the headrace tunnel head loss.

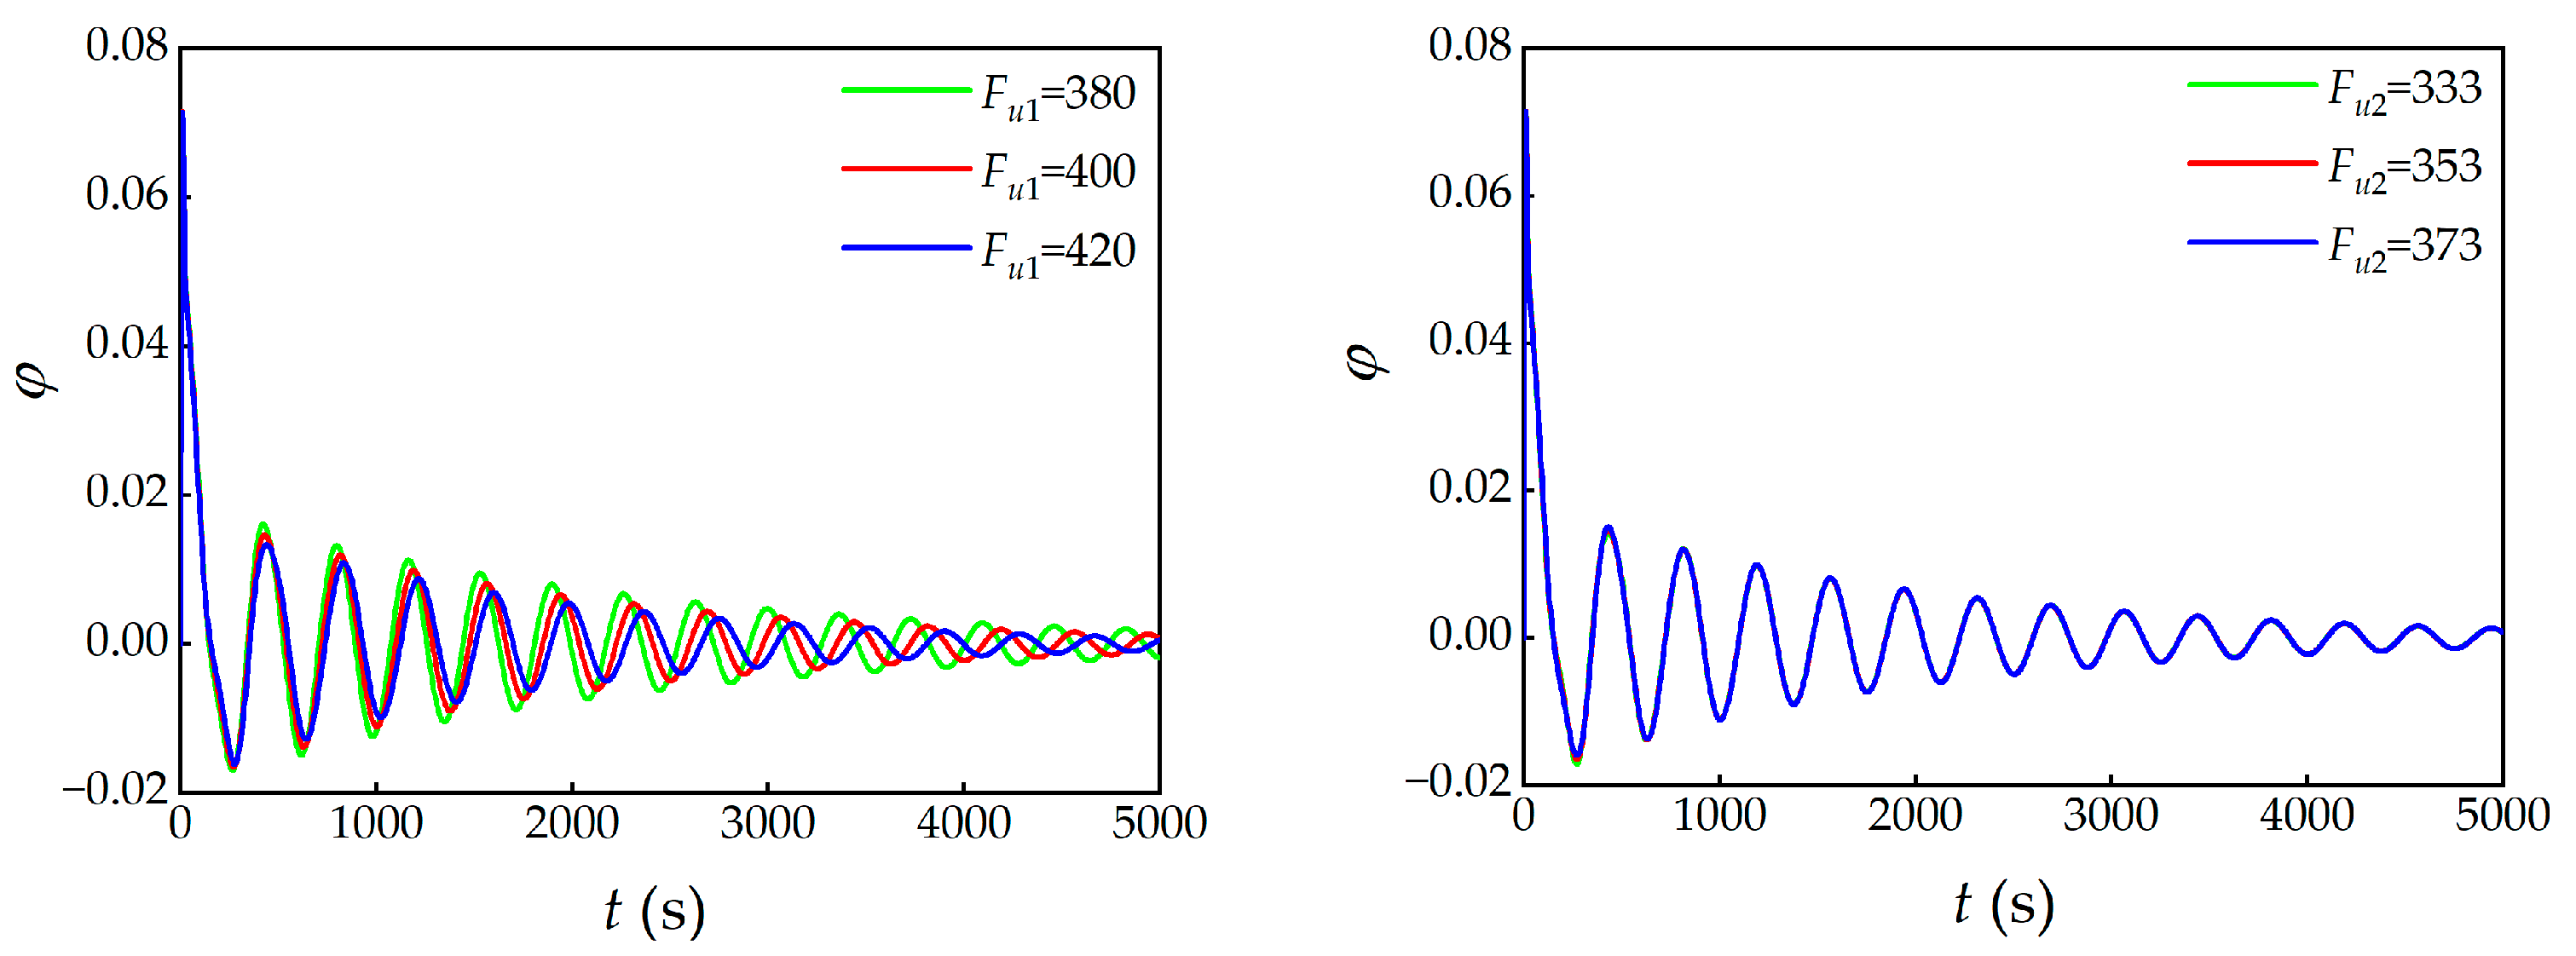
4.3. Influence of Areas of USC and DSC on the Stability Domain and Dynamic Behavior

Table 1 demonstrates the default data of the HPUDSC. The stability domains under different Fu1 and Fu2 were solved as demonstrated in Figure 8.
As shown in Figure 8, as the area of the USC increased, the stability domain gradually increased. As the area of the DSC changed, the stability domain remained almost unchanged. The above results showed that the stability of the HPUDSC was mainly affected by the area of the USC.
To further study the dynamic behavior of the HPUDSC under different surge chamber areas, the governor parameter P4 (bt = 1.5, Td = 15 s) was chosen for numerical simulation. The time domain processes of the turbine rotational speed deviation φ are demonstrated in Figure 9.
As shown in Figure 9, with the rise of the area of the USC, the attenuation of the tail wave gradually slowed down. Additionally, the area of the DSC had little influence on the time domain process of φ. The above results showed that the dynamic behavior of the HPUDST was mainly affected by the area of the USC.

5. Discussion

Recently, a hydropower plant with a long headrace tunnel and tailrace tunnel has become a vital development type for hydropower, and a HPUDSC is normally adopted. Two water level oscillations of the USC and DSC and the unit oscillation interact with each other, resulting in complex dynamic behaviors of the HPUDSC system. However, there are few theoretical studies on the operational stability of a HPUDSC. Therefore, it is vital to build a reasonable mathematical model of a HPUDSC and further study the operational stability of a HPUDSC.
In this paper, a reasonable nonlinear mathematical model of a HPUDSC was deduced and established. Hopf bifurcation theory was introduced to provide theoretical analysis for the stability of the HPUDSC. The obtained critical bifurcation value can provide the basis for setting the governor parameters during operation. The influencing factors of stability and dynamic behaviors of the HPUDSC were fully revealed. The proposed conclusions are of crucial engineering value for the stable operation of a HPUDSC.
Furthermore, this research could be expanded based on the following points: (1) The interaction mechanism of the water level oscillation in the UST, the water level oscillation in the DST and the unit oscillation could be further investigated. (2) This research focused on analyzing the stability of a HPUDSC based on theoretical analysis and numerical simulation. Further analysis of the frequency characteristics of a HPUDSC will be conducted. (3) The HPUDSC in this paper is currently in the design stage. A verification of the numerical model of the HPUDSC will be conducted when this HPUDSC is put into operation.

6. Conclusions

A nonlinear mathematical model of HPUDSC was built. The stability of the HPUDSC was analyzed based on Hopf bifurcation theory and numerical simulation. The influencing factors on the stability of HPUDSC were investigated. The main conclusions are as follows: (1) The nonlinear HPUDSC system occurred at subcritical Hopf bifurcation. The stability domain was above the bifurcation curve, and the other side was the instability domain. When the governor parameters were selected in the instability domain, the nonlinear HPUDSC system experienced persistent oscillation. (2) For the stability and dynamic behavior of the HPUDSC, the flow inertia and head loss of the headrace tunnel and the area of the USC had obvious effects, while the flow inertia and head loss of the penstock and tailrace tunnel and the area of the DSC had little effect. Either increasing the head loss of the headrace tunnel and area of the USC or decreasing the flow inertia of the headrace tunnel could improve the stability of HPUDSC.

Author Contributions

Conceptualization, Y.L.; Methodology, Y.L., X.Y., X.G., W.Z. and S.C.; Validation, S.C.; Investigation, W.Z.; Writing—original draft, Y.L.; Writing—review & editing, X.Y.; Supervision, X.G. All authors have read and agreed to the published version of the manuscript.

Funding

This work was funded by the Open Research Fund of State Key Laboratory of Simulation and Regulation of Water Cycle in River Basin (China Institute of Water Resources and Hydropower Research), grant number IWHR-SKL-KF202011.

Data Availability Statement

Not applicable.

Acknowledgments

The authors sincerely appreciate the support of Open Research Fund of State Key Laboratory of Simulation and Regulation of Water Cycle in River Basin (China Institute of Water Resources and Hydropower Research), grant number IWHR-SKL-KF202011.

Conflicts of Interest

The authors declare no conflict of interest.

Nomenclature

A1, A2, A3area of headrace tunnel, penstock and tailrace tunnel, [m2]
bttemporary speed droop constant, [pu]
Fu1, Fu2area of USC and DSC, [m2]
HTworking head of turbine, [m]
htdimensionless deviation of working head of turbine, [pu]
L1, L2, L3length of headrace tunnel, penstock and tailrace tunnel, [m]
MTkinetic moment of turbine, [N·m]
MGresisting moment of turbine, [N·m]
mtdimensionless deviation of kinetic moment of turbine, [pu]
mgdimensionless deviation of kinetic moment of turbine, [pu]
nrotational speed of turbine, [rad/s]
QTworking discharge of turbine, [m3/s]
Q1, Q2, Q3discharge in headrace tunnel, penstock and tailrace tunnel, [m3/s]
qtdimensionless deviation of working discharge of turbine, [pu]
q1, q2, q3dimensionless deviation of discharge in headrace tunnel, penstock and tailrace tunnel, [pu]
S5-10characteristic coefficients of turbine, [pu]
Spload self-regulation coefficient, [pu]
Tamechanical starting constant, [s]
Tddashpot time constant, [s]
Tw1, Tw2, Tw3flow inertia constant in headrace tunnel, penstock and tailrace tunnel, [s]
Z1, Z2water level in USC and DSC, [m]
Zu1, Zu2dimensionless deviation water level in USC and DSC, [pu]
α1, α2, α3head loss coefficient in headrace tunnel, penstock and tailrace tunnel, [s2/m5]
μdimensionless deviation of guide vane open degree, [pu]
τguide vane open degree, [°]
φdimensionless deviation of turbine rotational speed, [pu]

References

  1. Sebestyen, V. Renewable and Sustainable Energy Reviews: Environmental impact networks of renewable energy power plants. Renew. Sustain. Energy Rev. 2021, 151, 111626. [Google Scholar] [CrossRef]
  2. Nzotcha, U.; Nsangou, J.C.; Kenfack, J.; Ngohe, P.S.; Hamandjoda, O.; Bignom, B. Combining electric energy storage and deep-lake degassing by means of pumped hydropower. Appl. Energy 2021, 304, 117839. [Google Scholar] [CrossRef]
  3. Schulz, C.; Saklani, U. The future of hydropower development in Nepal: Views from the private sector. Renew. Energy 2021, 179, 1578–1588. [Google Scholar] [CrossRef]
  4. Jin, X.; Liu, B.; Liao, S.; Cheng, C.; Li, G.; Liu, L. Impacts of different wind and solar power penetrations on cascade hydroplants operation. Renew. Energy 2022, 182, 227–244. [Google Scholar] [CrossRef]
  5. Ruggles, H.T.; Caldeira, K. Wind and solar generation may reduce the inter-annual variability of peak residual load in certain electricity systems. Appl. Energy 2022, 305, 117773. [Google Scholar] [CrossRef]
  6. Wen, X.; Sun, Y.; Tan, Q.; Tang, Z.; Wang, Z.; Liu, Z.; Ding, Z. Optimizing the sizes of wind and photovoltaic plants comple-mentarily operating with cascade hydropower stations: Balancing risk and benefit. Appl. Energy 2022, 306, 117968. [Google Scholar] [CrossRef]
  7. Guo, W.; Zhu, D. A review of the transient process and control for a hydropower station with a super long headrace tunnel. Energies 2018, 11, 11. [Google Scholar] [CrossRef] [Green Version]
  8. Xu, B.; Zhang, J.; Egusquiza, M.; Chen, D.; Li, F.; Behrens, P.; Egusquiza, E. A review of dynamic models and stability analysis for a hydro-turbine governing system. Renew. Sustain. Energy Rev. 2021, 144, 110880. [Google Scholar] [CrossRef]
  9. Liu, Y.; Zhang, J.; Liu, Z.; Wang, Q.; Yu, X. Effect of the nonlinearity of head loss on stability and dynamic performance for hydropower plant with surge tank during small load disturbance. J. Energy Storage 2022, 53, 105182. [Google Scholar] [CrossRef]
  10. Hu, J.H.; Yang, J.B.; He, X.H.; Zhao, Z.G.; Yang, J.D. Transient analysis of a hydropower plant with a super-long headrace tunnel during load acceptance: Instability mechanism and measurement verification. Energy 2023, 263, 125671. [Google Scholar] [CrossRef]
  11. Wang, L.; Guo, W.C. Nonlinear hydraulic coupling characteristics and energy conversion mechanism of pipeline-surge tank system of hydropower station with super long headrace tunnel. Renew. Energy 2022, 199, 1345–1360. [Google Scholar] [CrossRef]
  12. Guo, W.; Liu, Y.; Qu, F.; Xu, X. A review of critical stable sectional areas for the surge tanks of hydropower stations. Energies 2020, 13, 23. [Google Scholar] [CrossRef]
  13. Yang, W.; Yang, J.; Guo, W.; Zeng, W.; Wang, C.; Saarinen, L.; Norrlund, P. A mathematical model and its application for hydro power units under different operating conditions. Energies 2015, 8, 10260–10275. [Google Scholar] [CrossRef] [Green Version]
  14. Yang, W.; Norrlund, P.; Chung, C.Y.; Yang, J.; Lundin, U. Eigen-analysis of hydraulic-mechanical-electrical coupling mechanism for small signal stability of hydropower plant. Renew. Energy 2018, 115, 1014–1025. [Google Scholar] [CrossRef]
  15. Zhang, H.; Chen, D.; Xu, B.; Wang, F. Nonlinear modeling and dynamic analysis of hydro-turbine governing system in the process of load rejection transient. Energy Convers. Manag. 2015, 90, 128–137. [Google Scholar] [CrossRef]
  16. Liu, Y.; Zhang, J.; Chen, S.; Yu, X. Stability analysis and estimation of domain of attraction for hydropower station with surge tank. Chaos Solitons Fractals 2023, 170, 113413. [Google Scholar] [CrossRef]
  17. Yu, X.; Zhang, J.; Fan, C.; Chen, S. Stability analysis of governor-turbine-hydraulic system by state space method and graph theory. Energy 2016, 114, 613–622. [Google Scholar] [CrossRef]
  18. Liu, Y.; Zhang, J.; Yu, X.; Chen, S.; Xu, H. Safety factor for Thoma stable area considering the governor-turbine-penstock system. J. Hydraul. Eng. 2023, 149, 3. [Google Scholar] [CrossRef]
  19. Chaudhry, M.H. Applied Hydraulic Transients; Springer: New York, NY, USA, 2014. [Google Scholar]
  20. Vereide, K.; Svingen, B.; Nielsen, T.K.; Lia, L. The effect of surge tank throttling on governor stability, power control, and hydraulic transients in hydropower plants. IEEE Trans. Energy Convers. 2017, 32, 91–98. [Google Scholar] [CrossRef] [Green Version]
  21. Zhu, D.; Guo, W. Critical sectional area of surge chamber considering nonlinearity of head loss of diversion tunnel and steady output of turbine. Chaos Solitons Fractals 2019, 127, 165–172. [Google Scholar] [CrossRef]
  22. Zhang, H.; Guo, P.; Sun, L. Transient analysis of a multi-unit pumped storage system during load rejection process. Renew. Energy 2020, 152, 34–43. [Google Scholar] [CrossRef]
  23. Liu, Y.; Guo, W. Multi-frequency dynamic performance of hydropower plant under coupling effect of power grid and turbine regulating system with surge tank. Renew. Energy 2021, 171, 557–581. [Google Scholar] [CrossRef]
  24. Chen, J.P.; Yang, J.D.; Guo, W.C.; Teng, Y. Study on the stability of waterpower-speed control system for hydropower station with upstream and downstream surge chambers based on regulation modes. In Proceedings of the 27th IAHR Symposium on Hydraulic Machinery and Systems (IAHR), Montreal, QC, Canada, 22–26 September 2014. [Google Scholar]
  25. Cao, L.N.; Ao, J.W.; Wu, D.K.; Li, B.; Zhang, H. Research on regulation quality of hydropower generation system with double surge chambers under small fluctuation. Water Resour. Power 2021, 39, 177–180. (In Chinese) [Google Scholar]
  26. Wu, F.L.; Guo, W.C.; Fu, S.; Qu, F.L. Hydraulic coupling vibration characteristics and control of hydropower station with upstream and downstream surge tanks. Sustain. Energy Technol. Assess. 2022, 50, 101842. [Google Scholar] [CrossRef]
  27. Yu, X.; Yang, X.; Liu, Z.; Zhang, J. Mechanism and quantified criteria of stability characteristics of hydropower plants with surge tanks during regulation. Int. J. Electr. Power Energy Syst. 2020, 122, 106160. [Google Scholar] [CrossRef]
  28. Yu, X.; Yang, X.; Zhang, J. Stability analysis of hydro-turbine governing system including surge tanks under interconnected operation during small load disturbance. Renew. Energy 2019, 133, 1426–1435. [Google Scholar] [CrossRef]
  29. Liu, Y.; Zhang, J.; Liu, Z.; Chen, L.; Yu, X. Surge wave characteristics for hydropower plant with upstream double surge tanks connected in series under small load disturbance. Renew. Energy 2022, 186, 667–676. [Google Scholar] [CrossRef]
  30. Kuznetsov, Y.A.; Kuznetsov, I.A.; Kuznetsov, Y. Elements of Applied Bifurcation Theory; Springer: Berlin/Heidelberg, Germany, 1998. [Google Scholar]
Figure 1. Sketch map of the HPUDSC.
Energies 16 04517 g001
Figure 2. Bifurcation curve and values for σ(ψc): (a) Bifurcation curve. (b) Values for σ(ψc).
Energies 16 04517 g002
Figure 3. Time domain processes of q1, Zu1 and φ and phase space trajectories of q1-Zu1-φ under P1, P2 and P3: (a) Time domain process under P1. (b) Phase space trajectory under P1. (c) Time domain process under P2. (d) Phase space trajectory under P2. (e) Time domain process under P3. (f) Phase space trajectory under P3.
Energies 16 04517 g003aEnergies 16 04517 g003b
Figure 4. Stability domains under different Tw1, Tw2 and Tw3.
Energies 16 04517 g004
Figure 5. Dynamic behaviors under different Tw1, Tw2 and Tw3.
Energies 16 04517 g005
Figure 6. Stability domains under different α1, α2 and α3.
Energies 16 04517 g006
Figure 7. Dynamic behaviors under different α1, α2 and α3.
Energies 16 04517 g007
Figure 8. Stability domains under different Fu1 and Fu2.
Energies 16 04517 g008
Figure 9. Dynamic behaviors under different Fu1 and Fu2.
Energies 16 04517 g009
Table 1. Data of a HPUDSC.
L1/mL2/mL3/mA1/m2A2/m2A3/m2α1/(s2/m5)α2/(s2/m5)α3/(s2/m5)Fu1/m2
8711.21363.21580.1121.4951.93589.597.94 × 10−51.53 × 10−54.23 × 10−5400
Fu2/m2H0/mQ0/(m3/s)S5/puS6/puS7/puS8/puS9/puS10/puSp/pu
353226.1290.81.660.35−1.42.61−0.61−1.40
Table 2. Data of three points.
PointbtTd (s)LocationTheoretical State
P10.912.1Instability domainLimit cycle
P21.112.1Bifurcation curveLimit cycle
P31.312.1Stability domainEquilibrium point
Disclaimer/Publisher’s Note: The statements, opinions and data contained in all publications are solely those of the individual author(s) and contributor(s) and not of MDPI and/or the editor(s). MDPI and/or the editor(s) disclaim responsibility for any injury to people or property resulting from any ideas, methods, instructions or products referred to in the content.

