Article

Design and Implementation of Inductively Coupled Power and Data Transmission for Buoy Systems

1
School of Marine Science and Engineering, Shandong University of Science and Technology, Qingdao 266590, China
2
The State Key Laboratory of Precision Measuring Technology and Instruments, Tianjin University, Tianjin 300072, China
*
Author to whom correspondence should be addressed.
Current address: Qingdao National Laboratory of Marine Science and Technology, Qingdao 266237, China.
These authors contributed equally to this work.
Energies 2023, 16(11), 4417; https://doi.org/10.3390/en16114417
Submission received: 15 March 2023 / Revised: 3 May 2023 / Accepted: 9 May 2023 / Published: 30 May 2023
(This article belongs to the Special Issue Advances in Wireless Power Transfer System)

Abstract

:
Moored buoys are important components of stereo platforms for ocean observation, which are crucial in underwater exploration. In complex marine environments, power supply and data transmission between moored buoys and underwater sensors are difficult. To solve these problems, an inductively coupled power and data transfer (ICPDT) scheme based on LCCL-S-LC hybrid compensation is proposed. The power transmission was analyzed by establishing an LCCL-S-LC compensation buoy ICPDT system model. The system efficiency and output power were analyzed when the load changed, and the optimal load resistor for maximum system efficiency was determined. A modulation and demodulation circuit used for data transmission was introduced, the compensation topology parameters of each loop of the buoy ICPDT system were deduced, and the crosstalk between power and data was analyzed and reduced. An ICPDT system prototype was built to verify the system’s feasibility and effectiveness when it was powered by 24 V. The LCCL-S-LC topology reduced the interference between data and power transmission. When the measured output power of the system was 61.5 W, the power transmission efficiency was 78.1%, and the data receiving end could achieve correct demodulation when the transmission rate was 100 kb/s.

1. Introduction

Moored buoys are pieces of marine environment monitoring equipment that use mooring cable to ensure that surface buoys and their underwater anchors remain relatively fixed. With the advantages of long service lives and the ability to host multiple sensors, moored buoys are widely used in marine monitoring [1,2,3]. Various sensors mounted on mooring cables are used to obtain physical information, such as conductivity, temperature, salinity, etc., at different profiles. For power supply, underwater sensors rely on battery packs. However, battery packs must be regularly replaced as they run out, which increases the deployment costs [4,5]. The traditional wired charging method experiences problems with sliding wear and bare connections, which makes it unsuitable for charging underwater sensors. Inductively coupled power and data transmission (ICPDT) is an attractive technology that can simultaneously achieve battery charging and data transmission. Therefore, in this study, we focused on ICPDT technology.
ICPDT systems can realize inductively coupled power transmission from a power source to a load; they can also send instructions to sensors to obtain data. Compared with traditional wired transmission, they do not experience problems with wire-type transmission cable wear or exposed joints. Due to these advantages, ICPDT systems are widely used in electric vehicles, underwater AUVs, etc. [6,7,8,9,10,11]. Compared with traditional ICPDT systems, moored buoy ICPDT systems have the following characteristics: First, moored buoy ICPDT systems are applied for the power supply and data transmission of water buoys and underwater sensors. Underwater sensors are arranged in various sections below sea level to collect temperature and salinity data and are usually several meters away from the buoys for energy and data transmission. The coupling coefficient of traditional primary and secondary coupling coils is low when the distance is too far, and the power transmission power is low or may even be zero [12,13,14]. A contactless power supply system (CLPS) using a cone-type coil was proposed for underwater vehicles [15], which could transmit 500 W of electric power with approximately 96% efficiency when the diameter of the coil was 48 mm. Second, when the closed loops formed by mooring cables are used for power and data transmission, the influence of the resonance formed by the mooring cables on the resonance frequency of the power and data transmission needs to be evaluated, and the loss of data signals when they flow through mooring cable circuits needs to be considered to ensure the efficient transmission of power and the high-speed transmission of data. Third, mooring buoy ICPDT systems use mooring cables as intermediate circuits, allowing for power and data transmission without changing the sensor positions, which reduces the burden of the buoys’ mechanical structures.
With the development of ICPDT technology, power transmission technology has become relatively mature, and we focus on how to improve the data transmission performance. At present, the four main methods in ICPDT technology are as follows: The first technique uses two pairs of coupled coils to separately transmit power and data [16,17,18]. The power and the data transmission coils are separate from each other, which reduces the crosstalk between the data and power transmissions. However, adding a pair of coupled coils increases the system’s size and weight, and the separation of the two pairs of coils further increases the system volume The second technique transfers power and data by changing the inverter input voltage or load [19,20,21]. Researchers [19] proposed a modulation and demodulation method based on load transfer keying (LSK), which demodulates data by changing the current of the load monitoring/receiving coil, and the voltage information of the load resistance is transmitted to the primary coil to adjust the primary input. The voltage is used to control the load power, and the load output power is approximately 1.1 W. The efficiency of this system is only 60% due to fluctuations in the power received by the load caused by the changes in the input voltage on the primary side. Adjustments to the input voltage and changes in the load lead to changes in the output power, which directly affect the output power and efficiency of the system. The frequency of data transmission is usually lower than the resonant frequency of power transmission, and the data transmission rate is not high. The third technique uses carrier-based ICPDT technology [22,23,24,25], which superimposes data signals onto high-frequency carriers and then superimposes data waveforms onto power waveforms using on–off keying (OOK). Power waveforms are transmitted to the secondary side through electromagnetic coupling; then, the data signals are extracted from the power signals for demodulation. In this case, power transmission has a stronger impact on data transmission, so analyzing and reducing interference are difficult, which increases the difficulty of data demodulation. The fourth technique is the 2FSK -modulation-based ICPDT technique [26,27]. The data transmission frequency based on 2FSK modulation is usually an order of magnitude higher than the power transmission frequency. The interference between data transmission and power transmission is minimal and can be ignored. Most of the interference between power transmission and data transmission can be removed by adding filters. Frequency division multiplexing can also be implemented.
The data transmission mode based on FSK modulation and demodulation has the following advantages: Compared with independent electric energy and data transmission circuits, the circuit structure of the 2FSK method is simple, and data can be transmitted by simply injecting signals into electric energy transmission circuits. The FSK modulation and demodulation frequencies are generally higher than the power transmission frequency, so the data transmission rate can be very high. In addition, the FSK method has a high SNR and a low bit error rate.
In the air, as a medium, ICPDT technology has been applied in various situations, such as the wireless charging of electric vehicles, implantable medical devices [27,28], constant-current or constant-voltage inductive charging of UAVs [29], as well as wireless charging of mobile phones, computers, and other devices [30,31,32]. However, inductively coupled power and data transmission systems with intermediate loops in the marine environment have rarely been reported in the literature.
To ensure adequate energy reception and simultaneous data transmission for underwater sensors, in this study, we employed frequency division multiplexing technology and developed an inductively coupled power and data transmission system with shared coupling channels. Through an analysis of the characteristics of four data transmission modes, 2FSK modulation and demodulation technology, known for its high signal-to-noise ratio (SNR) and high data transmission rate, was selected as the preferred data transmission mode.
The main contributions of this study are summarized as follows:
(1)
The moored buoy ICPDT system model based on the LCCL-S-LC hybrid compensation was established and analyzed in detail, including the power and data transmission modules.
(2)
The 2FSK modulation and demodulation technology was applied to the buoy data transmission. The demodulation circuit adopts an NE564 module with adjustable loop gain. A notch filter composed of L1/L3 was designed to reduce the interference between power and data transmission.
(3)
The reliability of the proposed system was verified through experiments, where we observed that, at an output power of 61.5 W, the power efficiency was 78.1%. Additionally, the data receiving side successfully demodulated data at a rate of 100 kb/s.
The rest of this paper is organized as follows: Section 2 presents the system structure of ICPDT, and the equivalent circuit mode is established and analyzed. In Section 3, we analyze the crosstalk between power and data and propose methods to reduce the interference. In Section 4, we verify the power and data transmission characteristics of the proposed moored buoy ICPDT system through experiments. The conclusions are drawn and discussions are outlined in Section 5.

2. System Modeling

2.1. System Structure

Although many researchers have studied traditional ICPDT system modeling, the modeling and analysis of the three-loop moored buoy ICPDT system is relatively complex. Moored buoy ICPDT systems are mainly composed of three circuits: the above-water, the mooring cable, and the underwater circuits. The overall structure of the system is shown in Figure 1. A solar panel is installed on the upper part of the buoy body, which provides electricity for the internal battery. An above-water coupler forms a closed loop with the underwater control center’s coupler through a mooring cable. Inductive coupling principles are employed for both power and data transmissions in this configuration. The underwater sensor is usually a temperature and salinity depth sensor (CTD) or a Doppler current profiler (ADCP). The mooring cable is not only the load-bearing cable of the buoy but can also be used as a closed intermediate loop for power and data transmission, providing good rigidity and stability. The data received by the above-water system can be transmitted to iridium through the satellite antenna, and the shore-based personnel use an upper computer to receive the data and perform the next step.
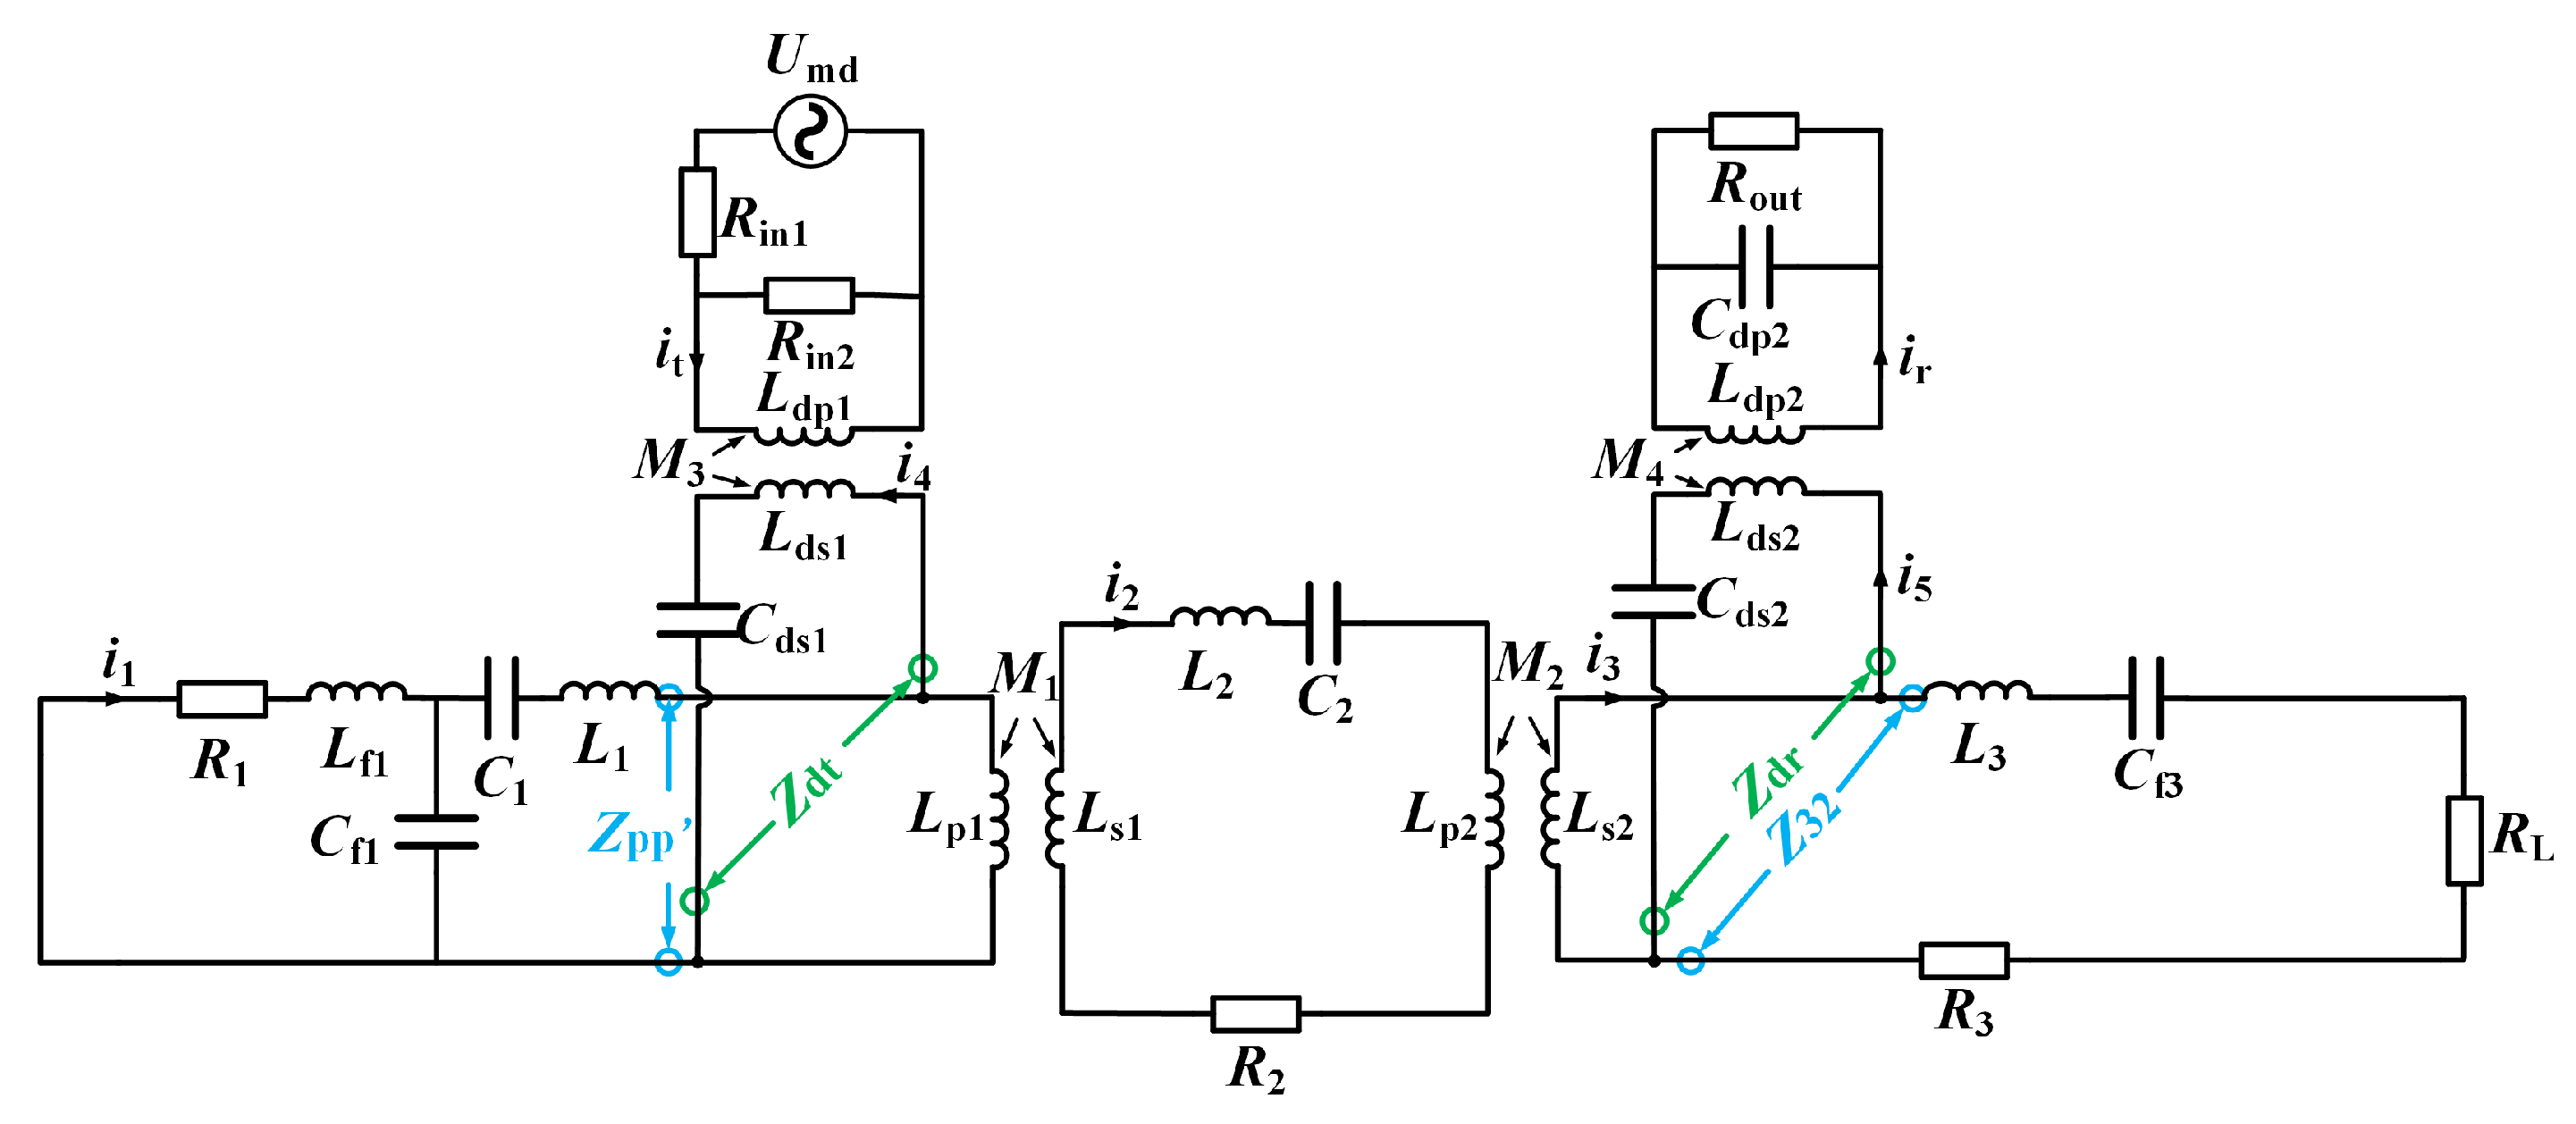
The system circuit model is shown in Figure 2. The DC voltage output by the above-water power supply system is converted into AC voltage U d through an inverter circuit, and the operating frequency of the inverter is f p . R 1 is the AC equivalent resistance of the above-water circuit; L f 1 , C f 1 , and C 1 are the primary series compensation inductance, parallel compensation capacitor, and series compensation capacitor, respectively; L 1 is the primary wave trap; L p 1 and L s 1 are the primary and secondary inductance of the above-water coupling magnetic ring, respectively; L 2 is the self-induction of the mooring cable; C 2 is the series compensation capacitor of the mooring cable circuit.; R 2 is the AC equivalent resistance of L s 1 , L 2 , and L p 2 . L p 2 and L s 2 are the primary and secondary inductance of the underwater coupling magnetic ring, respectively; L 3 is the secondary wave trap; C f 3 is the series compensation capacitor of the underwater loop; D 1 , D 2 , D 3 , and D 4 are the four diodes forming a full-bridge rectifier circuit; C F is a filter capacitor; and RL is load.
The blue short dotted line represents the data transmission circuit; U m d is the modulation data; R i n 1 and R i n 2 are the series and parallel resistance, respectively; L d p 1 and L d s 1 are the primary and secondary inductance of the data injection magnetic ring, respectively; C d S 1 forms resonance with L d s 1 when the data carrier frequency is f d . The blue dotted line is surrounded by the data receiving circuit. R o u t is the output resistance of the data receiving circuit; C d p 2 is the parallel compensation capacitor; L d p 2 and L d s 2 are the primary and secondary inductance of the data extraction magnetic ring, respectively; C d s 2 forms resonance with L d s 2 at f d .
The data demodulation circuit is shown in Figure 3 and consists of 4 modules. The first stage is amplifier Amp1, which can amplify the waveform of the data extraction magnetic ring to an appropriate multiple that can be demodulated. The band-pass filter is composed of RLC in series and parallel. The low- and high-frequency noise is filtered out. Amplifier Amp2 in the third stage is used to amplify the filtered carrier signal; the fourth stage is the FSK demodulation module, which is composed of NE564. U d d represents the final demodulated data.

2.2. Power Transmission Analysis

The power transmission of an ICPDT system was analyzed with an equivalent circuit. The system compensation structure adopts LCC-S-LC compensation. To simplify the calculation, the inverter circuit is equivalent to an AC voltage source, and the full-bridge rectifier circuit and electronic load are equivalent to pure resistance R L , which is represented by (1). The simplified circuit is shown in Figure 4, where U d is the output voltage of the inverter, and the frequency is f d , which is represented by (2).
R L = 8 π 2 R E
U d = 2 2 π U i n
The circuit was analyzed by Kirchhoff’s law. In the above-water circuit, the series impedance of C 1 , L 1 , and L p 1 can be expressed as:
Z 12 = 1 j ω p C 1 + j ω p L 1 + j ω p L p 1
Then, the parallel impedance of C f 1 and Z 12 can be expressed as:
Z 11 = 1 j ω p C f 1 Z 12 1 j ω p C f 1 + Z 12
In the underwater circuit, the series impedance of L 3 , R 3 , C f 3 , and R E can be expressed as:
Z 31 = j ω p L 3 + R 3 + 1 j ω p C f 3 + R L
The equivalent impedances Z 1 , Z 2 , and Z 3 of the above-water, mooring cable, and underwater circuits can be expressed as:
Z 1 = R 1 + j ω p L f 1 + Z 11 Z 2 = j ω p L s 1 + 1 j ω p C 2 + R 2 + j ω p L 2 + j ω p L p 2 Z 3 = j ω p L s 2 + Z 31
According to the principle of mutual inductance impedance transformation, the reflection impedances Z 23 and Z 12 can be expressed as:
Z 23 = ω p 2 M 2 2 Z 3 Z 12 = ω p 2 M 1 2 Z 2 + Z 23
In (7), Z 23 is the impedance converted from the underwater loop to the mooring cable loop, and Z 12 is the equivalent impedance converted from the impedance of the mooring cable loop to the above-water loop.
M 1 and M 2 are the mutual inductances of the above-water coupled magnetic ring and the underwater coupled magnetic ring, respectively. In the experiment, an LCR meter (TH2840B Precision LCR Meter) was used to measure the self-induction and mutual inductance values of the electromagnetic coupler, and we calculated k1 and k2 using the following equation:
M 1 = k 1 L p 1 L s 1 M 2 = k 2 L p 2 L s 2
ω p is the resonant angular frequency of the power transmission system, which is tuned as:
ω p = 2 π f p ω p L f 1 = 1 ω p C f 1 1 ω p C f 1 + 1 ω p C 1 = ω p L 1 + ω p L p 1 1 ω p C 2 = ω p L p 1 + ω p L 2 + ω p L p 2 1 ω p C f 3 = ω p L s 2 + ω p L 3
Equation (9) describes the conditions that the angular frequency needs to meet when the power transmission system works in the resonance state, where f d is the frequency of power transmission.
By simultaneously solving Equations (1)–(9), the currents of the above-water, the mooring cable, and the underwater circuits can be obtained as:
I 1 = U d Z 1 + Z 12 I 2 = j ω p M 1 U d ( Z 1 + Z 12 ) ( Z 2 + Z 23 ) I 3 = j ω p M 1 j ω p M 2 U d Z 3 ( Z 1 + Z 12 ) ( Z 2 + Z 23 )
In (10), I 1 , I 2 , and I 3 are the power transmission channel currents of the above-water, the mooring cable, and the underwater circuits.
From (10), the load voltage can be obtained as:
V O U T = I 3 R L
The output power and system efficiency can be obtained as:
P O U T = V O U T 2 R L
η = P O U T P I N × 100 %
P I N represents the input power of the system.
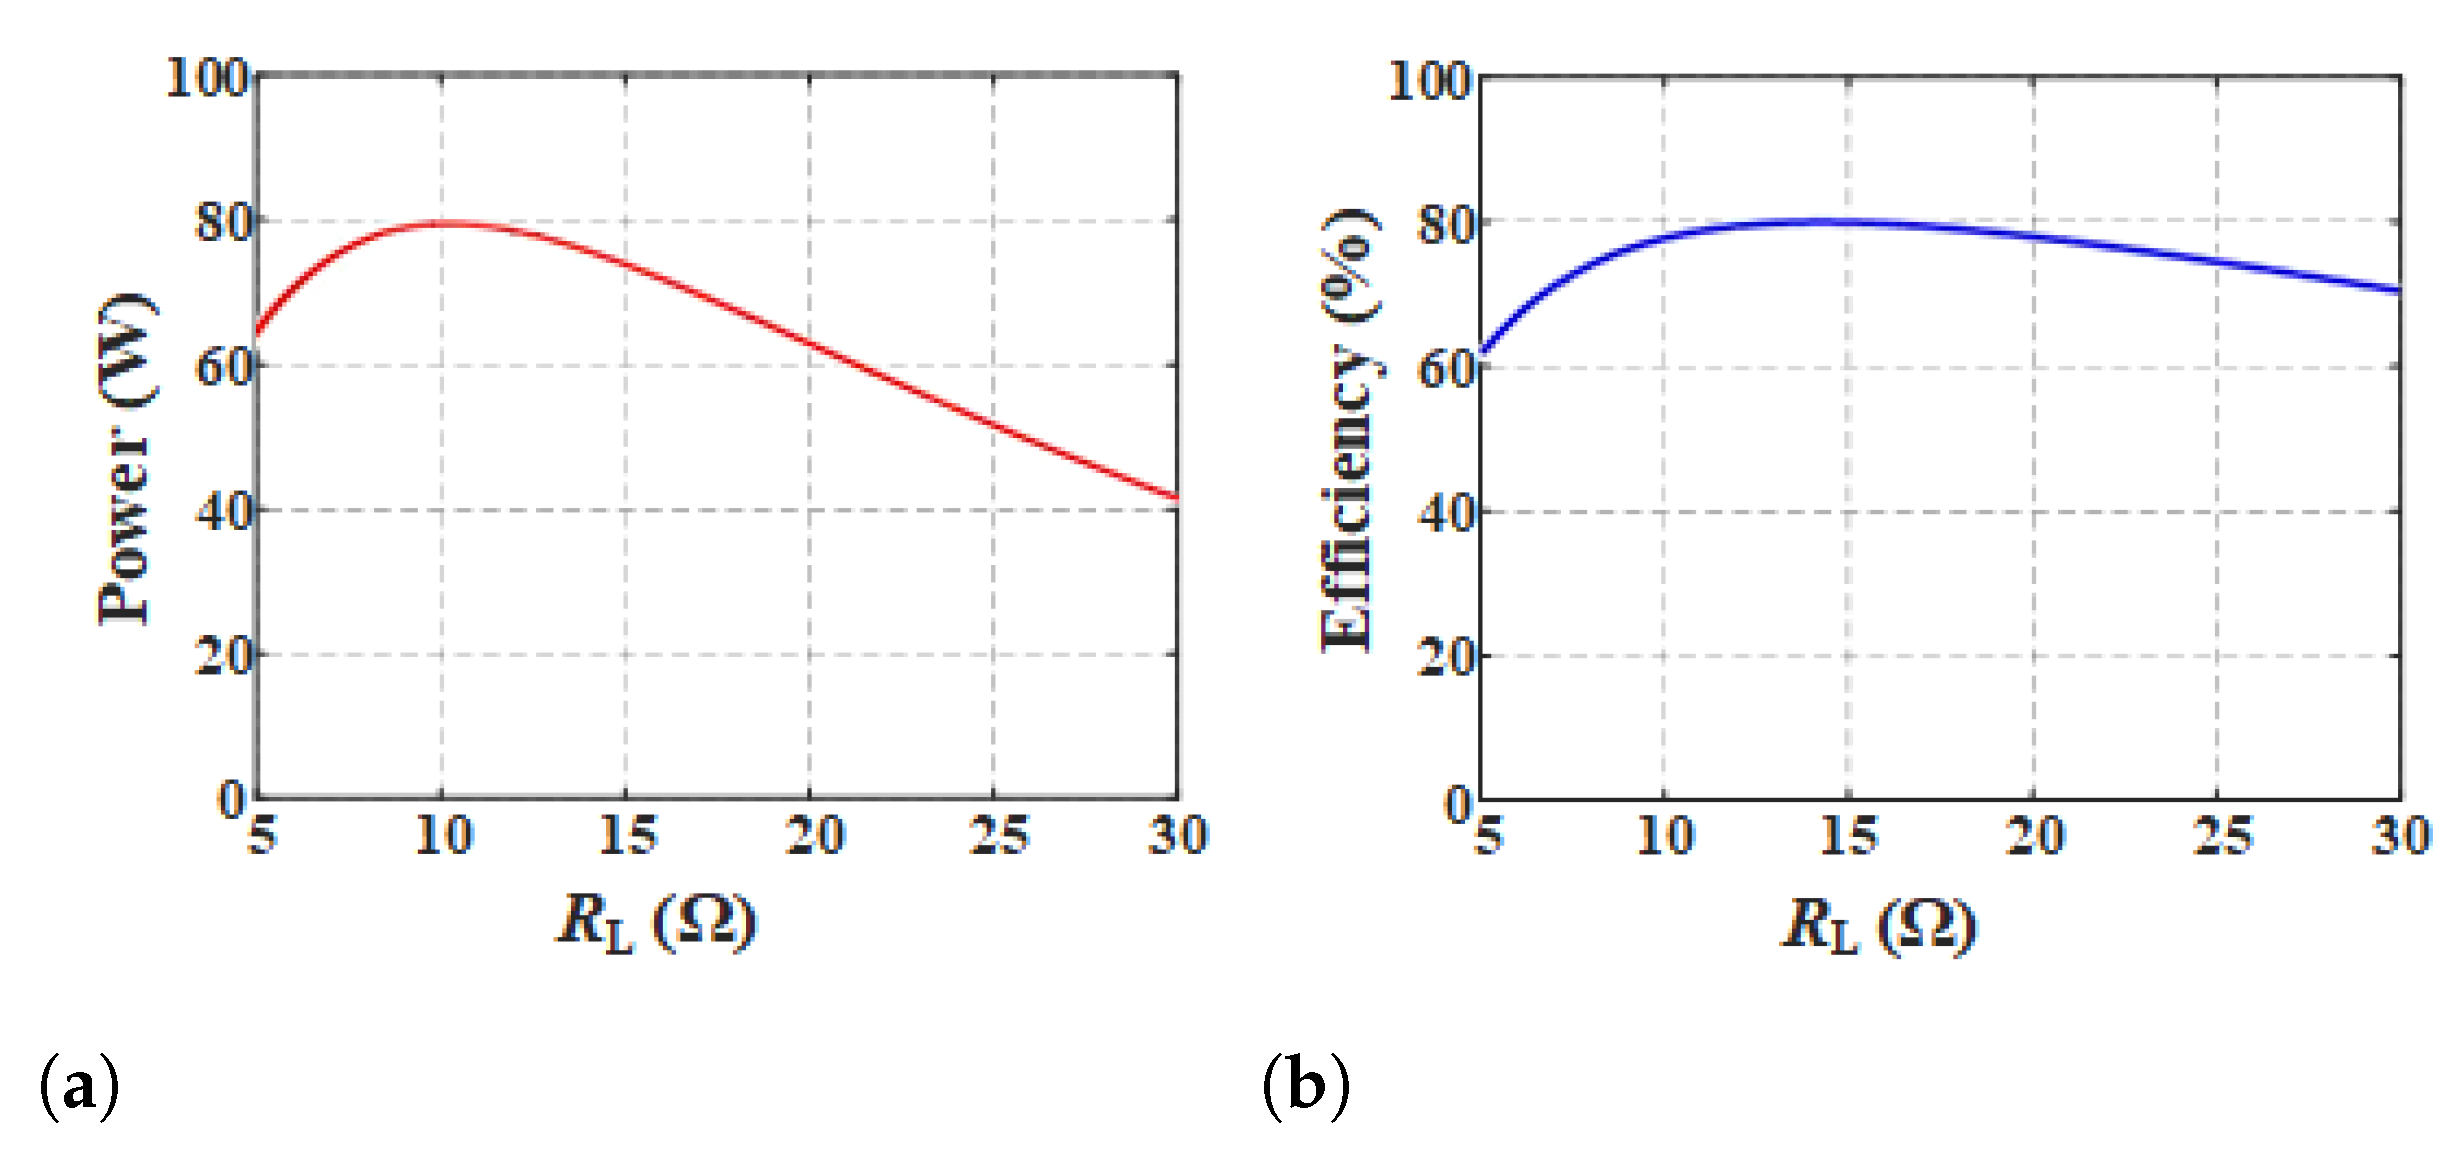
After determining the value of the other components, take the derivative of (12) and (13). When RL is approximately 10.3 Ω and 15.2 Ω , the output power and efficiency reach the maximum value.
After the output voltage is obtained, the transfer function of power transmission can be obtained:
G p o w e r = V O U T U d
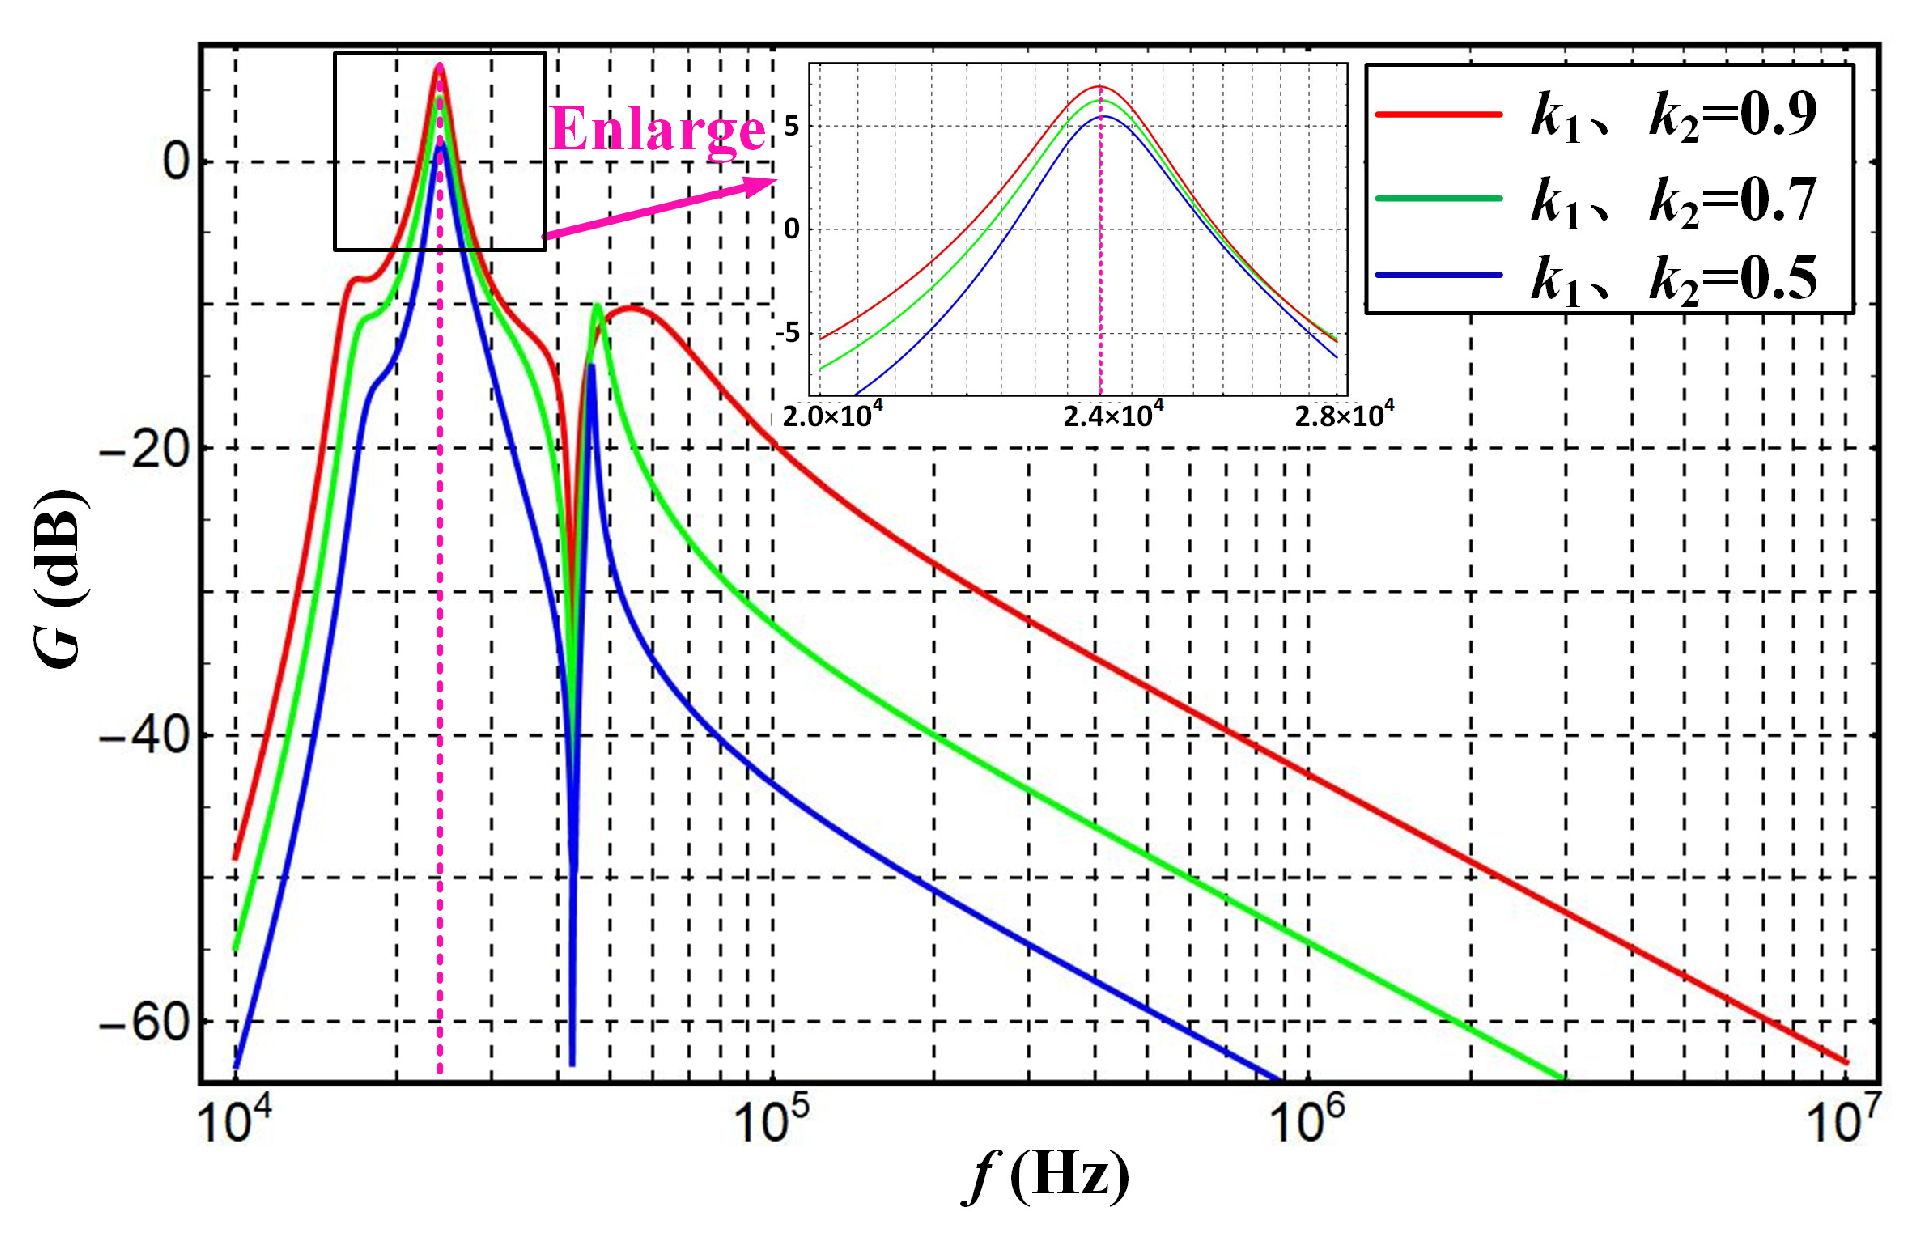
The transfer function of power transmission is related to the mutual inductance of the magnetic ring, which is essentially related to the coupling coefficient. The amplitude–frequency response curve of the power transmission shown in Figure 5 can be obtained after substituting the parameters of the system into (14).
Figure 5 shows that the power transmission gain has a peak value at 24 kHz, which is the resonant frequency of the power transmission. With the increase in the coupling coefficient, the voltage gain of the load shows an upward trend; that is, the larger the value of the mutual inductance of the power transmission magnetic ring, the greater the power received by the load end.Therefore, a larger coupling coefficient was selected for the experiment.
Figure 5 also shows that the load voltage gain has a double-peak characteristic; that is, two maximum points can be seen, which is called the frequency splitting phenomenon of the ICPDT system. This occurs due to the peak separation phenomenon, which is caused by the system being in an over-coupling state. This aspect was not the focus of this study. After determining the working frequency of power transmission, the influence of frequency splitting on the ICPDT system designed in this study could be ignored.
The gap of the coupling ring and coupling coefficient k 1 and k 2 can be determined after determining the influence of the coupling coefficient on the power gain. When determining the values of the other components, the output power and efficiency of the system are related to the load R L , and the output power curve and efficiency curve under the change in R L were drawn using Mathematica, as shown in Figure 6.
Figure 6 shows the change curve of the system output power with the load. The load R L continues increasing, and the output power shows a trend of first increasing and then decreasing. When the load is 10 Ω , the maximum output power of the system is 76 W, and, when the load is 15 Ω , the system efficiency reaches a maximum of 79%. For the proposed ICPDT system, high output power and efficiency can be guaranteed by selecting the appropriate load value.

2.3. Data Transmission Circuit Design and Analysis

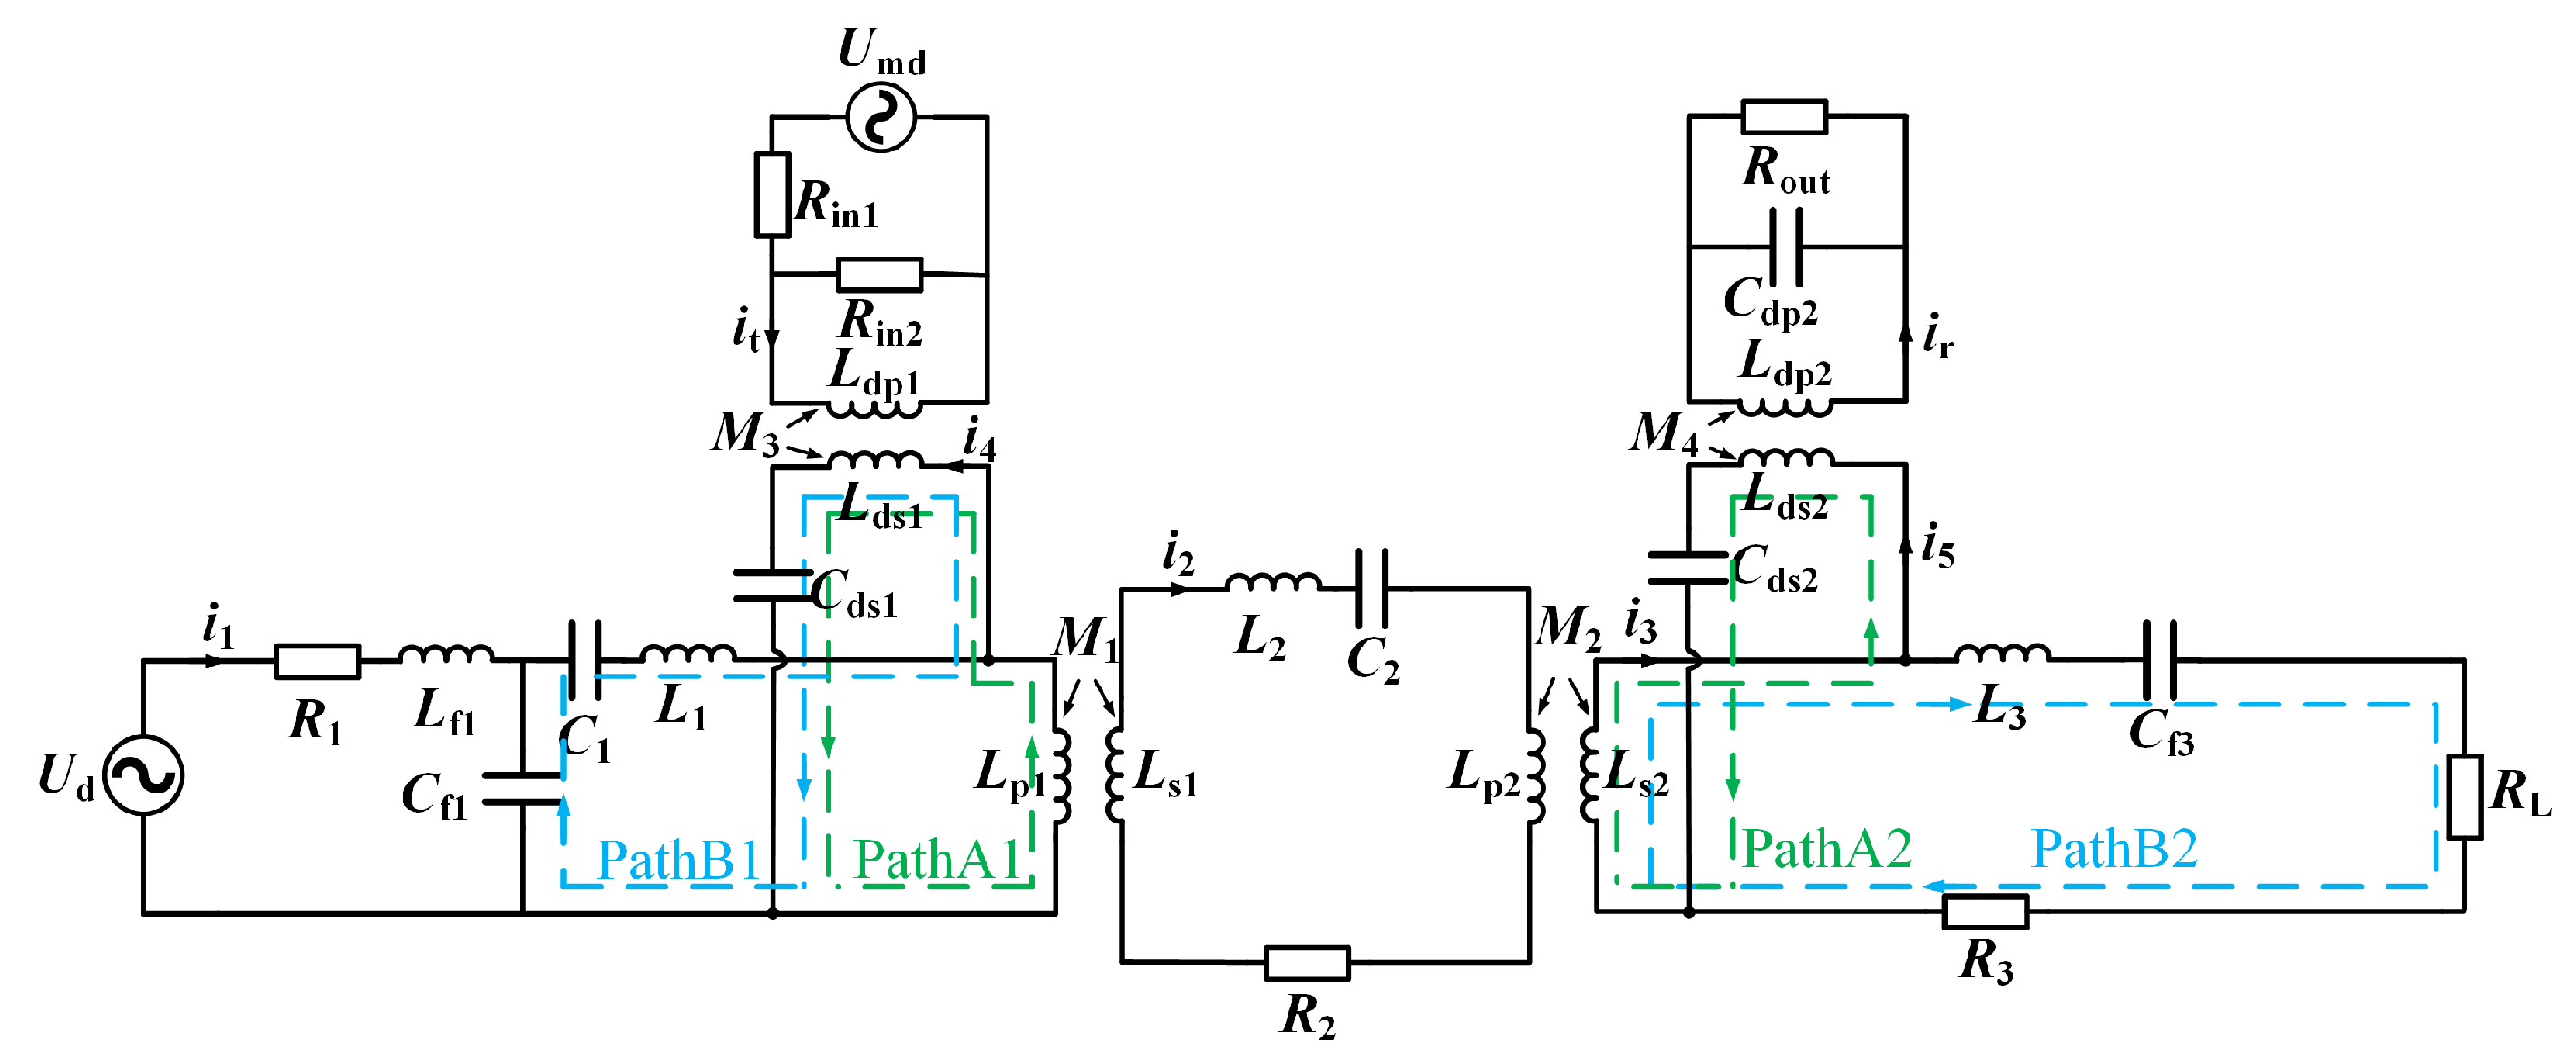
The data transmission circuit was analyzed after paralleling the data transmission channel in the power transmission channel. First, the function of each device in the ICPDT system is described. As shown in Figure 7, L f 1 , C f 1 , and L 1 form a third-order low-pass filter, which can filter out the higher harmonics of the inverter output voltage U d . The interference of U d to data transmission is considerably reduced, thereby reducing the bit error rate of data transmission. L 3 and C f 3 form a second-order low-pass filter, which can reduce the influence of the high-order harmonics of the input voltage of the rectifier circuit on data demodulation.
Notch inductors L 1 and L 3 are used to increase the impedance of paths B1 and B2 and increase the data flow of paths A1 and A2. The more the data pass through the data extraction circuit, the stronger the signal received by R o u t , and the easier the data demodulation becomes. If L 1 and L 3 are not used, most of the data signal flows in B1 and B2, the signal received by R o u t becomes weaker, and demodulation is more difficult. Due to the existence of L 1 and L 3 , the part of the data signal flowing to the power channel can be ignored in the subsequent analysis of the data transmission circuit.
C d s 1 and L d s 1 resonate at f d ; C d s 2 and L d s 2 also resonate at f d . f d is the resonant frequency of data transmission, and f p is the resonant frequency of power transmission. Under the condition that f d satisfies (15), the influence of power transmission on data transmission can be substantially reduced. L d s 1 , L d p 1 and L d s 2 , L d p 2 are used as the primary and secondary stages of the data transmission magnetic ring, respectively, and their volume should be reduced as much as possible in the design, so the value should not be too large. The power of data transmission should be controlled within a certain range to reduce the interference of data transmission to power transmission. Therefore, two conditions should be comprehensively considered to determine the values of L d s 1 , L d p 1 and L d s 2 , L d p 2 . R i n 1 is used to adjust the amplitude of the data signal and limit the power consumption of the data transmission circuit. R i n 2 is used to remove the voltage spikes generated during the frequency conversion of the two carriers during 2FSK modulation. Among them, the relationship between f d and f p is shown in (15).
f d 10 f p
The impedance of each loop of the data transmission channel is simplified to obtain the equivalent impedance of each part of the data transmission circuit:
Z 4 = R 1 + j ω d L d p 1 R i n 2 j ω d L d p 1 + R i n 2 Z 5 = j ω d L d p 2 + 1 j ω d C t 2 R o u t 1 j ω d C t 2 + R o u t Z d t = 1 j ω d C d s 1 + j ω d L d s 1 + ω d 2 M 3 2 Z 4 Z d r = 1 j ω d C d s 2 + j ω d L d s 2 + ω d 2 M 4 2 Z 5
where Z 4 and Z 5 are the primary equivalent impedance of the data injection circuit and the secondary equivalent impedance of the data extraction circuit, respectively. Z d t and Z d r are the equivalent total impedances of the data injection and extraction circuits, respectively.
According to the principle of mutual inductance impedance transformation, the expressions of Z 35 , Z 23 , Z 12 , and Z 14 are obtained as follows:
Z 35 = ω d 2 M 4 2 Z 5 Z 23 = ω d 2 M 2 2 Z 35 Z 12 = ω d 2 M 1 2 Z 23 Z 14 = ω d 2 M 3 2 Z 12
In (17), Z 35 is the reflected impedance of the data-receiving circuit to the underwater circuit, Z 23 is the reflected impedance of the underwater circuit to the mooring cable circuit, Z 12 is the reflection impedance of the mooring cable circuit to the water circuit, and Z 14 is the reflection impedance of the water circuit to the data transmission circuit.
M 3 and M 4 are the mutual inductances between the data-sending and data-receiving magnetic ring, which are represented by the following equation:
M 3 = k 3 L d s 1 L d p 1 M 4 = k 2 L d s 2 L d p 2
Based on Kirchhoff’s law, the currents of each loop of the data transmission circuit can be obtained as:
I 4 = I 1 Z 11 Z 12 Z d t j ω d L d p 1 Z d t + j ω d L d p 1 1 j ω d C d s 1 + j ω d L d s 1 I 5 = I 3 Z 31 Z 31 + Z d r I t = j ω d M 3 I 4 Z 4 I r = j ω d M 4 I 5 Z 5
From (19), we can deduce that the voltage and power received on R o u t in the data extraction circuit are, respectively:
V o u t = 1 j ω d C t 2 R o u t 1 j ω d C t 2 + R o u t
P o u t = V o u t 2 R o u t
Then, the transmission gain G d a t a of the data carrier can be expressed as:
G d a t a = V o u t U m d
Figure 8 shows the amplitude–frequency response curve of the data forward transmission gain. On the basis of determining the power transmission frequency of 24 kHz, the data transmission gain achieves the maximum value between 1 and 2 MHz. The difference between the power transmission frequency of the ICPDT system and the data transmission frequency is more than 10 times. This power transmission circuit can be equivalent to a short circuit at the data transmission frequency. At this time, the data transmission circuit does not occupy too much load receiving power. The overall efficiency of the system is not substantially reduced. Therefore, 1.3 MHz and 2 MHz were selected as the 2FSK carrier frequencies.
The values of L 1 and L 3 are determined based on the data carrier transmission gain G d a t a defined by the above equation. The fourth part produces the variation curve of G d a t a with respect to L 1 and L 3 . By selecting suitable L 1 and L 3 , the interference of power transmission with data transmission can be reduced while obtaining a larger data transmission gain.

3. Crosstalk Analysis

3.1. Data Transmission Interference with Power Transmission

The influence of data transmission on power transmission is shown as the change in R L received power in the following two states: In the first case, the data transmission loop does not transmit data. In the second case, the data and power are simultaneously transmitted. The power received by R L in the two cases is analyzed below.
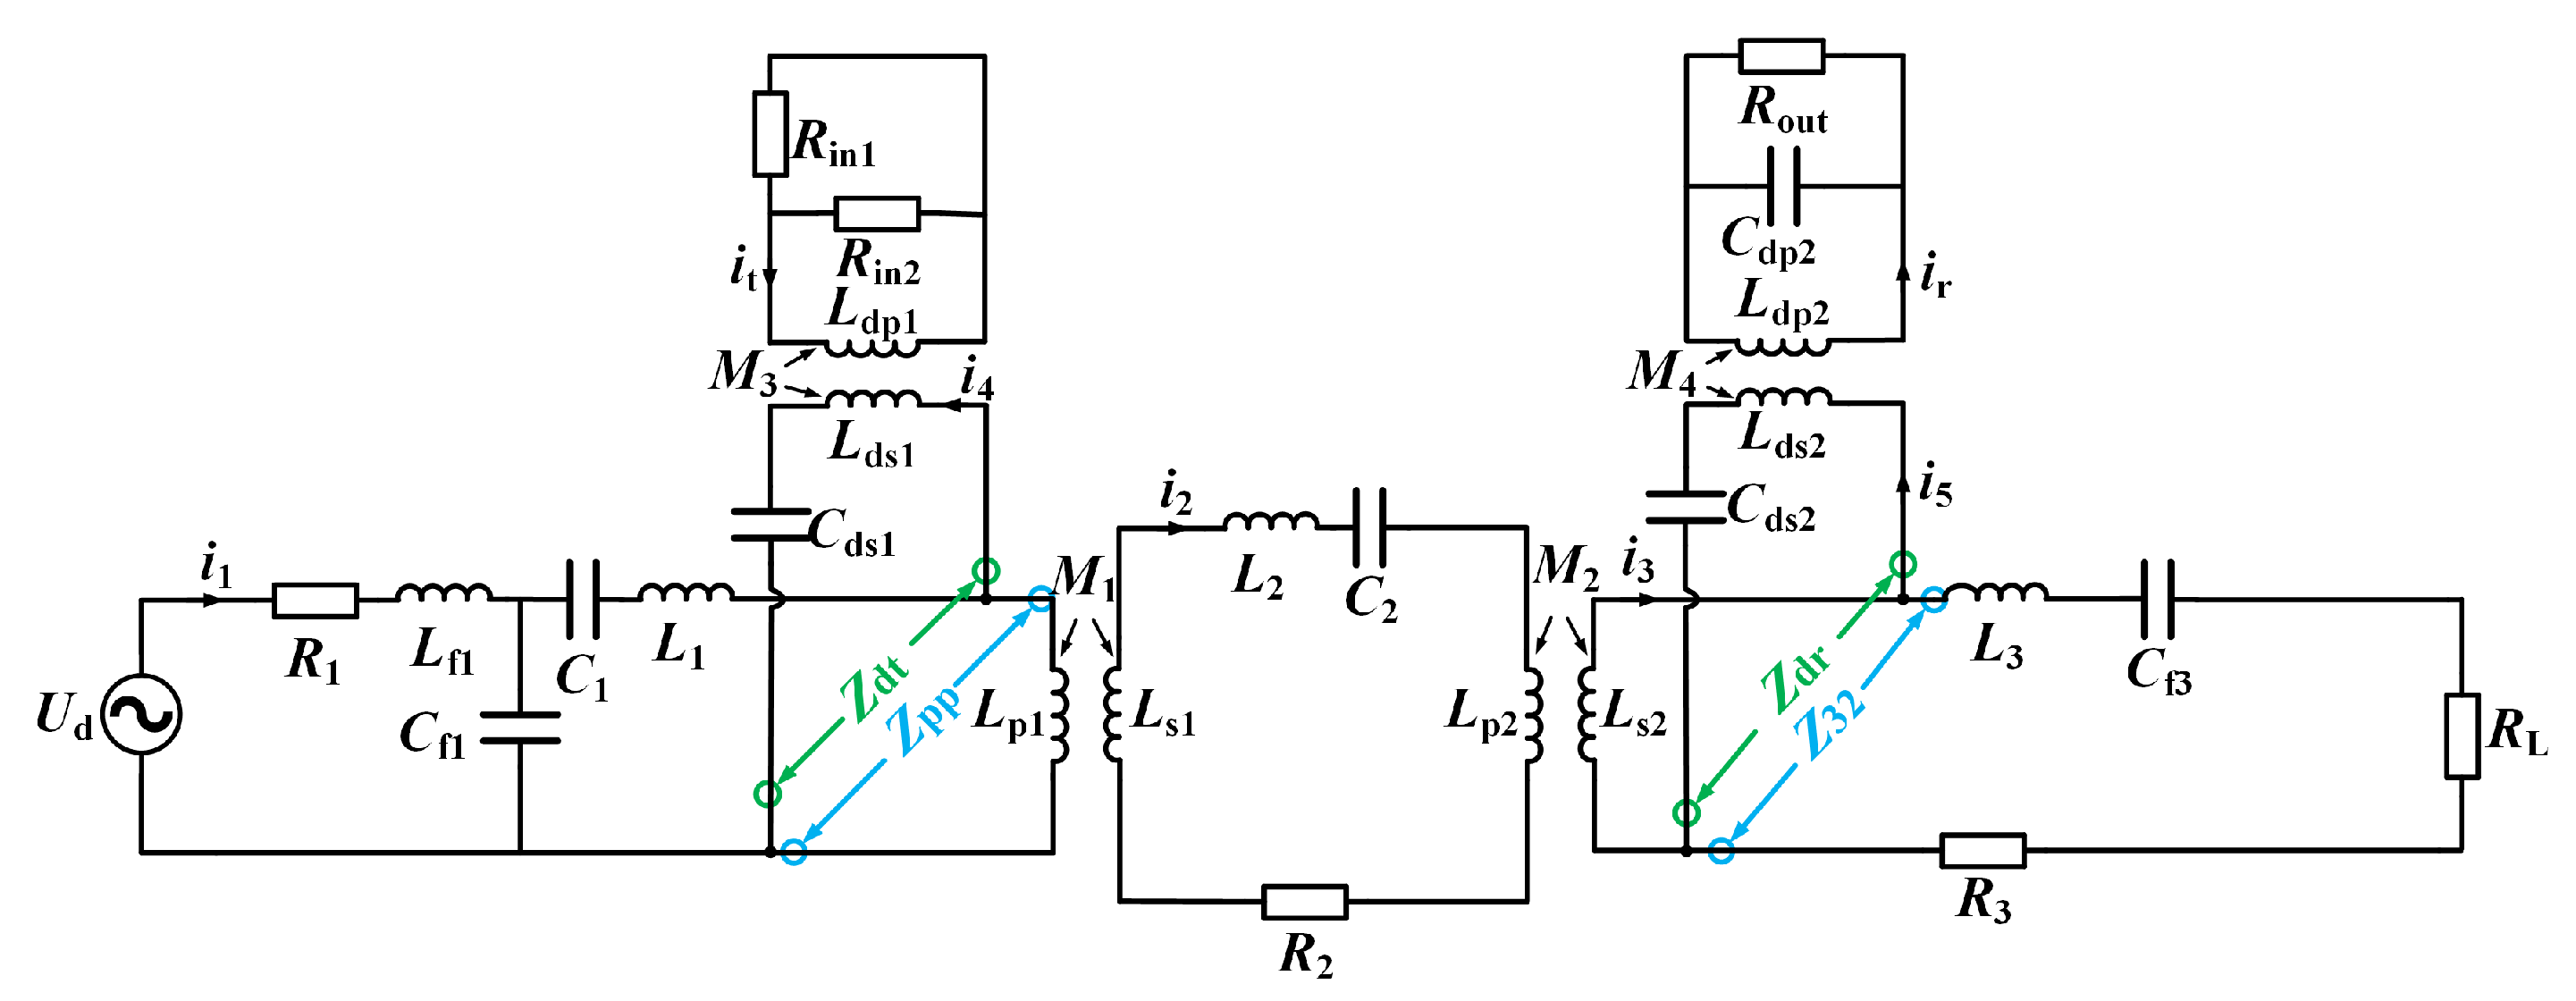
Figure 9 shows a simplified circuit for crosstalk analysis when only power is transferred, corresponding to the first case. Z d t and Z d r are the total impedances of the data-transmitting and data-receiving circuits, respectively. The ratio of the data transmission frequency to the power transmission frequency is defined as  γ , and the expression is:
γ = f d f p
In the case of L d s 2 = L d p 2 and γ 10 , Z d r can be approximated as follows:
Z d r j γ 2 ω L d s 2
To reduce the impact of data transmission on power transmission, the modulus of Z d r is at least one order of magnitude larger than that of Z 31 , namely:
γ 2 ω L d s 2 10 ( 1 ω p C f 3 ω p L 3 ) 2 + ( R 3 + R E ) 2
Equation (25) is one of the conditions that L d s 2 needs to satisfy. At this time, the parallel impedance of Z d r and Z 31 can be approximated as Z 31 , and the expression of Z p p can be derived from:
Z p p = ω p 2 M 1 2 Z 2 + Z 23
In the case of L d s 1 = L d p 1 = L d s 2 = L d p 2 and γ 10 , Z d t can be approximated as follows:
Z d t j γ 2 ω L d s 1
Similar to underwater loop analysis, the modulus of Z d t is at least one order of magnitude larger than that of Z p p , namely:
γ 2 ω L d s 2 10 Z p p
Equation (28) is another constraint that L d s 2 should satisfy. Under the two constraints, when only power is transmitted, the influence of the data transmission channel on power transmission can be ignored.
The following is an analysis of the simultaneous transmission of data and power. To simplify the analysis, the simultaneous transmission of data and power is divided into the superposition of two cases: Case 1: only U d is working; Case 2: only U m d is working. Case 1 is consistent with the above analysis. Case 2 is analyzed below.
Figure 10 depicts a crosstalk analysis circuit when only U m d works, where Z d r is the equivalent impedance of the data receiving circuit, Z 32 is the equivalent impedance of the power receiving circuit, and Z d r and Z 32 are both calculated at f d , which are expressed as:
Z d r = 1 j ω d C d s 2 + j ω d L d s 2 + ω d 2 M 4 2 Z 5 Z 32 = j ω d L 3 γ + γ j ω d C f 3 + R 3 + R L
When the impedances of L d s 2 , L 3 , C f 3 , R L , and R 3 are in an order of magnitude, Z 32 is simplified to:
Z 32 = j γ ω p L s 2
In (30), Z 32 is approximately a pure inductance. Therefore, only when U m d works is the power received by R L very small; the input power at U m d is also relatively small, most of which is absorbed by R i n 1 and R i n 2 . The power received on R o u t and R E is very small. Therefore, when power and data are transmitted at the same time, the interference of data transmission with power transmission can be ignored.

3.2. Power Transmission Interference with Data Transmission

The interference of power transmission with data transmission is divided into two parts: the low-frequency (at f p ) noise received by R o u t and the high-frequency (at f d ) noise received by R o u t . The noise is called low- and high-frequency noise in this paper.
The low-frequency noise is filtered out at the data-receiving loop by a band-pass filter. f d is at least one order of magnitude higher than f p . Therefore, the LC resonance can attenuate the low-frequency noise, and only a small part of the low-frequency noise can flow into R o u t . As shown in Figure 3, a high-performance LC-BPF is added to the demodulation circuit to filter out the low-frequency noise.
Compared with low-frequency noise, high-frequency noise has a more serious impact on data transmission. Most high-frequency noise comes from the harmonics where the power transmission frequency is close to f d . Because the harmonic frequency is close to the data transmission frequency, filtering out the interference signal and restoring the original signal through the filter are difficult. Therefore, a notch filter composed of L 1 and L 3 was designed in this study. By selecting the appropriate values of L 1 and L 3 , the interference of power transmission in data transmission can be minimized.
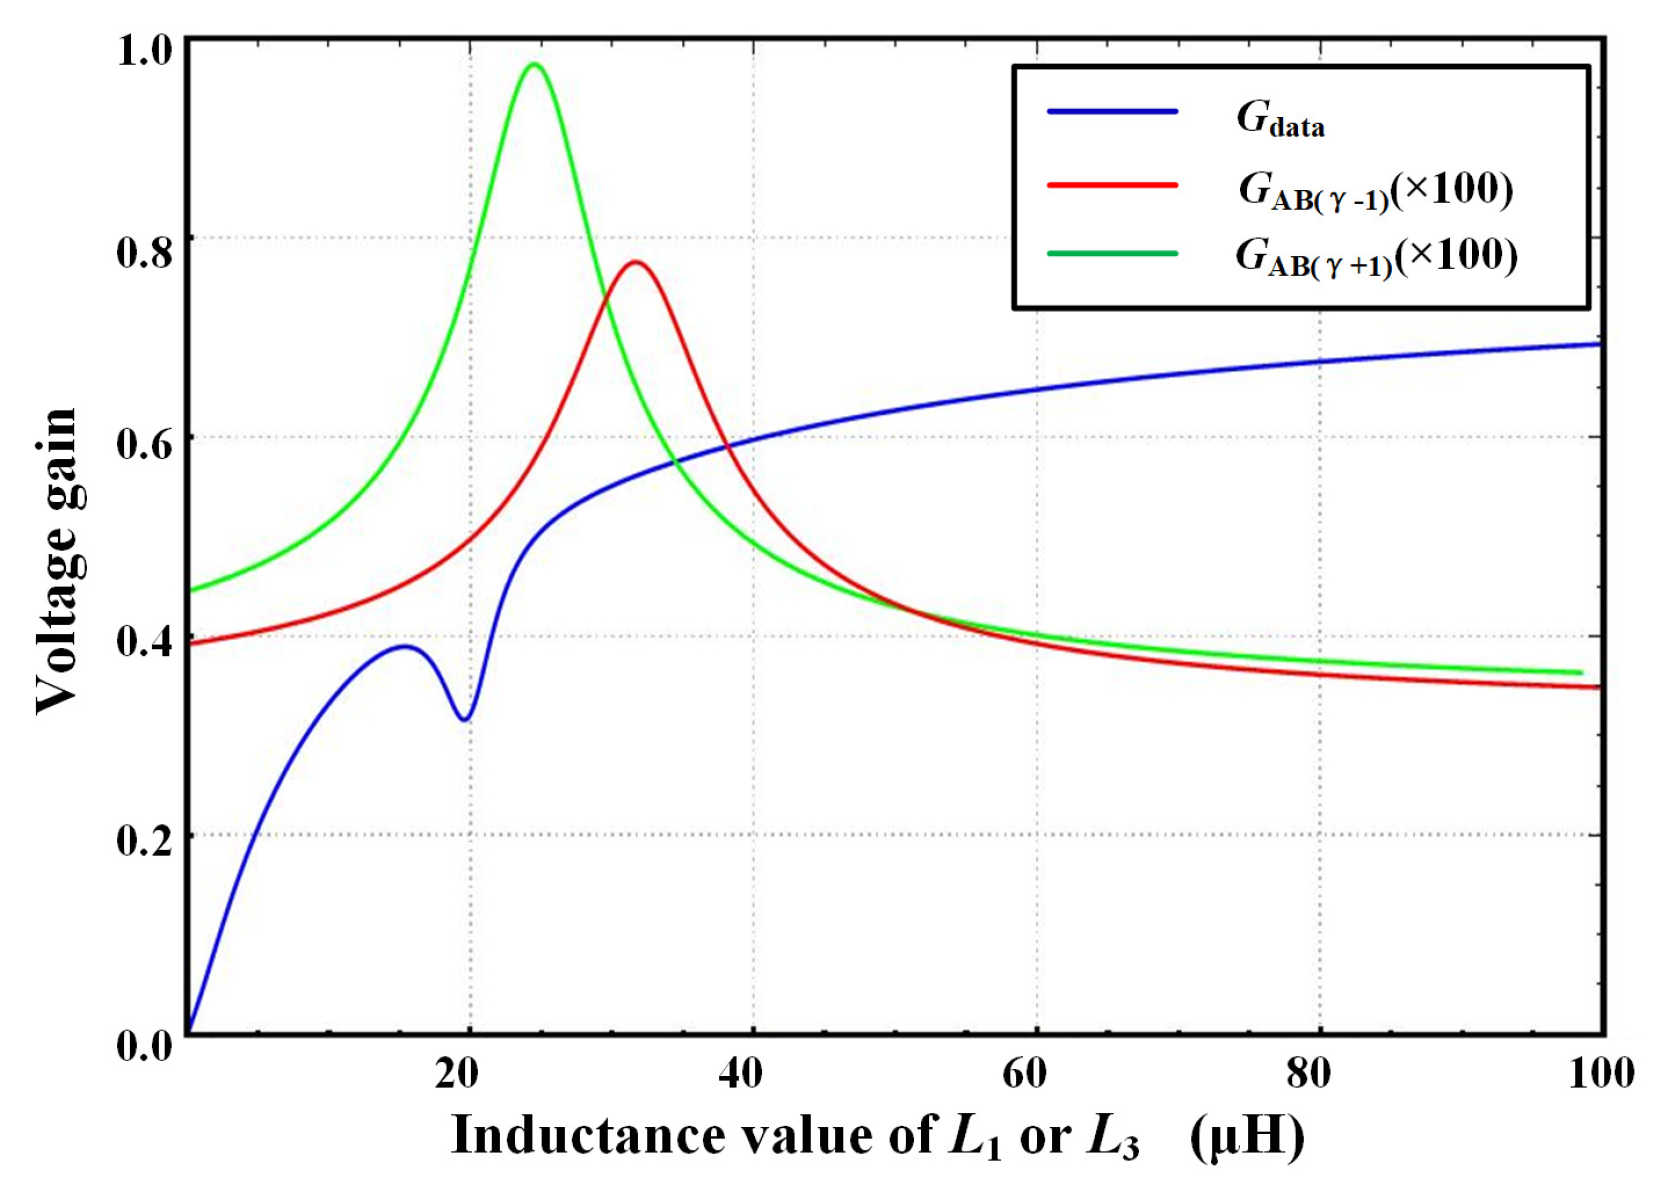
We mainly analyzed the harmonics at f d . Because the harmonics of the square wave are all odd harmonics, the γ ± 1 harmonics were analyzed. The voltage gain G A B ( γ ± 1 ) is defined as:
G A B ( γ ± 1 ) = U R o u t ( γ ± 1 ) U d
U R o u t ( γ ± 1 ) is the voltage received by R o u t when only U d works, that is, the power transmission interference voltage received by the data-receiving end. The variation curve of G A B ( γ ± 1 ) with respect to L 1 ( L 3 ) was obtained with the numerical analysis software of Mathematica. The curve of data transmission gain with L 1 ( L 3 ) was also obtained. Table 1 shows the value of the circuit components of the ICPDT system.
Figure 11 shows the variations in data transmission gain and interference voltage gain with L 1 ( L 3 ). The values of G A B ( γ 1 ) and G A B ( γ + 1 ) are amplified 100-fold. The red and green curves represent G A B ( γ 1 ) and G A B ( γ + 1 ) , respectively. The blue curve represents the data transfer gain. The figure shows that, with the increase in L 1 ( L 3 ), the data transmission gain continues to increase. Considering the coil volume limitation, L 1 ( L 3 ) must meet the power resonance frequency on the basis of ensuring higher data transmission gain. Therefore, 13 μ H was selected as the value of L 1 ( L 3 ), and the data transmission gain at this time is approximately 0.4. Additionally, a signal amplification circuit is added to the data demodulation side, which can ensure the normal demodulation of data.

4. Experimental Verification

4.1. Experimental System Structure

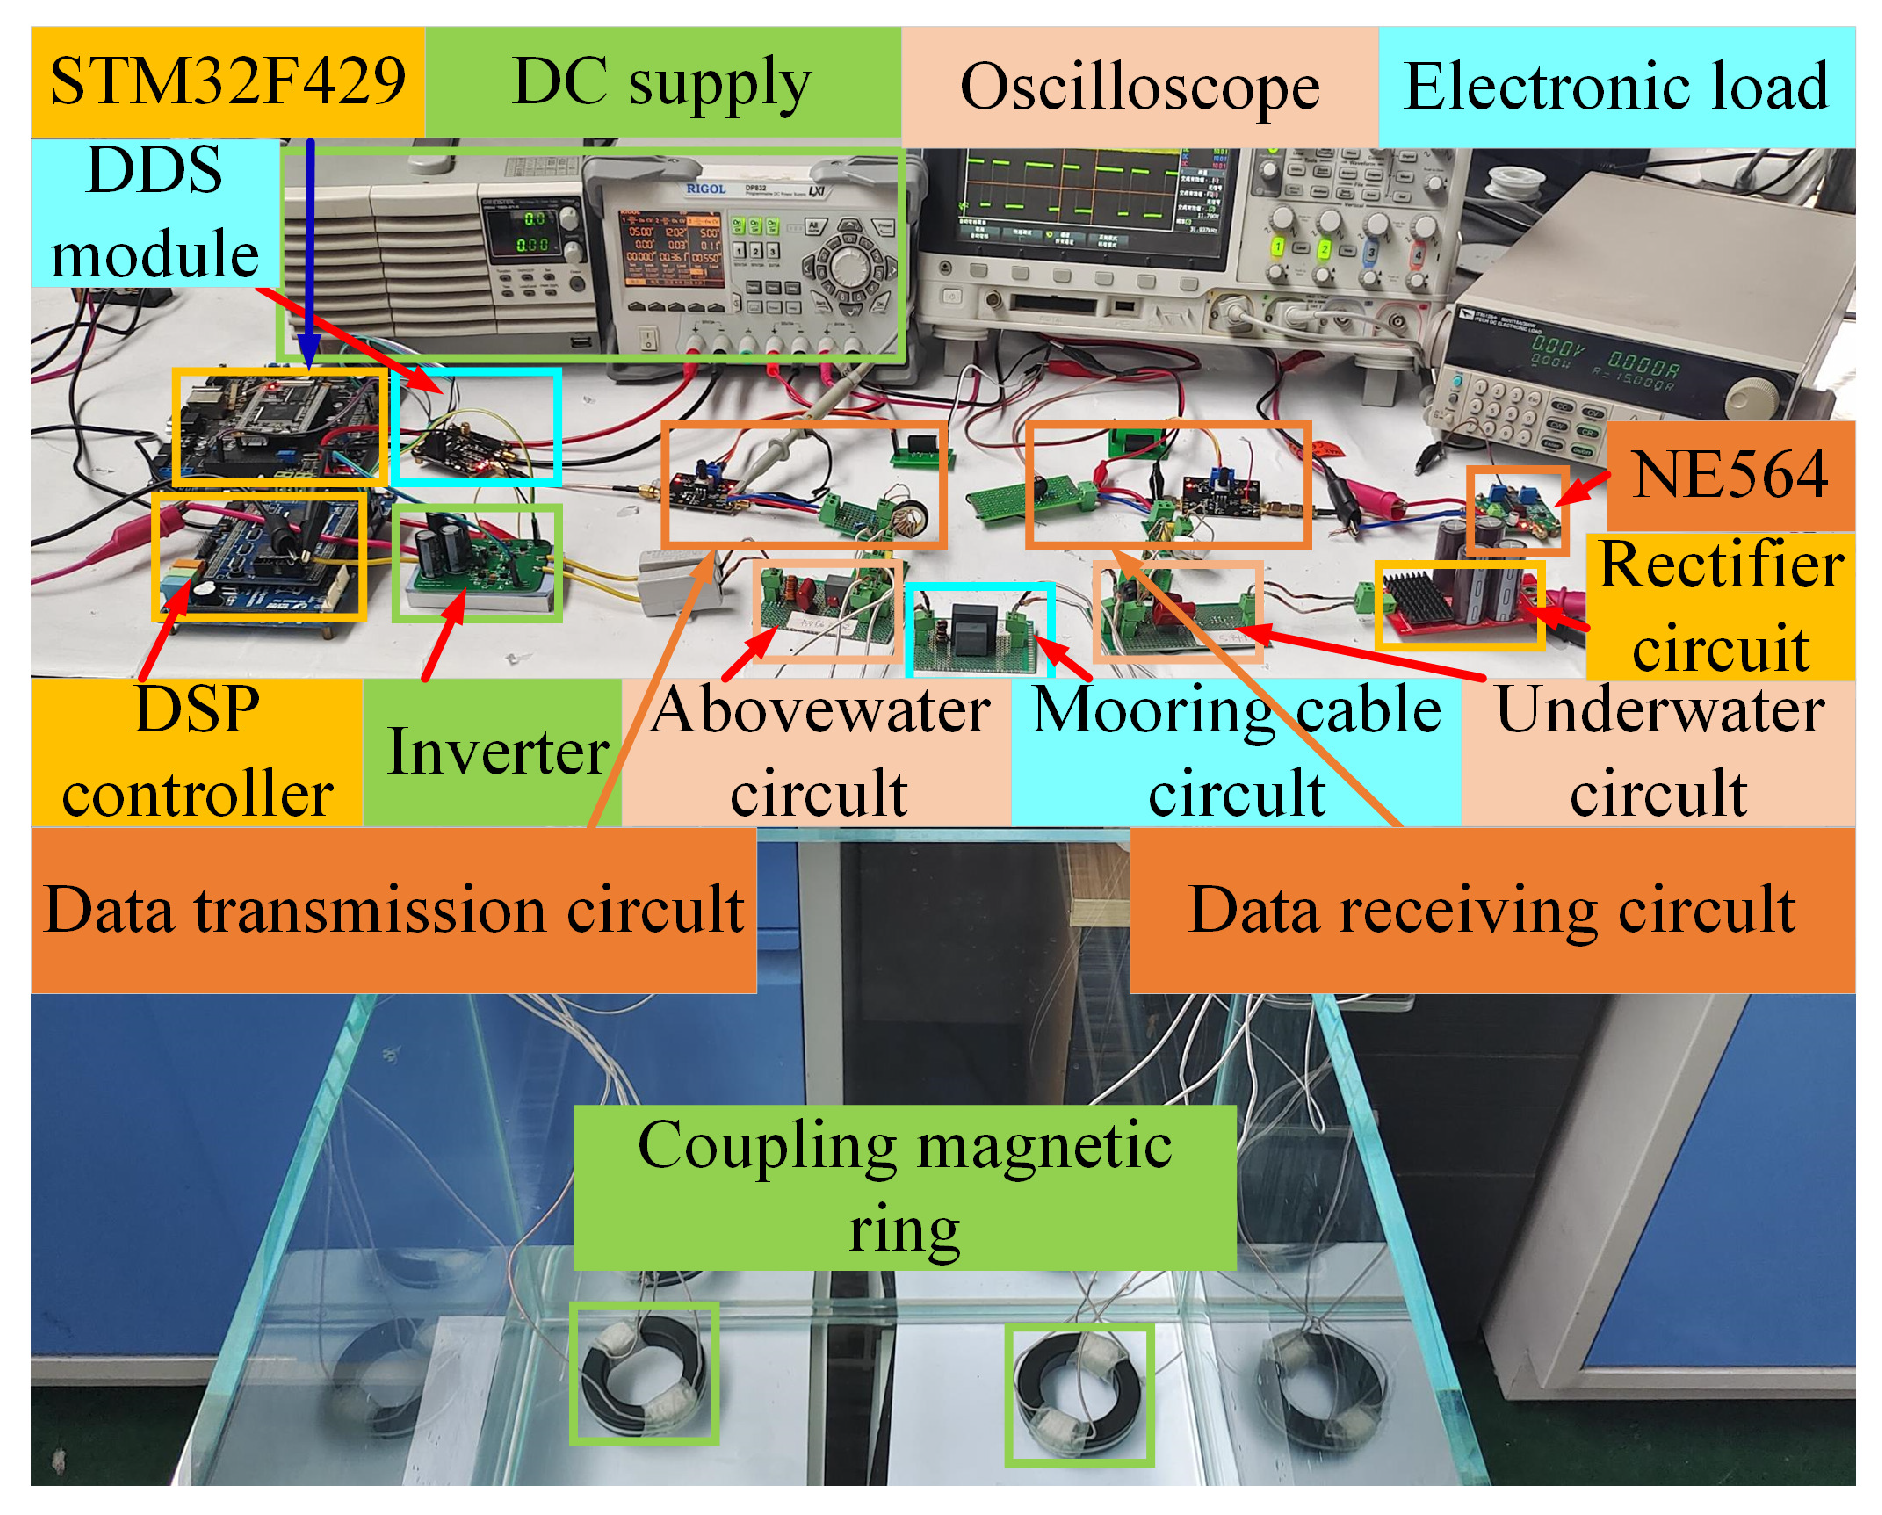
According to the aforementioned schematic diagram of the ICPDT system, an experimental platform was built, as shown in Figure 12. The design parameters are shown in Table 1. The system was mainly composed of a DC voltage source, oscilloscope, electronic load, DSP controller, STM32 microcontroller, inverter circuit, data transmission circuit, above-water circuit, mooring cable circuit, underwater circuit, data-receiving circuit, data demodulation circuit, and rectifier circuit. These parts are marked in Figure 12. The DSP controller was used to generate four complementary output PWM signals. The dual frequency modulation signal was implemented using an STM32 microcontroller. Seawater with salinity of 3.2% in the glass tank was taken from the Yellow Sea, China.
Table 2 shows the parameters of the coupling magnetic ring in air and seawater. This table shows that the parameters of the coupling magnetic ring in air and seawater only slightly varied and could be ignored. To simulate the real marine environment, we also selected the sea water of the Yellow Sea, China for experiment.

4.2. Experiment Results of Power and Data Transmission

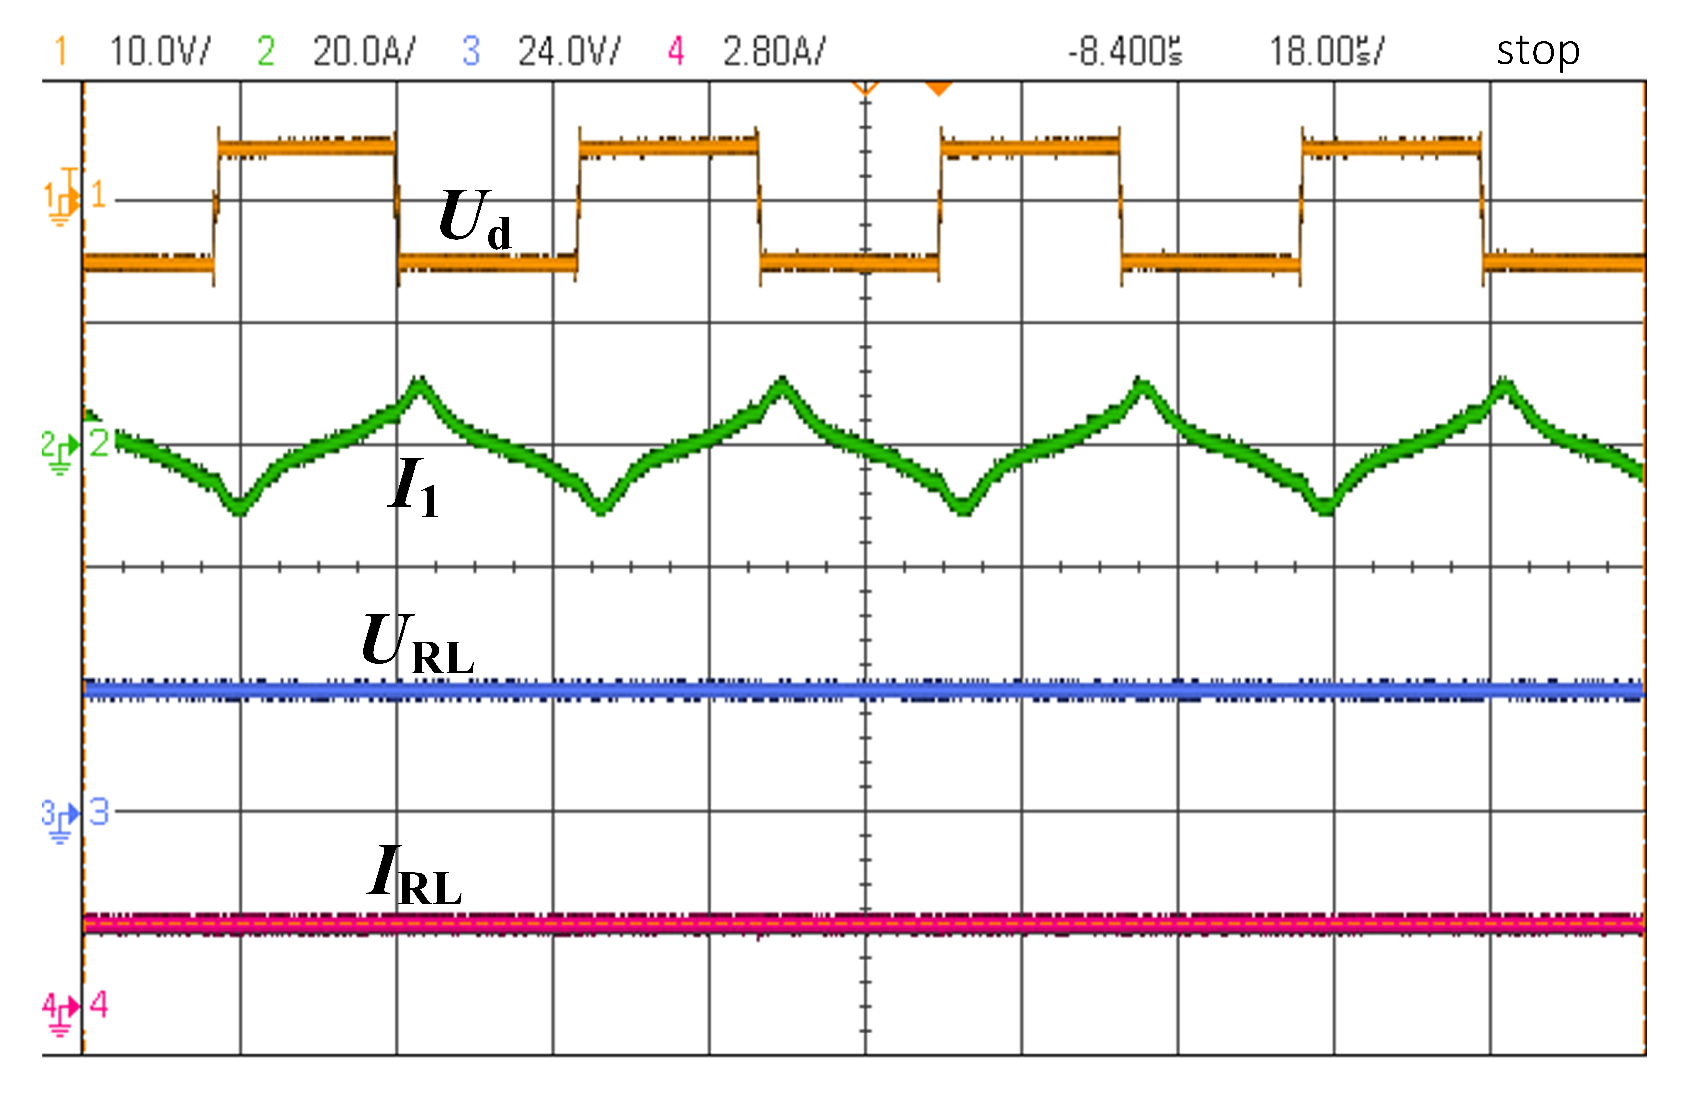
When power and data are transmitted at the same time, the voltage and current of inverter output and load receiving are as shown in Figure 13.
To verify the output power and efficiency of the ICPDT system when the load changes, experimental tests were conducted by changing the load value. The curve of power and efficiency with load shown in Figure 14 was drawn. The experimental results showed that, when the load value was 15 Ω , the input power of the system was 78.7 W, the output power was directly read from the electronic load, and the result was 61.5 W. The system efficiency of the calculation system from DC input to DC output is 78.1%. The measured output efficiency was similar to the designed output efficiency, which verified the reliability of power transmission.
As shown in Figure 14a, with increasing load, the output power increased first and then decreased. When R L = 10   Ω , the system output power reached the maximum value of 61.5 W. When the load changed from 5 Ω to 30 Ω , the output power of the system was always above 40 W, which meets the charging demand of the battery carried by the underwater sensor. Figure 14b shows that, with the constant change in load, the efficiency of the ICPDT system remained above 60%. When R L = 15   Ω , the system efficiency reached the maximum of 78.1%. Because of the existence of the cable loop, the system power transmission from the above-water loop to the underwater loop requires two inductive coupling transmissions. Because the coupling coefficient cannot be one, the efficiency loss of this system is higher than that of the traditional ICPDT system.
Figure 15 shows the data modulation and demodulation signals when only data are transmitted. The binary symbol signal was sent with a period of 11001110. The demodulation conditions were tested when the transmission rate was 50 kb/s, 100 kb/s, 150 kb/s, and 200 kb/s, separately.
The experimental results showed that the demodulated data were the same as the original data. The data demodulation signal generated a certain delay, and no error arose in the demodulated signal due to the delay. The designed ICPDT system could demodulate the data signal with a maximum rate of 200 kb/s when the data channel worked alone.
Figure 16 shows the data modulation and demodulation signal waveforms when power and data were transmitted at the same time. Due to the addition of power transmission, the amplitude of the carrier signal was seriously affected by the power signal. The frequency corresponding to transmission digital signal “1” is 2 MHz, and the carrier frequency of the digital signal “0” is 1.3 MHz. Figure 15a,b shows that the data were well recovered on the demodulator when the data transfer rate was 50 kb/s and 100 kb/s. As shown in Figure 15c,d, when the data transfer rate was further increased to 150 kb/s and 200 kb/s, the demodulated signal produced a serious error code. Therefore, when the power and data are simultaneously transmitted, the data signal can be transmitted at a rate of up to 100 kb/s and normally demodulated.
Figure 16 shows that, compared with data transmission alone, the amplitude of the data carrier considerably changed after the power transmission was added, with a notable fluctuation with the power transmission frequency. Although we implemented measures to reduce the interference of the power with the data transmission in the experiment, completely filtering out one of the mixed waveforms of the power and data was difficult. Some electric energy waveforms are inevitably mixed in the data transmission channel. To enable the normal demodulation of the signal, an operational amplifier with adjustable magnification was added to the front of the demodulation circuit, and the normal demodulation of the signal was realized by adjusting the magnification. The selected 2FSK demodulation chip was an NE564, which has good bandwidth and signal-to-noise ratio, which further reduces the difficulty of signal demodulation.
In the ICPDT system with the same structure, the data transmission rate was compared with that reported in other papers. Table 3 shows that the ICPDT system proposed in this paper has a higher transmission rate and transmission power than those in [28,29,33].
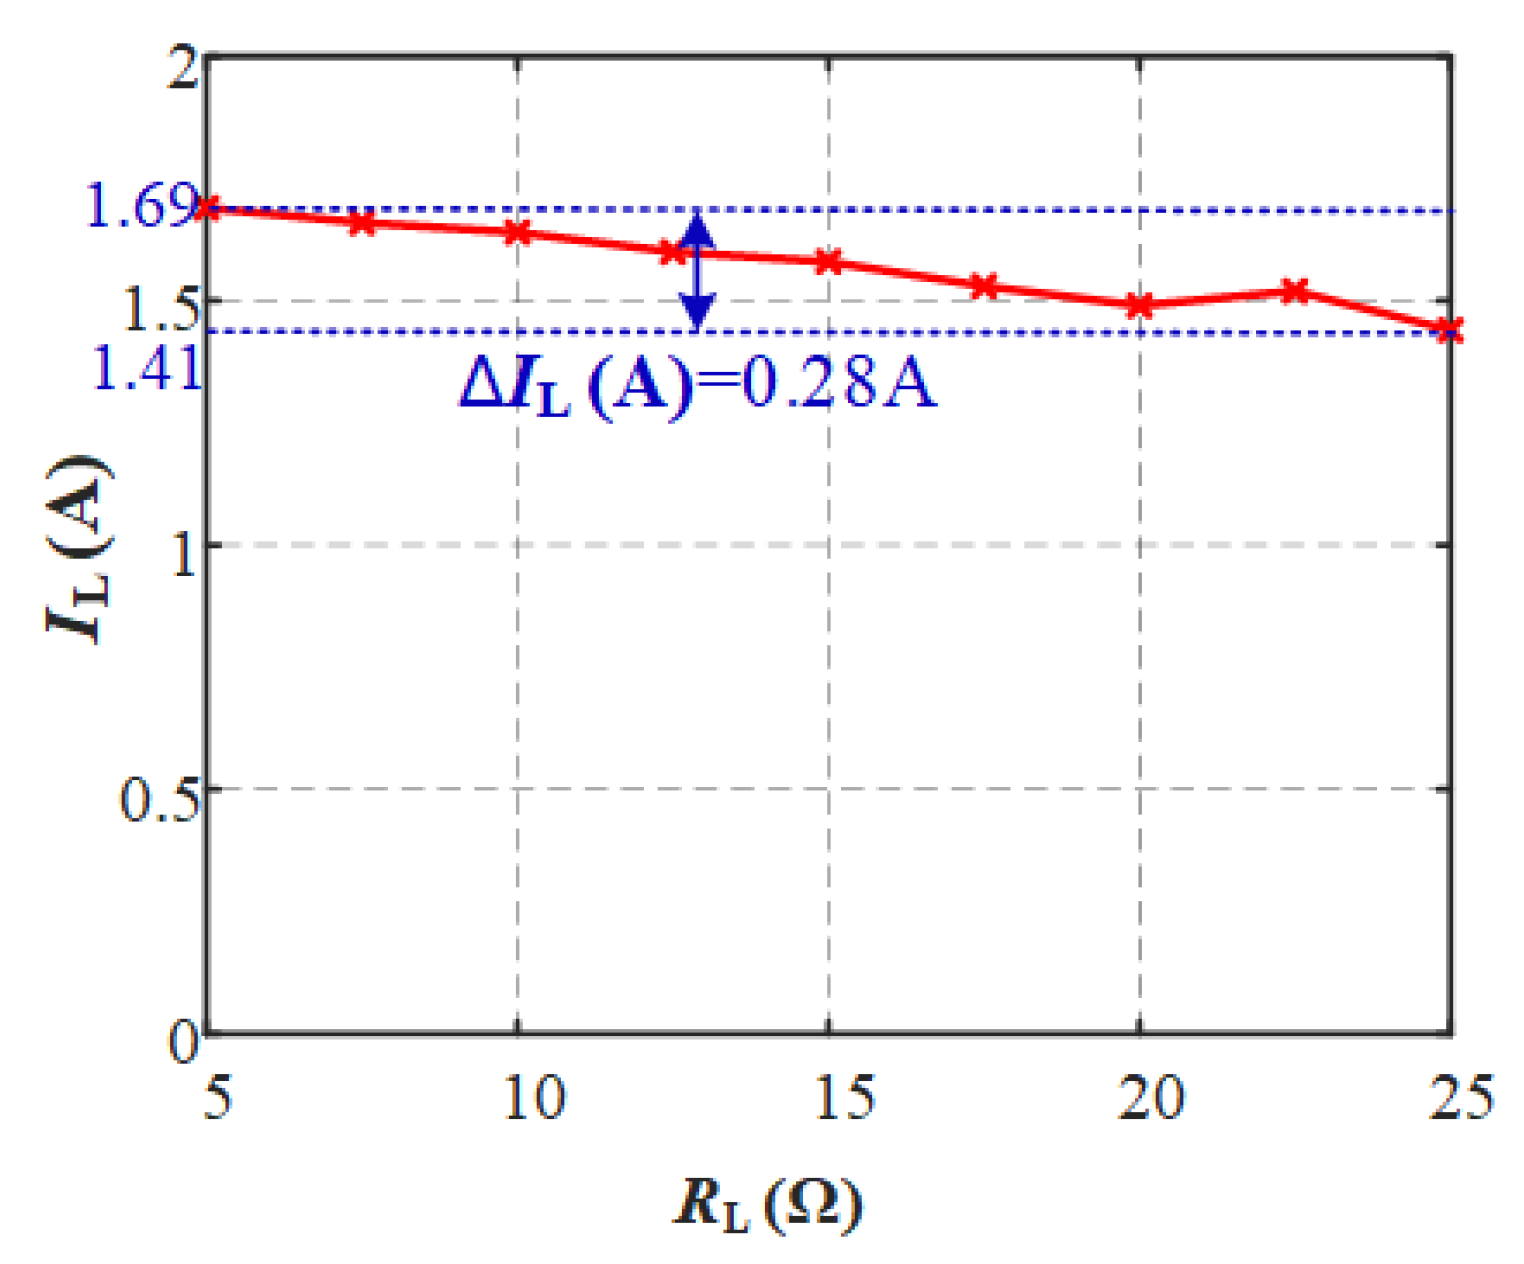
Finally, the current change when the load changes was verified, as shown in Figure 17. By changing the value of load resistance, the current value of the R L receiving terminal was measured. When R L fluctuated in a small range, the current received by the load was basically maintained at approximately 1.5 A; that is, the current was almost stable within a certain range without additional control of the load. This feature can ensure the stability of battery charging and prolong the service life of the battery. Increasing the running time of the sensor carried by a moored buoy is important.

5. Conclusions

This paper proposes an ICPDT system to enable the power and data transmission between a mooring buoy and underwater sensors, and the ICPDT system was analyzed and designed in detail. The crosstalk between power and data was analyzed, and power and data were successfully transmitted. The experimental results showed that the DC-to-DC efficiency was 78.1%. Under load fluctuations, the load receiving current did not considerably change, and the load power could be maintained at a high level. Additionally, the data signal could be normally demodulated when the transmission rate was 100 kb/s. By changing the values of the data gain resistance, the amplification factor of the data transmission loop could be easily adjusted, and the power of the data transmission loop could be limited, thereby improving the efficiency of power transmission. This study provides a reference for the subsequent research on the parallel transmission systems of buoy power and data. On the basis of our findings, we can further explore how to realize the closed-loop control of the whole system.

Author Contributions

Methodology, J.X. and X.L.; Software, S.P.; Writing—original draft, X.C.; Writing—review & editing, X.C., J.X. and S.P.; Project administration, X.L. and H.L.; Funding acquisition, X.L. and H.L. All authors have read and agreed to the published version of the manuscript.

Funding

This study was funded by the Natural Science Foundation of Shandong Province (project No. ZR2022MF336), the State Key Laboratory of Precision Measuring Technology and Instruments (project Nos. pilab1906 and Pilq2305), and the National Natural Science Foundation of China (project No. 62203324).

Institutional Review Board Statement

The study was not involving humans or animals.

Data Availability Statement

Data is unavailable due to privacy.

Acknowledgments

Thank you to Jiayi Xu, Shui Pang, Xingfei Li and Hongyu Li for their guidance in writing and revising this paper.

Conflicts of Interest

The authors declare no conflict of interest.

References

  1. Grosenbaugh, M.A.; Paul, W.; Frye, D.; Farr, N. Development of Synthetic Fiber-Reinforced Electro-Optical-Mechanical Cables for Use with Moored Buoy Observatories. IEEE J. Ocean. Eng. 2006, 31, 574–584. [Google Scholar] [CrossRef]
  2. Barrera, C.; Rueda, M.; Elgue, J.; Llinas, O. Red acomar: Coastal moored buoy network for real-time surveillance, control and observation in canary islands. In Proceedings of the OCEANS 2006, Boston, MA, USA, 18–21 September 2006; pp. 1–5. [Google Scholar]
  3. Xu, J.; Li, X.; Xie, Z.; Fu, C.; Du, R. Design and Analysis of Inductively Coupled Power Transfer System on Mooring Buoy with Double Ultracapacitor Chargers Using Indirect Control. IEEE Trans. Ind. Electron. 2020, 67, 4836–4845. [Google Scholar] [CrossRef]
  4. Xu, J.; Li, X.; Li, H.; Xie, Z.; Ma, Q. Maximum Efficiency Tracking for Multitransmitter Multireceiver Wireless Power Transfer System on the Submerged Buoy. IEEE Trans. Ind. Electron. 2022, 69, 1909–1919. [Google Scholar] [CrossRef]
  5. Hu, Z.; Wang, Y.; Ding, L.; Wu, P. Underwater Wireless Charging and Communication Integrated System. In Proceedings of the OCEANS 2019, Marseille, France, 17–20 June 2019; pp. 1–5. [Google Scholar] [CrossRef]
  6. Ahn, D.; Hong, S. Wireless Power Transmission with Self-Regulated Output Voltage for Biomedical Implant. IEEE Trans. Ind. Electron. 2014, 61, 2225–2235. [Google Scholar] [CrossRef]
  7. Cheng, Z.; Lei, Y.; Song, K.; Zhu, C. Design and Loss Analysis of Loosely Coupled Transformer for an Underwater High-Power Inductive Power Transfer System. IEEE Trans. Magn. 2015, 51, 8401110. [Google Scholar] [CrossRef]
  8. Yan, Z.; Song, B.; Zhang, Y.; Zhang, K.H.; Mao, Z.; Hu, Y. A Rotation-Free Wireless Power Transfer System with Stable Output Power and Efficiency for Autonomous Underwater Vehicles. IEEE Trans. Power Electron. 2019, 34, 4005–4008. [Google Scholar] [CrossRef]
  9. Zhu, Z.; Yang, A.; Yuan, H.; Zhao, C.; Chen, F.; Wang, X.; Rong, M. Efficiency optimization and power allocation of omnidirectional wireless power transfer for multiple receivers. IEEE Trans. Ind. Electron. 2023, 70, 9689–9699. [Google Scholar] [CrossRef]
  10. Yuan, H.; Liang, C.; Zhang, R.; Ruan, Z.; Zhou, Z.; Yang, A.; Wang, X.; Rong, M. A Novel Anti-Offset Interdigital Electrode Capacitive Coupler for Mobile Desktop Charging. IEEE Trans. Power Electron. 2023, 38, 4140–4151. [Google Scholar] [CrossRef]
  11. Pang, S.; Xu, J.; Li, H.; Ma, Q.; Li, X. Dual-Frequency Modulation to Achieve Power Independent Regulation for Dual-Load Underwater Wireless Power Connector. IEEE J. Emerg. Sel. Top. Power Electron. 2023, 11, 2377–2389. [Google Scholar] [CrossRef]
  12. Yan, Z.; Xiang, Z.; Wu, L.; Wang, B. Study of Wireless Power and Information Transmission Technology Based on the Triangular Current Waveform. IEEE Trans. Power Electron. 2018, 33, 1368–1377. [Google Scholar] [CrossRef]
  13. Yoshioka, D.; Sakamoto, H.; Ishihara, Y.; Matsumoto, T.; Timischl, F. Power Feeding and Data-Transmission System Using Magnetic Coupling for an Ocean Observation Mooring Buoy. IEEE Trans. Magn. 2007, 43, 2663–2665. [Google Scholar] [CrossRef]
  14. Liu, J.; Zhang, G.; Yu, H.; Zhang, X. An anchor mooring profile monitoring buoy based on underwater non-contact wireless communication. In Proceedings of the OCEANS’10 IEEE SYDNEY, Sydney, Austrilia, 24–27 May 2010. [Google Scholar] [CrossRef]
  15. Kojiya, T.; Sato, F.; Matsuki, H.; Sato, T. Automatic power supply system to underwater vehicles utilizing non-contacting technology. In Proceedings of the Oceans ’04 MTS/IEEE Techno-Ocean ’04, Kobe, Japan, 9–12 November 2004. [Google Scholar] [CrossRef]
  16. Nakanishi, K.; Sasaki, M. Data transmission system using magnetic resonance wireless power transfer. In Proceedings of the 2017 IEEE Wireless Power Transfer Conference (WPTC), Taiwan, China, 10–12 May 2017. [Google Scholar] [CrossRef]
  17. Zhu, Q.; Wang, L.; Guo, Y.; Liao, C.; Li, F. Applying LCC Compensation Network to Dynamic Wireless EV Charging System. IEEE Trans. Ind. Electron. 2016, 63, 6557–6567. [Google Scholar] [CrossRef]
  18. Sun, Y.; Yan, P.-X.; Wang, Z.-H.; Luan, Y.-Y. The Parallel Transmission of Power and Data with the Shared Channel for an Inductive Power Transfer System. IEEE Trans. Power Electron. 2016, 31, 5495–5502. [Google Scholar] [CrossRef]
  19. Qiu, H.; Sakurai, T.; Takamiya, M. Coupling-Dependent Data Flipping in Wireless Power and Data Transfer System. In Proceedings of the 2019 IEEE International Symposium on Circuits and Systems (ISCAS), Sapporo, Japan, 26–29 May 2019; pp. 1–5. [Google Scholar] [CrossRef]
  20. Son, Y.-H.; Jang, B.-J. Simultaneous data and power transmission in resonant wireless power system. In Proceedings of the 2013 Asia-Pacific Microwave Conference Proceedings (APMC), Seoul, Republic of Korea, 5–8 November 2013; pp. 1003–1005. [Google Scholar] [CrossRef]
  21. Liu, J.-Y.; Tang, K.-T. A novel wireless power and data transmission ac to dc converter for an implantable device. In Proceedings of the 2013 35th Annual International Conference of the IEEE Engineering in Medicine and Biology Society (EMBC), Osaka, Japan, 3–7 July 2013; pp. 1875–1878. [Google Scholar]
  22. Wu, J.; Zhao, C.; Lin, Z.; Du, J.; Hu, Y.; He, X. Wireless Power and Data Transfer via a Common Inductive Link Using Frequency Division Multiplexing. IEEE Trans. Ind. Electron. 2015, 62, 7810–7820. [Google Scholar] [CrossRef]
  23. Wang, Y.; Yao, Y.; Guan, Y.; Liu, X.; Liu, M.; Xu, D. A novel modulation and demodulation method for wireless power and data transmission. In Proceedings of the 2017 IEEE Transportation Electrification Conference and Expo, Asia-Pacific (ITEC Asia-Pacific), Harbin, China, 7–10 August 2017. [Google Scholar] [CrossRef]
  24. Li, S.; Li, W.; Deng, J.; Nguyen, T.D.; Mi, C.C. A Double-Sided LCC Compensation Network and Its Tuning Method for Wireless Power Transfer. IEEE Trans. Veh. Technol. 2015, 64, 2261–2273. [Google Scholar] [CrossRef]
  25. Yao, Y.; Wang, Y.; Liu, X.; Cheng, H.; Liu, M.; Xu, D. Analysis, Design, and Implementation of a Wireless Power and Data Transmission System Using Capacitive Coupling and Double-Sided LCC Compensation Topology. IEEE Trans. Ind. Appl. 2019, 55, 541–551. [Google Scholar] [CrossRef]
  26. Zhigang, H.; Shen, Z.; Jian, C.; Chunjie, Q. A research on the non-coherent demodulation method of the underwater 2FSK signal. In Proceedings of the IEEE 2011 10th International Conference on Electronic Measurement & Instruments, Chengdu, China, 16–19 August 2011; Volume 3, pp. 185–188. [Google Scholar]
  27. Ishii, M.; Yamanaka, K.; Sasaki, M. Multiple FSK Data and Power Transmission System using Magnetic Resonance Wireless Power Transfer. In Proceedings of the 2019 IEEE Wireless Power Transfer Conference (WPTC), London, UK, 18–21 June 2019; pp. 208–211. [Google Scholar] [CrossRef]
  28. Fu, C. Research on Inductively Coupled Power and Data Transmission Based Anchored Buoy; Tianjin University: Tianjin, China, 2019; pp. 1–72. [Google Scholar]
  29. Lang, Z.; Li, X.; Xu, J.; Xie, Z.; Li, H. An Inductively Coupled Power and Data Transfer System Based on Three-Coil Coupled Structure Used for Mooring Buoy; Tianjin University: Tianjin, China, 2022; pp. 7–15. [Google Scholar]
  30. Barmada, S.; Dionigi, M.; Tucci, M.; Mezzanotte, P. Design and experimental characterization of a combined WPT-PLC system. Wirel. Power Transf. 2017, 4, 160–170. [Google Scholar] [CrossRef]
  31. Barmada, S.; Dghais, W.; Fontana, N.; Raugi, M.; Tucci, M. Design and realization of a multiple access wireless power transfer system for optimal power line communication data transfer. Energies 2019, 12, 988. [Google Scholar] [CrossRef]
  32. Hatanaka, K.; Sato, F.; Matsuki, H.; Kikuchi, S.; Murakami, J.; Kawase, M.; Satoh, T. Power transmission of a desk with a cord-free power supply. IEEE Trans. Magn. 2002, 38, 3329–3331. [Google Scholar] [CrossRef]
  33. Yang, L.; Huang, J.; Feng, B.; Zhang, F.; Zhang, Y. Undersea Wireless Power and Data Transfer System with Shared Channel Powered by Marine Renewable Energy System. IEEE J. Emerg. Sel. Top. Circuits Syst. 2022, 12, 242–250. [Google Scholar] [CrossRef]
Figure 1. Structure diagram of mooring buoy system.
Energies 16 04417 g001
Figure 2. Equivalent circuit diagram of ICPDT.
Energies 16 04417 g002
Figure 3. Schematic diagram of data demodulation circuit.
Energies 16 04417 g003
Figure 4. Analytical circuit of power transfer.
Energies 16 04417 g004
Figure 5. Amplitude–frequency response diagram of power transmission.
Energies 16 04417 g005
Figure 6. Curve of (a) system output power and (b) system efficiency with load changes.
Energies 16 04417 g006
Figure 7. ICPDT system circuit model.
Energies 16 04417 g007
Figure 8. Amplitude−frequency response diagram of data transmission.
Energies 16 04417 g008
Figure 9. Crosstalk analysis circuit when only power is transmitted.
Energies 16 04417 g009
Figure 10. Crosstalk analysis circuit when only Umd works.
Energies 16 04417 g010
Figure 11. Variation curve of data-receiving terminal voltage gain with L 1 ( L 3 ).
Energies 16 04417 g011
Figure 12. Experiment setup.
Energies 16 04417 g012
Figure 13. Voltage and current of inverter output and load receiving.
Energies 16 04417 g013
Figure 14. The curves of (a) system output power and (b) system efficiency with load changes.
Energies 16 04417 g014
Figure 15. Modulation and demodulation signals when only data are transmitted at a rate of (a) 50 kb/s, (b) 100 kb/s, (c) 150 kb/s, and (d) 200 kb/s.
Energies 16 04417 g015
Figure 16. Modulated signal and demodulated signal when power and data are transmitted at the same time. (a) Data transmission rate is 50 kb/s. (b) Data transmission rate is 100 kb/s. (c) Data transmission rate is 150 kb/s. (d) Data transmission rate is 200 kb/s.
Energies 16 04417 g016
Figure 17. Current change when load changes.
Energies 16 04417 g017
Table 1. Main parameters used in Mathematica and prototype.
SymbolSimulation ValueExperimental ValueSymbolSimulation ValueExperimental Value
U d 24 V24 V L 2 10 μ H10.2 μ H
U m d 5 V5 V L p 2 115 μ H115.3 μ H
f p 24 kHz24 kHz L s 2 115 μ H114.8 μ H
f d 1.3/2 MHz1.3/2 MHz C f 3 356 nF356.0 nF
R 1 , R 2 , R 3 0.2 Ω 0.24 Ω k 1 k 2 0.90.9
L f 1 133 μ H133.1 μ H R E 15 Ω 15 Ω
C f 1 330 nF330.5 nF C d s 1 C d s 2 2.5 nF2.5 nF
C 1 170 nF170.2 nF L d s 1 L d s 2 L d p 1 L d p 2 4.4 μ H4.4 μ H
L 1 L 3 1∼100 μ H13 μ H k 3 k 4 0.950.95
L p 1 114 μ H114.5 μ H R i n 1 R i n 2 200 Ω 200 Ω
L s 1 115 μ H115.6 μ H C t 2 2.5 nF2.5 nF
C 2 183 nF183.9 nF R o u t 200 Ω 200 Ω
Table 2. Value of coupling magnetic ring in air and seawater.
SymbolValue in AirValue in Seawater
L p 1 114.8 μ H114.5 μ H
L s 1 115.1 μ H115.6 μ H
M 1 109.2 μ H109.3 μ H
L p 2 114.7 μ H115.3 μ H
L s 2 115.3 μ H114.8 μ H
M 2 109.3 μ H109.3 μ H
Table 3. Comparison of proposed method with previously reported methods.
ReferenceElectric Energy Transmission PowerElectric Energy Transmission EfficiencyData Transmission Rate
[28]27.6 W67.8%10 kb/s
[29]50 W64.1%30 kb/s
[33]≤10 W60.0%20 kb/s
This work61.5 W78.1%100 kb/s
Disclaimer/Publisher’s Note: The statements, opinions and data contained in all publications are solely those of the individual author(s) and contributor(s) and not of MDPI and/or the editor(s). MDPI and/or the editor(s) disclaim responsibility for any injury to people or property resulting from any ideas, methods, instructions or products referred to in the content.