1. Introduction
In light of the recent energy crisis, in the midst of the energy transition towards carbon-free power systems, the advantages of renewable energy sources (RESs), such as photovoltaic (PV) generators, the growth of which has been exponential over the last twenty years [
1], position them in the center of related policies. However, they suffer from variability and stochasticity of output power, which is their main drawback [
2] and a challenge in terms of attracting the interest of the research community. A promising approach towards a more flexible use of PV sources is their combination with battery energy storage systems (BESSs) to fully exploit the potential of PV units integrated into distribution networks (DNs) [
3,
4].
In the last few years, a number of authors have addressed the issues of optimal power dispatch in DNs with integrated BESSs. These studies have been focused on several main aspects, such asmodeling BESSs; defining the BESS function in DNs, i.e., objective functions of the optimization problem; defining control variables, dependent variables, and technical constraints; and the choice of solution methods.
A BESS is a combination of a voltage source converter and a battery pack such that the active and reactive power can be controlled independently [
5,
6,
7,
8,
9,
10]. In most research articles, BESSs are modeled as a set of equations defining that the stored energy at any given time segment is a function of the stored energy the and charge/discharge power at the previous time segment. Internal losses of BESSs are accounted for through the charge/discharge efficiency coefficients or functions. The limits of the reactive power output to be provided by a BESS are also defined in these models.
Depending on the function that a BESS performs in the DN, the objectives for the optimal power dispatch can be summarized in three groups: technical objectives, financial objectives, and multi-objectives. Financial objectives can be related to the maximization of revenues of an RES-BESS based on hybrid power plant [
11]; the reduction in the energy cost from the source grid [
12,
13]; or the minimization of distributed generator dispatch costs [
14], power generation costs, and load-shedding costs [
6]. Technical objectives are the base objectives and include static voltage stability improvement [
7], transient voltage stability enhancement [
9], energy loss minimization [
10], voltage fluctuation mitigation [
15], minimization of the voltage deviations at load buses [
16], and reduction in power imbalances [
17]. Researchers often adopt multi-objective functions with different combinations of financial and technical objectives, such as the simultaneous maximization of the total yield from an RES and minimization of the total costs of the energy loss in DNs [
5] or the simultaneous minimization of power exchange cost between a DN and the transmission network and the penalty cost of the voltage deviation in the DN [
8].
In its most general mathematical formulation, the optimal power dispatch in DNs with integrated RES and BESS is a non-linear, non-convex, large-scale, dynamic optimization problem with constraints. There are two approaches to solving it, namely classical optimization methods and metaheuristic methods.
Non-linear optimization models are implemented in the GAMS environment and solved using CONOPT3 solver [
5], CPLEX solver [
6], and KNITRO solver [
12]. The big
M method was used in [
8] to transform the model into a mixed-integer linear programming problem and solved using commercial software. The interior-point solver
fmincon in MATLAB R2021a [
10] and the simplex solver through the
docplex Python library [
11] are also suggested for optimal power flow in DNs with a BESS, whereas Giuntoli et al. [
14] used the CaADdi framework to interface with the IPOPT solver for non-linear programming. In recent research, some population-based methods, such as PSO, have been proposed to find the optimal power dispatch solution in DNs with BESSs [
7,
16].
The focus of this paper, which is a continuation of the research started in [
13], is the problem of optimal power dispatch in unbalanced DNs with single-phase PV generation and BESSs. The main contributions of this study are as follows:
A dynamic model of the optimal active power dispatch (OAPD) in unbalanced DNs with single-phase PV and BESSs is proposed to minimize energy costs from the source network;
The optimal reactive power dispatch (ORPD) in unbalanced DNs with single-phase PV and BESSs is considered. The objective functions consist of minimizing energy losses and voltage unbalance at three-phase load buses with the reactive powers of solar PV inverters and BESSs as control variables;
A scenario-based approach encompassing the MSC method and the simultaneous backward reduction technique is proposed for modeling the uncertainty of PV generation and load in DNs;
A novel hybrid PSOS-CGSA algorithm is proposed and applied to solve optimal active–reactive power dispatch problems;
A modified IEEE 13-bus feeder for evaluating the solvability and applicability of the proposed approach is proposed and defined.
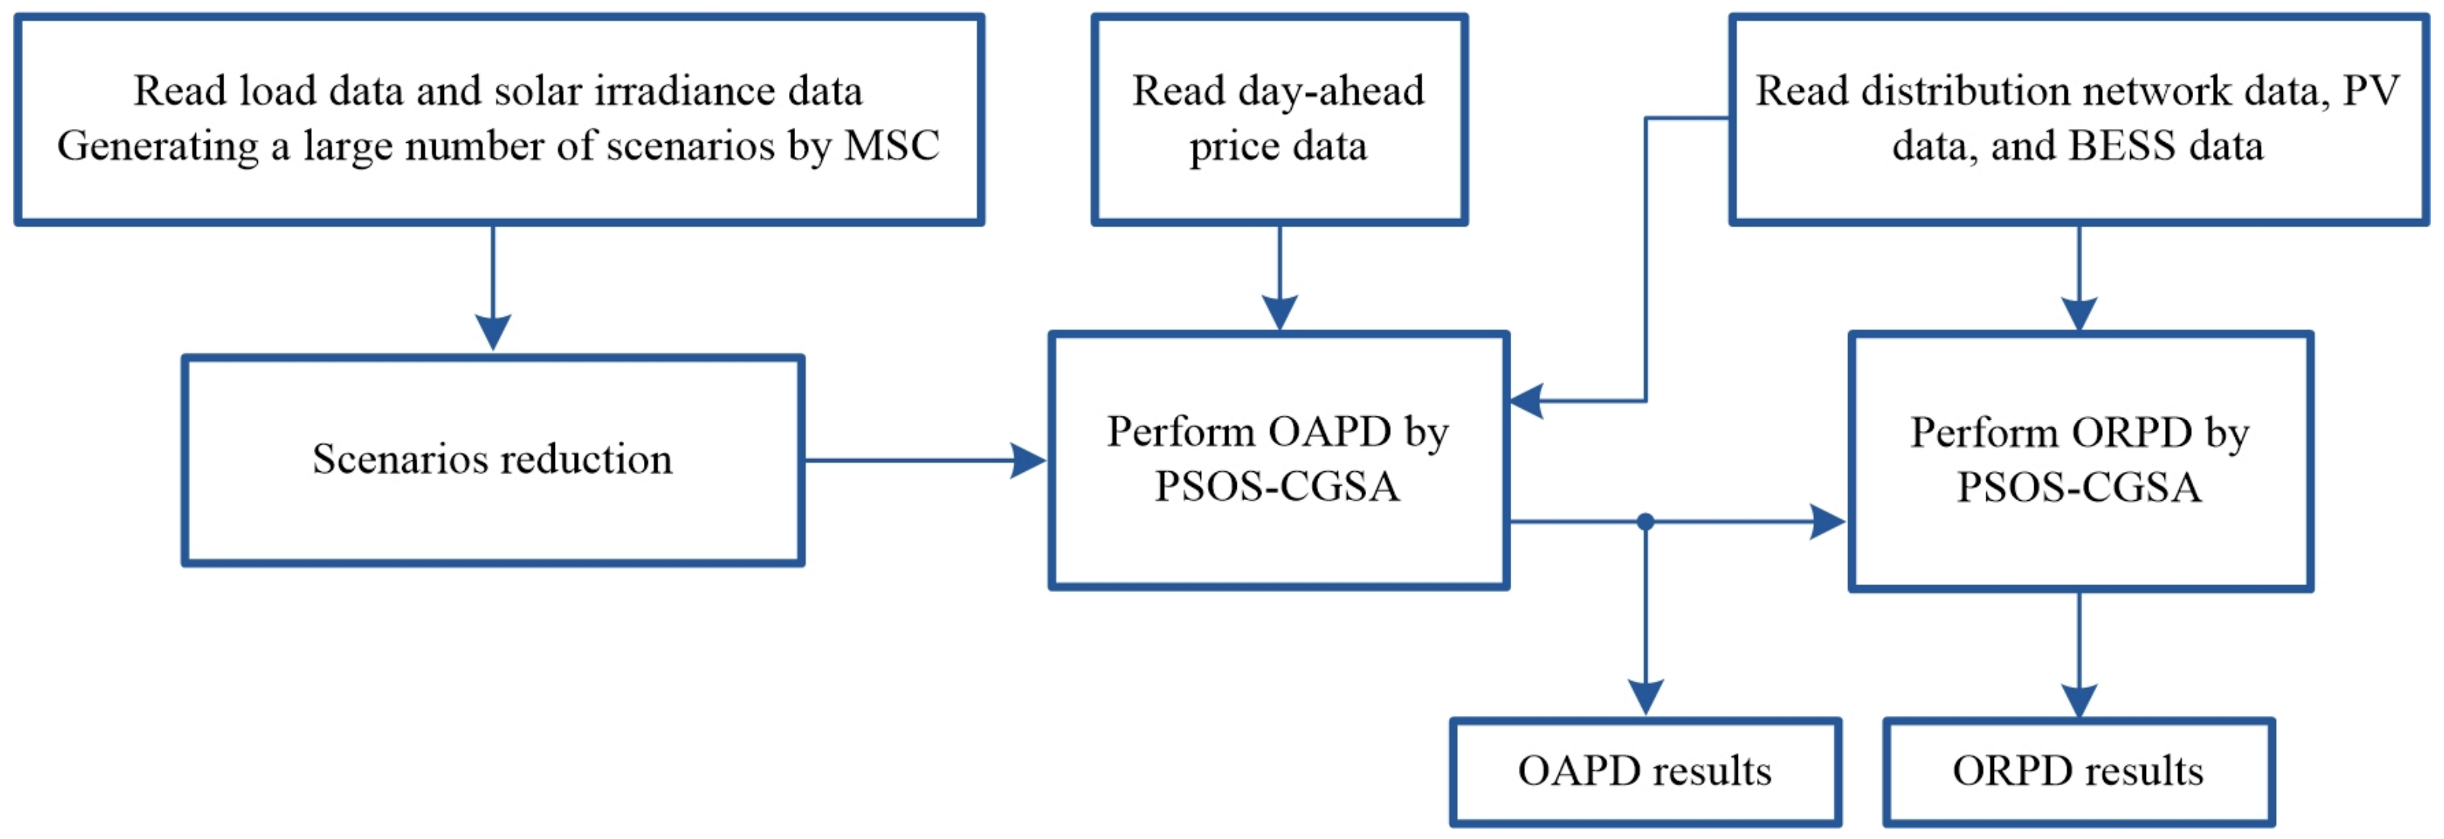
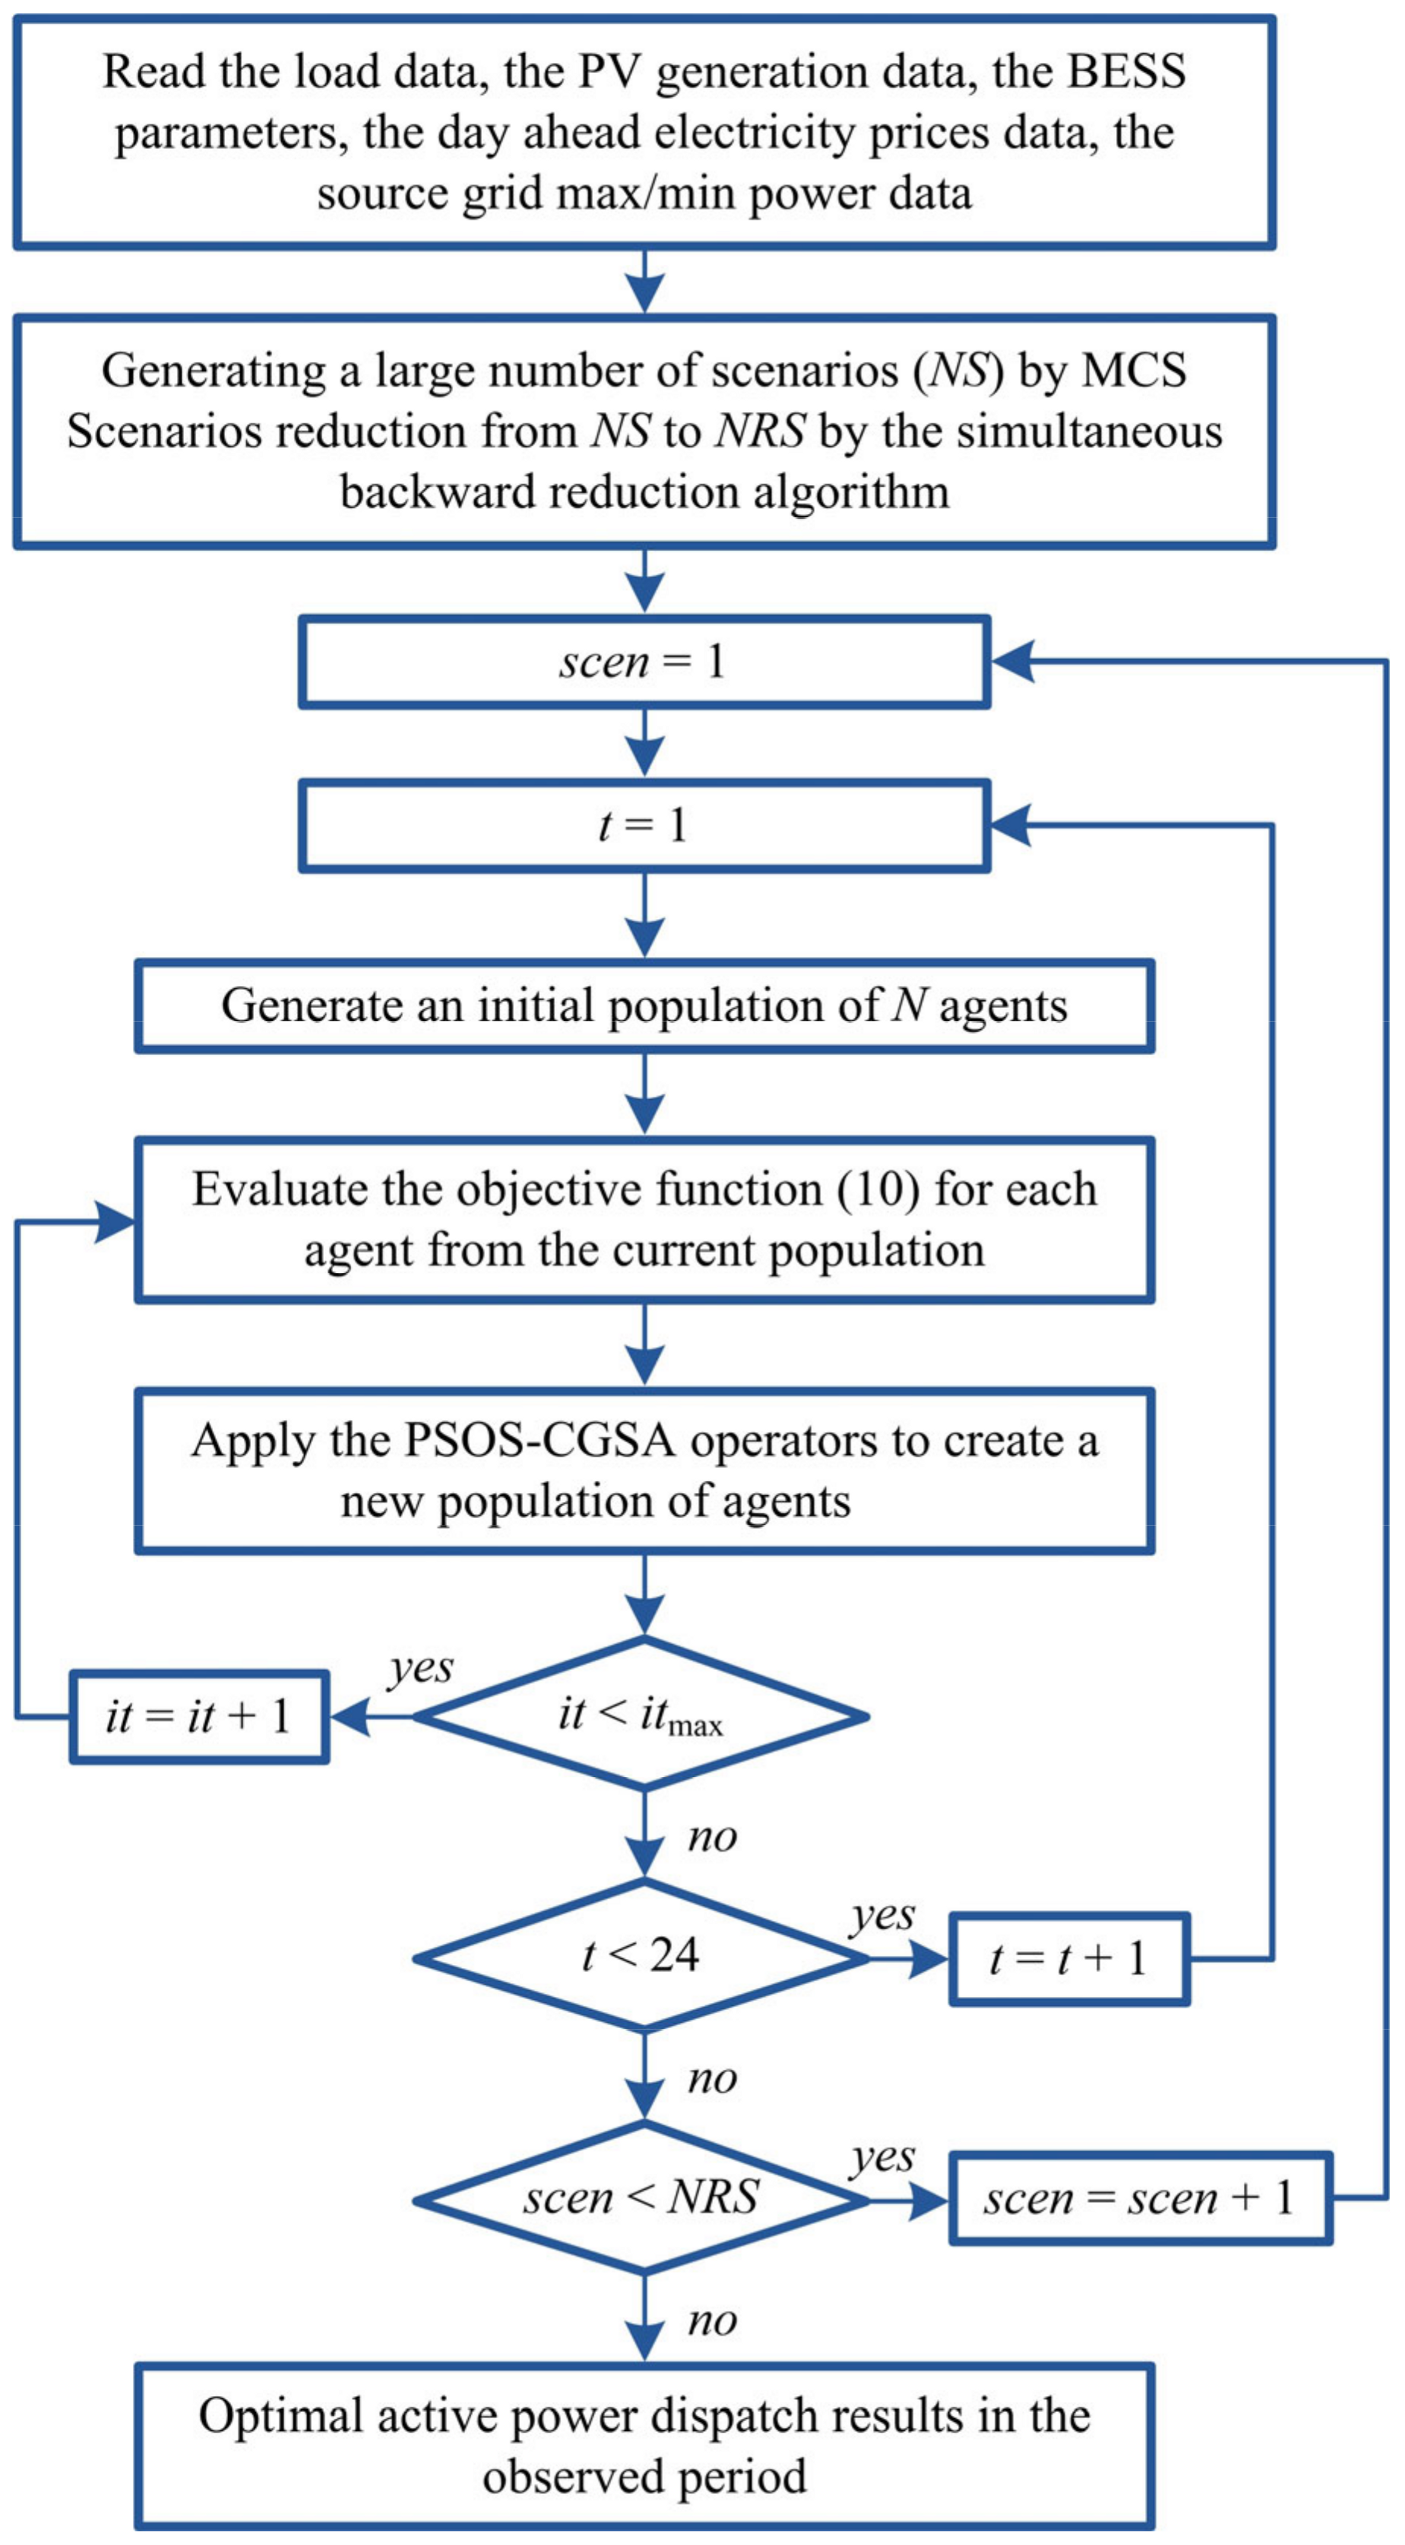
The proposed methodology is presented in a structured way through the flowchart in
Figure 1.
The rest of this paper is organized as follows. In
Section 2, a scenario-based model is formulated for the optimal dispatching of active power in DNs by operating mode control of BESSs. The problem of optimal reactive power dispatch in unbalanced DNs with single-phase PV and BESS inverters is elaborated in
Section 3. The solution method based on the hybrid PSOS-CGSA metaheuristic algorithm is briefly presented in
Section 4. The simulation results are discussed in
Section 5, whereas the main conclusions are listed in
Section 6.
2. Active Power Dispatch by BESS
The battery operation mode is determined by two basic parameters: charge/discharge power (
Pbat) and state of charge (
SoC). Since the battery capacity is limited, the
SoC of the battery must be viewed as a dynamic quantity, as follows [
11]:
where
is the total capacity of the battery;
and
are the charging and discharging power of the battery, respectively;
and
are the charging and discharging efficiency, respectively; Δ
t is the time segment (for example, 1 h); and
ϕ denotes the phase, where
ϕ(
a,
b,
c).
Battery power and
SoC must always be within defined limits, as follows:
where
and
are the maximum charging and discharging powers of the battery, respectively;
and
are the predefined minimum and maximum charge levels, respectively; and
T is a time horizon, e.g., 24 h.
Battery charge/discharge power (
) and
SoC are mutually dependent variables. Taking into account the variability of the electricity price, their relationship can be expressed as follows [
13]:
where
is the day-ahead electricity price from the source grid at time
t,
is the average electricity price during the day, and
aϕ(
t) is a coefficient within the range [0–1].
The coefficient
aϕ(
t), which defines the power of the BESS, can be determined in different ways. In [
13], the coefficient
aϕ(
t) was calculated based on the relation of the electricity price at the time
t with the mean electricity price during the day. A similar approach was adopted in [
18], where the coefficient
aϕ(
t) was calculated as a function of the difference in the electricity price from the predefined lower price limit for discharging and the upper price limit for charging. However, the charging/discharging powers of the BESS determined in this way do not guarantee the optimal dispatch of the active power according to the adopted objective function. Therefore, in this paper, the coefficient
aϕ(
t) is considered as a control variable, the value of which is optimized to ensure the minimization of a given objective function.
The basic equation of the active power dispatch problem is the power balance constraint (9), which must be satisfied at each time segment (
t):
where
Pg,ϕ(
t) is the active power from/to the source grid at time
t in phase
ϕ,
PL,ϕ(
t) is the total active power of the load at time
t in phase
ϕ,
PPV,ϕ(
t) is the total active power generation of PV units at time
t in phase
ϕ, and
Pbat,ϕ(
t) is the active power of the battery at time
t in phase
ϕ, where
ϕ(
a,
b,
c).
2.1. Objective Function for OAPD
By controlling the operating mode of the battery, i.e., the charging/discharging power and SoC, the active power flows in the distribution network can be significantly influenced. In this way, the exchange power with the source power grid is directly affected, as well as other parameters of the distribution networks, such as power losses, voltage profile, etc. The operating costs of the distribution network mostly depend on the value of the energy from/to the source grid. Considering various PV generation and load demand scenarios with their probabilities, the objective function for OAPD can be formulated as the minimization of the expected cost for electricity, as follows:
where
ξ and Ξ are the current scenario and the total number of scenarios, respectively;
p(
ξ) is the probability of scenario
ξ;
and
are the total cost for electricity from the source grid and operating cost of the battery in scenario
ξ, respectively;
cg and
are the electricity price from the source grid and the unit operating cost of the battery, respectively; and
T is the considered period (i.e., 24 h).
Two assumptions should be kept in mind here, namely:
The retail electricity prices have the same daily profile as the wholesale electricity prices and fluctuate hourly;
The DN transacts the wholesale markets through some energy agent such as an aggregator.
The power output of a PV source is determined by the solar irradiation at a given moment, and its value cannot be influenced. Therefore, the cost of PV generation is not taken into account in the objective function (10) because it cannot be optimized by controlling the charge/discharge power of the battery.
For stable operation, constraints (3)–(7) and (9) must be satisfied. The output power of the PV generator is limited by the maximum output power, i.e., the nominal power. Additionally, Pg,ϕ(t) must be restricted by minimum and maximum values.
2.2. Modeling of Uncertainties
2.2.1. PV Generation Modeling
The power of the PV source as a function of solar irradiance can be expressed as follows [
16]:
where
Ppvn is the nominal power of the PV source,
S is the solar irradiance on the PV module surface,
Sstc is the solar irradiance under standard test conditions, and
Rc is a certain irradiance point.
To model the stochastic nature of the solar irradiance, it is most convenient to use the Beta probability density function (PDF):
where
fb(
S) is the Beta function of the solar irradiance (
S),
α and
β are the shape parameters of the Beta distribution, and Γ is the Gamma function.
Based on the data of the long-term measurement of the solar irradiance in a given area, characteristic daily diagrams of the solar radiation can be estimated with statistical indicators, i.e., mean value (
µS) and standard deviation of the solar irradiance (
σS) in a given time interval
t (e.g., an hour). Using the mean value and standard deviation of the solar irradiance, the shape parameters of the Beta PDF can be calculated for a time interval (
t) as follows:
2.2.2. Load Modeling
The normal (Gaussian) probability function is most commonly used to model load uncertainty in distribution systems. Generally, the load level is assumed to be a random variable (
L) following the same PDF within each hour of a given daily load diagram [
2].
where
μL and
σL are the mean value and standard deviation of
L, respectively;
r is a random number in the range of [0, 1]; and erf(·) and erf
−1(·) are the error function and the inverse error function, respectively.
2.2.3. Scenario Generation
The Monte Carlo simulation (MCS) method is suitable for modeling the uncertainties of solar irradiance and load level. Starting from probability density functions for solar irradiance and load, the parameters of which are determined based on historical data, e.g., previous years, the MSC method can generate a large number of scenarios for day-ahead profiles of solar irradiance and load levels. Although a larger number of scenarios (e.g., several thousand) provides a more faithful modeling of the uncertainty of the output power of the PV source and the load level, on the other hand, it means a higher computation burden. In distribution network operation control applications, such as optimal power flow, methods with high accuracy and low computational burden are needed.
As a compromise between a good approximation (modeling) of the uncertainty of stochastic input variables (solar irradiance and load) on the one hand and a significant reduction in calculation time on the other hand, a scenario reduction strategy aggregating similar scenarios can be applied. In doing so, it must be ensured that the metric of the probability distribution of the reduced set is close enough to the original set of scenarios. There are several algorithms for reducing the number of scenarios, such as k-means clustering, backward reduction, and fast forward selection. In this work, the simultaneous backward reduction algorithm [
19,
20,
21] was employed to reduce a ternary scenario tree for the daily PV generations and load profiles.
5. Simulation Results
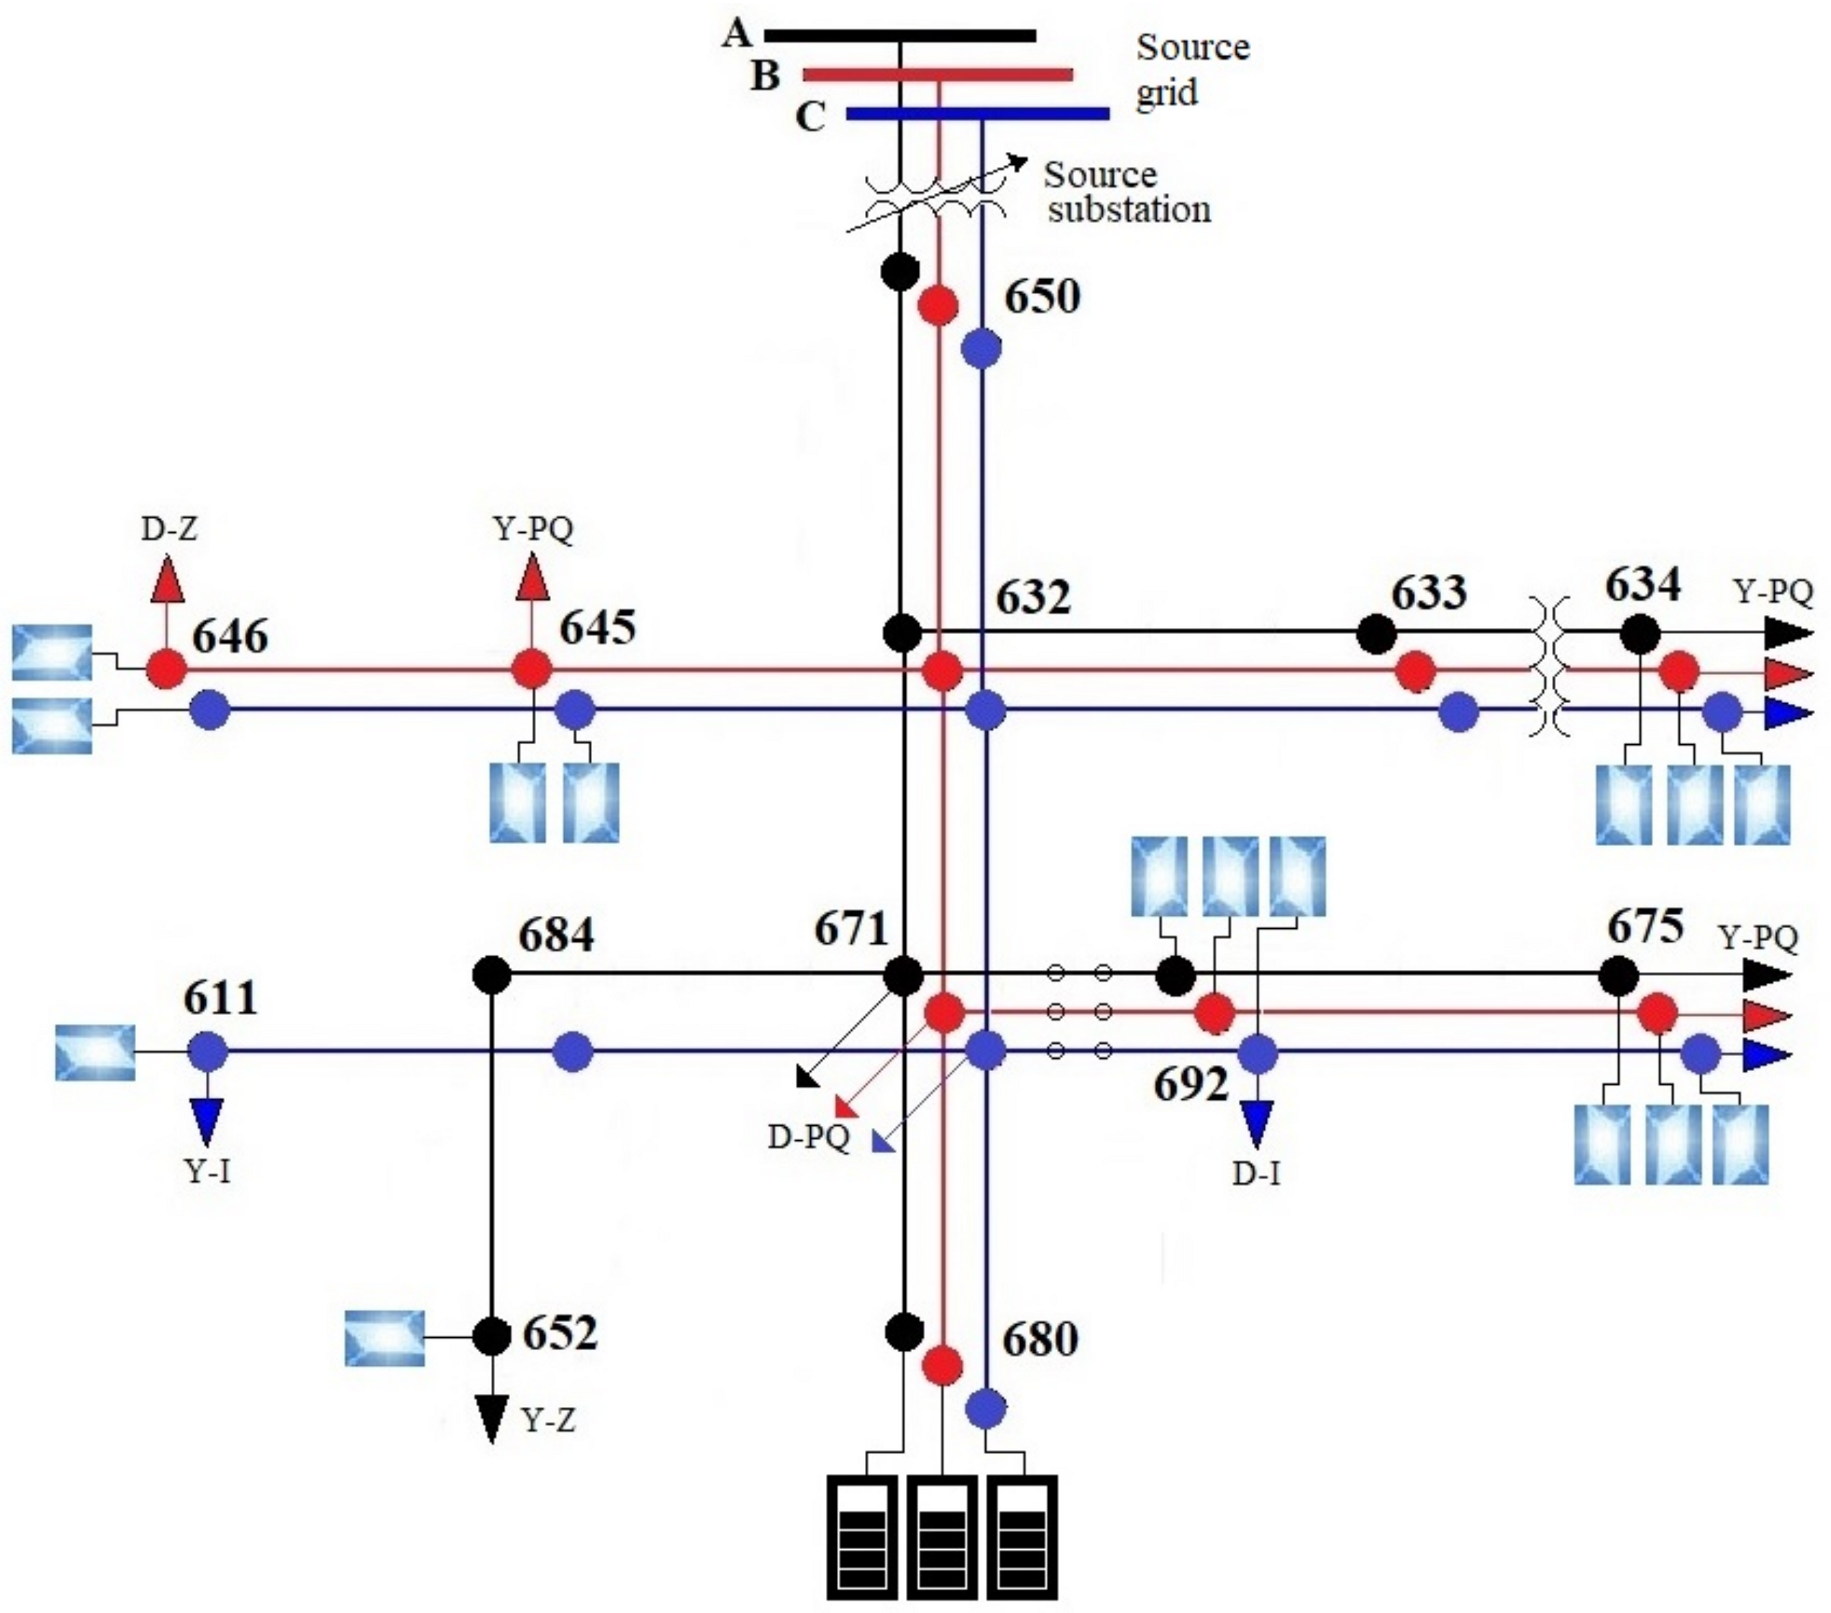
The proposed approach for the day-ahead optimal dispatching of active and reactive powers was simulated on a modified IEEE 13-bus feeder [
31]. In the modified IEEE 13-bus feeder, the single-phase PV sources are connected to buses 634, 645, 646, 611, 675, 692, and 652, as shown in
Figure 5. Single-phase PV sources, each with the same rated power of 250 kW, are connected to the grid via single-phase inverters. Single-phase BESSs, each with a rated power of 0.9 MW and a capacity of 3.6 MWh, are connected at bus 680 in all three phases via single-phase converters with rated apparent power of 1.1 of the rated power of the batteries. Data on PV and BESS parameters are given in
Table 1 and
Table 2, respectively.
The daily load profile is represented by the mean hourly values shown in
Table 3, with a standard deviation of 10%. The daily solar irradiance profile used in the simulation is represented by the mean hourly values and standard deviations given in
Table 4. The day-ahead electricity price (EP) data used are shown in
Table 5. The maximum value is estimated according to the electricity price for Serbia on the spot market in January–February 2023.
5.1. OAPD Results
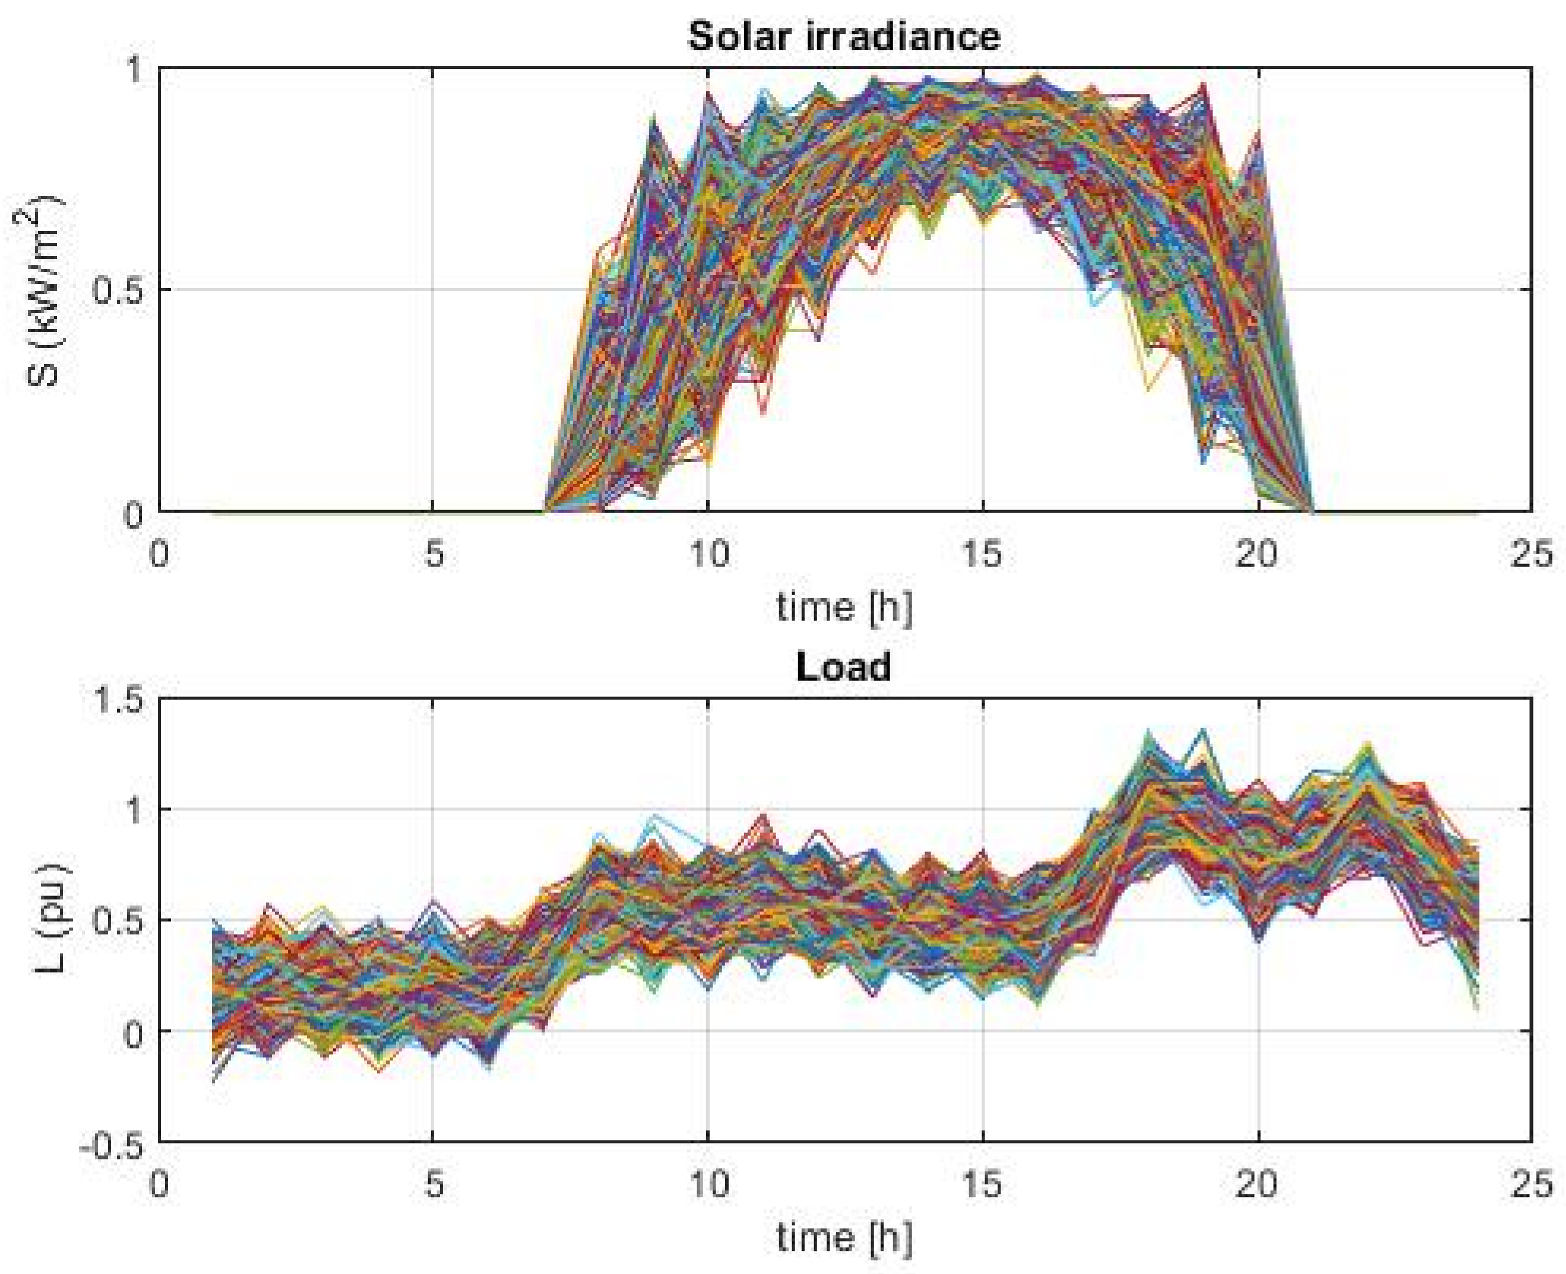
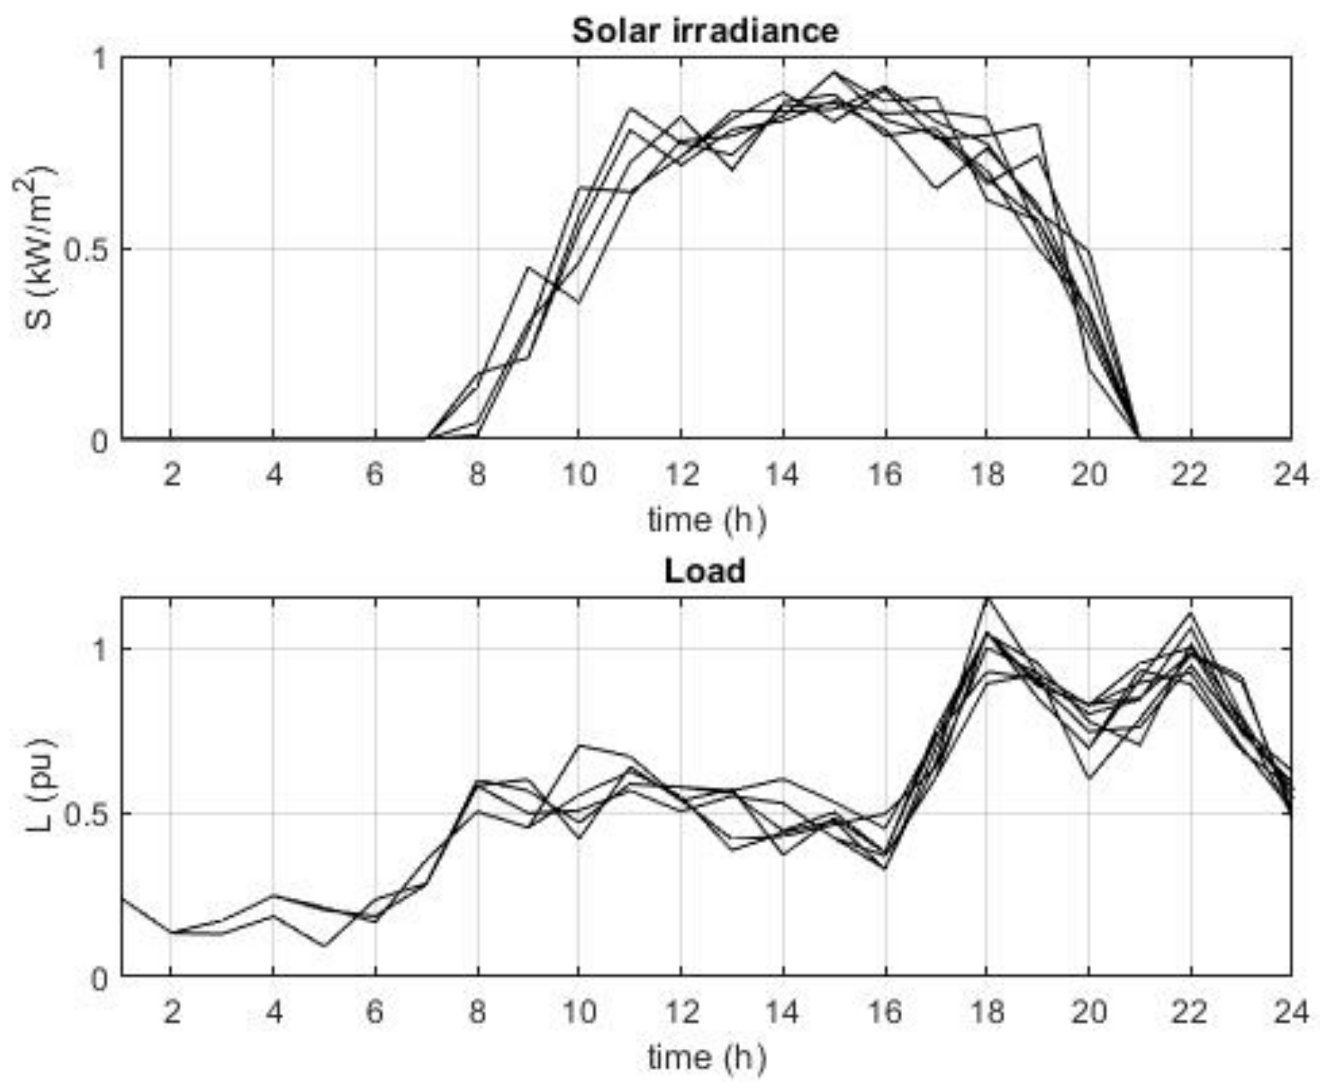
As explained in
Section 2, using MCS, there are 2000 solar irradiance and load scenarios generated, as shown in
Figure 6. By applying the simultaneous backward reduction technique, these 2000 scenarios were reduced to the 10 scenarios shown in
Figure 7.
By applying the proposed approach for the optimal active power dispatch, the expected total operating costs of each scenario were determined; the results are shown in
Table 6.
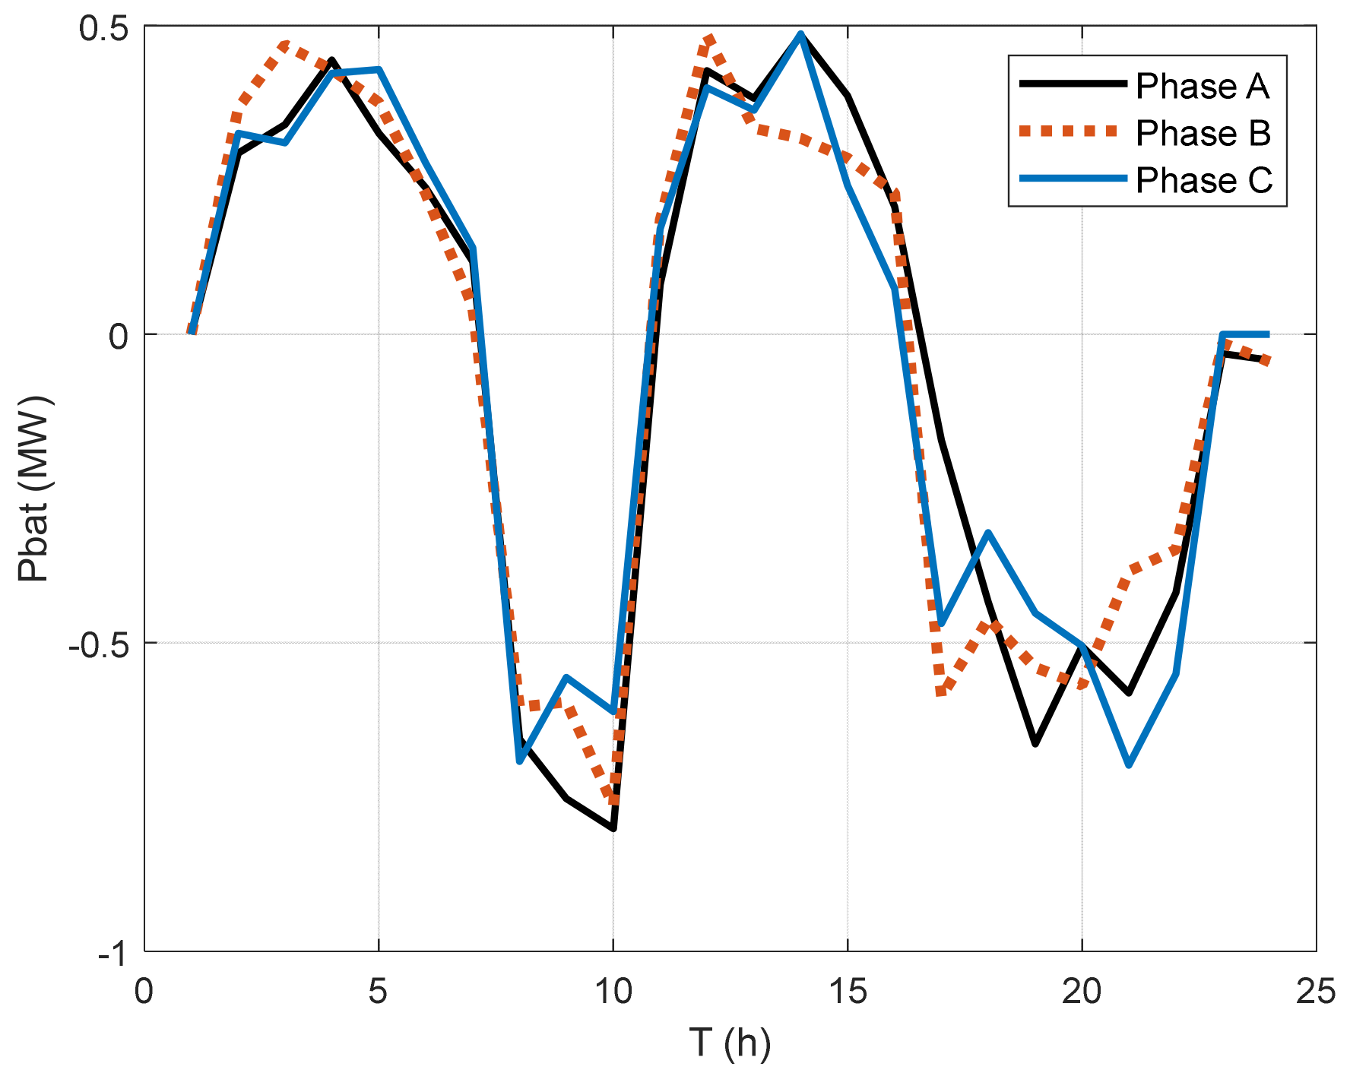
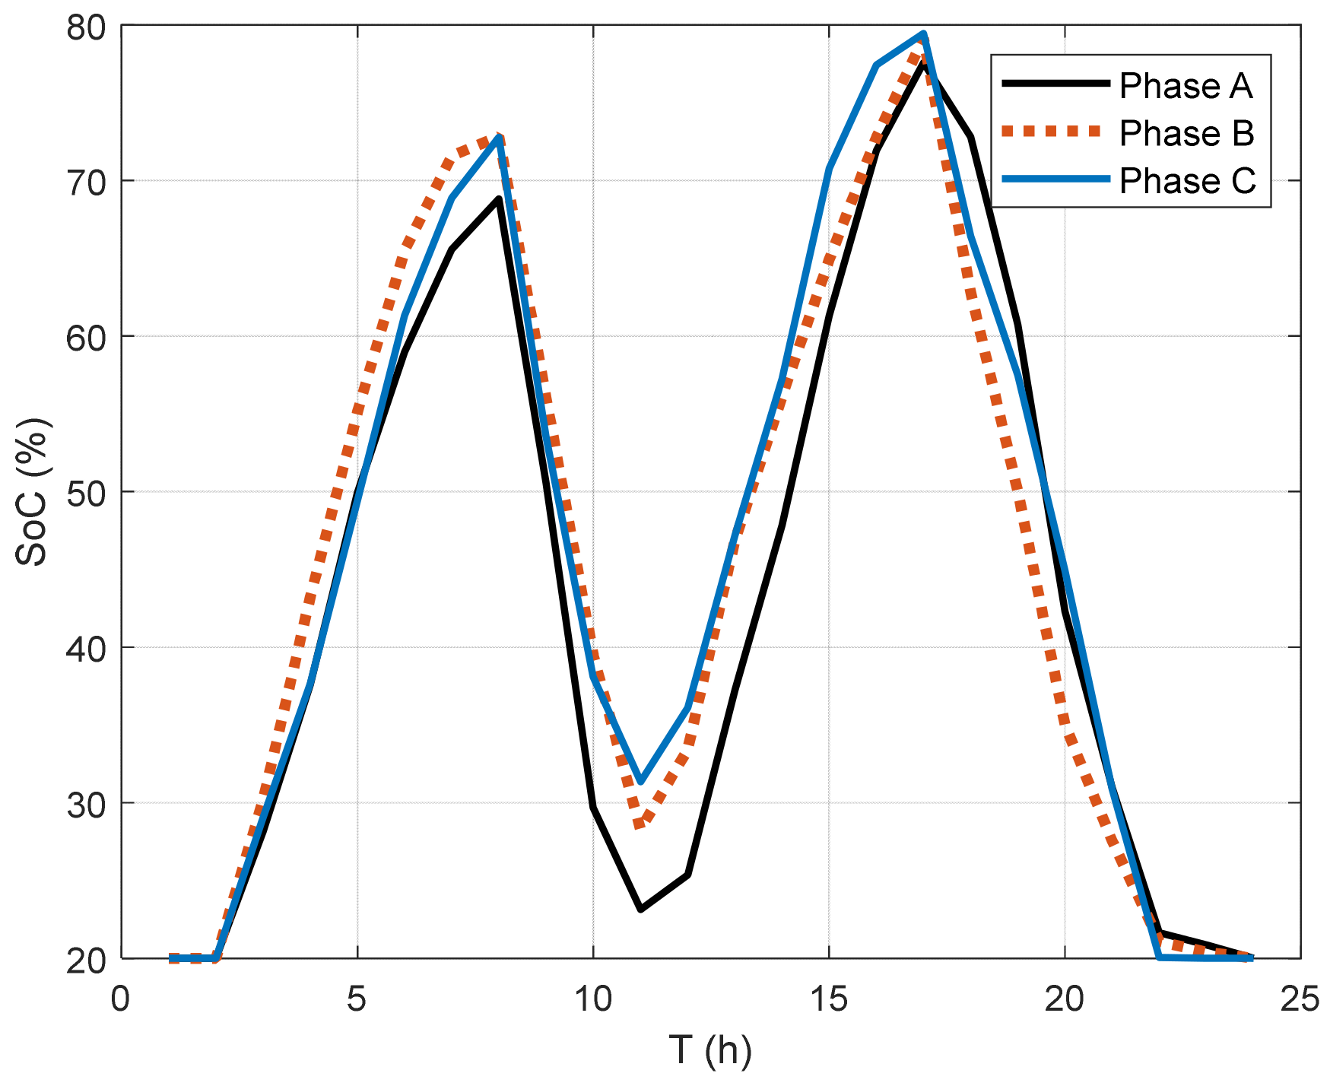
The optimal value of the expected daily cost for electricity is EUR 453.16. According to (10), this value is obtained as the sum of the costs in each reduced scenario multiplied by the corresponding probability. In view of this, the expected day-ahead charging/discharging schedule of the BESS was obtained as shown in
Figure 8 and
Figure 9.
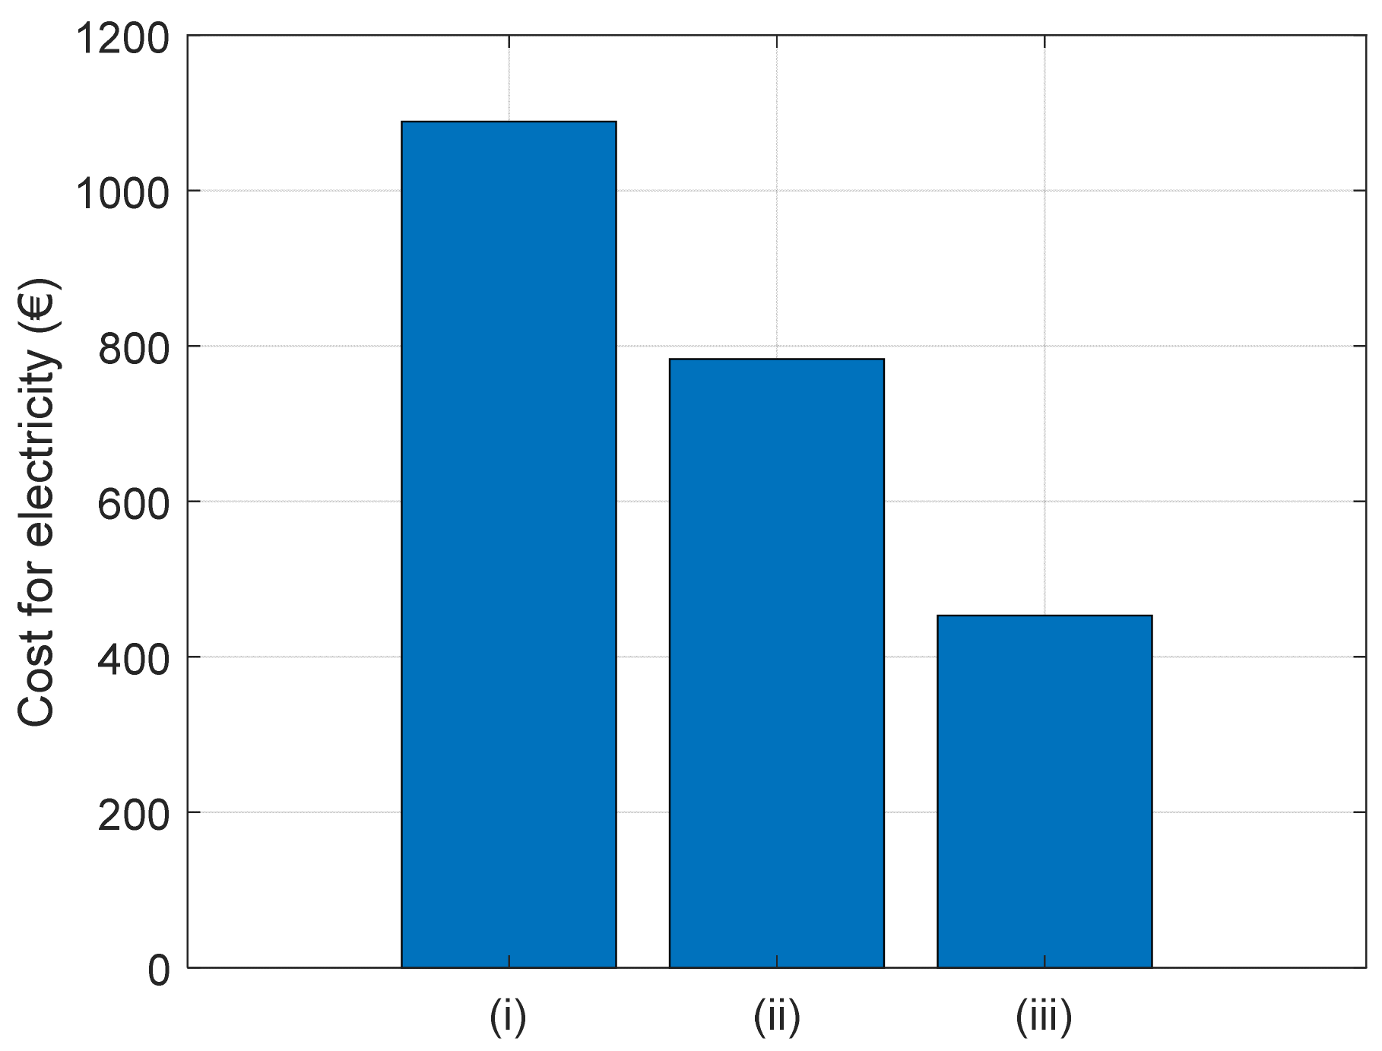
For comparison,
Figure 10 shows the daily costs for electricity in the following cases: (i) without a BESS integrated into the DN (base case), (ii) with a BESS in the DN applying the charge/discharge schedule approach presented in [
13], and (iii) with the BESS in the DN using the proposed OAPD algorithm. The results in
Figure 10 clearly indicate that the proposed PSOS-CGSA-based approach for OAPD leads to a large reduction in costs for electricity compared to the base case and the approach for OAPD in [
13].
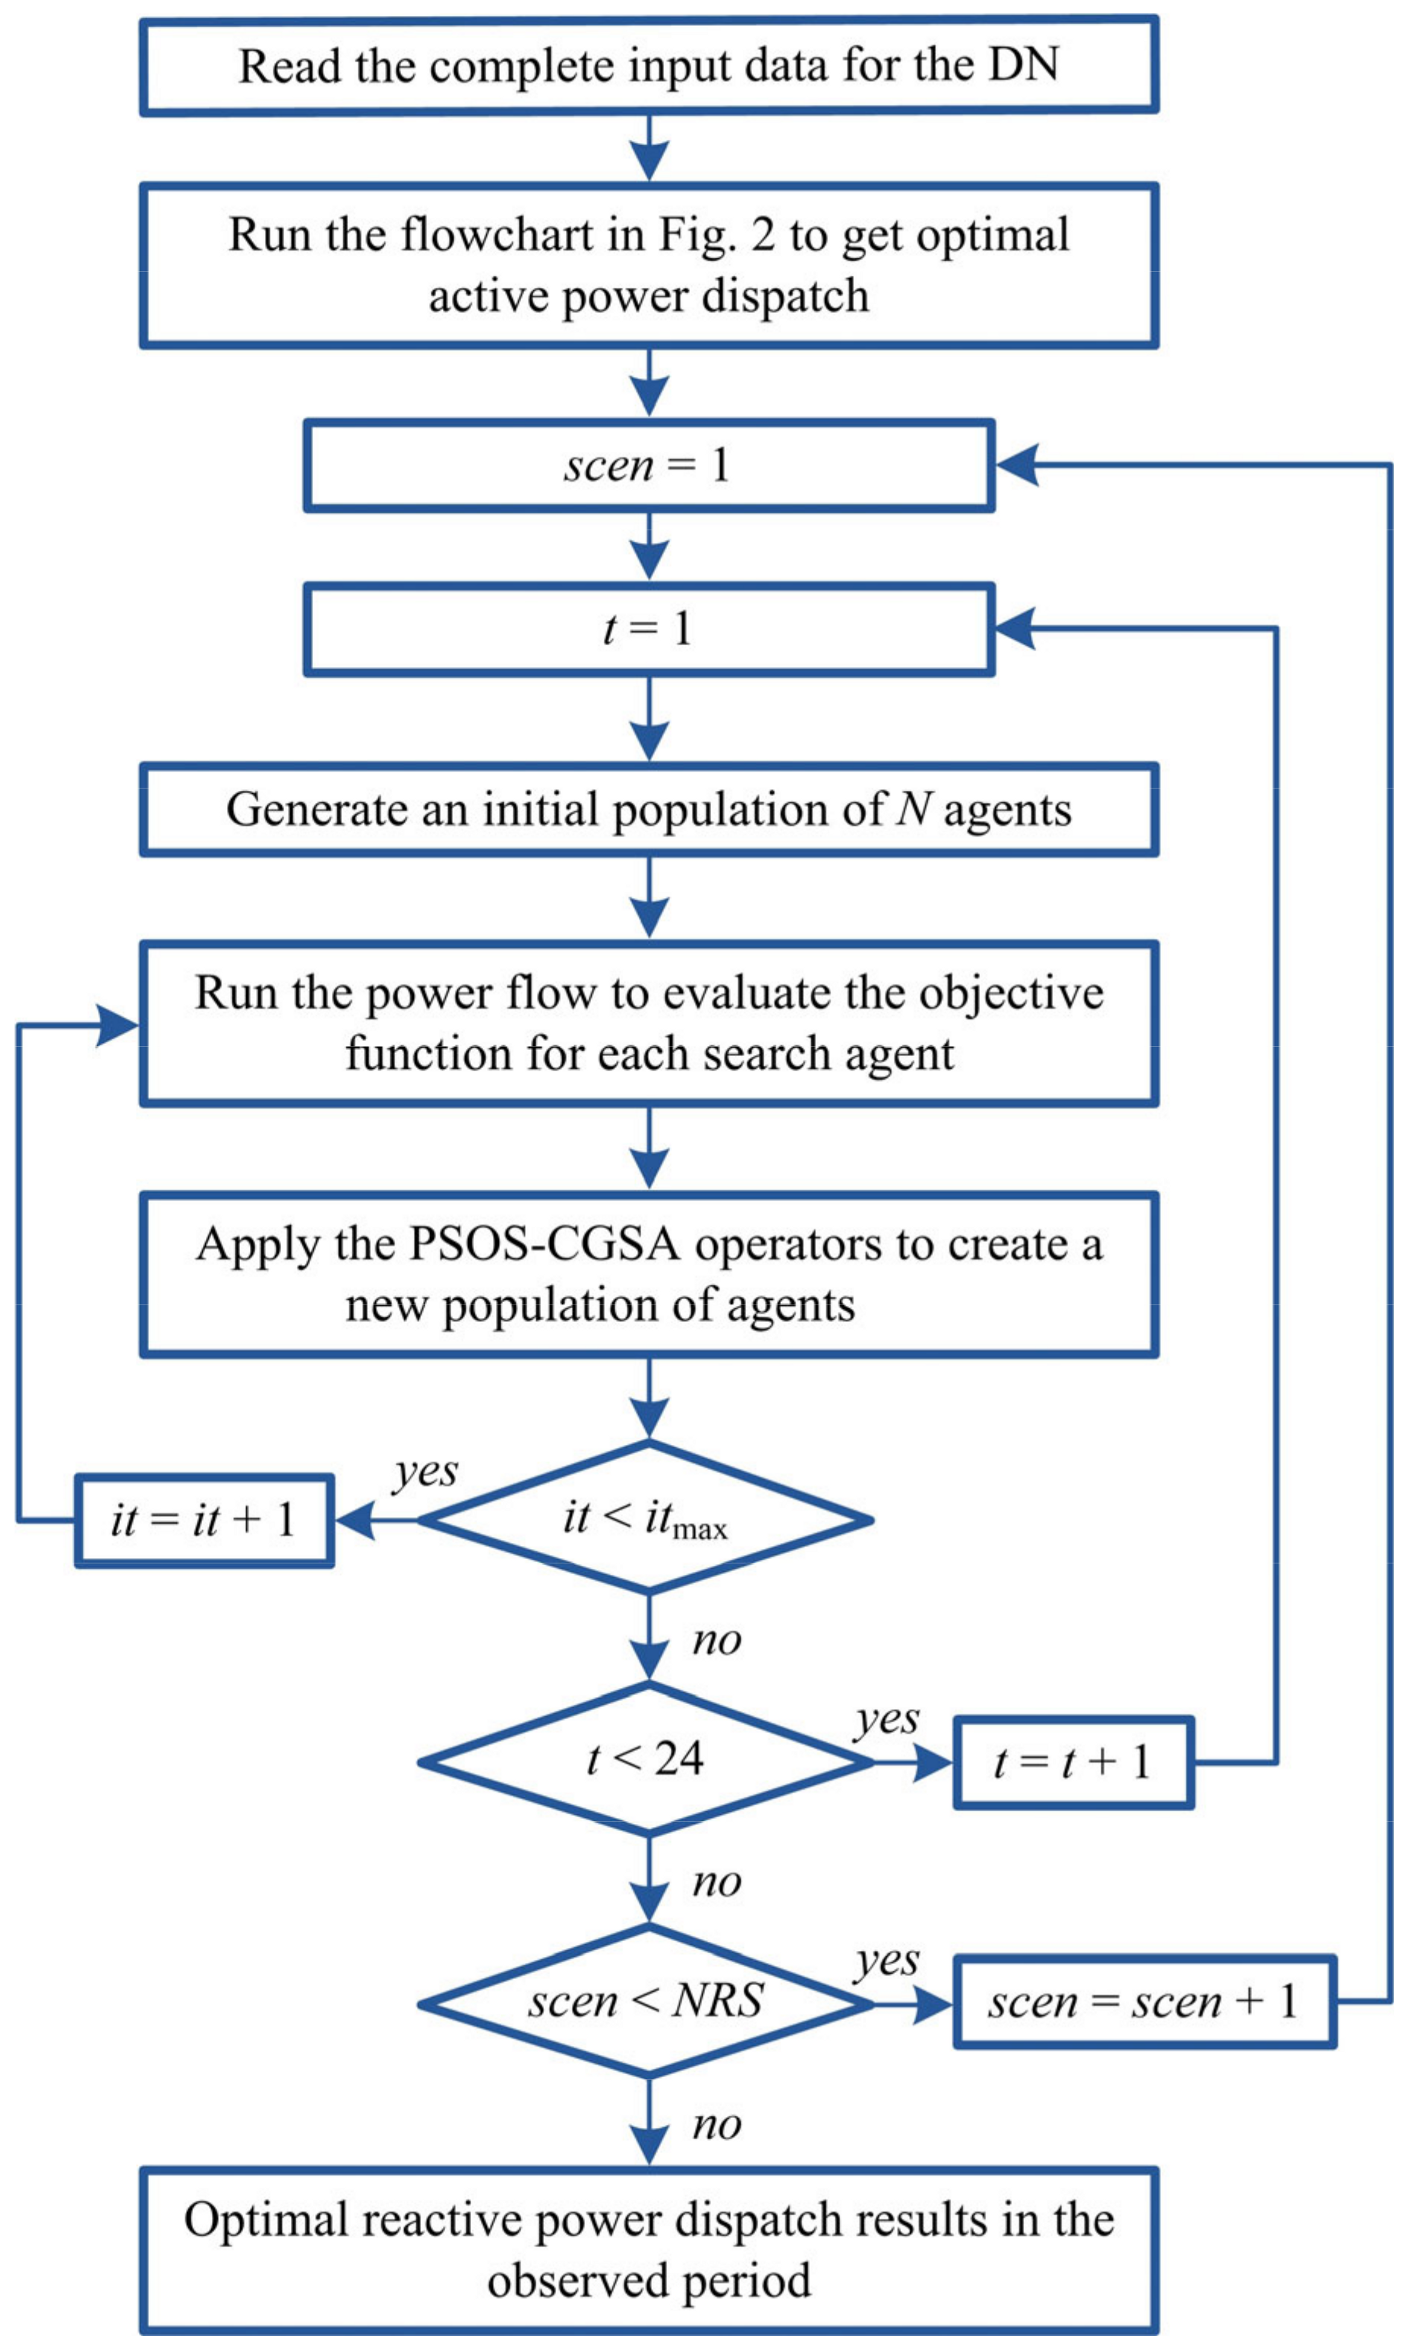
5.2. ORPD Results
Here, the optimal values of21 control variables should be determined, as follows:
The simulation studies were performed for the following two test cases:
Case 1: Minimization of the active power losses (Fobj1);
Case 2: Minimization of the phase voltage unbalance rate (Fobj2).
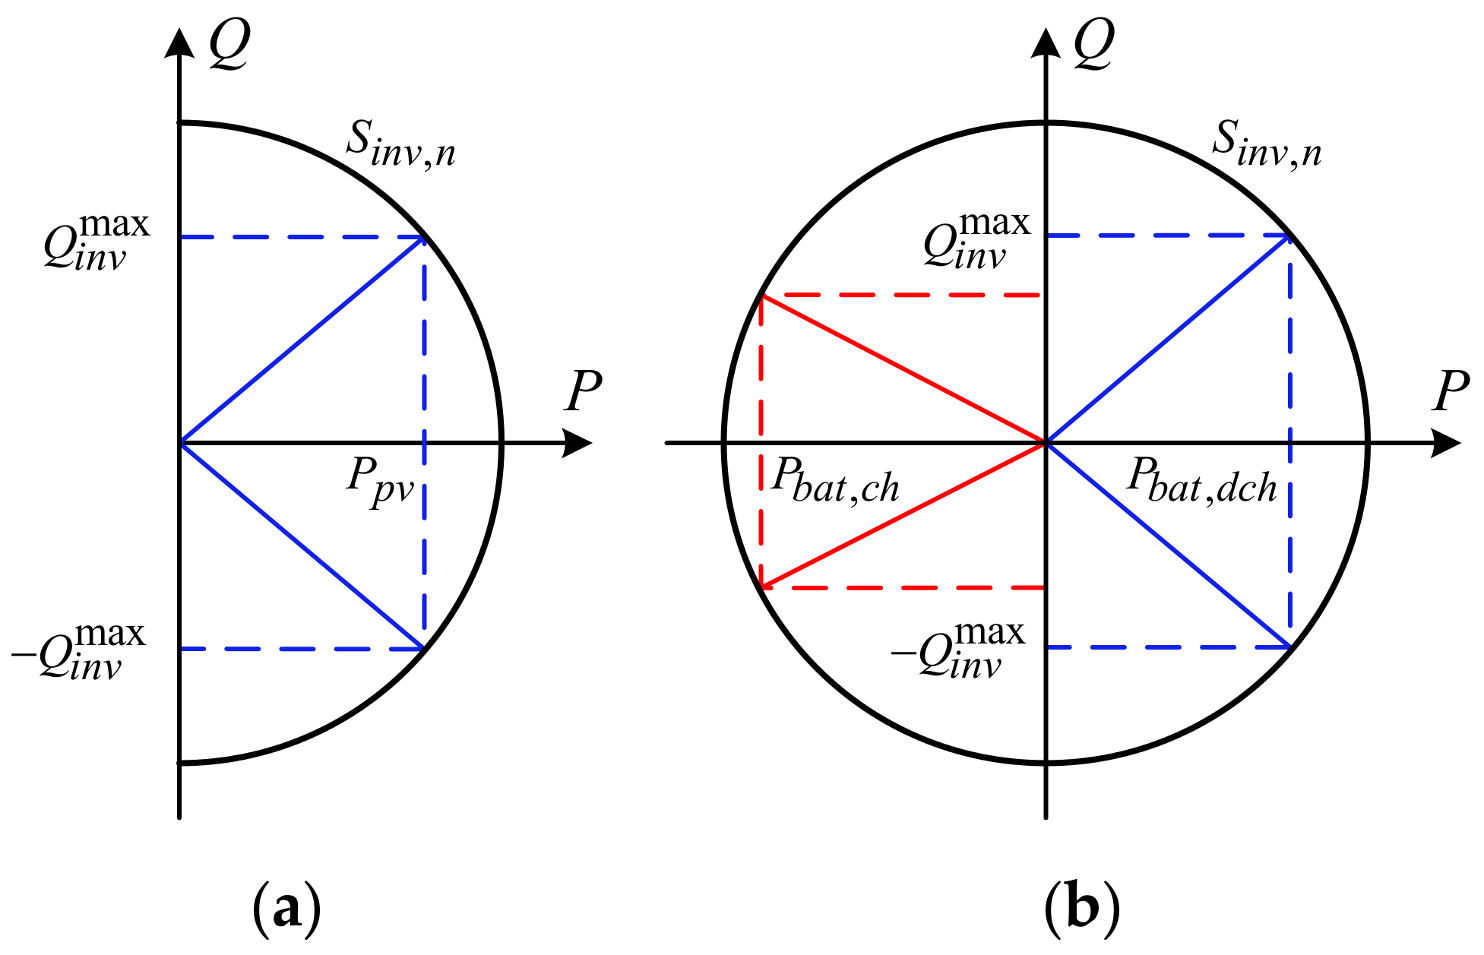
The voltages at the load buses must be within the range of [0.94–1.06] (p.u.). The voltage of the root bus (V0) can be changed in the range of [0.9–1.1] (p.u.), while the limits of the reactive power of the converter are variable, according to (26).
The results are given in
Table 7 and
Table 8. In the base case, the PV sources and BESS operate with unity power factor, and the root bus voltage is equal to 1 p.u.
Table 7 and
Table 8show the expected values of total active energy losses (W
loss) and maximum values of the phase voltage unbalance rate (PVUR
max), respectively, for all ten reduced scenarios.
Applying the proposed procedure for ORPD achieves a reduction in expected energy losses of 22% compared to the base case, while the expected value of the maximum PVUR drops from 9.1% to 1.91%. There are significant energy savings, and it is ensured that the PVUR index level is below the maximum limit of 2% for all three-phase buses in the DN.
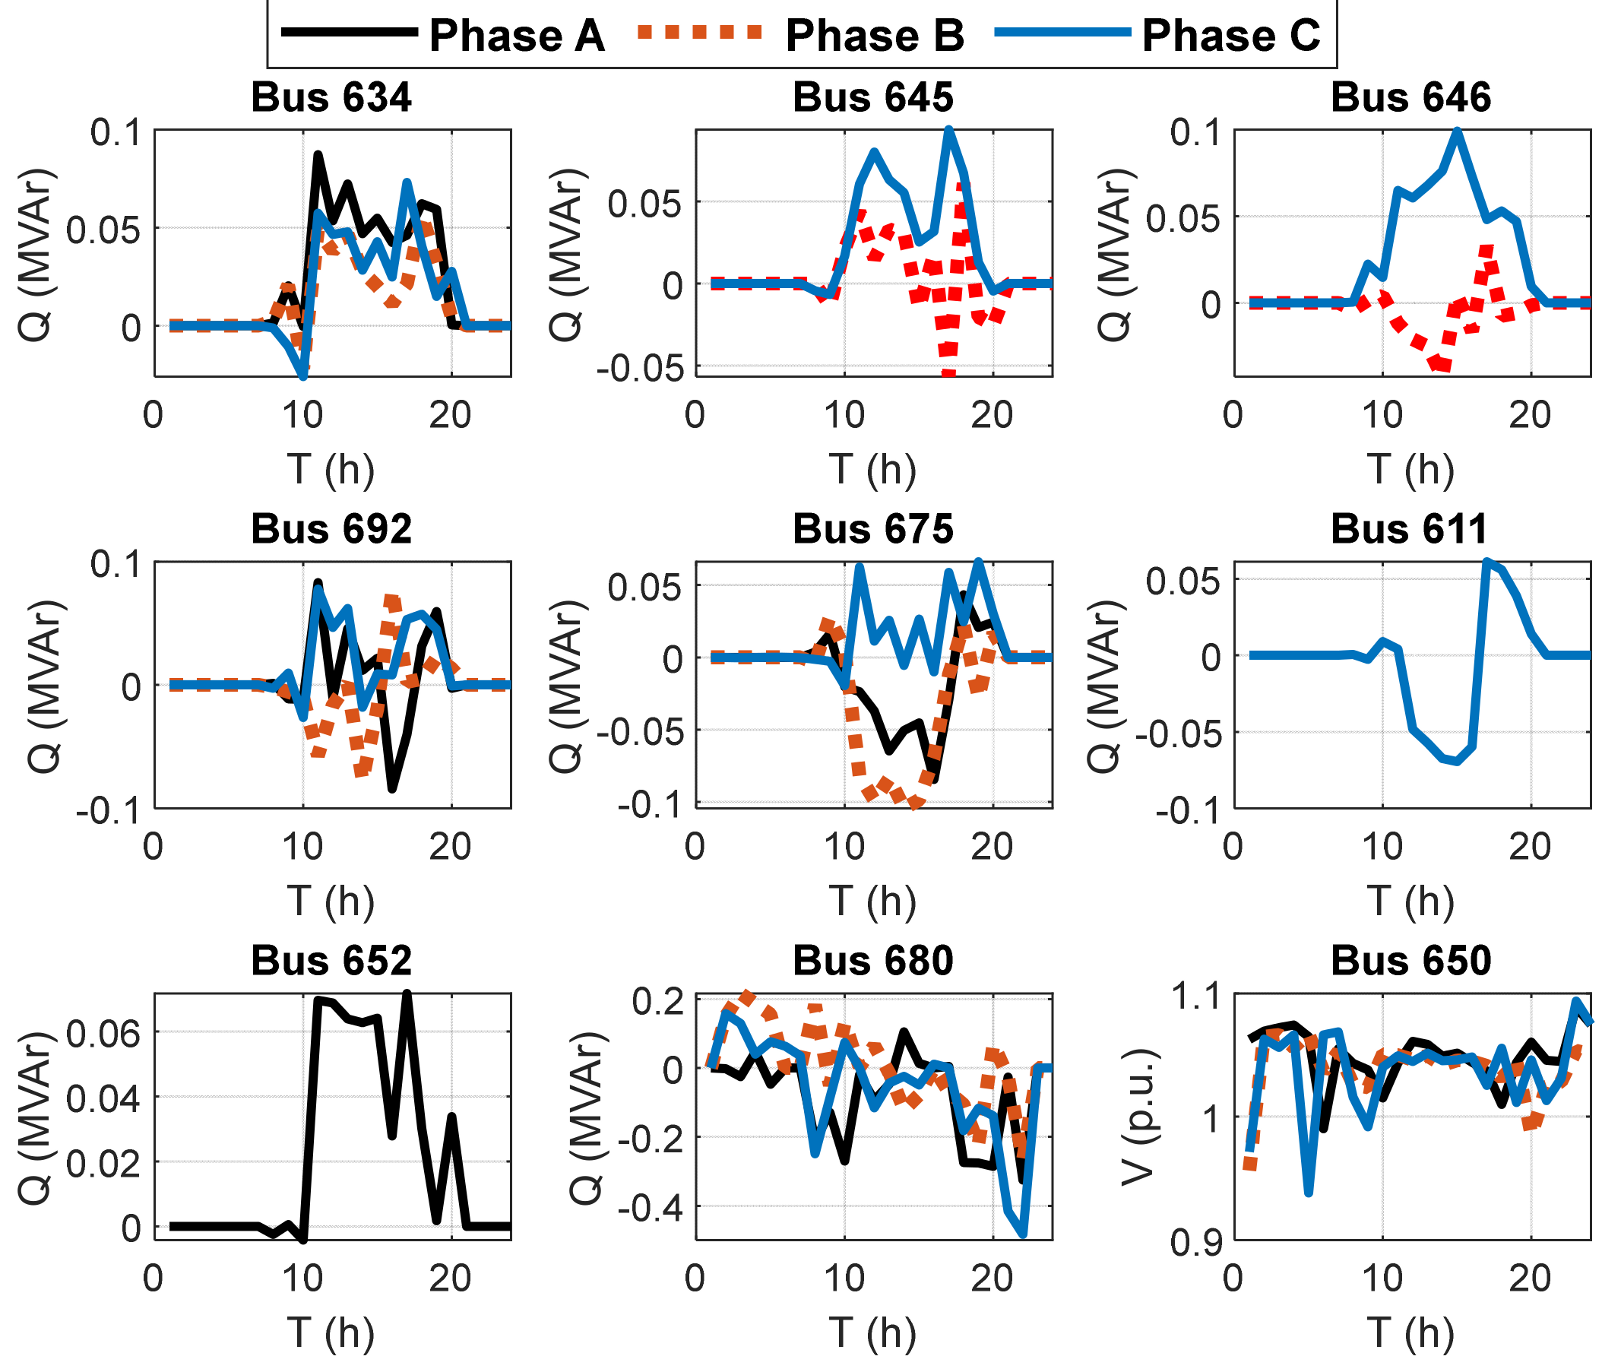
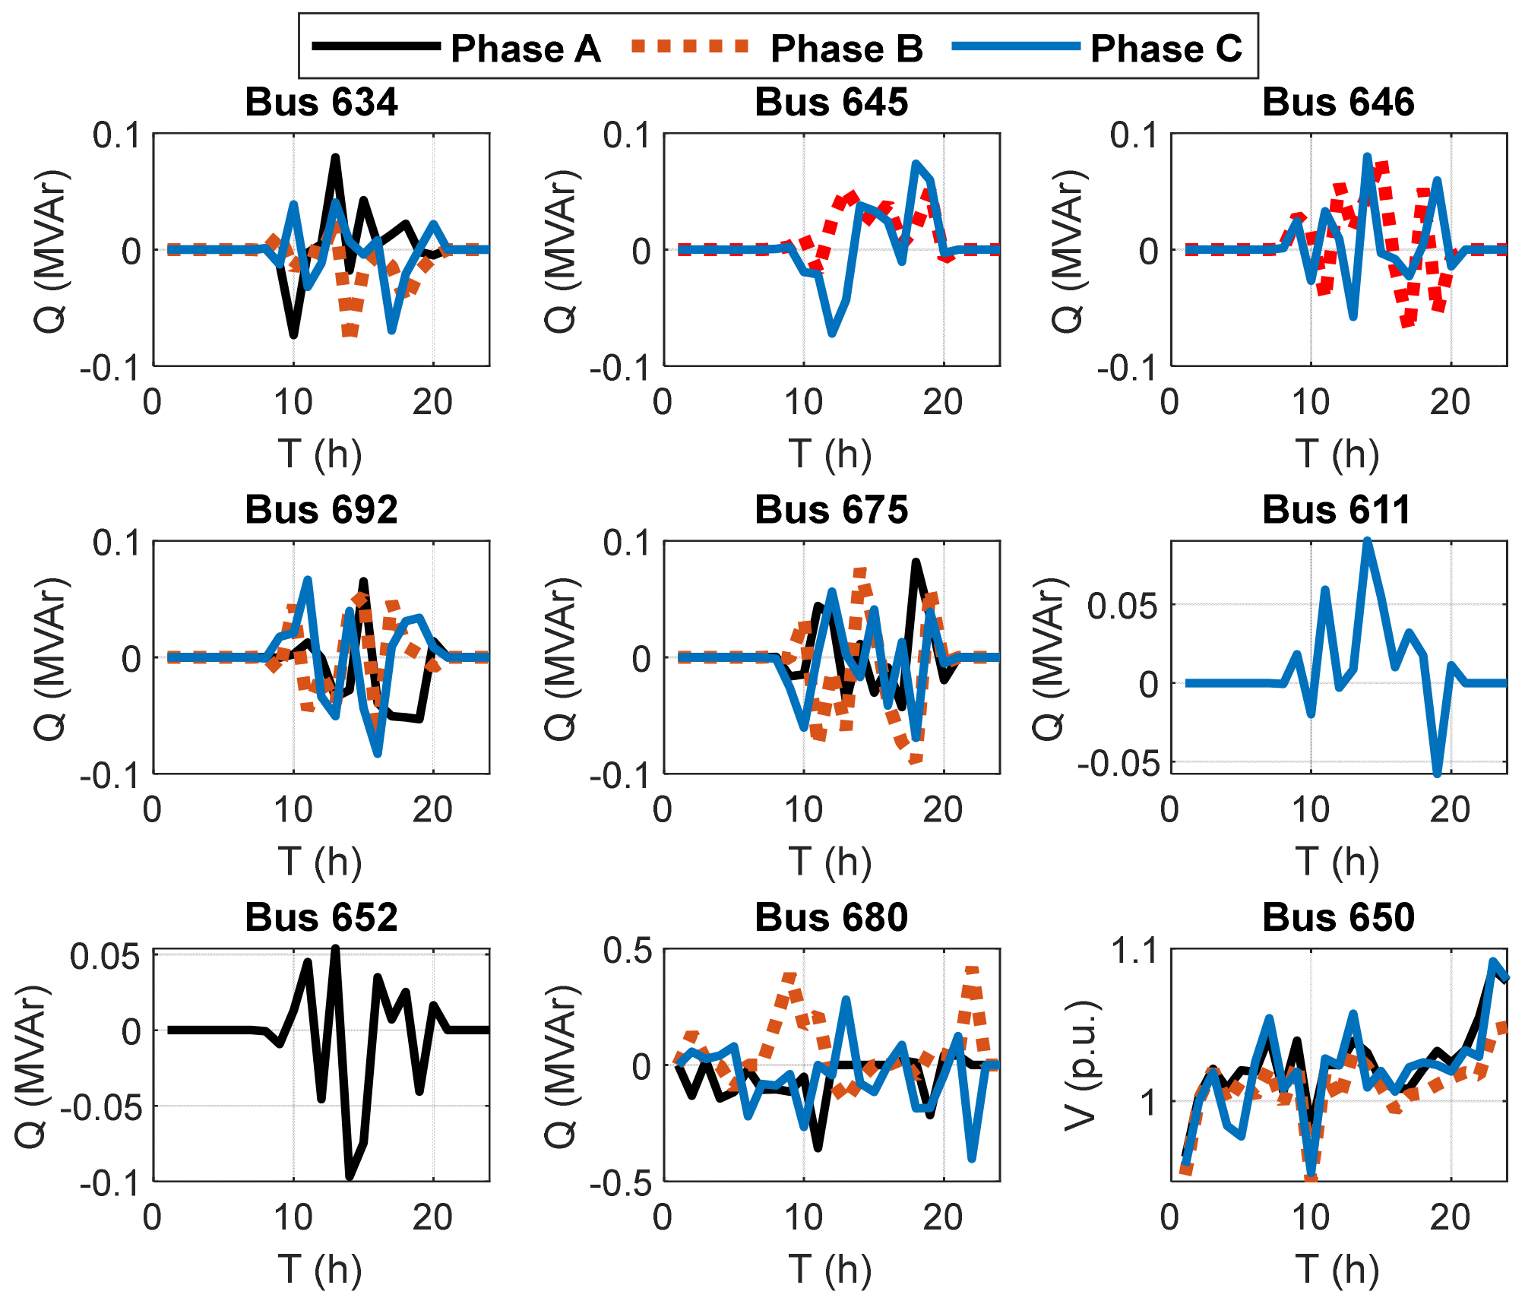
Based on the results shown in
Table 7 and
Table 8, it can be seen that in the case of the minimization of active energy losses (
Fobj1), the best scenario is 9, and in the case of the minimization of the voltage unbalance (
Fobj2), the best scenario is scenario 1.
Figure 11 and
Figure 12 show the optimal values of the control variables for these best scenarios.
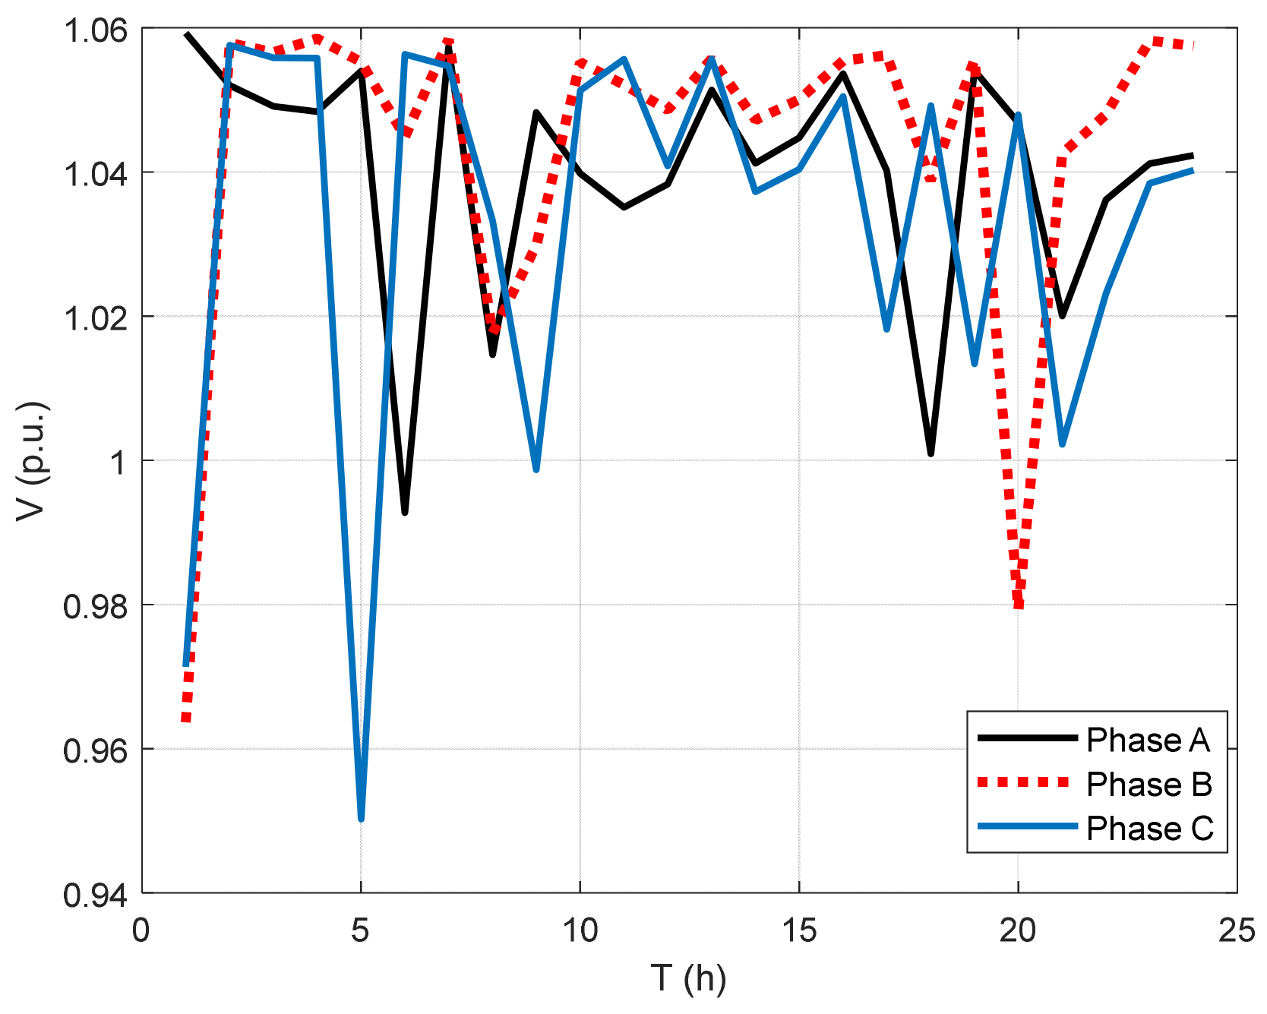
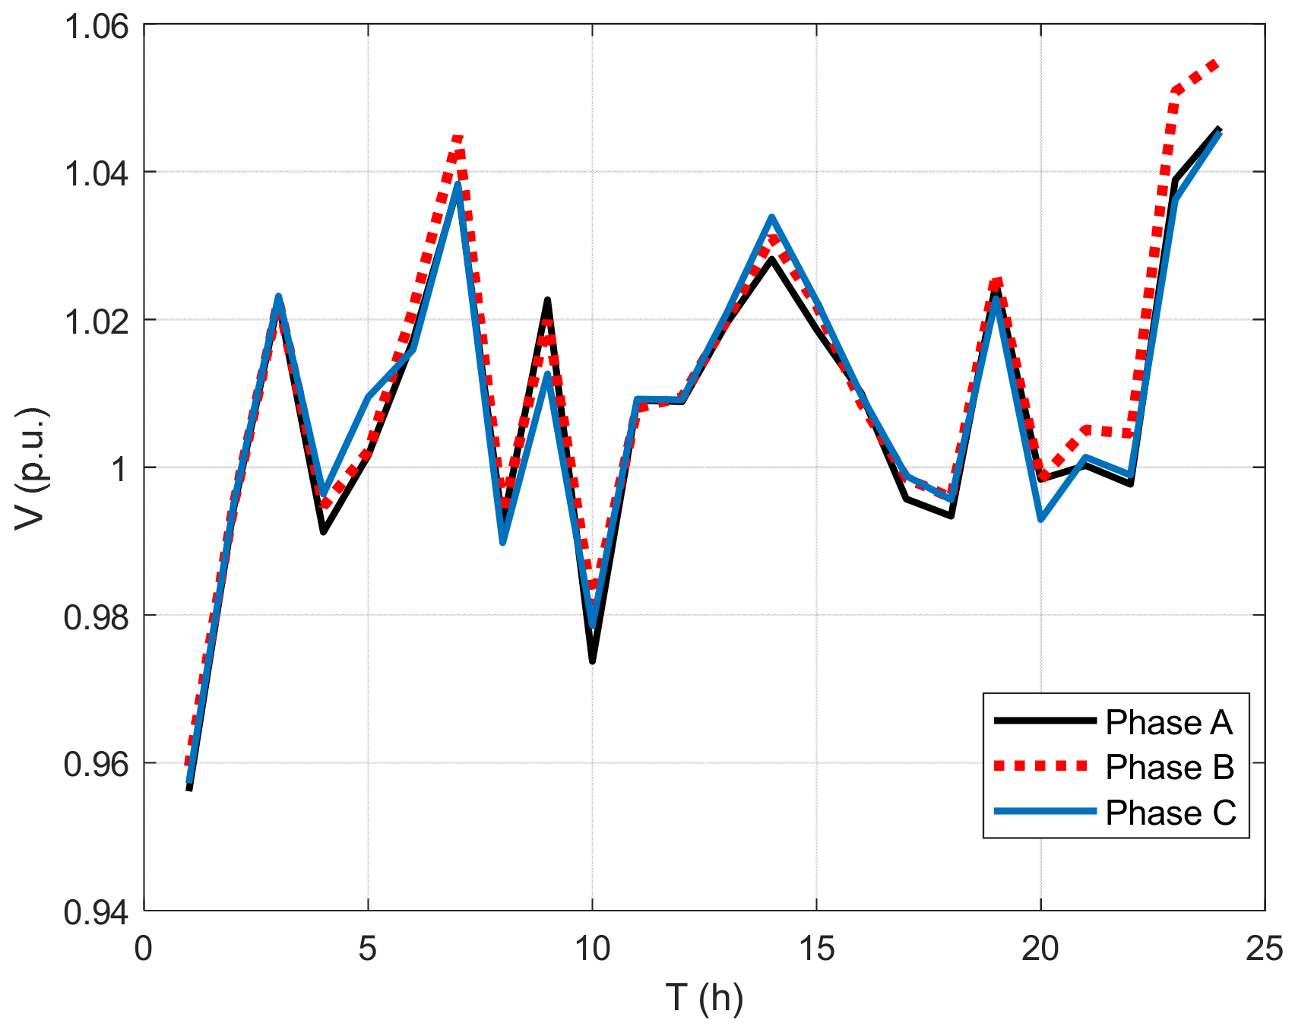
The voltage profiles at bus 671 for the best scenario in Case 1 and the best scenario in Case 2 are shown in
Figure 13 and
Figure 14, respectively.
In Case 1, ORPD reduces the active energy losses compared to the base case, while the voltages are within the permissible limits, as shown in
Figure 13. The phase voltage magnitudes are much closer to each other in Case 2 (
Figure 14) than in Case 1 (
Figure 13). Clearly, this is as a consequence of the
PVUR minimization in Case 2.
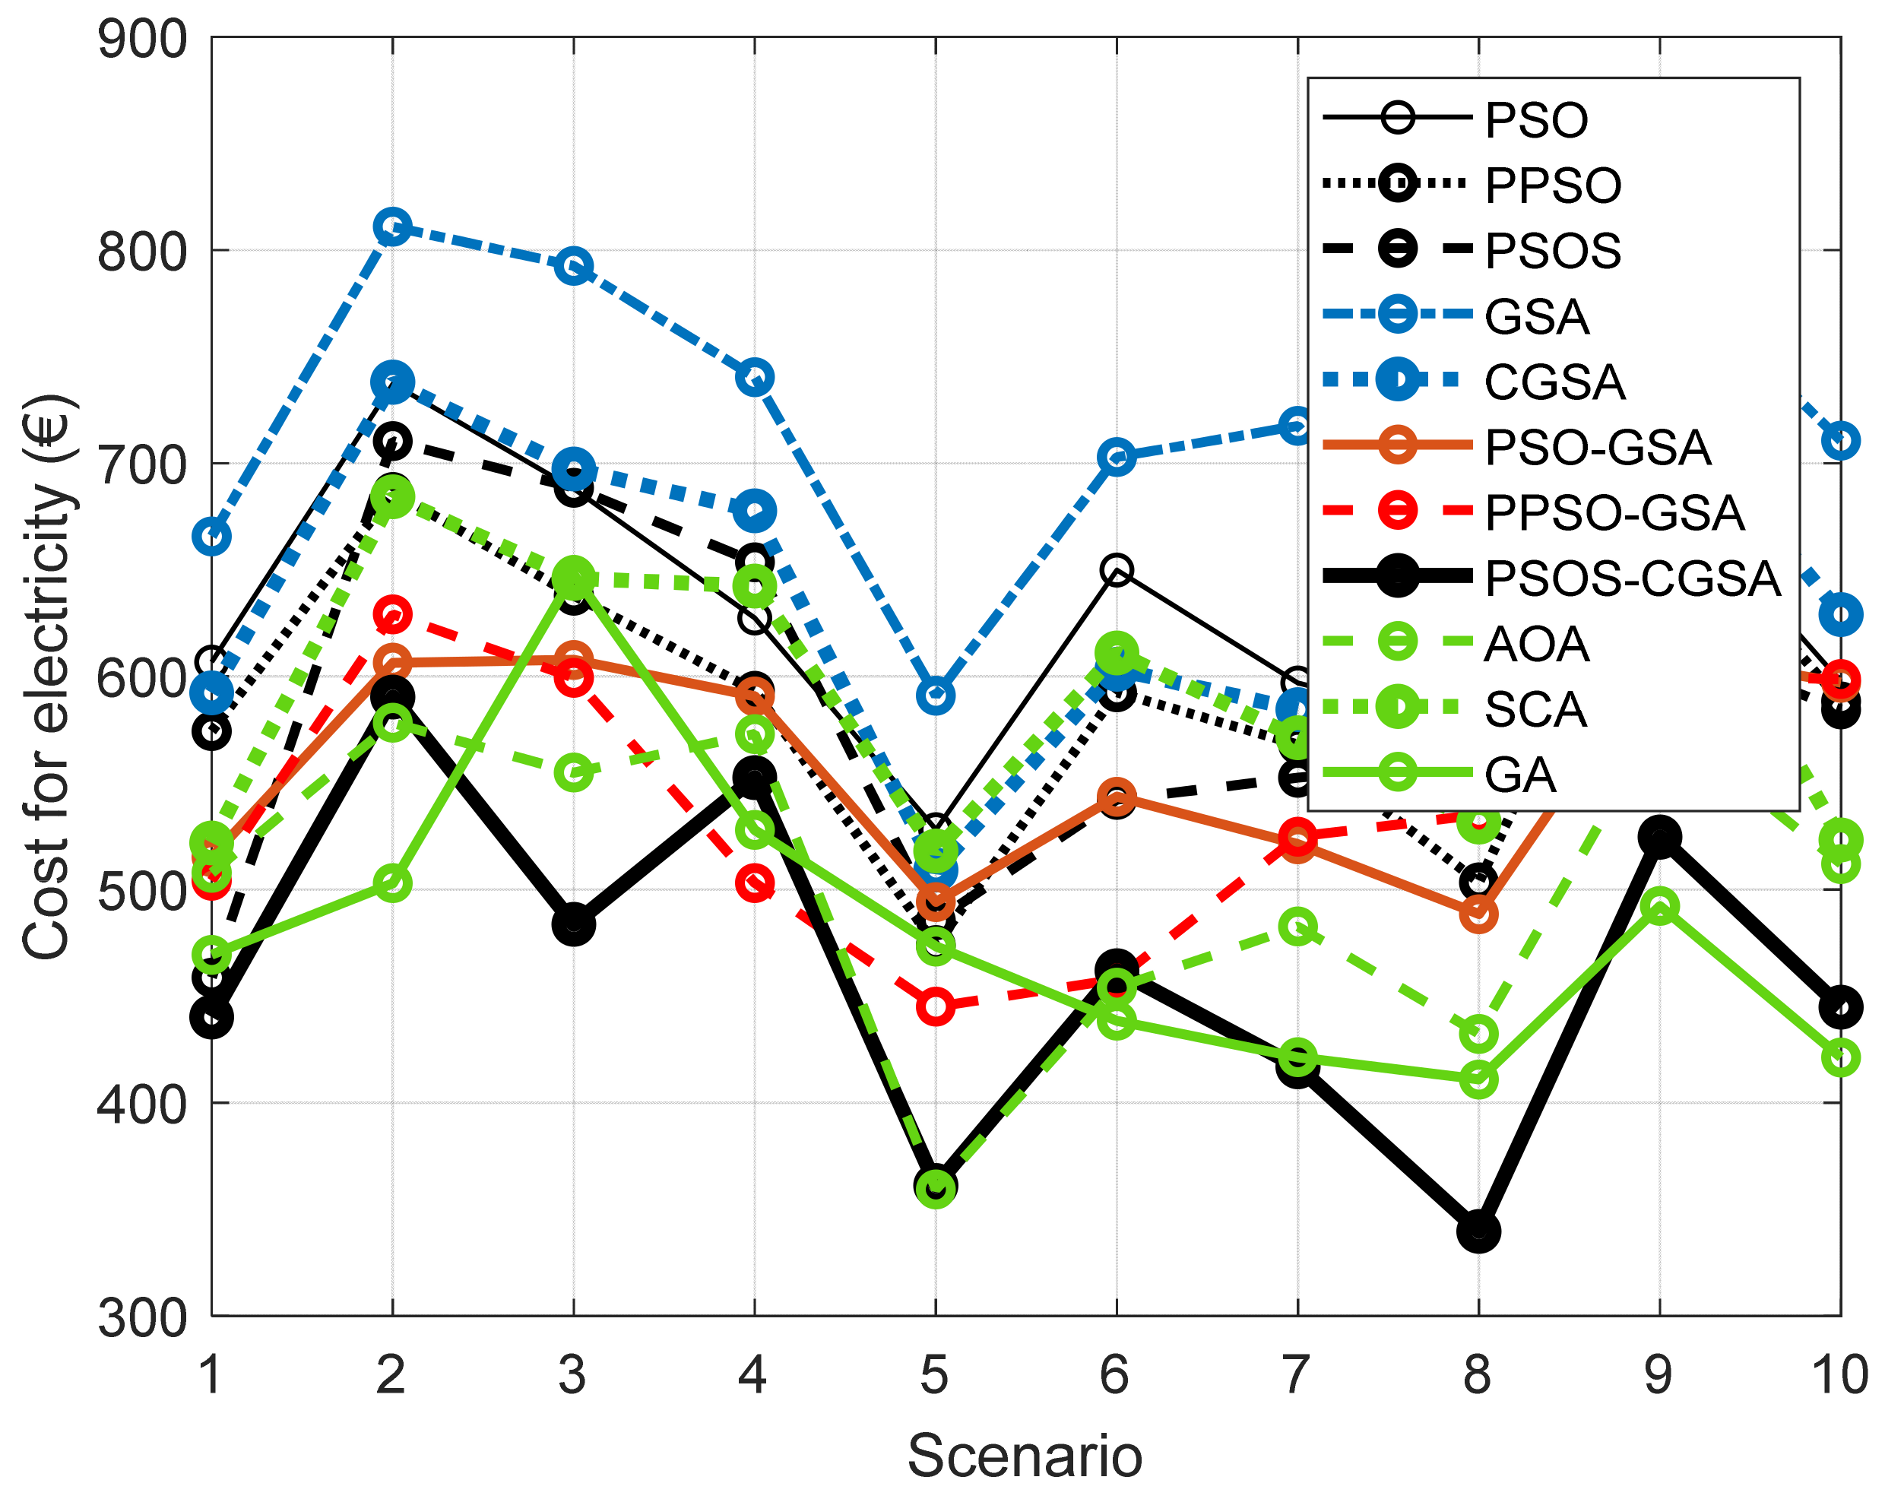
5.3. Evaluation of PSOS-CGSA
The efficiency of the proposed solution algorithm (PSOS-CGSA) [
27,
30] was confirmed by a comparison with well-established metaheuristic algorithms genetic algorithm (GA) [
32], particle swarm optimization (PSO) [
33], and the gravitational search algorithm (GSA) [
34]; their recently improved versions, PSOS [
28] and CGSA [
29], phasor PSO (PPSO) [
35], hybrid PSO and GSA (PSO-GSA) [
36], and hybrid PPSO and GSA (PPSO-GSA) [
2]; and two recently proposed algorithms, namely the arithmetic optimization algorithm (AOA) [
37] and the tunicate swarm algorithm (TSA) [
38].
Algorithm parameters were adopted based on their default values in the cited references. The population size and maximum iteration number were set as N = 50 and itmax = 200 for all case studies. All algorithms were employed to solve the problem of OAPD under the same terms and input data.
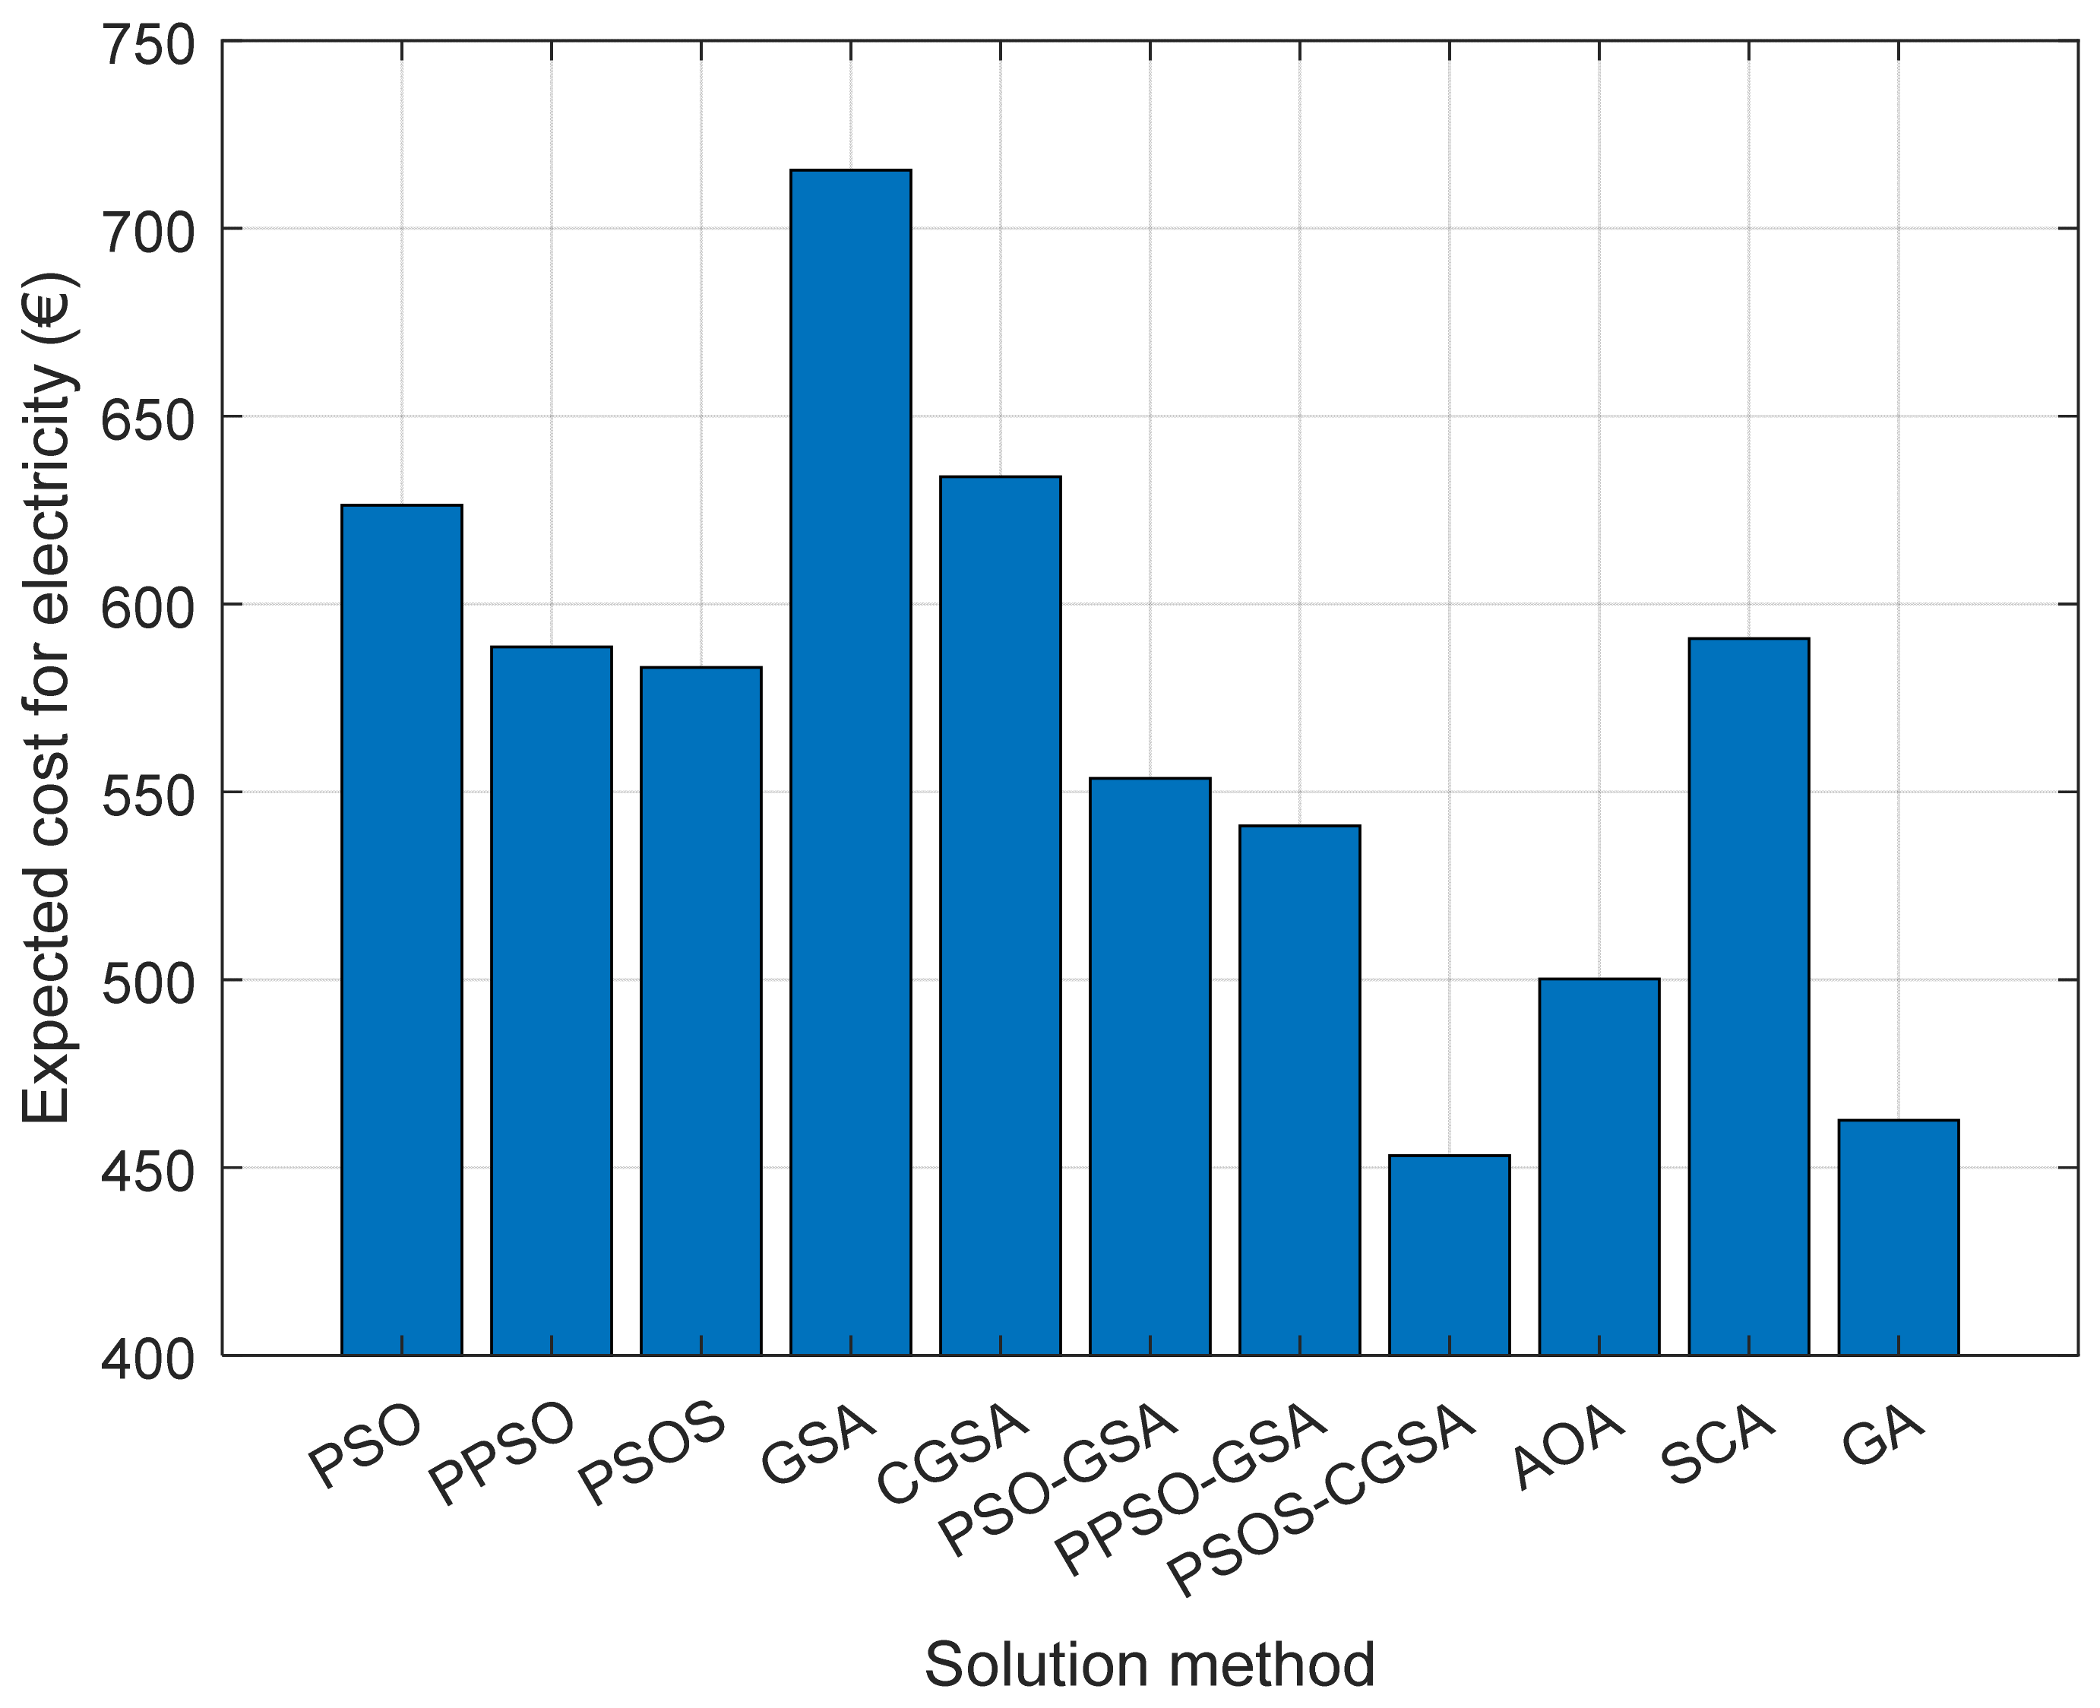
The daily costs for electricity obtained for all 10 reduced scenarios are shown in
Figure 15. Furthermore, the expected daily costs for electricity obtained using different solution methods are shown in
Figure 16. It is clear that the proposed hybrid PSOS-CGSA method finds better solutions for the OAPD problem, i.e., provides lower costs in each of 10 scenarios and the least expected daily cost for electricity compared to other algorithms.


 ,
, 


