Abstract
In view of the lack of clear physical significance of the parameters of the traditional nonlinear seepage models and the difficulty of obtaining accurate experimental measurements of the two-phase relative permeability curve, a nonlinear seepage model of a tight reservoir is established on the basis of fractal theory and boundary layer theory. The results show that the proposed model can comprehensively reflect the effects of reservoir matrix physical properties, reservoir fluid physical properties, wettability, and displacement-pressure gradient on the single-phase and two-phase nonlinear seepage characteristics of tight reservoirs. Furthermore, the introduction of the permeability loss factor makes the two-phase relative permeability model more representative of the morphological characteristics of the actual relative permeability curve and avoids the disadvantage that the relative permeability at the end point of the wetting phase has in the traditional model. Finally, by taking the tight core of Changqing Oilfield as an example, a sensitivity analysis of the proposed model is conducted, which proves the practical application of this model. The proposed model provides a convenient theoretical method for the accurate characterization of nonlinear seepage characteristics of tight reservoirs and is of great significance to the numerical simulation, productivity evaluation, and optimization of tight reservoirs.
1. Introduction
Tight reservoirs have low porosity and permeability and are mostly associated with unconventional reservoirs. Understanding fluid flow behavior in tight porous media is a subject of great interest thanks to its significance to the development of unconventional oil and gas reservoirs [1,2,3]. However, because of the disordered and extremely complicated microstructures in tight porous media [4], transport phenomena in such reservoirs are still not well understood. Tight porous media has low porosity, which is composed mainly of micro- and nanopores, whose pore radius ranges from a few nanometers to several hundred nanometers [5,6,7]. Thanks to the microscale effect, the interaction between pore surface and fluid molecules has significant effects on liquid transport in tight porous media [8,9,10]. As a result, oil transport behavior in tight porous media substantially differs from that in conventional pore scale [1].
Within the conventional pore dimension, the flow capacity of liquid can be accurately predicted by the classical Darcy law. However, the applicability of the Darcy law is greatly limited in micro- and nanopores, and this can be attributed to the dominant interaction between liquid molecules and pore surfaces [11]. With the pore area divided into an interfacial region and a bulk region, surface–liquid interaction results in a heterogeneous distribution of liquid physical properties, such as viscosity and density, that can affect liquid transport capacity [12,13,14,15]. Moreover, the heterogeneous distribution of liquid physical properties in micro- and nanopores result in a deviation from the classical Darcy’s law and show nonlinear seepage characteristics.
Much research has been conducted on the nonlinear seepage characteristics, and some models have been developed, which are mainly piecewise models [16,17], multiparameter models [18,19,20] and fractal models [21,22]. The piecewise model is the most common nonlinear seepage model, which divides the flow stage into three parts. The nonlinear flow stage can be approximately described as a straight line, and it is extensively applied in well testing and numerical simulation but is inapplicable when the pressure gradient is small [17]. Moreover, the simplicity of the piecewise model reduces the difficulty in executing the model calculation, but it is difficult to distinguish the flow stages of the model, and this will decrease the continuity between the stages if the model were applied to a reservoir with strong nonlinear seepage characteristics. This will also decrease the accuracy of the representation of the nonlinear seepage process. Some researchers introduced different coefficients obtained from the fitting of experimental results to describe the nonlinear seepage flow stage [16,23]. Deng and Liu proposed an implicit seepage velocity expression of pressure gradient for multiparameter models [18]. However, some of the parameters of these models did not have clear physical meanings. Shi [19], Jiang [24], and Xu [25] proposed three two-parameter models given the boundary layer effects. The partition process between the different flow stages can be avoided in the multiparameter model; however, the derivation process of the model is based on an equivalent diameter capillary bundle model, which ignores the complicated nature of the pore structure in tight reservoirs. Meanwhile, owing to the advantages of fractal scaling theory on describing the complexity of pore structures in tight porous media, the pore radius distribution and tortuosity of the flow path can be determined by introducing a pore fractal dimension and a tortuosity fractal dimension. Some fractal nonlinear seepage models for tight oil have been developed [21,22].
The aforementioned models are aimed at the nonlinear seepage characteristics of the single-phase fluid. The seepage variation caused by the process of nonlinear seepage and wettability is often neglected because the nonlinear seepage characteristics of each phase fluid are usually considered separately in the traditional two-phase numerical simulation. As a result, it is necessary to devise a method for determining the relative permeability curve of oil–water two-phase flow while taking nonlinear seepage characteristics into account. The methods of determining the relative permeability curve usually include the experimental method [26,27,28], the numerical simulation method [29,30,31,32], and the analytical model method [33,34,35,36,37,38,39]. Among these, the experimental method is difficult to measure because of the high seepage resistance of the fluid in a tight reservoir. The time cost of the numerical simulation method is high because of the complicated computational process. However, the analytical model method is easy to use because it is relatively convenient to solve.
In this work, a model for single-phase seepage in a tight reservoir based on fractal theory and boundary layer theory was proposed. On this basis, a two-phase seepage model was built to characterize the relative permeability curve given the nonlinear seepage flow and the effect of wettability. The accuracy and generalizability of this model have been confirmed via model validation and sensitivity analysis. The model is easy to apply because it directly uses the capillary force curve. Furthermore, an in-depth understanding of the nonlinear seepage characteristics of tight oil reservoirs has laid a theoretical foundation for the efficient development and utilization of tight oil reservoirs.
2. Single-Phase Nonlinear Seepage Model in a Tight Reservoir
2.1. Model Assumption
Given that the pore radius distribution can be described by fractal theory [21], the fluid still obeys the Newtonian fluid characteristics when it flows in a tight matrix [36], the boundary layer thicknesses are related to the fluid type, and the temperature changes in the reservoir can be ignored in most cases, the assumptions of the model are as follows: (1) Tight oil reservoir cores are composed of a few unequal-diameter capillaries conforming to the fractal distribution law. (2) The fluid flow in capillaries conforms to Newtonian fluid flow characteristics. (3) The water phase and the oil phase have different boundary layer thicknesses. Wettability, capillary force, and displacement-pressure gradient all influence the seepage characteristics of the water and oil phases. (4) The fluid flow process is isothermal flow.
2.2. Single-Phase Nonlinear Seepage Model in a Tight Reservoir
Unlike gas seepage, single-phase liquid has strong nonlinear characteristics when flowing in tight cores, and it is often characterized by combining boundary layer theory and capillary bundle theory, as shown in Figure 1. The interaction between the liquid molecule and the pore wall cannot be overlooked, because the extremely small size of the pore would make some of the liquid molecules that come into contact with the pore wall (boundary layer) difficult to flow, ultimately reducing the relative permeability at the macro level.
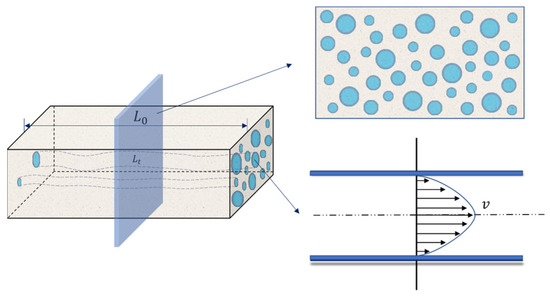
Figure 1.
Schematic diagram of a single-phase capillary bundle model.
When the influence of the boundary layer is taken into account, the volumetric flow rate of fluid in a single capillary tube with radius is as follows:
where is the boundary thickness, m; is the fluid viscosity, mPa·s; is the displacing-pressure difference, MPa; and is the actual length of the curved capillary, m.
According to the experiment results, the boundary layer thickness can be obtained by using the following equation [40].
where , , and , which are all constants with undefined unit, and where is the pressure gradient, MPa/m.
To describe the theoretical total flow rate of fluid in the matrix, fractal theory is adopted in this work. Fractal theory, also known as the geometry of describing nature, captures the essence of a series of complex systems or natural phenomena and provides a very simple description. It has played an important role in promoting research of many complex scientific fields, such as fluid dynamics and turbulence research, neurophysiology, urban planning, fracture mechanics, earthquake prediction, and crystal growth laws, among others. A porous medium is also a kind of fractal material, in which the distribution of pore scale conforms to the fractal distribution law. In addition, the cumulative pore-size distribution can be characterized by the maximum pore radius, the minimum pore radius, and the fractal dimension. In a fractal porous medium, the total flow rate of fluid in the matrix characteristic unit is as follows [21]:
where is the tortuosity fractal dimension, undefined unit; is the characteristic length of the pore media, m; is the total number of capillaries; is the maximum pore radius, m; and is the minimum pore radius, m. The characteristic length of porous media can be calculated by using the following formula [36]:
where is the fractal dimension of porous media, undefined unit.
According to Darcy’s law, the effective permeability under a specific pressure gradient can be expressed as follows:
where is the cross-sectional area of porous media, m2.
During the fluid flow process, the fluid flow in some micropores encounters some difficulty owing to solid wall action. Thus, the pressure at the end of the mercury injection is not able to overcome the capillary force in the very small pore throats, and the ability of the nonwetting-phase fluid to enter the small pore is hampered. Therefore, the effective permeability of single-phase fluid flow can be expressed as follows:
where is the minimum throat radius that fluid can enter, m.
where is the ratio of pores with radius to core pore volume, undefined unit, and is the porosity, undefined unit.
In the actual core pore radius measurement process, pore-throat parameters are often calculated by using the results of the mercury injection experiment. In order to avoid errors during data conversion, mercury injection data are directly used. Meanwhile, the relationship between saturation, porosity, cross-sectional area, and capillary pressure is as follows:
where is the interfacial tension, mN/m; is the contact angle, °; and is the capillary pressure, MPa. Substituting Equation (8) into Equation (7) gives
The mercury injection process can be divided into M stages; while the mercury is injected from capillary n to m, the pressure increases from to and the mercury saturation increases from to . The increment of effective permeability during the process is as follows:
Transforming the accumulation part in Equation (10) gives
During the mercury injection process, the injection pressure is gradually increased, which means :
During the mercury saturation process, , so Equation (11) can be simplified as follows:
Given that the values range of to is just part of the whole design domain, substituting Equation (13) into Equation (10) gives
If the mercury injection process is subdivided into infinitely many segments, , , . The permeability obtained at this time is not the approximate permeability from Equation (14) but rather the accurate single-phase effective permeability that is based on the fractal capillary bundle model:
where is the maximum mercury injection saturation, undefined unit; ; and is the immobile fluid saturation, undefined unit.
According to the capillary pressure curve and the characteristics of the boundary layer, the effective permeability of porous media given the influence of the boundary layer can be calculated by using Equation (15). Afterward, the equation of motion for porous media given the nonlinear seepage characteristics is as follows:
2.3. Two-Phase Oil–Water Relative Permeability Model
The porous media effective permeability model that has been established in this paper on the basis of fractal theory and capillary bundle theory has transformed the pore radius of the traditional fractal permeability model to the saturation of the capillary pressure curve. That could be calculated directly by the saturation to avoid the transformation process of the traditional method. The oil and water occurrence states in the two-phase capillary bundle model are depicted in Figure 2. It is assumed that both oil-wet and water-wet capillaries are contained in the tight core, which is affected by the boundary layer, and that the variation in their ratios is caused by changes in wettability. This will affect the characteristics of the two-phase relative permeability.

Figure 2.
Occurrence state of oil and water in capillary bundle model.
During oil–water two-phase flow in tight oil reservoirs, the effective permeability when irreducible water saturation and residual oil saturation are considered can be expressed as follows:
where is the nonwetting-phase residual saturation, undefined unit, and is the wetting phase residual saturation, undefined unit. Therefore, the two-phase permeability of the seepage process can be expressed as follows:
It can be seen from Equations (17) to (19) that the wetting phase relative permeability is 1 at the nonwetting-phase saturation in this model, which is inconsistent with the actual oil–water two-phase relative permeability curve. The reason is that when the nonwetting phase initially saturates the porous media, the total seepage process can be considered as single-phase seepage; therefore, the relative permeability of the nonwetting phase at the residual wetting-phase saturation is equal to 1. However, as the wetting-phase saturation increases, the nonwetting phase becomes a discontinuous fluid. Part of the nonwetting-phase fluid cannot be displaced and stays in the core, which hinders the seepage process of the wetting-phase fluid, and the relative permeability of the end point cannot increase to 1, which means there is a loss in permeability. When the permeability loss in during two-phase seepage is considered, the relative permeability of the oil–water two-phase process can be expressed as follows:
where and are the permeability loss coefficients of nonwetting and wetting phases, respectively, undefined units. The permeability loss coefficient of the two-phase seepage process can be expressed as follows [41]:
Therefore, the relative permeability of oil and water is
The immovable fluid in tight oil reservoirs can be approximated as the fluid in the nonconnected pores and the immobile boundary layer fluid in the pores. According to fractal theory and capillary bundle theory, during single-phase seepage in the tight reservoir, the saturation of the immobile boundary layer fluid can be expressed as follows:
Therefore, the saturation of immobile fluid during the single-phase seepage process in the tight reservoir is
Given the mixed wetting phenomenon in the tight core [42], and according to the wettability classification standard, the residual wetting-phase saturation and nonwetting-phase saturation are
where is the wettability index, undefined unit.
3. Model Verification
3.1. Verification of Single-Phase Nonlinear Seepage Model
The results from the proposed model in this paper were compared with the nonlinear seepage experiment by Li Yongshou to verify their feasibility [43]. The experiment data from cores X191 and G95 were chosen for the calculation. The basic parameters are shown in Table 1, which includes the capillary pressure curve, as shown in Figure 3, and the model verification results are shown in Figure 4. It is seen from the results that the model in this paper can accurately characterize the nonlinear seepage characteristics in porous media.

Table 1.
Parameters adopted in the single-phase model validation.
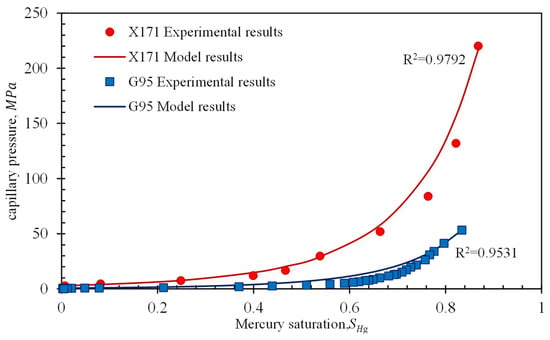
Figure 3.
Comparison of the proposed model’s results and the pressure-controlled porosimetry data.
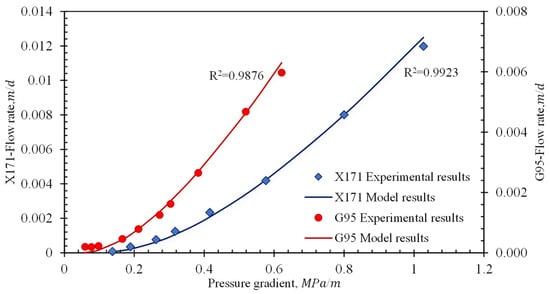
Figure 4.
Comparison of the proposed model’s results and the experimental data.
3.2. Verification of Two-Phase Nonlinear Seepage Model
The simulation results of the oil–water two-phase pore network in the Changqing Oilfield tight reservoir, conducted by He et al. [44]., were used to verify the model, which was based on the single-phase nonlinear seepage model. The wettability of the core was obtained by fitting in He’s simulation. The parameters adopted in the two-phase model validation is shown in Table 2. According to Figure 5, the model in this paper has a good correlation with the results from the literature. The calculation of two-phase relative seepage features for nonlinear seepage characteristics can be realized. The defect of the relative permeability value of the wetting-phase end point, which is 1, is avoided by introducing the permeability loss factor. Similar to Section 3.1, there are still some variations between the experimental results and the model results. This can be attributed partly to the effects of experimental error and partly to the difficulty in collecting the pore structure parameters.

Table 2.
Parameters adopted in the two-phase model validation.
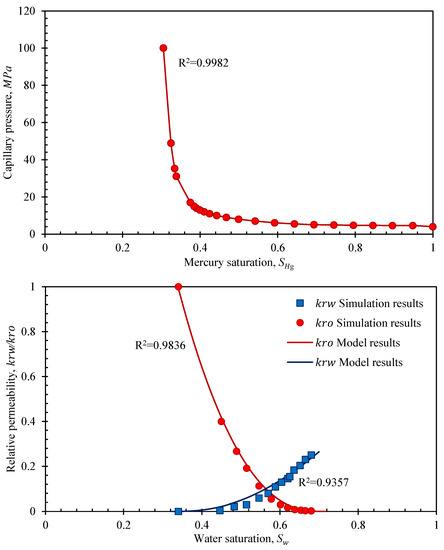
Figure 5.
Validation result of two-phase nonlinear seepage model and its capillary pressure.
4. Results and Discussions
4.1. Sensitivity Analysis of Single-Phase Nonlinear Seepage Model
The influence of pressure gradient on the nonlinear seepage characteristics is shown in Figure 6. The core data are from core X171. It can be seen from Figure 6 that when the pressure gradient increases, the effective permeability increases and gradually tends to become stable. This is because as the pressure gradient increases, the thickness of the boundary layer decreases. This causes the proportion of movable fluid in the micro- and nanopores to increase, and this reduces resistance to fluid flow. Macroscopically, the effective permeability increases with the increase in the pressure gradient. Therefore, increasing the pressure gradient can to a certain extent reduce the nonlinear seepage characteristics of the reservoir. In the case of high fluid viscosity, however, the nonlinear section is longer, and the effect of increasing the pressure gradient on improving the nonlinear seepage characteristics of the reservoir is significantly reduced.
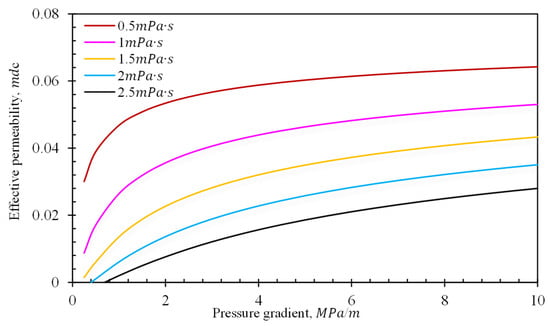
Figure 6.
Effects of pressure gradient on effective permeability.
The influence of reservoir fluid viscosity on the effective permeability of porous media is shown in Figure 7. As the fluid viscosity increases, the effective permeability gradually decreases until it reaches 0 under the same pressure gradient, because as fluid viscosity increases, the thickness of the boundary layer and the ratio of immobile fluid in the micro- or nanopore also increase, as can be seen in Equation (2). This results in greater flow resistance and a significant decrease in permeability at the macroscopic scale.
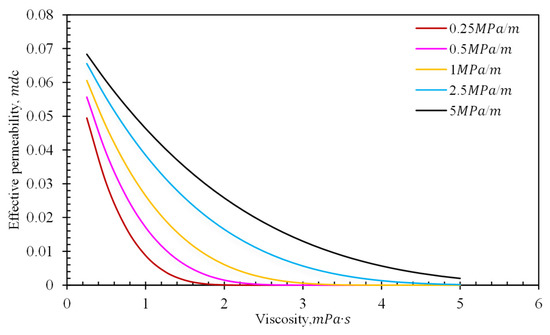
Figure 7.
Effects of viscosity on effective permeability.
In order to discuss the influence of capillary radius distribution on permeability, it is necessary to select representative capillary pressure curves for the model calculations. From the results of high-pressure mercury injection experiments, Huang Xing divided the tight sandstone samples of the Chang 8 reservoir into three types, with different permeabilities and displacement pressures [45]. The parameters used in the calculation are shown in Table 3, and the variations in capillary pressure and effective permeability are presented in Figure 8. As the capillary pressure increases, the pore radius decreases and the fractal dimension of the tortuosity increases. Furthermore, the pore fractal dimension gradually decreases, and this indicates that the pore-throat tortuosity is greater in rock cores with poor physical properties. According to the calculation, as the physical properties of the pore throats deteriorate, the throats become smaller, the displacement pressure increases, and the influence of the boundary layer becomes more significant, resulting in a significant decrease in effective permeability (Y1 < Y3 < Y5).

Table 3.
Fitting and calculation results of pressure-controlled porosimetry data.
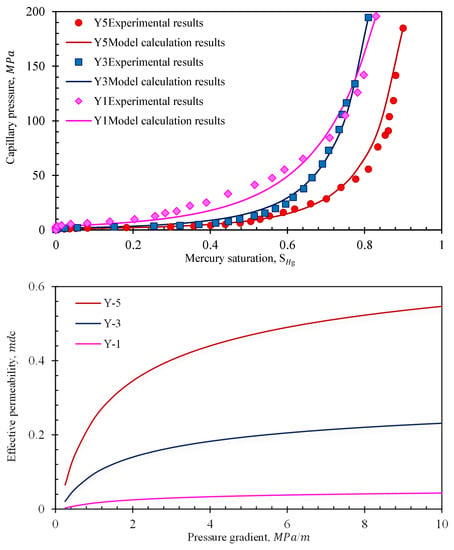
Figure 8.
Fitting of capillary pressure curve and changes in the effective permeability of different type cores.
4.2. Sensitivity Analysis of Two-Phase Nonlinear Seepage Model
In order to discuss the influence of throat distribution characteristics on oil–water two-phase seepage characteristics, three throat distribution types were constructed on the basis of the capillary pressure curves used in the model verification process (as shown in Figure 9). From throat distribution 1 to throat distribution 3, the pore-throat radius gradually decreases, and the physical properties gradually deteriorate. It is found from Figure 9 that as the throat radius increases, the residual wetting-phase saturation and the nonwetting-phase saturation decrease. This makes the two-phase coinfiltration zone become larger, and the relative permeability at the end of the wetting phase increases (permeability loss decreases). This is because as the radius of the pore throat increases, the ratio of the boundary layer in the throat decreases. Therefore, the saturation of the immovable fluid decreases, while the saturation of the movable fluid increases. This makes the range of the two-phase seepage zone become larger, which eventually decreases the flow resistance. This leads to an increase in the relative permeability of the wetting phase at the residual nonwetting-phase saturation.
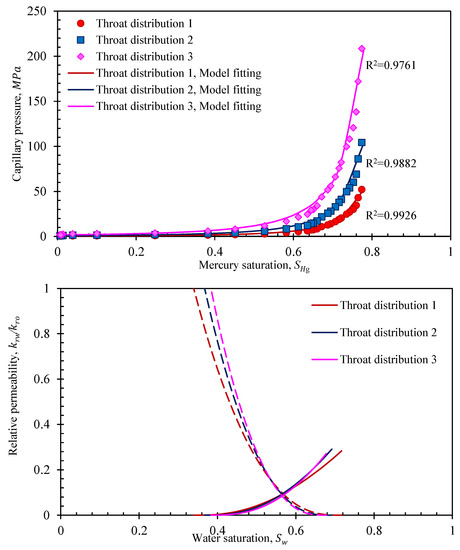
Figure 9.
Fitting of capillary pressure curves for different types of pore-throat distribution and their relative permeabilities.
Figure 10 shows the effect of pressure gradient on the shape of the relative permeability curve. With increasing pressure gradient, both residual saturations of the nonwetting and wetting phases decrease, the two-phase c-infiltration zone extends, and the wetting-phase saturation increases at the residual nonwetting-phase saturation. Under the same saturation of the wetting phase, the relative permeability of the nonwetting phase decreases and the relative permeability of the wetting phase increases. This is because as the pressure gradient increases, the thickness of the boundary layer and the seepage resistance decrease. With further increases in the pressure gradient, the thickness of the boundary layer gradually tends to become stable, and the relative permeability curves gradually tend to coincide.
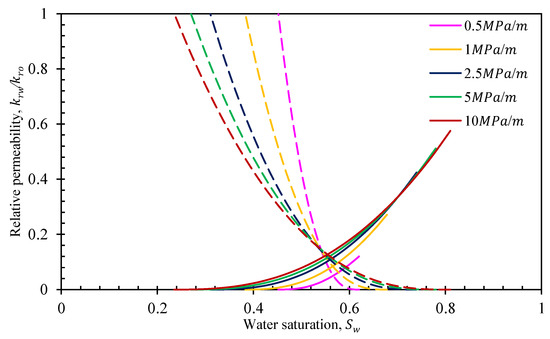
Figure 10.
Effects of pressure gradient on relative permeabilities.
Figure 11 shows the effect of wettability on relative permeability. It can be found that as wettability changes from oil-wet to water-wet, the relative permeability curve and isotonic point gradually shift to the right, bound water saturation increases, residual oil saturation decreases, and water phase relative permeability increases at residual oil saturation. This is because as the wettability gradually changes from oil-wet to water-wet, the number of hydrophilic throats increases, the number of channels available for water flow increases, and the bound water saturation increases. At the same time, the number of oil-wet throats gradually decreases, and the residual oil saturation gradually decreases. Thus, the relative permeability curve gradually shifts to the right, and the relative permeability of the water phase at the end point increases.
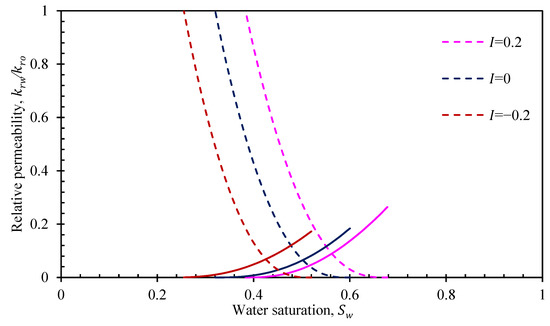
Figure 11.
Effects of wettability on the relative permeabilities.
Figure 12 shows the influence of the viscosity on the relative permeability. An increase in the viscosity of the oil phase leads to a rapid increase in the residual oil saturation, a reduction in the copermeability zone, the relative permeability of the water phase at the residual oil saturation, and the gradual shift of the isotonic point to the right. This is because as the viscosity of the oil phase increases, the thickness of the oil-phase boundary layer increases, resulting in seepage resistance and an increase in the proportion of immovable oil in the pores. The residual oil saturation increases as well, which also gives reasons why the coseepage region for oil–water two-phase flow in tight reservoirs is smaller than that in other conventional reservoirs. Moreover, under a given wettability situation, the ratio of pores for oil-phase and water-phase flow is fixed. The thickness of the water-phase boundary layer would not change with the reduction in the oil-phase seepage capability; therefore, the water phase’s relative permeability would increase at the residual oil saturation.
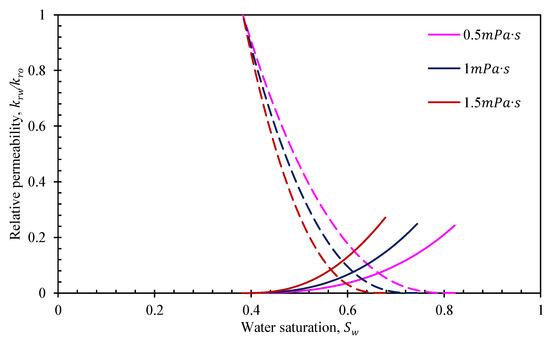
Figure 12.
Effects of viscosity on relative permeabilities.
4.3. Comparative Analysis of the Influencing Parameters of Single-Phase and Two-Phase Seepage Characteristics
According to the sensitivity analysis in Section 4.1 and Section 4.2, different parameters influence the single-phase and two-phase seepage characteristics, which are listed in Table 4. For the single-phase seepage characteristics, the physical parameters affect effective permeability mainly by having effects on the thickness of the boundary layer and the proportion of movable fluid. However, the influence on the two-phase seepage characteristics is mainly due to changes in the relative seepage capacity caused by a change in the ratio of movable fluid in each phase. Therefore, in the actual application process, the full effect of nonlinear seepage characteristics on effective permeability and relative permeability should be considered at the same time.

Table 4.
Comparison of influence of various factors on single-phase and two-phase seepage characteristics.
5. Model Limitation and Prospect
Although the proposed fractal permeability model can reproduce some experimental results and can effectively describe the single-phase and two-phase nonlinear seepage characteristics by using boundary layer theory, this model still suffers from several limitations and deficiencies. These limitations and deficiencies can be considered as prospects for future studies. First of all, although the proposed method can describe the nonlinear seepage characteristics of single-phase and two-phase fluid, incorporating three-phase fluid is still a challenge. Furthermore, temperature also plays a critical role in effective permeability and relative permeability [46], whereby temperature changes alter wettability and change the inhomogeneous distribution of liquid physical properties. However, these effects caused by temperature changes are hardly obtained and quantified. Moreover, the shapes of the pores in this research are assumed as circles. However, in the actual reservoir or tight porous media, which are rich in micro- or nanopores, different cross sections of shapes, such as circle, ellipse, triangle, and so on, exist [47,48]. Moreover, the effects of chemicals such as nanoparticles [49] and surfactants [50] on the transport behavior of multiphase fluid in a tight oil reservoir are yet to be studied. Overcoming the aforementioned limitations is the most direct problem that needs to be solved when one attempts to develop a new analytical model with wide applicability. Although the limitations of the proposed model are detailed in this section, the new model can serve as a basic model. For example, the effects of temperature, the sorption, and the phase transition can be combined to improve the calculation methods of boundary layer thickness and the wettability index, which affect the mechanisms mentioned above. Once the shortcomings mentioned above have been overcome, a more powerful and meaningful model for the transport behavior of fluid in tight porous media can be developed.
6. Conclusions
- A tight reservoir nonlinear seepage numerical model is established on the basis of boundary theory, the capillary pressure curve, and fractal theory. While allowing for the characterization of single-phase and two-phase nonlinear seepage, a direct introduction of mercury injection curves improves the convenience of model application and avoids a solution process that involves complex parameters.
- The single-phase and two-phase nonlinear seepage characteristics of tight oil reservoirs are related directly to pore-throat structure, boundary layer parameters, fluid viscosity, reservoir wettability, and displacement-pressure gradient. The pore-throat structural parameters, or physical property parameters, of the reservoir itself are the key factors that determine the seepage capacity of reservoir fluid. Changing the wettability of the reservoir and increasing the displacement-pressure gradient can effectively improve the seepage capacity of the reservoir fluid.
- The existence of the boundary layer is the main reason for the nonlinear seepage characteristics of tight reservoirs. The influence on the single-phase and two-phase seepage characteristics is mainly from the boundary layer thickness changes under the influence of different environmental conditions and physical property conditions, as well as the change of movable fluid ratio between different fluids.
- The model in this paper does not consider boundary slip, organic matter adsorption, desorption characteristics, or the possible mixed wetting phenomenon in a single capillary. Therefore, this model is not fully applicable to shale reservoirs. Further studies that can be carried out include single-phase and two-phase nonlinear seepage models for organic matter adsorption and desorption, different pore-throat cross-sectional shapes, and complex pore-connectivity conditions.
Author Contributions
Conceptualization, W.L.; Methodology, J.J., Y.Z., W.X., W.L. and S.W.; Software, C.G.; Validation, Y.Z., W.X. and C.G.; Formal analysis, J.J.; Investigation, J.J.; Writing—original draft, Y.Z., W.X., C.G. and W.L.; Writing—review & editing, S.W. All authors have read and agreed to the published version of the manuscript.
Funding
The research was funded by China Petroleum Corporation Technology Project. Research topic on key technologies of CO2 flooding to enhance oil recovery in Changqing Jiyuan ultra-low permeability Ⅲ reservior.
Data Availability Statement
Not applicable.
Conflicts of Interest
The authors declare no conflict of interest.
References
- Huang, S.; Yao, Y.; Zhang, S.; Ji, J.; Ma, R. A Fractal Model for Oil Transport in Tight Porous Media. Transp. Porous Media 2018, 121, 725–739. [Google Scholar] [CrossRef]
- Wang, Y.; Yang, Y.; Wang, K.; Tao, L.; Liu, J.; Wang, C.; Yao, J.; Zhang, K.; Song, W. Changes in relative permeability curves for natural gas hydrate decomposition due to particle migration. J. Nat. Gas Sci. Eng. 2020, 84, 103634. [Google Scholar] [CrossRef]
- Yury, V.I.; Mir-Amal, M.A. Development of a Distributed Control System for the Hydrodynamic Processes of Aquifers, Taking into Account Stochastic Disturbing Factors. Water 2023, 15, 770. [Google Scholar]
- Lei, G.; Dong, Z.; Li, W.; Wen, Q.; Wang, C. Theoretical study on stress sensitivity of fractal porous media with irreducible water. Fractals 2018, 26, 189–199. [Google Scholar] [CrossRef]
- Zhang, T.; Sun, S. A coupled Lattice Boltzmann approach to simulate gas flow and transport in shale reservoirs with dynamic sorption. Fuel 2019, 246, 196–203. [Google Scholar] [CrossRef]
- Li, J.; Li, X.; Chen, Z.; Wang, X.; Wu, L.; Sun, Z.; Qu, S. Permeability model for gas transport through shale nanopores with irreducible water saturation. Pet. Sci. Bull. 2018, 3, 167–182. [Google Scholar]
- Huang, T.; Li, E.; Tao, Z.; Guo, X. A nonlinear seepage model of gas and water transport in multi-scale shale gas reservoirs based on dynamic permeability. J. Geophys. Eng. 2018, 15, 1255–1268. [Google Scholar] [CrossRef]
- Afsharpoor, A.; Javadpour, F. Liquid slip flow in a network of shale noncircular nanopores. Fuel 2016, 180, 580–590. [Google Scholar] [CrossRef]
- Hayat, T.; Tasawar, Z.; Hussain, A.; Ahmad, B. Numerical study for slip flow of carbon-water nanofluids. Comput. Methods Appl. Mech. Eng. 2017, 319, 366–378. [Google Scholar] [CrossRef]
- Morteza, D. Dispersion in non-Newtonian fluid flows in a conduit with porous walls. Chem. Eng. Sci. 2018, 189, 296–310. [Google Scholar]
- Stephen, W. Flow in Porous Media I: A Theoretical Derivation of Darcy’s Law. Transp. Porous Media 1986, 1, 3–25. [Google Scholar]
- Zhang, Q.; Chan, K.; Quirke, N. Molecular dynamics simulation of water confined in a nanopore of amorphous silica. Mol. Simul. 2009, 35, 1215–1223. [Google Scholar] [CrossRef]
- Renou, R.; Szymczyk, A.; Ghoufi, A. Influence of the pore length on the properties of water confined in a silica nanopore. Mol. Phys. 2014, 112, 2275–2281. [Google Scholar] [CrossRef]
- Jin, Z.; Firoozabadi, A. Effect of water on methane and carbon dioxide sorption in clay minerals by Monte Carlo simulations. Fluid Phase Equilibria 2014, 382, 10–20. [Google Scholar] [CrossRef]
- Tao, J.; Song, X.; Zhao, T.; Zhao, S.; Liu, H. Confinement Effect on Water Transport in CNT Membranes. Chem. Eng. Sci. 2018, 192, 1252–1259. [Google Scholar] [CrossRef]
- Yao, Y.; Ge, J. Characteristics of non-Darcy flow in low-permeability reservoirs. Pet. Sci. 2011, 8, 55–62. [Google Scholar] [CrossRef]
- Prada, A.; Civan, F. Modification of Darcy’s law for the threshold pressure gradient. J. Pet. Sci. Eng. 1999, 22, 237–240. [Google Scholar] [CrossRef]
- Deng, Y.; Liu, C. Mathematical model of nonlinear flow in low permeability porous media and its application. Acta Pet. Sin. 2001, 22, 72–77. [Google Scholar]
- Shi, Y.; Yang, Z.; Huang, Y. Study on non-linear seepage flow model for low-permeability reservoir. Acta Pet. Sin. 2009, 30, 731–734. [Google Scholar]
- Yang, R.; Jiang, R.; Liu, S. Demonstration of essentiality of considering nonlinear flow in low permeability reservoir. Fault-Block Oil Gas Field 2011, 18, 493–497. [Google Scholar]
- Cai, J. A fractal approach to low velocity non-Darcy flow in a low permeability porous medium. Chin. Phys. B 2014, 23, 044701. [Google Scholar] [CrossRef]
- Su, H.; Zhang, S.; Sun, Y.; Wang, X.; Yu, B.; Wang, Y.; Yu, M.; Yang, M.; Meng, W.; Yi, H.; et al. A comprehensive model for oil-wat relative permabilitis in low permeability reservoirs by fractal theory. Fractals 2020, 28, 2050055. [Google Scholar] [CrossRef]
- Huang, Y. Nonlinear percolation feature in low permeability reservoir. Spec. Oil Gas Reserve 1997, 4, 9–14. [Google Scholar]
- Jiang, R.; Li, L.; Xu, J.; Yang, R.; Zhuang, Y. A nonlinear mathematical model for low-permeability reservoirs and well-testing analysis. Acta Pet. Sin. 2012, 33, 264–268. [Google Scholar]
- Xu, S.; Yue, X.; Hou, J.; Wang, B. Influence of boundary-layer fluid on the seepage characteristic of low-permeability reservoir. J. Xian Shiyou Univ. (Nat. Sci. Ed.) 2007, 22, 26–28. [Google Scholar]
- Ren, X.; Li, A.; Fu, S.; Wang, S. Experimental study on the oil-water relative permeability relationship for tight sandstone considering the nonlinear seepage characteristics. J. Pet. Sci. Eng. 2018, 161, 409–416. [Google Scholar] [CrossRef]
- Su, H.; Wang, D.; Zhang, P.; An, Y.; Fu, Y.; Lu, J.; Huang, F.; Zhang, H.; Ren, Z.; Li, Z. A new method to calculate the relative permeability of oil and water in tight oil reservoirs by considering the nonlinear flow. Geofluids 2022, 2022, 9450967. [Google Scholar] [CrossRef]
- Zeng, J.; Cheng, S.; Kong, X.; Guo, K.; Wang, H. Non-Darcy flow in oil accumulation (oil displacing water) and relative permeability and oil saturation characteristics of low-permeability sandstones. Pet. Sci. 2010, 7, 20–30. [Google Scholar] [CrossRef]
- Joekar-Niasar, V.; Hassanizadeh, S.; Leijnse, A. Insights into the relationships among capillary pressure, saturation, interfacial area and relative permeability using pore-network modeling. Transp. Porous Media 2008, 74, 201–219. [Google Scholar] [CrossRef]
- Gharbi, O.; Blunt, M. The impact of wettability and connectivity on relative permeability in carbonates: A pore network modeling analysis. Water Resour. Res. 2012, 48, 1–14. [Google Scholar] [CrossRef]
- Mcdougall, S.; Cruickshank, J.; Sorbie, K. Anchoring methodologies for pore-scale network models: Application to relative permeability and capillary pressure prediction. Petrophysics 2002, 43, 365–375. [Google Scholar]
- Olafuyi, O. Prediction of multiphase flow properties from network models. J. Niger. Assoc. Math. Phys. 2013, 19, 1116–1134. [Google Scholar]
- Stone, H. Probability model for estimating three-phase relative permeability. J. Pet. Technol. 1970, 22, 214–218. [Google Scholar] [CrossRef]
- Oostrom, R. A parametric model for predicting relative permeability-saturation-capillary pressure relationships of oil-water systems in porous media with mixed wettability. Transp. Porous Media 1998, 31, 109–131. [Google Scholar]
- Su, H.; Zhang, S.; Sun, Y.; Yu, J.; Yang, M.; Meng, W.; Wang, Y.; Yu, M. Oil-water relative permeability model of low permeability reservoir based on fractal theory. Pet. Geol. Recovery Eff. 2020, 27, 67–78. [Google Scholar]
- Lei, G.; Dong, P.C.; Mo, S.Y.; Gai, S.H.; Wu, Z.S. A novel fractal model for two-phase relative permeability in porous media. Fractals-Complex Geom. Patterns Scaling Nat. Soc. 2015, 23, 1550017. [Google Scholar] [CrossRef]
- Ahmadlouydarab, M.; Liu, Z.S.; Feng, J.J. Relative permeability for two-phase flow through corrugated tubes as model porous media. Int. J. Multiph. Flow 2012, 47, 85–93. [Google Scholar] [CrossRef]
- Standnes, D.; Evje, S.; Andersen, P.S. A novel relative permeability model based on mixture theory approach accounting for solid–fluid and fluid–fluid interactions. Transp. Porous Media 2017, 119, 707–738. [Google Scholar] [CrossRef]
- Li, K. More general capillary pressure and relative permeability models from fractal geometry. J. Contam. Hydrol. 2010, 111, 13–24. [Google Scholar] [CrossRef]
- Tian, X.; Cheng, L.; Yan, Y.; Liu, H.; Zhao, W.; Guo, Q. An improved solution to estimate relative permeability in tight oil reservoirs. J. Pet. Explor. Prod. Technol. 2015, 5, 305–314. [Google Scholar] [CrossRef]
- Burdine, N. Relative permeability calculations from pore size distribution data. J. Pet. Technol. 1953, 98, 71–78. [Google Scholar] [CrossRef]
- Tiab, D.; Donaldson, E. Petrophysics; Gulf Professional Publishing: Amsterdam, The Netherlands, 2003. [Google Scholar]
- Li, Y.; Zheng, H.; He, Z.; Yan, Y. The study on characterization of non-linear unstable flow in ultra-low-permeability reservoirs. Sci. Technol. Eng. 2012, 20, 9480–9485. [Google Scholar]
- He, M.; Zhou, Y.; Wu, K.; Hu, Y.; Feng, D.; Zhang, T.; Liu, Q.; Li, X. Pore network modeling of thin water film and its influence on relative permeability curves in tight formations. Fuel 2021, 289, 119828. [Google Scholar] [CrossRef]
- Huang, X. Fine Characterization of Microscopic Characteristics of Tight Sandstone Reservoir and Evaluation of Remaining Oil after Water Flooding. Ph.D. Thesis, China University of Petroleum, Beijing, China, 2017. [Google Scholar]
- Wang, H. A Two-Phase Flow Theory for Thermal-Moisture-Hydro-Mechanical Multi-Physical Coupling in Fractured Shale. Ph.D. Thesis, University of Tasmania, Hobart, Australia, 2021. [Google Scholar]
- Sun, Z.; Shi, J.; Wu, K.; Li, X. Gas flow behavior through inorganic nanopores in shale considering confinement effect and moisture content. Ind. Eng. Chem. Res. 2018, 57, 3430–3440. [Google Scholar] [CrossRef]
- Sun, Z.; Wu, K.; Shi, J.; Zhang, T.; Feng, D.; Huang, L.; Li, X. An analytical model for transport capacity of water confined in nanopores. Int. J. Heat Mass Transf. 2019, 138, 620–630. [Google Scholar] [CrossRef]
- Khormali, A.; Koochi, M.R.; Varfolomeev, M.A.; Ahmadi, S. Experimental study of the low salinity water injection process in the presence of scale inhibitor and various nanoparticles. J. Pet. Explor. Prod. Technol. 2023, 13, 903–916. [Google Scholar] [CrossRef]
- Kalaei, M.; Green, D.; Willhite, G. A new dynamic wettability-alteration model for oil-wet cores during surfactant-solution imbibition. SPE J. 2012, 18, 109–122. [Google Scholar]
Disclaimer/Publisher’s Note: The statements, opinions and data contained in all publications are solely those of the individual author(s) and contributor(s) and not of MDPI and/or the editor(s). MDPI and/or the editor(s) disclaim responsibility for any injury to people or property resulting from any ideas, methods, instructions or products referred to in the content. |
© 2023 by the authors. Licensee MDPI, Basel, Switzerland. This article is an open access article distributed under the terms and conditions of the Creative Commons Attribution (CC BY) license (https://creativecommons.org/licenses/by/4.0/).