
Eventual Increase in Solar Electricity Production and Desalinated Water through the Formation of a Channel between the Mediterranean and the Dead Sea


Abstract
1. Introduction
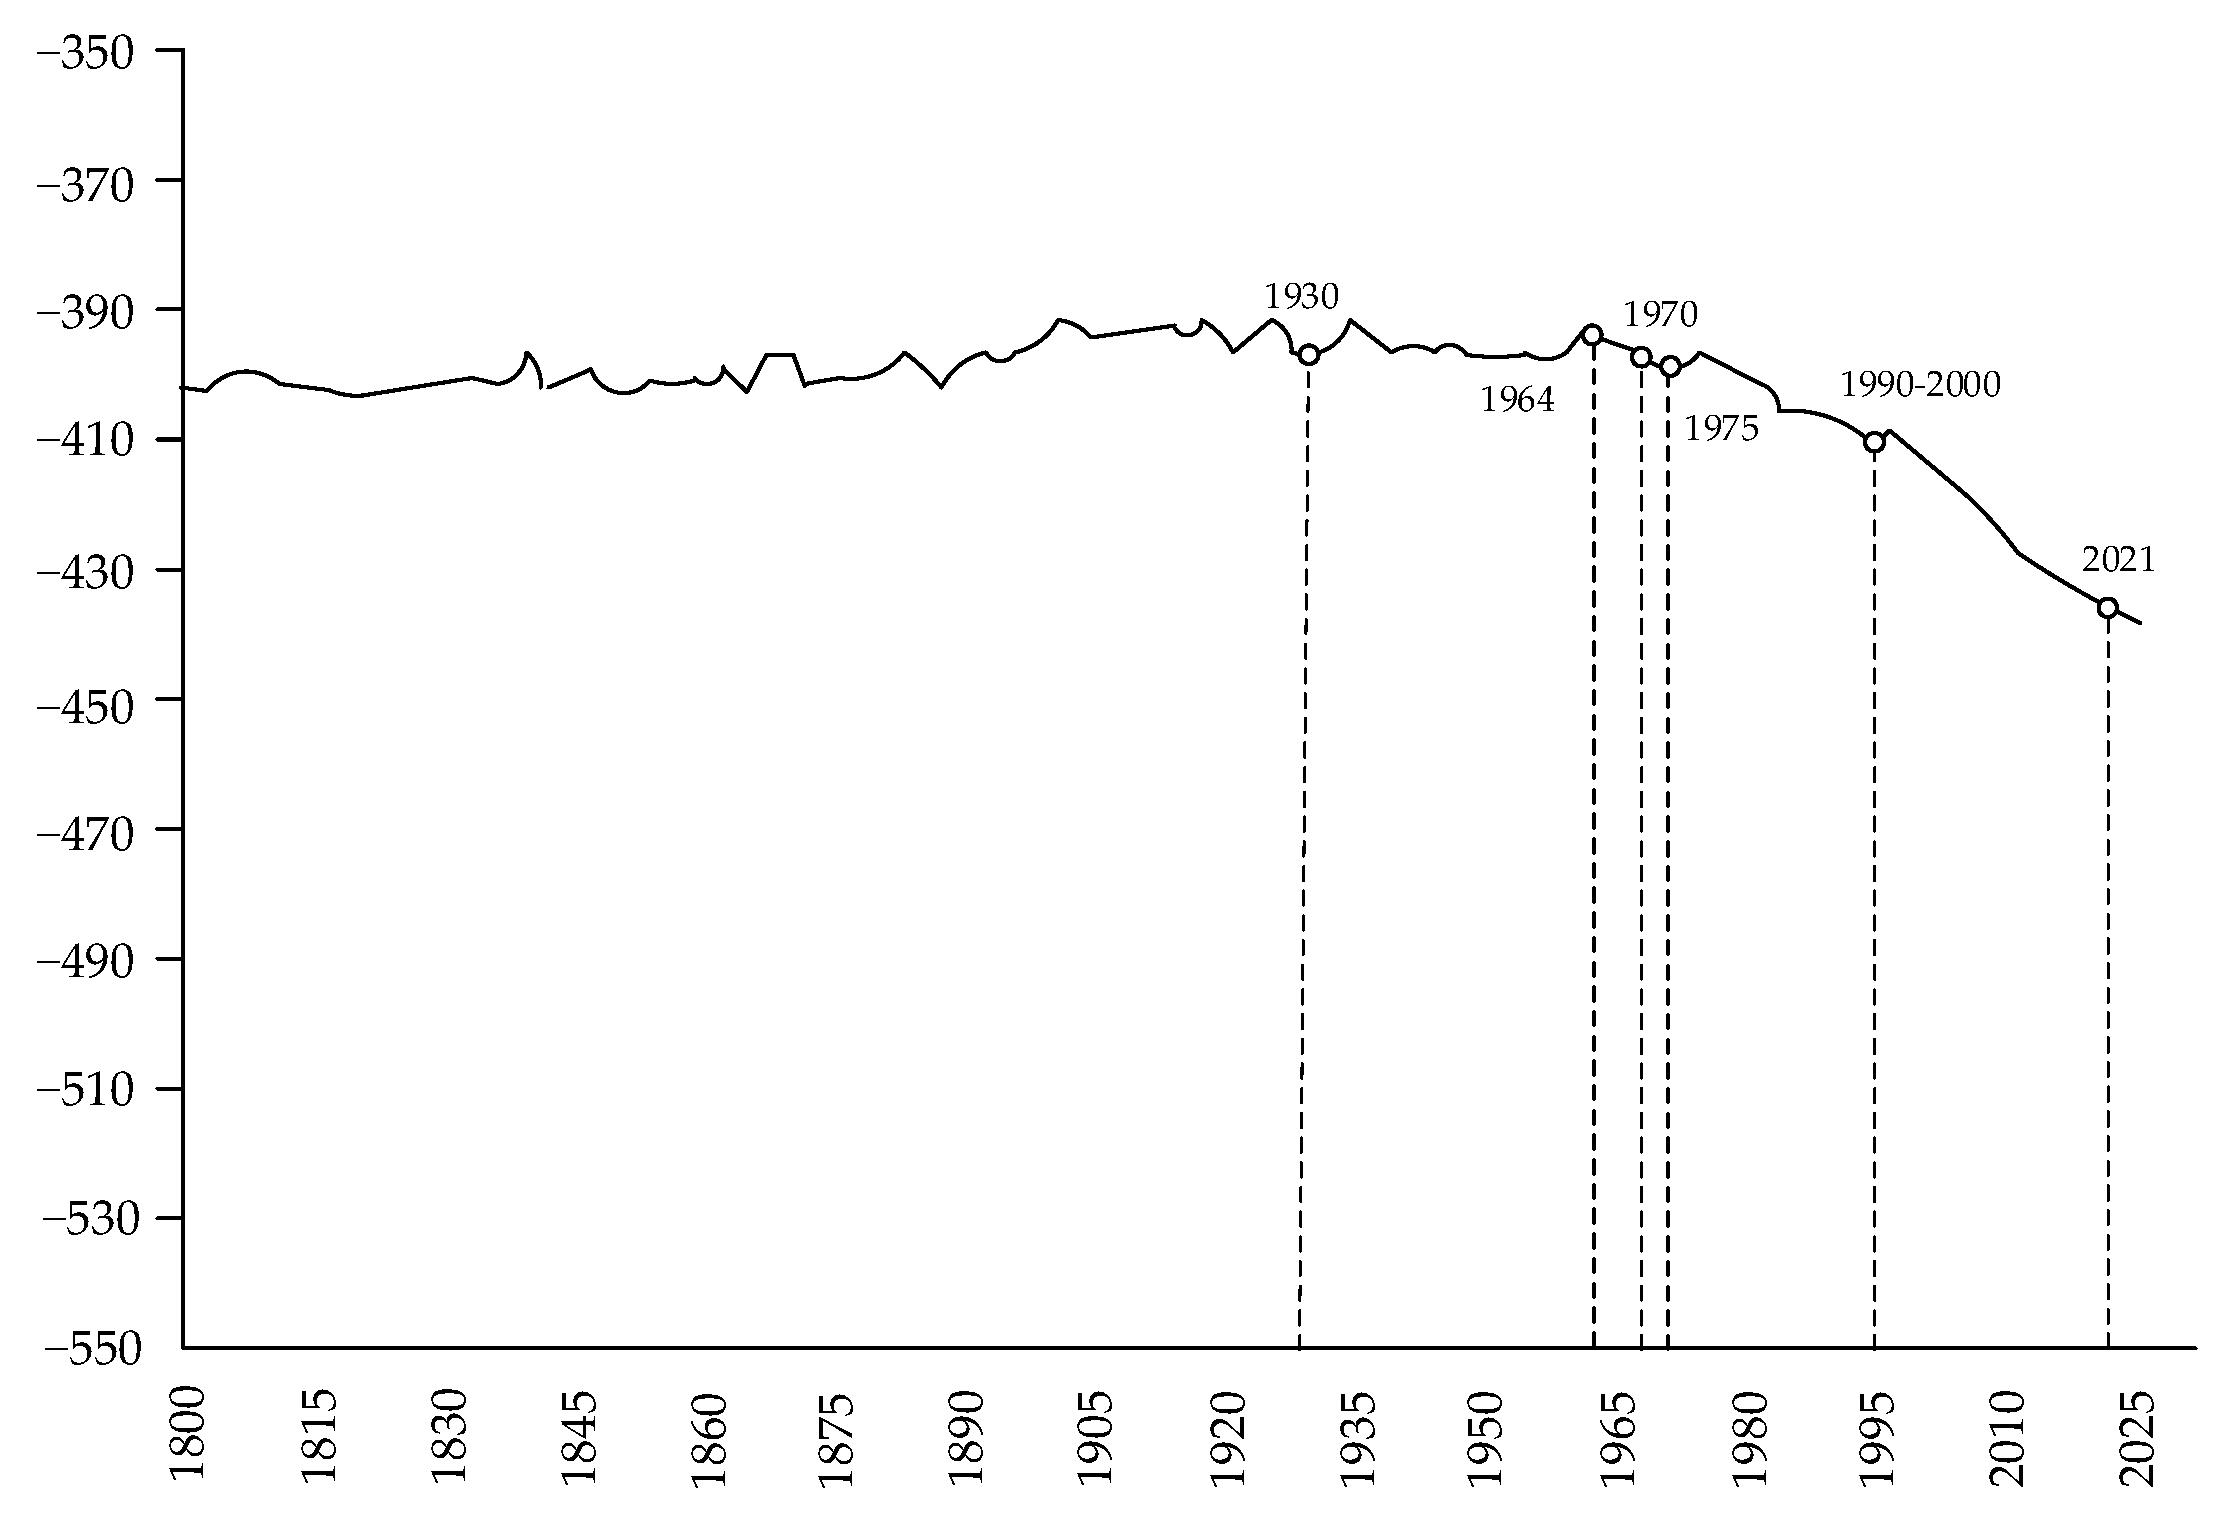
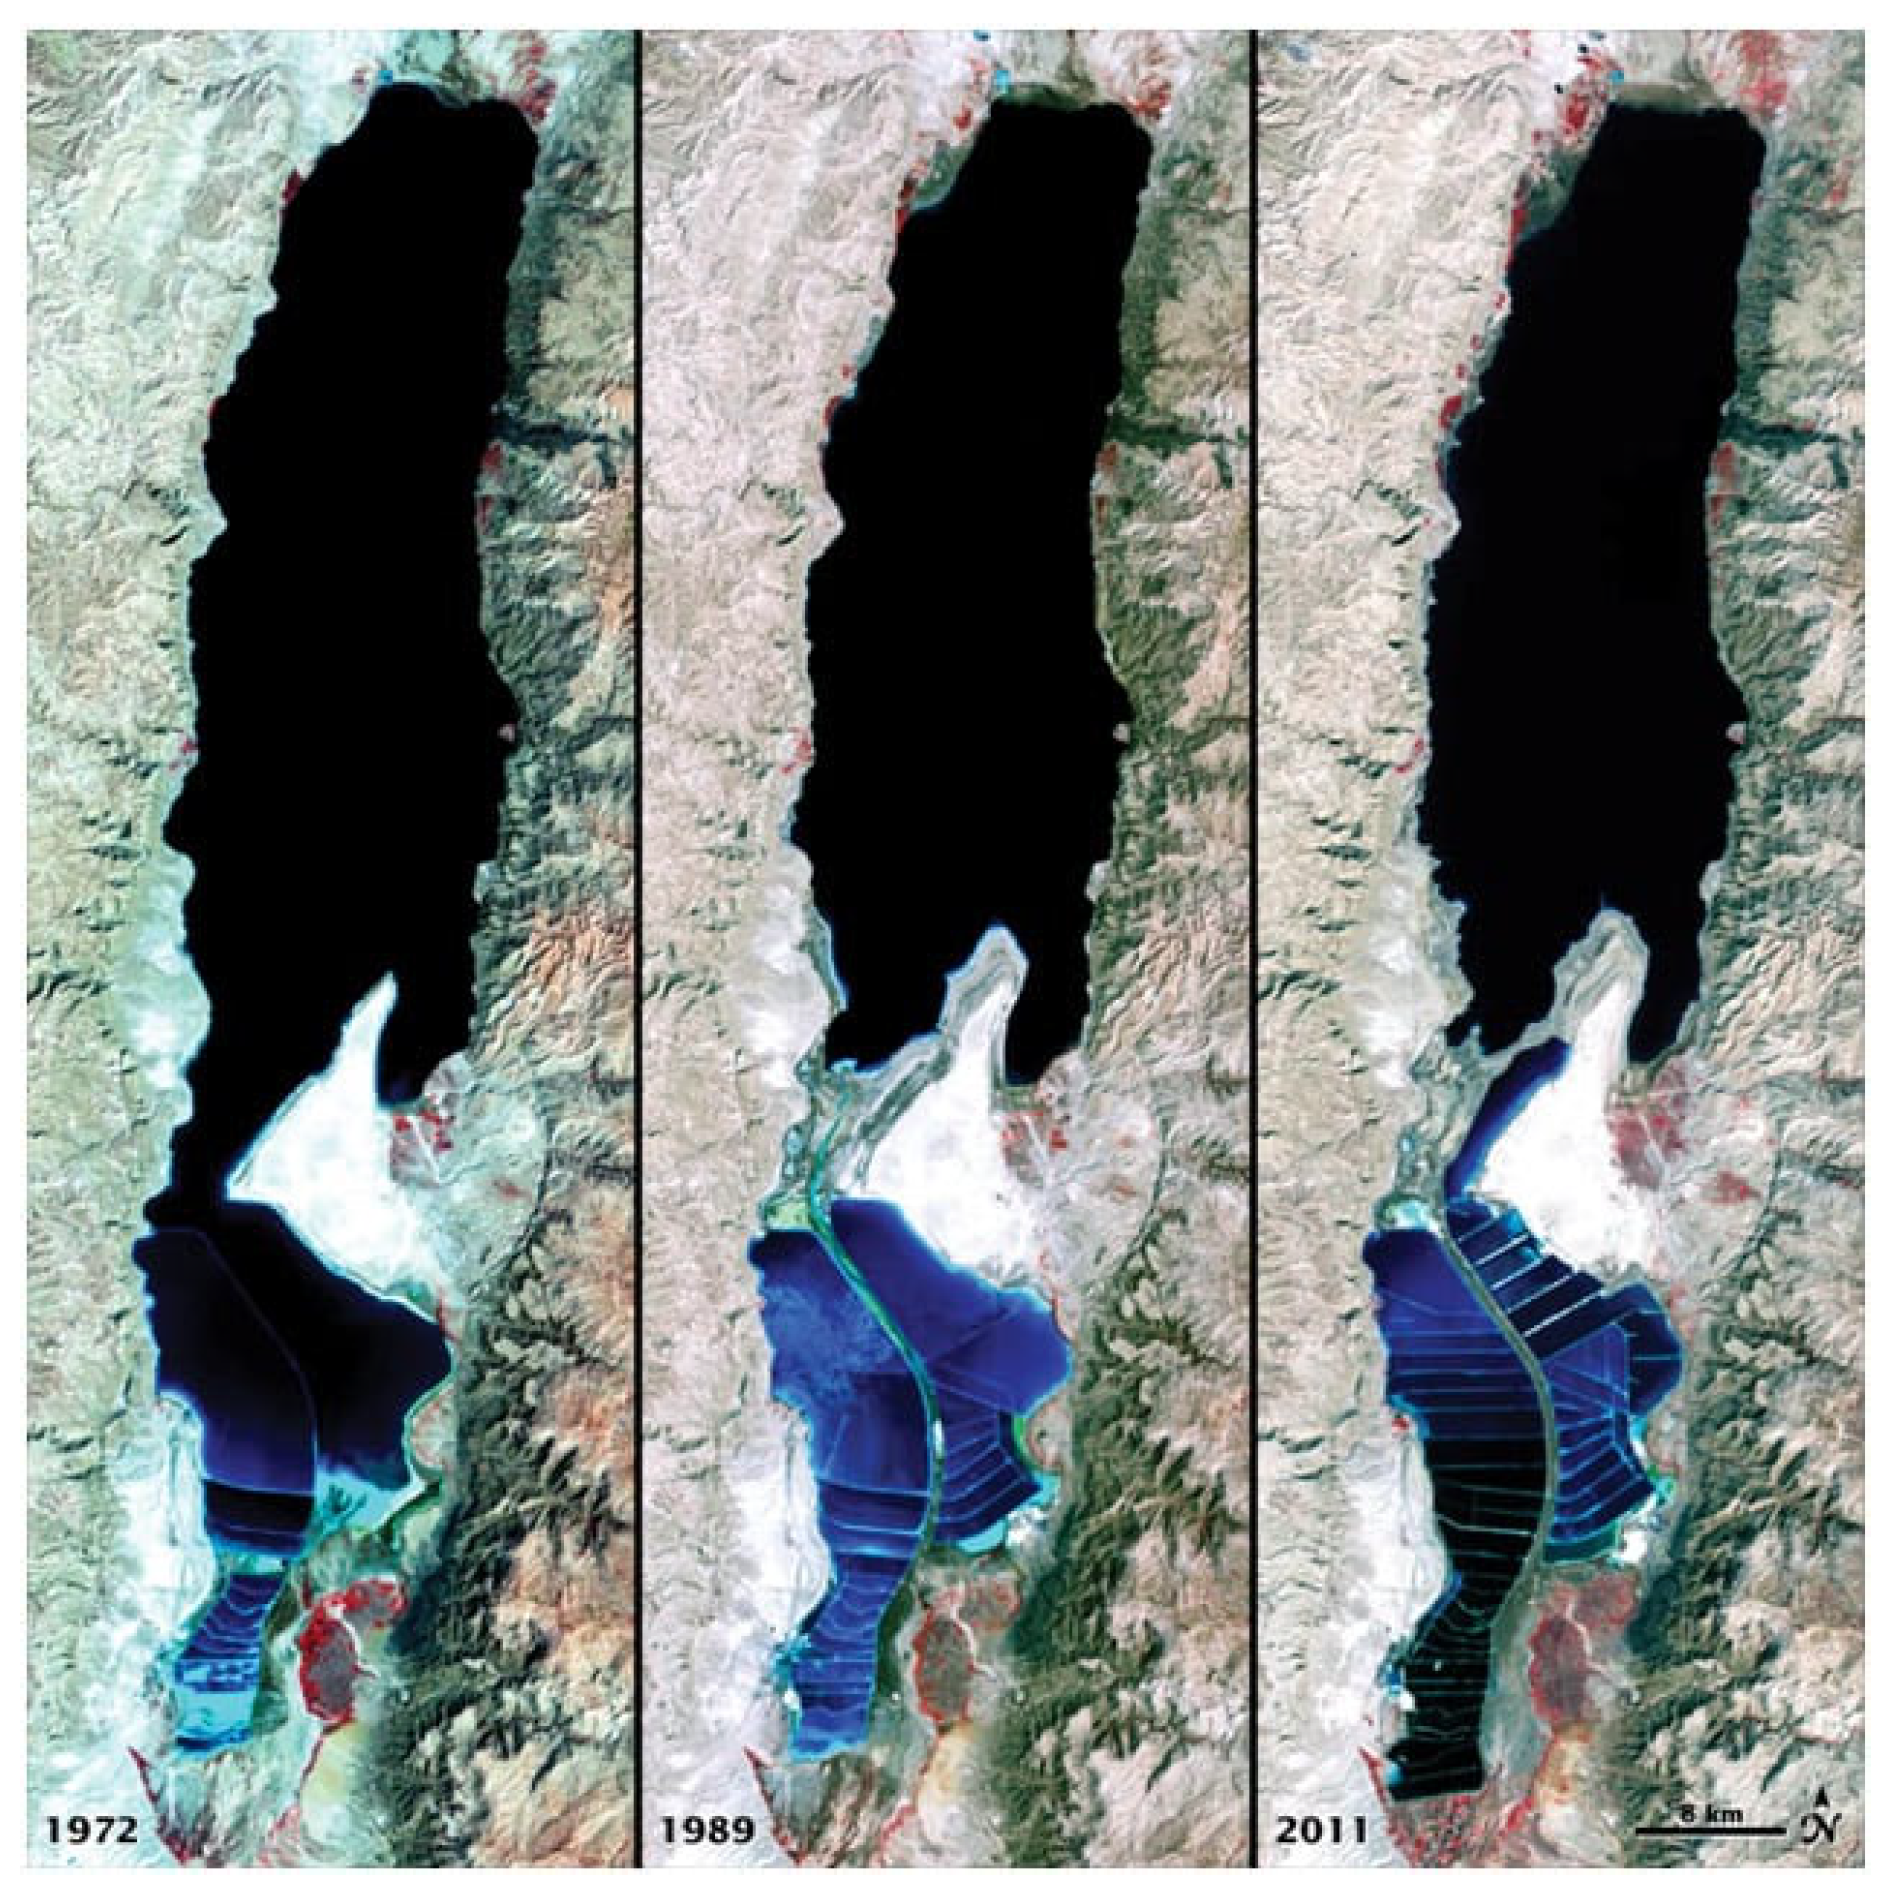
2. Dead Sea Review
3. Methods
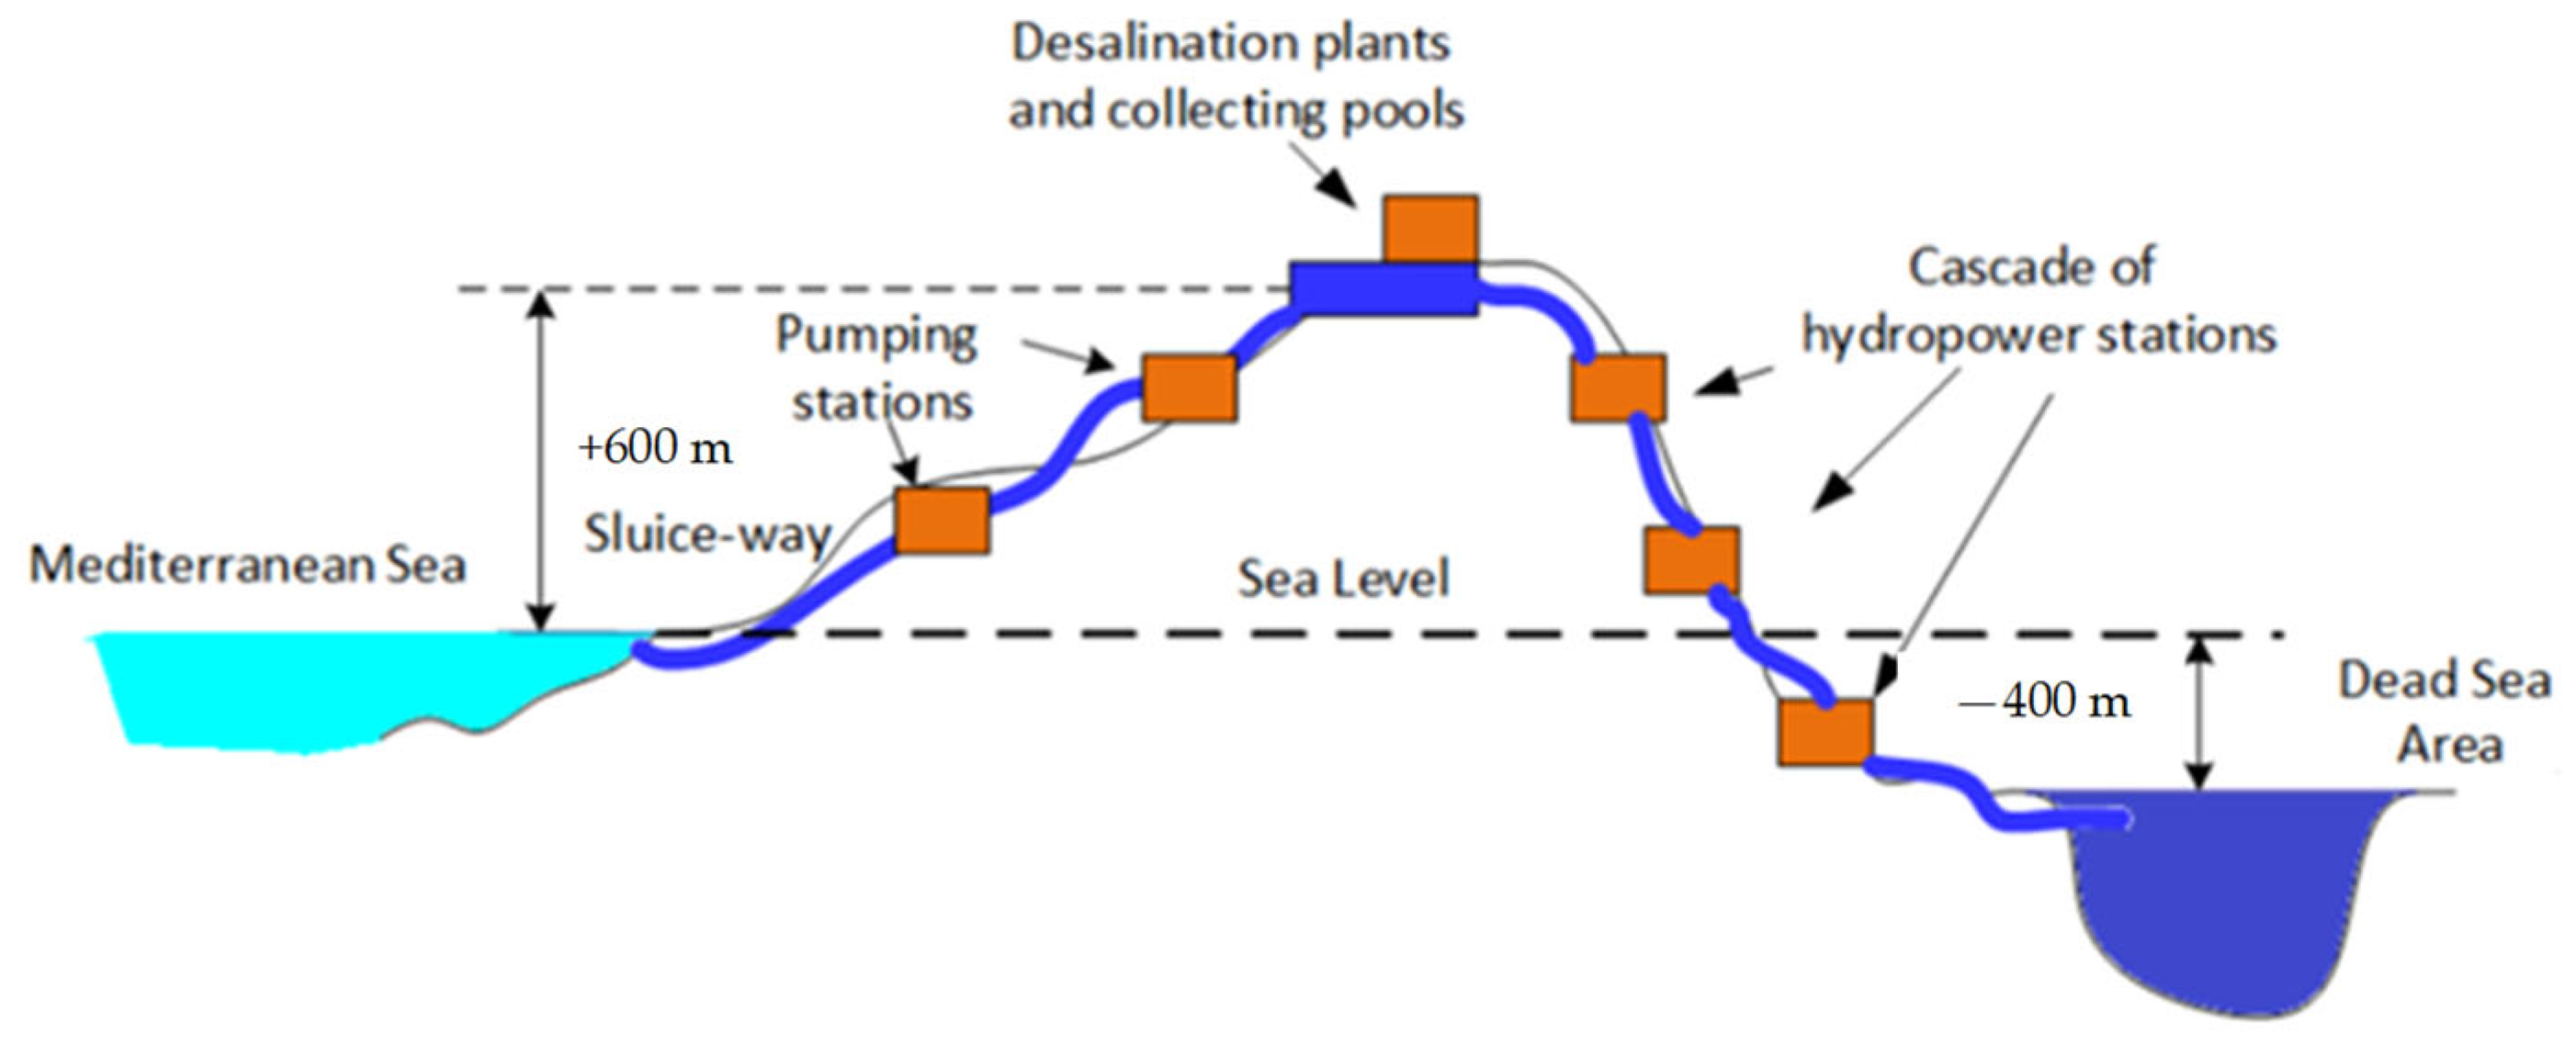
3.1. The Schematic Diagram of a Domestic Electric Power System Combines Conventional Generating Facilities with PV Plants and Hydro-Power Storage
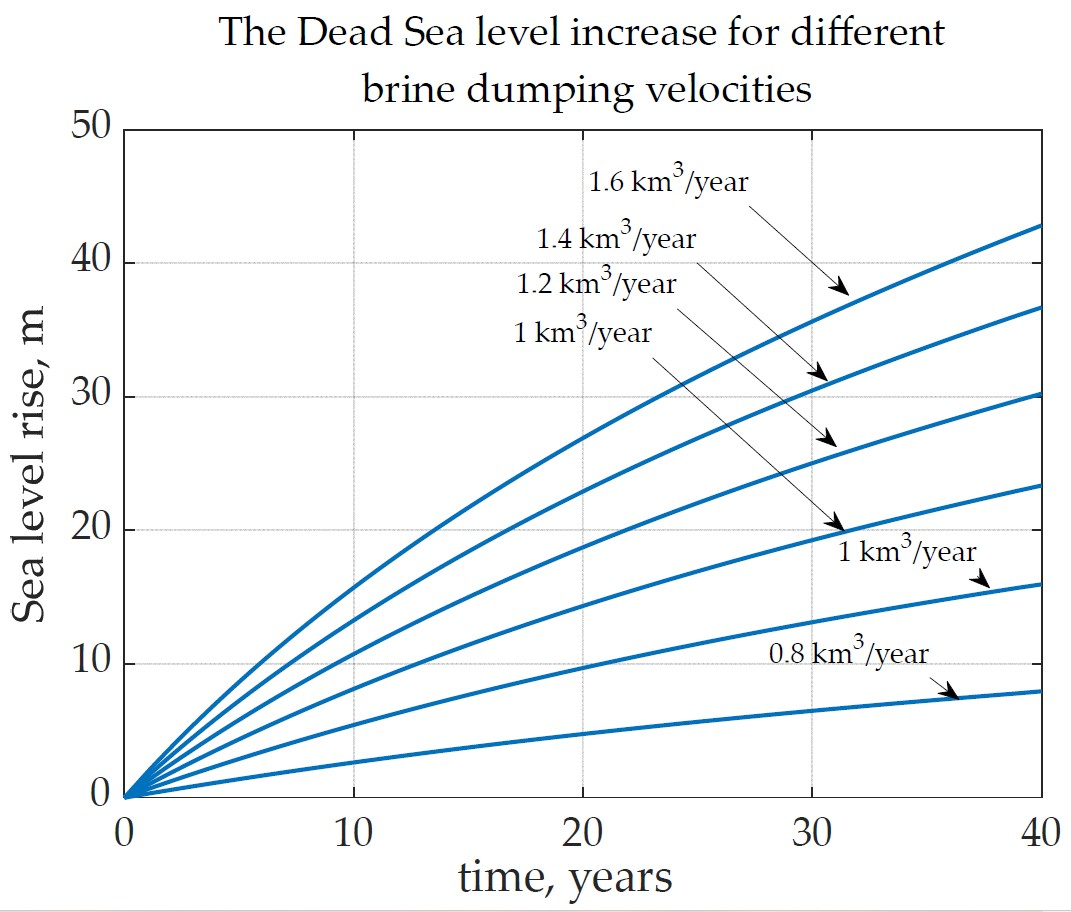
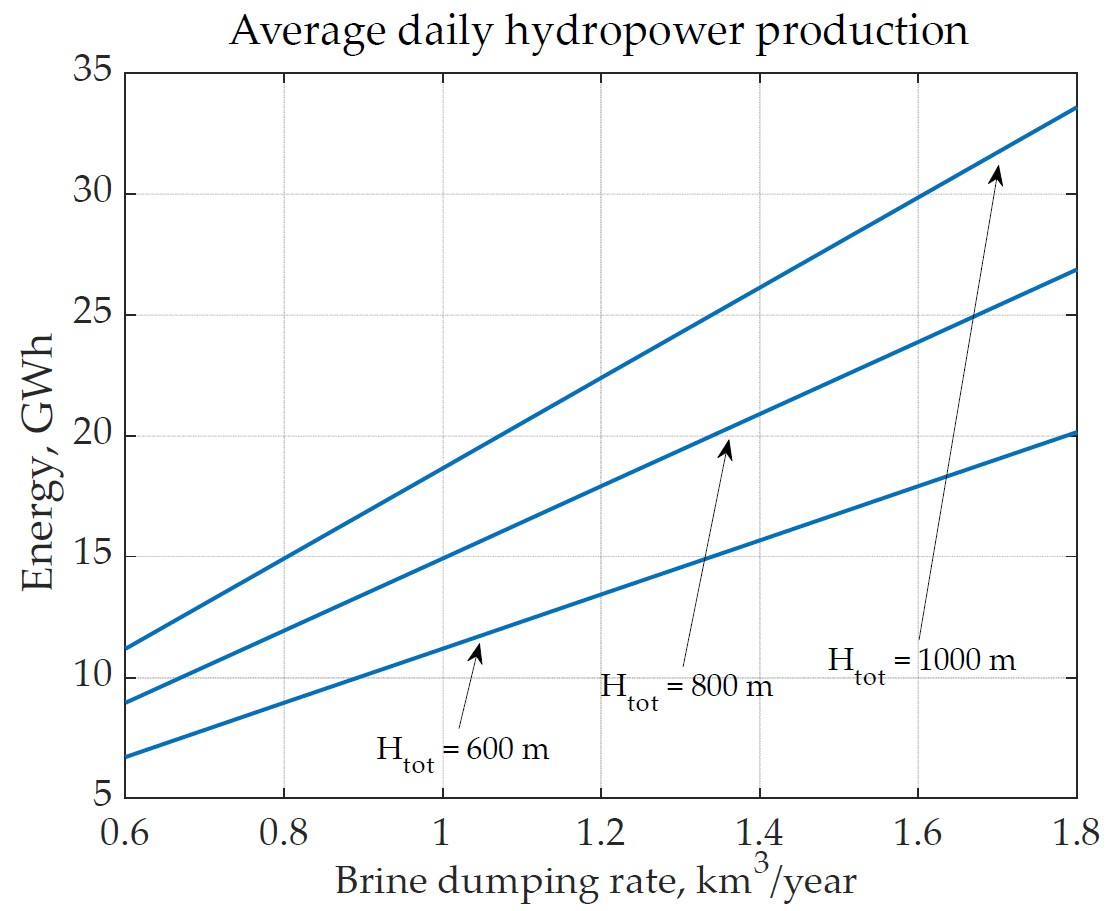
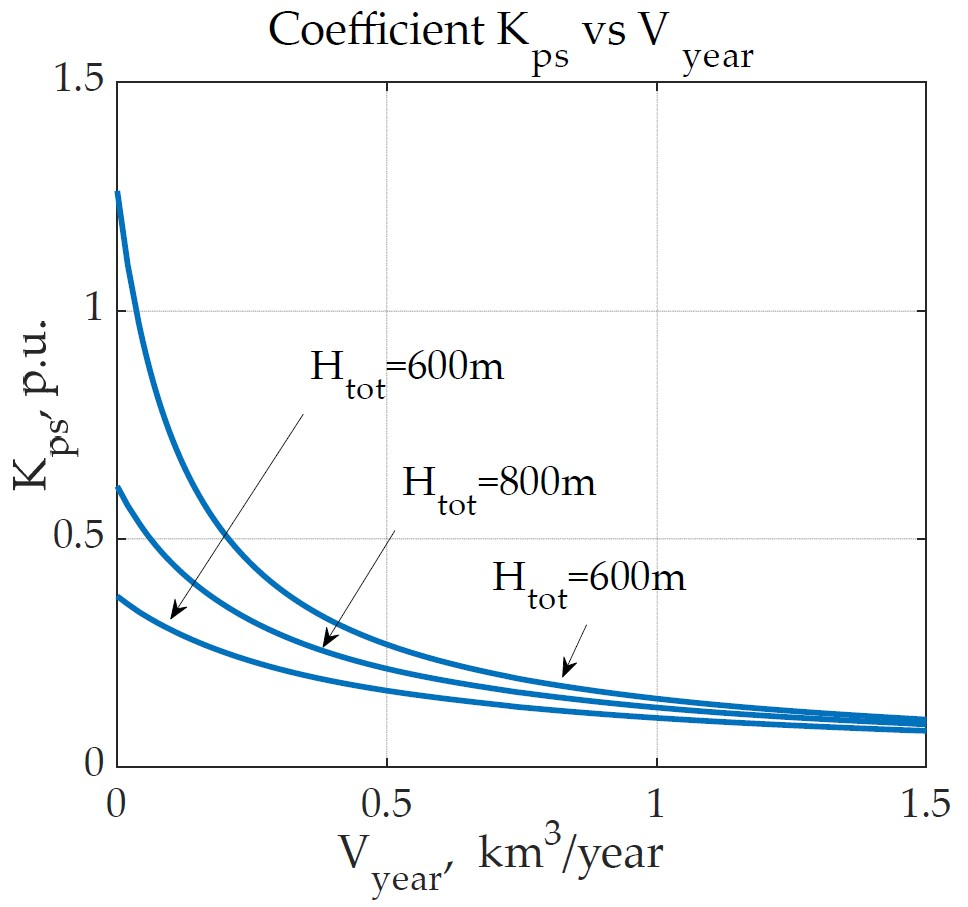
3.2. Estimation of the Dead Sea Level Increase as per the Dumping of the Sea Water
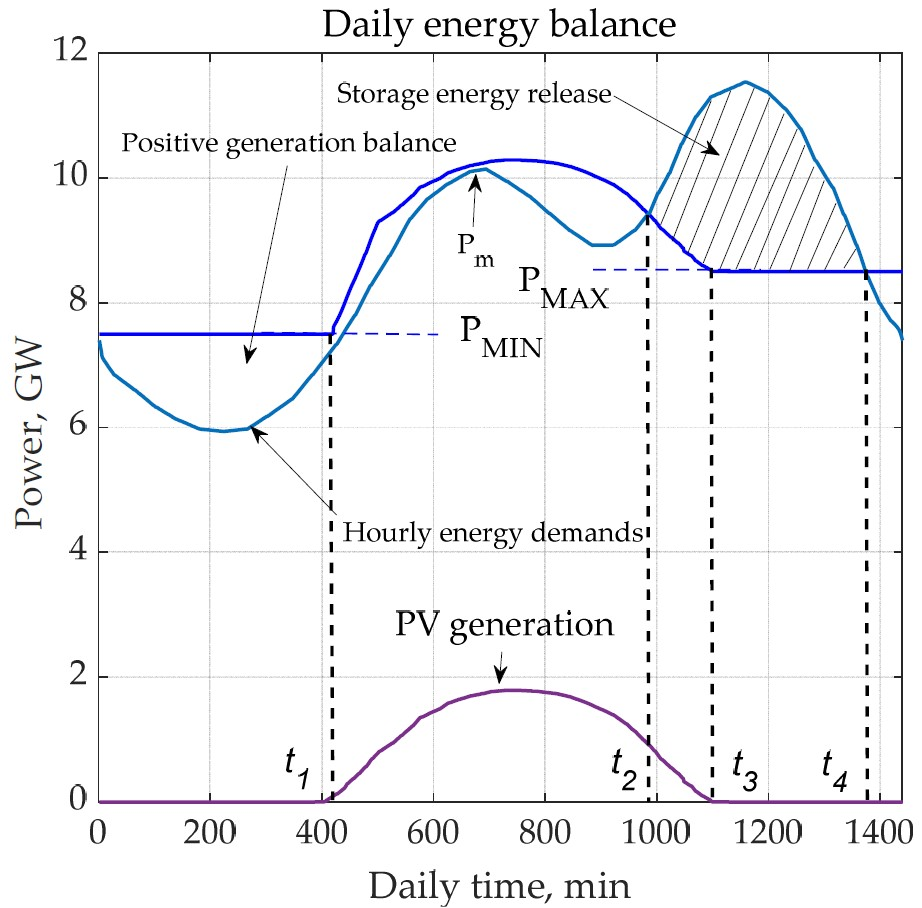
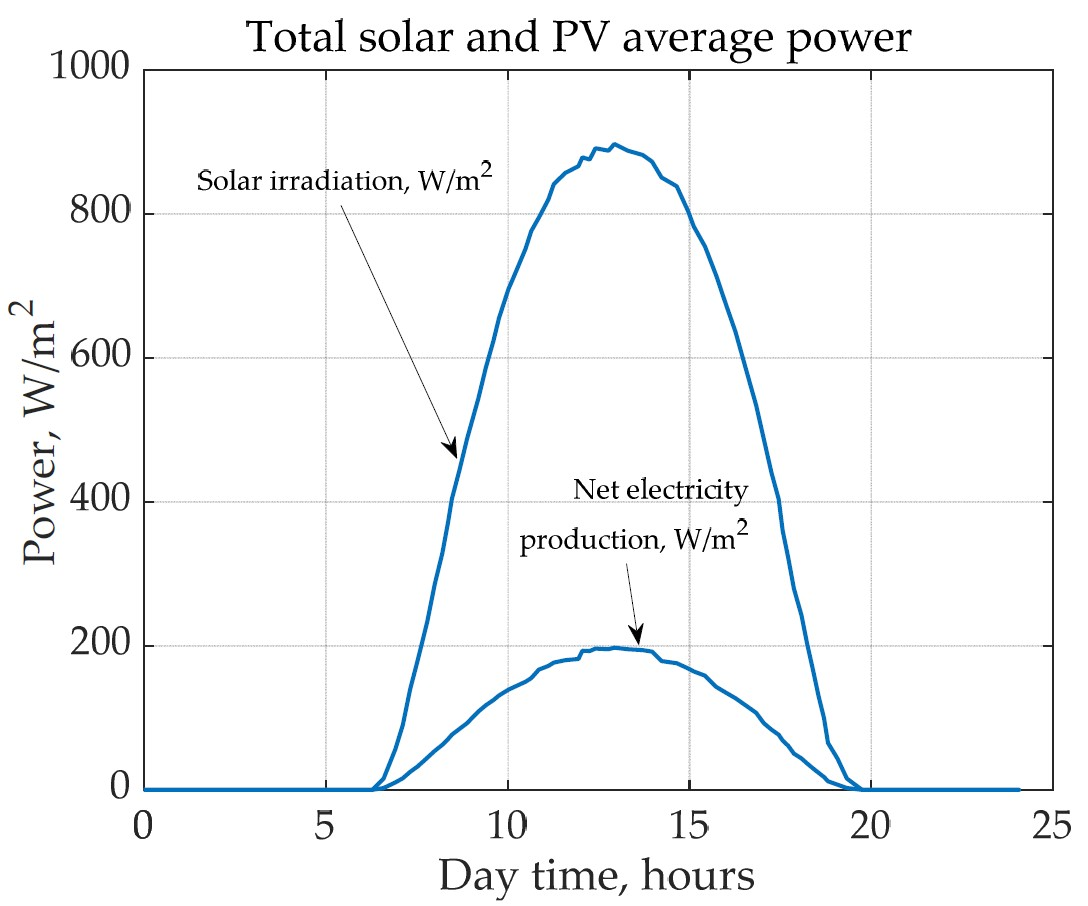
3.3. Analysis of the Electricity Demands and Hypothetical Solar Electricity Production
4. Results
5. Discussion
6. Conclusions
Author Contributions
Funding
Data Availability Statement
Conflicts of Interest
References
- Macedo, S.F.; Peyerl, D. Prospects and economic feasibility analysis of wind and solar photovoltaic hybrid systems for hydrogen production and storage: A case study of the Brazilian electric power sector. Int. J. Hydrogen Energy 2022, 47, 10460–10473. [Google Scholar] [CrossRef]
- Spyridonidou, S.; Sismani, G.; Loukogeorgaki, E.; Vagiona, D.G.; Ulanovsky, H.; Madar, D. Sustainable spatial energy planning of large-scale wind and PV farms in Israel: A collaborative and participatory planning approach. Energies 2021, 14, 551. [Google Scholar] [CrossRef]
- Prados, M.; Iglesias-Pascual, R.; Barral, Á. Energy transition and community participation in portugal, greece and israel: Regional differences from a multi-level perspective. Energy Res. Soc. Sci. 2022, 87, 102467. [Google Scholar] [CrossRef]
- Ashwarya, S. Israel’s Renewable Energy Strategy: A Review of its Stated Goals, Current Status, and Future Prospects. Percept. J. Int. Aff. 2021, 26, 321–340. [Google Scholar]
- Milstein, I.; Tishler, A.; Woo, C. Wholesale electricity market economics of solar generation in Israel. Util. Policy 2022, 79, 101443. [Google Scholar] [CrossRef]
- Guttikunda, S.K.; Jawahar, P. Atmospheric emissions and pollution from the coal-fired thermal power plants in India. Atmos. Environ. 2014, 92, 449–460. [Google Scholar] [CrossRef]
- Shu, Y.; Hu, J.; Zhang, S.; Schöpp, W.; Tang, W.; Du, J.; Cofala, J.; Kiesewetter, G.; Sander, R.; Winiwarter, W. Analysis of the air pollution reduction and climate change mitigation effects of the Three-Year Action Plan for Blue Skies on the “2 26” Cities in China. Environ. Manag. 2022, 317, 115455. [Google Scholar] [CrossRef]
- Arcos-Vargas, A.; Cansino, J.M.; Román-Collado, R. Economic and environmental analysis of a residential PV system: A profitable contribution to the Paris agreement. Renew. Sustain. Energy Rev. 2018, 94, 1024–1035. [Google Scholar] [CrossRef]
- Glenk, G.; Meier, R.; Reichelstein, S. Cost dynamics of clean energy technologies. Schmalenbach J. Bus. Res. 2021, 73, 179–206. [Google Scholar] [CrossRef]
- Branker, K.; Pathak, M.; Pearce, J.M. A review of solar photovoltaic levelized cost of electricity. Renew. Sustain. Energy Rev. 2011, 15, 4470–4482. [Google Scholar] [CrossRef]
- Comello, S.; Reichelstein, S.; Sahoo, A. The road ahead for solar PV power. Renew. Sustain. Energy Rev. 2018, 92, 744–756. [Google Scholar] [CrossRef]
- Balali, M.H.; Nouri, N.; Omrani, E.; Nasiri, A.; Otieno, W. An overview of the environmental, economic, and material developments of the solar and wind sources coupled with the energy storage systems. Int. J. Energy Res. 2017, 41, 1948–1962. [Google Scholar] [CrossRef]
- Rajput, S.; Amiel, I.; Sitbon, M.; Aharon, I.; Averbukh, M. Control the Voltage Instabilities of Distribution Lines using Capacitive Reactive Power. Energies 2020, 13, 875. [Google Scholar] [CrossRef]
- Amiel, I.; Rajput, S.; Averbukh, M. Capacitive reactive power compensation to prevent voltage instabilities in distribution lines. Int. J. Electr. Power Energy Syst. 2021, 131, 107043. [Google Scholar] [CrossRef]
- Sultan, H.M.; Diab, A.A.Z.; Kuznetsov, O.N.; Ali, Z.M.; Abdalla, O. Evaluation of the impact of high penetration levels of PV power plants on the capacity, frequency and voltage stability of Egypt’s unified grid. Energies 2019, 12, 552. [Google Scholar] [CrossRef]
- Yan, R.; Saha, T.K. Investigation of voltage stability for residential customers due to high photovoltaic penetrations. IEEE Trans. Power Syst. 2012, 27, 651–662. [Google Scholar] [CrossRef]
- Saidi, A.S. Impact of grid-tied photovoltaic systems on voltage stability of unisian distribution networks using dynamic reactive power control. Ain Shams Eng. J. 2022, 13, 101537. [Google Scholar] [CrossRef]
- Zhou, H.; Yan, X.; Liu, G. A review on voltage control using on-load voltage transformer for the power grid. IOP Conf. Ser. Earth Environ. Sci. 2019, 252, 032144. [Google Scholar] [CrossRef]
- Alam, M.; Chowdhury, T.A.; Dhar, A.; Al-Ismail, F.S.; Choudhury, M.; Shafiullah, M.; Hossain, M.; Ullah, A.; Rahman, S.M. Solar and Wind Energy Integrated System Frequency Control: A Critical Review on Recent Developments. Energies 2023, 16, 812. [Google Scholar] [CrossRef]
- Mansouri, N.; Lashab, A.; Sera, D.; Guerrero, J.M.; Cherif, A. Large photovoltaic power plants integration: A review of challenges and solutions. Energies 2019, 12, 3798. [Google Scholar] [CrossRef]
- Uzum, B.; Onen, A.; Hasanien, H.M.; Muyeen, S. Rooftop solar pv penetration impacts on distribution network and further growth factors—A comprehensive review. Electronics 2020, 10, 55. [Google Scholar] [CrossRef]
- Rajan, R.; Fernandez, F.M.; Yang, Y. Primary frequency control techniques for large-scale PV-integrated power systems: A review. Renew. Sustain. Energy Rev. 2021, 144, 110998. [Google Scholar] [CrossRef]
- Shafiullah, M.; Ahmed, S.D.; Al-Sulaiman, F.A. Grid Integration Challenges and Solution Strategies for Solar PV Systems: A Review. IEEE Access 2022, 10, 52233–52257. [Google Scholar] [CrossRef]
- Zhang, Q.; Mao, M.; Ke, G.; Zhou, L.; Xie, B. Stability problems of PV inverter in weak grid: A review. IET Power Electron. 2020, 13, 2165–2174. [Google Scholar] [CrossRef]
- Solomon, A.A.; Faiman, D.; Meron, G. Grid matching of large-scale wind energy conversion systems, alone and in tandem with large-scale photovoltaic systems: An Israeli case study. Energy Policy 2010, 38, 7070–7081. [Google Scholar] [CrossRef]
- Luo, X.; Wang, J.; Dooner, M.; Clarke, J. Overview of current development in electrical energy storage technologies and the application potential in power system operation. Appl. Energy 2015, 137, 511–536. [Google Scholar] [CrossRef]
- Akinyele, D.; Rayudu, R. Review of energy storage technologies for sustainable power networks. Sustain. Energy Technol. Assess. 2014, 8, 74–91. [Google Scholar] [CrossRef]
- Azzuni, A.; Breyer, C. Energy security and energy storage technologies. Energy Procedia 2018, 155, 237–258. [Google Scholar] [CrossRef]
- Jacobson, M.Z.; Delucchi, M.A.; Cameron, M.A.; Frew, B.A. Low-cost solution to the grid reliability problem with 100% penetration of intermittent wind, water, and solar for all purposes. Proc. Natl. Acad. Sci. USA 2015, 112, 15060–15065. [Google Scholar] [CrossRef]
- Jacobson, M.Z.; Delucchi, M.A. Providing all global energy with wind, water, and solar power, part I: Technologies, energy resources, quantities and areas of infrastructure, and materials. Energy Policy 2011, 39, 1154–1169. [Google Scholar] [CrossRef]
- Aliyu, M.; Hassan, G.; Said, S.A.; Siddiqui, M.U.; Alawami, A.T.; Elamin, I.M. A review of solar-powered water pumping systems. Renew. Sustain. Energy Rev. 2018, 87, 61–76. [Google Scholar] [CrossRef]
- Sontake, V.C.; Kalamkar, V.R. Solar photovoltaic water pumping system—A comprehensive review. Renew. Sustain. Energy Rev. 2016, 59, 1038–1067. [Google Scholar] [CrossRef]
- Ma, T.; Yang, H.; Lu, L. Feasibility study and economic analysis of pumped hydro storage and battery storage for a renewable energy powered island. Energy Convers. Manag. 2014, 79, 387–397. [Google Scholar] [CrossRef]
- Blakers, A.; Stocks, M.; Lu, B.; Cheng, C. A review of pumped hydro energy storage. Prog. Energy 2021, 3, 022003. [Google Scholar] [CrossRef]
- Hunt, J.D.; Zakeri, B.; Lopes, R.; Barbosa, P.S.F.; Nascimento, A.; de Castro, N.J.; Brandão, R.; Schneider, P.S.; Wada, Y. Existing and new arrangements of pumped-hydro storage plants. Renew. Sustain. Energy Rev. 2020, 129, 109914. [Google Scholar] [CrossRef]
- Hunt, J.D.; Byers, E.; Wada, Y.; Parkinson, S.; Gernaat, D.E.; Langan, S.; van Vuuren, D.P.; Riahi, K. Global resource potential of seasonal pumped hydropower storage for energy and water storage. Nat. Commun. 2020, 11, 947. [Google Scholar] [CrossRef]
- Fang, W.; Huang, Q.; Huang, S.; Yang, J.; Meng, E.; Li, Y. Optimal sizing of utility-scale photovoltaic power generation complementarily operating with hydropower: A case study of the world’s largest hydro-photovoltaic plant. Energy Convers. Manag. 2017, 136, 161–172. [Google Scholar] [CrossRef]
- Ming, B.; Liu, P.; Guo, S.; Zhang, X.; Feng, M.; Wang, X. Optimizing utility-scale photovoltaic power generation for integration into a hydropower reservoir by incorporating long- and short-term operational decisions. Appl. Energy 2017, 204, 432–445. [Google Scholar] [CrossRef]
- Ma, T.; Yang, H.; Lu, L.; Peng, J. An optimization sizing model for solar photovoltaic power generation system with pumped storage. Energy Procedia 2014, 61, 5–8. [Google Scholar] [CrossRef]
- Cipollina, A.; Micale, G.; Rizzuti, L. Seawater Desalination: Conventional and Renewable Energy Processes; Springer Science & Business Media: Berlin/Heidelberg, Germany, 2009. [Google Scholar]
- Chafik, E. A new type of seawater desalination plants using solar energy. Desalination 2003, 156, 333–348. [Google Scholar] [CrossRef]
- Shim, W.G.; He, K.; Gray, S.; Moon, I.S. Solar energy assisted direct contact membrane distillation (DCMD) process for seawater desalination. Sep. Purif. Technol. 2015, 143, 94–104. [Google Scholar] [CrossRef]
- Chen, L.; Lam, W. A review of survivability and remedial actions of tidal current turbines. Renew. Sustain. Energy Rev. 2015, 43, 891–900. [Google Scholar] [CrossRef]
- Available online: https://icl-group-sustainability.com/reports/dead-sea-water-level/ (accessed on 14 May 2023).
- Available online: https://water.fanack.com/publications/red-sea-dead-sea-project/ (accessed on 14 May 2023).
- Salhotra, A.M.; Adams, E.E.; Harleman, D.R. Effect of salinity and ionic composition on evaporation: Analysis of Dead Sea evaporation pans. Water Resour. Res. 1985, 21, 1336–1344. [Google Scholar] [CrossRef]
- Chen, C.; Kuang, Y.; Hu, L. Challenges and opportunities for solar evaporation. Joule 2019, 3, 683–718. [Google Scholar] [CrossRef]
- Chang, J.; Li, Y.; Yuan, M.; Wang, Y. Efficiency evaluation of hydropower station operation: A case study of Longyangxia station in the Yellow River, China. Energy 2017, 135, 23–31. [Google Scholar] [CrossRef]
- Kress, N.; Gertner, Y.; Shoham-Frider, E. Seawater quality at the brine discharge site from two mega size seawater reverse osmosis desalination plants in Israel (Eastern Mediterranean). Water Res. 2020, 171, 115402. [Google Scholar] [CrossRef]
- Available online: https://www.gov.il/en/departments/publications/reports/potential_for_solar_production_on_existing_structures_jan_2020 (accessed on 14 May 2023).
- Stover, R.L. Seawater reverse osmosis with isobaric energy recovery devices. Desalination 2007, 203, 168–175. [Google Scholar] [CrossRef]
- Kim, J.; Park, K.; Yang, D.R.; Hong, S. A comprehensive review of energy consumption of seawater reverse osmosis desalination plants. Appl. Energy 2019, 254, 113652. [Google Scholar] [CrossRef]
- Watton, J. Fundamentals of Fluid Power Control; Cambridge University Press: Cambridge, UK, 2009. [Google Scholar]
- Solomon, A.A.; Faiman, D.; Meron, G. Properties and uses of storage for enhancing the grid penetration of very large photovoltaic systems. Energy Policy 2010, 38, 5208–5222. [Google Scholar] [CrossRef]


Disclaimer/Publisher’s Note: The statements, opinions and data contained in all publications are solely those of the individual author(s) and contributor(s) and not of MDPI and/or the editor(s). MDPI and/or the editor(s) disclaim responsibility for any injury to people or property resulting from any ideas, methods, instructions or products referred to in the content. |
© 2023 by the authors. Licensee MDPI, Basel, Switzerland. This article is an open access article distributed under the terms and conditions of the Creative Commons Attribution (CC BY) license (https://creativecommons.org/licenses/by/4.0/).
Share and Cite
Lineykin, S.; Sharma, A.; Averbukh, M. Eventual Increase in Solar Electricity Production and Desalinated Water through the Formation of a Channel between the Mediterranean and the Dead Sea. Energies 2023, 16, 4272. https://doi.org/10.3390/en16114272
Lineykin S, Sharma A, Averbukh M. Eventual Increase in Solar Electricity Production and Desalinated Water through the Formation of a Channel between the Mediterranean and the Dead Sea. Energies. 2023; 16(11):4272. https://doi.org/10.3390/en16114272
Chicago/Turabian StyleLineykin, Simon, Abhishek Sharma, and Moshe Averbukh. 2023. "Eventual Increase in Solar Electricity Production and Desalinated Water through the Formation of a Channel between the Mediterranean and the Dead Sea" Energies 16, no. 11: 4272. https://doi.org/10.3390/en16114272
APA StyleLineykin, S., Sharma, A., & Averbukh, M. (2023). Eventual Increase in Solar Electricity Production and Desalinated Water through the Formation of a Channel between the Mediterranean and the Dead Sea. Energies, 16(11), 4272. https://doi.org/10.3390/en16114272