Article

Experimental Study on Temperature Sensitivity of the State of Charge of Aluminum Battery Storage System

1
Department of Vehicle Engineering, National Taipei University of Technology, No. 1, Sec. 3, Zhongxiao E. Rd., Taipei City 10608, Taiwan
2
Green Energy and Environment Research Laboratory, Industrial Technology Research Institute, Tainan City 711010, Taiwan
*
Author to whom correspondence should be addressed.
Energies 2023, 16(11), 4270; https://doi.org/10.3390/en16114270
Submission received: 24 March 2023 / Revised: 22 April 2023 / Accepted: 13 May 2023 / Published: 23 May 2023
(This article belongs to the Special Issue Advances in Battery Energy Storage Systems)

Abstract

:
The operating temperature of a battery energy storage system (BESS) has a significant impact on battery performance, such as safety, state of charge (SOC), and cycle life. For weather-resistant aluminum batteries (AlBs), the precision of the SOC is sensitive to temperature variation, and errors in the SOC of AlBs may occur. In this study, a combination of the experimental charge/discharge data and a 3D anisotropic homogeneous (Ani-hom) transient heat transfer simulation is performed to understand the thermal effect of a novel battery system, say an aluminum-ion battery. The study conducts a turbulence fluid dynamics method to solve the temperature distribution of the battery rack, and the entropy generation method analyzes the heat generation of AlB during the charging/discharging process. The AlB is modeled by a second-order Thevenin equivalent circuit to estimate the status of the battery. An extended Kalman filter is applied to obtain the accurate SOC for monitoring the battery cell. The current study conducts the Galvanostatic Intermittent Titration Technique (GITT) on aluminum-ion batteries under different operation temperatures: 25 °C, 40 °C, 60 °C, and 80 °C. According to the sensitivity analysis of the SOC, the temperature sensitivity tends to or greater than one, S T 1 , while the operation temperature is above 40 °C, and the SOC modification of EKFtmep estimator improves the battery state of charge in the error range below 1%.

1. Introduction

Taiwan has advocated the development of green energy and hopes that the power generation of renewable energy will reach 20% of the total power generation by 2025. The storage of energy generated from renewable energy is very significant. Giannelos, S. et al. proposed that the option value of Dynamic Line Rating and Storage technologies can allow for generating considerable system savings through the management of planning uncertainties [1]. According to the different ways of energy storage, it can be classified into mechanical energy storage, electrical energy storage, and electrochemical energy storage. Electrochemical energy storage mainly realizes energy storage in the form of batteries. Commonly used batteries include lead-acid batteries, flow batteries, and lithium-ion batteries. Compared with mechanical energy storage, electrochemical [1] energy storage has the advantages of application flexibility, high efficiency, and rapid response, gradually occupying an increasingly important position in the energy storage market. The global energy storage industry is developing continuously. The energy storage system has functions such as peak load shaving to suppress peak power loads, smart mesh frequency regulation assistance, island operation, and black start. Lithium-ion batteries are often used in numerous electronic products, electric vehicles, energy storage systems, military, aviation, and aerospace applications due to their high energy density, high voltage capability, and excellent cycle performance. However, Li-ion batteries still have obstacles that limit their application. One of the main limitations is the thermal runaway in the operation of lithium-ion batteries. Generally, the operating temperature range of Li-ion batteries is about −20 to 60 °C [1]. The optimum operation temperature is in the range 15~35 °C. Once the temperature exceeds the allowable operating temperature region, the performance of lithium-ion batteries is greatly reduced, which has safety problems, such as fire, self-heating ignition, and explosions [2,3]. Extremely low and high temperatures have different effects on lithium-ion batteries [4,5]. Low-temperature effects mainly occur in high-latitude countries and regions. In these high latitudes, outdoor temperatures in winter are well below 0 °C. The low temperature directly affects the performance and cycle life of lithium-ion batteries, especially for Electric Vehicle (EV), Hybrid Electric Vehicle (HEV), and Plug-in Hybrid Electric Vehicle (PHEV) used in the V2B mode under the peak load and during outage condition [6]. There is another extremely low-temperature environment, which may apply to the battery system in space technology. In the case of Mars, the temperature may be as low as −120 °C [7], which is undoubtedly suitable for lithium-ion batteries that pose a severe test. The main effect of high temperature is attributed to the heat generated inside the lithium-ion battery during battery operation. The high temperature inside the battery is caused by the heat generated inside the lithium-ion battery, which usually occurs in the state of high current and voltage in high power output demand. The working state that generates high temperature includes the operation of fast charging/discharging [8]. High-temperature effects lead to the degradation of battery performance, including the loss of energy capacity and power [9,10,11,12]. In electrode-layered materials, the relative dielectric constant, as well as the energy storage density of the PLZT thin films with different levels of La doping, shows good temperature stability. If the battery temperature continues to be at high temperature, it results in thermal runaway, which may lead to spontaneous combustion or even explosion [13,14].
Recently, a safe and environmentally friendly option, a novel battery, has been considered. Aluminum-ion batteries have attracted the interest of researchers because they use materials that are abundant in nature [15]. Previous studies have employed aluminum-ion batteries for energy storage systems and vehicles [16,17] because of their excellent charging and discharging capabilities [18], low cost [19], high specific energy [20], and high safety [21]. A rechargeable aluminum-ion battery uses an aluminum metal anode and a three-dimensional (3D) graphitic-foam cathode with a non-flammable ionic liquid electrolyte [22], which has been investigated for its high-rate capability. Many research groups have developed novel thermal models by using measurable parameters of a battery pack for electric vehicle applications [23,24]. Y Wang et al. proposed a flat heat pipe structure for removing the heat generation of batteries [25]. For improving the measurement errors, Y Xie et al. developed a Co-Estimation method for a distributed spatial-temporal online correction [26]. Panchal, S et al. also gave a turbulence numerical model for cooling the large-sized battery storage system under high C-rate operation [27]. Therefore, it is critical to conduct the operation state of the batteries in a safe operation on the proper management of the working temperature of batteries.
The temperature variation affects the estimation value of the SOC. Predicting the State of Charge (SOC) of a battery is related to the type of battery and how to apply it. Many scholars and researchers began to develop ways on improving the accuracy of the SOC estimation. An accurate SOC estimation can improve the system performance, safety, and reliability, and timely extend the battery life and duration. Therefore, accurate estimation of the battery SOC can avoid unexpected system interruption and prevent excessive damage to batteries. Sudden system interruption may lead to permanent damage or explosion of batteries. However, battery charging and discharging involve complex chemical and physical processes, so it is not easy to accurately estimate the SOC under different working conditions. When a large number of battery units, battery modules, battery cabinets, and other energy storage equipment are stored, thermal runaway problems arise, which have become major safety concerns in the energy storage industry. During operation in a temperature-varied environment, battery resistance, charge, voltage, SOC, and state of health (SOH) may be affected unpredictably, which makes it more difficult to monitor the parameters of the battery unit. This paper studies a novel battery modulus, a weather-resistant, highly C-rate, aluminum battery (AlB). Due to the fast charging/discharging characteristic, the dynamical properties of the SOC value of AlB are highly sensitive to temperature variation. This study combines the battery Galvanostatic Intermittent Titration Technique (GITT) experiment data and 3D anisotropic homogeneous (Ani-Hom) transient heat transfer method of energy storage cabinets under different working conditions [23]. Through Computer-Aided Design (CAD) and Computational Fluid Dynamics (CFD) software (Ansys Fluent), the temperature, flow field, and thermal state of various positions inside the cabinets are discussed. The AlB is modeled by a second-order equivalent circuit for simulation. Various internal parameters of the battery, such as battery resistance, capacity, discharge efficiency, etc., are affected due to the variation in battery working temperature, so the SOC is prone to error because of the temperature difference. As a result, an equivalent circuit model is established for the aluminum-ion battery with the experimental data, and then the parameters are estimated by an extended Kalman filter, and the temperature sensitivity of the SOC is analyzed.

2. Materials and Methods

The temperature distribution on the SOC of the 10 kW power battery energy storage system was mainly discussed. The finite element analysis method was used to analyze the thermal state of energy storage cabinets under different working conditions. The 3D model of the energy storage rack was established by CAD, and then the parameters such as material, fluid, and boundary conditions were introduced by CFD to solve the temperature, flow field, and temperature in each position inside the cabinet. The Thevenin second-order equivalent circuit was also used as the basis of the battery model, and the data of aluminum-ion batteries were measured by Galvanostatic Intermittent Titration Technique (GITT) battery test method. The parameters used in the equivalent circuit model; such as internal resistance, diffusion polarization, and electrochemical polarization, are obtained from curve fitting of the battery GITT data. From the circuit equivalent model, the dynamic and static characteristics of the battery and the SOC curves of the internal resistance, capacitance, and open circuit voltage (OCV) of the battery model can be obtained. The above parameters were imported into MATLAB/Simulink, and the SOC estimation model and virtual battery were established.

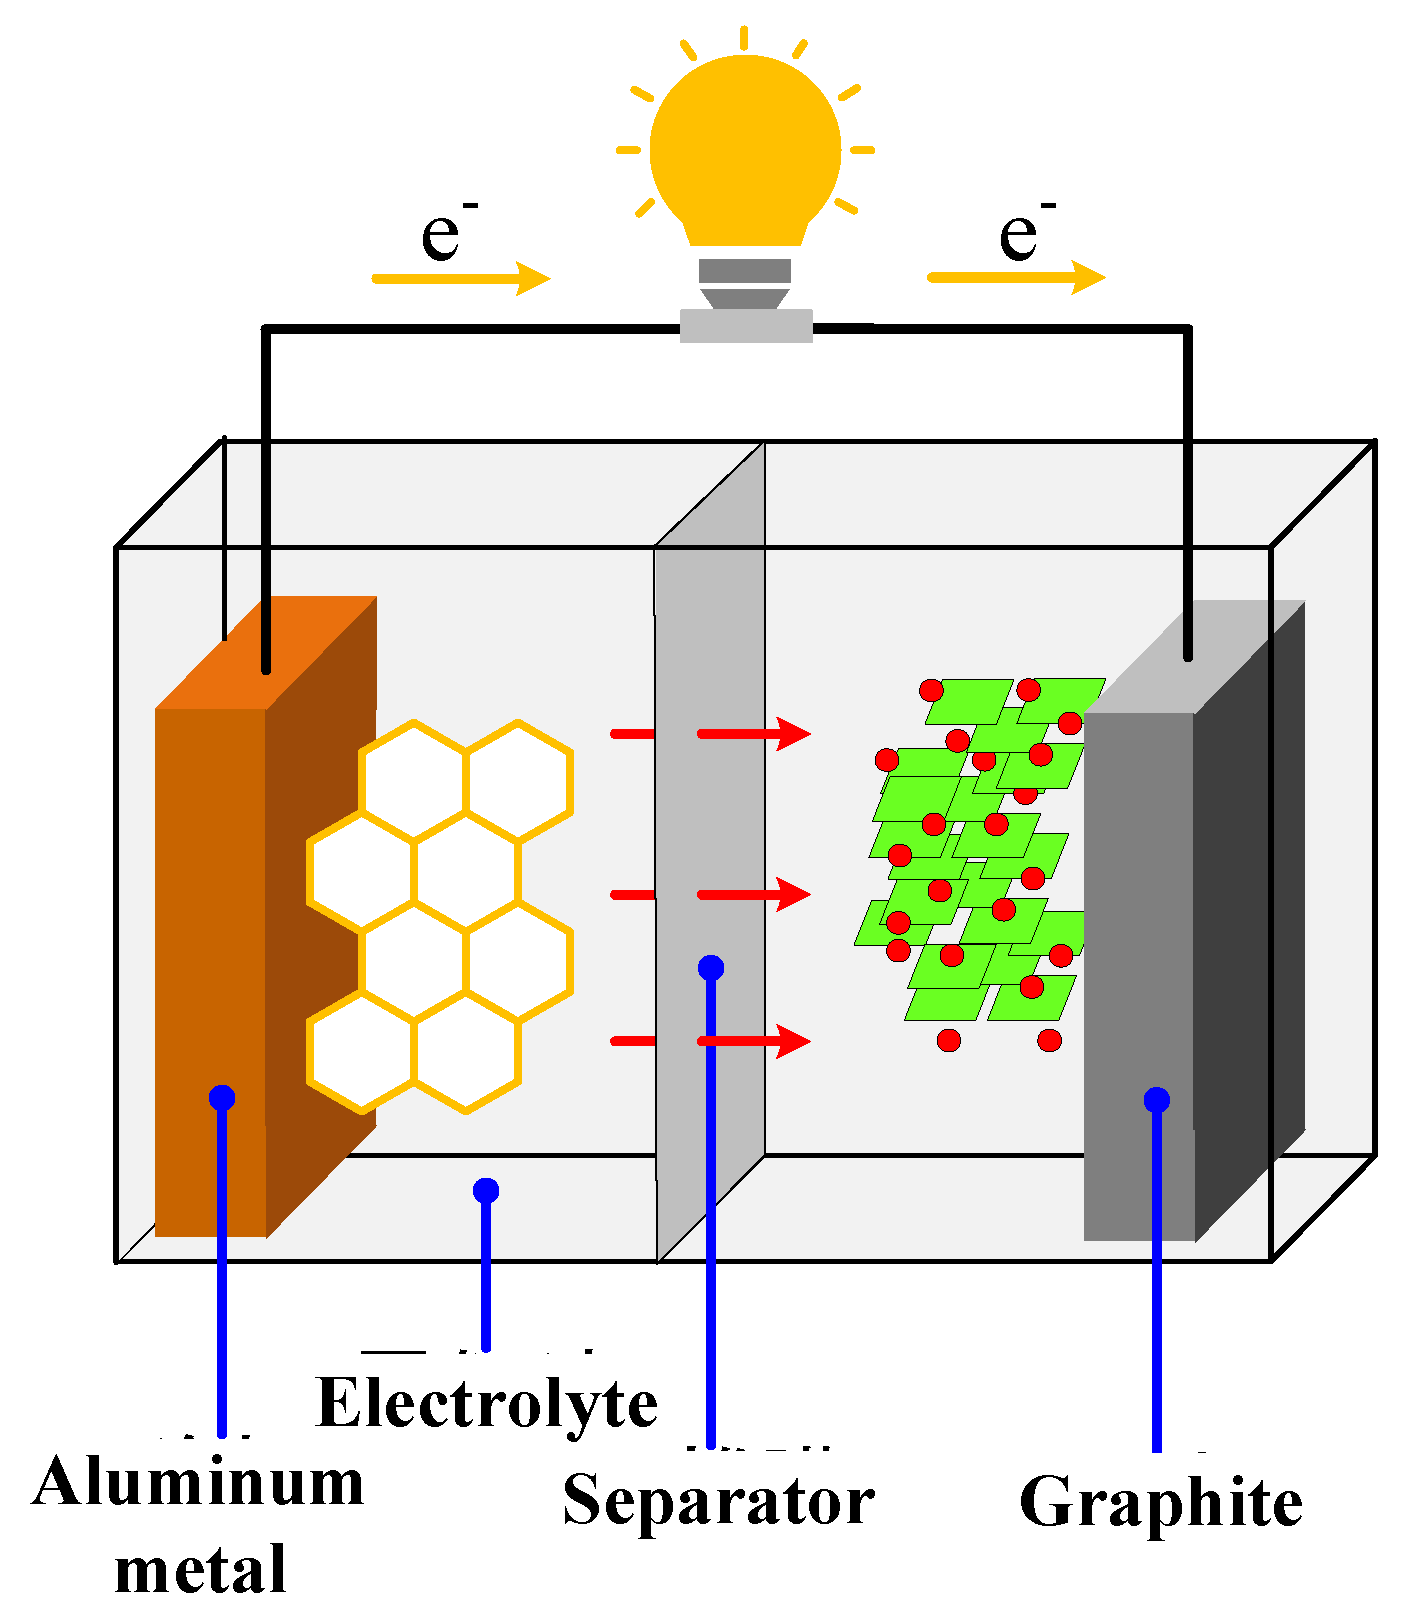
2.1. Principle and Introduction of Aluminum-Ion Batteries

Aluminum is abundant in the earth’s crust, second only to nonmetallic oxygen (O) and silicon (Si). Because of its good electrical and heat conductivity, aluminum is suitable to replace copper cables as conductors. Due to its low density and corrosion resistance, aluminum is often synthesized with other alloys, which are widely used not only in the aerospace industry, but also in transportation vehicles and mechanism materials. The energy density of an aluminum-ion battery is almost the same as a Lead acid battery, and the outermost orbital of the aluminum element has three-electron redox, which can release three electrons. Although lithium metal has three-electron redox, only one electron in its reaction equation is dissociated. Dr. Yang developed a breakthrough aluminum battery. The research team cooperated with Stanford University in the United States to solve the shortcomings of low discharge voltage and extremely short life of aluminum-ion batteries, and produced the first commercialized aluminum battery in the world [24].
The anode of the aluminum-ion battery is made of 3D graphite, the cathode is made of aluminum, and the electrolyte is made of non-combustible ionic liquid, which can make the battery safe even if it is damaged by an external force during charging and discharging. An aluminum battery has the characteristics of fast charging and fast discharging, which can be charged at a current of 100 times the C-rate, with the C-rate being the unit battery engineers use to measure the speed at which a battery is fully charged or discharged. For example, charging at a C-rate of 1C means that the battery is charged from SOC 0~100% in one hour; that is, the charging time is less than one minute [25], and its safety is more stable than lithium metal, so it is suitable to be used as battery material. The following are the chemical reaction equations of the aluminum-ion battery, and its working schematic diagram is shown in Figure 1.
Anodic reaction
A I + 7 A I C I 4 4 A I 2 C I 7 + 3 e
Cathodic reaction
C n [ A I C I 4 ] + e C n + A I C I 4

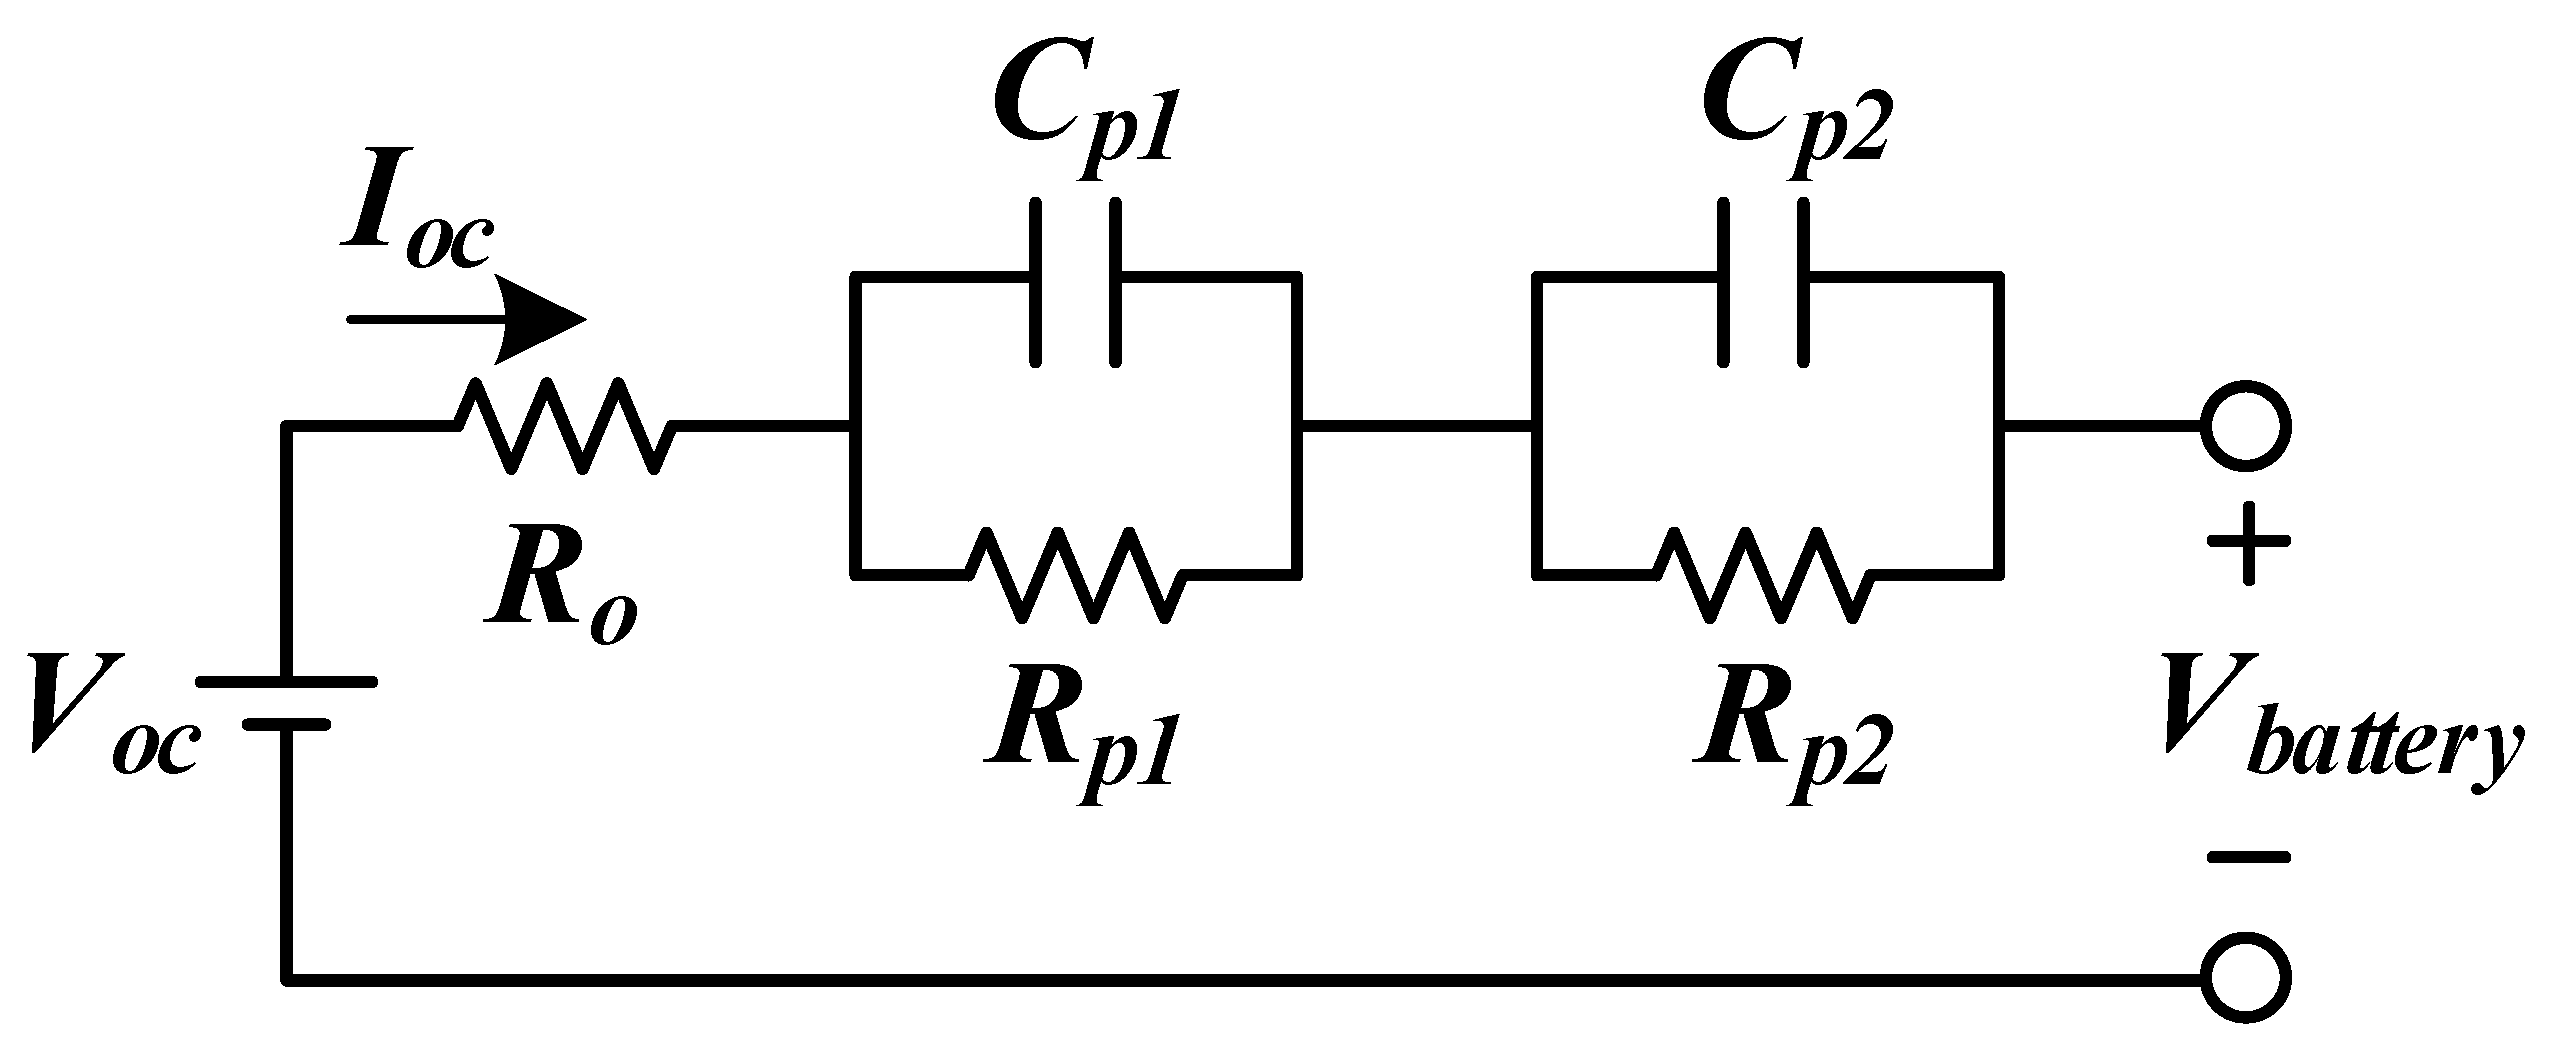
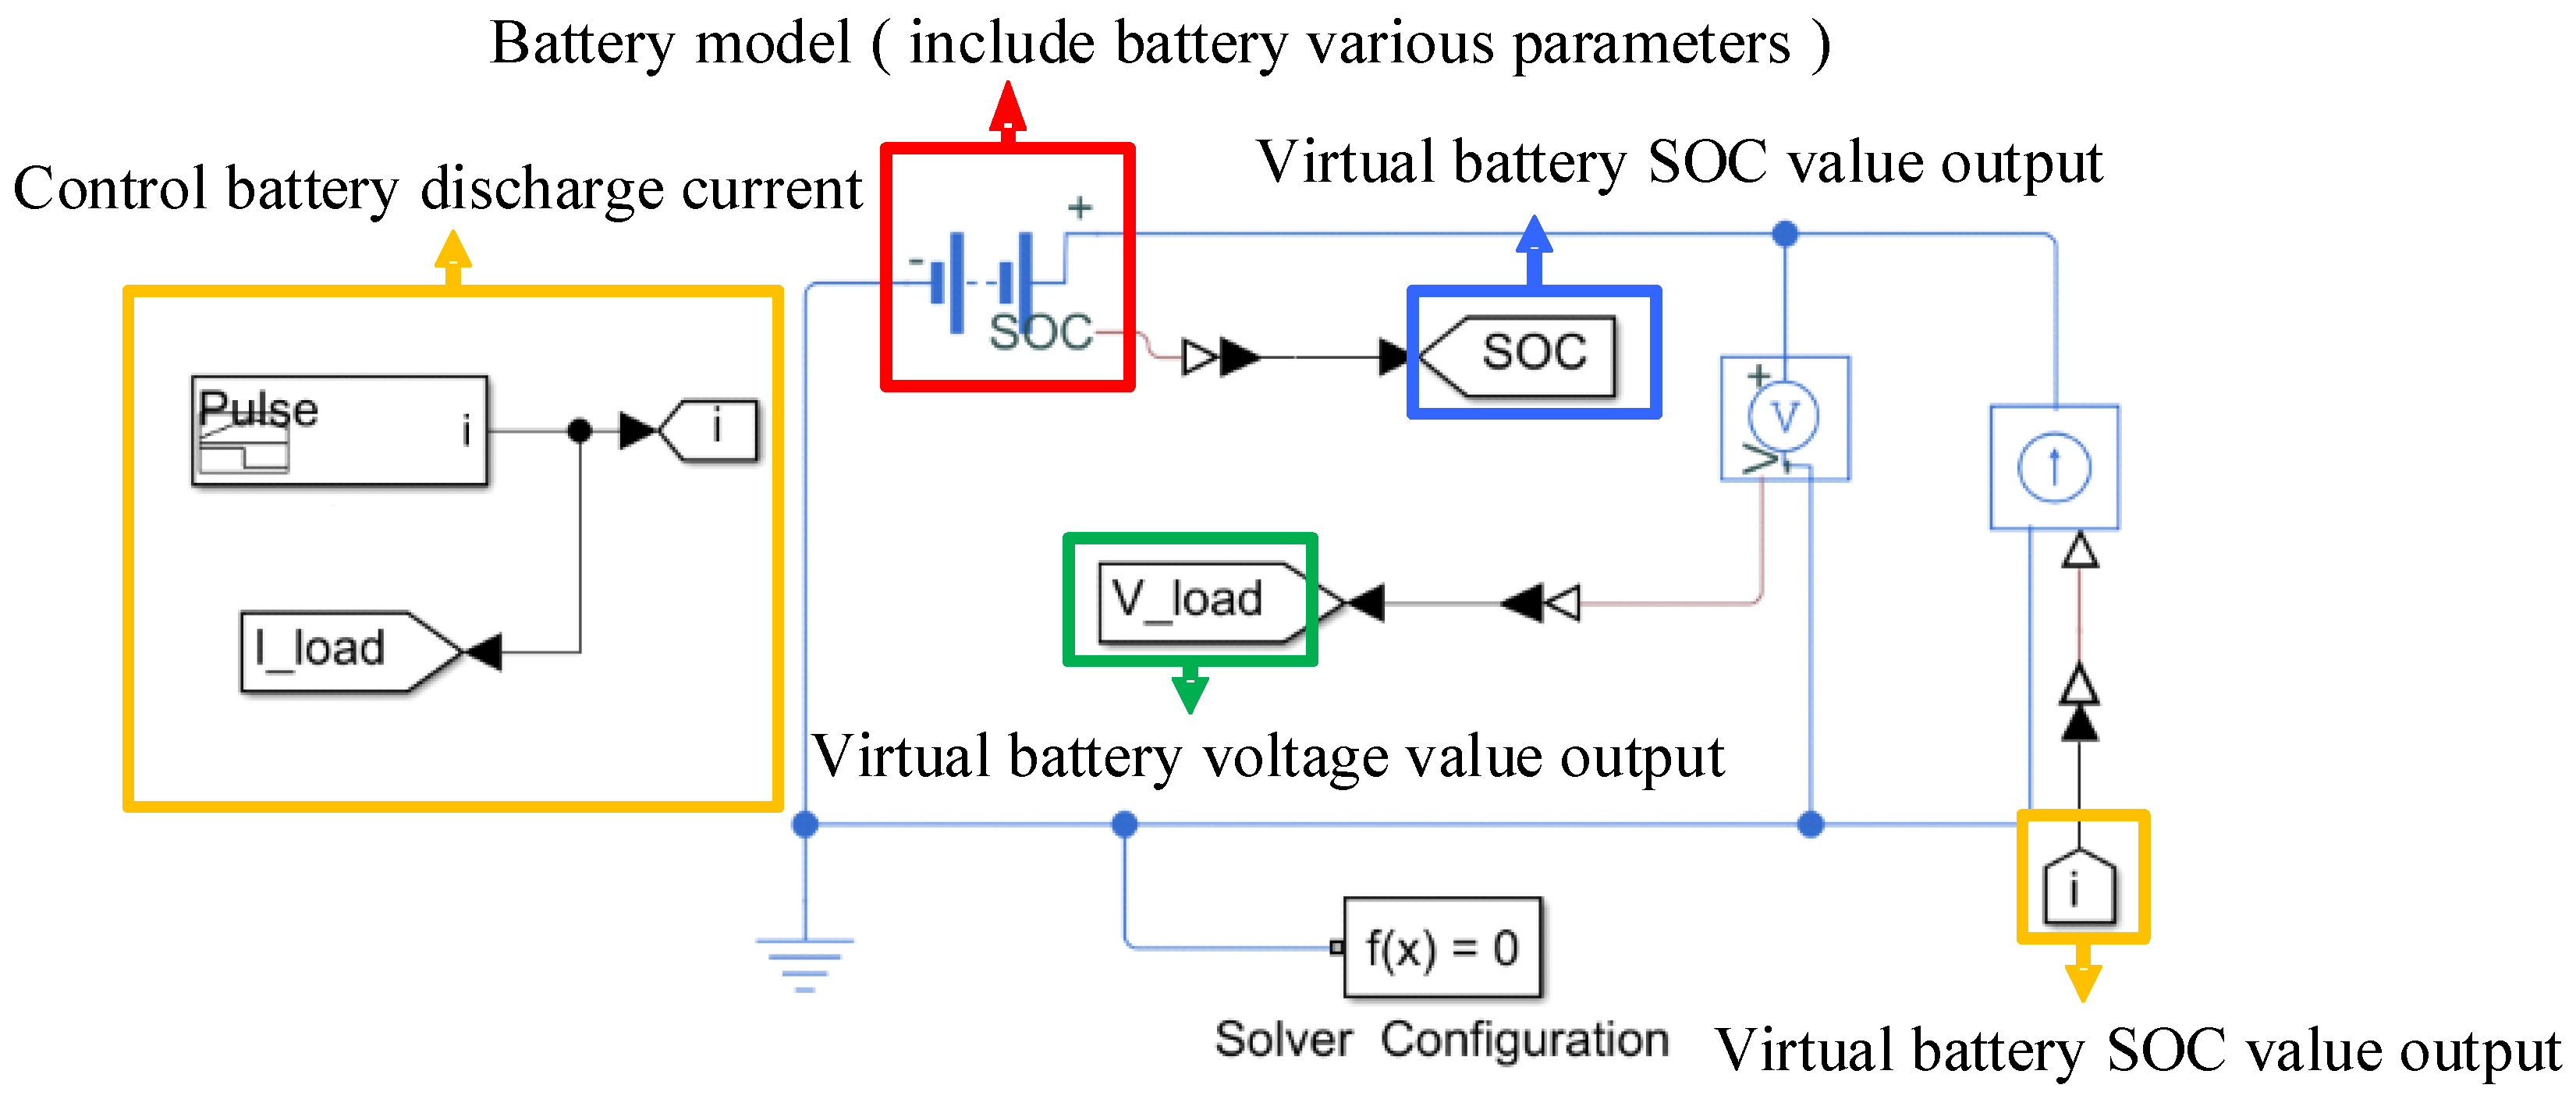
2.2. Thevenin Second-Order Equivalent Circuit Model

The battery model describes the dynamic and static characteristics of the aluminum battery. Because the electrochemical solution of the battery has the problems of electrochemical polarization and electrolyte concentration difference, which may affect various parameters of the battery during charging and discharging, the electrochemical and concentration polarization are explored. Thevenin Model is used as the simulation battery model [26,27]. The dynamic characteristics of the equivalent circuit model simulating the battery are shown in Figure 2. In the model, a second-order RC equivalent circuit is used. The Electrochemical Polarization is compared to equivalent capacitance (Cp1) and resistance (Rp1), and the Concentration Polarization is compared to equivalent capacitance (Cp2) and resistance (Rp2). The two groups of equivalent RC circuit models are combined, and the battery open-circuit voltage source Voc and initial internal resistance Ro are added in series to form the second-order equivalent circuit model.
From the schematic diagram of the second-order equivalent circuit in Figure 2, the battery output voltage (Vbattery) equation can be derived as shown in the following Equations (3) and (4).
V b a t t e r y = V o c V R o V p 1 V p 2
V R o = R o × I o c
Of which, Vbattery is the working voltage, Voc is the OCV, VRo is the terminal voltage of the ohmic resistance, VRp1 is the terminal voltage of the concentration polarization RC circuit, VRp2 is the terminal voltage of the electrochemical polarization RC circuit of the battery, and Ioc is the discharge current. Equation (5) shows the change in battery discharge time function and battery rest time function of electrochemical corrosion polarization in equivalent circuit, while Equation (6) displays the change in battery discharge time function and battery rest time function of concentration polarization in equivalent circuit. We can apply these equations to estimate the battery states.
V p 1 ( t ) = V p 1 ( t 0 ) × e t τ p 1 + I o c ( t ) × R p 1 ( 1 e t τ p 1 )
V p 2 ( t ) = V p 2 ( t 0 ) × e t τ p 2 + I o c ( t ) × R p 2 ( 1 e t τ p 2 )

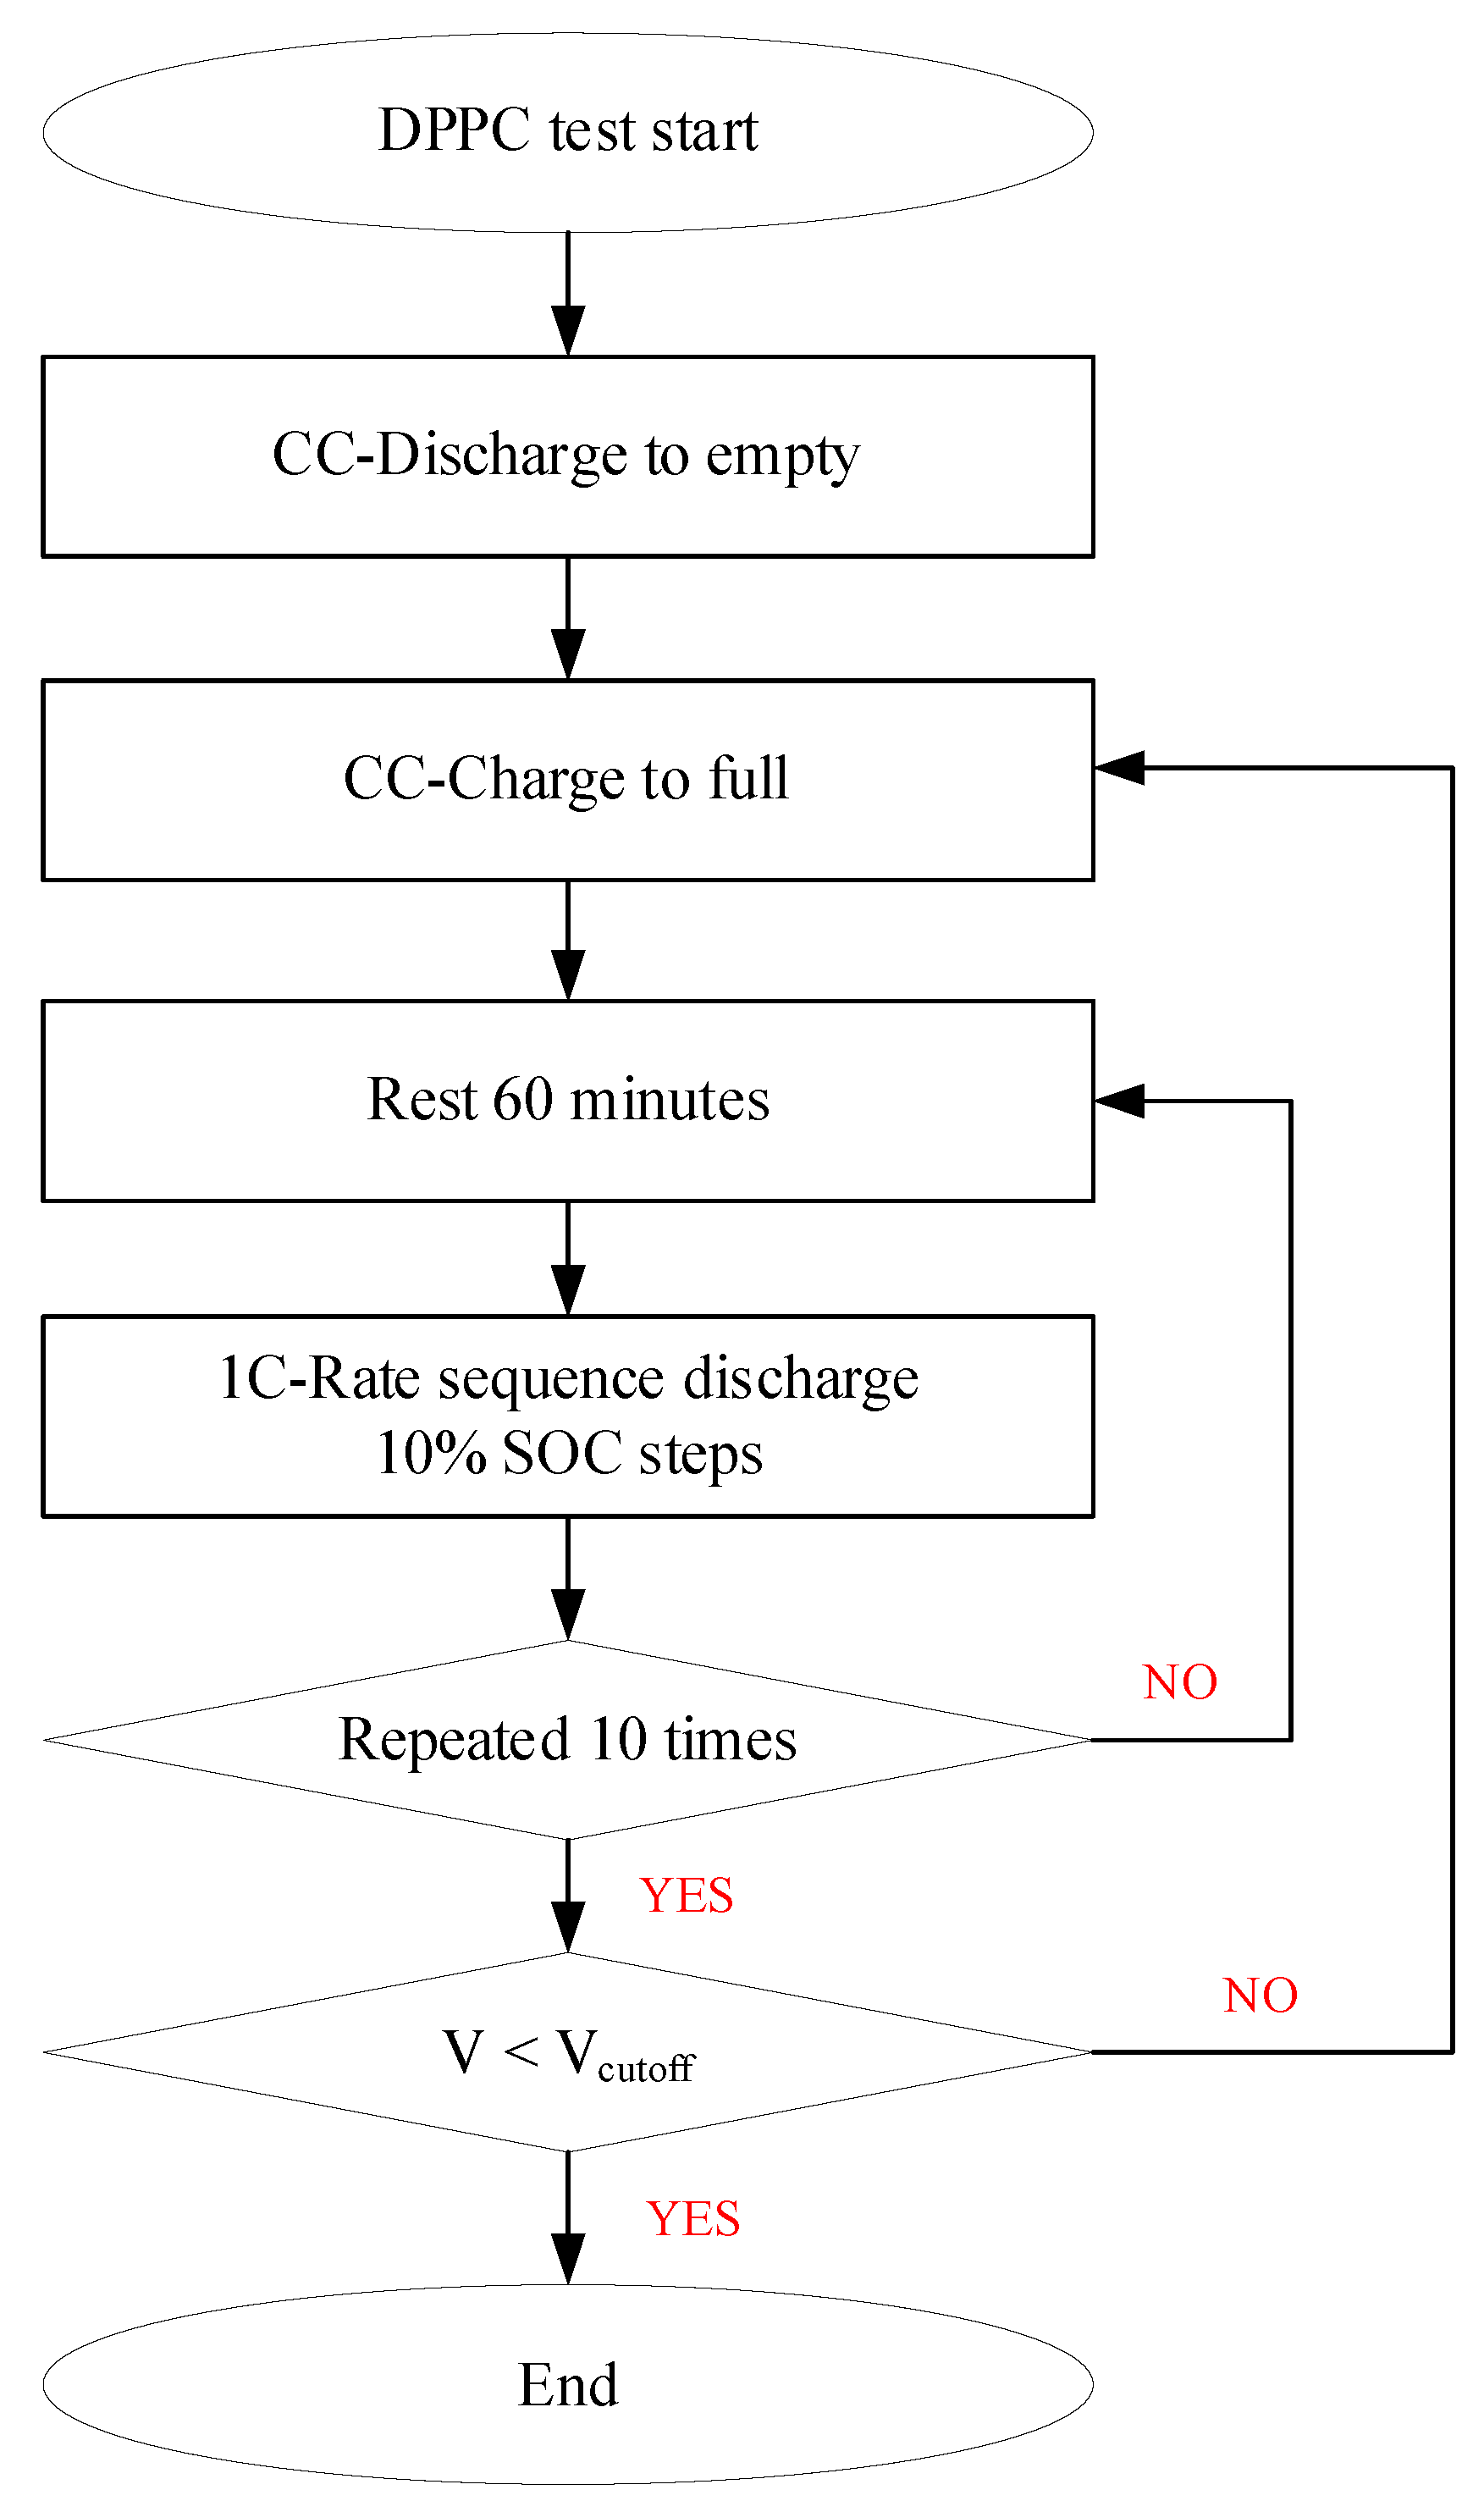
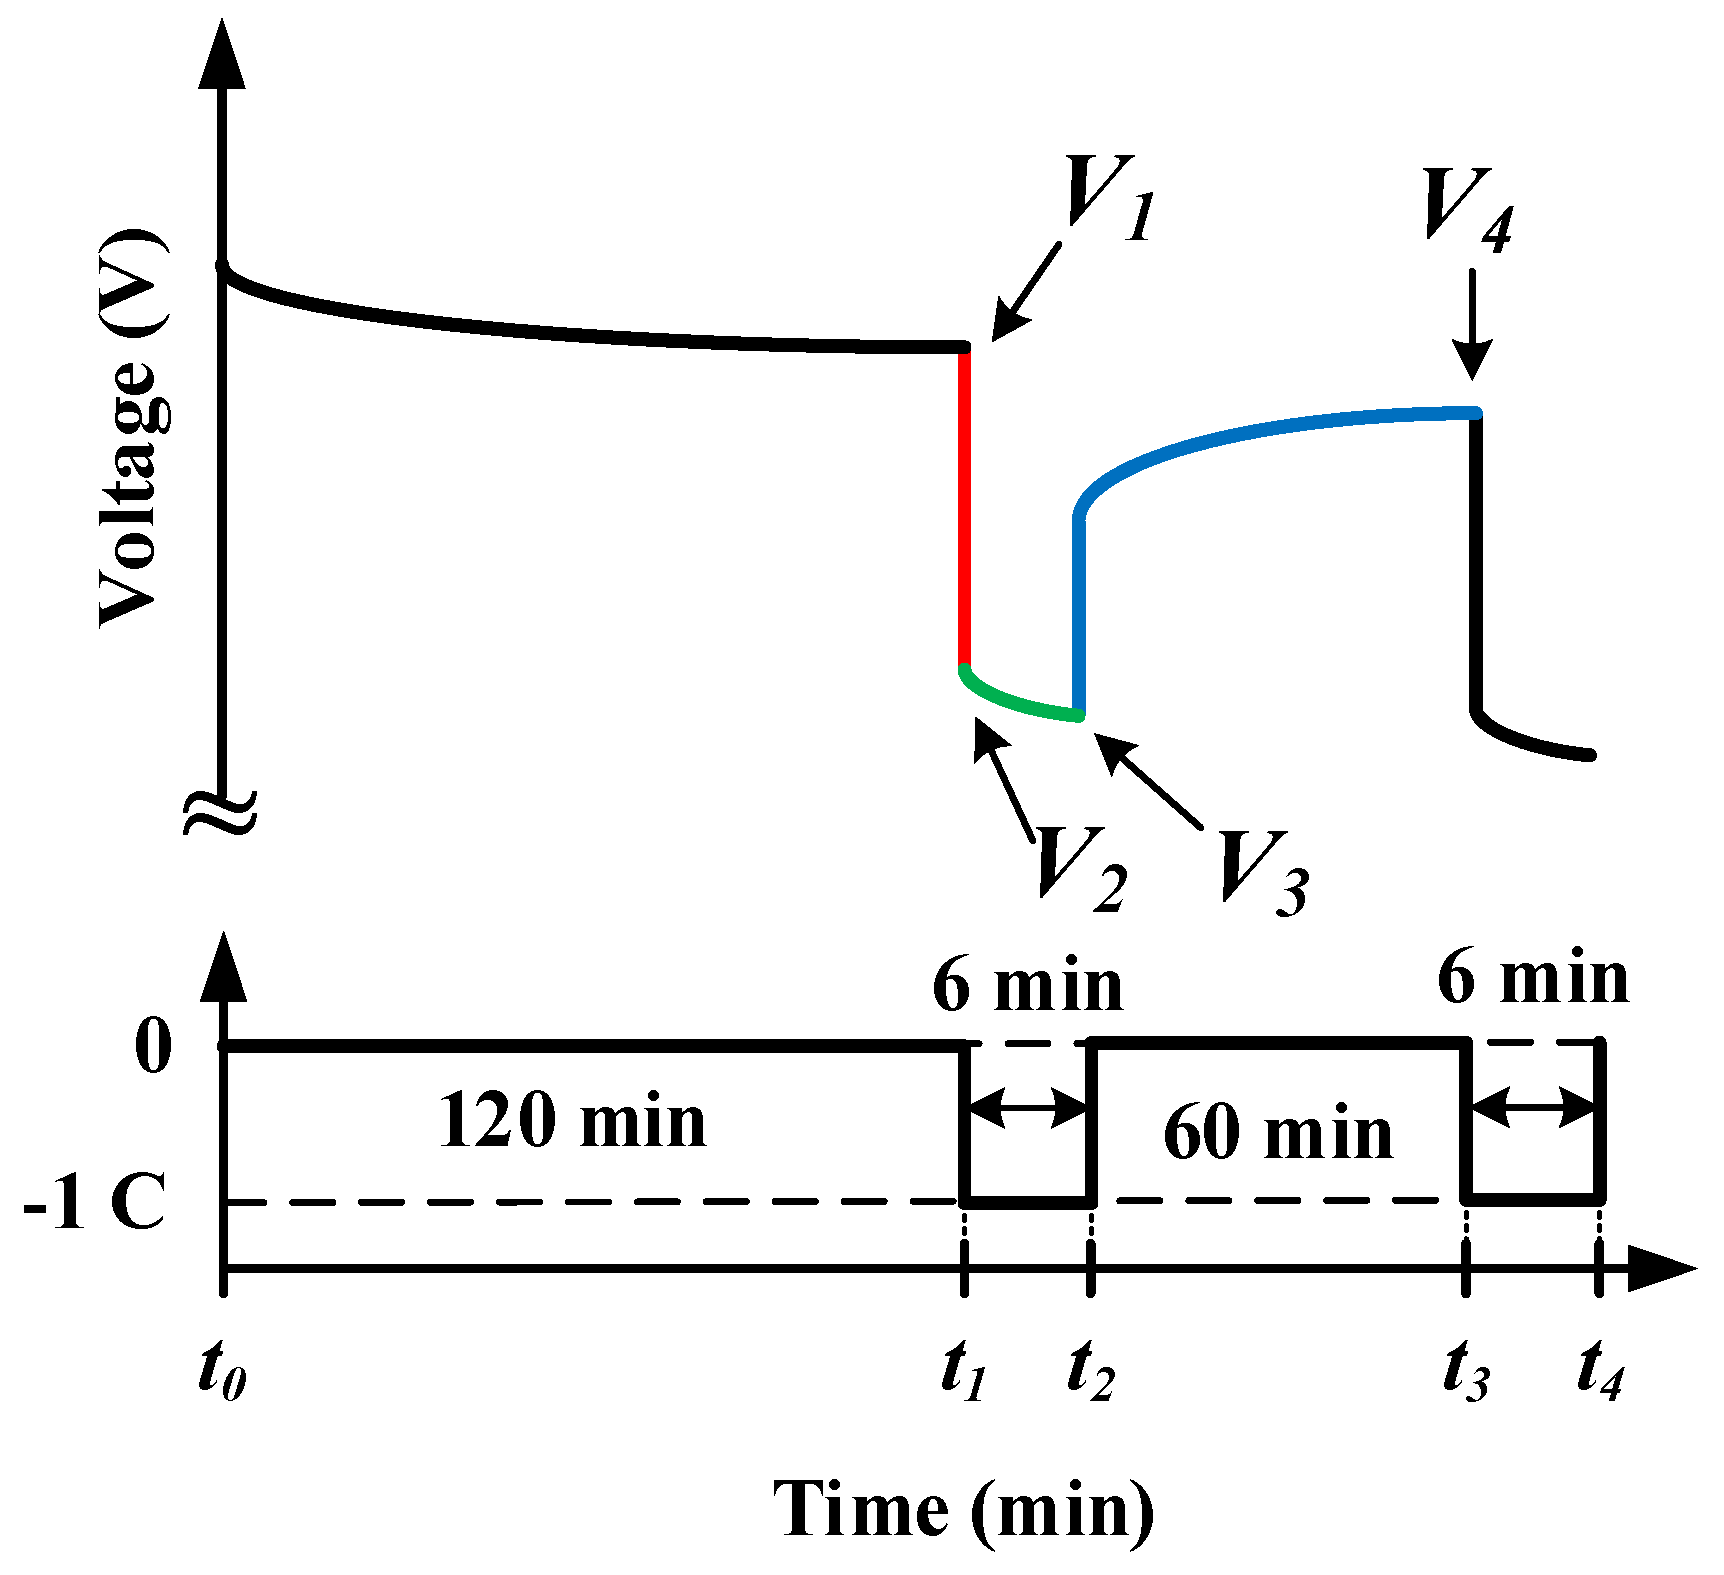
2.3. Battery Galvanostatic Intermittent Titration Technique Test

In order to evaluate the basic data of battery modules, and the performance and other states of EV or PHEV on the market at present, experts from all over the world must test the batteries, among which the Galvanostatic Intermittent Titration Technique (GITT) developed by the Program Electrochemical Energy Storage Team of Freedom CAR in the United States is the most widely used [28]. GITT is mainly used for pulse charge and pulse discharge capability of test battery and single-cell battery at different depths of discharge (DOD). The process is shown in Figure 3. Pulse discharge/charge internal resistance and over internal impedances of battery at specific DOD can be obtained by calculation of Ohm’s Law.
Figure 4 is the discharging interval of pulse motive force test. Remain stationary at t0-t1 for one hour, without any current passing positive and negative electrodes, until battery’s internal polarization effect has stabilized, followed by 10% DOD (depth of discharge) discharging by battery with current at 1C multiple ratios. During the discharging time, there are three states, each with different significance. These three states represent their different physical variations. V1~V2 indicates abrupt voltage decline, caused by Ohmic internal resistance and charge transfer resistance R0 (Rohm + Rtrans). The 10-steps GITT testing data and fitting curve are shown in Figure 5. The experiment environment-controlled box and the temperature monitoring curve during the charge/discharge process are both shown in Figure 6 and Figure 7. The temperature data measurement collecting by the “thermistor” (see Table 1 and Figure 8).
According to the 2nd order equivalent circuit model, in the voltage, all of the ohmic internal resistance Ro, electric resistance resulting from electrochemical polarization and concentration difference polarization, and capacitance is reaction. Due to the electric resistance deriving from electrochemical reaction polarization and concentration difference polarization, the capacitance’s terminal voltage exhibits exponential growth over time. The mathematical relations between these parameters are described in Equations (7)–(9).
R o , d i s c h arg e = V 1 V 2 I d i s c h arg e
V b a t t e r y ( t ) = V o c ( t ) R o × I o c ( t ) R p 1 ( t ) × I o c ( t ) × ( 1 e t τ p 1 ) R p 2 ( t ) × I o c ( t ) × ( 1 e t τ p 2 )
V b a t t e r y ( t ) = V o c ( t ) V p 1 ( t ) × e t τ p 1 V p 2 ( t ) × e t τ p 2

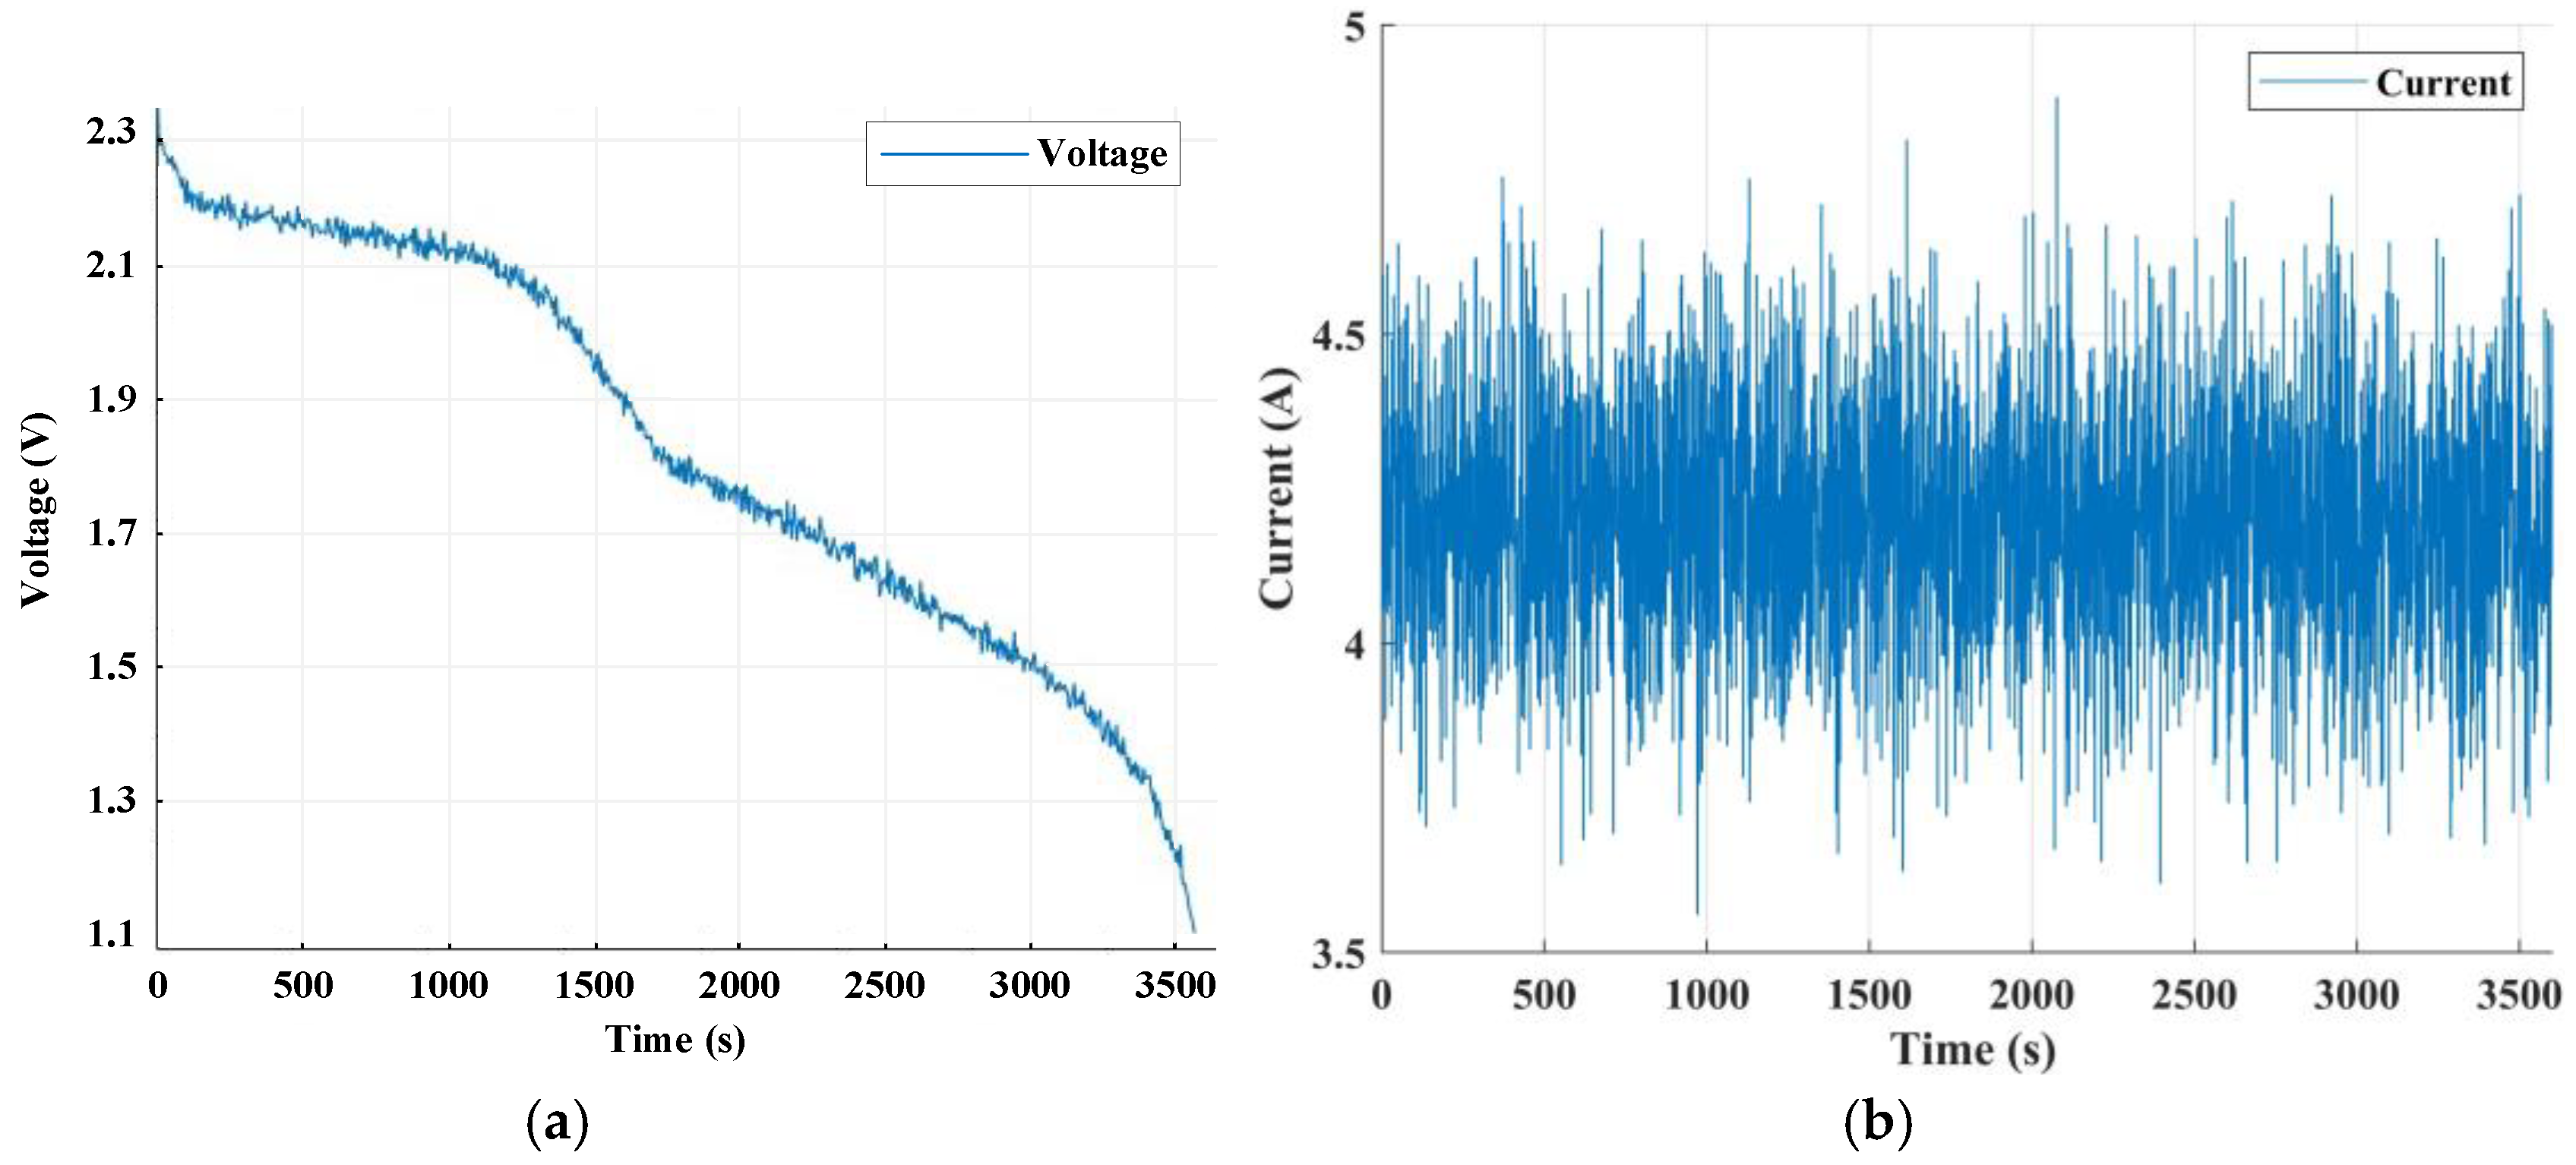
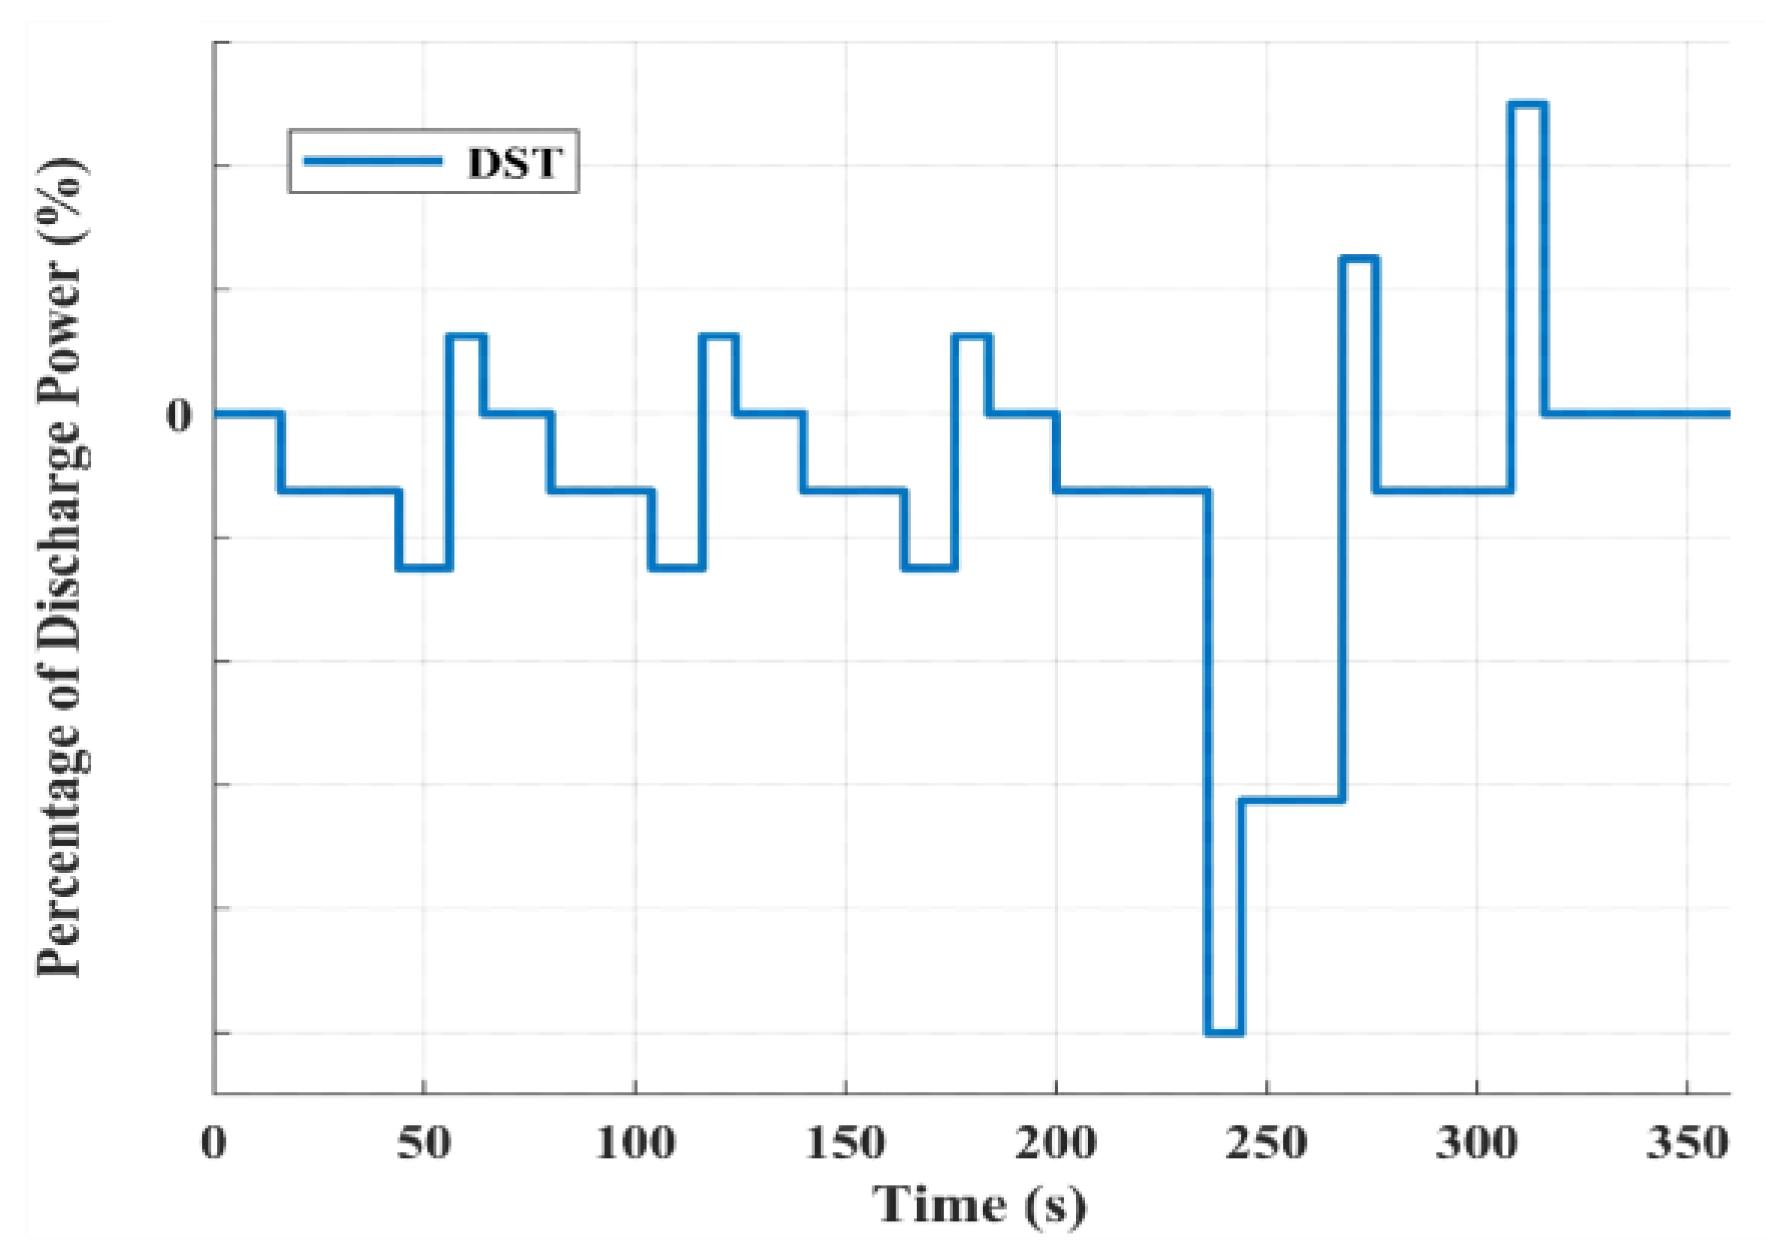
2.4. EKF Method for Al-Battery SOC Estimation

In order to establish a SOC estimator for aluminum-ion batteries and predict the SOC accurately, this paper uses Kalman filter to build the SOC [29], and then uses the prediction and correction method of Kalman filter to estimate the State of Charge (SOC). Kalman Filter is an efficient recursive filter (autoregressive filter) [30], which can estimate the state of a dynamic system from complex and noisy measurement data. As long as the estimated value of the state at the previous moment and the observed value of the current state are known and time-varying measured values, and although the measured value is inaccurate and contains statistical errors, the Kalman filter can still calculate the current state estimation value, and can estimate the dynamic changes in the system in real time without reading the historical data of the measured data or the estimated data in the process. Battery is a nonlinear dynamic system, so an extended Kalman filter is used. In order to estimate the SOC by an extended Kalman filter, the battery system should be expanded by Taylor expansion, and the state equation and observation equation of the battery system should be linearized by partial derivatives. The nonlinear system should be transformed into a linear system by Taylor expansion, and the battery linear system model should be established [31], and then the estimated value should be predicted and corrected by Kalman filter. The extended Kalman filter can be divided into five equations; repeat the following steps for recursive operation.
X ^ k = A X ^ k 1 + B u k 1
P k = A P k 1 A T + Q
K k = P k H T ( H P k H T + R ) 1
X ^ k = X ^ k 1 + K k ( Z k ( H X ^ k 1 D k u k ) )
P k = ( I K k H ) P k 1
where X ^ k is the system state matrix of state k, X ^ k 1 is the system state matrix of state k − 1, μ k 1 is the system control matrix of state k − 1, An*n is the state transition matrix, Bn*1 is the state control matrix, P k is the covariance of prediction error in state k, Q is the covariance of system process noise, Kk is the Kalman gain in state k, R is the covariance of system measurement noise, and Zk is the measured value of state k.

2.5. Governing Equations

This study uses ANSYS-Fluent computational fluid dynamics software to solve the relevant parameters for the internal heat flow field of the battery rack. The simulation model is calculated using a 3D model. The governing equations used include continuity equations, momentum equations, and energy equations [32]. The equation is expressed as follows:
(1)
Continuity Conservation Equation:
ρ t + ( ρ υ ) = 0
where ρ is the fluid density, υ is the fluid vector, and t is the time, the above equation is expanded as follows:
ρ t + ( ρ u ) x + ( ρ v ) y + ( ρ w ) z = 0
(2)
Momentum Conservation Equations:
ρ D υ D t = p + p g + μ 2 υ
Also known as Navier–Stokes Equations, among them 2 2 x 2 + 2 y 2 + 2 z 2 , this equation is called Laplacian Operator. Where ρ D υ D t is the inertial force per unit volume, p is the pressure per unit volume, p g is the body force per unit volume, μ 2 υ is the viscous force per unit volume. p is pressure, g is the gravitational component in the x , y , z directions in space. Since the direction of gravity in this study is only in the z direction, only the gravity field in the z direction is considered.
(3)
Energy Conservation Equation:
( ρ T ) t + ( ρ u T ) = ( k C P T )
Which can be written as:
( ρ T ) t + ( ρ u T ) x + ( ρ v T ) y + ( ρ w T ) z = x ( k C P T x ) + y ( k C P T y ) + z ( k C P T z )
Among them, C P is the specific heat capacity, T is the temperature item to be obtained, k is the thermal conductivity coefficient of the fluid.

2.6. Turbulence Model

The concept of the turbulence model of the Reynolds-averaged Navier–Stokes equation (RANS) is that any fluid variable ϕ is regarded as the average value obtained after N calculations ϕ ¯ and the instantaneous jump value ϕ . The average value can be expressed as [33]:
ϕ ¯ = lim N 1 N n = 1 N ϕ n ( x , t )
This study assumes an unsteady incompressible Newtonian viscous fluid, in which the body force and heat transfer are ignored, and with the runout value, the momentum equation has an additional Reynolds stress. Under the Cartesian coordinates, the basic system equations in the turbulence model are as follows:
( u ¯ i ) x i = 0
ρ ( ( u ¯ i ) t + ( u ¯ i u ¯ j ) x j ) = P x i + x j ( 2 μ S i j + τ i j )
S i j = 1 2 ( u ¯ i x j + u ¯ j x i )
τ i j = ρ u i u j _ _ _ _ _ _ _ _ = μ t ( u ¯ i x j + u ¯ j x i )
x is the coordinate, and the subscripts i, j, and k in the equation represent the direction of the Cartesian coordinates, u ¯ i is the average velocity of the in the x i direction, u ¯ j is the average velocity of the fluid in the x j direction μ is the dynamic viscosity coefficient, S i j is the strain rate. Equation (21) uses Boussinesq’s gradient transport hypothesis to connect the runout value and the average velocity gradient, τ i j is the Reynolds stress, and μ t is the turbulence dynamic viscosity. In addition, the Reynolds stress term resulting from the runout value is handled by the turbulence model.

SST k-ω Model

ρ ( k t + ( u ¯ j k ) x j ) = P k D k + x j ( ( μ + σ k μ t ) k x j )
ρ ( ω t + ( u ¯ j ω ) x j ) = P ω D ω + x j ( ( μ + σ ω μ t ) ω x j ) + 2 ρ ( 1 F 1 ) σ ω 2 1 ω k x j ω x j
μ = ρ a 1 k max ( a 1 ω a * , S F 2 )
a * = ( 0.024 + ρ k 6 μ ω 1 + ρ k 6 μ ω )
S = 2 S i j S i j
Equations (22) and (23) are the transmission equations of k and ω , and k is the turbulence kinetic energy, ω is the specific turbulent dissipation rate, σ k and σ ω are the Prandtl numbers of the turbulence k and ω , respectively, a * is the parameter used to control the viscosity coefficient of turbulent flow in Low-Reynolds Number Correction. When the Reynolds number is high, its value is equal to one, and S is the average shear strain rate. In addition, P k and D k are the generation and dissipation terms of turbulent kinetic energy, as shown in Equations (27) and (28), then P ω and D ω are the generation and dissipation terms of turbulent dissipation rate, as shown in Equations (29) and (30).
P k = min [ μ t u ¯ i x j ( u ¯ i x j + u ¯ j x i ) , 10 β * ρ k ω ]
D k = β * ρ k ω
P ω = α ρ μ t P k
D ω = β ρ ω 2
Moreover, F 1 and F 2 are defined as follows:
F 1 = tanh { { min [ max ( k β * ω y , 500 μ ρ y 2 ω ) , 4 ρ σ ω 2 k C D k ω y 2 ] } 4 }
C D k ω = max ( 2 ρ σ ω 2 1 ω k x j ω x j , 10 10 )
F 2 = tanh { [ max ( 2 k β * ω y , 500 μ ρ y 2 ω ) ] 2 }
ϕ = ϕ 1 F 1 + ϕ 2 ( 1 F 1 )
where y is the minimum distance between the first layer near-wall grid. It is known that the SST k-ω model is a turbulence model that combines the advantages of the k-ε model and the k-ω model, where F 1 in Equation (31) and F 2 in Equation (33) are the parameters of the SST k-ω model used to switch k-ε model or k-ω model. When its value is equal to zero, it represents the k-ε model, and when the value is equal to one, it represents the k-ω model close to the boundary, and all the constants are calculated from Equation (34). Other SST k-ω model constant values are as follows:
β * = 0.09 , σ k 1 = 0.85 , σ k 2 = 1.0 , σ ω 1 = 0.5 , σ ω 2 = 0.856 , a 1 = 0.31 ϕ 1 = 5 / 9 , ϕ 2 = 0.44 , β 1 = 0.075 , β 2 = 0.0828
Equation (35) is for finding Reynolds number (Re) and is used to determine whether the fluid flow is turbulent or laminar, where D h represents the hydraulic diameter of the coolant body, u is the mean velocity of the fluid (m/s), μ is the dynamic viscosity of the fluid (Pa·s). In this study, the flow model is turbulence model. The corresponding parameters are shown in Table 2.
Re = ρ u D h μ

2.7. Thermal Analysis of Energy Storage Cabinet

Figure 9 represents the thermal analysis conducted by the following simulation steps. They are 3D model graphics processing, CFD solver setting, and result analysis. ANSYS is used to establish a solid model of the energy storage cabinet, and the geometric structure of its battery module is simplified. CFD is used to feed in the data of entrance and exit conditions, boundary conditions, material physical parameters, fluid physical parameters, environmental parameters, and battery heat generation, so that the energy storage cabinet can be simulated completely. The purpose is to analyze the temperature distribution of different kinds of operation conditions in energy storage cabinets. That we can apply the computed temperature distribution for the battery SOC estimation from the Kalman predictor. The heat dissipation in the battery module and the heat exchange in the ceiling interlayer are beyond its scope, so the lump battery system hypothesis is adopted to simplify the 3D model. It is assumed that the cold air system in the ceiling interlayer can make complete heat exchange. The concept of lump battery heat source is to replace the geometric model of single battery, battery pack, wire, tab, housing, and other components with homogeneous lump geometry. It has the advantages of easy mesh generation, higher meshing quality, and lower mesh numbers to complete numerical discretization.
The battery pack is regarded as a hypothesis composed of core and housing. The complex geometry of all battery modules in the energy storage cabinet is simplified in the same way. All single batteries in the original battery module are assumed to be a single entity with isotropic homogeneous materials, in which the battery core is made of battery composite materials, the battery pack housing is made of heat-resistant plastic, the battery box housing is made of metal steel plates, and the cooling fluid is air. Conjugate heat transfer analysis is carried out for the battery modules and battery cabinets in the energy storage cabinet, and the boundary conditions are shown in Table 3 and Table 4.

2.8. Heat Generation of Al-Battery

The total heat, Qtot, generated by the battery in use is composed of Joule heat and entropy change, which can be divided into irreversible heat Qirr and reversible heat Qrev. Fundamentally, the main heat-generating positions of batteries are anode, cathode, separation film, and electrode sheet, and the above positions include electrochemical reaction ohm’s heat. For thermodynamic, assuming that the battery reaction is ideally reversible, the Equation (39) of the battery equation at constant temperature is as follows:
Δ H = Δ G + T Δ S
Among them, enthalpy change ΔH is obtained by Gibbs function ΔG energy transformation and entropy change ΔS energy compensation. According to reference [34], Equation (39) can be rewritten into Equation (40).
Q t o t = Q i r r + Q r e v
The generation of irreversible heat is caused by the electrochemical polarization inside the battery and the overpotential of the battery electrode, which is expressed in Equation (41).
Q o v e r = I ( E E e q )
When electric current I flows through the battery to produce electrochemical polarization, its voltage E drops from the OCV to the operating voltage Eeq, and the heat loss caused by this electrochemical polarization dissipates with the air and is described by the following Equation (42):
R i r r = R int ( T , S O C ) × I 2
In Equation (42), the internal resistance of Rint (Ω) depends on SOC and operating temperature T (K); I is the magnitude of current (A), but the heat generated due to entropy change is expressed as:
Q e n t r o p y = T Δ S 1 n F
ΔS can be expressed as Equation (44):
Δ S = Δ G Δ T = n F E e q T
After using Gibbs equation, T is the temperature of the battery. The current of the battery is positive when charging, and the current of the battery is negative when discharging. F is Faraday constant, Eeq is the OCV of the battery, and n is the charge number related to the reaction, in which ∂Eeq/∂T can be obtained by experiment.
The equation of reversible heat can be expressed as Equation (45). The amount of irreversible heat depends on the battery current and internal resistance. Therefore, the temperature and SOC significantly affect the calorific value of the battery. In fact, the internal resistance of the battery varies with the temperature and SOC. Equation (45) is obtained by integrating the above Equations (39)–(44).
Q t o t = R int ( T , S O C ) × I 2 I T E e q T
However, the reversible heat depends partly on the battery temperature, current, and entropy temperature coefficient. Generally speaking, under normal working environment, the battery can only transfer heat and dissipate heat by convection through the battery surface, and the governing equation of convection can be expressed by Equation (46):
q c o n v e c t i o n = h A ( T b T a m b )
where qconvection is heat transfer (W), h is heat convection coefficient W/m2K, A is contact surface area (m2) between fluid and battery, Tb is battery temperature (K), and Tamb is environmental temperature (K).
According to the heat generation equation [35], the power generation of different kinds of batteries can be calculated effectively according to battery type, impedance, temperature coefficient, and other battery heat generation parameters. The volume heat generation power density of battery modules can be converted, which is beneficial to CFD to calculate battery heat generation and simulate heat dissipation. Because of the different volumes and energy densities of each type of battery, different types of batteries have different power levels under the same volume. Therefore, in order to make the simulation really close to the actual state, the volume energy density is used to convert the battery power, so the calculated single-core power and the specifications of the single core module and cabinet are shown in Table 5.

2.9. Mesh and Mesh Independence Test

In computational fluid dynamics, the number of mesh is one of the ways to accelerate computation time, but there is a critical mesh number that is sufficient for reasonable results. When solving from rough mesh, the results may be different with the continuous refinement of the mesh. There is a critical value for mesh refinement. Even if it exceeds this critical value, the same results will be observed. It can be proved that our mesh model has achieved mesh independence. The mesh will be fine enough to capture the most complex details of the fluid, which is why the mesh will be finer without making any changes to the results.
When using finite elements method to calculate engineering problems, we should check any possible numerical problems, and the numerical calculation errors are mainly truncation errors. These errors tend to accumulate gradually in the calculation process, resulting in CFD simulation results that do not conform to the physical meaning. However, if the calculation results seem to be relatively reasonable on the whole, it may be found that there are relatively large errors at specific positions in the flow domain afterward. The control of computational error is an important step to obtain reliable and meaningful CFD simulation results. The grid-independent test results are shown in Figure 10. In this study, using ANSYS Mesh for meshing, when the grid numbers reach 4,000,000, the current simulation seems to obtain stable results, and therefore mesh number 4,000,000 is used in this study.

3. Results and Discussion

In this chapter, the results of SOC estimation of battery and thermal analysis of energy storage cabinets are analyzed, respectively. In the part of battery SOC estimation, a series of verification simulations and tests are carried out in order to verify the convergence, estimation ability, and anti-noise ability of the extended Kalman filter estimation architecture. In order to understand the influence of the operating temperature on the SOC estimation, this paper simulates the dynamic stress test (DST) at different temperatures and analyzes the results. In the part of thermal analysis of energy storage cabinets, this paper uses CFD to simulate the temperature distribution and heat transfer state of battery cabinets, analyzes the heat dissipation state of different kinds, and discusses the influence of temperature.

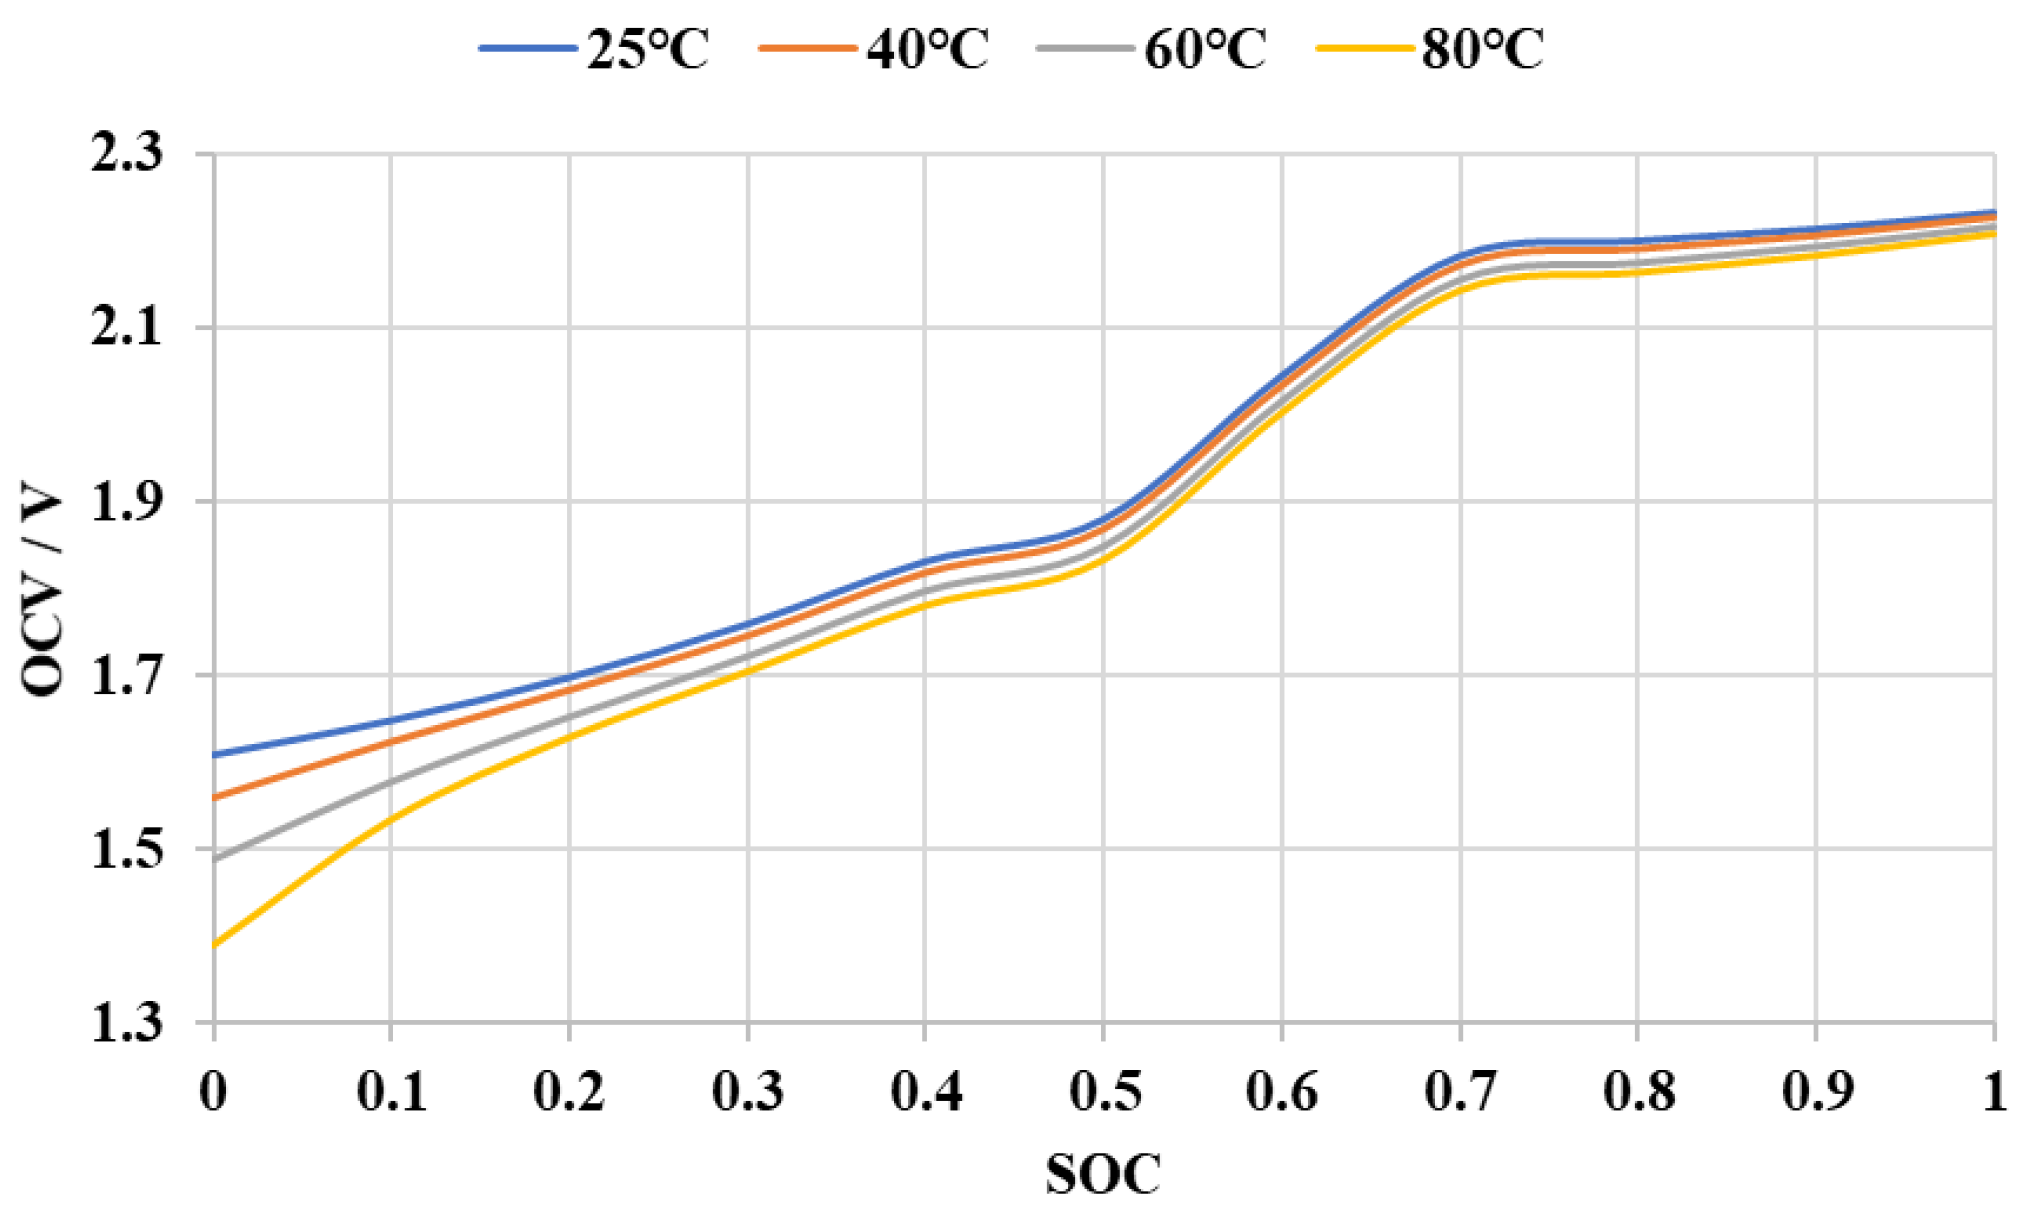
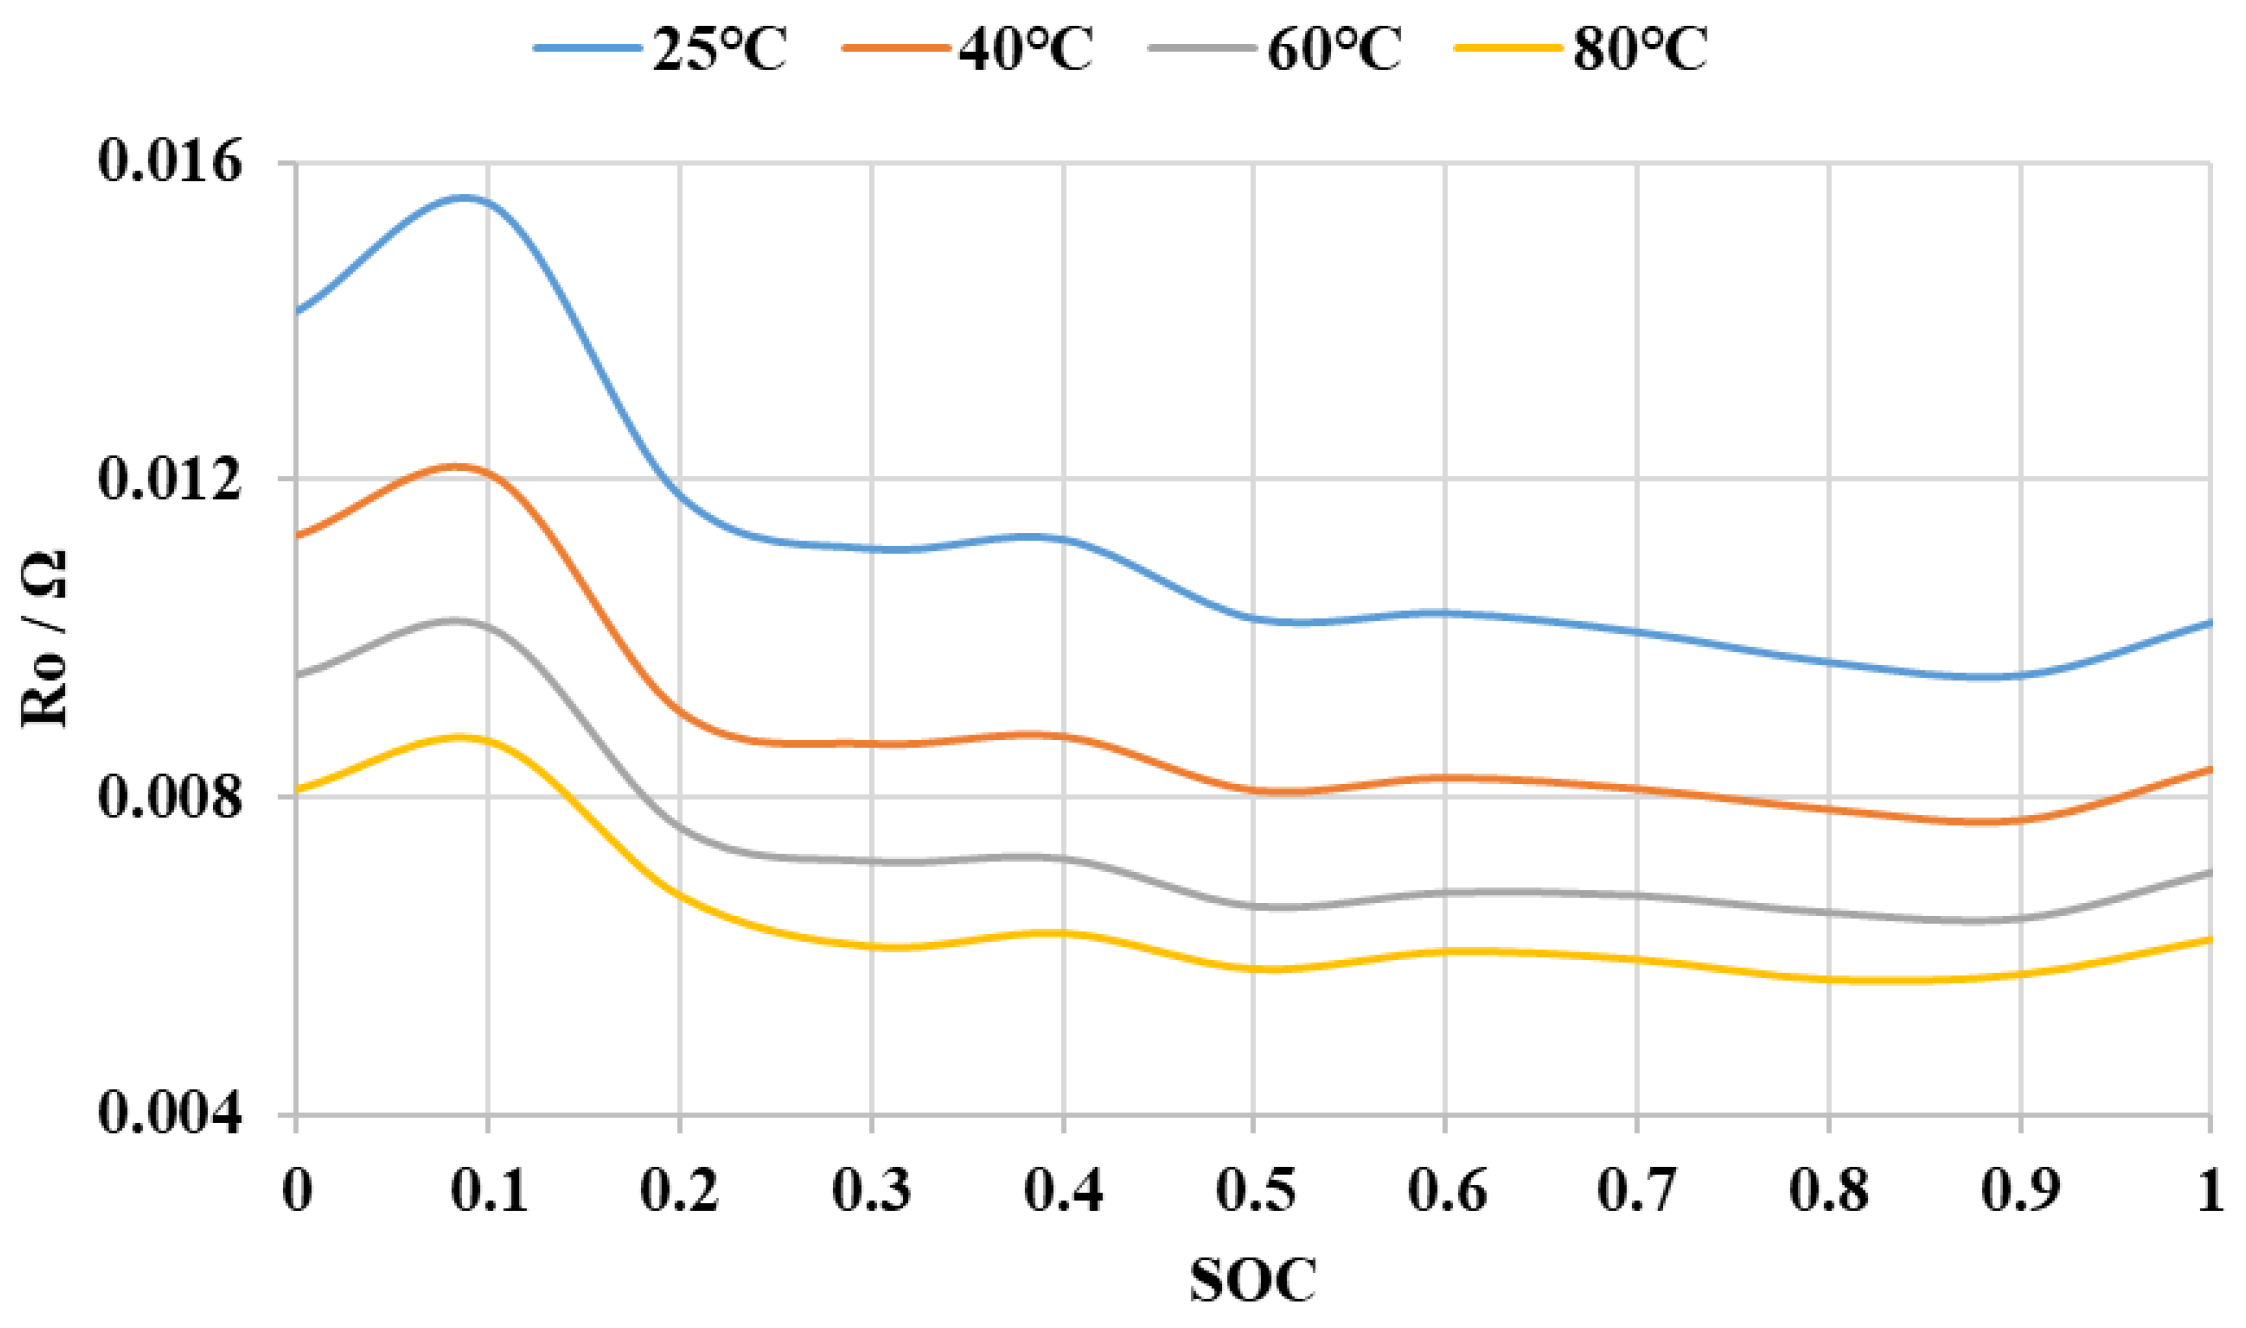
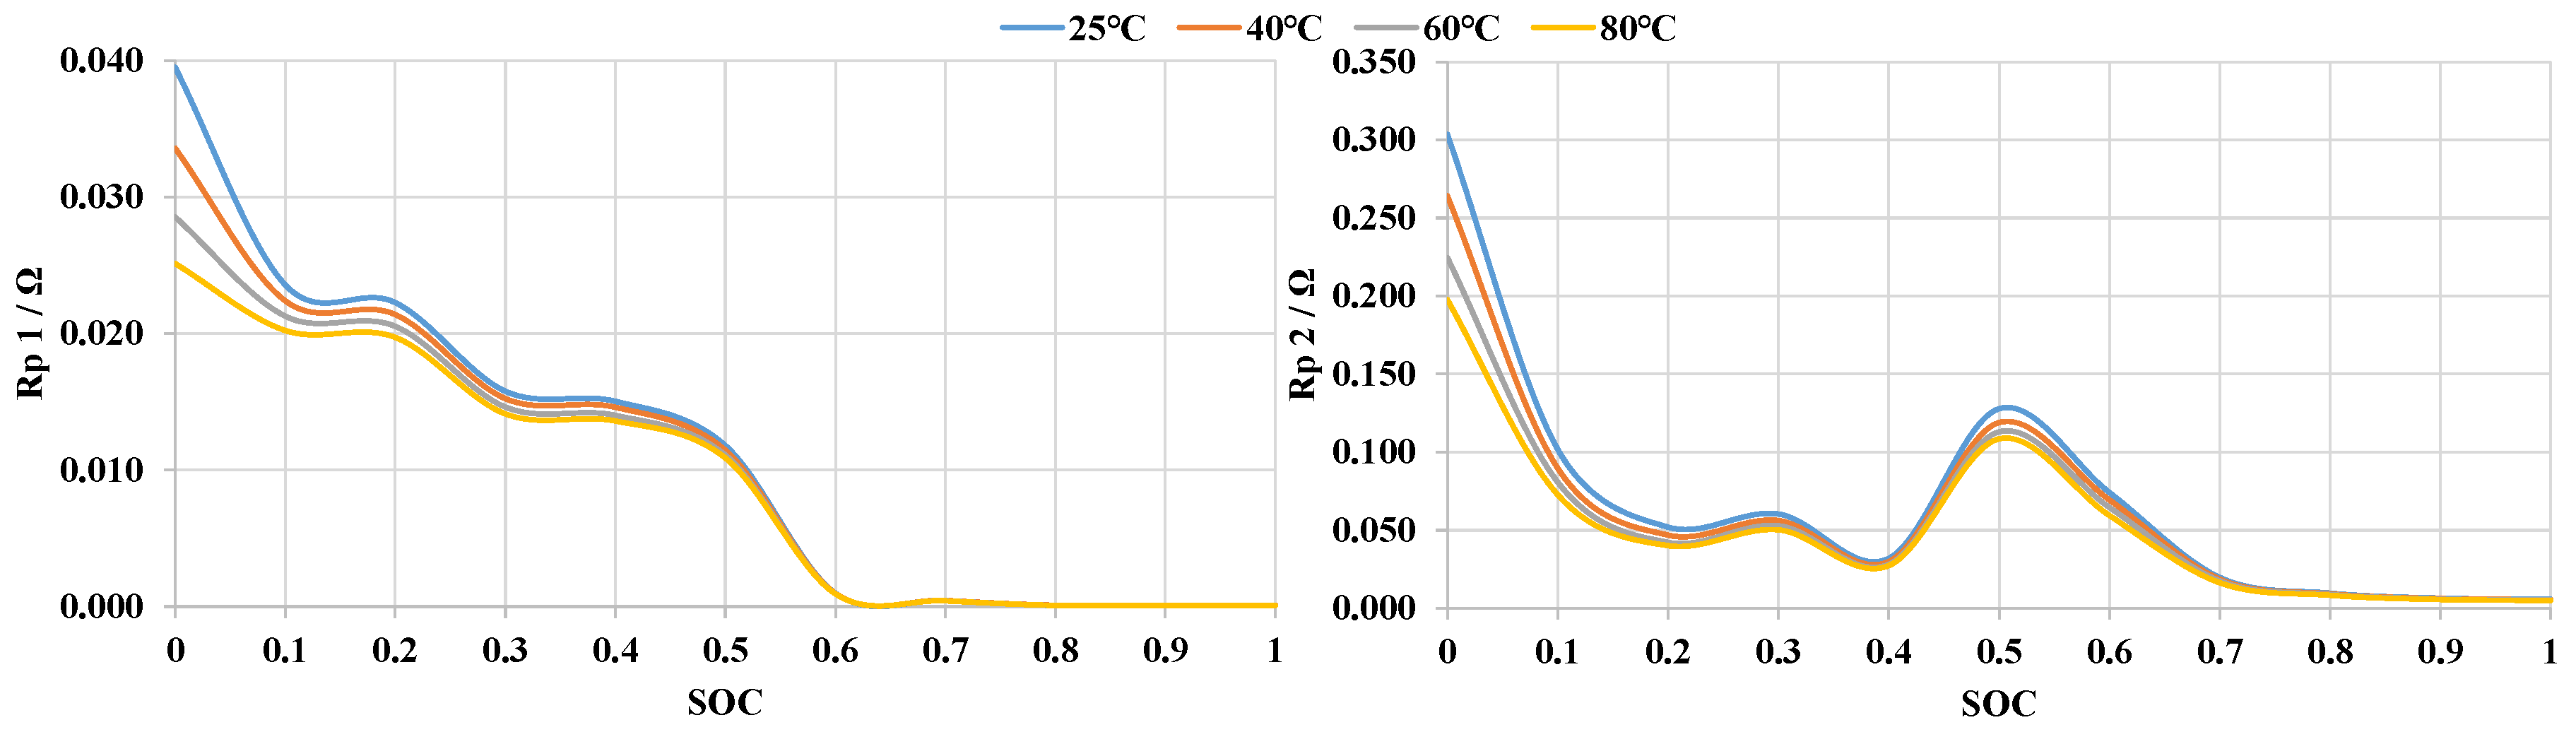
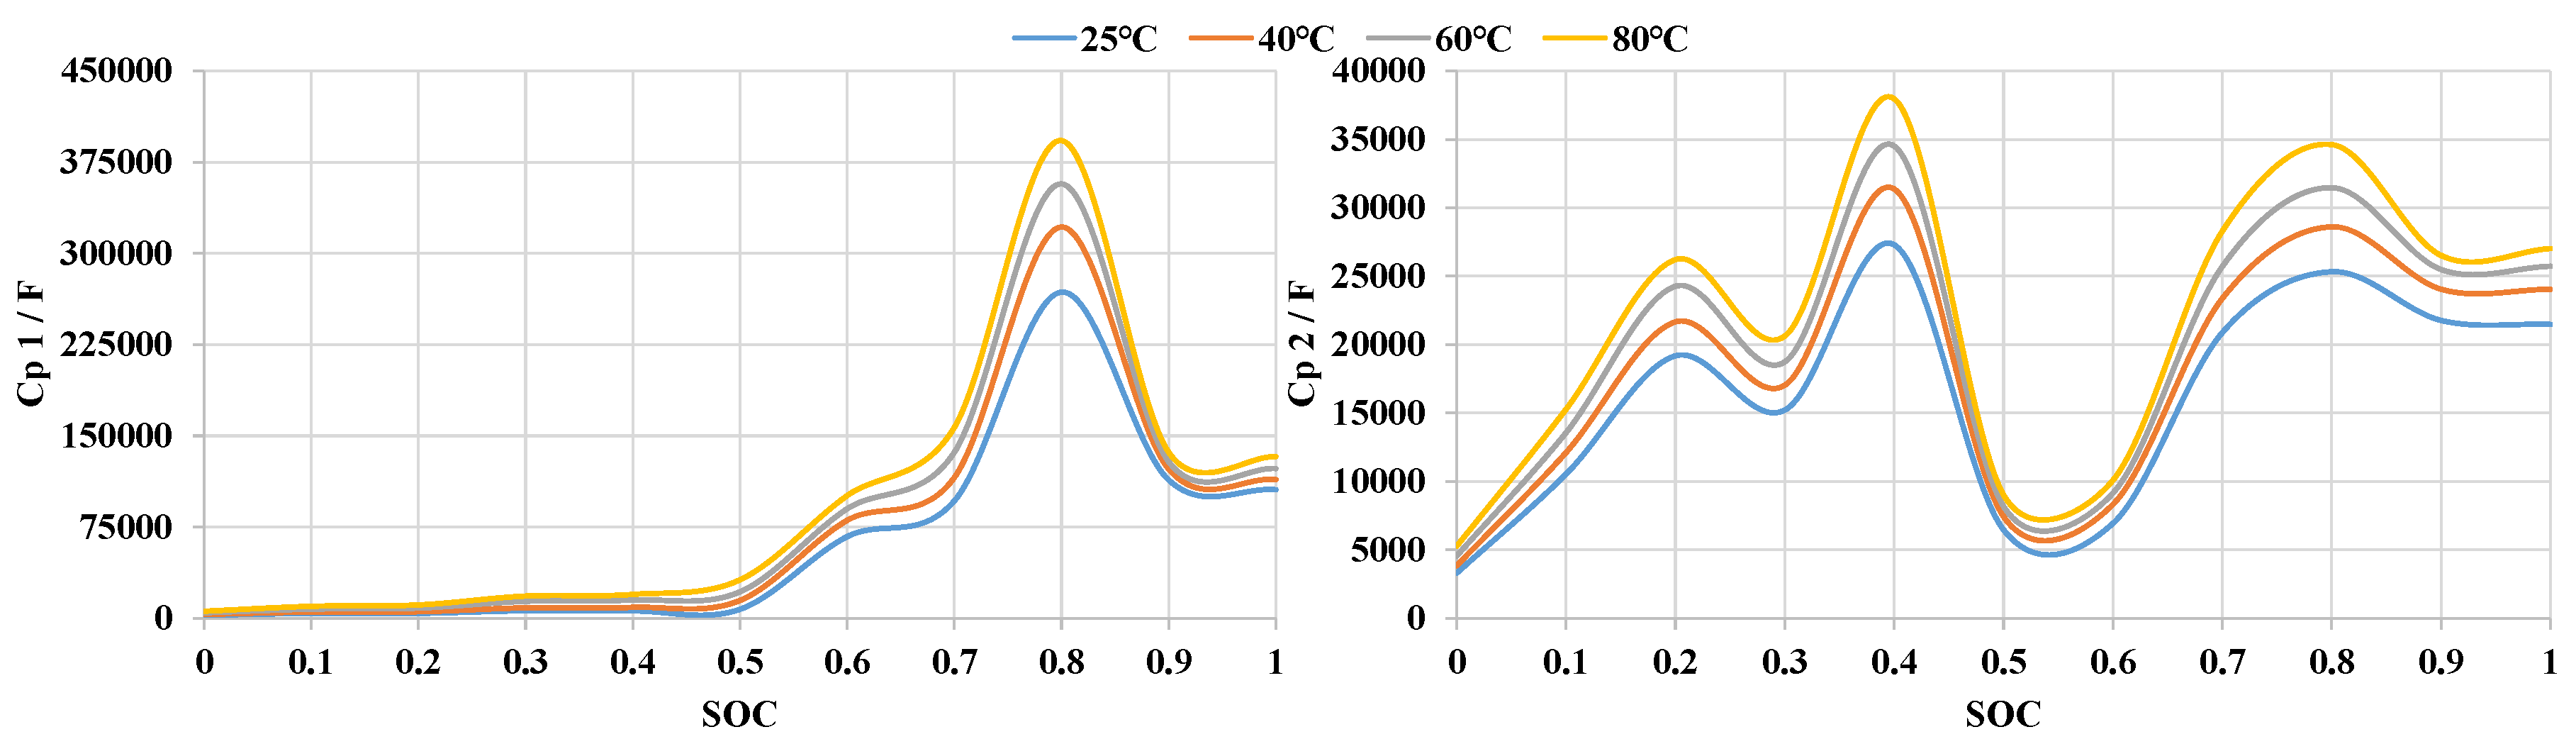
3.1. Establishment of Battery Equivalent Model

A DPPC battery test is carried out on AlB at different temperatures, and the battery voltage equation derived from the Thevenin second-order equivalent circuit battery model is fitted by the least square method to obtain the battery model parameters. Figure 11 shows the relationship between the Open Circuit Voltage (OCV) and the SOC at different temperatures. When the battery is less than 10% SOC for all four different temperature states, the OCVs of the battery would present as 1.65 V, 1.56 V, 1.49 V, and 1.4 V for the battery temperature at 25 °C, 40 °C, 60 °C, and 80 °C, respectively. Obviously, the battery temperature difference of 55 °C (80–25) decreases the OVC for 0.25 V at temperature 80 °C.
Figure 12, Figure 13 and Figure 14 show the ohm’s internal resistance Ro, electrochemical polarization capacitance Cp1 and resistance Rp1, and concentration polarization capacitance Cp2 and resistance Rp2 of the battery at different temperatures, respectively. It is found that operating temperature has a great influence on battery model parameters. Ohmic resistance, electrochemical polarization resistance, and concentration polarization resistance decrease with increasing temperature, while electrochemical polarization capacitance and concentration polarization capacitance increase with increasing temperature. When SOC is less than 10%, the ohmic resistance, electrochemical corrosion polarization resistance, and concentration polarization resistance increase significantly. The SOC of aluminum batteries has a considerable correlation with battery model parameters. When the SOC is less than 10%, it has an obvious influence on model parameters. For the SOC range between 20 and 90%, the model parameters of the batteries are represented in a stable way.
From Figure 12 and Figure 13, it can be seen that when the working temperature of the battery is higher, the ohm’s internal resistance Ro, electrochemical polarization resistance Rp1, and concentration polarization resistance Rp2 all start to produce violent chemical reactions in the electrolyte, positive electrode material, and negative electrode material inside the battery due to the increase in the working temperature of the battery, and then the higher the working temperature of the battery, the lower the battery resistance.
As can be seen from Figure 14, the increase in battery operating temperature also causes the increase in electrochemical reaction polarization capacitance Cp1 and concentration polarization capacitance Cp2, which is because the polarization and chemical reactions inside the battery produce a more intense chemical reaction with the increase in temperature, which makes the discharge of the battery more stable and causes the increase in capacitance value.
The ohmic resistance (Ro), electrochemical corrosion polarization capacitance (Cp1), electrochemical corrosion polarization resistance (Rp1), concentration polarization capacitance (Cp2), and concentration polarization resistance (Rp2) were identified by using the above-mentioned battery model state equation and DPPC battery test. By applying the DPPC-curve-fitting parameters of 10 stages into the curve, the ohm’s internal resistance, polarization resistance and capacitance, OCV, and other parameters are obtained, and the parameters are brought into the model, and the battery model is established on MATLAB Simscape platform, as shown in Figure 15.

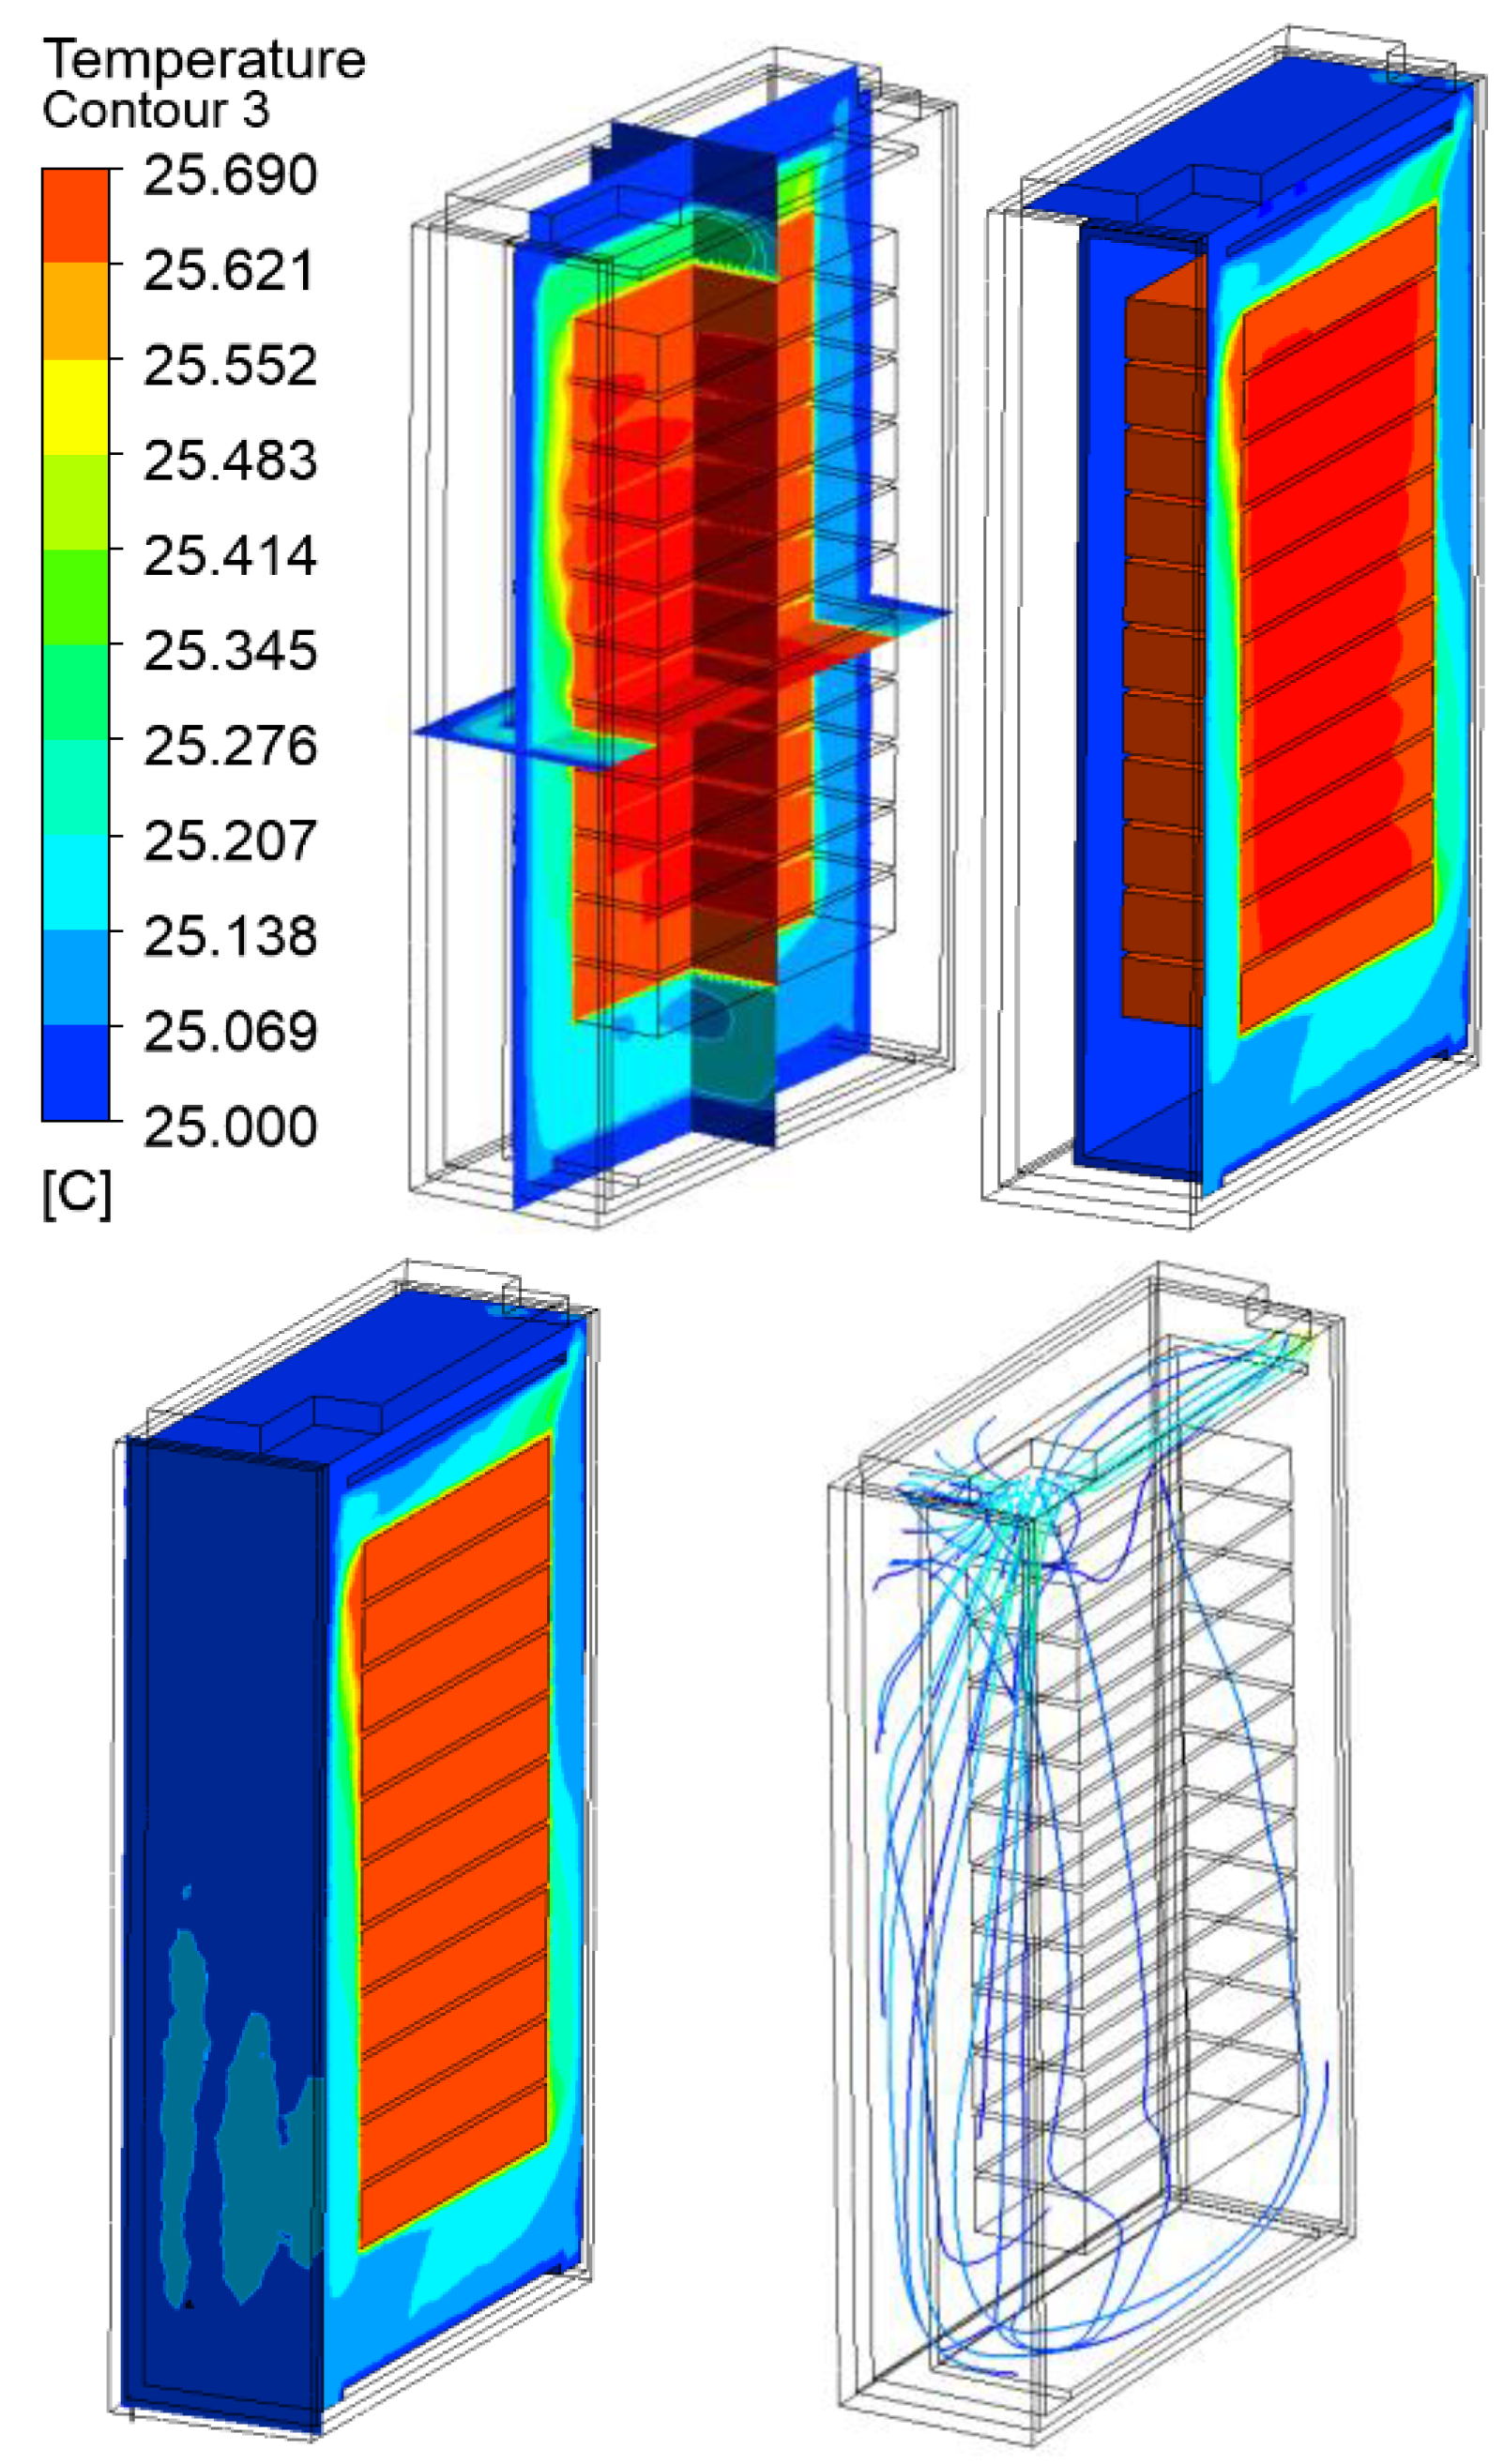
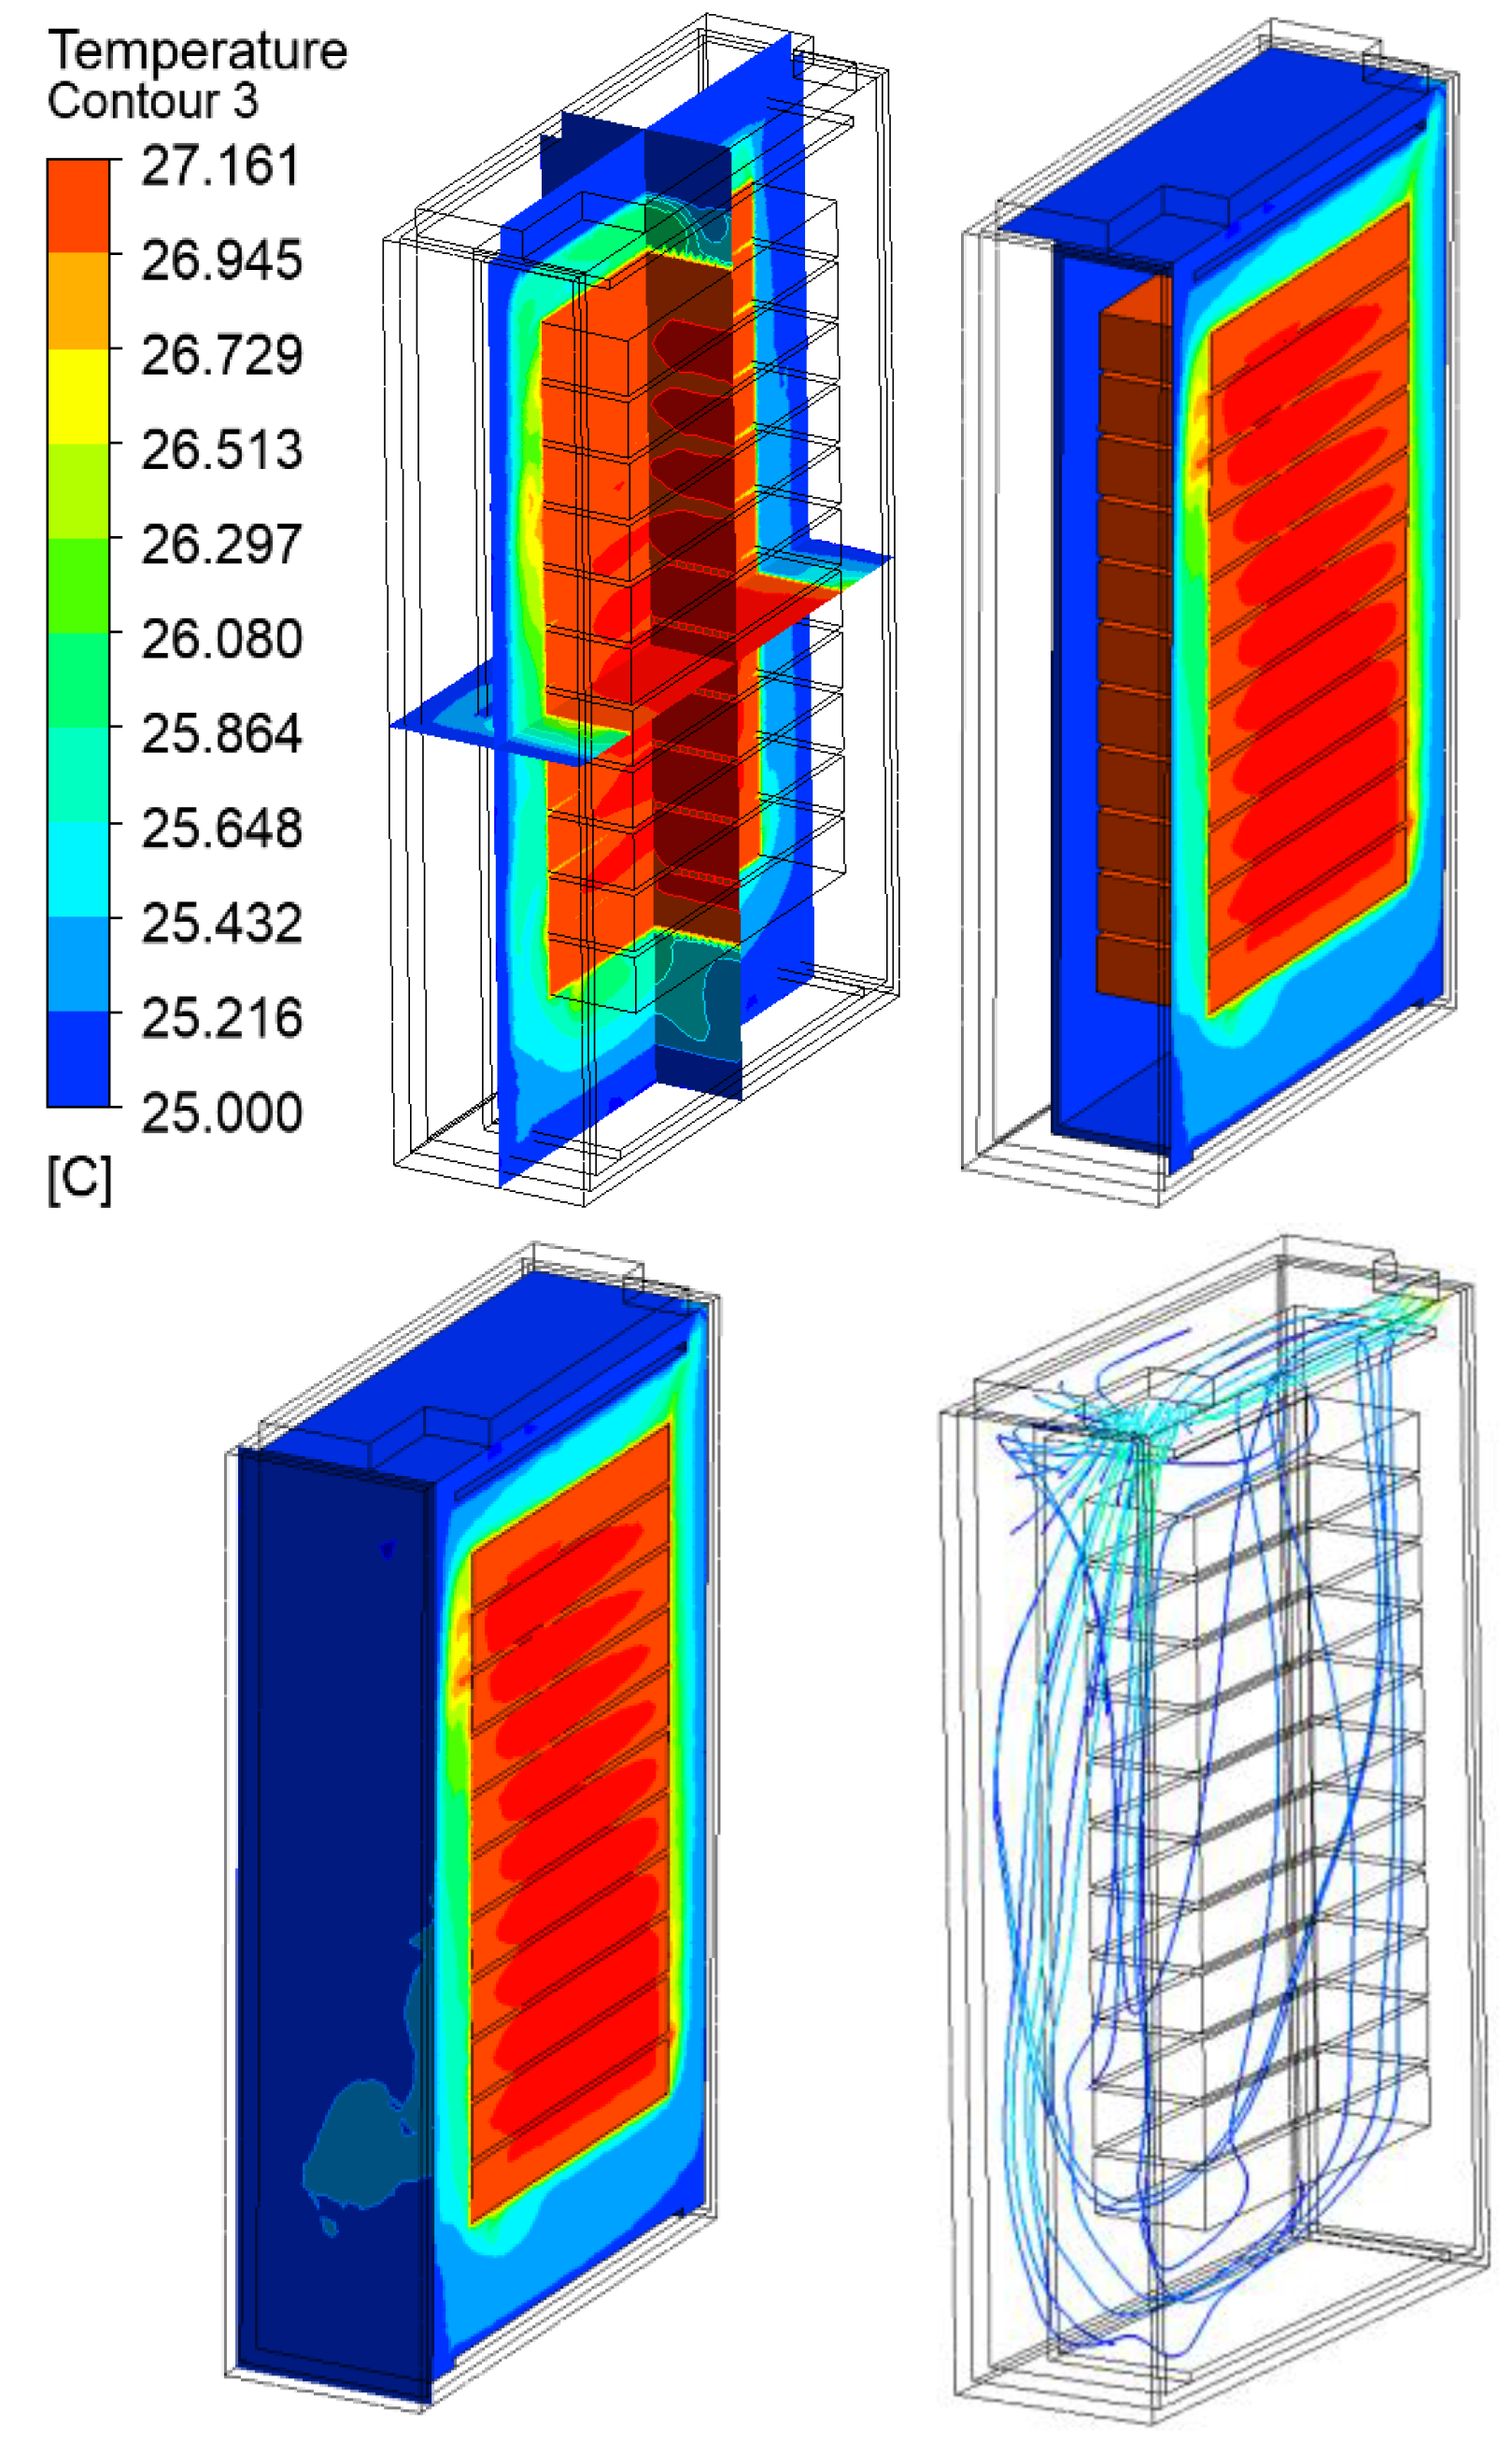
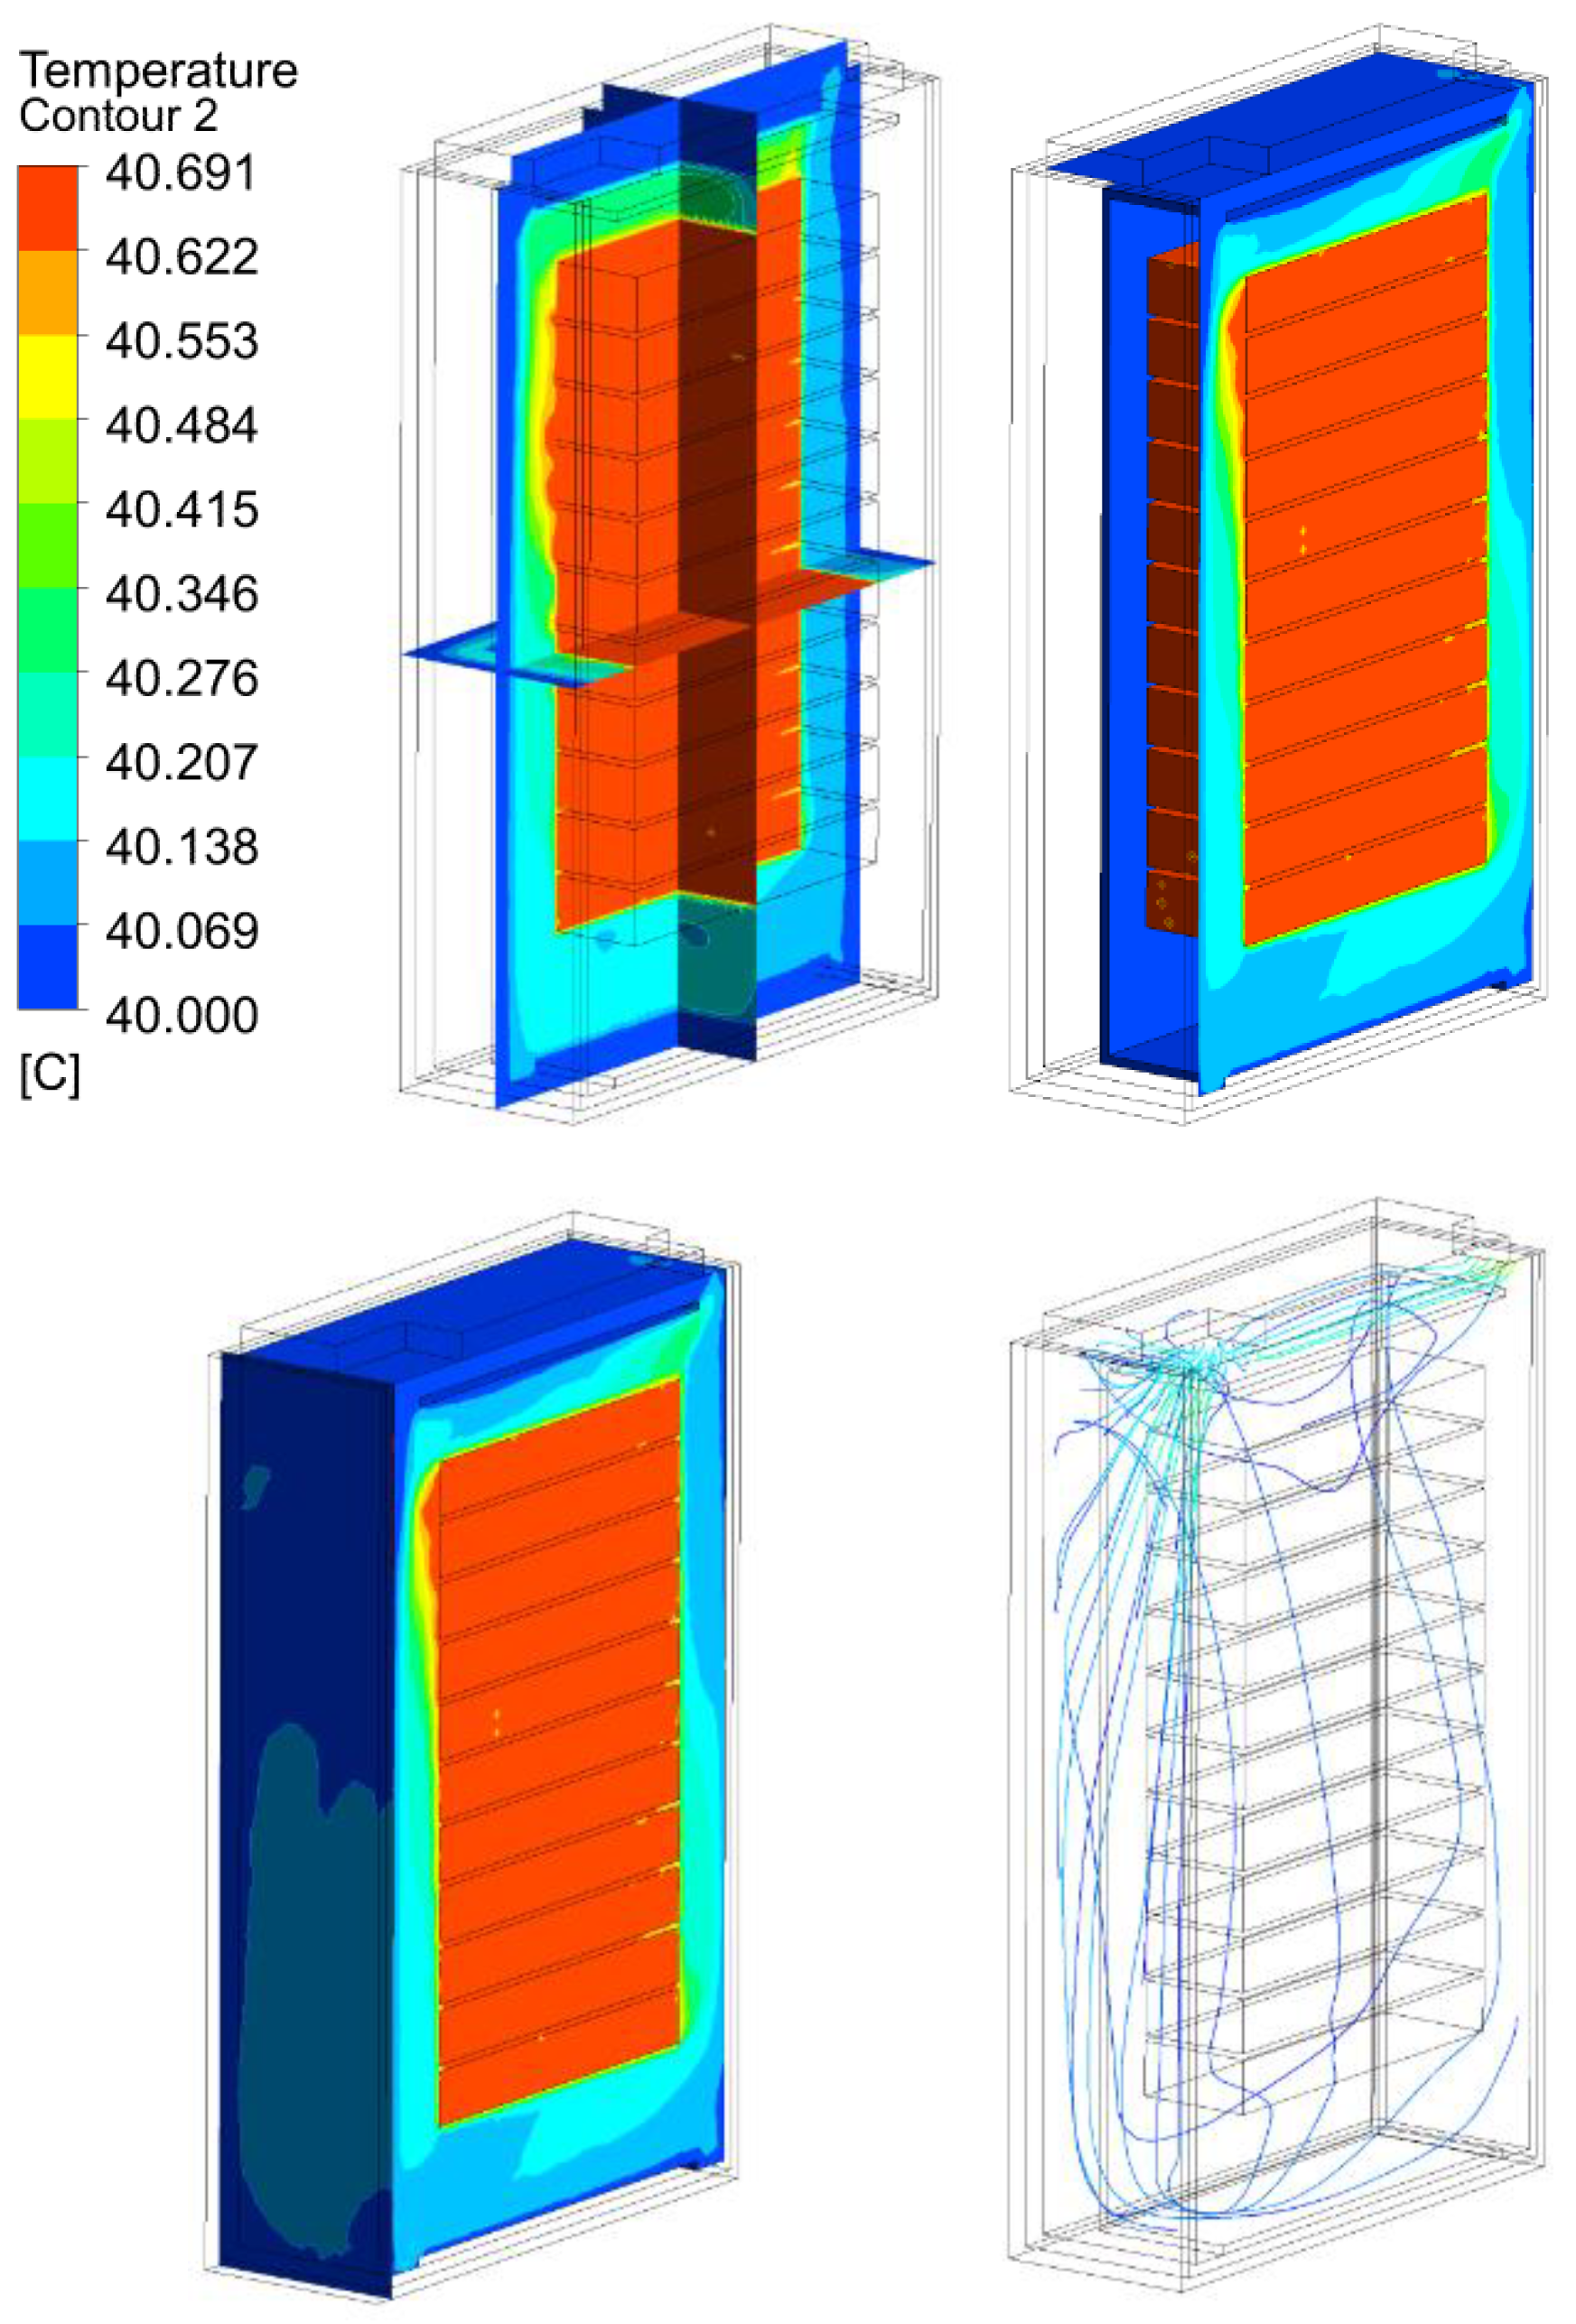
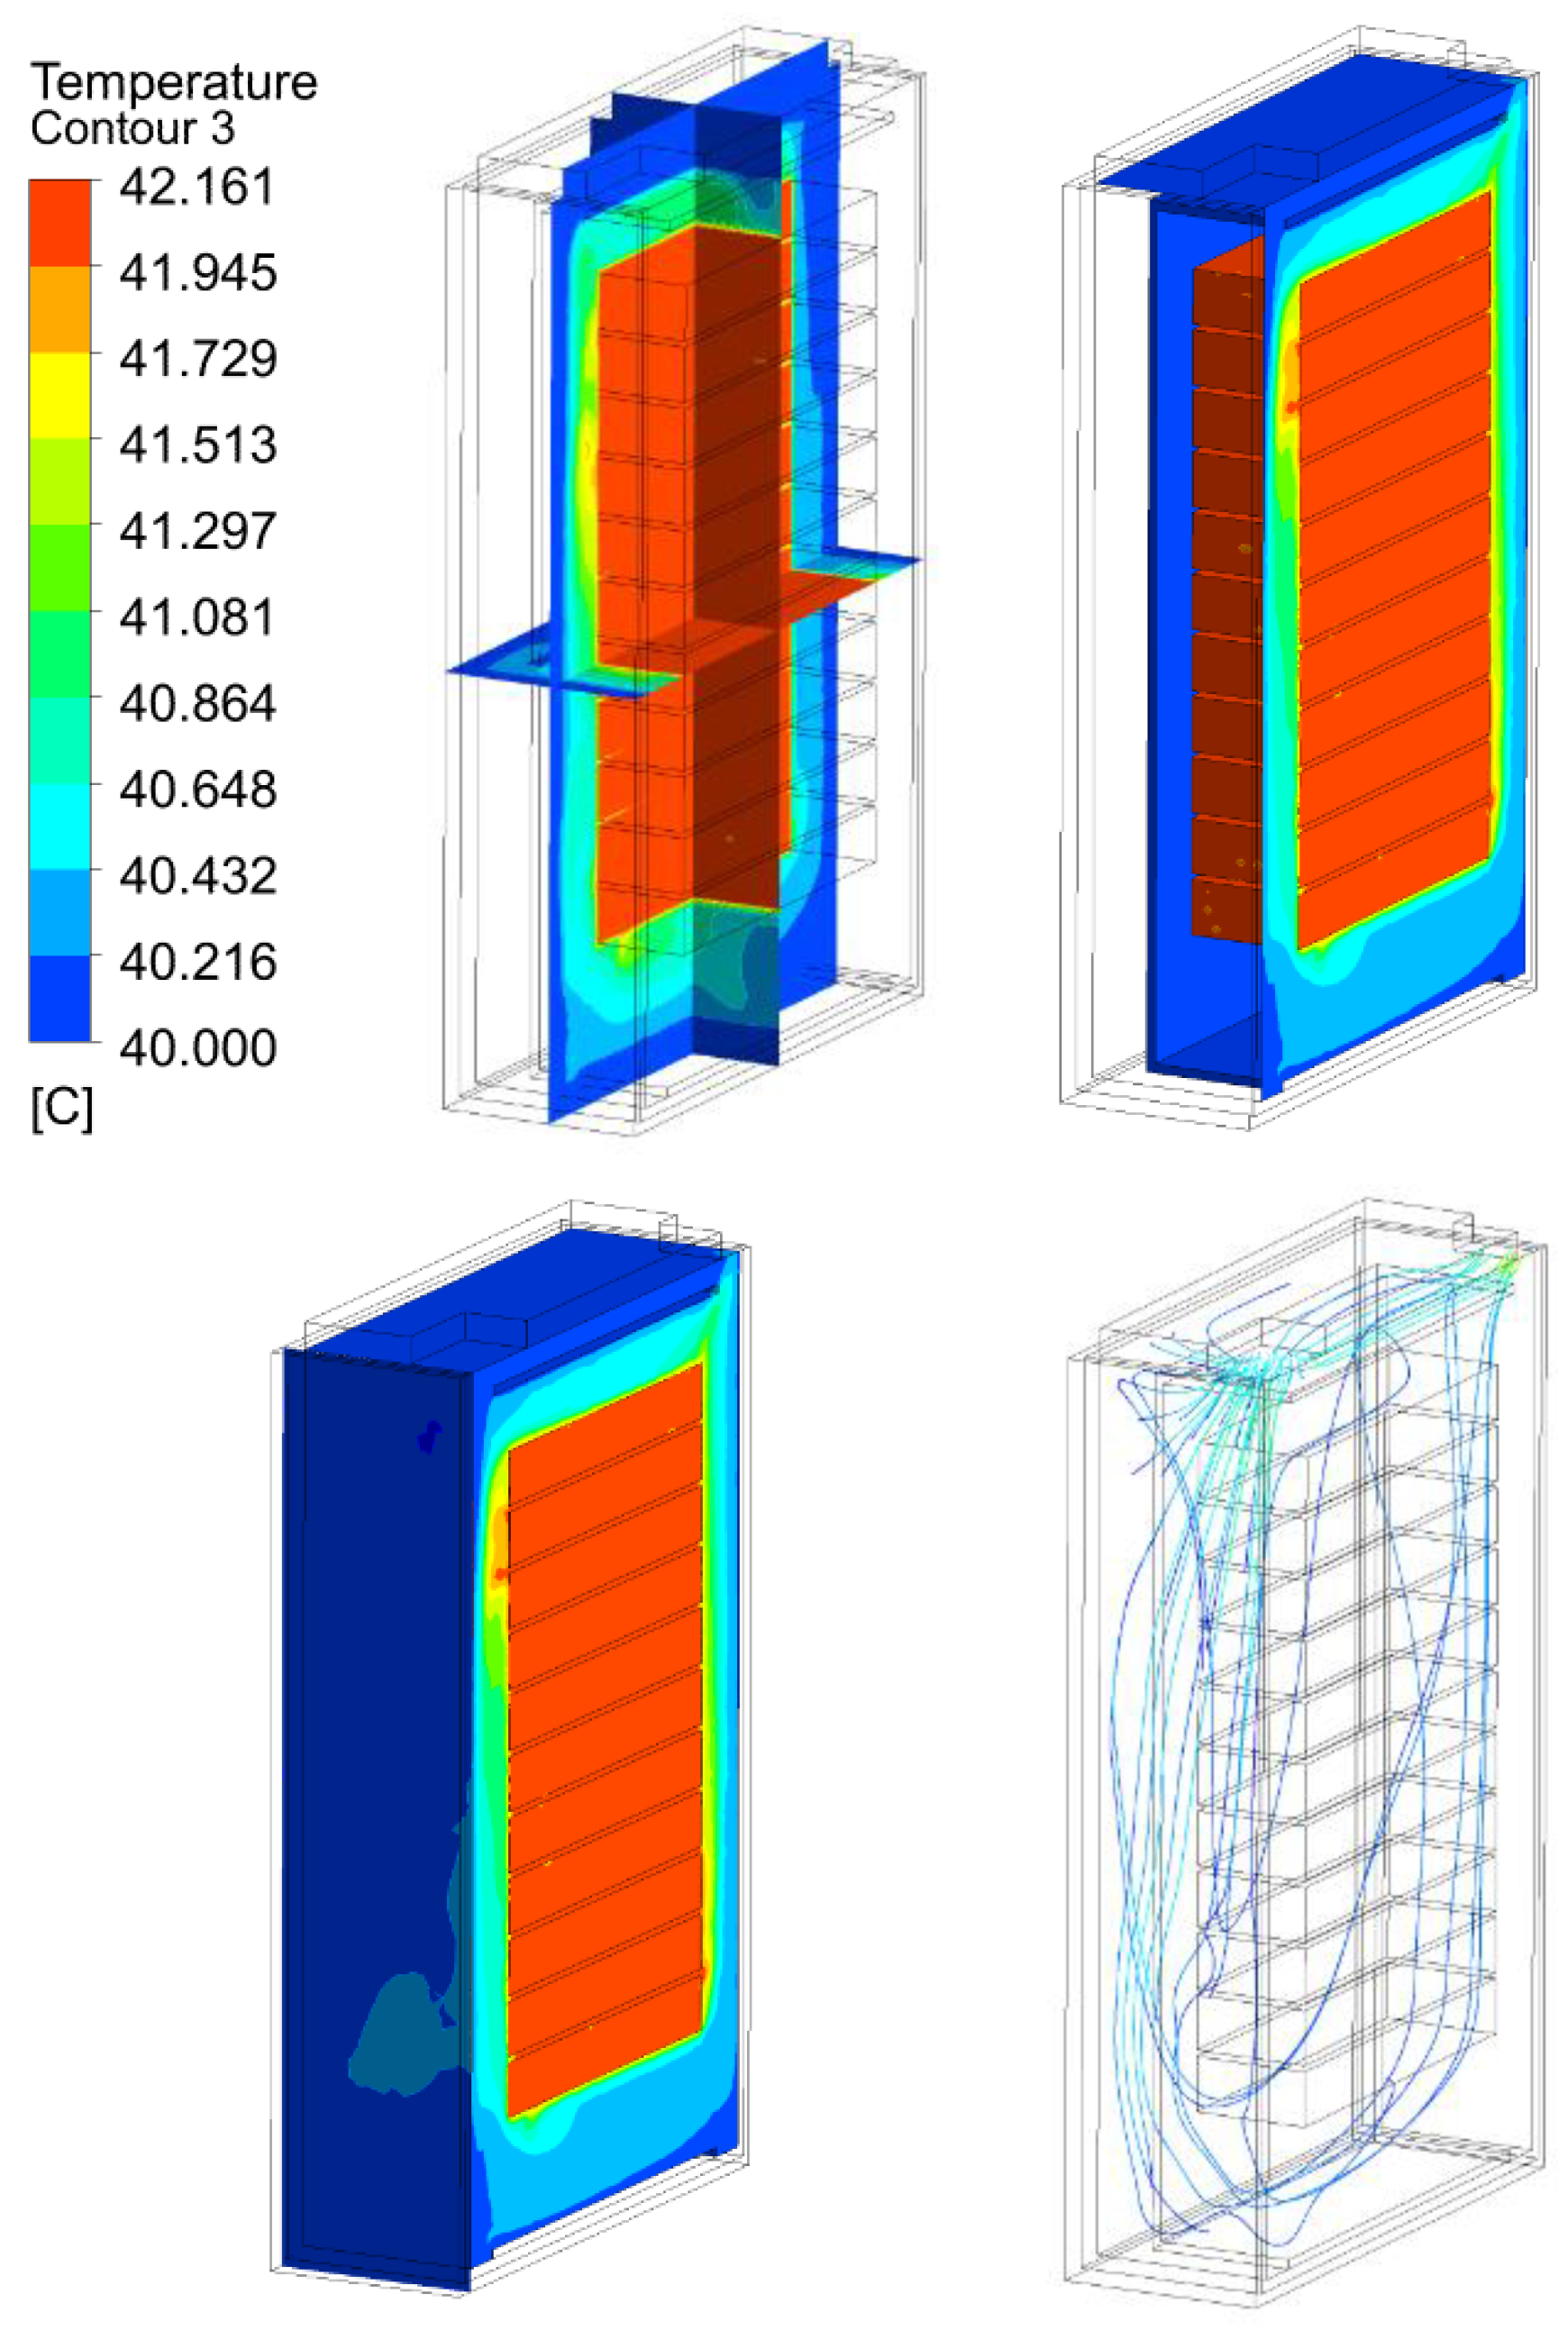
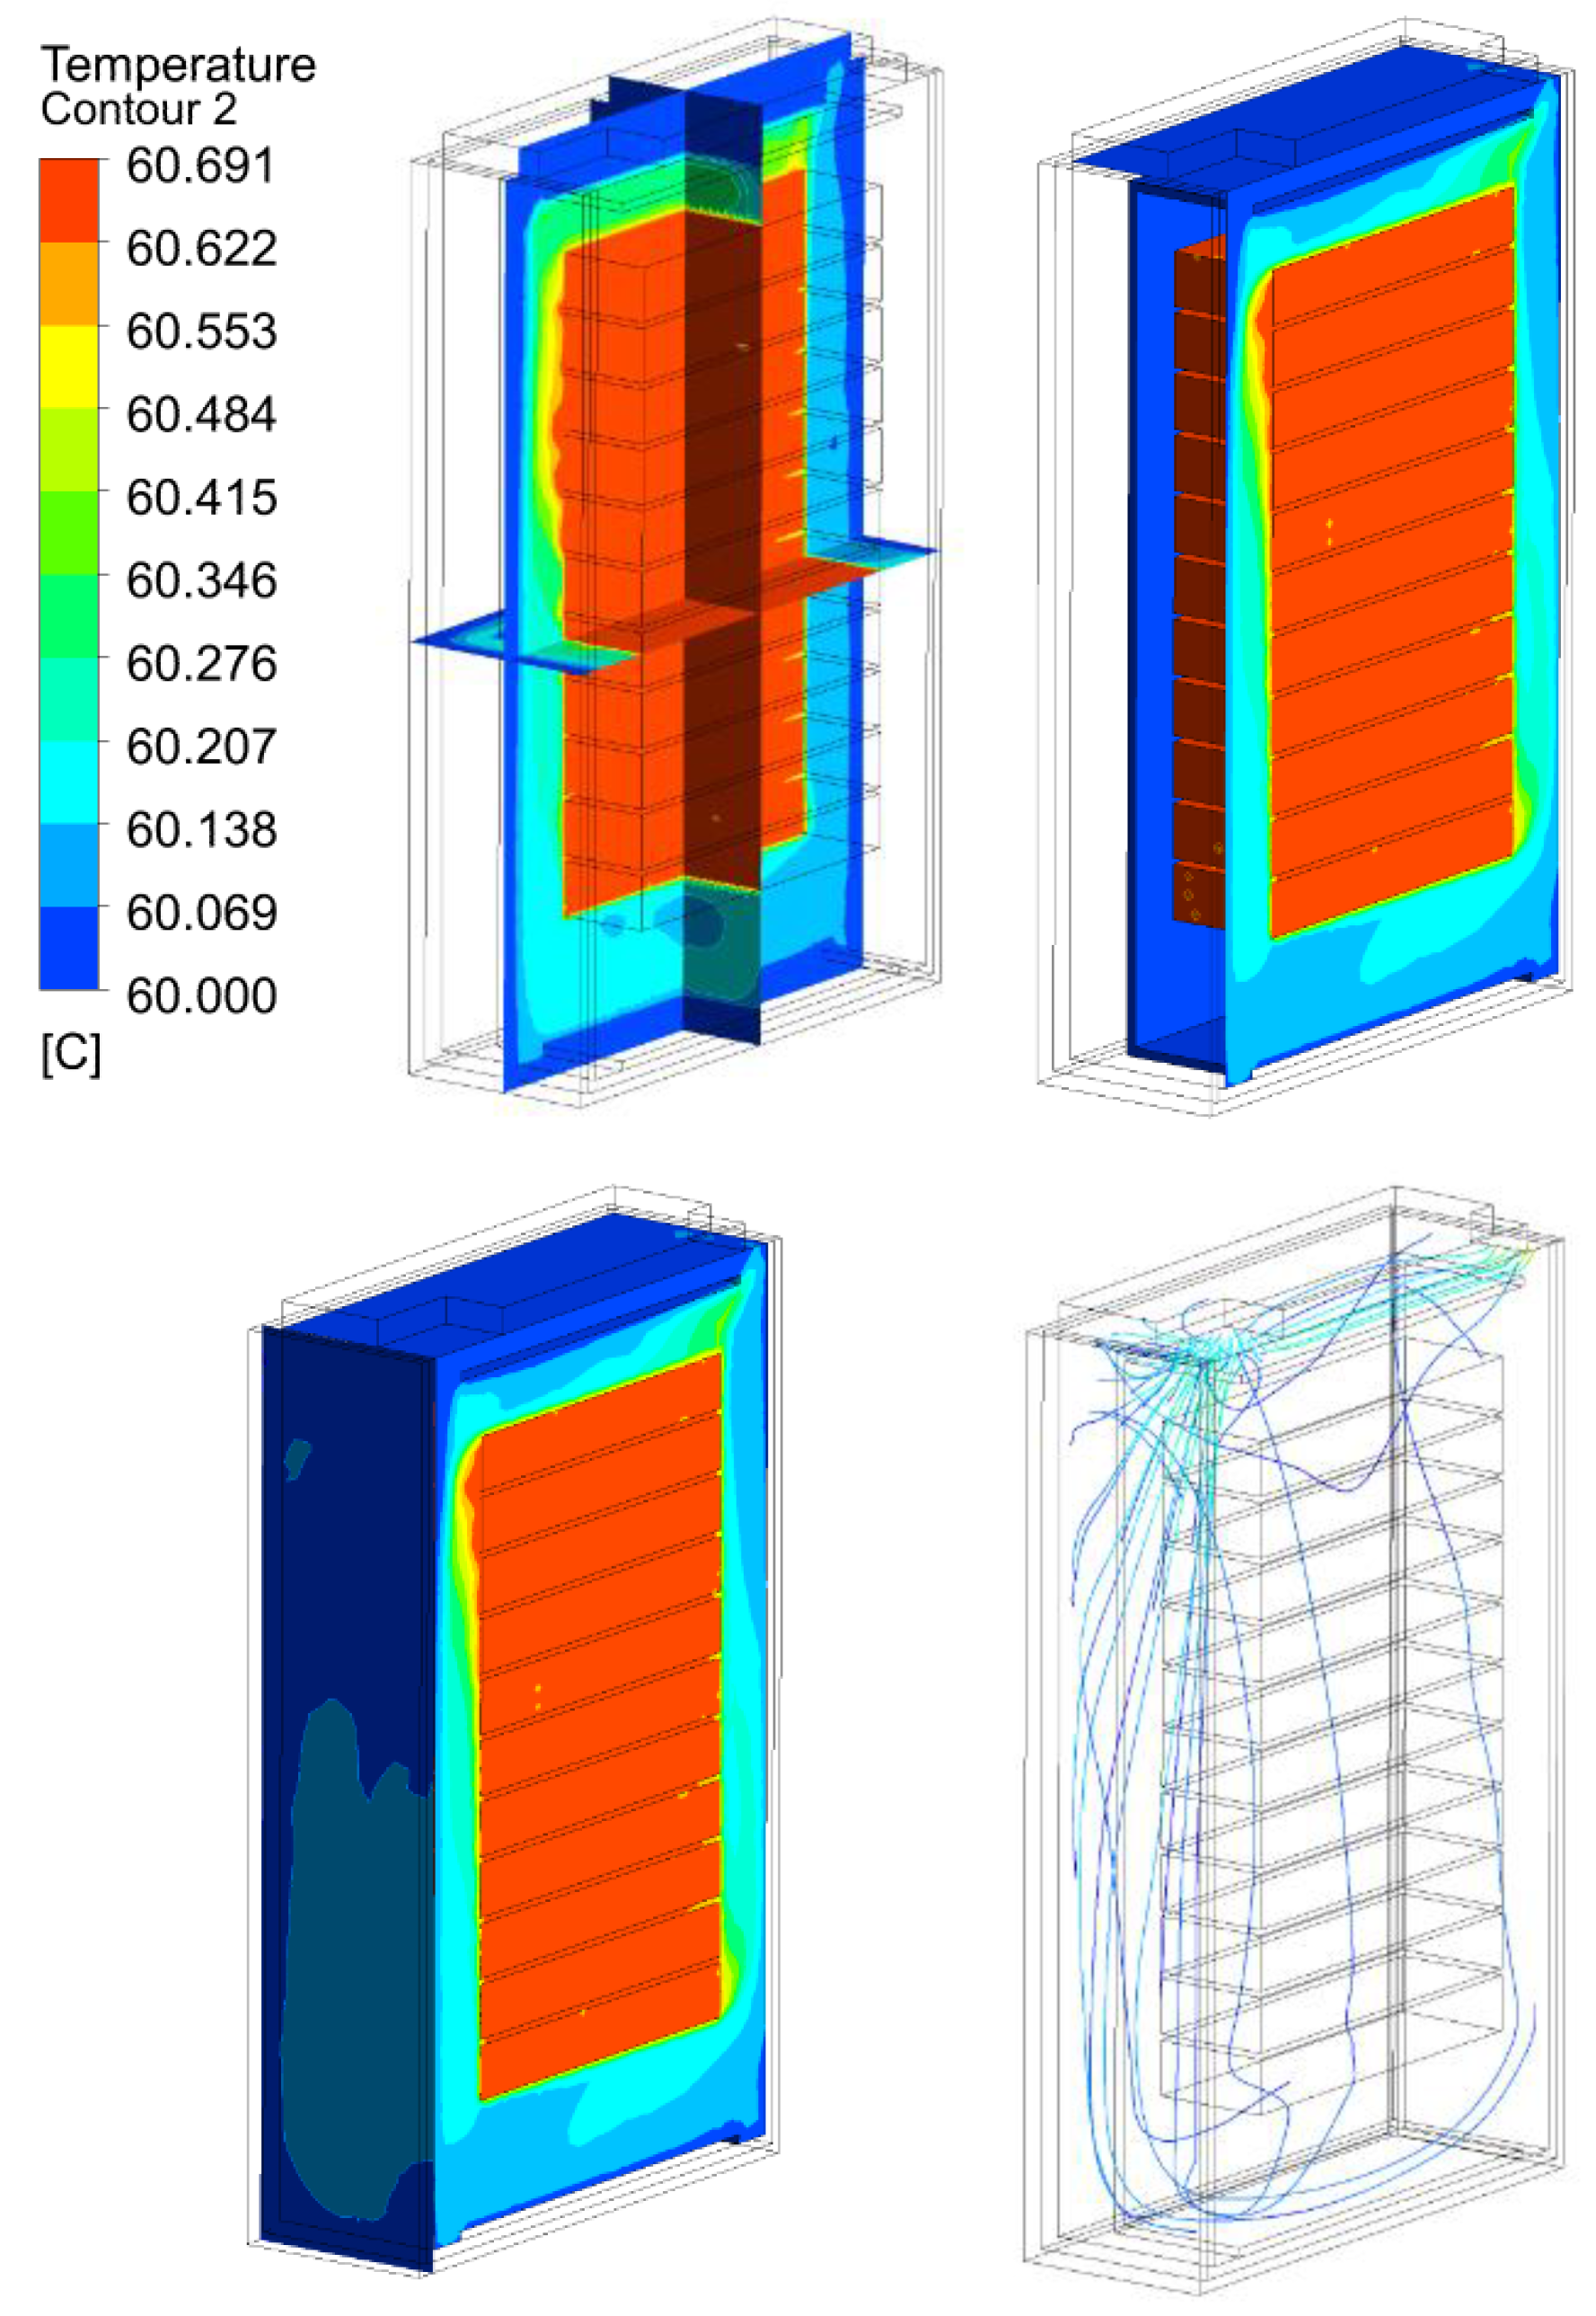
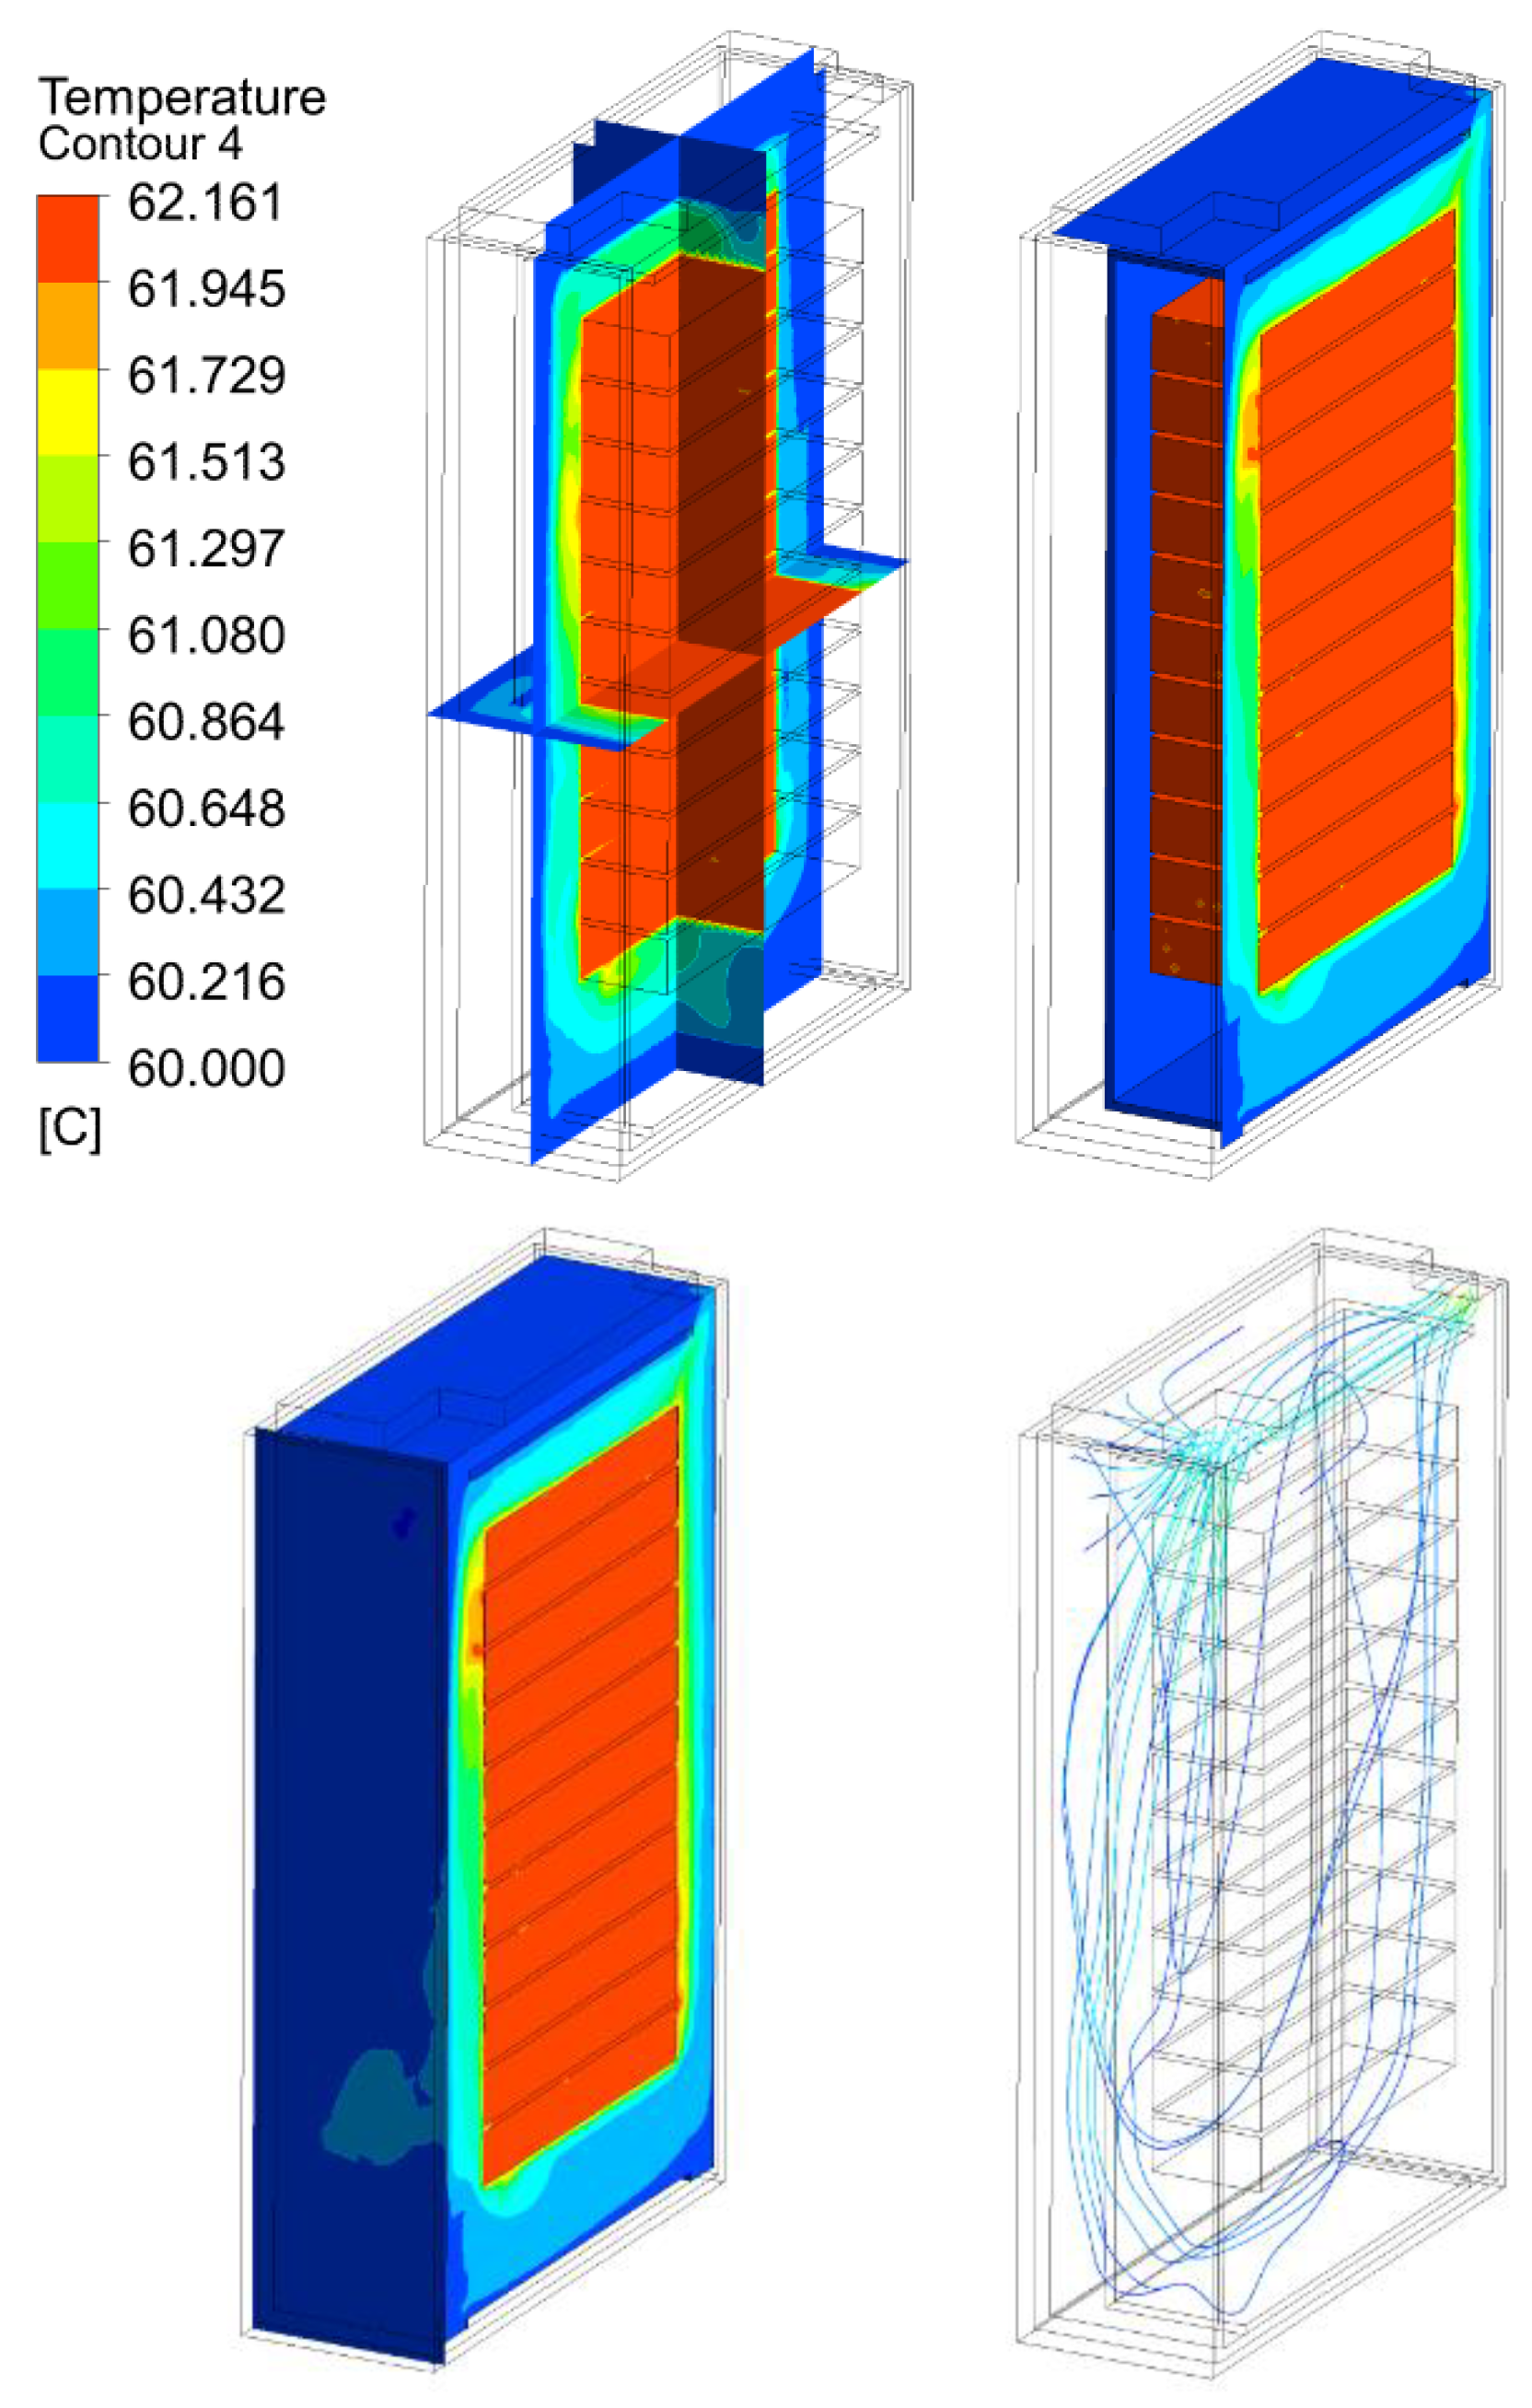
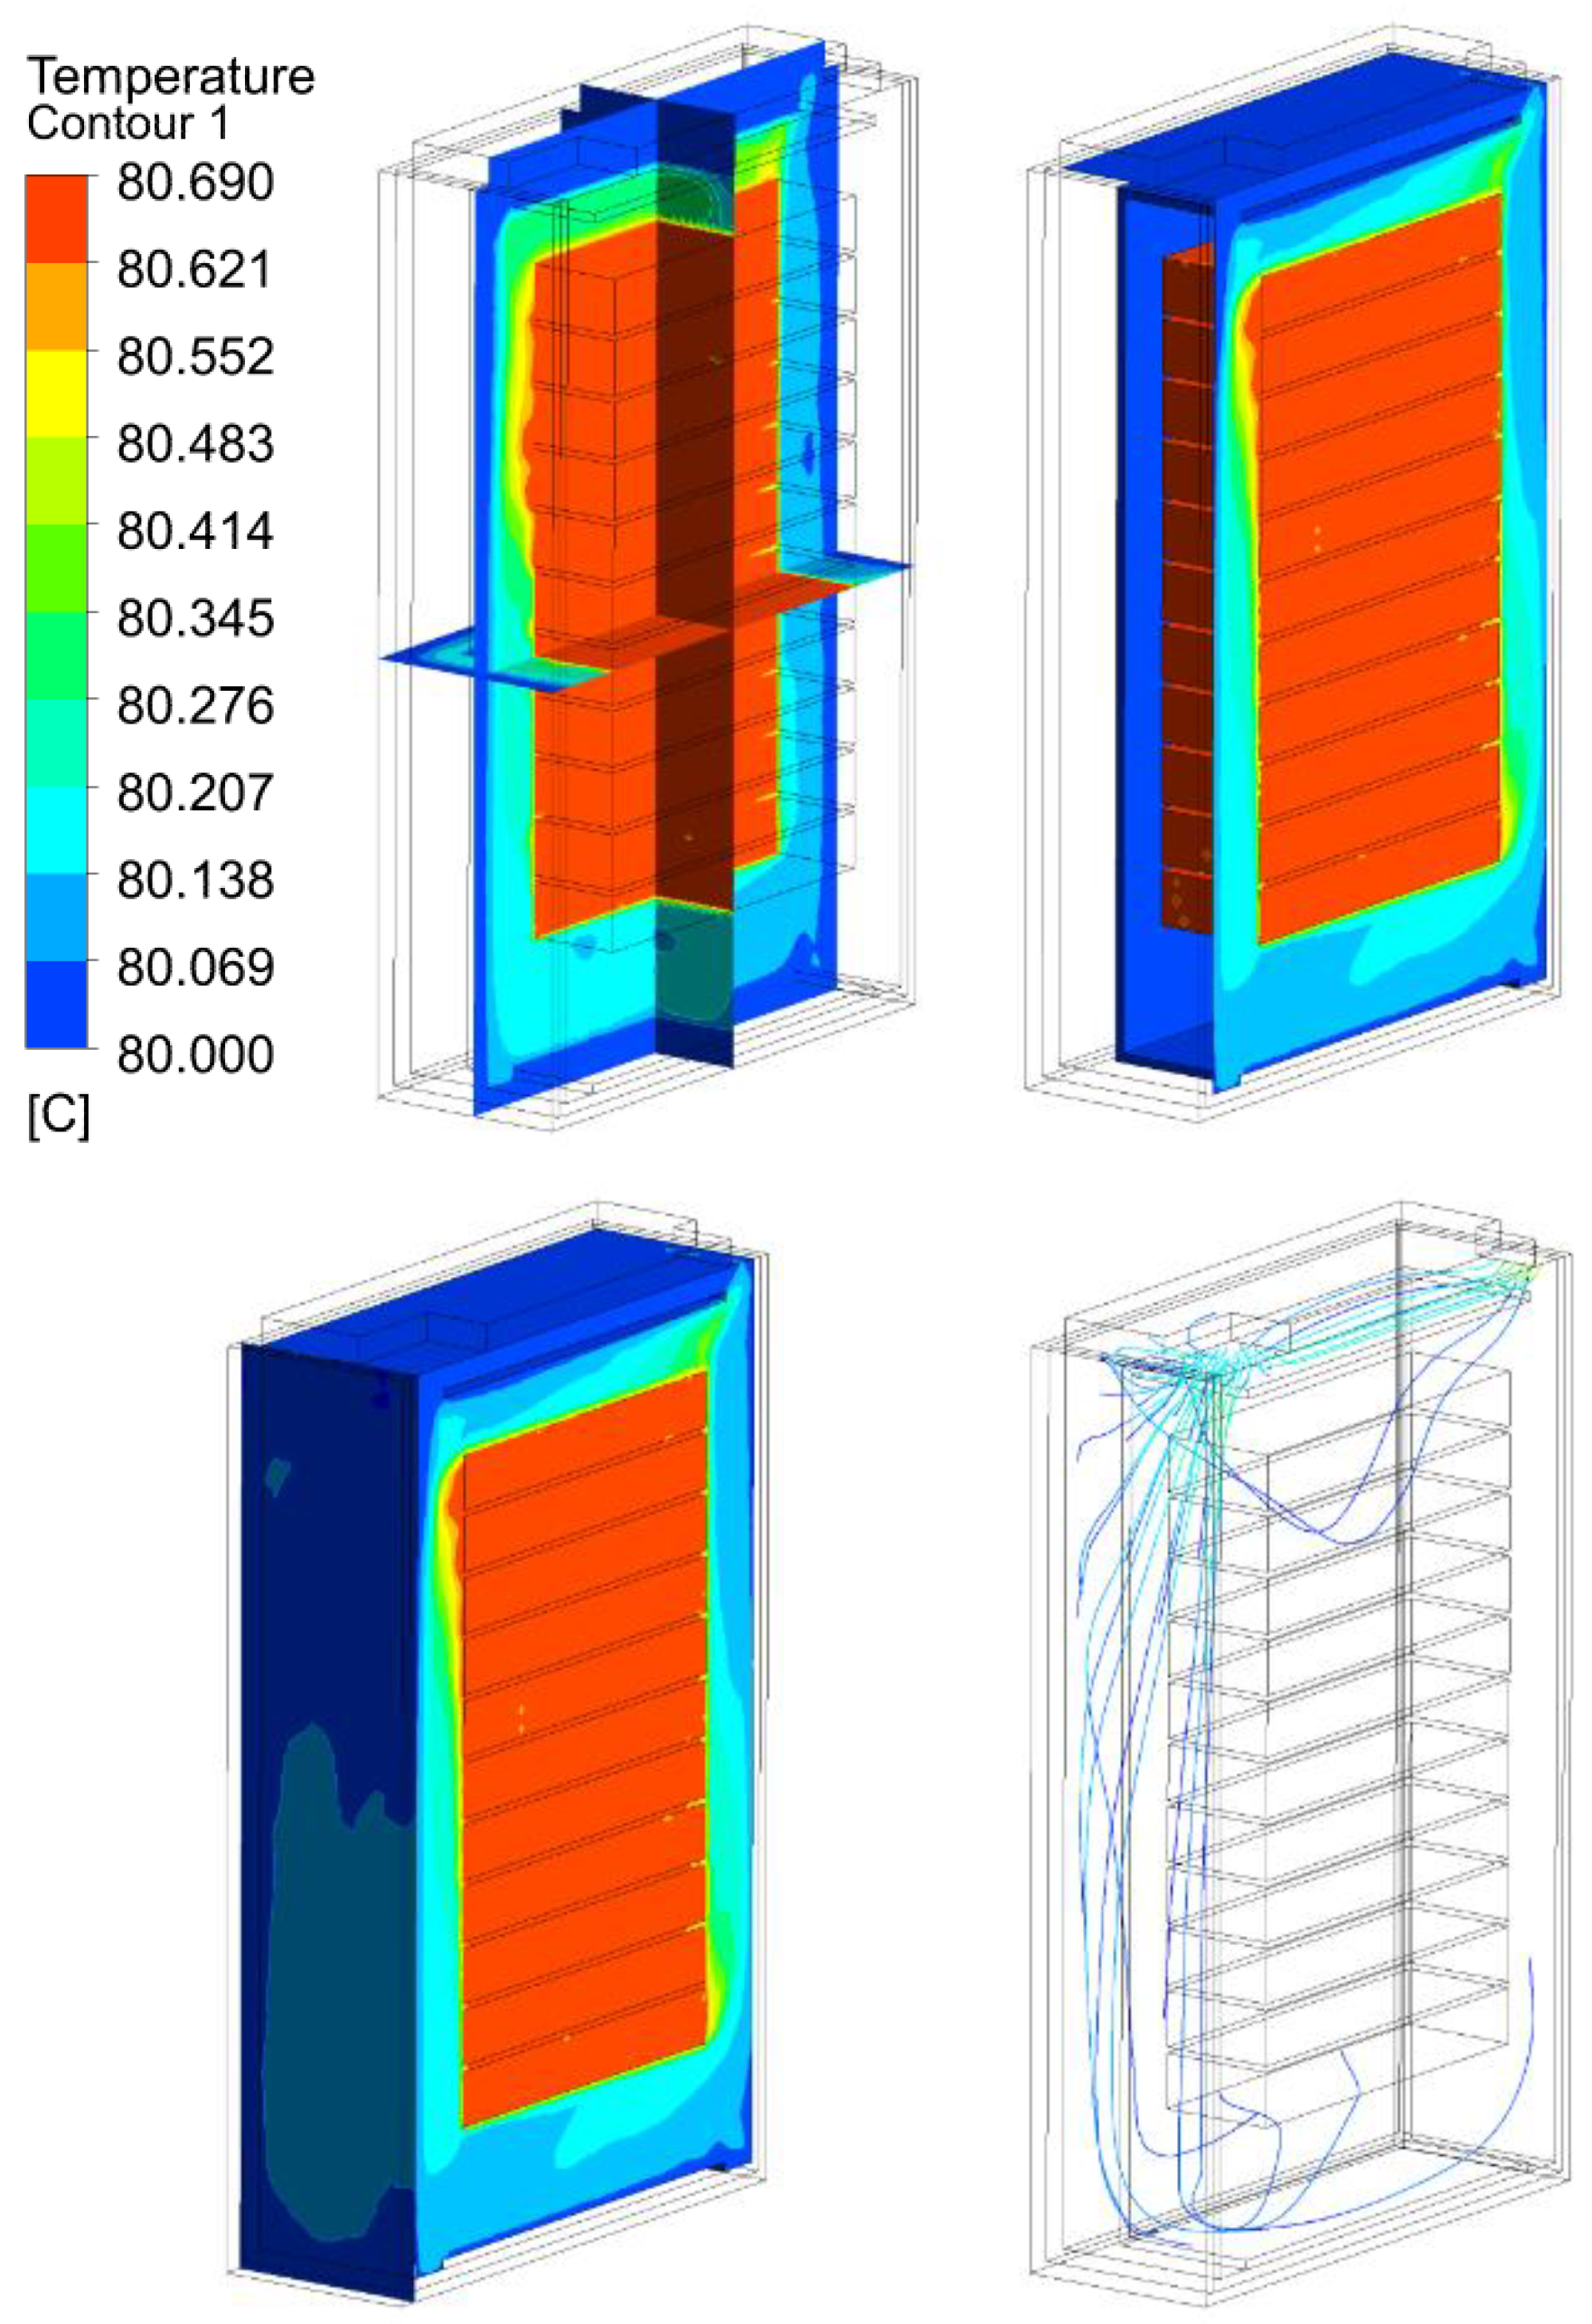
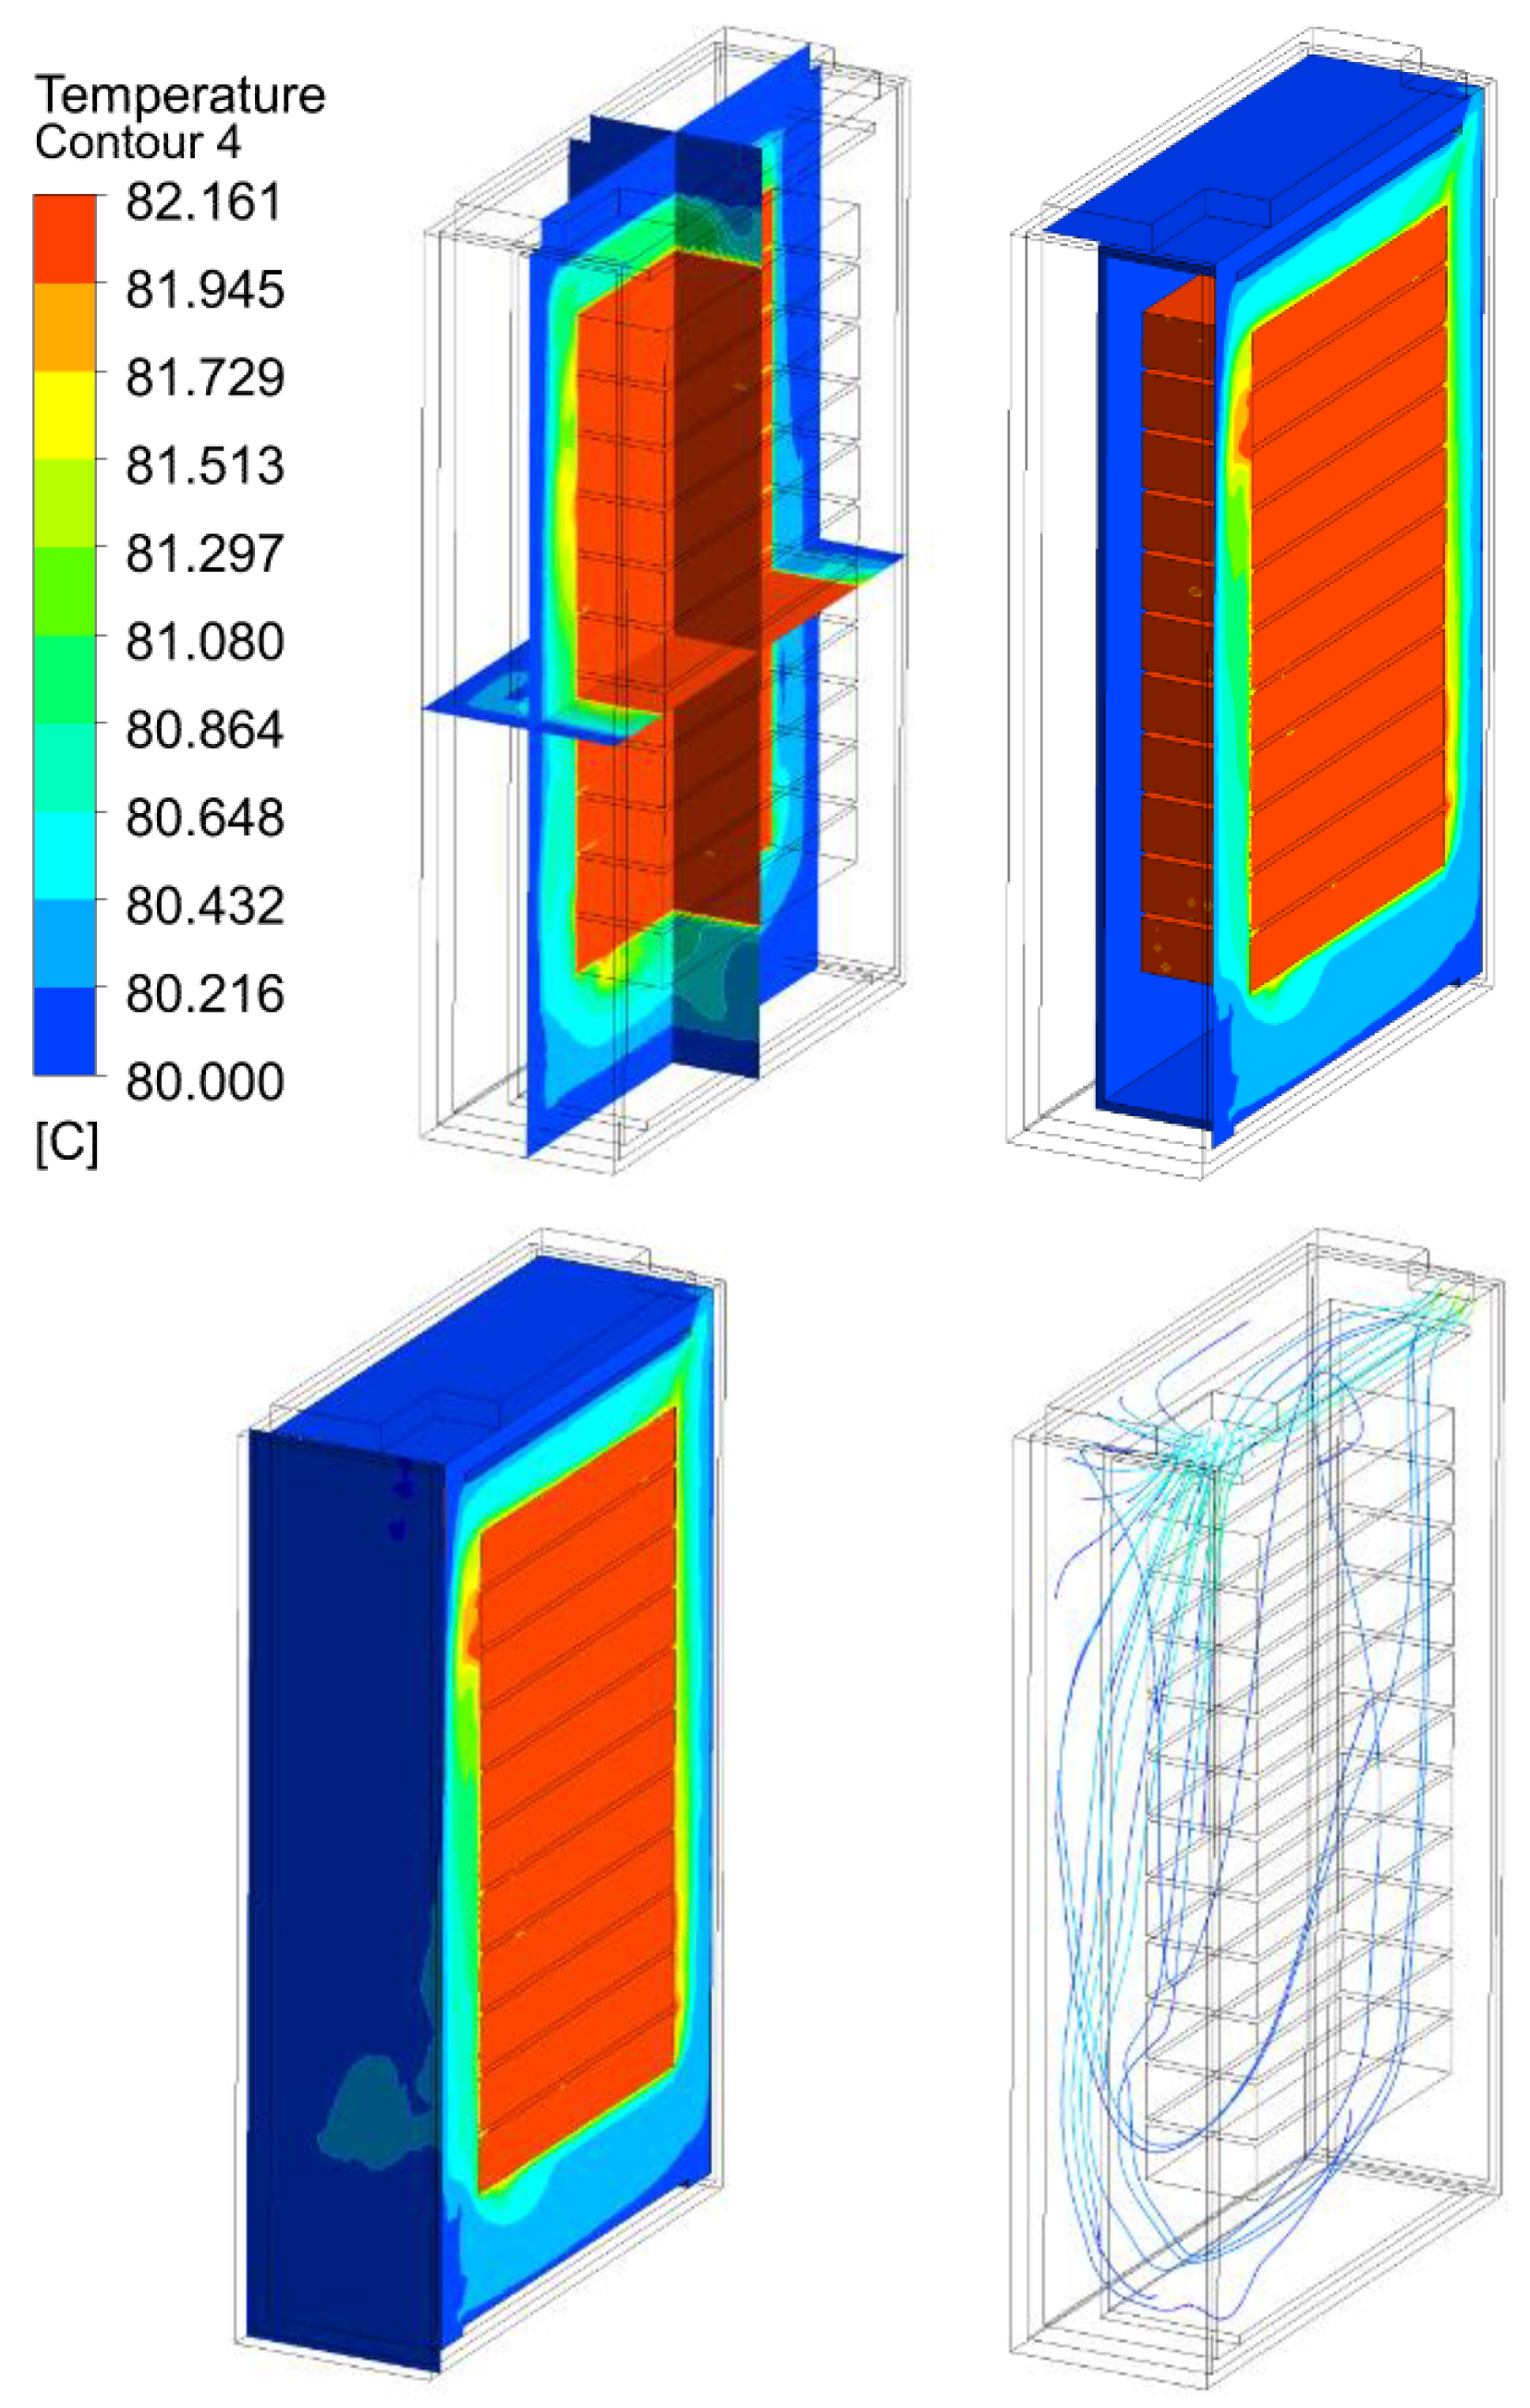
3.2. Thermal Analysis Results of Energy Storage Rack

This section discusses the thermal state and heat transfer of the single energy storage rack and battery module. According to the Ani-Hom approach, the battery discharge simulation of the single battery rack based on the different environment temperature modes is carried out and its thermal state is analyzed. The simulation results in Figure 16 show that the 30 kW (7 C-rate) discharge simulation of the aluminum-ion battery cabinet is carried out under the conditions of an initial temperature of 25 °C, the environment temperature is also 25 °C, with the air outlet of one atmosphere and air inlet wind speed of 1.05 m/s. Because of the low energy density of AlB, it can be seen that the highest temperature of the aluminum-ion battery cabinet is only 25.69 °C when carrying out a 30 kW discharge simulation. Although the discharge current of the single battery 7 C-rate of the aluminum-ion battery is 5.35 Amps, and the DC impedance of the battery is 11.25 mΩ, the energy output of the aluminum-ion battery can only be maintained for 514 s when the aluminum-ion battery is discharged at 7 C-rate, but it will not produce a high temperature. According to the simulation results in Figure 17, the highest temperature reaches 27.16 °C when the aluminum-ion battery cabinet discharges at 28C, which is about 120 kW output power. This is because the current that the aluminum-ion battery discharges at 28C is 21.4 amperes, and the DC impedance of the aluminum-ion battery is 11.25 mΩ, which causes the battery cabinet to reach 27.16 °C after 128 s of the output power of 120 kW. For other operating temperatures of 40 °C, 60 °C, and 80 °C under 7C and 28C discharging rates (Figure 18, Figure 19, Figure 20, Figure 21, Figure 22 and Figure 23), the battery rack temperature distribution is shown in Table 6. Although AlB is a good weather-resistant battery, it presents as highly sensitive on the SOC due to the environment temperature. The thermal state simulation enabled us to find the temperature distribution of each AlB rack under its preferred operation place and exerted the associated environment temperature. These temperature distributions will apply to an EKF SOC estimator by obtaining the precision SOC of AlB.

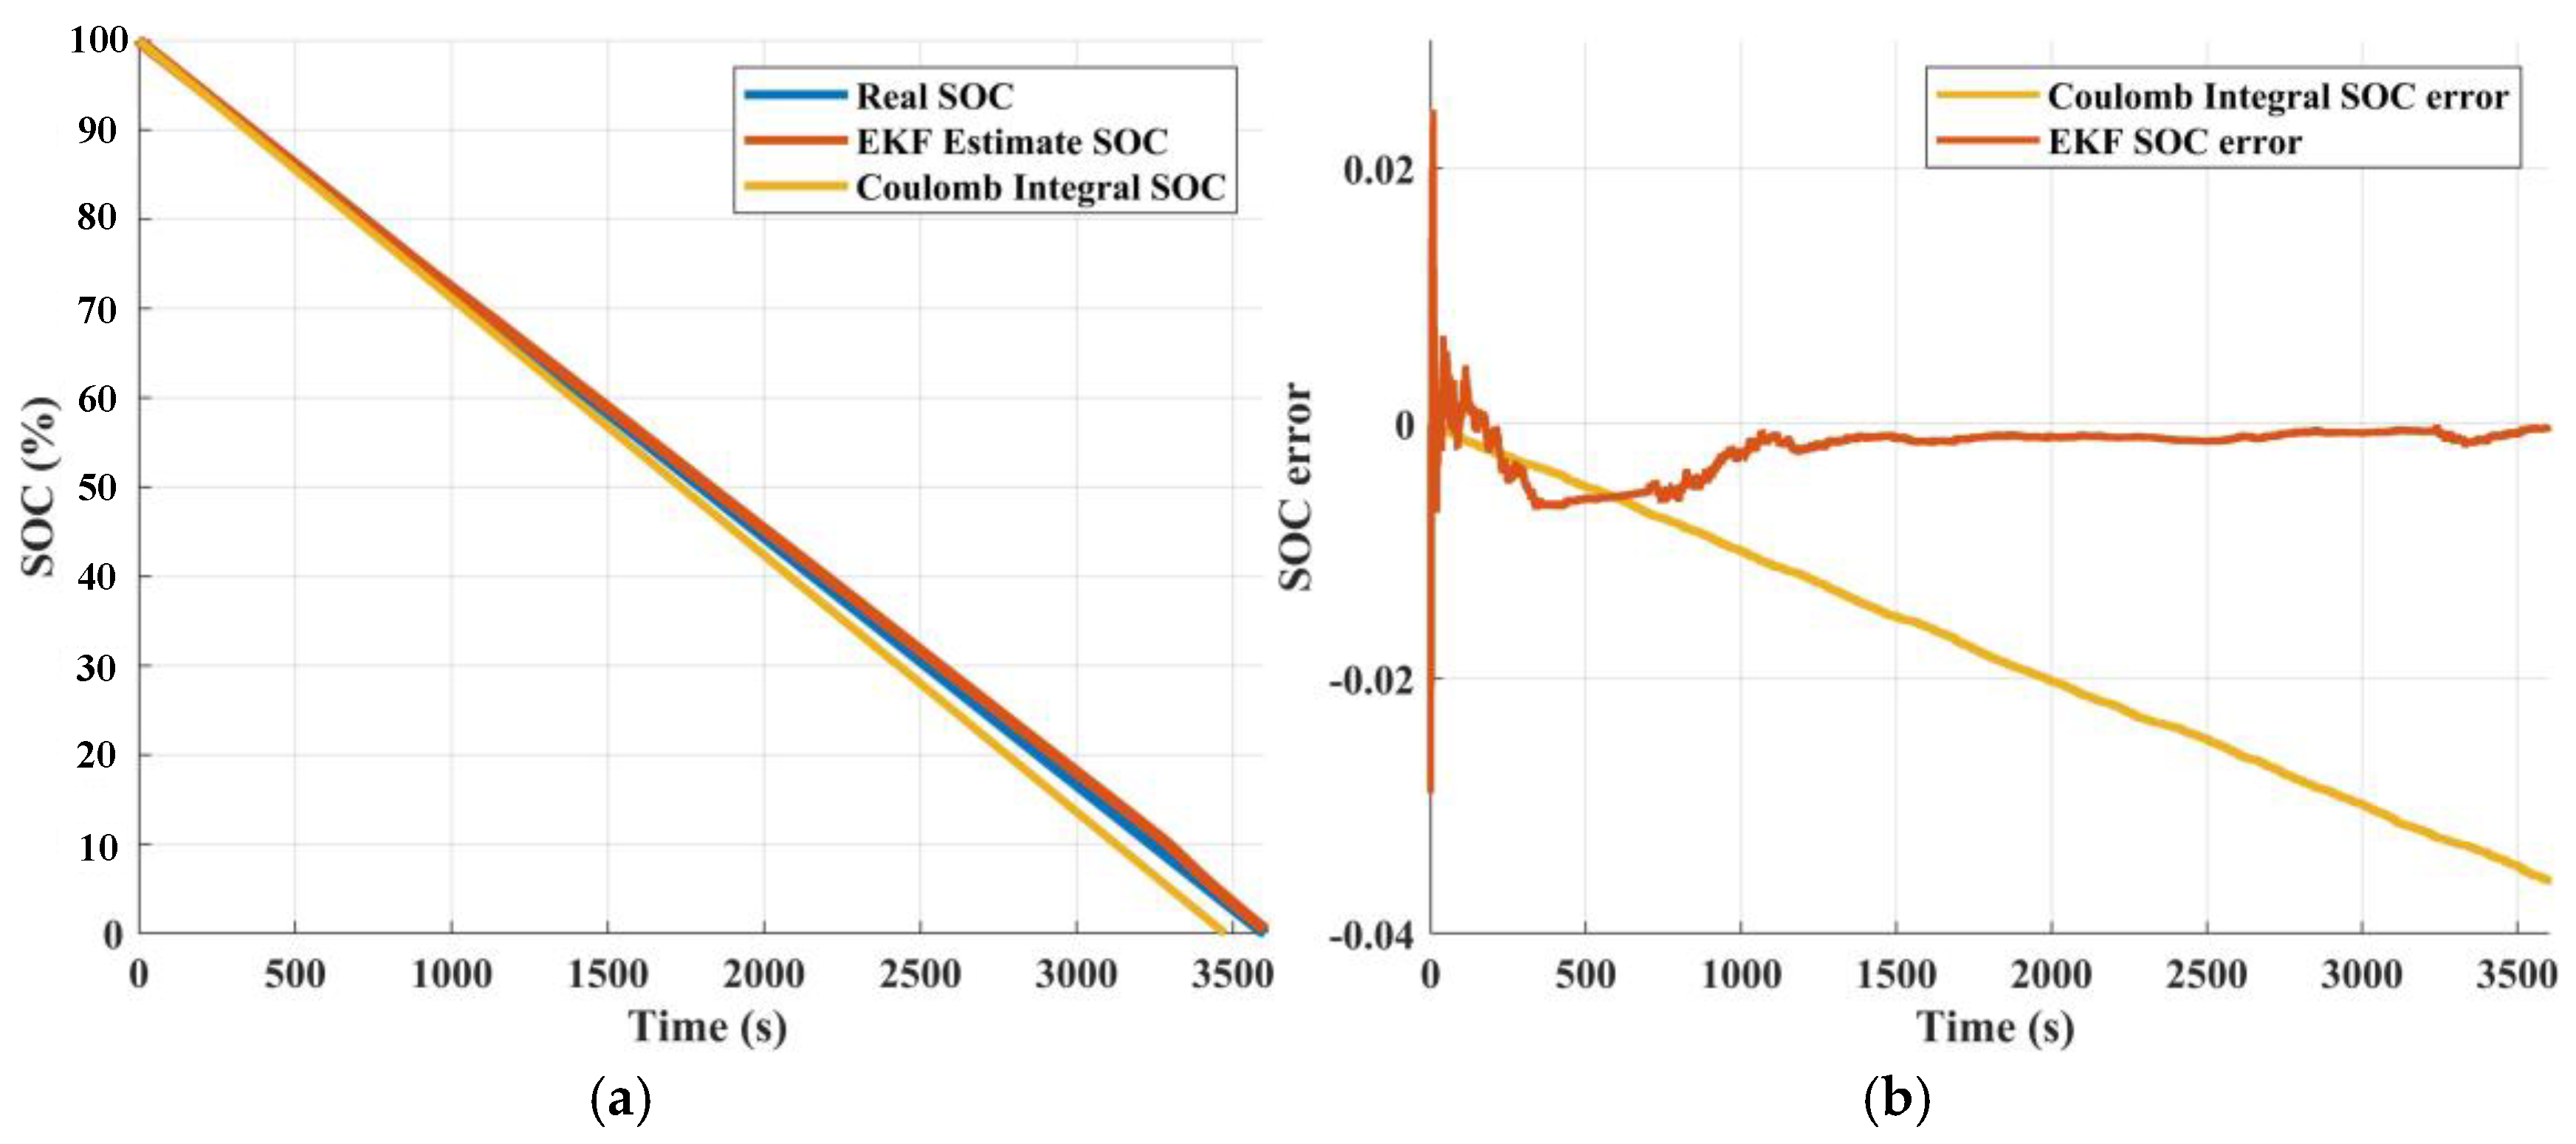
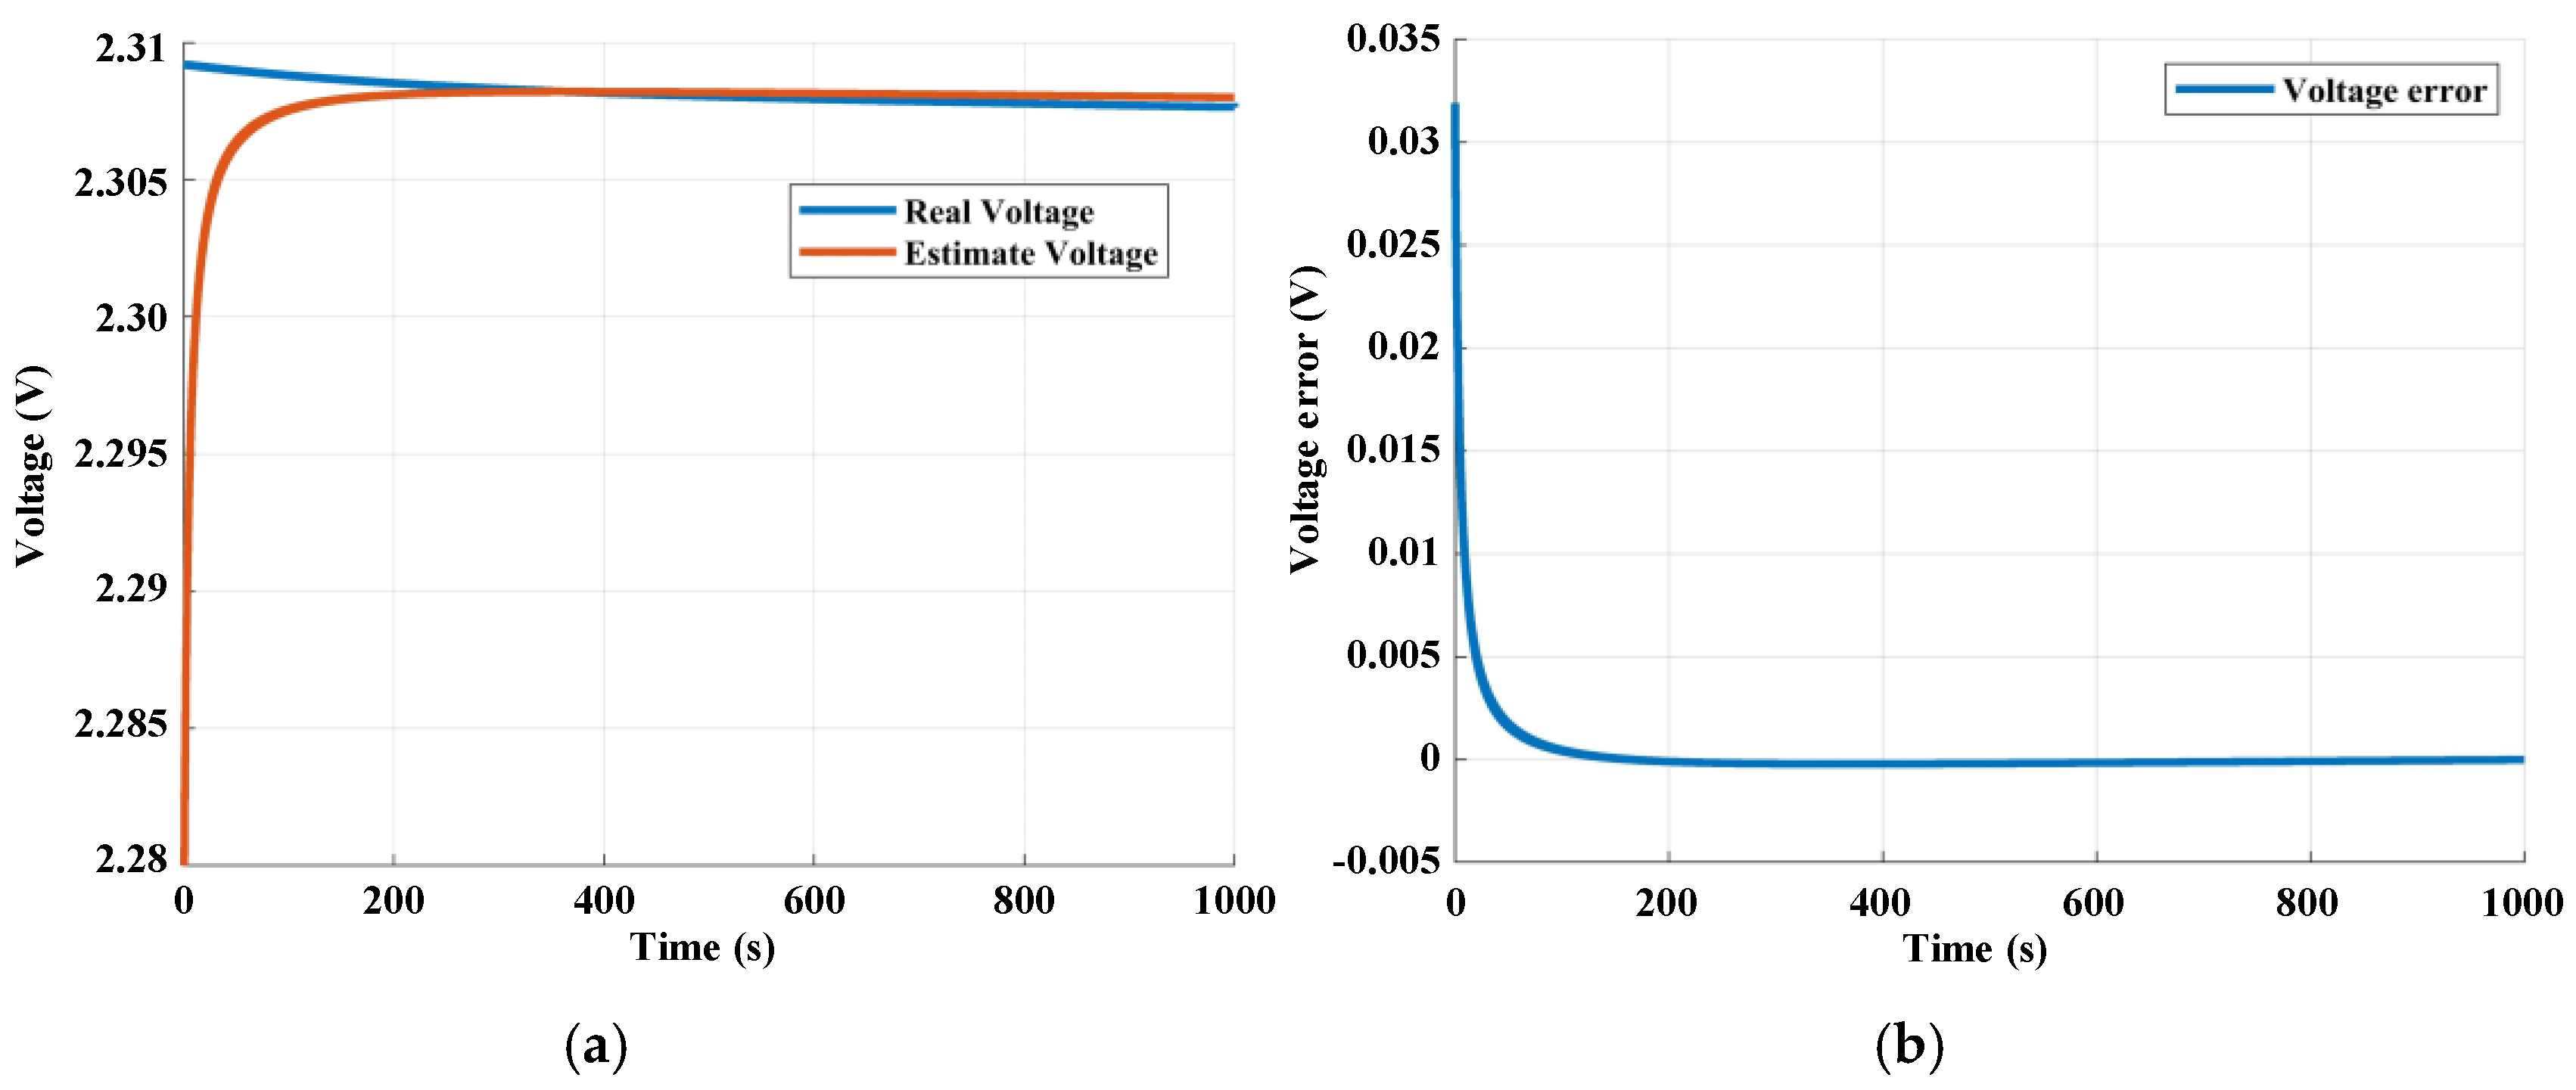
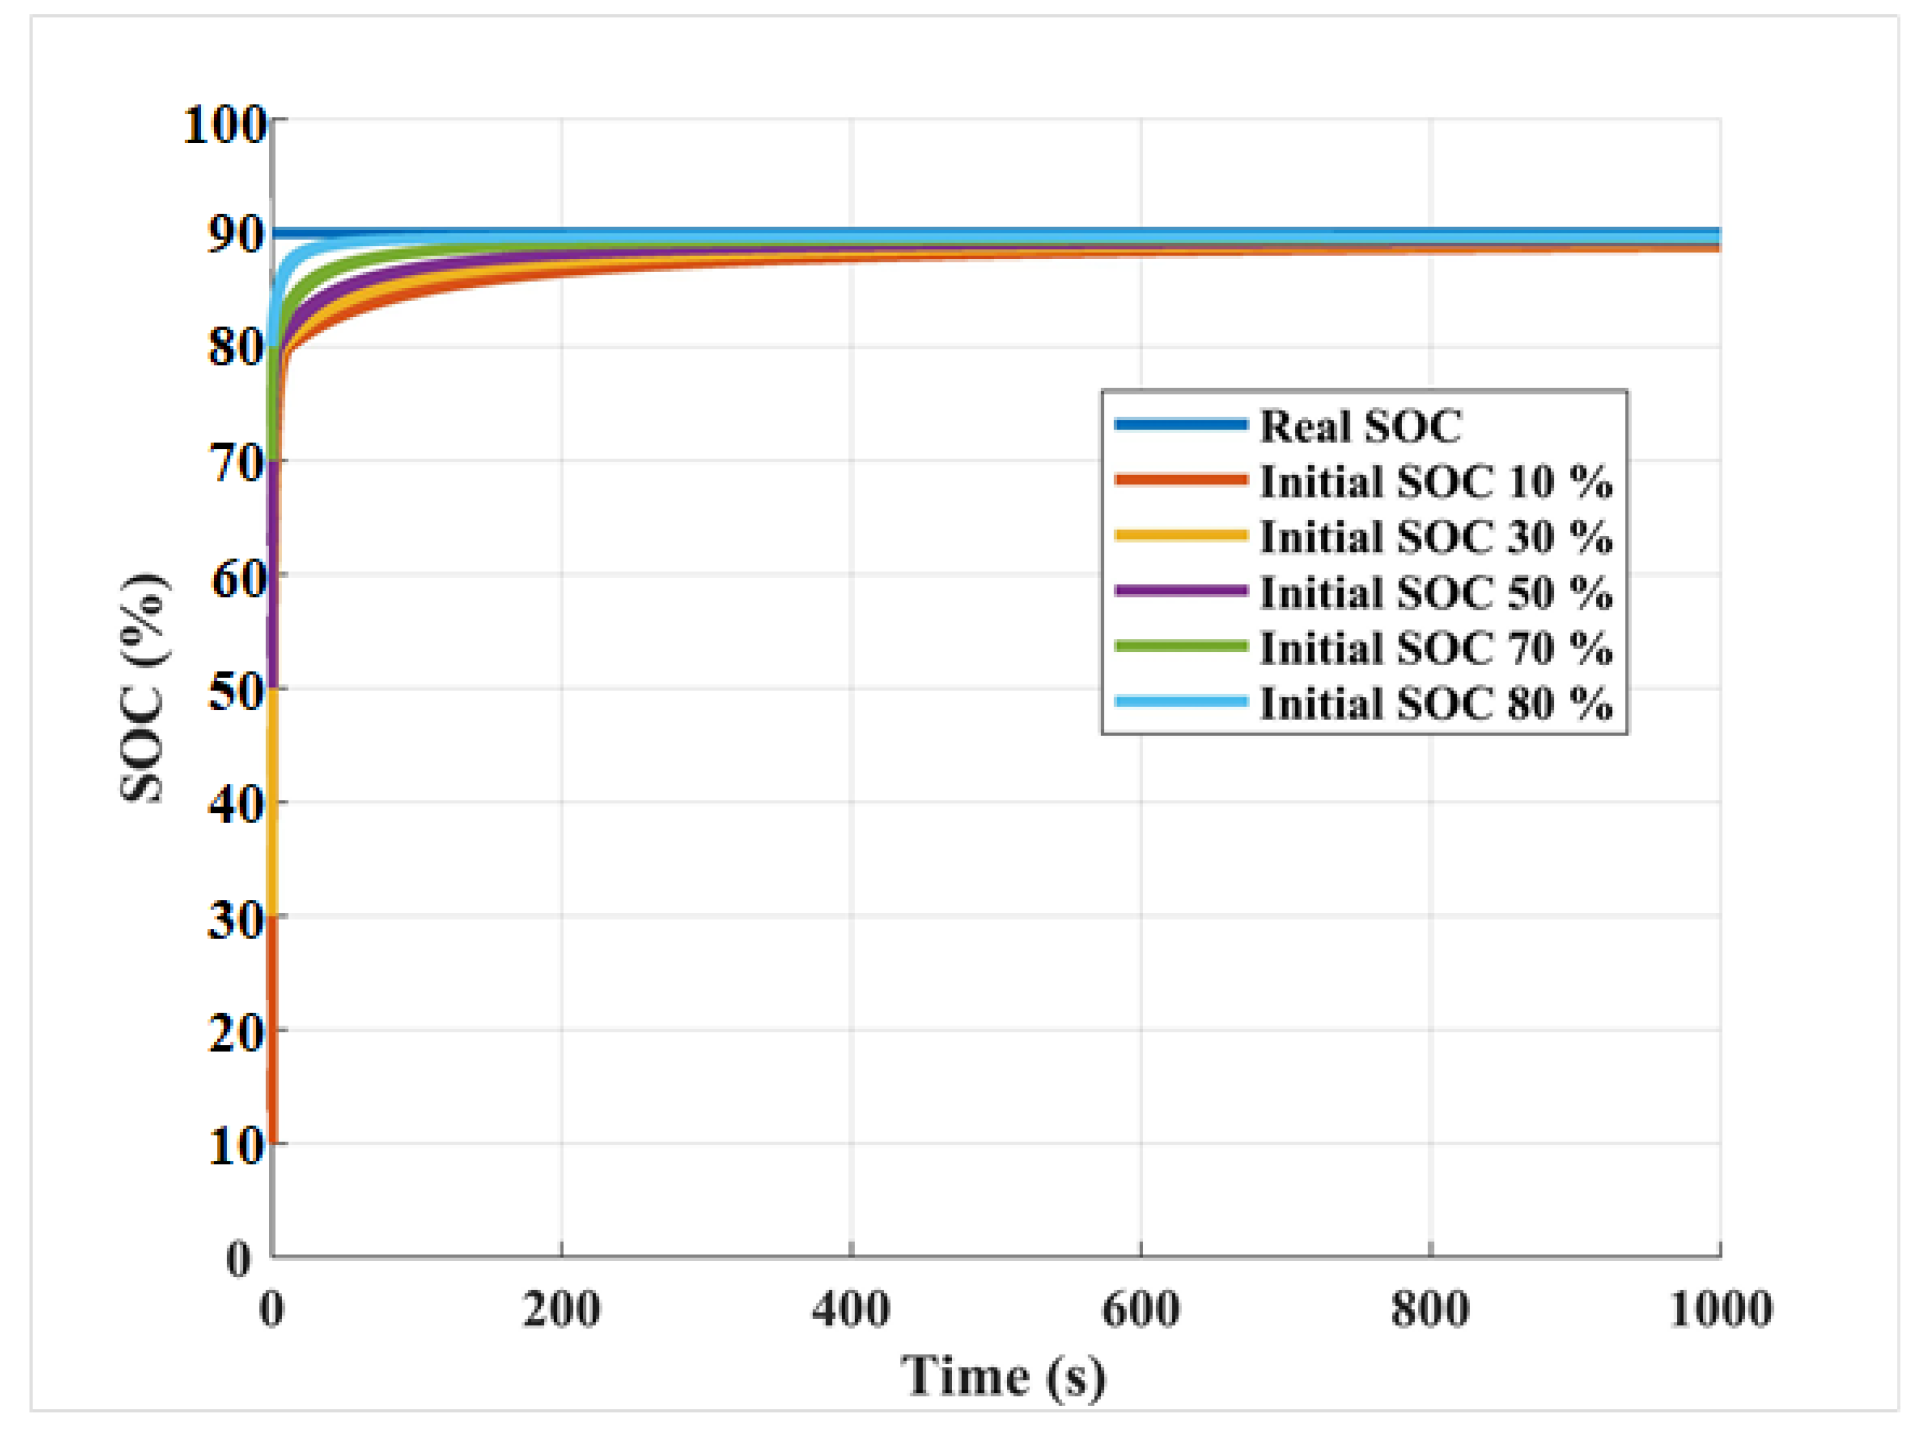
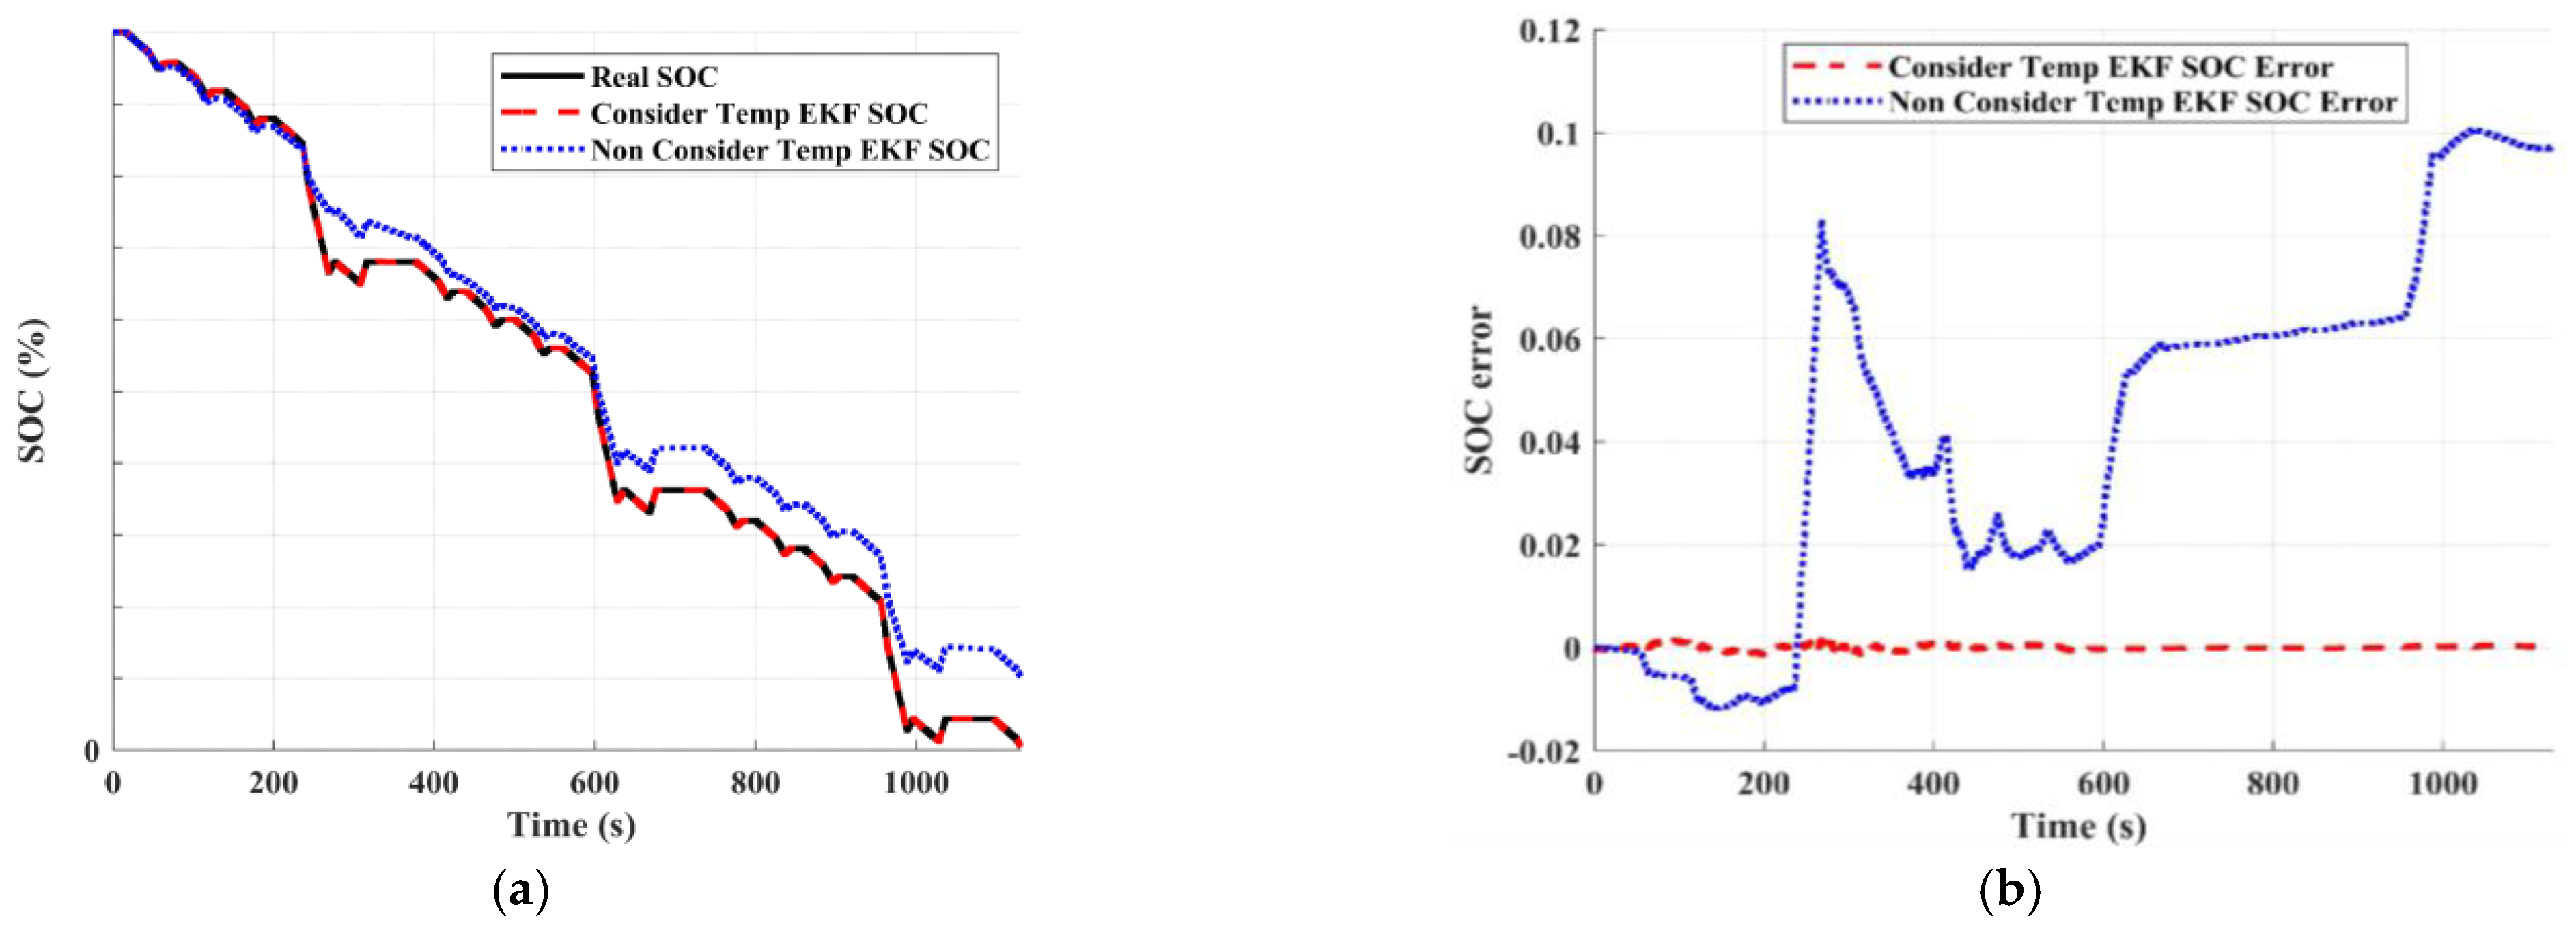
3.3. State of Charge Estimation Results

Focusing on the establishment of extended Kalman filter estimation architecture by numerical analysis simulation software MATLAB and Simulink, this section presents the estimation of the SOC. In order to ensure the accuracy of the estimation architecture of the extended Kalman filter (EKF), the state parameter of the extended Kalman filter estimation procedure is set to a testing process: the wrong initial value when simulating battery discharge. In estimating the SOC, random noise is added to the current value and voltage value of the measuring of the simulated battery, and the test estimation architecture of dynamic stress test (DST: shown and discussed in Figure 24 is used to judge whether the extended Kalman filter estimation architecture can accurately estimate the SOC under different environmental temperatures.
In order to ensure the convergence of the EKF estimator to the initial value error of the SOC, an EKF convergence verification is presented. The convergent test of the Kalman estimator is performed when the battery is simulated to stand at 90% SOC and the temperature is 25 °C. The initial value of the extended Kalman estimator SOC is set to 50%, and the program is used to recursively calculate the SOC. The convergence test result is shown in Figure 25a. The initial value of the extended Kalman estimator is different from the actual SOC. After recursive calculation by the extended Kalman estimator, the estimated value of the SOC can gradually converge to the actual SOC. As shown in Figure 25b, the voltage value error estimated by the extended Kalman estimator is corrected by the recursive estimation method of the extended Kalman estimator, so that the voltage error gradually approaches zero.
In Figure 26, to test the convergence of the EKF estimator, five different SOC values are set to be the initial guess. After the recursive estimation method in a 200 s time interval, the EKF estimation value approaches the actual SOC value. If the difference between the initial value and the actual value is too large, it needs more iterations and will take more time, such as when the initial value SOC is 10%. If the difference between the initial value and the actual value is very small, the extended Kalman estimator recursive estimation method can quickly correct the initial value to the actual value. In the application of the EKF SOC estimator in the actual state, the battery voltage and current sensing elements are susceptible to interference noise caused by environmental temperature, humidity, vibration, electromagnetism, or man-made accidental contact. Traditionally, Coulomb’s integration was used for battery SOC prediction, but the noise caused by the environments produced distortion and integration errors. In order to detect the noise suppression ability of the extended Kalman estimator, Gauss noise is used to simulate the addition of voltage and current noise when the battery is discharged at 1C-rate. The state value of SOC is estimated by the EKF estimator to verify that the estimator can still suppress noise in the dynamic system containing noise. The recursive calculation is executed to estimate the value of SOC. However, in order to better compare the accuracy of the extended Kalman estimator, the Coulomb integral method for SOC estimation is added to the simulation results to compare two different SOC estimation methods. An artificial noise of battery OCV and discharging current is shown in Figure 26. Figure 27a shows the SOC estimation result after adding the noise. From the simulation results, it can be seen that the 1C-rate constant current discharge simulation test of the battery is carried out under the same initial value state. In the SOC estimation using Coulomb integral method, because the noise is added to the measuring end of the simulated current and the Coulomb integral method cannot correct the measurement error, it is easy to produce a cumulative error with time when using the Coulomb integral method to estimate the SOC. For the extended Kalman Estimator in the simulation of SOC state value results, it is verified that the extended Kalman estimator can suppress the voltage and current noise during battery measurement, and would not produce cumulative errors. As shown in Figure 27b, it is a very effective SOC estimation method to use the extended Kalman estimator to estimate the SOC state value. It can be seen in Figure 27 that the extended Kalman estimation method gradually converges to zero with time iteration and calculation. In the calculation of the Coulomb integral method, we can see that there are errors from the beginning of the integral calculation. With the increase in time and iteration times, the errors accumulate with time because the Coulomb integral method does not include a correction method, which means it produces cumulative estimation errors.
During the charging/discharging process of the battery, the heat is generated due to the battery’s internal resistance and electrochemical reaction, which makes the battery temperature rise. The influence of higher temperatures on the battery will cause numerical changes, such as DC impedance, internal resistance, capacitance, and electrochemical polarization. In order to understand the influence of higher temperature impact and SOC sensitivity against temperature on the estimation architecture of EKF, the DST test is carried out with AlB, and the test is conducted by a comparison of the temperature-dependent/independent results. The test waveform of DST is shown in Figure 28, where a negative value simulates the battery in a discharged state and a positive value simulates the battery in a charged state. In the following, the dynamic stress test (DST) simulation of an aluminum-ion battery at 45 °C is carried out. The dynamic discharge and charge simulations are explained with the maximum power of a 28 C-rate battery. The difference between the EKF based on the battery data of DPPC at different temperatures and the extended Kalman filter based on the battery data of 25 °C is compared, and the results are discussed. Figure 29 is a comparison chart between DST results and errors of aluminum-ion batteries. The extended Kalman SOC estimator considering the temperature difference has high accuracy and convergence. The common extended Kalman SOC estimator used in the state-of-temperature difference leads to the inaccuracy of SOC estimation, even the estimation errors. In the process of high C-rate battery discharge, because of the increase in the battery discharge current, the estimation error increases, and the common extended Kalman SOC estimator has an error as high as 10%. Compared with the extended Kalman SOC estimator considering temperature difference, the estimation error caused by temperature difference is greatly reduced.

3.4. Temperature Sensitivity of AlB’s SOC

Temperature sensitivity, ST, of AlB means the property that the SOC of AlB changes with the temperature change. It is defined as S T = E K F E K F t e m p E K F t e m p . The greater ST means the SOC behavior performs a highly sensitive way. From the experimental procedure, the results show that the SOC of AlB is sensitive and depends on environment temperature. According to the sensitivity analysis of SOC, the temperature sensitivity tends to or greater than one, S T 1 (Table 7), while the operation temperature is above 40 °C, and the SOC modification of EKFtmep estimator needs to be applied to obtain correct battery state of charge. Between 10% and 80% of SOC, the current results find that heat can cause the traditional estimation (Coulomb’s integral and EKF) to worsen.

4. Conclusions

In this paper, a hybrid method of CFD and EKF is used to establish and simulate the heating condition of batteries. A series of analyses and the simulation of aluminum-ion batteries are carried out. To improve the accuracy of the SOC of the battery, the temperature sensitivity of AlB’s SOC is discussed. According to the sensitivity analysis of the SOC, the temperature sensitivity tends to or greater than one, S T 1 , while the operation temperature is above 40 °C, and the SOC modification of the EKFtmep estimator improves the battery state of charge in the error range below 1%. The power density, material parameters, and boundary conditions are combined into CFD to simulate the conjugate heat transfer in order to prove that the battery generates Joule heat when discharging, which rises the working temperature of the battery. The SOC estimation accuracy is affected by temperature variation. In order to solve the problems, the convergence ability, noise suppression ability, and the influence of temperature on the Extended Kalman Filter SOC estimator are analyzed by MATLAB and Simulink simulation. By adding voltage and current noise to the measuring end of the battery model, the corresponding real state of AlB is observed. It is verified that the extended Kalman SOC estimator has the ability to repair sensor noise, and the maximum SOC estimation error is below 2.90% under the effect of temperature variation. The difference between the common extended Kalman SOC estimator and the extended Kalman SOC estimator considering temperature is obtained from the simulation results. The SOC modification of EKFtmep estimator improves the battery state of charge successfully. Under the battery operating state of charge, say between 10% and 80%, current results find that heat can cause the traditional estimation (Coulomb’s integral and EKF) to worsen. The estimation result of the extended Kalman SOC estimator considering temperature is more accurate, and the maximum SOC estimation error is less than 1%. In this study, we conduct a second-order Thevenin equivalent circuit for simulating the aluminum-ion battery. A second-order model only considers two polarization effects: electrical polarization and concentration polarization. Actually, battery charging/discharging dynamics might cause other polarization effects in AlB. For a fast charging/discharging system, in future work, a higher-order equivalent circuit may be suitable in a low SOC condition.

Author Contributions

Formal analysis, C.-H.H.; Resources, C.-C.H.; Supervision, B.-H.C.; Funding acquisition, L.-T.T. All authors have read and agreed to the published version of the manuscript.

Funding

This work was supported by Bureau of Energy of the Ministry of Economic Affairs (112-D0113) in Taiwan and APh ePower Co., Ltd.

Data Availability Statement

Not applicable.

Acknowledgments

The author sincerely thanks the Bureau of Energy of the Ministry of Economic Affairs (112-D0113) in Taiwan and APh ePower Co., Ltd. for its financial support and E-ONE MOLI ENERGY Co., Ltd. for its technical support.

Conflicts of Interest

The authors declare no conflict of interest.

Nomenclature

A n × n State transition matrix
B n × l State control matrix
C p 1 electrochemical polarization capacitance
C p 2 concentration polarization capacitance
C p Specific heat
E e q The open circuit voltage of the battery
F Faraday constant
H m × n Observation state transition matrix
h Heat convection coefficient
I o c Output current
K k Kalman gain in state k
k r Thermal conductivity in the r direction
k θ Thermal conductivity in the θ direction
k z Thermal conductivity in the r direction
n Charge quantity
P k Covariance of prediction error in state k
P k 1 Error common variance matrix
P k Generation of turbulent kinetic energy
Q Covariance of system process noise
Q t o t Total heat
Q i r r Irreversible heat
Q r e v Reversible heat
q c o n v e c t i o n Heat convection
R Covariance of system measurement noise
R p 1 electrochemical polarization resistance
R p 2 concentration polarization resistance
R o the ohm’s internal resistance
RCovariance of system measurement noise
τ Time constant
T Temperature
T b Battery temperature
T a m b Ambient temperature
t Time
u k 1 System control matrix of state k 1
V b a t t e r y Battery working voltage
V o c Open circuit voltage
V R o terminal voltage of the internal resistance
V p 1 terminal voltage of the concentration polarization
V p 2 terminal voltage of the electrochemical polarization
x ^ k System state matrix of state k
x ^ k 1 System state matrix of state k 1
Zkmeasured value of state k
u X axis velocity component
v Y axis velocity component
w Z axis velocity component
υ Fluid velocity vector
D k Dissipation of turbulent kinetic energy
P ω Generation of turbulent dissipation rate
D ω Dissipation of turbulent dissipation rate
ReReynolds number
Greek symbols
Gradient operator
ρ fluid density (kg/m3)
k Thermal conductivity (W/m-K)
μ dynamic viscosity (kg/m·s)
σ Prandtl number
AIBAluminum-ion battery
C-ratecurrent discharge/ charge rate
CFDComputational fluid dynamics
BESSBattery energy storage system
3DThree dimensions
LIBLithium-ion battery
HEVHybrid electric vehicle
OCVOpen circuit voltage
DPPCDischarge pulse power characterization
SOCState of charge
EVElectric vehicle
BMSBattery management system
EMIC1-ethyl-3-methylimidazolium chloride
AlCl3Aluminum chloride

References

  1. Giannelos, S.; Konstantelos, I.; Strbac, G. Option value of dynamic line rating and storage. In Proceedings of the 2018 IEEE International Energy Conference (ENERGYCON), Limassol, Cyprus, 3–7 June 2018; pp. 1–6. [Google Scholar]
  2. Ji, Y.; Zhang, Y.; Wang, C.-Y. Li-Ion Cell Operation at Low Temperatures. J. Electrochem. Soc. 2013, 160, A636–A649. [Google Scholar] [CrossRef]
  3. He, X.; Hu, Z.; Restuccia, F.; Fang, J.; Rein, G. Experimental study of the effect of the state of charge on self-heating ignition of large ensembles of lithium-ion batteries in storage. Appl. Therm. Eng. 2022, 212, 118621. [Google Scholar] [CrossRef]
  4. Ren, D.; Smith, K.; Guo, D.; Han, X.; Feng, X.; Lu, L.; Ouyang, M.; Li, J. Investigation of Lithium Plating-Stripping Process in Li-Ion Batteries at Low Temperature Using an Electrochemical Model. J. Electrochem. Soc. 2018, 165, A2167–A2178. [Google Scholar] [CrossRef]
  5. Yang, Z.; Huang, Q.; Li, S.; Mao, J. High-temperature effect on electrochemical performance of Li4Ti5O12 based anode material for Li-ion batteries. J. Alloys Compd. 2018, 753, 192–202. [Google Scholar] [CrossRef]
  6. Pang, C.; Dutta, P.; Kezunovic, M. BEVs/PHEVs as Dispersed Energy Storage for V2B Uses in the Smart Grid. IEEE Trans. Smart Grid 2011, 3, 473–482. [Google Scholar] [CrossRef]
  7. Ma, S.; Jiang, M.; Tao, P.; Song, C.; Wu, J.; Wang, J.; Deng, T.; Shang, W. Temperature effect and thermal impact in lithium-ion batteries: A review. Prog. Nat. Sci. 2018, 28, 653–666. [Google Scholar] [CrossRef]
  8. Finegan, D.P.; Darcy, E.; Keyser, M.; Tjaden, B.; Heenan, T.M.; Jervis, R.; Bailey, J.J.; Vo, N.T.; Magdysyuk, O.V.; Drakopoulos, M.; et al. Shearing, Thermal Runaway: Identifying the Cause of Rupture of Li-Ion Batteries during Thermal Runaway. Adv. Sci. 2018, 5, 1870003. [Google Scholar] [CrossRef]
  9. Liu, H.; Wei, Z.; He, W.; Zhao, J. Thermal issues about Li-ion batteries and recent progress in battery thermal management systems: A review. Energy Convers. Manag. 2017, 150, 304–330. [Google Scholar] [CrossRef]
  10. Zhang, Y.; Wang, C.-Y.; Tang, X. Cycling degradation of an automotive LiFePO4 lithium-ion battery. J. Power Sources 2011, 196, 1513–1520. [Google Scholar] [CrossRef]
  11. Kim, J.; Oh, J.; Lee, H. Review on battery thermal management system for electric vehicles. J. Appl. Therm. Eng. 2019, 149, 192–212. [Google Scholar] [CrossRef]
  12. Wu, W.; Wang, S.; Wu, W.; Chen, K.; Hong, S.; Lai, Y. Acritical review of battery thermal performance and liquid based battery thermal management. Energy Convers. Manag. 2019, 182, 262–281. [Google Scholar] [CrossRef]
  13. Wu, M.; Xiao, Y.; Liu, Y.; Li, H.; Gao, J.; Zhong, L.; Lou, X. Temperature Stability of Dielectric Constant and Energy Storage Properties of (Pb1-x,Lax)(Zr0.65,Ti0.35)O3 Relaxor Ferroelectric Thin Films. IEEE Trans. Dielectr. Electr. Insul. 2021, 28, 2052–2057. [Google Scholar] [CrossRef]
  14. Wang, Q.; Ping, P.; Zhao, X.; Chu, G.; Sun, J.; Chen, C. Thermal runaway caused fire and explosion of lithium ion battery. J. Power Sources 2012, 208, 210–224. [Google Scholar] [CrossRef]
  15. Smith, B.D.; Wills, R.G.A.; Cruden, A.J. Aqueous Al-ion cells and supercapacitors—A comparison. Energy Rep. 2020, 6, 166–173. [Google Scholar] [CrossRef]
  16. Pozzato, G.; Müller, M.; Formentin, S.; Savaresi, S.M. Economic MPC for online least costly energy management of hybrid electric vehicles. Control. Eng. Pract. 2020, 102, 104534. [Google Scholar] [CrossRef]
  17. Fan, J.; Qin, Z.; Luo, Y.; Li, K.; Peng, H. A novel power management strategy for hybrid off-road vehicles. Control. Eng. Pract. 2020, 101, 104452. [Google Scholar] [CrossRef]
  18. Li, Q.; Bjerrum, N.J. Aluminum as anode for energy storage and conversion: A review. J. Power Sources 2002, 110, 1–10. [Google Scholar] [CrossRef]
  19. Ellingsen, L.A.W.; Holland, A.; Drillet, J.F.; Peters, W.; Eckert, M.; Concepcion, C.; Ruiz, O.; Colin, J.F.; Knipping, E.; Pan, Q.; et al. Environmental screening of electrode materials for a rechargeable aluminum battery with an AlCl3/EMIMCl electrolyte. Materials 2018, 11, 936. [Google Scholar] [CrossRef]
  20. Mckerracher, R.; Holland, A.; Cruden, A.; Wills, R. Comparison of carbon materials as cathodes for the aluminium-ion battery. Carbon 2018, 144, 333–341. [Google Scholar] [CrossRef]
  21. Holland, A.W.; Cruden, A.; Zerey, A.; Hector, A.; Wills, R.G.A. Electrochemical study of TiO2 in aqueous AlCl3 electrolyte via vacuum impregnation for superior high-rate electrode performance. BMC Energy 2019, 1, 1–7. [Google Scholar] [CrossRef]
  22. Lin, M.-C.; Gong, M.; Lu, B.; Wu, Y.; Wang, D.-Y.; Guan, M.; Angell, M.; Chen, C.; Yang, J.; Hwang, B.-J.; et al. An ultrafast rechargeable aluminium-ion battery. Nature 2015, 520, 324–328. [Google Scholar] [CrossRef]
  23. Hu, Z.; He, X.; Restuccia, F.; Rein, G. Anisotropic and homogeneous model of heat transfer for self-heating ignition of large ensembles of lithium-ion batteries during storage. Appl. Therm. Eng. 2021, 197, 117301. [Google Scholar] [CrossRef]
  24. Du, S.; Jia, M.; Cheng, Y.; Tang, Y.; Zhang, H.; Ai, L.; Zhang, K.; Lai, Y. Study on the thermal behaviors of power lithium iron phosphate (LFP) aluminum-laminated battery with different tab configurations. Int. J. Therm. Sci. 2015, 89, 327–336. [Google Scholar] [CrossRef]
  25. Shen, X.; Sun, T.; Yang, L.; Krasnoslobodtsev, A.; Sabirianov, R.; Sealy, M.; Mei, W.-N.; Wu, Z.; Tan, L. Ultra-fast charging in aluminum-ion batteries: Electric double layers on active anode. Nat. Commun. 2021, 12, 1–12. [Google Scholar] [CrossRef] [PubMed]
  26. Hossain, M.; Saha, S.; Haque, M.E.; Arif, M.; Oo, A. A Parameter Extraction Method for the Thevenin Equivalent Circuit Model of Li-ion Batteries. In Proceedings of the IEEE Industry Applications Society Annual Meeting, Baltimore, MD, USA, 29 September 2019–3 October 2019; pp. 1–7. [Google Scholar] [CrossRef]
  27. Gurjer, L.; Chaudhary, P.; Verma, H.K. Detailed Modelling Procedure for Lithium-ion Battery Using Thevenin Equivalent. In Proceedings of the 2019 IEEE International Conference on Electrical, Computer and Communication Technologies (ICECCT), Coimbatore, India, 20–22 February 2019; pp. 1–6. [Google Scholar] [CrossRef]
  28. Immonen, E.; Hurri, J. Incremental thermo-electric CFD modeling of a high-energy Lithium-Titanate Oxide battery cell in different temperatures: A comparative study. Appl. Therm. Eng. 2021, 197, 117260. [Google Scholar] [CrossRef]
  29. Zhang, R.; Xia, B.; Li, B.; Cao, L.; Lai, Y.; Zheng, W.; Wang, H.; Wang, W. State of the Art of Lithium-Ion Battery SOC Estimation for Electrical Vehicles. Energies 2018, 11, 1820. [Google Scholar] [CrossRef]
  30. Wang, K.; Feng, X.; Pang, J.; Ren, J.; Duan, C.; Li, L. State of charge (SOC) estimation of lithium-ion battery based on adaptive square root unscented kalman filter. J. Electrochem. Sci. 2020, 15, 9499–9516. [Google Scholar]
  31. Li, W.; Yang, Y.; Wang, D.; Yin, S. The multi-innovation extended Kalman filter algorithm for battery SOC estimation. Ionics 2020, 26, 6145–6156. [Google Scholar] [CrossRef]
  32. Cai, Y.-S.; Ho, J.-R. Development of ANSYS-Fluent-based Numerical Approaches for Studies of Three-dimensional Gas Flows in a Planetary MOCVD Reactor. Electronic Theses & Dissertations. Master’s Thesis, National Central University, Taoyuan, Taiwan, 2015. [Google Scholar]
  33. Huang, C.; Tseng, C. Numerical Simulation and Analysis of Dynamic Stall on a Pitching Airfoil with Turbulence Models. Master’s Thesis, Department of Mechanical and Electro-Mechanical Engineering, 2017. [Google Scholar]
  34. Jiang, C.; Wang, S.; Wu, B.; Fernandez, C.; Xiong, X.; Coffie-Ken, J. A state-of-charge estimation method of the power lithium-ion battery in complex conditions based on adaptive square root extended Kalman filter. Energy 2020, 219, 119603. [Google Scholar] [CrossRef]
  35. Hu, Y.; Choe, S.-Y.; Garrick, T.R. Hybridized time-frequency method for the measurement of entropy coefficient of lithium-ion battery. Electrochim. Acta 2020, 362, 137124. [Google Scholar] [CrossRef]
Figure 1. Working principle of aluminum-ion battery.
Energies 16 04270 g001
Figure 2. Thevenin second-order equivalent circuit.
Energies 16 04270 g002
Figure 3. Schematic diagram of GITT test procedure steps.
Energies 16 04270 g003
Figure 4. GITT test voltage curve (part).
Energies 16 04270 g004
Figure 5. Complete GITT test curve and fitting chart.
Energies 16 04270 g005
Figure 6. Complete GITT test Temperature plot (25 °C).
Energies 16 04270 g006
Figure 7. Picture of aluminum-ion battery test DPPC.
Energies 16 04270 g007
Figure 8. NTC thermistor.
Energies 16 04270 g008
Figure 9. Stereo view of the interior of the energy storage rack (bank).
Energies 16 04270 g009
Figure 10. (a) Mesh independence analysis and (b) meshing of rack diagram.
Energies 16 04270 g010
Figure 11. Battery SOC and OCV curves at different temperatures.
Energies 16 04270 g011
Figure 12. Relationship between ohmic internal resistance Ro of battery model and SOC of battery at different temperatures.
Energies 16 04270 g012
Figure 13. The relationship between battery models Rp1, Rp2, and battery SOC at different temperatures.
Energies 16 04270 g013
Figure 14. Relationship between Cp1, Cp2, and SOC at different temperatures.
Energies 16 04270 g014
Figure 15. Schematic diagram of battery model.
Energies 16 04270 g015
Figure 16. The 30 kW (7 C-rate) discharge at 25 °C heating diagram of aluminum-ion battery cabinet.
Energies 16 04270 g016
Figure 17. The 120 kW (28 C-rate) discharge at 25 °C heating diagram of aluminum-ion battery cabinet.
Energies 16 04270 g017
Figure 18. The 30 kW (7 C-rate) discharge at 40 °C heating diagram of aluminum-ion battery cabinet.
Energies 16 04270 g018
Figure 19. The 120 kW (28 C-rate) discharge at 40 °C heating diagram of aluminum-ion battery cabinet.
Energies 16 04270 g019
Figure 20. The 30 kW (7 C-rate) discharge at 60 °C heating diagram of aluminum-ion battery cabinet.
Energies 16 04270 g020
Figure 21. The 120 kW (28 C-rate) discharge at 60 °C heating diagram of aluminum-ion battery cabinet.
Energies 16 04270 g021
Figure 22. The 30 kW (7 C-rate) discharge at 80 °C heating diagram of aluminum-ion battery cabinet.
Energies 16 04270 g022
Figure 23. The 120 kW (28 C-rate) discharge at 80 °C heating diagram of aluminum-ion battery cabinet.
Energies 16 04270 g023
Figure 24. Current graph simulating battery current and voltage with noise. (a) the different SOC estimation lines; (b) the error variation comparisons of EKF & Coulomb Integral.
Energies 16 04270 g024
Figure 25. Extended Kalman estimator battery convergence results: (a) the OCV convergence curve; (b) the estimation errors.
Energies 16 04270 g025
Figure 26. Convergence results of extended Kalman estimator for different SOC initial values.
Energies 16 04270 g026
Figure 27. (a,b) Current graph simulating battery current and voltage with noise.
Energies 16 04270 g027
Figure 28. DST test waveform.
Energies 16 04270 g028
Figure 29. (a,b) Comparison of test results and errors of aluminum-ion batteries in DST.
Energies 16 04270 g029
Table 1. NTC thermistor datasheet.
CharacteristicTypeUnit
Resistance at 25 °C10 KΩ
Temperature Range−40 to +120 °C
R Tolerance1.0%
B Value3435
B Tolerance1.0%
Wire TypeSeparate
PackageDIP
Table 2. Reynolds number specification.
PropertyValueUnit
ρ1.225kg/m3
u 1m/s
μ 1.8 ×∙10−5Pa∙S
Reynolds number (Re)14,544-
Table 3. Battery Module Material Parameters.
MaterialAirCabinet Steel FrameFoam InsulationBattery Cell
Material
Property
Density
(kg/m3)
1.184803017.62697
Specific Heat (j/kg-k)1006.43502.481501823
Heat Conductivity (W/m-k)0.024216.270.0439Axial-28.5
Radial-3.4
Viscosity (kg/m-s)1.7894 × 10−5---
Molecular Weight (kg/kmol)28.966---
Table 4. Boundary Conditions.
PropertyFluid Velocity (m/s)Temperature (°C)Pressure (atm)Amount
Boundary
Air inlet1.0525-6
Exhaust vent-2512
Wall boundary conditionNo-slip wall boundary
Table 5. Aluminum-Ion Battery Specification Sheet.
Battery TypeAluminum-Ion Battery
Term
Cell nominal voltage (V)2.35~1.1
Cell nominal capacity (Ah)0.764
Anode typeAluminum
Cathode type3D Graphite
electrolyteIonic liquid (EMIC&AlCl3)
Table 6. The temperature distribution of AlB rack.
Temperature25 °C40 °C60 °C80 °C
Power
Output/C-rate
30 kW/7C25.6940.6960.6980.69
120 kW/28C27.1642.1662.1682.16
30 kW/7C
Energies 16 04270 i001
Energies 16 04270 i002Energies 16 04270 i003Energies 16 04270 i004Energies 16 04270 i005
120 kW/28C
Energies 16 04270 i006
Energies 16 04270 i007Energies 16 04270 i008Energies 16 04270 i009Energies 16 04270 i010
Table 7. The estimation errors of SOC (iteration No. ~3000; 28C-rate; SOC = 20%).
SOC ErrorsEKFtempEKFCoulomb’s IntegralSensitivity
Environment
Temperature
25 °C0.00100.00100.070.000
40 °C0.00340.00650.100.911
60 °C0.00550.01200.241.181
80 °C0.00600.01620.311.700
Disclaimer/Publisher’s Note: The statements, opinions and data contained in all publications are solely those of the individual author(s) and contributor(s) and not of MDPI and/or the editor(s). MDPI and/or the editor(s) disclaim responsibility for any injury to people or property resulting from any ideas, methods, instructions or products referred to in the content.

