1. Introduction
The deterioration of the ecological environment and the consumption of traditional fossil energy have become increasingly serious, prompting scholars worldwide to advocate for the accelerated development of clean and pollution-free renewable energy to achieve sustainable energy development [
1,
2,
3]. However, the continuous grid connection of renewable energy presents significant challenges and pressures to the operation and maintenance of power systems [
4,
5,
6,
7,
8]. Consequently, energy storage (ES) technology has become a critical foundation in building a new power system that promotes green and low-carbon energy transformation [
9,
10]. The cumulative installed capacity of new ES in China exceeded 4 million kilowatts by the end of 2021 [
11,
12]. To improve the consumption capacity of renewable energy, it is essential to accelerate the large-scale application of ES technology. Pumped storage, the most mature large-scale ES mode, operates by using surplus electric energy to pump water during low-demand periods and subsequently release the water to generate hydroelectric power during peak-demand periods.
Nowadays, the increasing installed capacity of wind power (WP) has become a major driving force for optimizing energy structure and achieving low carbonization. However, due to the intermittency, unpredictability, and fluctuation of WP, the stability of the power system is greatly affected and even threatened [
13]. Therefore, to improve the stability of power systems with a high proportion of renewable energy, ES technology is introduced to cooperate with WP, making full use of the fast charge–discharge characteristics of energy storage. In addition, ES can be charged during high power generation periods of wind and PV plants, reducing the amount of abandoned power, and discharged during low power generation periods, reducing the start-up of thermal power units and promoting the absorption of new energy [
14]. Thus, ES systems have a broad prospect in participating in frequency and peak regulation of power grids. However, due to the imperfections of the current domestic frequency regulation market and the high cost of ES products, the coordinated control means of ES systems and wind turbines for participating in grid frequency support have become a key topic of current research.
Among them, the vast majority of the literature takes WP prediction as the tracking target to make up for the error between the actual active power of WP and the prediction curve, to meet the assessment standards. In reference [
15], the method of optimization before evaluation is adopted to carry out the research, and the feasibility of ES to improve the accuracy rate and qualified rate of active power in wind farms is verified by numerical examples. In the early stage of the development of WP, the power system has the priority to fully accept WP, and it is reasonable to take the predicted power of WP as the tracking target. Common control strategies can be roughly divided into the current control strategy that only considers the current charge and discharge demand and the advance control strategy which considers the ES demand in the future period. The former can meet the tracking requirements when the ES capacity is sufficient; otherwise, the latter strategy should be considered.
The high charge–low discharge strategy is the earliest ES control strategy. Reference [
16] applied the high charge–low discharge strategy to a certain capacity of ES and found that the tracking effect of the combined system under different active power series of WP was different, but the paper did not make a quantitative analysis of this phenomenon. According to the simulation calculation in reference [
17], a better tracking effect can be achieved when the ES capacity reaches 15~25% of the wind farm capacity. The advance control strategy can be divided into a one-step forward control strategy, an advanced control strategy based on control coefficient optimization, and an advanced control strategy oriented by objective function. In reference [
18], battery limit states are partitioned according to state of charge (SOC). If the SOC is in the forbidden zone, the ES does not participate in the tracking of the power generation target; otherwise, the state of the SOC after fully tracking the power generation target is calculated. In reference [
19], five control coefficients were designed to establish the relationship between the charging and discharging power of energy storage, using the planned active power of WP and ES SOC. Using the short-term prediction information in the time window, a set of control coefficient values corresponding to the time window is obtained by the particle swarm optimization algorithm. For the fan rotor kinetic energy control, reference [
20] points out that the variable speed fan’s participation in frequency modulation is generally realized by adding a frequency control loop to the active power controller, and proper adjustment of the gain of the control loop can enhance the frequency modulation effect of inertia control and droop control. In reference [
21], inertial control and droop control are combined, and on this basis, the influence of different power levels of WP on frequency control performance is studied. Electricians began to realize the importance of the inertial response of WP [
22,
23]. Reference [
24] provides a frequency modulation control strategy for wind turbines considering power reference values, which effectively uses the inertia of wind turbines to assist in solving frequency problems in power systems. In addition, the combination of the intelligent optimization algorithm and control method is also an effective means to solve the collaborative control of the power grid with the participation of raw energy sources. Reference [
25] proposes a model prediction controller based on transient search optimization to realize the dual optimization process of load frequency control (LFC) of the power grid, so as to improve the dynamic and transient performance of the power grid.
The frequency support of hybrid energy systems with ES is a complex non-linear optimization problem. In general, the actual engineering application usually adopts the power distribution according to the adjustable capacity ratio, climbing speed ranking, and other ways, which cannot meet the optimal control requirements of the system. On the other hand, although the traditional mathematical optimization methods (such as the interior point method [
26]) are fast, they have poor global search ability and tend to fall into the local optimal solution. Therefore, it cannot be easily solved using traditional mathematical methods. In contrast, intelligent optimization algorithms such as the genetic algorithm (GA) [
27,
28] and particle swarm optimization (PSO) [
29] are more flexible in application and have stronger global search ability, but their solving speed is slow, which cannot meet the requirements of the automatic generation control (AGC) online control of large-scale regional power grids. Therefore, in this paper, we propose the use of the dingo optimization algorithm (DOA) to solve the problem [
30]. To verify the effectiveness of our proposed method, we introduce an extended model based on the two-region model for simulation verification.
The rest of this paper is arranged as follows:
Section 2 introduces the two-area load control model considering thermal power, hydropower, ES, and WP. At the same time, the objective function of this paper is introduced.
Section 3 describes the DOA used in this paper in detail. In
Section 4, based on the two-area load control model, the optimization effect of DOA under different power disturbances is simulated and analyzed. Meanwhile, to further test the optimization effect of DOA, the optimization results of DOA are compared with those of the proportion method (PORP) and GA [
31,
32].
Section 5 summarizes the contributions made in this paper in detail and gives the outlooks of future research.
3. DOA Algorithm
The DOA algorithm is a swarm intelligence optimization algorithm proposed by Peraza-Vazquez et al. in 2021 [
35]. The DOA algorithm was inspired by the hunting behavior of the dog population. DOA designs three different search patterns associated with four rules. During the operation of the DOA algorithm, these search rules and patterns balance the exploitation and exploration of the solution space well. The DOA algorithm considers four aspects of the dingo population: group attack, persecution, scavenger, and survival rates. The mathematical model of the DOA algorithm is shown below.
The random initialization of the dingo population is shown in Equation (8).
and
denote the lower and upper bounds of individual
, respectively.
is represented as a random number between 0 and 1.
Group attack: Dingoes tend to move in groups when hunting large animals. The group behavior can be expressed by Equation (9).
where
is represented as the next position of the dingo. na is represented as a random integer generated in the inverse order of [2, SizePop/2], where SizePop is represented as the size of the dingo population.
is the set of dingoes that engages in aggressive behavior, where
, X is represented as a randomly generated population of dingoes.
is represented as the current position of the dingo.
is represented as the best dingo location found in the previous iteration.
is a scaling factor used to change the trajectory of the dingo, usually taken as a uniformly generated random number between −2 and 2.
Persecution: Compared with hunting large animals, the behavior of a dingo hunting small animals can be expressed by Equation (10).
is represented as the dingo’s movement.
is represented as the current position of the dingo.
is represented as the best dingo location found in the previous iteration.
is represented as a uniformly generated random number between 0 and 1.
is denoted as the position of
r1 dingo chosen at random.
Scavenger: In addition, dingoes also have the behavior of looking for carrion in the process of random action, which can be expressed by (11).
where
is represented as a binary number randomly generated by
Figure 3a,
.
Survival rates: During the operation of the DOA algorithm, the survival rate is expressed by Equation (12).
where
and
are represented as the worst and best fitness values, respectively.
is represented as the current fitness value. In addition, Equation (13) is applied to the case of low survival rate through
Figure 3b.
where
is denoted as a dingo with a low survival rate that will be updated.
and
are represented as random numbers from 1 to population size. The overall operation flow of the DOA algorithm is shown in
Figure 4.
4. Case Study
To test the online optimization effect of the proposed method, the effectiveness of the DOA algorithm is simulated and analyzed through the extended model of the IEEE standard two-area load control model, as shown in
Figure 5a,b. Meanwhile, considering the current trend of energy structure transformation, this paper adjusts a single AGC unit to five different types of units, including one thermal power unit, one hydropower unit, two WP units, and one ES unit, as shown in
Figure 5c. Considering the characteristics of thermal power, hydropower, WP, and ES in the actual project, we have limited the frequency regulation range and time delay, and the specific parameters are shown in
Table 2 and
Table 3 [
36,
37]. All experiments in this paper were carried out on the MATLAB2020b platform. In addition, the PROP method and GA algorithm are adopted in this section to conduct comparative experiments, in which the populations of the GA algorithm and DOA algorithm are 50 and the iteration times of the algorithms are 30.
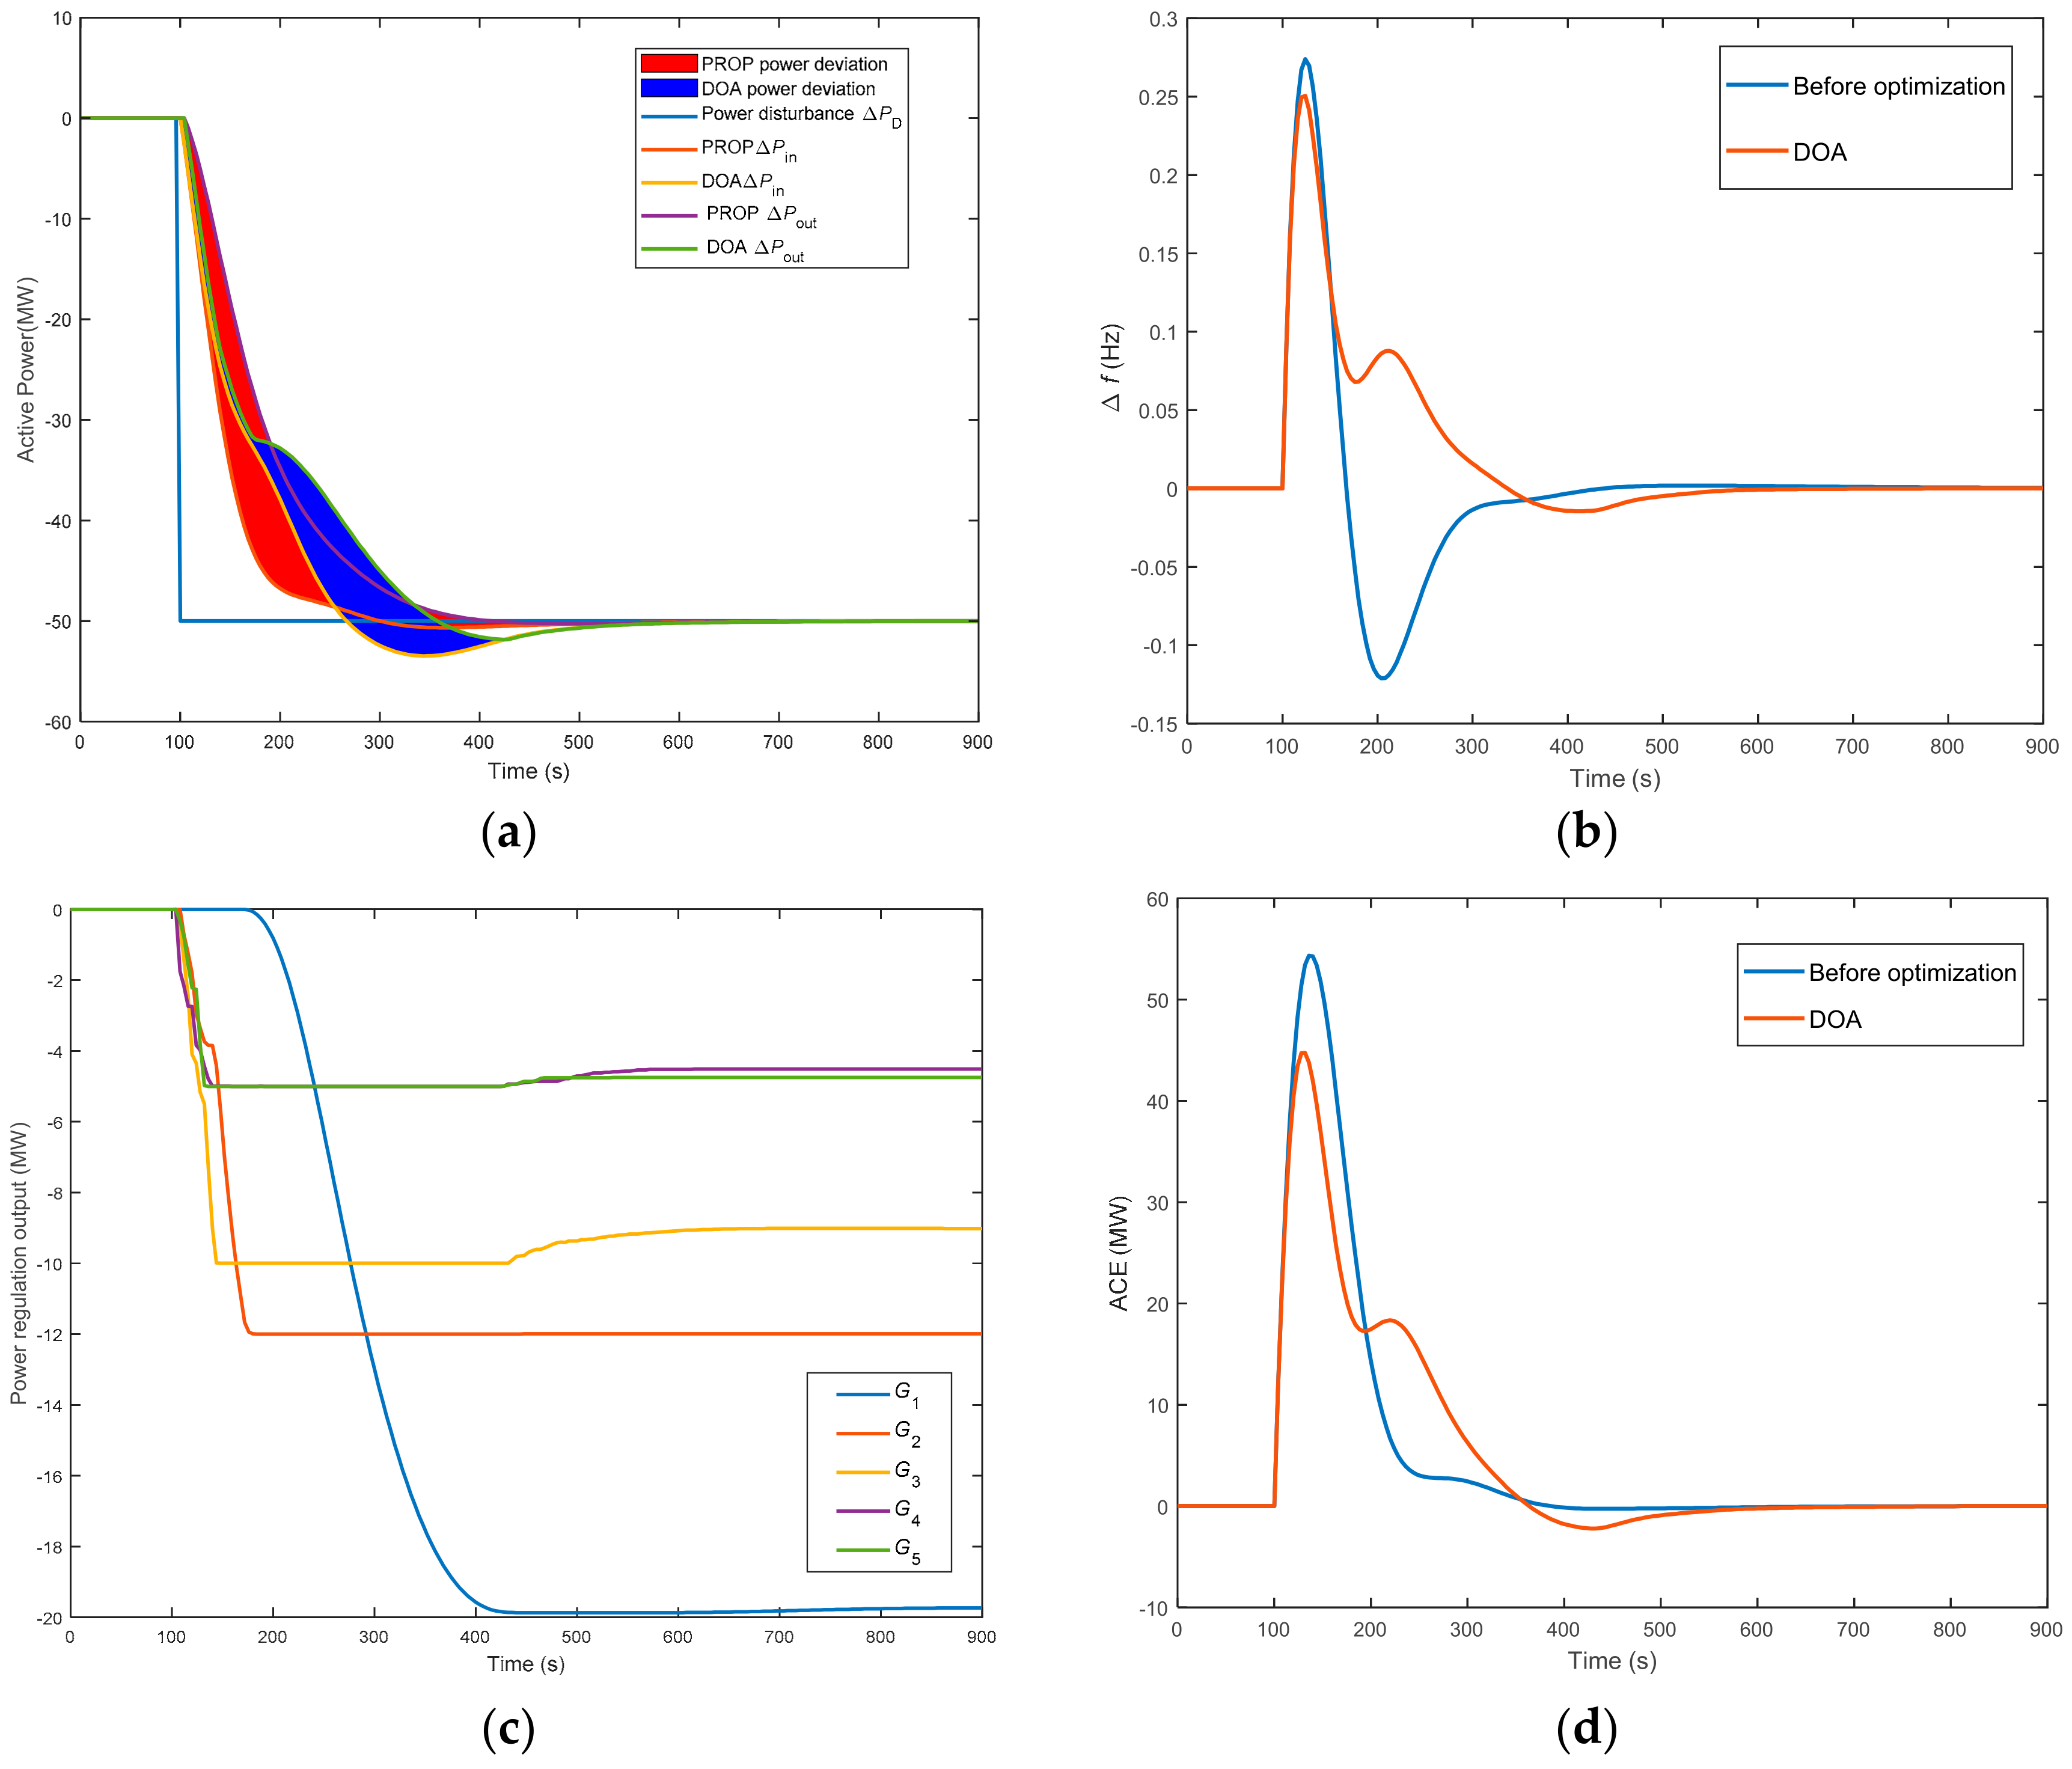
4.1. Power Disturbance
The PROP method is used to allocate frequency regulation instructions proportionally according to the frequency regulation capacity of each frequency regulation unit. At present, the PROP method is widely used. However, it is difficult for the PROP method to take full advantage of the fast response speed of renewable energy units. Therefore, this paper adopts an intelligent optimization algorithm to improve the response speed of regional power grid frequency regulation and reduce power deviation. To verify the effectiveness of the DOA algorithm in the optimization of power network frequency modulation instruction, this section conducts a simulation experiment with power disturbance
. At the same time, the PROP method was added for comparison. The optimization effects of the two methods are shown in
Figure 6. According to
Figure 6, conclusions can be obtained as follows.
The overall power regulation curves of the PROP and DOA methods are shown in
Figure 6a. The red area in the figure represents the power deviation of the PROP method, and the blue area represents the power deviation of the DOA method. The optimized DOA greatly reduces the total power deviation. Meanwhile, in the early stage of power regulation, the DOA algorithm can make full use of the characteristics of the fast regulation speed of renewable energy, and the power deviation in the early stage is greatly reduced. In addition, the power output curve and power instruction curve optimized by the DOA algorithm have a higher degree of fitting.
The mean frequency deviation curves of the PROP and DOA methods are shown in
Figure 6b. The maximum deviation of the mean deviation curve after optimization of DOA algorithm is smaller than that of the PROP method. Meanwhile, the mean frequency deviation curve after optimization of the DOA algorithm rises more smoothly.
After DOA online optimization, the real-time power output curve of each frequency regulation unit is as shown in
Figure 6c. Thermal power units did not participate in this frequency regulation, and the response speed of hydropower, WP, and ES is faster. Therefore, the characteristics of maximizing the utilization of WP and ES through algorithm optimization will contribute to the frequency stability of the regional power grid.
Area control error (ACE) is the deviation value formed by the load, generation power, frequency, and other factors in the control area. ACE reflects the balance between power generation and the load in the area. Compared with the PROP method, after the optimization of the DOA algorithm, the value of the lowest point of ACE increases. Meanwhile, the ACE curve optimized by the DOA algorithm rises more gently, as shown in
Figure 6d.
In this case, to further test the online optimization performance of the DOA algorithm, the GA algorithm is added in this paper for comparison, as shown in
Table 4. The three methods were evaluated in terms of
, accuracy, and power error. From
Table 4, compared with the traditional PROP method, the intelligent optimization algorithm can dramatically improve the dynamic response performance of the AGC system of the regional power grid and significantly reduce the total power deviation. Meanwhile, compared with the GA algorithm, the DOA algorithm has better performance in the two evaluation indexes of the accuracy and power error, and the overall performance is better. Therefore, the simulation results show that the DOA algorithm is more suitable to deal with the frequency regulation optimization of the area power grid.
4.2. Power Disturbance
When the power disturbance value is small, the thermal power frequency regulation units under the intelligent optimization algorithm almost do not participate in the frequency modulation process. Therefore, to verify the universality of the DOA algorithm in the optimization of power network frequency modulation instruction, this section conducts a simulation experiment with power disturbance
. Meanwhile, the PROP method was added for comparison. The optimization effects of the two methods are shown in
Figure 7. From this, conclusions can be obtained as follows.
The overall power regulation curves of the PROP and DOA methods are shown in
Figure 7a. The optimized DOA algorithm greatly reduces the total power deviation. Meanwhile, in the early stage of power regulation, DOA algorithms can take full advantage of the fast regulation of renewable energy sources, and the power deviation in the early stage is greatly reduced. In addition, in about 250 s, when the thermal power unit starts to undertake the task of frequency regulation, due to the slow response speed of the thermal power unit,
Figure 7a shows that there is a significant deviation between the actual power output curve and the command power output curve.
The mean frequency deviation curves of the PROP and DOA methods are shown in
Figure 7b. The maximum deviation of the mean deviation curve after optimization of the DOA algorithm is smaller than that of the PROP method. Meanwhile, the mean frequency deviation curve after optimization of the DOA algorithm rises more smoothly.
After DOA online optimization, the real-time power output curve of each frequency regulation unit is as shown in
Figure 7c. The response speed of thermal power units is relatively slow, while the response speed of hydropower, WP, and ES is faster. Therefore, the characteristics of maximizing the utilization of ES through algorithm optimization will contribute to the frequency stability.
Compared with the PROP method, after the optimization of the DOA algorithm, the value of the lowest point of ACE increases. Meanwhile, the ACE curve optimized by the DOA algorithm rises more gently.
In this case, to further test the online optimization performance of the DOA algorithm, the GA algorithm is added in this paper for comparison, as shown in
Table 5. The three methods were evaluated in terms of
, accuracy, and power error. Compared with the GA algorithm, the DOA algorithm has better performance in the three evaluation indexes of the
, accuracy, and power error, and the overall performance is better. Therefore, the DOA algorithm is more suitable to deal with the frequency regulation optimization.
4.3. Power Disturbance
To further prove the effectiveness of the DOA algorithm, the simulation experiment when the step power disturbance is negative is added to this case. In this case, the step power disturbance is
. Meanwhile, this paper compares the optimization results of the DOA algorithm with the PROP method, as shown in
Figure 8. According to
Figure 8, it can be analyzed as follows.
From
Figure 8a, when the power disturbance is negative, the optimized DOA algorithm also greatly reduces the total power deviation. Meanwhile, in the early stage of power regulation, DOA algorithms can take full advantage of the fast regulation of renewable energy sources, and the power deviation in the early stage is greatly reduced. In addition, the power output curve and power instruction curve optimized by the DOA algorithm have a higher degree of fitting.
The mean frequency deviation curves of the PROP and DOA methods are shown in
Figure 8b. According to the simulation results, it is obvious that the maximum deviation of the mean deviation curve after optimization of the DOA algorithm is smaller than that of the PROP method.
After online optimization of DOA, the real-time power output curve of each frequency regulation unit is as shown in
Figure 8c. Thermal power units have not participated in the frequency regulation process, and the frequency regulation task can be completed through hydropower, WP, and energy storage.
Compared with PROP method, after optimization of the DOA algorithm, the highest point of the ACE curve drops. Meanwhile, the ACE curve optimized by the DOA algorithm declines more gently.
From
Table 6, compared with the traditional PROP method and the GA, the DOA algorithm can significantly improve the performance of the AGC of the regional power grid, significantly reduce the total power deviation, and has better overall optimization performance.
4.4. Power Disturbance
When the power disturbance ratio is small, thermal power units hardly participate in the frequency modulation work. This section adds that the step power disturbance is
in the simulation experiment. Meanwhile, the results of the DOA algorithm and PROP method are compared in
Figure 9.
The overall power regulation curves of the PROP and DOA methods are shown in
Figure 9a. When the power disturbance is negative, the optimized DOA algorithm also greatly reduces the total power deviation. Meanwhile, in the early stage of power regulation, the DOA algorithm can make full use of the characteristics of the fast regulation speed of renewable energy, and the power deviation in the early stage is greatly reduced.
The mean frequency deviation curves of the PROP and DOA methods are shown in
Figure 9b. The maximum deviation of the mean deviation curve after optimization of the DOA algorithm is smaller than that of PROP.
After DOA online optimization, the real-time power output curve of each frequency regulation unit is as shown in
Figure 9c. The response speed of thermal power units is relatively slow, while the response speed of hydropower, WP, and ES is faster. Therefore, the characteristics of maximizing the utilization of ES through algorithm optimization will contribute to the frequency stability.
Compared with the PROP method, after optimization of the DOA algorithm, the highest point of the ACE curve drops. Meanwhile, the ACE curve optimized by the DOA algorithm declines more gently, as shown in
Figure 9d.
In this case, to further test the online optimization performance of the DOA algorithm, the GA algorithm is added in this paper for comparison. From
Table 7, compared with the traditional PROP method, the intelligent optimization algorithm can significantly improve the performance of the AGC of the regional power grid and significantly reduce the total power deviation. Meanwhile, compared with the GA algorithm, the DOA algorithm has better performance in the two evaluation indexes of accuracy and power error, and the overall performance is better. Therefore, the DOA algorithm is more suitable to deal with frequency regulation optimization.
5. Conclusions
This paper investigates the cooperative control of wind power (WP) and energy storage (ES) involved in the secondary frequency regulation of the grid for hybrid energy systems. A new multi-energy secondary frequency regulation cooperative control method is proposed. The contributions of this paper are as follows.
Considering the accelerated process of energy structure transformation, the construction of a new power system continues to advance under the background. This paper constructed a regional power grid automatic generation control (AGC) model with the participation of WP and ES to improve the system’s rapid response performance.
A multi-type energy cooperative control method based on the dingo optimization algorithm (DOA) algorithm is proposed, which realizes real-time online optimization of frequency modulation instructions through the DOA algorithm and quickly obtains the regulation scheme with a fast response speed and good convergence effect, to significantly improve the cooperative regulation performance of the regional power grid.
According to the recent energy development trend, future research plans are as follows.
According to the actual situation, the type and quantity of frequency modulation units are increased, and the appropriate intelligent optimization algorithm is studied to realize the cooperative control of the regional power grid.
For the frequency analysis and control of large hybrid energy systems, we can take advantage of deep learning classification, dimension reduction clustering, and other obvious advantages to improve the existing frequency problem modeling methods and prediction and evaluation effects.


