Review

A Comparative Review of Capacity Measurement in Energy Storage Devices

School of Electrical, Electronic and Computer Engineering, North-West University, Potchefstroom 2520, South Africa
*
Author to whom correspondence should be addressed.
Energies 2023, 16(10), 4253; https://doi.org/10.3390/en16104253
Submission received: 11 April 2023 / Revised: 12 May 2023 / Accepted: 17 May 2023 / Published: 22 May 2023

Abstract

:
Energy storage devices are fast becoming a necessity when considering a renewable energy harvesting system. This improves the intermittency of the source as well as significantly increasing the harvesting capacity of the system. However, most energy storage devices have a large limitation with regards to their usable life—this aspect is especially relevant to batteries. The degradation of batteries (and energy storage devices) plays a large role in determining their feasibility and the degradation is determined through capacity estimations—due to the inability/difficulty of directly measuring instantaneous capacity. This article aims to research the various methods used to estimate the capacity as well as the applications of these measurements aimed at reducing the degradation of the energy storage device. Through this research, the advantages and disadvantages of the measurements and their applications will be revealed, which will then highlight an area in which these estimations or their applications can be improved. The novelty of this paper lies in the graphical representation of the capacity measurement techniques, and how they relate to each other, as well as the relations and differences between their applications, highlighting the limitations in how the measurements are used.

1. Introduction

Batteries, especially lead-acid (Pb-SO4) and lithium-ion (LIB), are gaining a larger presence in the energy storage industry due to the increased interest in the renewable energy industry [1]. One major advantage of their inclusion is their addressal of the intermittency of renewable sources, but an equally large disadvantage is their feasibility and sensitivity with respect to cyclability [2]. There are many factors that affect and further exacerbate the cyclability of the energy storage device (ESD)—factors that can be user-dependant but are mostly unavoidable [3]. These factors, and how they affect cyclability, are related to the capacity degradation of the ESD/battery [4].
From A. Townsend et al. [3], a list can be created of the most common degradation causes: over-discharge, overcharge, crystal sulfation, stratification, water loss, lithium-ion insertion, loss of lithium inventory, loss of active material, ohmic resistance increases, lithium plating, electrochemical reactions, voltage resets, and uneven charge. Of these, overcharging/discharging, environmental temperatures [5], and too frequent/infrequent recharges can be largely attributed to user behaviour. The best method for reducing user-behaviour based degradation is to reduce the contribution of the user. This can be achieved using energy management techniques (EMTs) or an energy management system (EMS) [6].
An EMT monitors and controls the flow of energy between the source and the load [7]. It can include a battery management system (BMS) and/or charge controller (CC), or it can simply just utilise an electronic switch to control when and how the source is used [3]. The simplest form of an EMT is using the topological arrangement of the ESDs to promote autonomous voltage equalisation across the connections; this is discussed in A. Townsend et al.’s work [8]. A more complicated EMT can contain an array of electronic switches (transistors, relays) aimed at intelligent control of the ESD or arrangement [9,10,11,12,13,14,15].
A BMS controls the energy of the battery or battery pack [16]. Similar to EMTs, the topological arrangement of the cells in the battery pack can provide autonomous voltage equalisation [17]. For clarity, a BMS focuses on monitoring and controlling the battery pack, whereas the EMT monitors and controls the entire system, which may or may not include a BMS [3]. A CC is used to monitor and control the charge and discharge of the ESD; it helps prevent, or reduce, the occurrence of, overcharging and overdischarging [18]. A hybrid energy storage system (HESS) presents a different approach to energy management, where it makes use of more than one ESD to distribute the load requirements according to the various ESD’s capabilities [19,20]. It can make use of one or more of the above mechanisms (BMS, CC) in order to redistribute the stresses accordingly and thus improve the ESD’s usability or feasibility [20]. All of these techniques make use of the capacity of the ESD to control it. Capacity generally refers to the storage (in ampere hours) of the ESD, but it can also refer to the remaining useful life (RUL), state of health (SOH), state of charge (SOC), or state of function (SOF) of the ESD [21].
The novelty of this paper is the inclusion of figures and descriptive tables that compare the various capacity measurement techniques (and their applications), showing the differences between them and how they relate to each other.
The purpose of this study is to research the capacity of ESDs—how it is measured and the applications of those measurements—with a main focus on how those measurements are used in the specified application. The main purpose will be to highlight the downfalls of the manner in which these measurements are used and identify areas for improvement. Referring to Figure 1, to fulfil this purpose, the measurement methods related to experimental-based and model-based will be discussed, listing their advantages and disadvantages as well as other categories that they form part of. The applications in which these measurements are used will be discussed, looking into the different variations of the application and how they use the capacity measurements of the ESD and, consequently, the downfall of that method.
As the main focus of this paper is the method in which the capacity measurements are used, the topics listed will predominantly include high-level information that relates to or leads to how the capacity measurements are used for ESDs and their EMSs. Any in-depth information that does not lead to this will fall outside of the scope and thus not be included. The purpose is to find similarities and limitations in the methods of capacity measurement utilisation and not in the research of ESD capacity (this was covered in A. Townsend et al. [3]) or improvement thereof.

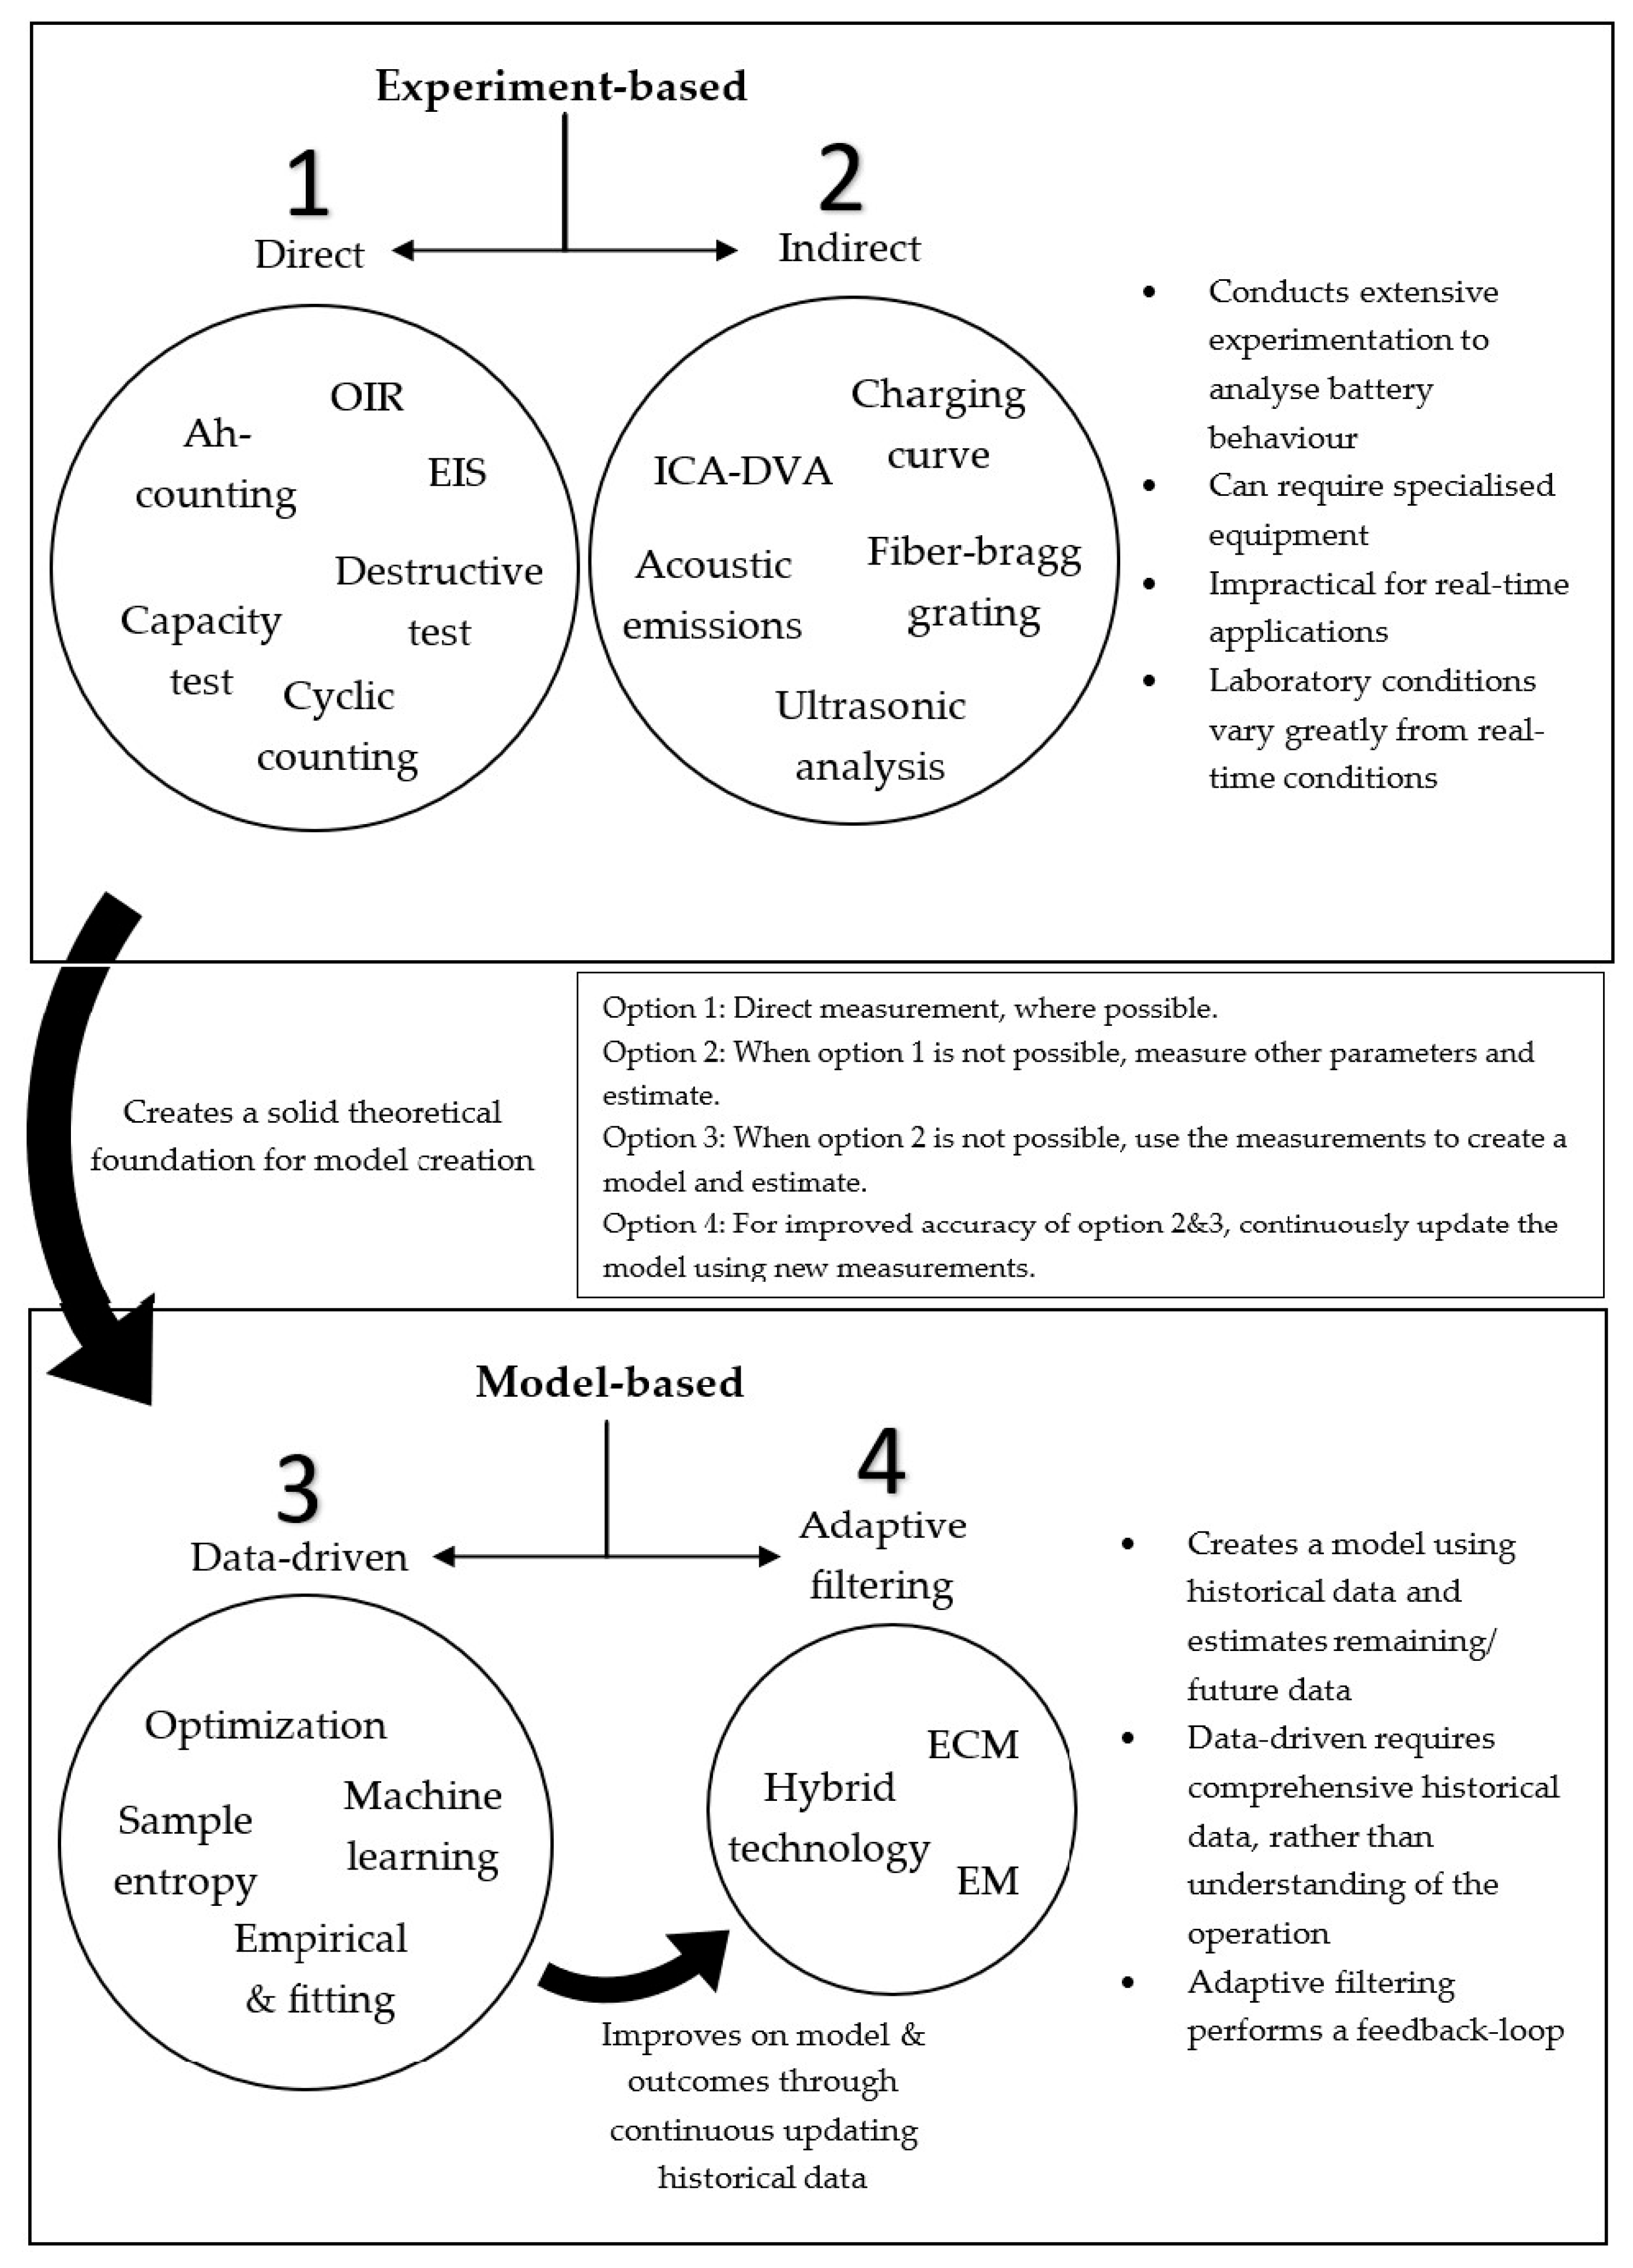
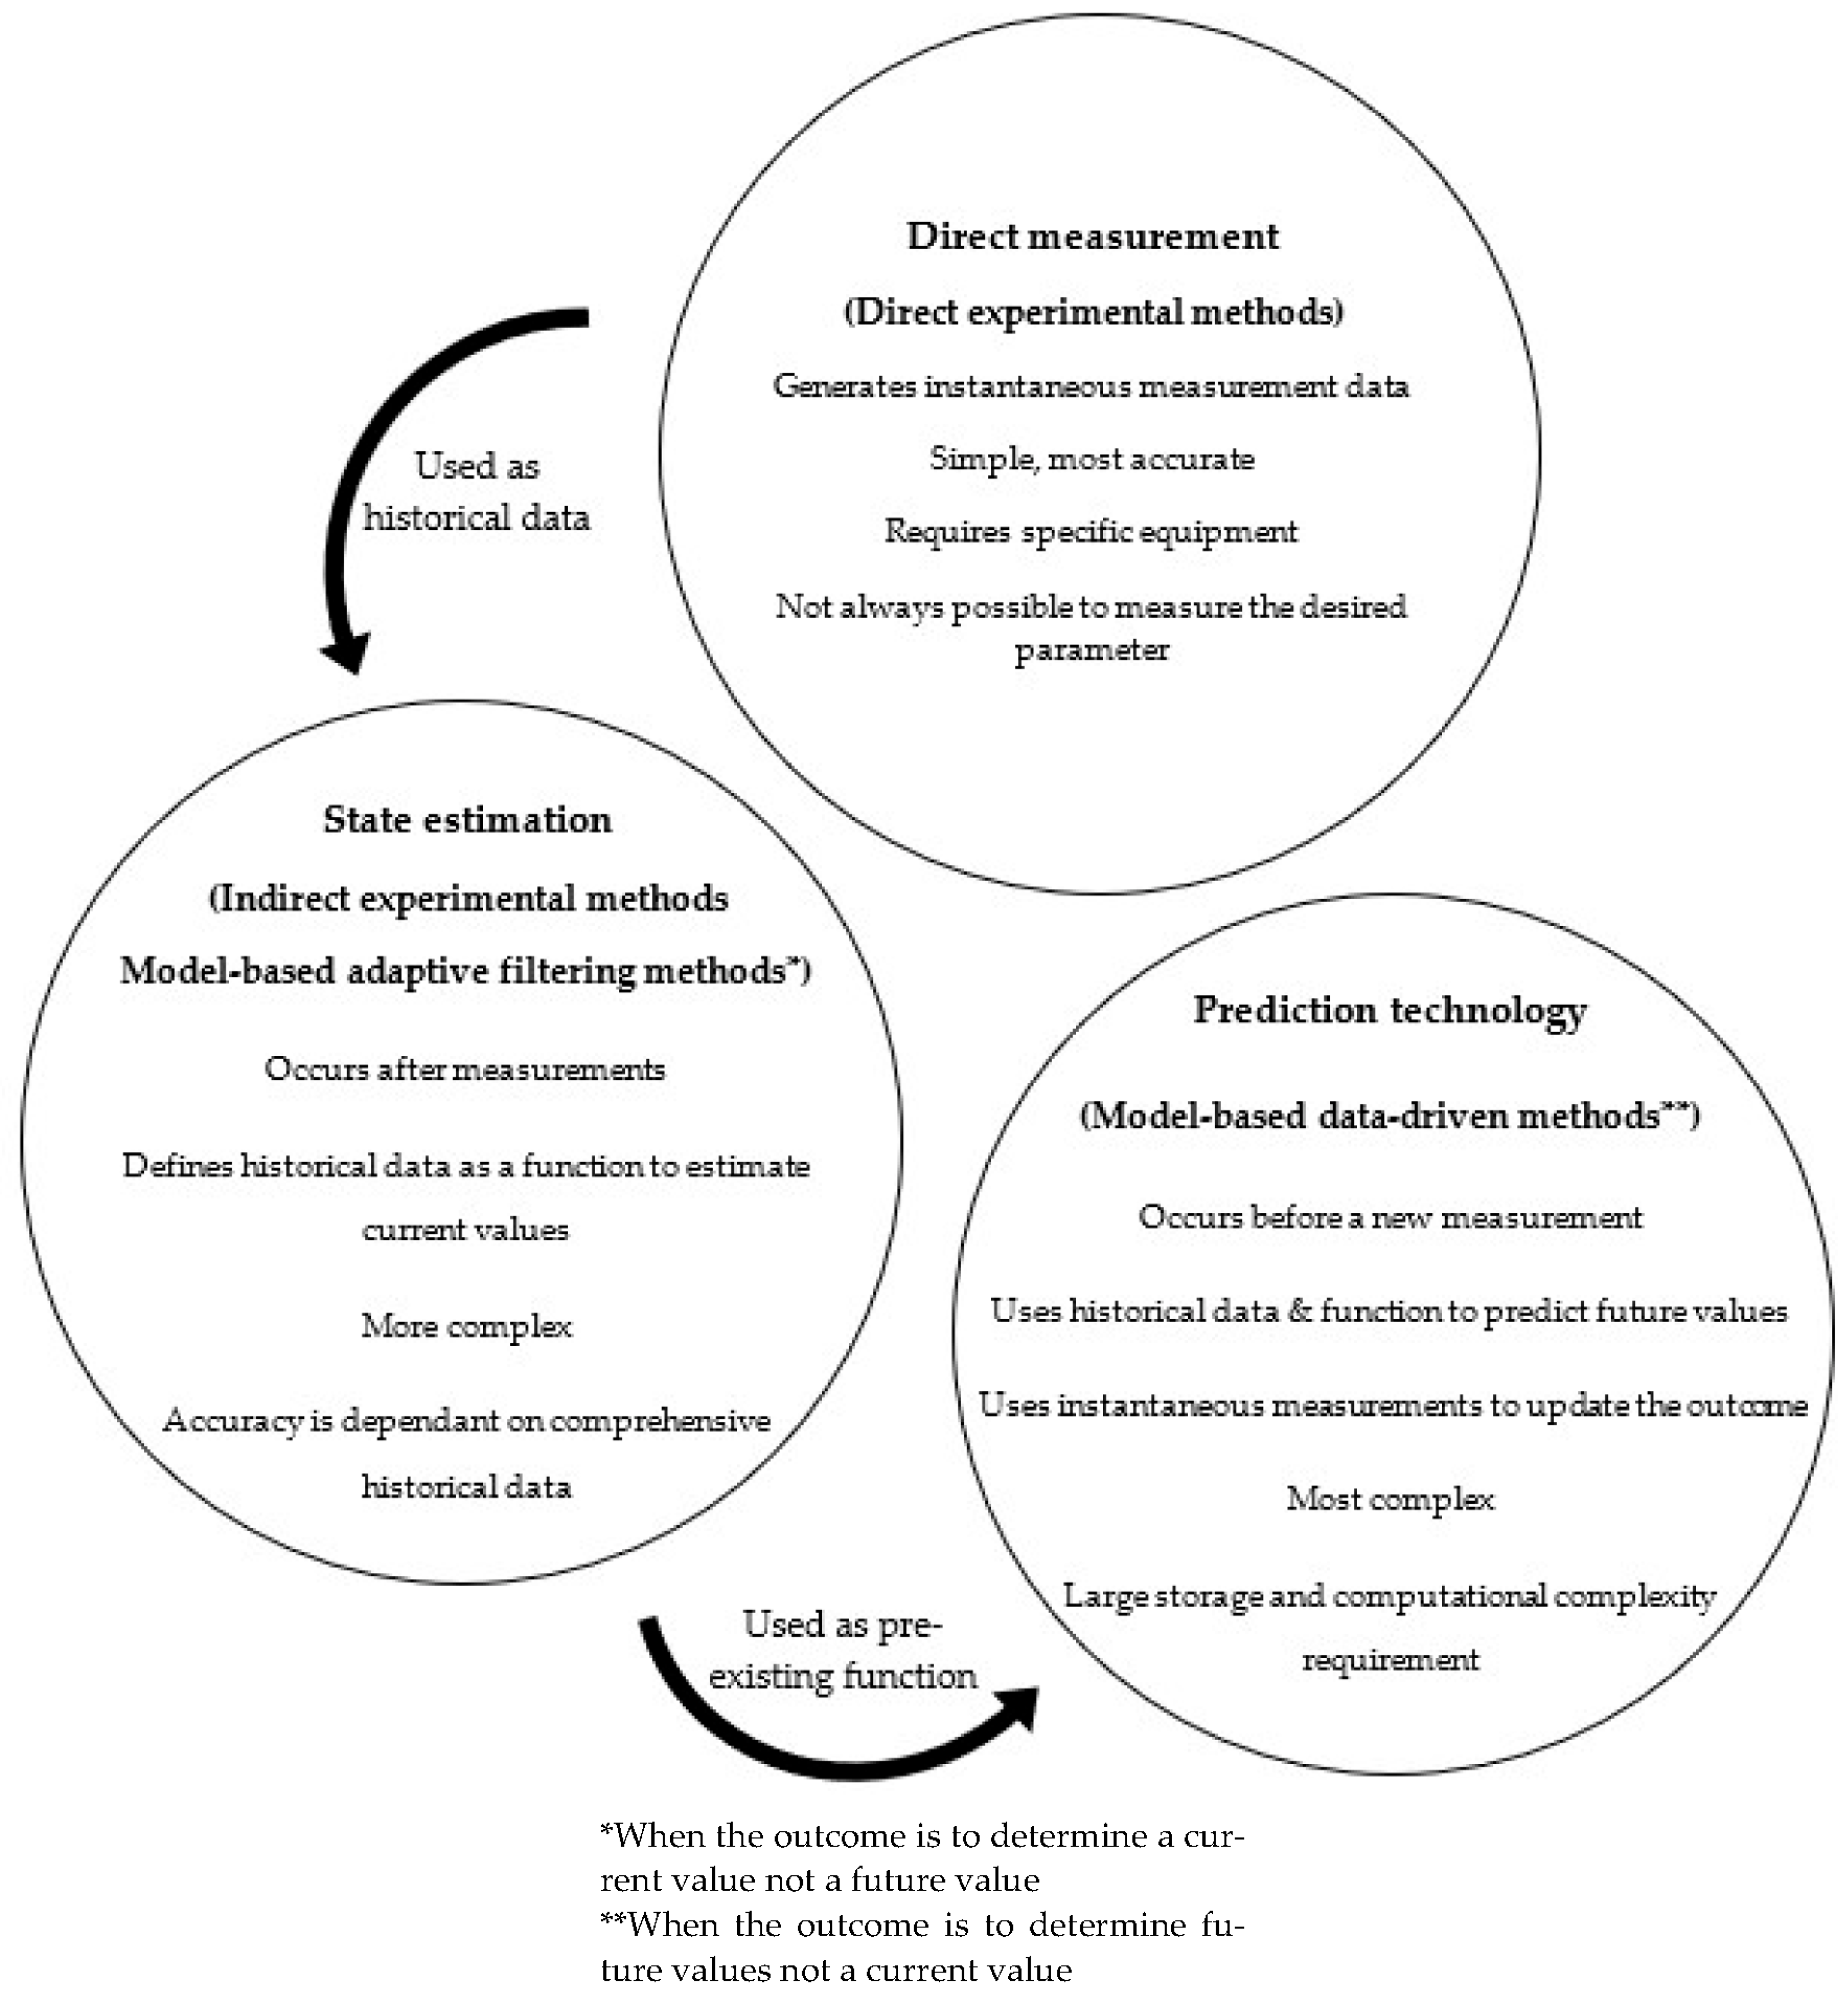
2. Capacity Measurement

Almost anything that produces or stores energy experiences some kind of capacity loss over time. Primary and secondary batteries, ultracapacitors (UC), compressed air energy storage (CAES), hydropower energy storage (HPES), solar panels, wind power generators, hydropower generators, etc., all have some kind of degradation that allows these devices to have a quantifiable usable lifetime [22]. Possibly the most sensitive of the mentioned items are secondary batteries, which experience performance reductions due to parasitic reactions even when not in use [23]. Parasitic reactions refer to secondary electrochemical reactions that develop and occur outside of the primary electrochemical reactions that reduce the charge of the battery and increase the degradation rate [24]. This capacity fade can be further divided into two groups—reversible and nonreversible. The former is related to self-discharge, the latter to capacity fade [25], where capacity fade can lead to increased self-discharge [26].
Self-discharge refers to the (partial) depletion of a battery’s charge through secondary electrochemical reactions that can occur with or without a load; this predominantly occurs due to internal resistances and their increase [27]. Internal resistances of batteries generally increase (even if only slightly) as the battery degrades, as well as while it depletes.
Capacity is the quantity of electric charge that can be stored and delivered in a cell, which can refer to the energy density, current-rating or even the c-rate [21]. Capacity fade generally refers to a loss in a cell’s capacity to store energy, while power fade refers to the loss of cell power due to increased resistance [28,29]. Capacity fade can be divided into two categories—true capacity fade and rate capacity fade. The former is active material loss and is independent of the current level, while the latter is due to cell impedance growth and depends on the current level [30]. A cell impedance increases cause the minimum cut-off voltage to be reached faster than compared to a new cell [4].
A larger depth of discharge (DoD) is found to accelerate capacity fading [5,6]. A higher initial SOC can result in a faster capacity fade rate for cycling [6], but this is different for cells under storage. For calendar loss, high SOC either has a significant influence on capacity fading [7] or has no influence at all [8]. High temperature is found to be an additional stress factor for capacity fading [9,10,11]. Overdischarge, overcharge, and high c-rates can also increase the fade rate [12,13]. C-rate has an indirect effect on capacity fading in the form of a temperature rise due to ohmic heating [14,15].
Batteries have some important health indices: SOH, SOC, RUL, SOF, end of life (EOL), and state of safety (SOS) [31,32,33,34,35,36]; these are used to determine the capacity of the battery. SOH refers to the instantaneous parameters of the battery and how they relate to the full health parameters of that battery; usually represented as a percentage, this value represents the degree of ageing of a battery, represented in capacity loss or resistance increment [37]. SOC represents the remaining charge of the battery; there are many methods used to determine this value (coulomb counting, OCV [38], neural network [39,40], Kalman filter [41,42,43,44,45], etc.) [46]. RUL uses the SOH to estimate the operation of the battery until it reaches the 20% drop in overall capacity and thus needs to be replaced [47]. This replacement time is referred to as the EOL [48]. SOF is a method for describing how the battery performs in delivering the required load—this can be represented by the peak output power [49,50]. SOS represents the condition of a battery when it poses a danger—this can refer to the thermal runaway temperature [32].
The accuracy of these measurements is imperative for the health of the battery, as it can lead to overcharging or overdischarging of the battery. Inaccuracy can also lead to premature replacement of the battery, which in turn increases the overall cost of the system [51,52,53,54]. If the battery is used at too low a capacity rate, it can be underutilised and create instances where the number of cycles used is unnecessarily increased. Alternatively, if the battery capacity is overestimated, the battery can be overused, increasing the degradation rate further [55].
As a battery ages, its cyclability and capacity decrease—these decreases further affect the SOH of the battery [56]. The SOH is a combination of the maximum charge voltage, energy capacity (compared to the original full-health capacity), internal resistance, and usable cycles of the ESD [57]. When cells are combined to increase the capacity of the system, the SOH of each battery, as compared to both the full health of that cell and the SOH of the other cells, is very important to maintain consistency throughout. Variations in any cell will affect the other cells [58]. All of these measurements and parameters are combined and used in an EMS or BMS, which helps to determine the optimal use and better management of the EMS/BMS, determine the precise time for replacement of the ESD, pinpoint a fault, determine the required power of a task, better select the ESD for a specific application, and determine the life expectancy of the ESD [59].
The SOH is an indication of the ageing history of the ESD, which can help predict future ageing thereof and, thus, the RUL [59]. Herein lies the complexity—how one determines the SOH of a battery [58]. There are a few SOH estimation methods [60]; however, accuracy requires increasingly complex calculations/computations, some of which are not suitable for real-time applications. Less complex computations are increasingly less accurate and insufficient. The inaccuracy of these methods lies in the fact that they are based on the operation of other batteries and on the full-health operation of the specified battery [59]. Before the battery is sent to the user, it undergoes laboratory tests to collect an array of data that characterises the specific battery. Algorithms are then used to create a table of information that defines its working points as well as the parameters for the BMS [61]. This information is then merely used to predict the RUL, but these measurements are no longer made once the battery is in operation, thus the base data remains constant [62]. SOH estimation methods can be divided into two groups: model-based and experimental, each with their various subcategories [62], as shown in Figure 2.
Model-based prognostics, also known as physics-of-failure prognostics, use models generated from fundamental laws of physics to calculate the RUL of the system [63,64]. Experimental methods involve analysing the battery’s behaviour through extensive experimentation [65,66]. Both have further subdivisions: direct and indirect experimental-based, data-driven, and adaptive filtering model-based [63,64,65,66].
Figure 2. Capacity measurement techniques, adapted from [66,67,68].
Energies 16 04253 g002
Direct experimental-based methods use actual measurements for the estimation of those same measurements, whereas indirect methods will make estimations of parameters based on other parameter measurements [67]. Data-driven model-based uses existing/collected data in the model to create estimations [69,70], whereas adaptive-filtering follows the same principle, but it utilises some form of a feed-back loop to continuously update and optimise the model [67].
Direct measurement techniques present more of a traditional approach and, as the name suggests, it measures the desired parameter directly, if possible [67]. This last statement sheds light on the limitations of this technique, as it is not always possible to directly measure certain parameters, such as SOH, RUL, EOL, or immediate capacity [71,72]. Indirect measurement techniques can obtain the desired parameters by exploiting extensive data; it is generally a multistep technique that utilises parameters linked to those desired, to obtain that parameter. Indirect measurements obtain more data than direct measurements to make more accurate deductions, but they remain estimations and thus have a lot of room for improvement as well as error [67]. Experimental techniques provide comprehensive estimations; however, BMSs require more accurate and real-time estimations of the ESD parameters; this is where model-based techniques are preferred [73].
Model-based techniques can be seen as an extension of experimental techniques as they use real-time data to develop the models and obtain the desired parameters. Due to the extensive requirement for data, these techniques are costly, have large computational complexity, and require long data collection periods [67]. Data-driven techniques collect the data first to create a model that is then used to obtain/estimate the desired parameters [74]. Adaptive filtering improves on this by continuously collecting data after the implementation of the model and reapplying it to the model to improve the accuracy and relevance of the desired parameters [67].
Generally, when referring to batteries, these two methods are also used to quantify capacity fade. The experimental method uses current, temperature, DoD, and Ah-throughput (instead of cycle number); the numerical method (model-based) uses electrochemical models to simulate capacity fade, which requires many parameters and uses wide design parameters and operating conditions [75]. For direct measurements, Ah-counting, capacity tests, ohmic internal resistance (OIR), electrochemical impedance spectroscopy (EIS), destructive testing, and cycle number counting can be used. For Ah-counting, the battery is run through complete charge and discharge cycles at a constant, low current. To determine the SOH using this method, Equation (1) [67] is used.
S O H = Q m a x Q n o m i n a l * 100 %
For Equation (1), Qmax refers to the attainable (measured) capacity and Qnominal refers to the initial (full health specified) capacity of the battery. This method is generally used to verify other techniques, and it is especially crucial for the equivalent circuit model (ECM) of the model-based method and capacity measurements.
Capacity tests are used to indicate the attainable capacity and to calibrate the capacities of experimental models in laboratories. OIR applies a pulsed current to the battery to measure the DC resistance; for this, Equation (2) [67] is used.
R O = Δ U t Δ I L
For Equation (2), ΔUt refers to the pulsed voltage and ΔIL refers to the pulsed current. This method is used because there is a correlation between battery capacity fade and internal resistance increase, which therefore determines the battery EOL.
EIS uses a wide frequency-spectrum sinusoidal signal to determine the specific impedance-dependent response of the cell [76]. Destructive testing has many variations, including, X-ray diffraction [77], Raman spectroscopy [78,79,80], scanning transmission electron microscope (TEM) [81], cyclic voltammetry [81], X-ray photoelectron spectroscopy [82], atomic force microscopy (AFM) [83], scanning electron microscope (SEM) [81], and Auger electron spectroscopy (AES) [84,85], all of which destruct the cell/battery in order to obtain the results of the tests. Finally, cycle number counting is the simplest method, as it involves the physical tally of the cycles used by the cell and comparing it to the supplier’s specified cycle life [86].
For indirect measurements, charging curve [84], ultrasonic analysis [87], incremental capacity analysis and differential voltage analysis (ICA-DVA) [88], acoustic emissions, and fibre-bragg grating (FBG) [89] can be used. The charging curve method evaluates the constant voltage/current/power stage of the charging curve and compares it to that of the full health charging curve [84]. Ultrasonic analysis uses a pulse generator to emit ultrasonic waves into the battery [87]. Refraction, reflection, and wave pattern transformations are created at the critical interfaces, and secondary waves are formed due to faults that are then received and analysed. For ICA-DVA, ICA researches the intercalation characteristics of the battery, and DVA will then scrutinise the voltage curve to obtain the ageing information [88]. Acoustic emissions use a sensitive microphone attached to the surface of the battery, which then measures the acoustic waves of the relaxation of the mechanical stresses within the battery [67]. Finally, FBG is based on the reflection of optical signals passing through an expanding and contracting optical fibre [89].
Data-driven methods can use optimisation algorithms [90], empirical and fitting algorithms [91], sample entropy [92], and machine learning [93] for their estimations. Optimisation algorithms identify the SOH parameters using intelligent optimisation algorithms [90]. Empirical and fitting algorithms estimate the future performance of different battery types based on the available battery health data [91]. Sample entropy uses higher-pulse-power-characterisation voltage sequencing for SOH estimation [92]. Machine learning designs a model based on testing or training data to give accurate approximations or predictions without being programmed to do so [93]. These can include Gaussian process regression, neural networks, support vector machines, fuzzy logic, Markov chain, and Monte Carlo.
Finally, for adaptive filtering, electrochemical models [94], ECM [95], and hybrid methods [96] can be used. For the electrochemical model, nonlinear correlated partial differential equations are used to generate the model, which will explain the cell’s internal electrochemical dynamics. This method is similar to ECM in that it utilises adaptive filters to identify and estimate the battery SOH [94]. An ECM uses fundamental electrical components to simulate the operation of the battery and thus estimate the SOH [95]. An ECM is a scalable model, however, the more the model is scaled (up or down), the more errors and deviations from the real-time output can be expected, leading to poor predictions of the (remaining) capacity. Finally, hybrid methods make use of both model-based and experimental methods, the former performs parameter identification, whereas the latter processes those parameters. The experimental methods improve or lead to new model-based techniques [96].
There are other measurement methods that fall under these two main types of SOH-measurements; however, they fall outside of the scope of this paper. These various measurement techniques have individual advantages and disadvantages that are used to distinguish their applications; these are summarised in Table 1 below.
These methods can be further categorised according to three different measurement methods: direct measurements, state estimation, or prediction technologies; their division is shown below in Figure 3.
Direct measurement is a present/instantaneous action to obtain current data about the system; state estimation occurs after the measurement has been taken; and prediction will occur before a new measurement is taken [71,97,98]. Direct measurements are accumulated and used in state estimation as historical data; both are then used in prediction technology, where the accuracy of one depends heavily on the accuracy of the one preceding it, but not inversely [97,99,100].
The direct measurement method is arguably the simplest and most accurate and has the great advantage of having no hypothetical basis; however, its simplicity and accuracy are dependent on the type of measurement and the equipment available [101]. In the case of batteries, the RUL, EOL, or SOH cannot be directly measured [102]. This method, similar to the others, also requires some level of historical data so that the measurements taken can have a basis for comparison; however, this data does not need to be continuous or vast [62]. State estimation makes use of a model that is extrapolated to determine the current/expected value of a specific parameter. This method works well when the data is relatively linear; outliers or spikes in the data will cause the estimation accuracy to decrease [103]. This is where the final method, prediction technology, becomes useful, as it constantly updates the model, thus improving accuracy with more data [104]. To further elucidate the variances in these methods, Table 2 is used.
As shown in Table 2, the first ten SOC (%) entries, under the direct measurement method, are used as historical data for the state estimation and prediction methods. For state estimation, this data is used to generate a single linear function that will be used to estimate SOC (%) values from 11 to 20 s, whereas for the prediction method, this function will be used to predict the initial value (at 11 s) only, then compare the prediction to the direct measurement at that interval, and if there is a deviation, the function will be adjusted accordingly. For each consecutive prediction, this is shown through the various functions generated at each time interval. This allows the prediction methodology to better follow the real-time curve. Figure 4, below, provides a visual comparison of this explanation.
It is clear from Figure 4a that state estimation has a large variance between the actual SOC measurements and the estimated values, a variance that is significantly less than that of the prediction methodology. Figure 4b shows how the prediction methodology forms and adjusts its curve according to the various generated functions. This deviation is quantified in Table 3 below.
Table 3 corroborates the statement made regarding the curve matching in Figure 4, where the state estimation shows a large variation and error percentage that gets larger as the battery depletes further. It also shows that the prediction methodology has better curve matching, with the largest error of 5.04% (compared to 87.5% for state estimation) when the largest variance in the consecutive direct measurement’s SOC values was observed. These observations were expected, as explained in the literature preceding Table 2, where it is stated that state estimations work best when the parameters follow a linear pattern with minimal outliers. Outliers also affect the prediction methodology, however to a lesser extent, as it is constantly adjusting the prediction algorithm.

3. Applications of Capacity Measurements

The degradation of ESDs can be reduced, or even increased, using EMSs, BMSs, CCs, or even through hybrid combinations [3]. These methods have been developed to reduce degradation caused by user interference and behaviour; however, they have many different variations, each with its own specific applications, and if used incorrectly, these can lead to an increase in the rate of degradation. If these methods are used as intended, then they can lead to a reduction in the rate of deterioration of the ESD and possibly eliminate the continuation of some types of degradation [6,16,105]. These various methods will be discussed below, including the downfalls of each and how they can affect the degradation of ESDs.

3.1. Energy Management Techniques

The degradation of ESDs can be reduced using an EMS [6], which will mainly monitor the individual ESD’s operation and adjust its use to optimise its performance, whether it is used in combination with other ESDs or not [7]. The EMS is responsible for the coordination of the activities, i.e., mainly when to charge/discharge, how to charge/discharge, and which ESD to use when applicable [3]. The main objective of an EMS is to manage the split of power between the ESD(s) and load based on what is required as well as what is available in order to provide the optimal output [106]. It controls and monitors the energy flow of the entire system and is often combined with a BMS and/or CC for optimal control of the system [3].
The power allocation is generally divided using one of two methods—rule-based (RB) or optimisation-based (OB) [9]. Both make use of a set of states that define the ESD use charge/discharge or power-split and a set of rules to determine the state to use. During operation, measurements are taken of the load and ESD to determine the state according to the rules. The rules and states are predetermined according to prior knowledge of the ESD operation and through simulations that allow predictions of the operation to be made [9,10,11,12,13,14,15]. For an RB EMS, once this system is implemented, the rules and states do not change, this simplifies the construction and algorithms, and therefore this method is also referred to as a cost-optimisation EMS [107]. RB uses measurements of the operational requirements of the load to select the state of the ESD [108]. For an OB EMS, these rules and states are fine-tuned during operation [10,11,12] in order to use the ESD most optimally according to the load—thus this method is also referred to as the operational-optimisation EMS [13,14].
OB is similar to RB in that it also uses measurements of the operational requirements of the load to select the ESD state, except that it further adjusts the states dynamically to improve the use of the ESD according to what would be most optimal [108]. The predictions of this method can further be optimised through the use of either online or offline methods—online uses a database of information gathered from a global network developed through the operation of similar systems; offline uses data collected from the specific device in use [15].
The states for both methods are based on predictions of the operation of the ESD and the load [3]. Both methods use algorithms to make the predictions, algorithms that are based on data collected prior to use, through simulations or direct measurements. There are various algorithms that can be used to optimise each of these approaches, all with various advantageous outcomes [109,110,111,112,113,114,115,116], as is discussed in A. Townsend et al. [3]. It is then left to the EMS to make the proper decisions for optimised use of the ESD(s) per use and cumulatively.
Using Figure 5, RB- and OB-EMS approaches can be compared for better clarity. The values are only used for explanatory purposes, with both methods assuming either a one-second refresh rate or a half-second refresh rate. The load can assume any unit, as it is for comparison purposes. The red lines demarcate the interval in which the delays, for each method, occur.
From Figure 5, it is clear for both refresh rates that the methods experience some level of time delay as well as some deviation in the required load that is delivered. RB shows predominantly a time delay in the deliverance, but it does deliver the full load, whereas OB shows both a time delay and an overshoot of deliverance, specifically on the incline of the load. This is explained above in the operation principle of the two EMS methods—RB evaluates present measurements before choosing the current state, which thus causes a time delay; OB uses both present and previous measurements to pre-empt future requirements, which will avoid/decrease further deviations in both time and load supply. This pre-emptive approach causes an inaccurate assumption, shown as the OB load deviation overshoot in both cases, which is corrected when the EMS method re-evaluates and adjusts accordingly. If the base load was larger than zero units, an equivalent undershoot would be observed at approximately the 14-s mark.
Using Figure 5, Table 4 can be compiled to summarise the values and compare the outcomes in more detail. The load efficiency refers to the ratio of load supplied against the load requirement; a value above one shows excess and below one shows a shortage; closer to one is desired as this reduces losses from either side; the load difference column refers to excess or shortage of units; the total time delay refers to the accumulative delay in time experienced due to each method; and the time efficiency represents the effect of the time delay. Table 4 contains additional 2 s and 0.1 s interval rows with their accompanying information to improve the area of comparison.
In Table 4, the sample interval refers to the reaction speed of the various methods, and the load difference shows whether the load was overdelivered (positive value) or underdelivered (negative value). Load efficiency refers to how well the load required was delivered, a value of one is preferred here; over one shows overdeliverance, and below one shows underdeliverance.
Overdeliverance of the load represents a waste of power, as this will essentially be lost in the form of heat. Total time delay represents the accumulation of delay time for each method, and time efficiency is a representation of this time delay as a function of the total duration of each load.
Comparing the two EMS methods using Table 4, it is clear that the decreased sample interval improves the load efficiency of OB and the time efficiency of both. From Table 4, some advantages and disadvantages can be deduced. First off, RB shows better load efficiency than OB, but OB shows better time efficiency, and thus better curve/load mirroring will be experienced. RB does, however, require significantly less complex computations as well as less/no historical data—this reduces storage requirements, and, as the sample interval does not affect it, the clock speed of the controller is not limited. OB methods, on the other hand, show improvements in load and time efficiency with an increase in sample frequency; therefore, accuracy and optimisation are reliant on the data collected as well as sample frequency.
One downfall of these methods is that the algorithms and predictions are based on the ideal operation of the ESD within the ESD’s ideal parameters. Each ESD has its own unique parameters; sometimes these parameters are very similar, such that they will achieve optimal performance with the predetermined algorithms. However, many of the ESDs have parameters that are not similar enough for this to be the case. Therefore, using these ESDs according to the generic algorithm can lead to large variances in their operation.
Additionally, the energy management techniques discussed in A. Townsend et al. [3] all make use of a predetermined set switching point (the rules used to determine the power split), which does not vary throughout the use of the system. This switching point is made according to the original range of the source and the known requirements of the load. The range of the load changes through depletion as well as through the accumulative degradation of the source. The main issue here is that this degradation is not taken into account for the operating parameters of the EMS, which is due to the complexity of accurately determining the instantaneous capacity of the ESD as well as predicting the RUL of the ESD.
When ESDs operate differently than expected and control is not adjusted, there are two outcomes—the device experiences increased strain or the device is underutilised. The latter does not cause too much consternation as this will prolong the use of the ESD; however, it can cause increased costs due to overspecification. The former, however, has a lot more repercussions—the biggest of which is the increased rate of degradation.

3.2. Battery Management System

A BMS monitors and controls the internal operating parameters (temperature, internal resistance, and voltage) of a battery and uses these parameters to estimate the battery SOC and SOH [16]. It can be used to control the charger and thus the charge/discharge process, manage cell balancing for optimal battery usage, control safety to avoid overcharging, undercharging, or other factors that can lead to unsafe operation of the battery, report the battery state, manage the thermal properties, communicate with auxiliary or ancillary circuits, and transfer data to an external circuit [117]. This is achieved through the collection of information from the sensors connected to the battery/batteries [17]. It is a very important tool for the protection of the battery as well as the user [117]. The BMS has some parameters defined by the user, such as the maximum number of cycles and the upper and lower bounds of the SOC. Its algorithms then attempt to continuously improve battery efficiency through the use of optimal charging algorithms (aimed at reducing heat loss and SOH degradation) and more accurate SOC estimation algorithms (aimed at improving efficiency) [118].
The topology of a BMS generally has three variations: centralised, distributed, and modular [119]. Centralised uses a single controller connected to all the battery cells for direct control [120]. Distributed uses a controller on each cell, which are all connected to a master controller by the battery [17]. Modularity connects the cells in a specific arrangement such that a single controller can be used for each arrangement [17]. The three variations can be seen in Figure 6.
Understandably, centralised systems have complexity in the array of wires and connections, are least expandable, and are most economical [119]. Distributed is the most expensive as it utilises the largest number of controllers, has simple installation, and has a clean configuration of wires [17]. Modular BMSs offer a combination of the advantages and disadvantages of the other two [17,119,120]. The selection of the category of BMS depends on the application thereof, i.e., whether it is intended for mobile or stationary use, has space and weight constraints, or has some other safety or operational requirements due to the type of battery in use [61]. A BMS is not a necessity for battery operation or use, but it is necessary if optimal use of the battery, or battery pack, is desired [117].
BMSs experience a few challenges, including accurate SOC estimation, real-time SOH estimation, optimal charging, fast characterisation, battery reuse, universality, and self-evaluation [121,122,123,124,125,126,127,128,129,130,131,132,133,134,135,136,137]. These challenges have been summarised in Figure 7 below.
As mentioned, the BMS controls the battery pack using sensors and prior knowledge of the operational parameters of the specific battery at full health or as an ideal battery. If the bounds of the parameters used for the BMS are not sufficient or if the system malfunctions, causing a command not to occur, then the ESD will experience overcharging or discharging or experience these at increased rates, this has the very imminent and dangerous side-effect of thermal runaway [117]. BMSs are designed for full-health batteries that are characterised in laboratories prior to use, this makes them most effective for first-time use of the battery. Additionally, these laboratory experiments occur at a constant controlled temperature, whereas real-time use has gradual and fluctuating temperature changes that affect the parameters significantly and lead to highly inaccurate estimations [130]. When the ESD experiences increased operating temperatures (the ideal operating temperatures vary for each ESD and their different chemical make-ups, Shuai Ma et al. [138], provide some insight into those of LIBs); this can lead to mechanical and chemical breakdown of the internal structures of the ESD—this in turn either leads to irreversible thermal runaway or increased degradation and premature failure [117].
If a BMS is used in the correct application, it can increase the energy efficiency of the ESS by 15%, whilst increasing the lifetime of the ESD by 39%, [139].

3.3. Charge Controller

As mentioned above, a CC is used to regulate and control the energy flowing to and from the ESD (most commonly a battery). This will protect the ESD from being overcharged and overdischarged, both of which are detrimental to the health of the ESD, as well as control and optimise the charging stages accordingly [18]. Charge controllers provide benefits to the ESD in the form of overcharge, low-voltage, overdischarge, and overload protection [105].
There are two basic types of CCs when referring to the path of current flow for each of the charging phases: shunt and series [105]. The former utilises a shunt to redirect the charging current away from the ESD in the form of a short-circuit; this method leads to heat dissipation and consequently requires a heatsink to facilitate this. This is a very basic form of CC, where supply is simply on or off [18]. A series-type CC opens an electronic switch on the controller based on the charging stage of the ESD [140]. The series-type CC is more controlled and can be used in two different topologies: pulse width modulation (PWM) or maximum power point tracking (MPPT) [105]. PWM is the cheaper variation, consisting of a single electronic switch controlled by a PWM signal, which adjusts the input voltage (to the ESD) based on what the ESD requires. It is a constant voltage controller that reduces the supply voltage according to the ESD requirements. It is designed with a higher voltage than that required by the battery so that the battery can be fully recharged. This PWM control of the switch effectively reduces the average power delivered to the ESD, thus never using the full power of the load. MPPT makes use of multiple electronic switches in a DC-DC converter (buck, boost, or buck/boost) array that accept the maximum power capabilities of the source and supply those capabilities to the ESD within its voltage requirements [141]. Therefore, using MPPT, the maximum power capability of the load will always be utilised [141].
These types of CC can be utilised as single-stage or multistage controllers based on the requirements of the application [18,105]. As the ESDs have different states of charging that have different current requirements, it is preferable and more efficient to utilise a multistage CC; therefore, when the battery enters a new state of charging, the internal resistance will vary to adjust the current flow. This method allows for a slower adjustment of the energy and does not cause such a large energy dissipation effect, leading to fewer power losses in the form of decreased heat dissipation [141].
Charge controllers are designed for specific types of batteries, and their algorithms are based on specific parameters. They vary widely in complexity and, thus, also in the specific parameters used in their algorithms [142]. Most charge controllers charge the ESD based on the three basic phases of charging—bulk, absorption, and float. More advanced controllers allow customization of these ranges according to the chemistry of the battery, which can be adjusted by the user or through communication with the onboard circuitry of the battery itself [105]. If the charging parameters are incorrect for the battery used, then the battery undergoes a great risk of overcharging or charging at an incorrect (too fast) rate [105]. PWM charge controllers disconnect the controller once the ESD voltage has reached the target voltage and only reconnect once the voltage drops below a certain threshold—this runs the risk of severely undercharging the battery. If any of the components of the charge controllers malfunction, particularly the sensors, then the controller will enter the incorrect stage at the incorrect time, thus reducing the efficiency of the system and leading to possible overcharging and increased charge rates [142]. A CC uses instantaneous measurements to determine the phase of charging as well as the optimal method of discharging. This requires instantaneous measurements of capacity and an accurate prediction of the charge/discharge pattern of the ESD.

3.4. Hybrid Energy Storage System

HESSs present a different approach to reducing the degradation of ESDs in the form of a multiple-ESD combination that is able to distribute the stress between the sources [20]. To achieve the best, or optimal, benefits from such combinations, three topologies can be used: passive, semiactive, and fully active [143]. The various advantages and disadvantages of each are summarised in Table 5 below.
HESSs combine multiple ESDs in a configuration that is beneficial to the degradation of each, individually. For this combination, it is necessary to split the power optimally between these ESDs, which requires instantaneous measurements of the capacities and accurate predictions of the RUL/SOH of each [144].
HESSs have complicated control processes to control the interaction and coordination of the various energy sources and their accompanying parameters/requirements. If these parameters are not set up correctly, the system will operate inefficiently and possibly outside of the desired/intended range; this can lead to overutilisation of one ESD and underutilisation of the other ESD [3]. This imbalance can render the entire combination useless, as the benefits will not be obtained sufficiently in order to justify the feasibility of the combination.
Table 5. Comparison of advantages and disadvantages of different hybrid topologies, adapted from [145,146,147,148,149,150,151,152,153,154,155,156].
AdvantagesDisadvantages
PassiveSimplest formPoor overall performance
Direct connections between ESDsUncontrollable power sharing
Single converterESDs are coupled
LightweightExhibits highly volatile drive cycles
CheapNo control over power/energy split
Reduction in individual ESD stressesHigh dynamic current draw leads to increased ESD degradation
Improves peak deliverance capability, efficiency, and cycle life of individual ESDOver-and under-utilisation leads to increased degradation and reduced use
Peak-shaving capabilityPoor response to high power demands
Semi-activeIncreased controllabilityTwo converters
Extended ESD usable lifeIncreased costs
More practical power/energy splitIncreased weight
Further advantages are dependent on the placement of the 2nd converter Decreased efficiency due to increased operational losses
ActiveOptimal ESD use Converter on each ESD
Reduced ESD degradationIncreased costs
Practical flexibility and controllability of energy/power flowDecreased efficiency due to increased operational losses
Increased complexity
To compare the various applications, Figure 8 has been created, showing the main differences between them and the use of capacity measurements within each method.

4. Conclusions

The main purpose of this paper is to highlight the downfalls of the manner in which capacity measurements of ESDs are used. In order to achieve this, capacity measurement techniques would first need to be researched. For this portion of the paper, the various experimental-based and model-based methods were defined and compared according to their advantages and disadvantages, which revealed that these methods can be further sorted based on the measurements made, their use, and the conclusions drawn. These groupings are direct measurements, state estimation, and prediction technology. Direct measurements tend to be the most accurate; however, it is seldom possible to directly measure the capacity, in which case it requires specialised equipment and environments. State estimation is more complex than direct measurements, requires comprehensive historical data for better accuracy, and has a delay in the acquisition of the desired variable. Prediction technology is the most complex method of the three and requires significant storage and computational complexity to achieve satisfactory results.
State estimation and prediction technology were compared to direct measurements to show the error in the variable obtained. It was seen that the error in state estimation increases, whilst the error in prediction technology decreases the longer the device is used. This is due to prediction technology continuously updating the initial function used to obtain the variable. This indicates that direct measurements are preferred when possible; otherwise, prediction technology will yield better results than state estimation if the computational capacity allows for it.
The next step in the research was to identify the applications in which these measurements are used—EMTs, BMSs, CCs, and HESSs. EMTs focused on RB and OB methods for the energy allocation split. These two methods were compared based on how they were able to mirror a power curve and the delay experienced for this delivery, using different sample intervals (2 s, 1 s, 0.5 s, and 0.1 s). The results for RB and OB for the various sample intervals are as follows: 2 s—100% delivery with 4 s delay for both; 1 s—RB: 100% delivery with 3 s delay, OB: 120% delivery with 2 s delay; 0.5 s—RB: 100% delivery with 2.5 s delay, OB: 103% delivery with 1 s delay; 0.1 s—RB: 100% delivery with 2.1 s delay, OB: 100.3% delivery with 0.2 s delay. These results show that overall, OB EMTs supply the load better than RB EMTs, but both have an increase in efficiency with smaller sampling intervals. However, OB EMTs require more complex computations and historical data than RB EMTs. Both methods are dependent on the clock speed of the controller used for implementation.
For the BMSs, three main variations (centralised, distributed, and modular) were graphically compared, showing that centralised is more complex in terms of connections but is more economical than distributed, whereas modular combines the best and worst of the two. BMSs are found to offer an energy efficiency increase of 15% and a lifetime increase of 39%. The main challenges of BMSs were categorised according to SOC estimation, SOH estimation, optimal charging, fast characterisation, battery reuse options, universality, and self-evaluation.
Under CCs, the two types, shunt and series, are discussed; for the latter, further discussion of its two topologies, PWM and MPPT, is provided. PWM is seen as cheaper, less complex, and less accurate as compared to MPPT. Three topologies of HESSs are provided in the research—passive, semiactive, and active. A passive topology (with a single controller) has the advantages of simplicity and lower cost, but it has poor overall performance and an uncontrollable power split. Semiactive topology (with two controllers) has increased controllability and a better power split; however, this comes with an increase in cost and a decrease in efficiency. Active topology (with multiple controllers) optimises the power split and ESD use; however, this increases the costs and decreases the efficiency of every additional controller.
The final step in achieving the purpose of this paper was to research how capacity measurements are used in each of these applications. EMTs/EMSs make use of a predetermined set of switching points (states and rules) based on the rated capacity of the system, which does not vary throughout use. They use measurements (voltage and current) to implement and improve these states and rules. BMSs are generally programmed according to the generic full-health parameters (capacity) of that ESD and use temperature, internal resistance (IR), and voltage measurements to estimate the SOC and SOH (capacity) of that ESD. These estimations are used to implement the charge phases, cell balancing, or safety against overcharging and overdischarging parameters. CCs use IR, voltage, and current measurements (capacity indicators) to select the optimal charging phase, to protect against overcharging or overdischarging, and to optimise the charge phases. For optimal performance of the CC, instantaneous capacity measurements as well as an accurate charge/discharge pattern prediction are required. HESSs use current and voltage measurements (capacity indicators) for the operation of the DC-DC converter(s).
Each of the methods requires a capacity prediction, and the accuracy of these predictions largely affects the outcome of the method. Inaccurate predictions are related to real-time measurement difficulties/inaccuracies due to time constraints, equipment requirements, temperature and noise sensitivities, and insufficient historical data due to a lack of storage space or computational speed. These inaccuracies lead to a misrepresentation of the capacity of the ESD, which essentially means that all the measurements are estimations, creating large concerns regarding imminent overcharging and overdischarging, inaccurate cell balancing, and less-than-optimal phases of charging of the ESD. This is a vast range of difficulties, which are imperative to keep in mind with the applications. As stated above, inaccuracies lead to a range of complications in the ESD and its degradation.
In light of these limitations, it would be beneficial to find a way to avoid these inaccuracies, either through improved capacity measurement techniques or through better use of the presently used estimation results, to avoid premature failure or retirement of the ESD. As this paper excluded in-depth research pertaining to improving ESD capacity, it is recommended that this be a starting point for research in avoiding or reducing the inaccuracies of capacity estimation and use.

Author Contributions

Conceptualization and writing, original draft preparation, editing, A.T.; Conceptualization, review, editing, supervision, R.G. All authors have read and agreed to the published version of the manuscript.

Funding

This research received no external funding.

Data Availability Statement

Not applicable.

Conflicts of Interest

The authors declare no conflict of interest.

References

  1. Kalyani, N.T.; Dhoble, S.J. Energy materials: Applications and propelling opportunities. In Energy Materials; Elsevier: Amsterdam, The Netherlands, 2021; pp. 567–580. [Google Scholar] [CrossRef]
  2. Wolf, E. Large-Scale Hydrogen Energy Storage. In Electrochemical Energy Storage for Renewable Sources and Grid Balancing; Elsevier: Amsterdam, The Netherlands, 2015; pp. 129–142. [Google Scholar] [CrossRef]
  3. Townsend, A.; Gouws, R. A Comparative Review of Lead-Acid, Lithium-Ion and Ultra-Capacitor Technologies and Their Degradation Mechanisms. Energies 2022, 15, 4930. [Google Scholar] [CrossRef]
  4. Qadrdan, M.; Jenkins, N.; Wu, J. Smart Grid and Energy Storage. In McEvoy’s Handbook of Photovoltaics; Elsevier: Amsterdam, The Netherlands, 2018; pp. 915–928. [Google Scholar] [CrossRef]
  5. Divakaran, A.M.; Hamilton, D.; Manjunatha, K.N.; Minakshi, M. Design, Development and Thermal Analysis of Reusable Li-Ion Battery Module for Future Mobile and Stationary Applications. Energies 2020, 13, 1477. [Google Scholar] [CrossRef]
  6. Thien, T.; Axelsen, H.; Merten, M.; Sauer, D.U. Energy management of stationary hybrid battery energy storage systems using the example of a real-world 5 MW hybrid battery storage project in Germany. J. Energy Storag. 2022, 51, 104257. [Google Scholar] [CrossRef]
  7. Segatto, M.E.V.; de Oliveira Rocha, H.R.; Silva, J.A.L.; Paiva, M.H.M.; do Rosário Santos Cruz, M.A. Telecommunication Technologies for Smart Grids: Total Cost Optimization. In Advances in Renewable Energies and Power Technologies; Elsevier: Amsterdam, The Netherlands, 2018; pp. 451–478. [Google Scholar] [CrossRef]
  8. Townsend, A.; Martinson, C.; Gouws, R.; Bessarabov, D. Effect of supercapacitors on the operation of an air-cooled hydrogen fuel cell. Heliyon 2021, 7, e06569. [Google Scholar] [CrossRef]
  9. Wang, B.; Xu, J.; Cao, B.; Ning, B. Adaptive mode switch strategy based on simulated annealing optimization of a multi-mode hybrid energy storage system for electric vehicles. Appl. Energy 2017, 194, 596–608. [Google Scholar] [CrossRef]
  10. Song, Z.; Hofmann, H.; Li, J.; Han, X.; Ouyang, M. Optimization for a hybrid energy storage system in electric vehicles using dynamic programing approach. Appl. Energy 2015, 139, 151–162. [Google Scholar] [CrossRef]
  11. Ramoul, J.; Chemali, E.; Dorn-Gomba, L.; Emadi, A. A Neural Network Energy Management Controller Applied to a Hybrid Energy Storage System using Multi-Source Inverter. In Proceedings of the 2018 IEEE Energy Conversion Congress and Exposition (ECCE), Portland, OR, USA, 23–27 September 2018; IEEE: Piscataway, NJ, USA, 2018; pp. 2741–2747. [Google Scholar] [CrossRef]
  12. Xiong, R.; Cao, J.; Yu, Q. Reinforcement learning-based real-time power management for hybrid energy storage system in the plug-in hybrid electric vehicle. Appl. Energy 2018, 211, 538–548. [Google Scholar] [CrossRef]
  13. Hannan, M.A.; Hoque, M.M.; Mohamed, A.; Ayob, A. Review of energy storage systems for electric vehicle applications: Issues and challenges. Renew. Sustain. Energy Rev. 2017, 69, 771–789. [Google Scholar] [CrossRef]
  14. Ren, G.; Ma, G.; Cong, N. Review of electrical energy storage system for vehicular applications. Renew. Sustain. Energy Rev. 2015, 41, 225–236. [Google Scholar] [CrossRef]
  15. Salmasi, F.R. Control Strategies for Hybrid Electric Vehicles: Evolution, Classification, Comparison, and Future Trends. IEEE Trans. Veh. Technol. 2007, 56, 2393–2404. [Google Scholar] [CrossRef]
  16. Vezzini, A. Lithium-Ion Battery Management. In Lithium-Ion Batteries; Elsevier: Amsterdam, The Netherlands, 2014; pp. 345–360. [Google Scholar] [CrossRef]
  17. Arora, S.; Abkenar, A.T.; Jayasinghe, S.G.; Tammi, K. Battery Management System: Charge Balancing and Temperature Control. In Heavy-Duty Electric Vehicles; Elsevier: Amsterdam, The Netherlands, 2021; pp. 173–203. [Google Scholar] [CrossRef]
  18. Asdrubali, F.; Desideri, U. High Efficiency Plants and Building Integrated Renewable Energy Systems. In Handbook of Energy Efficiency in Buildings; Butterworth-Heinemann; Elsevier: Oxford, UK, 2019; pp. 441–595. [Google Scholar] [CrossRef]
  19. Atawi, I.E.; Al-Shetwi, A.Q.; Magableh, A.M.; Albalawi, O.H. Recent Advances in Hybrid Energy Storage System Integrated Renewable Power Generation: Configuration, Control, Applications, and Future Directions. Batteries 2022, 9, 29. [Google Scholar] [CrossRef]
  20. Konstantinou, G.; Hredzak, B. Power electronics for hybrid energy systems. In Hybrid Renewable Energy Systems and Microgrids; Elsevier: Amsterdam, The Netherlands, 2021; pp. 215–234. [Google Scholar] [CrossRef]
  21. Aktaş, A.; Kirçiçek, Y. Solar Hybrid Systems and Energy Storage Systems. In Solar Hybrid Systems; Elsevier: Amsterdam, The Netherlands, 2021; pp. 87–125. [Google Scholar] [CrossRef]
  22. Coombs, T.A. High-temperature superconducting magnetic energy storage (SMES) for power grid applications. In Superconductors in the Power Grid; Elsevier: Amsterdam, The Netherlands, 2015; pp. 345–365. [Google Scholar] [CrossRef]
  23. Kularatna, N.; Gunawardane, K. Capacitors as energy storage devices: Simple basics to current commercial families. In Energy Storage Devices for Renewable Energy-Based Systems; Elsevier: Amsterdam, The Netherlands, 2021; pp. 181–197. [Google Scholar] [CrossRef]
  24. Misra, S.S. Secondary batteries–lead– acid systems|Charging. In Encyclopedia of Electrochemical Power Sources; Elsevier: Amsterdam, The Netherlands, 2009; pp. 764–778. [Google Scholar] [CrossRef]
  25. Redondo-Iglesias, E.; Venet, P.; Pelissier, S. Global Model for Self-Discharge and Capacity Fade in Lithium-Ion Batteries Based on the Generalized Eyring Relationship. IEEE Trans. Veh. Technol. 2018, 67, 104–113. [Google Scholar] [CrossRef]
  26. Pollet, B.G.; Staffell, I.; Shang, J.L.; Molkov, V. Fuel-cell (hydrogen) electric hybrid vehicles. In Alternative Fuels and Advanced Vehicle Technologies for Improved Environmental Performance; Elsevier: Amsterdam, The Netherlands, 2014; pp. 685–735. [Google Scholar] [CrossRef]
  27. Seong, W.M.; Park, K.-Y.; Lee, M.H.; Moon, S.; Oh, K.; Park, H.; Lee, S.; Kang, K. Abnormal self-discharge in lithium-ion batteries. Energy Environ. Sci. 2018, 11, 970–978. [Google Scholar] [CrossRef]
  28. Lawder, M.T.; Northrop, P.W.C.; Subramanian, V.R. Model-Based SEI Layer Growth and Capacity Fade Analysis for EV and PHEV Batteries and Drive Cycles. J. Electrochem. Soc. 2014, 161, A2099–A2108. [Google Scholar] [CrossRef]
  29. Yang, Z.; Patil, D.; Fahimi, B. Online Estimation of Capacity Fade and Power Fade of Lithium-Ion Batteries Based on Input–Output Response Technique. IEEE Trans. Transp. Electrif. 2018, 4, 147–156. [Google Scholar] [CrossRef]
  30. Marinescu, M.; O’Neill, L.; Zhang, T.; Walus, S.; Wilson, T.E.; Offer, G.J. Irreversible vs Reversible Capacity Fade of Lithium-Sulfur Batteries during Cycling: The Effects of Precipitation and Shuttle. J. Electrochem. Soc. 2018, 165, A6107–A6118. [Google Scholar] [CrossRef]
  31. Lu, L.; Han, X.; Li, J.; Hua, J.; Ouyang, M. A review on the key issues for lithium-ion battery management in electric vehicles. J. Power Sources 2013, 226, 272–288. [Google Scholar] [CrossRef]
  32. Cabrera-Castillo, E.; Niedermeier, F.; Jossen, A. Calculation of the state of safety (SOS) for lithium ion batteries. J. Power Sources 2016, 324, 509–520. [Google Scholar] [CrossRef]
  33. Casimir, A.; Zhang, H.; Ogoke, O.; Amine, J.C.; Lu, J.; Wu, G. Silicon-based anodes for lithium-ion batteries: Effectiveness of materials synthesis and electrode preparation. Nano Energy 2016, 27, 359–376. [Google Scholar] [CrossRef]
  34. Liu, X.; Wu, J.; Zhang, C.; Chen, Z. A method for state of energy estimation of lithium-ion batteries at dynamic currents and temperatures. J. Power Sources 2014, 270, 151–157. [Google Scholar] [CrossRef]
  35. Mamadou, K.; Delaille, A.; Lemaire-Potteau, E.; Bultel, Y. The State-of-Energy: A New Criterion for the Energetic Performances Evaluation of Electrochemical Storage Devices. ECS Trans. 2010, 25, 105–112. [Google Scholar] [CrossRef]
  36. Moo, C.S.; Ng, K.S.; Chen, Y.P.; Hsieh, Y.C. State-of-Charge Estimation with Open-Circuit-Voltage for Lead-Acid Batteries. In Proceedings of the 2007 Power Conversion Conference-Nagoya, Nagoya, Japan, 2–5 April 2007; IEEE: Piscataway, NJ, USA, 2007; pp. 758–762. [Google Scholar] [CrossRef]
  37. Kong, X.; Bonakdarpour, A.; Wetton, B.T.; Wilkinson, D.P.; Gopaluni, B. State of Health Estimation for Lithium-Ion Batteries. IFAC-PapersOnLine 2018, 51, 667–671. [Google Scholar] [CrossRef]
  38. Wu, G.; Lu, R.; Zhu, C.; Chan, C.C. State of charge Estimation for NiMH Battery based on electromotive force method. In Proceedings of the 2008 IEEE Vehicle Power and Propulsion Conference, Harbin, China, 3–5 September 2008; IEEE: Piscataway, NJ, USA, 2008; pp. 1–5. [Google Scholar] [CrossRef]
  39. He, W.; Williard, N.; Chen, C.; Pecht, M. State of charge estimation for Li-ion batteries using neural network modeling and unscented Kalman filter-based error cancellation. Int. J. Electr. Power Energy Syst. 2014, 62, 783–791. [Google Scholar] [CrossRef]
  40. Dong, G.; Zhang, X.; Zhang, C.; Chen, Z. A method for state of energy estimation of lithium-ion batteries based on neural network model. Energy 2015, 90, 879–888. [Google Scholar] [CrossRef]
  41. Plett, G.L. Extended Kalman filtering for battery management systems of LiPB-based HEV battery packs. J. Power Sources 2004, 134, 252–261. [Google Scholar] [CrossRef]
  42. Dai, H.; Wei, X.; Sun, Z.; Wang, J.; Gu, W. Online cell SOC estimation of Li-ion battery packs using a dual time-scale Kalman filtering for EV applications. Appl. Energy 2012, 95, 227–237. [Google Scholar] [CrossRef]
  43. Chen, Z.; Fu, Y.; Mi, C.C. State of Charge Estimation of Lithium-Ion Batteries in Electric Drive Vehicles Using Extended Kalman Filtering. IEEE Trans. Veh. Technol. 2013, 62, 1020–1030. [Google Scholar] [CrossRef]
  44. Li, J.; Klee Barillas, J.; Guenther, C.; Danzer, M.A. A comparative study of state of charge estimation algorithms for LiFePO4 batteries used in electric vehicles. J. Power Sources 2013, 230, 244–250. [Google Scholar] [CrossRef]
  45. Campestrini, C.; Heil, T.; Kosch, S.; Jossen, A. A comparative study and review of different Kalman filters by applying an enhanced validation method. J. Energy Storag. 2016, 8, 142–159. [Google Scholar] [CrossRef]
  46. Abdi, H.; Mohammadi-ivatloo, B.; Javadi, S.; Khodaei, A.R.; Dehnavi, E. Energy Storage Systems. In Distributed Generation Systems; Elsevier: Amsterdam, The Netherlands, 2017; pp. 333–368. [Google Scholar] [CrossRef]
  47. Wang, D.; Yang, F.; Zhao, Y.; Tsui, K.-L. Battery remaining useful life prediction at different discharge rates. Microelectron. Reliab. 2017, 78, 212–219. [Google Scholar] [CrossRef]
  48. Aitio, A.; Howey, D.A. Predicting battery end of life from solar off-grid system field data using machine learning. Joule 2021, 5, 3204–3220. [Google Scholar] [CrossRef]
  49. Plett, G.L. High-Performance Battery-Pack Power Estimation Using a Dynamic Cell Model. IEEE Trans. Veh. Technol. 2004, 53, 1586–1593. [Google Scholar] [CrossRef]
  50. Shen, P.; Ouyang, M.; Lu, L.; Li, J.; Feng, X. The Co-estimation of State of Charge, State of Health, and State of Function for Lithium-Ion Batteries in Electric Vehicles. IEEE Trans. Veh. Technol. 2018, 67, 92–103. [Google Scholar] [CrossRef]
  51. Wang, R.; Feng, H. Lithium-ion batteries remaining useful life prediction using Wiener process and unscented particle filter. J. Power Electron. 2020, 20, 270–278. [Google Scholar] [CrossRef]
  52. Zhang, L.; Mu, Z.; Sun, C. Remaining Useful Life Prediction for Lithium-Ion Batteries Based on Exponential Model and Particle Filter. IEEE Access 2018, 6, 17729–17740. [Google Scholar] [CrossRef]
  53. Ungurean, L.; Cârstoiu, G.; Micea, M.V.; Groza, V. Battery state of health estimation: A structured review of models, methods and commercial devices. Int. J. Energy Res. 2017, 41, 151–181. [Google Scholar] [CrossRef]
  54. Dong, G.; Chen, Z.; Wei, J.; Ling, Q. Battery Health Prognosis Using Brownian Motion Modeling and Particle Filtering. IEEE Trans. Ind. Electron. 2018, 65, 8646–8655. [Google Scholar] [CrossRef]
  55. Baumhöfer, T.; Brühl, M.; Rothgang, S.; Sauer, D.U. Production caused variation in capacity aging trend and correlation to initial cell performance. J. Power Sources 2014, 247, 332–338. [Google Scholar] [CrossRef]
  56. Daniel-Ivad, J. Secondary batteries–zinc systems|Zinc–Manganese. In Encyclopedia of Electrochemical Power Sources; Elsevier: Amsterdam, The Netherlands, 2009; pp. 497–512. [Google Scholar] [CrossRef]
  57. Yao, L.; Xu, S.; Tang, A.; Zhou, F.; Hou, J.; Xiao, Y.; Fu, Z. A review of lithium-ion battery state of health estimation and prediction methods. World Electr. Veh. J. 2021, 12, 113. [Google Scholar] [CrossRef]
  58. Viswanathan, V.V.; Kintner-Meyer, M.C. Repurposing of batteries from electric vehicles. In Advances in Battery Technologies for Electric Vehicles; Elsevier: Amsterdam, The Netherlands, 2015; Volume 15, pp. 389–415. [Google Scholar] [CrossRef]
  59. Vetter, M.; Lux, S.; Wüllner, J. The Use of Batteries in Storing Electricity. In Future Energy; Elsevier: Amsterdam, The Netherlands, 2020; pp. 247–261. [Google Scholar] [CrossRef]
  60. Shi, E.; Xia, F.; Peng, D.; Li, L.; Wang, X.; Yu, B. State-of-health estimation for lithium battery in electric vehicles based on improved unscented particle filter. J. Renew. Sustain. Energy 2019, 11, 024101. [Google Scholar] [CrossRef]
  61. Kirchev, A. Battery Management and Battery Diagnostics. In Electrochemical Energy Storage for Renewable Sources and Grid Balancing; Elsevier: Amsterdam, The Netherlands, 2015; pp. 411–435. [Google Scholar] [CrossRef]
  62. Gou, B.; Xu, Y.; Feng, X. State-of-Health Estimation and Remaining-Useful-Life Prediction for Lithium-Ion Battery Using a Hybrid Data-Driven Method. IEEE Trans. Veh. Technol. 2020, 69, 10854–10867. [Google Scholar] [CrossRef]
  63. Chelidze, D.; Cusumano, J.P. A Dynamical Systems Approach to Failure Prognosis. J. Vib. Acoust. 2004, 126, 2–8. [Google Scholar] [CrossRef]
  64. Luo, J.; Pattipati, K.R.; Liu, Q.; Chigusa, S. Model-Based Prognostic Techniques Applied to a Suspension System. IEEE Trans. Syst. Man Cybern.-Part A Syst. Hum. 2008, 38, 1156–1168. [Google Scholar] [CrossRef]
  65. Xiong, R.; Li, L.; Tian, J. Towards a smarter battery management system: A critical review on battery state of health monitoring methods. J. Power Sources 2018, 405, 18–29. [Google Scholar] [CrossRef]
  66. Chen, L.; Lü, Z.; Lin, W.; Li, J.; Pan, H. A new state-of-health estimation method for lithium-ion batteries through the intrinsic relationship between ohmic internal resistance and capacity. Measurement 2018, 116, 586–595. [Google Scholar] [CrossRef]
  67. Pradhan, S.K.; Chakraborty, B. Battery management strategies: An essential review for battery state of health monitoring techniques. J. Energy Storag. 2022, 51, 104427. [Google Scholar] [CrossRef]
  68. Hu, X.; Jiang, J.; Cao, D.; Egardt, B. Battery Health Prognosis for Electric Vehicles Using Sample Entropy and Sparse Bayesian Predictive Modeling. IEEE Trans. Ind. Electron. 2015, 63, 2645–2656. [Google Scholar] [CrossRef]
  69. Dong, M.; He, D. A segmental hidden semi-Markov model (HSMM)-based diagnostics and prognostics framework and methodology. Mech. Syst. Signal Process. 2007, 21, 2248–2266. [Google Scholar] [CrossRef]
  70. Heng, A.; Tan, A.C.C.; Mathew, J.; Montgomery, N.; Banjevic, D.; Jardine, A.K.S. Intelligent condition-based prediction of machinery reliability. Mech. Syst. Signal Process. 2009, 23, 1600–1614. [Google Scholar] [CrossRef]
  71. Ng, K.S.; Moo, C.-S.; Chen, Y.-P.; Hsieh, Y.-C. Enhanced coulomb counting method for estimating state-of-charge and state-of-health of lithium-ion batteries. Appl. Energy 2009, 86, 1506–1511. [Google Scholar] [CrossRef]
  72. Berecibar, M.; Gandiaga, I.; Villarreal, I.; Omar, N.; Van Mierlo, J.; Van Den Bossche, P. Critical review of state of health estimation methods of Li-ion batteries for real applications. Renew. Sustain. Energy Rev. 2016, 56, 572–587. [Google Scholar] [CrossRef]
  73. Wang, D.; Yang, F.; Gan, L.; Li, Y. Fuzzy Prediction of Power Lithium Ion Battery State of Function Based on the Fuzzy c-Means Clustering Algorithm. World Electr. Veh. J. 2019, 10, 1. [Google Scholar] [CrossRef]
  74. Tobon-Mejia, D.A.; Medjaher, K.; Zerhouni, N. CNC machine tool’s wear diagnostic and prognostic by using dynamic Bayesian networks. Mech. Syst. Signal Process. 2012, 28, 167–182. [Google Scholar] [CrossRef]
  75. Diab, Y.; Venet, P.; Gualous, H.; Rojat, G. Self-Discharge Characterization and Modeling of Electrochemical Capacitor Used for Power Electronics Applications. IEEE Trans. Power Electron. 2009, 24, 510–517. [Google Scholar] [CrossRef]
  76. Li, Y.; Tremblay, P.-L.; Zhang, T. Anode Catalysts and Biocatalysts for Microbial Fuel Cells. In Progress and Recent Trends in Microbial Fuel Cells; Elsevier: Amsterdam, The Netherlands, 2018; pp. 143–165. [Google Scholar] [CrossRef]
  77. Maher, K.; Yazami, R. A study of lithium ion batteries cycle aging by thermodynamics techniques. J. Power Sources 2014, 247, 527–533. [Google Scholar] [CrossRef]
  78. Markervich, E.; Salitra, G.; Levi, M.D.; Aurbach, D. Capacity fading of lithiated graphite electrodes studied by a combination of electroanalytical methods, Raman spectroscopy and SEM. J. Power Sources 2005, 146, 146–150. [Google Scholar] [CrossRef]
  79. Beyssac, O.; Goffé, B.; Petitet, J.-P.; Froigneux, E.; Moreau, M.; Rouzaud, J.-N. On the characterization of disordered and heterogeneous carbonaceous materials by Raman spectroscopy. Spectrochim. Acta Part A Mol. Biomol. Spectrosc. 2003, 59, 2267–2276. [Google Scholar] [CrossRef]
  80. Hardwick, L.; Buqa, H.; Novak, P. Graphite surface disorder detection using in situ Raman microscopy. Solid State Ion. 2006, 177, 2801–2806. [Google Scholar] [CrossRef]
  81. Midgley, P.A.; Weyland, M. 3D electron microscopy in the physical sciences: The development of Z-contrast and EFTEM tomography. Ultramicroscopy 2003, 96, 413–431. [Google Scholar] [CrossRef]
  82. Fadley, C.S. X-ray photoelectron spectroscopy: Progress and perspectives. J. Electron Spectros. Relat. Phenom. 2010, 178–179, 2–32. [Google Scholar] [CrossRef]
  83. Morigaki, K.; Ohta, A. Analysis of the surface of lithium in organic electrolyte by atomic force microscopy, Fourier transform infrared spectroscopy and scanning auger electron microscopy. J. Power Sources 1998, 76, 159–166. [Google Scholar] [CrossRef]
  84. Ouyang, M.; Chu, Z.; Lu, L.; Li, J.; Han, X.; Feng, X.; Liu, G. Low temperature aging mechanism identification and lithium deposition in a large format lithium iron phosphate battery for different charge profiles. J. Power Sources 2015, 286, 309–320. [Google Scholar] [CrossRef]
  85. Li, J.; Zhang, J.; Zhang, X.; Yang, C.; Xu, N.; Xia, B. Study of the storage performance of a Li-ion cell at elevated temperature. Electrochim. Acta 2010, 55, 927–934. [Google Scholar] [CrossRef]
  86. Wognsen, E.R.; Haverkort, B.R.; Jongerden, M.; Hansen, R.R.; Larsen, K.G. A Score Function for Optimizing the Cycle-Life of Battery-Powered Embedded Systems. In Formal Modeling and Analysis of Timed Systems, Proceedings of the 13th International Conference, FORMATS 2015, Madrid, Spain, 2–4 September 2015; Springer International Publishing: Berlin/Heidelberg, Germany, 2015; pp. 305–320. [Google Scholar]
  87. D’Orazio, T.; Leo, M.; Distante, A.; Guaragnella, C.; Pianese, V.; Cavaccini, G. Automatic ultrasonic inspection for internal defect detection in composite materials. NDT E Int. 2008, 41, 145–154. [Google Scholar] [CrossRef]
  88. Barker, J.; Saidi, M.Y.; Koksbang, R. Differential capacity as a spectroscopic probe for the investigation of alkali metal insertion reactions. Electrochim. Acta 1996, 41, 2639–2646. [Google Scholar] [CrossRef]
  89. Sommer, B.; Bender, C.; Hoppe, T.; Gamroth, C.; Jelonek, L. Stereoscopic cell visualization: From mesoscopic to molecular scale. J. Electron. Imaging 2014, 23, 011007. [Google Scholar] [CrossRef]
  90. Yang, R.; Xiong, R.; He, H.; Mu, H.; Wang, C. A novel method on estimating the degradation and state of charge of lithium-ion batteries used for electrical vehicles. Appl. Energy 2017, 207, 336–345. [Google Scholar] [CrossRef]
  91. Omar, N.; Abdel, M.; Firouz, Y.; Salminen, J.; Smekens, J.; Hegazy, O.; Gaulous, H.; Mulder, G.; Van Den Bossche, P.; Coosemans, T. Lithium iron phosphate based battery–Assessment of the aging parameters and development of cycle life model. Appl. Energy 2014, 113, 1575–1585. [Google Scholar] [CrossRef]
  92. Kumar, Y.; Dewal, M.L.; Anand, R.S. Epileptic seizures detection in EEG using DWT-based ApEn and artificial neural network. Signal, Image Video Process. 2014, 8, 1323–1334. [Google Scholar] [CrossRef]
  93. Birla, S.; Kohli, K.; Dutta, A. Machine Learning on imbalanced data in Credit Risk. In Proceedings of the 2016 IEEE 7th Annual Information Technology, Electronics and Mobile Communication Conference (IEMCON), Vancouver, BC, Canada, 13–16 October 2016; IEEE: Piscataway, NJ, USA, 2016; pp. 1–6. [Google Scholar] [CrossRef]
  94. Doyle, M.; Fuller, T.F.; Newman, J. Modeling of Galvanostatic Charge and Discharge of the Lithium/Polymer/Insertion Cell. J. Electrochem. Soc. 1993, 140, 1526–1533. [Google Scholar] [CrossRef]
  95. Dubarry, M.; Truchot, C.; Liaw, B.Y. Synthesize battery degradation modes via a diagnostic and prognostic model. J. Power Sources 2012, 219, 204–216. [Google Scholar] [CrossRef]
  96. Tian, J.; Xiong, R.; Yu, Q. Fractional-Order Model-Based Incremental Capacity Analysis for Degradation State Recognition of Lithium-Ion Batteries. IEEE Trans. Ind. Electron. 2019, 66, 1576–1584. [Google Scholar] [CrossRef]
  97. Xing, Y.; Williard, N.; Tsui, K.-L.; Pecht, M. A comparative review of prognostics-based reliability methods for Lithium batteries. In Proceedings of the 2011 Prognostics and System Health Management Conference, Shenzhen, China, 24–25 May 2011; IEEE: Piscataway, NJ, USA, 2011; pp. 1–6. [Google Scholar] [CrossRef]
  98. Koch, R.; Kuhn, R.; Zilberman, I.; Jossen, A. Electrochemical impedance spectroscopy for online battery monitoring-power electronics control. In Proceedings of the 2014 16th European Conference on Power Electronics and Applications, Lappeenranta, Finland, 26–28 August 2014; IEEE: Piscataway, NJ, USA, 2014; pp. 1–10. [Google Scholar] [CrossRef]
  99. Saha, B.; Poll, S.; Goebel, K.; Christophersen, J. An integrated approach to battery health monitoring using bayesian regression and state estimation. In Proceedings of the 2007 IEEE Autotestcon, Baltimore, MD, USA, 17–20 September 2007; IEEE: Piscataway, NJ, USA, 2007; pp. 646–653. [Google Scholar] [CrossRef]
  100. Gholami, B.; Haddad, W.M.; Tannenbaum, A.R. Relevance Vector Machine Learning for Neonate Pain Intensity Assessment Using Digital Imaging. IEEE Trans. Biomed. Eng. 2010, 57, 1457–1466. [Google Scholar] [CrossRef] [PubMed]
  101. Rizoug, N.; Bartholomeus, P.; Le Moigne, P. Study of the Ageing Process of a Supercapacitor Module Using Direct Method of Characterization. IEEE Trans. Energy Convers. 2012, 27, 220–228. [Google Scholar] [CrossRef]
  102. Fang, Q.; Wei, X.; Lu, T.; Dai, H.; Zhu, J. A State of Health Estimation Method for Lithium-Ion Batteries Based on Voltage Relaxation Model. Energies 2019, 12, 1349. [Google Scholar] [CrossRef]
  103. Della Giustina, D.; Ponci, F.; Repo, S. Automation for smart grids in Europe. In Application of Smart Grid Technologies; Elsevier: Amsterdam, The Netherlands, 2018; pp. 231–274. [Google Scholar] [CrossRef]
  104. Rong Li, X.; Bar-Shalom, Y. Performance Prediction of Hybrid Algorithms. Appl. Soft Comput. 1995, 18, 99–151. [Google Scholar] [CrossRef]
  105. Satpathy, R.; Pamuru, V. Off-grid solar photovoltaic systems. In Solar PV Power; Elsevier: Cambridge, MA, USA, 2021; pp. 267–315. [Google Scholar] [CrossRef]
  106. Chen, H.; Xiong, R.; Lin, C.; Shen, W. Model predictive control based real-time energy management for a hybrid energy storage system. CSEE J. Power Energy Syst. 2020, 7, 862–874. [Google Scholar] [CrossRef]
  107. Herath, A.; Kodituwakku, S.; Dasanayake, D.; Binduhewa, P.; Ekanayake, J.; Samarakoon, K. Comparison of Optimization- and Rule-Based EMS for Domestic PV-Battery Installation with Time-Varying Local SoC Limits. J. Electr. Comput. Eng. 2019, 2019, 8162475. [Google Scholar] [CrossRef]
  108. Restrepo, M.; Cañizares, C.A.; Simpson-Porco, J.W.; Su, P.; Taruc, J. Optimization- and Rule-based Energy Management Systems at the Canadian Renewable Energy Laboratory microgrid facility. Appl. Energy 2021, 290, 116760. [Google Scholar] [CrossRef]
  109. Trovão, J.P.; Pereirinha, P.G.; Jorge, H.M.; Antunes, C.H. A multi-level energy management system for multi-source electric vehicles–An integrated rule-based meta-heuristic approach. Appl. Energy 2013, 105, 304–318. [Google Scholar] [CrossRef]
  110. Schouten, N.J.; Salman, M.A.; Kheir, N.A. Energy management strategies for parallel hybrid vehicles using fuzzy logic. Control Eng. Pract. 2003, 11, 171–177. [Google Scholar] [CrossRef]
  111. Zandi, M.; Payman, A.; Martin, J.-P.; Pierfederici, S.; Davat, B.; Meibody-Tabar, F. Energy Management of a Fuel Cell/Supercapacitor/Battery Power Source for Electric Vehicular Applications. IEEE Trans. Veh. Technol. 2011, 60, 433–443. [Google Scholar] [CrossRef]
  112. Hung, Y.-H.; Wu, C.-H. An integrated optimization approach for a hybrid energy system in electric vehicles. Appl. Energy 2012, 98, 479–490. [Google Scholar] [CrossRef]
  113. Song, Z.; Hofmann, H.; Li, J.; Hou, J.; Han, X.; Ouyang, M. Energy management strategies comparison for electric vehicles with hybrid energy storage system. Appl. Energy 2014, 134, 321–331. [Google Scholar] [CrossRef]
  114. Hredzak, B.; Agelidis, V.G.; Jang, M. A Model Predictive Control System for a Hybrid Battery-Ultracapacitor Power Source. IEEE Trans. Power Electron. 2014, 29, 1469–1479. [Google Scholar] [CrossRef]
  115. Zhang, S.; Xiong, R.; Sun, F. Model predictive control for power management in a plug-in hybrid electric vehicle with a hybrid energy storage system. Appl. Energy 2017, 185, 1654–1662. [Google Scholar] [CrossRef]
  116. Sun, C.; Hu, X.; Moura, S.J.; Sun, F. Velocity Predictors for Predictive Energy Management in Hybrid Electric Vehicles. IEEE Trans. Control Syst. Technol. 2015, 23, 1197–1204. [Google Scholar] [CrossRef]
  117. Pistoia, G. Vehicle Applications. In Battery Operated Devices and Systems; Elsevier: Amsterdam, The Netherlands, 2009; pp. 321–378. [Google Scholar] [CrossRef]
  118. Wang, P.; Zhu, C. Summary of Lead-acid Battery Management System. IOP Conf. Ser. Earth Environ. Sci. 2020, 440, 022014. [Google Scholar] [CrossRef]
  119. Wang, S.; Fan, Y.; Stroe, D.-I.; Fernandez, C.; Yu, C.; Cao, W.; Chen, Z. Battery system active control strategies. In Battery System Modeling; Elsevier: Amsterdam, The Netherlands, 2021; pp. 313–340. [Google Scholar] [CrossRef]
  120. Gao, D.W. Interfacing Between an ESS and a Microgrid. In Energy Storage for Sustainable Microgrid; Elsevier: Amsterdam, The Netherlands, 2015; pp. 79–121. [Google Scholar] [CrossRef]
  121. Plett, G.L. Battery Management Systems, Volume I: Battery Modeling, 1st ed.; Artech: Norwood, MA, USA, 2015; ISBN 9781630810245. Available online: https://ieeexplore-ieee-org.nwulib.nwu.ac.za/document/9100168 (accessed on 26 July 2022).
  122. Plett, G.L. Battery Management Systems, Volume II: Equivalent-Circuit Methods, 1st ed.; Artech: Norwood, MA, USA, 2015; ISBN 9781630810283. Available online: https://ieeexplore.ieee.org/document/9100098 (accessed on 26 July 2022).
  123. Petzl, M.; Danzer, M.A. Advancements in OCV Measurement and Analysis for Lithium-Ion Batteries. IEEE Trans. Energy Convers. 2013, 28, 675–681. [Google Scholar] [CrossRef]
  124. Smokers, R.T.M.; Verbeek, M.; van Zyl, S. EVs and post 2020 CO2 targets for passenger cars. In Proceedings of the 2013 World Electric Vehicle Symposium and Exhibition (EVS27), Barcelona, Spain, 17–20 November 2013; IEEE: Barcelona, Spain, 2013; pp. 1–11. [Google Scholar] [CrossRef]
  125. Ahmadi, L.; Fowler, M.; Young, S.B.; Fraser, R.A.; Gaffney, B.; Walker, S.B. Energy efficiency of Li-ion battery packs re-used in stationary power applications. Sustain. Energy Technol. Assess. 2014, 8, 9–17. [Google Scholar] [CrossRef]
  126. Chen, M.; Rincon-Mora, G.A. Accurate electrical battery model capable of predicting runtime and I-V performance. IEEE Trans. Energy Convers. 2006, 21, 504–511. [Google Scholar] [CrossRef]
  127. Li, Y.; Sun, Z.; Wang, J. Design for battery management system hardware-in-loop test platform. In Proceedings of the 2009 9th International Conference on Electronic Measurement & Instruments, Beijing, China, 16–19 August 2009; IEEE: Beijing, China, 2009; pp. 3-399–3-402. [Google Scholar] [CrossRef]
  128. Stolitzka, D. An electronic fuel gauge accuracy study. In Proceedings of the The Twelfth Annual Battery Conference on Applications and Advances, Long Beach, CA, USA, 14–17 January 1997; IEEE: Long Beach, CA, USA, 1997; pp. 211–213. [Google Scholar] [CrossRef]
  129. Avvari, G.V.; Pattipati, B.; Balasingam, B.; Pattipati, K.R.; Bar-Shalom, Y. Experimental set-up and procedures to test and validate battery fuel gauge algorithms. Appl. Energy 2015, 160, 404–418. [Google Scholar] [CrossRef]
  130. Balasingam, B.; Ahmed, M.; Pattipati, K. Battery Management Systems—Challenges and Some Solutions. Energies 2020, 13, 2825. [Google Scholar] [CrossRef]
  131. Balasingam, B.; Avvari, G.V.; Pattipati, B.; Pattipati, K.R.; Bar-Shalom, Y. A robust approach to battery fuel gauging, part II: Real time capacity estimation. J. Power Sources 2014, 269, 949–961. [Google Scholar] [CrossRef]
  132. Balasingam, B.; Avvari, G.V.; Pattipati, K.R.; Bar-Shalom, Y. Performance analysis results of a battery fuel gauge algorithm at multiple temperatures. J. Power Sources 2015, 273, 742–753. [Google Scholar] [CrossRef]
  133. Pattipati, B.; Balasingam, B.; Avvari, G.V.; Pattipati, K.R.; Bar-Shalom, Y. Open circuit voltage characterization of lithium-ion batteries. J. Power Sources 2014, 269, 317–333. [Google Scholar] [CrossRef]
  134. Eddahech, A.; Briat, O.; Bertrand, N.; Delétage, J.-Y.; Vinassa, J.-M. Behavior and state-of-health monitoring of Li-ion batteries using impedance spectroscopy and recurrent neural networks. Int. J. Electr. Power Energy Syst. 2012, 42, 487–494. [Google Scholar] [CrossRef]
  135. Wu, J.; Wang, Y.; Zhang, X.; Chen, Z. A novel state of health estimation method of Li-ion battery using group method of data handling. J. Power Sources 2016, 327, 457–464. [Google Scholar] [CrossRef]
  136. Cope, R.; Podrazhansky, Y. The Art of Battery Charging. In Fourteenth Annual Battery Conference on Applications and Advances, Proceedings of the Conference (Cat. No.99TH8371), Long Beach, CA, USA, 12–15 January 1999; IEEE: Long Beach, CA, USA, 1999; pp. 233–235. [Google Scholar] [CrossRef]
  137. Waag, W.; Sauer, D.U. Adaptive estimation of the electromotive force of the lithium-ion battery after current interruption for an accurate state-of-charge and capacity determination. Appl. Energy 2013, 111, 416–427. [Google Scholar] [CrossRef]
  138. Ma, S.; Jiang, M.; Tao, P.; Song, C.; Wu, J.; Wang, J.; Deng, T.; Shang, W. Temperature effect and thermal impact in lithium-ion batteries: A review. Prog. Nat. Sci. Mater. Int. 2018, 28, 653–666. [Google Scholar] [CrossRef]
  139. Tran, D.; Zhou, H.; Khambadkone, A.M. Energy management and dynamic control in Composite Energy Storage System for micro-grid applications. In Proceedings of the IECON 2010-36th Annual Conference on IEEE Industrial Electronics Society, Glendale, CA, USA, 7–10 November 2010; IEEE: Glendale, CA, USA, 2010; pp. 1818–1824. [Google Scholar] [CrossRef]
  140. Ross, J.N.; Kalogirou, S.A. System Electronics. In McEvoy’s Handbook of Photovoltaics; Elsevier: Amsterdam, The Netherlands, 2018; pp. 765–788. [Google Scholar] [CrossRef]
  141. Salas, V. Stand-alone photovoltaic systems. In The Performance of Photovoltaic (PV) Systems; Woodhead Publishing; Elsevier: Sawston, UK, 2017; pp. 251–296. [Google Scholar] [CrossRef]
  142. Ashok Kumar, L.; Albert Alexander, S.; Rajendran, M. Charge controls and maximum power point tracking. In Power Electronic Converters for Solar Photovoltaic Systems; Elsevier: Amsterdam, The Netherlands, 2021; pp. 331–369. [Google Scholar] [CrossRef]
  143. Chong, L.W.; Wong, Y.W.; Rajkumar, R.K.; Rajkumar, R.K.; Isa, D. Hybrid energy storage systems and control strategies for stand-alone renewable energy power systems. Renew. Sustain. Energy Rev. 2016, 66, 174–189. [Google Scholar] [CrossRef]
  144. Rezkallah, M.; Chandra, A.; Ibrahim, H.; Feger, Z.; Aissa, M. Control systems for hybrid energy systems. In Hybrid Renewable Energy Systems and Microgrids; Elsevier: Amsterdam, The Netherlands, 2021; pp. 373–397. [Google Scholar] [CrossRef]
  145. Kuperman, A.; Aharon, I. Battery–ultracapacitor hybrids for pulsed current loads: A review. Renew. Sustain. Energy Rev. 2011, 15, 981–992. [Google Scholar] [CrossRef]
  146. Dougal, R.A.; Liu, S.; White, R.E. Power and life extension of battery-ultracapacitor hybrids. IEEE Trans. Compon. Packag. Technol. 2002, 25, 120–131. [Google Scholar] [CrossRef]
  147. Barcellona, S.; Piegari, L.; Villa, A. Passive hybrid energy storage system for electric vehicles at very low temperatures. J. Energy Storage 2019, 25, 100833. [Google Scholar] [CrossRef]
  148. Castelli Dezza, F.; Musolino, V.; Piegari, L.; Rizzo, R. Hybrid battery–supercapacitor system for full electric forklifts. IET Electr. Syst. Transp. 2019, 9, 16–23. [Google Scholar] [CrossRef]
  149. Chen, Z. High pulse power system through engineering battery-capacitor combination. In Collection of Technical Papers, Proceedings of the 35th Intersociety Energy Conversion Engineering Conference and Exhibit (IECEC) (Cat. No.00CH37022), Las Vegas, NV, USA, 24–28 July 2000; American Inst. Aeronaut. & Astronautics: Las Vegas, NV, USA, 2000; Volume 2, pp. 752–755. [Google Scholar] [CrossRef]
  150. Miller, J.R.; Outlaw, R.A.; Holloway, B.C. Graphene Double-Layer Capacitor with ac Line-Filtering Performance. Science 2010, 329, 1637–1639. [Google Scholar] [CrossRef]
  151. Gao, L.; Dougal, R.A.; Liu, S. Power Enhancement of an Actively Controlled Battery/Ultracapacitor Hybrid. IEEE Trans. Power Electron. 2005, 20, 236–243. [Google Scholar] [CrossRef]
  152. Zhang, C.; Wang, D.; Wang, B.; Tong, F. Battery Degradation Minimization-Oriented Hybrid Energy Storage System for Electric Vehicles. Energies 2020, 13, 246. [Google Scholar] [CrossRef]
  153. Grün, T.; Smith, A.; Ehrenberg, H.; Doppelbauer, M. Passive Hybrid Storage Systems: Influence of circuit and system design on performance and lifetime. Energy Procedia 2018, 155, 336–349. [Google Scholar] [CrossRef]
  154. Castaings, A.; Lhomme, W.; Trigui, R.; Bouscayrol, A. Comparison of energy management strategies of a battery/supercapacitors system for electric vehicle under real-time constraints. Appl. Energy 2016, 163, 190–200. [Google Scholar] [CrossRef]
  155. Zhang, Q.; Li, G. Experimental Study on a Semi-Active Battery-Supercapacitor Hybrid Energy Storage System for Electric Vehicle Application. IEEE Trans. Power Electron. 2020, 35, 1014–1021. [Google Scholar] [CrossRef]
  156. Goussian, A.; LeBel, F.-A.; Trovão, J.P.; Boulon, L. Passive hybrid energy storage system based on lithium-ion capacitor for an electric motorcycle. J. Energy Storage 2019, 25, 100884. [Google Scholar] [CrossRef]
Figure 1. Main theme of the paper.
Energies 16 04253 g001
Figure 3. Various measurement methods, adapted from [41,71,97,98,99,100].
Energies 16 04253 g003
Figure 4. Comparison of (a) direct, state estimation, and prediction methodologies and (b) direct and enlarged prediction methodologies.
Energies 16 04253 g004
Figure 5. Graphical comparison of rule-based and optimisation-based EMSs with a (a) 1 s refresh rate and (b) 0.5 s refresh rate, adapted from [9,10,11,12,13,14,15].
Energies 16 04253 g005
Figure 6. BMS variations, (a) centralised, (b) distributed, and (c) modular, adapted from [17,120].
Energies 16 04253 g006
Figure 7. Challenges experienced by battery management systems, adapted from [121,122,123,124,125,126,127,128,129,130,131,132,133,134,135,136,137].
Energies 16 04253 g007
Figure 8. Comparison of different capacity measurement application methods, adapted from [17,105,109,110,111,112,113,114,115,116,117,118,120,130,141,145,146,147,148,149,150,151,152,153,154,155,156].
Energies 16 04253 g008
Table 1. Comparison of capacity measurement methods, adapted from [63,64,65,66,67,69,70,74,75].
AdvantagesDisadvantages
Experimental—Direct
Ah countingSimple application
Least affected by other parameters (i.e., DoD, temperature and c-rate)
Time and energy consuming
Accuracy relies on the quality of the measuring probes
Requires a constant low current feed and constant 25 °C—this is unrealistic in real-life applications
Capacity testEasy method
Good accuracy
Challenging to inspect in real-time as fully charged capacity is not transient
Ohmic internal resistanceSimple and easy techniqueSensitive to sampling frequency, SOC, temperature, and timescale of measuring techniques
Electrochemical impedance spectroscopy (EIS)Several crucial battery parameters are measured—double layer capacitance, SEI-resistance and charge-transfer resistance
Noninvasive
Large fluctuations are observed due to insufficient algorithm and calibration platforms
SOC and temperature sensitive
Destructive testPrecise deterioration information can provide high SOH estimation accuracyTechniques require destructive intervention, thus not suitable for systems in industrial settings
Cycle number countingSimple and easy technique
No requirement for specialised equipment
Full cycles are rarely used
Capacity fade alters the duration of a cycle
Experimental—Indirect
Charging curveGood reliability
Easy implementation
Less accurate—does not account for effect of temperature
Accuracy requires discharge/charge maximum and minimum voltage be the same as that of the full-health charging curve
Ultrasonic analysisDetects internal flaws without dismantling
Noncontact, nondestructive method; can be combined with other techniques to improve accuracy
Requires a pulse generator, receiver, transducer and monitor
Extensive research and refinement of this method is still required
ICA-DVAApplicable to various types of batteries
Provides more sensitive ageing-information than charge/discharge curves
Can be combined with machine learning to improve precision
Requires small current rates—C/25, for credible accuracy
Requires microcontrollers to perform complex numerical deductions with higher computational work
Requires effective filtering to remove noise
Estimation is sensitive to temperature change
Acoustic emissionSeldomly requires the battery’s history
Detects sound waves where the battery is not subjected to external mechanical stimulus
Less effective on a battery that is not in the charge/discharge process
FBGNonelectrical
Outputs are not affected by electromagnetic interference
Can simultaneously measure battery surface strain and temperature distribution
Needs further research and refinement
Model-based—Data-driven
Optimization algorithmSmall requirement of prior knowledge
Stable outcome
High accuracy
Different model parameter combinations result in different discrepancies
Long computational time
Empirical and fittingDoes not require a thorough understanding of the electrochemical cell design or material properties
Faster computational deductions
Quality of experimental data largely influences this model; certainty of a single variable is difficult to achieve
Sample entropyHigher computational speed than approximate entropy
Self-match cancellation features
Can be combined with machine learning to improve performance
Can require large memory for computation as well as large computational time
Machine learningFlexible
Real-time implementation
High prediction accuracy
Collecting training data is lengthy and expensive
Model-based—Adaptive filtering
Electrochemical modelCombination of various validation data can yield very accurate results; usage in real-time battery state-estimationSolution deduction complexity
High computational load
Validation data combination is difficult to achieve;
Equivalent circuit model (ECM)Low computational load
Convenient real-time application
Computational complexity
Results are sensitive to model accuracy
Hybrid techniquesHigh accuracy
Good online application prospect;
Noise can diminish parameter identification
Can lead to cross-interference, which can impede algorithm accuracy and numerical stability
Require further testing on the variety of batteries
Table 2. Comparison of direct, state estimation, and prediction.
Direct State EstimationPrediction
Time (s)SOC (%) FunctionSOC (%)mFunctionSOC (%)
0100Energies 16 04253 i001Historical data: linear pattern (y = mx + c) where m = Δy/Δx
199.5
299
398.5
498
597.5
697
796.5
896
995.5
1095
1194.5 Energies 16 04253 i00294.5−0.5f(x) = (−0.5)x + 10094.5
1294 94−0.5f(x) = (−0.5)x + 10094
1393 93.5−0.5f(x) = (−0.5)x + 10093.5
1491.5 93−1f(x) = (−1)x + 10692
1588 92.5−1.5f(x) = (−1.5)x + 112.590
1683.5 92−3.5f(x) = (−3.5)x + 140.584.5
1777.5 91.5−4.5f(x) = (−4.5)x + 155.579
1870 91−6f(x) = (−6)x + 179.571.5
1959.5 90.5−7.5f(x) = (−7.5)x + 20562.5
2048 90−10.5f(x) = (−10.5)x + 25949
Table 3. Error percentages in various measurement methodologies.
Direct
Measurement
State
Estimation
Prediction
Time (s)SOC (%)SOC(%)% ErrorSOC (%)% Error
1194.594.50.0094.50.00
1294940.00940.00
139393.50.5493.50.54
1491.5931.64920.55
158892.55.11902.27
1683.59210.1884.51.20
1777.591.518.06791.94
18709130.0071.52.14
1959.590.552.1062.55.04
20489087.50492.08
Table 4. Comparison of rule-based and optimisation-based EMS curve mirroring.
Load DifferenceLoad Efficiency Total Time Delay (s)Time Efficiency (%)
2 s Sample intervalRB0~14~79
OB0~14~79
1 s Sample intervalRB0~13~84
OB+5~1.22~89
0.5 s Sample intervalRB0~12.5~87
OB+1.25~1.031~95
0.1 s Sample intervalRB0~12.1~89
OB+0.25~1.0030.2~99
Disclaimer/Publisher’s Note: The statements, opinions and data contained in all publications are solely those of the individual author(s) and contributor(s) and not of MDPI and/or the editor(s). MDPI and/or the editor(s) disclaim responsibility for any injury to people or property resulting from any ideas, methods, instructions or products referred to in the content.

