Article

Capacity Degradation and Aging Mechanisms Evolution of Lithium-Ion Batteries under Different Operation Conditions

1
College of Mechanical and Vehicle Engineering, Chongqing University, Chongqing 400044, China
2
School of Vehicle Engineering, Chongqing University of Technology, Chongqing 400054, China
*
Authors to whom correspondence should be addressed.
Energies 2023, 16(10), 4232; https://doi.org/10.3390/en16104232
Submission received: 25 April 2023 / Revised: 11 May 2023 / Accepted: 19 May 2023 / Published: 21 May 2023
(This article belongs to the Special Issue Advanced Energy Storage Technologies and Applications (AESAs))

Abstract

:
Since lithium-ion batteries are rarely utilized in their full state-of-charge (SOC) range (0–100%); therefore, in practice, understanding the performance degradation with different SOC swing ranges is critical for optimizing battery usage. We modeled battery aging under different depths of discharge (DODs), SOC swing ranges and temperatures by coupling four aging mechanisms, including the solid–electrolyte interface (SEI) layer growth, lithium (li) plating, particle cracking, and loss of active material (LAM) with a P2D model. Additionally, the mechanisms causing accelerated capacity to drop near a battery’s end of life (EOL) were investigated systematically. The results indicated that when the battery operated with a high SOC range, the capacity was more prone to accelerated degradation near the EOL. Among the four degradation mechanisms, li plating was mainly sensitive to the operation temperature and SOC swing ranges, while the SEI growth was mainly sensitive to temperature. Furthermore, there was an inhibitory interaction between li plating and SEI growth, as well as positive feedback between LAM and particle cracking during battery aging. Additionally, we discovered that the extremely low local porosity around the anode separator could cause the ‘knee point’ of capacity degradation.

1. Introduction

Lithium-ion (li-ion) batteries are widely used in electric vehicles (EVs) and energy storage systems due to their advantages, such as high energy density, long cycle life, and low self-discharge rate [1,2]. The battery performance degradation, including capacity fading, internal resistance increase and power capability decrease, shortens their usage lives in practice. Additionally, battery aging is highly dependent on operation conditions [3]. Therefore, to prolong the lifetime of batteries, it is critical to investigate the battery aging mechanisms under different usage conditions.
For lithium-ion batteries, multiple external stress factors such as ambient temperature, depth of discharge (DOD), state of charge (SOC) swing range and charging/discharging rate, etc., have a great impact on the electrochemical evolution of different aging mechanisms. The aging behaviors of li-ion batteries under different operating conditions have been studied in many works in the literature. Refs. [4,5,6] show that the high temperature accelerates the side reactions of lithium-ion batteries, especially the solid electrolyte interphase (SEI) layer growth and the loss of active materials (LAMs). The SEI layer breaks down at a temperature above 57 °C, destroying the structural stability of the battery electrode [7]. During battery charging, refs. [8,9] demonstrate that a significant amount of li ions accumulate on the anode surface under low temperatures and high charging rates, resulting in a sharp drop in the anode’s potential and, thus, a direct reduction in li ions into lithium metal on the anode surface. Li plating has a great influence on battery performance. Refs. [9,10] indicate that li plating can lead to the clogging of anode pores, which affects ion transport and thus causes a sharp resistance increase. Refs. [11,12] reveal that the development of li dendrites on the anode surface has the possibility to puncture the separator, thus resulting in the internal short circuit of the battery. Furthermore, Ref. [13] shows that the charging/discharging rate generates high mechanical stress during li-ion lithiation/delithiation, causing the stress fatigue of particles and, thus, particle cracking. Thus, it is important to place batteries in operation under suitable temperatures and charging/discharging rates to suppress these side reactions for extended battery life.
The DOD and SOC swing ranges significantly affect the battery performance degradation. Generally, the larger the DOD is, the faster the battery capacity degrades [5,14,15]. Wikner et al. [16] demonstrated that commercial lithium-ion pouch batteries have large capacity retention at a low SOC swing range. Based on a pouch battery with Li(NiMnCo)O2 as the positive electrode material, Gao et al. [17] investigated battery degradation under five different SOC swing ranges with a 20% DOD. The results show that the battery cycled with the [0–20%] SOC range had the maximal capacity retention, while the battery cycled with the [80–100%] SOC range had the fastest capacity degradation. Furthermore, it was discovered that the battery with a DOD of 100% degraded faster than that with a 20% DOD. Zhu et al. [18] showed that the battery life could be extended largely by cycling it under medium SOC ranges, and the loss of the lithium inventory (LLI) is the primary cause of the various capacity decay rates of lithium-ion batteries with different SOC ranges. Thiringer et al. [19] showed that avoiding cycling lithium-ion batteries in the high SOC ranges could effectively prolong battery life. Saxena et al. [20] demonstrated that the capacity decline rate of the LiCoO2 pouch battery increased with an increase in SOC swing ranges. Preger et al. [21] investigated the aging trajectories of three commercial lithium-ion batteries, including LiFePO4 (LFP), LiNixCoyAl1−x−yO2 (NCA), and LiNixMnyCo1−x−yO2 (NMC) as the cathode materials. The results show that, in contrast to LFP, the capacity degradation of NMC and NCA batteries was more sensitive to the DOD.
Although the battery capacity degradation of different li-ion batteries under different DODs, SOC swing ranges and temperatures have been studied by many researchers, the electrochemical evolution of aging mechanisms and the interactions between them under these operation conditions were not clear. To address this issue, this paper conducted a simulation experiment by coupling four different aging mechanisms and simulating the battery aging behaviors under different operation conditions. The main contributions are as the following:
  • A high-fidelity simulation model by coupling the P2D model and four aging mechanisms were developed to emulate the battery aging behaviors under different operation conditions.
  • The battery capacity degradation under different DODs, SOC swing ranges and temperatures was analyzed systematically based on the simulation experiment.
  • The aging mechanisms and the interaction effects between them under these usage conditions were analyzed systematically, based on which some new discoveries were made.
The remainder of this paper is organized as follows: Section 2 develops the models of four aging mechanisms, followed by Section 3, showing the specifications of the lithium-ion battery and the cycling protocols of the simulation experiments. Section 4 presents the battery aging results under different working conditions and the electrochemical evolution of different aging mechanisms. The paper is concluded in Section 5.

2. Model Development

The decline in battery life is primarily caused by differential degradation mechanisms in the positive and negative electrodes as well as electrolyte consumption. However, due to the incomplete modeling of aging mechanisms of the positive electrode and electrolyte consumption, especially due to the lack of consideration of mutual effects between different mechanisms, this study focused mainly on the negative electrode. Figure 1 illustrates all the aging mechanisms of the batteries considered in this paper, including the SEI layer growth, lithium plating, particle cracking and LAM. These aging mechanisms were integrated into the Doyle–Fuller–Newman (DFN) model [22] to characterize the battery’s aging behaviors. A detailed overview of the aging mechanisms and modeling is presented in the following subsections.

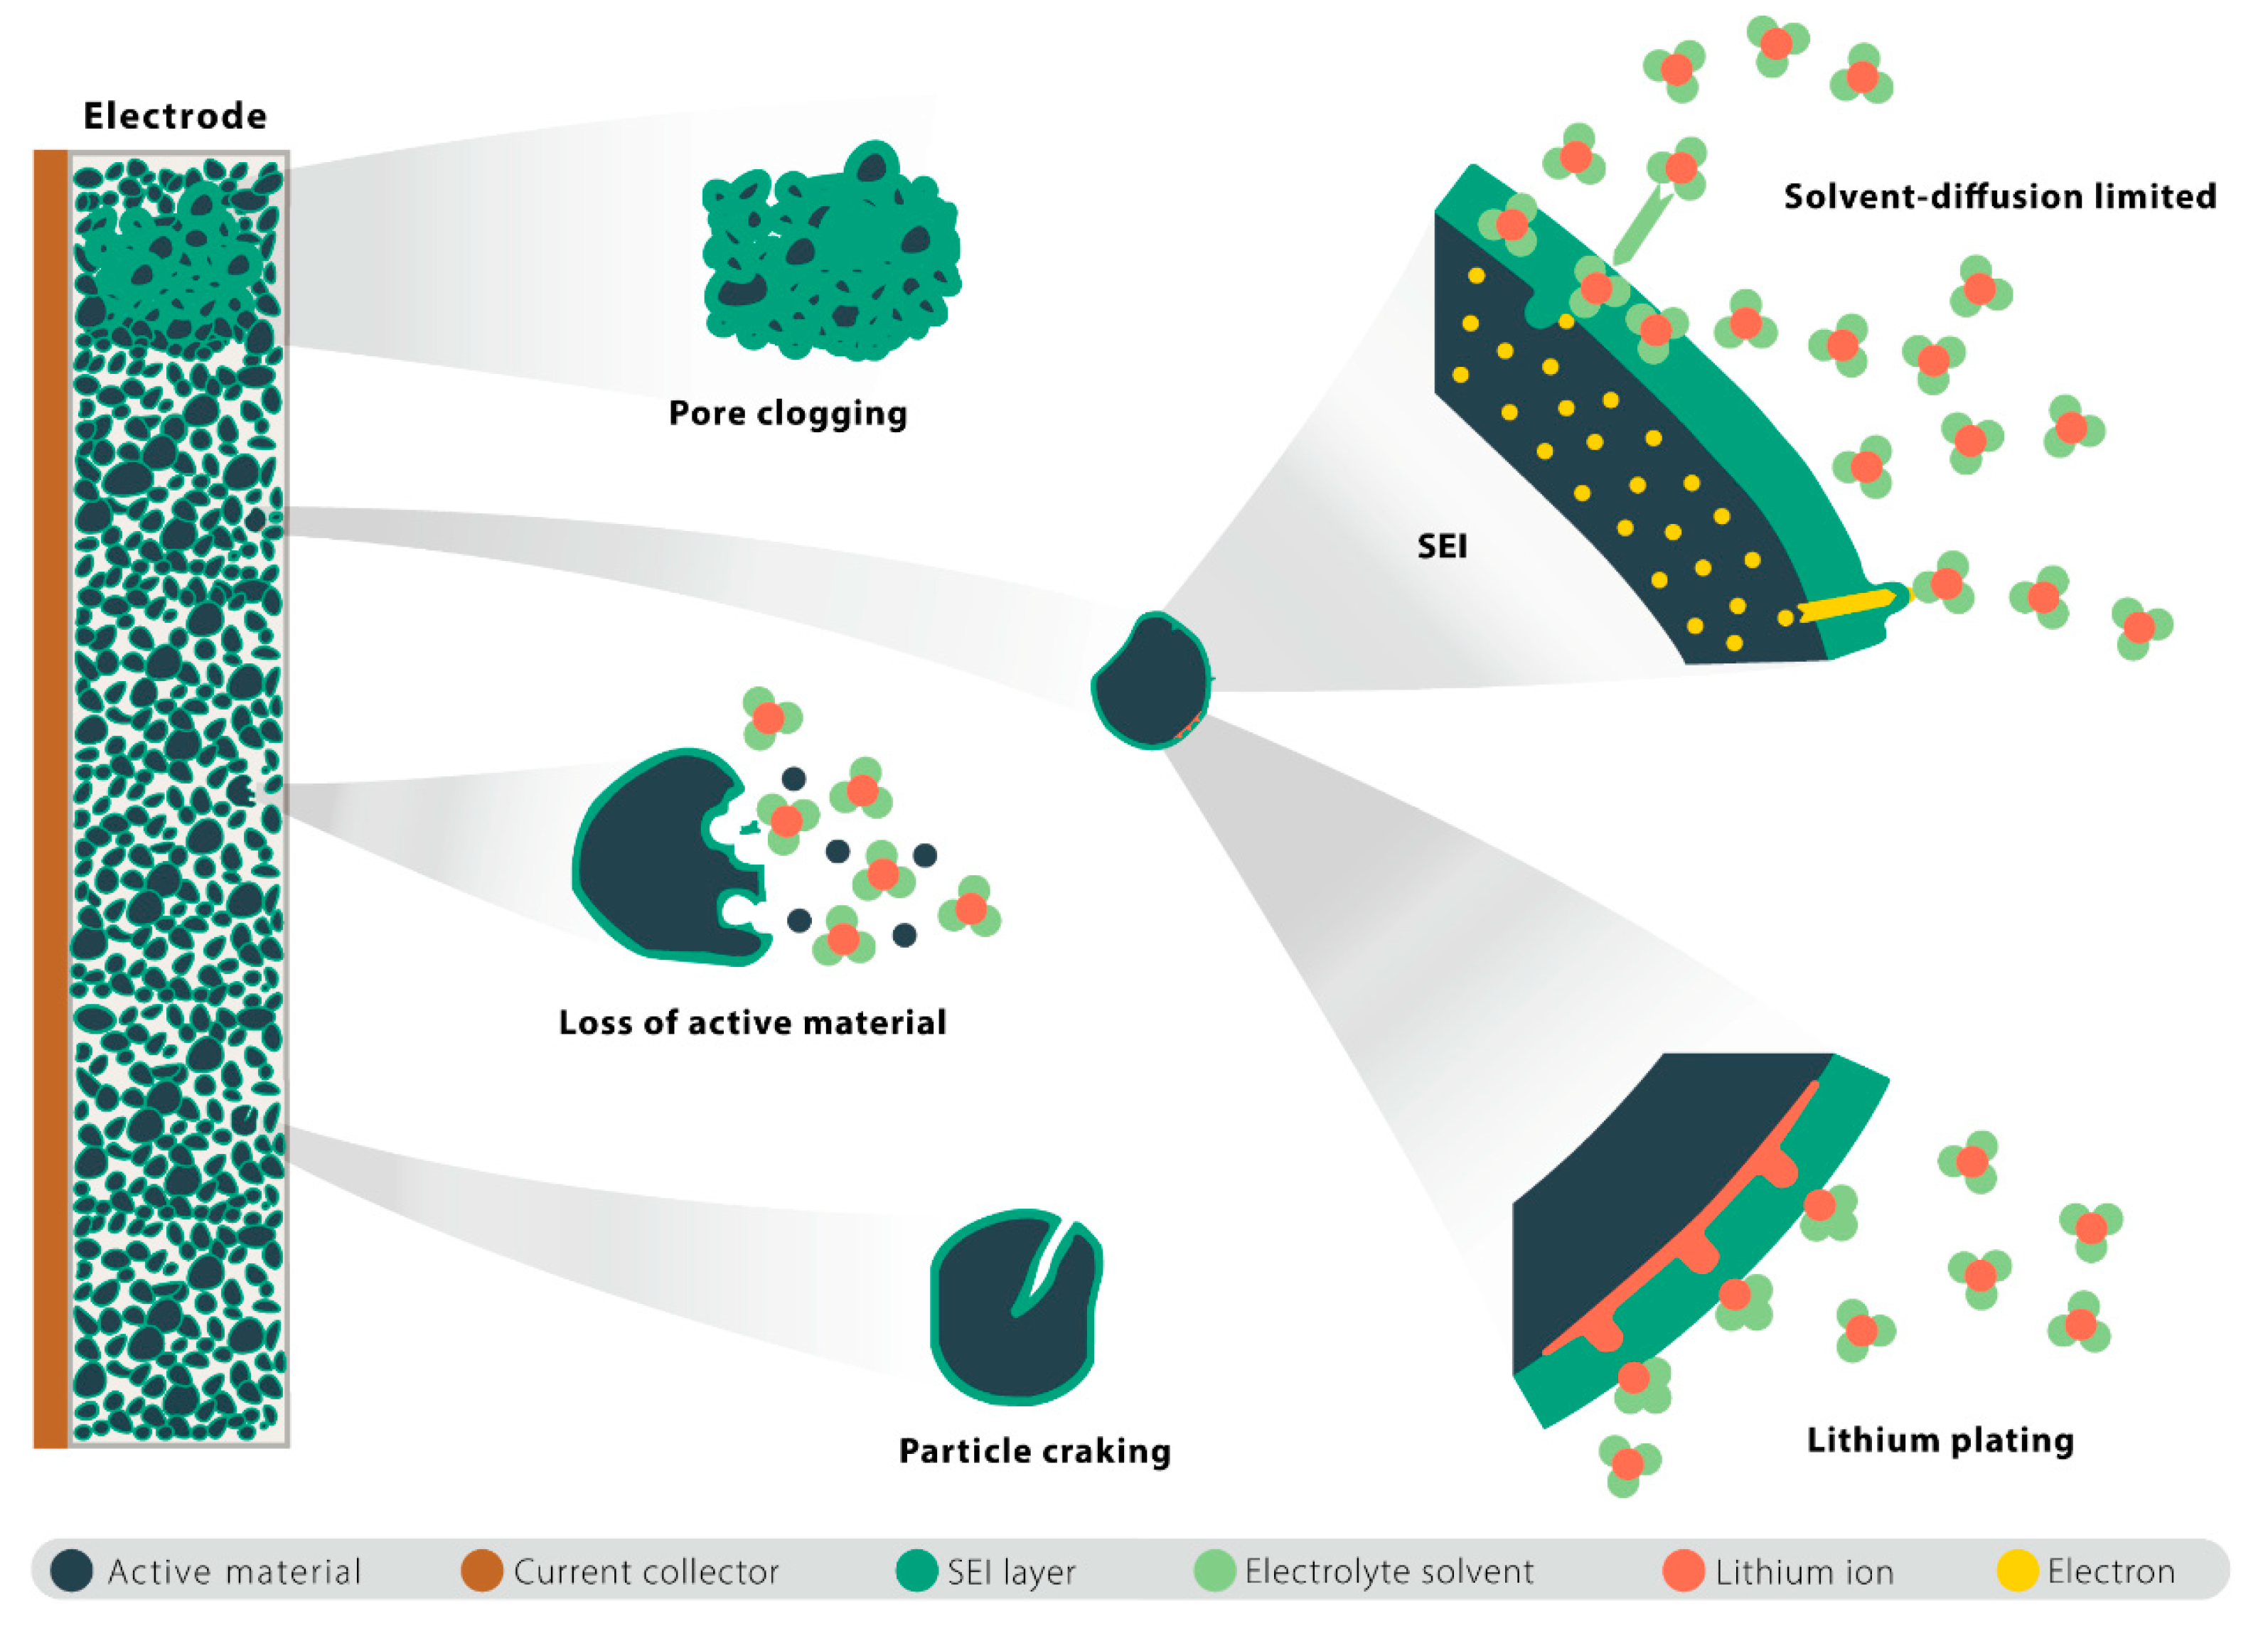
2.1. SEI Layer Growth Model

A structurally stable SEI layer is crucial for preserving the chemical and mechanical stability of the electrode. It is believed that the growth of the SEI layer is the most common and significant degradation mechanism for lithium-ion batteries. The growth of the SEI layer can be divided into two processes: first, the negative electrode of the battery is polarized, and the organic solvent in the electrolyte undergoes reduction and decomposition to produce new chemical compounds, and second, new chemical substances are precipitated on the anode surface to form a new SEI layer.
There are four SEI formation mechanisms, which were analyzed and modeled in [23]. In this paper, a diffusion-limited model was used to capture the growth of the SEI layer since the experimental data could be predicted by this model accurately [24], and the reaction rate was limited by the transport rate of the solvent through the outer layer of the SEI. The model assumed that the flux of solvent molecules followed Fick’s law:
N s o l = D s o l ( T ) c s o l l
with boundary conditions of:
c s o l | l = 0 = 0 , c s o l | l = L S E I = c s o l , e
where c s o l is the concentration of the solvent, c s o l , e is the concentration of the solvent in the electrolyte, D s o l ( T ) is the solvent diffusion coefficient, l is the location of the SEI layer.
Due to the law of conservation of material, the flux density at the interface of the SEI layer can be obtained as:
N S E I = N s o l = c s o l , 0 D s o l ( T ) L S E I .
The growth rate of the thickness of the SEI layer is also as follows:
L S E I t = 1 2 N s o l V ¯ S E I = c s o l , 0 D s o l ( T ) V ¯ S E I 2 L S E I ,
where L S E I is the SEI layer thickness and V ¯ S E I is the average partial molar volume of SEI. As indicated by Equation (4), the growth of the SEI layer was mainly affected by the temperature and the solvent diffusion coefficient, which followed the Arrhenius equation:
D s o l ( T ) = D s o l ( T r e f ) exp ( E s o l R T + E s o l R T r e f ) ,
where T r e f = 25 °C, E s o l is the activation energy for solvent diffusion.
In addition, the growth of the SEI layer led to the following effects:
  • A decrease in the negative electrode porosity:
    d ε n d t = a n · L S E I t .
  • An increase in the overpotential of the SEI layer caused by an internal resistance increase in the SEI layer:
    η S E I = j t o t L S E I a n σ S E I ,
    where ε n is the negative electrode porosity, a n is the specific surface area. For spherical particles, a n = 3 ε n / R n , R n is the negative electrode spherical particle radius. η S E I is the overpotential of the SEI layer, j t o t is the total current density in negative charge conservation and σ S E I is the conductivity of the SEI layer.

2.2. Lithium Plating Model

Lithium plating occurs when lithium ions do not intercalate into the electrode but instead form lithium metal on the electrode surface. The plated lithium can be recovered partially or completely by the subsequent discharge reactions through stripping. However, the plated lithium can quickly react chemically with the electrolyte solution to form SEI. The metal lithium isolated by the SEI film is not able to strip, so this part of lithium is called “dead lithium”. Ref. [25] constructed a partially reversible lithium plating model. According to the Butler–Former equation, with an overpotential correction form, the lithium plating/stripping flux at the anode/electrolyte interface was:
N L i = k L i ( c L i exp ( F α a , L i η L i R T ) c e exp ( F α a , L i η L i R T ) ) ,
where k L i is the lithium plating/stripping constants, c L i is the concentration of the plated lithium, F is Faraday’s constant, c e is the Li+ concentration in the electrolyte, while the transfer coefficients α a , L i and α c , L i were both set to 0.5 in this experiment. η L i is the lithium deposition potential (LDP), defined as η L i = ϕ s ϕ e η S E I , where ϕ s and ϕ e are the electrode potential and the electrolyte potential with respect to Li/Li+, respectively. However, the electrode potential in the anode was close to 0, and the internal resistance of the SEI layer was small at 25 °C. Therefore, the LDP was mainly affected by the electrolyte’s potential.
Ref. [26] indicated that the plated lithium decayed into SEI and dead lithium over time by coupling the three models of lithium plating, stripping and SEI growth. The differential solution of c L i was expressed as:
c L i t = a N L i c d l t ,
here a is the ratio of the negative electrode surface area to volume and c d l is the concentration of dead lithium, defined as:
c d l t = γ c L i
Since dead lithium is formed by the reaction of plated lithium with the electrolyte solution, the reaction rate is affected by the rate of solvent diffusion, which is also the case for the SEI layer formation. This model assumed that the dead lithium decay rate γ was inversely proportional to the thickness of the SEI layer:
γ ( L S E I ) = γ 0 L S E I , 0 L S E I , t ,
where γ 0 is the fitting parameter, L S E I , 0 is the initial SEI thickness, and L S E I , t is the SEI thickness at time t.

2.3. Particle Cracking Model

With the intercalation and deintercalation of lithium ions on the electrode, the electrode material expands and shrinks greatly. The alternating deformation of the electrode volume can cause alternating stress, leading to fracture propagation on the active particles and the creation of new surfaces, which, in turn, influences side reactions such as SEI and lithium plating. In this paper, a fatigue crack model based on spherical electrode particles was adopted, and the expressions of radial stress σ r ( r ) , tangential stress σ t ( r ) and displacement u were as follows [27]:
σ r ( r ) = 2 Ω E ( 1 υ ) [ c a v g ( R ) c a v g ( r ) ] ,
σ t ( r ) = Ω E ( 1 υ ) [ 2 c a v g ( R ) + c a v g ( r ) c ¯ / 3 ] ,
u = ( 1 + υ ) ( 1 υ ) Ω r c a v g ( r ) + 2 ( 1 2 υ ) ( 1 υ ) Ω r c a v g ( R ) ,
where Ω is the partial molar volume, E is Young’s modulus, υ is Poisson’s ratio, c a v g ( r ) is the average lithium-ion concentration as a function of the radius, R is the particle radius, and c ¯ = c c r e f is the deviation of the lithium-ion concentration c from the reference concentration c r e f under no stress.
The fatigue crack growth model follows Paris’ law [28], and it can be assumed that all electrode particle surfaces have the same crack length l c r , crack width w c r and crack density ρ c r per unit area.
d l c r d N = k c r t 0 ( σ t b c r π l c r ) m c r       σ t > 0 ,
where t 0 is the time of a single cycle, b c r is the stress intensity correction factor, and k c r and m c r are constants obtained from the experiments.
The growth model of the SEI layer on the new crack can be defined as follows [25]:
L S E I , c r t = c s o l , 0 D s o l ( T ) V ¯ S E I 2 L S E I , c r + l c r t L S E I , c r 0 L S E I , c r l c r
where L S E I , c r is the average thickness of the SEI layer on the new crack, and L S E I , c r 0 = L S E I , 0 / 10000 is the thickness of the initial SEI layer on the new crack.

2.4. Loss of Active Material Model

Particle cracking can also lead to the loss of active material (LAM). The underlying principles of the physical phenomena are the same, so the above mechanism-based models could also be used to calculate the LAM. The LAM can be simulated by decreasing the volume fraction of active material ε a according to:
ε a t = β t 0 ( σ h , m a x σ h , m i n σ c ) m 2       σ h , m i n > 0 ,
where β , m 2 and σ c are the coefficients obtained from the experiments. The hydrostatic stress σ h = ( σ r + 2 σ t ) / 3 can be derived from Equations (12)–(14). The subscripts max and min of σ h represent the maximum and minimum values, respectively.

3. Simulation Experiment

3.1. Battery Specification

A commercial 21,700-type battery (INR 21700-M50T, LG) with a nominal capacity of 5Ah and a nominal voltage of 3.63 V was simulated in this study. The anode used SiOy-graphite, and the cathode used LiNi0.8Co0.1Mn0.1O0.1 as the active material. It should be noted that the anode of the battery in question was a composite electrode, meaning that there was a small amount of SiOy present in the graphite negative electrode. However, the Si effect was disregarded in this study, and the negative electrode material was assumed to be pure graphite. The battery’s height and diameter were 70 mm and 21 mm, respectively. The lower and upper cut-off voltages were 2.5 V and 4.2 V, respectively. More detailed specifications of the battery are listed in Table 1.

3.2. Simulation Tool and Parameterization

The Python-based PYBAMM toolbox [29] was used to simulate the battery charging/discharging behaviors and aging characteristics in this study by using the P2D model coupled with aging models that describe the different aging mechanisms above. The key degradation parameters of the aging models are listed in Table 2, and some default degradation parameters are listed in Supplementary Table S1. In the simulation, the electrodes and separator were divided into 30 mesh nodes and the particles into 35 mesh nodes. The model was solved using the CasADI solver [30].

3.3. Cycling Protocols

The flow chart of the aging experiment is shown in Figure 2. The battery was first characterized with a reference performance test (RPT) to calibrate the capacity under T = 25 °C and was then cycled with the aging test. The specific processes for the RPT and aging tests are listed in Table 3. During the aging test, based on the constant current value, the battery charge and discharge time were controlled to ensure that the battery was cycled within a specific SOC range. The cut-off voltage (4.2 V and 2.5 V) was used as the charge/discharge limit to avoid battery overcharge or over-discharge. Since the aging experiments involved various depths of discharge (DODs), the equivalent full cycle (EFC) instead of the cycle number was used for fair comparisons. The EFC was computed by normalizing the accumulated throughput ampere-hour in charging and discharging to the battery’s maximum capacity.
For instance, when the SOC cycle range was [5–55%], the battery was first discharged at 1 C to a lower cut-off voltage of 2.5 V (SOC = 0%). Then the battery was charged at 0.5 C to 55% SOC, and after a rest for 60 s, the battery was discharged at 1 C for 0.5 h to 5% SOC. After another rest for 60 s, the battery was cycled between 5% and 55%, as the procedure indicates in Table 3. After 100 EFCs, the RPT was performed periodically to calibrate the battery capacity so that the charge-discharge rate and the charge-discharge time could be updated for the next aging test. This periodical capacity calibration was conducted to avoid accumulative errors caused by the continuous battery capacity fading during cycling. When the battery capacity fell below 80%, the aging test was terminated. Supplementary Table S2 lists the test matrix for the battery aging experiment. This research investigates how various DODs, SOC swing ranges, and ambient temperatures affect battery aging evolution. Note that the thermal characteristics were not considered in the modeling, and the battery temperature was fixed during the simulation.

4. Results and Discussion

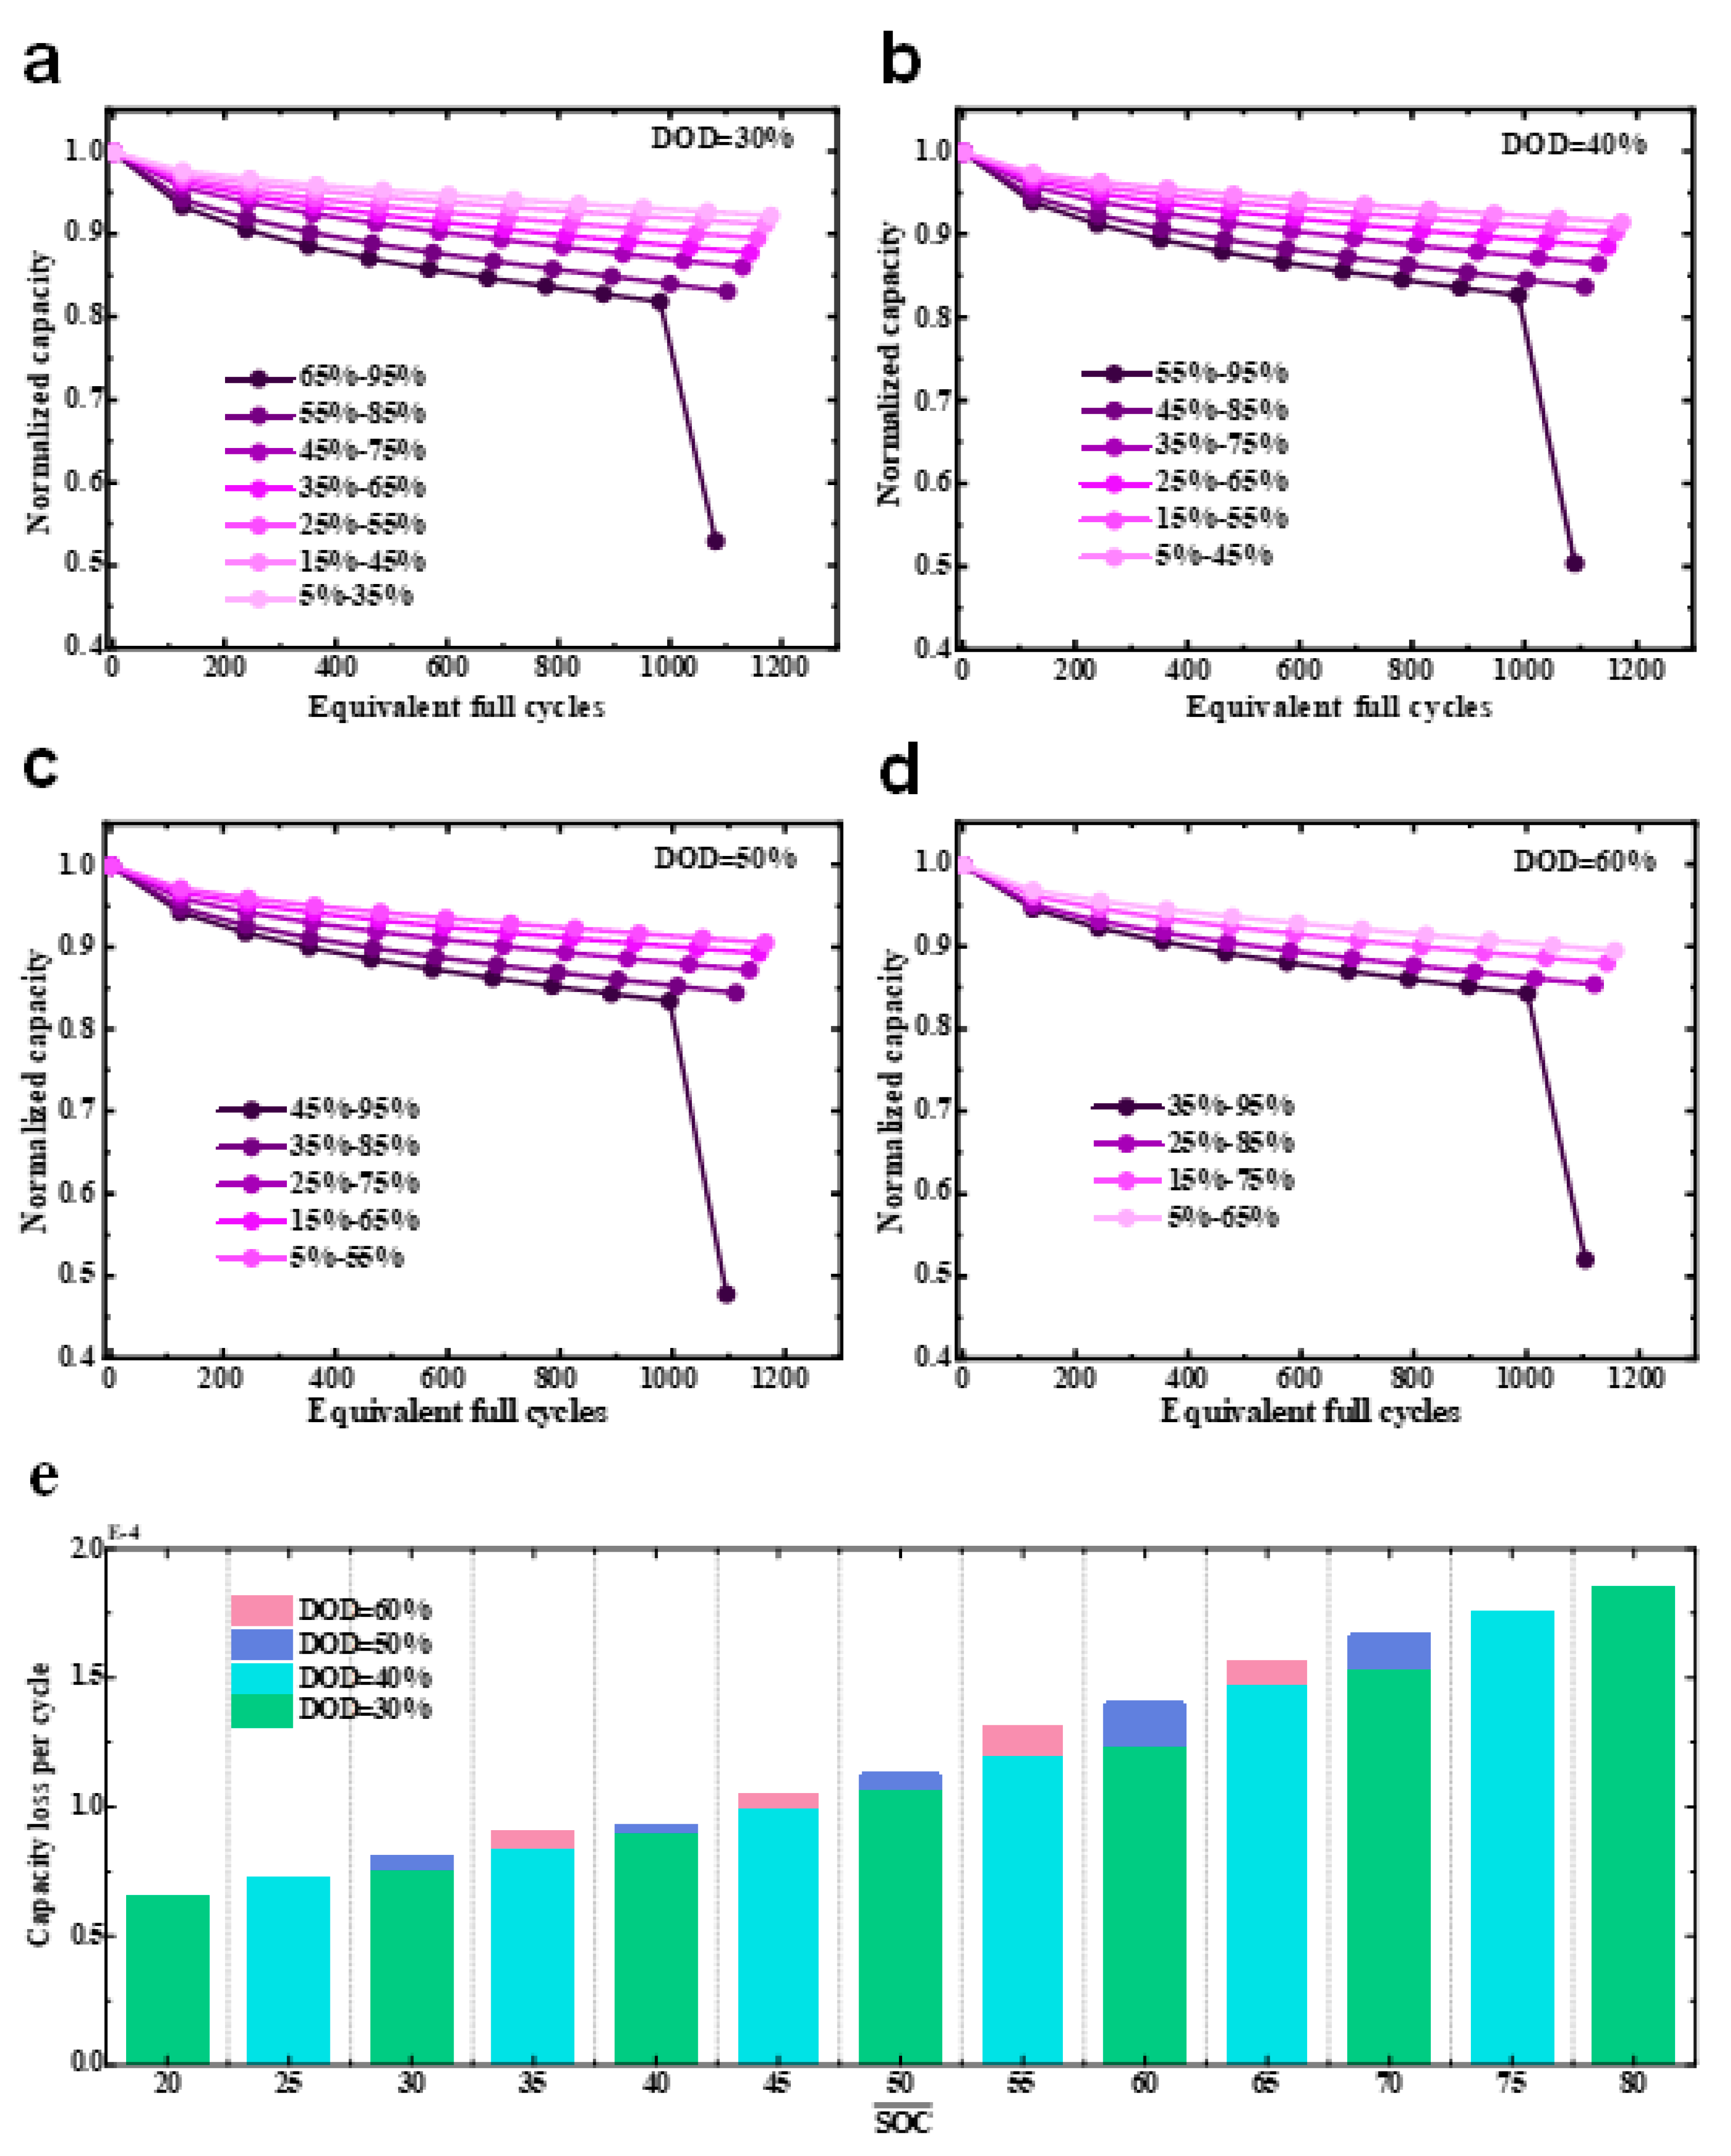
4.1. Simulation Results with Different SOC Swing Ranges

Figure 3 shows the battery capacity degradation under different DODs and SOC swing ranges. Figure 3a–d indicates that when the battery DOD was fixed, the capacity fading rate generally decreased as the battery SOC swing range decreased. This phenomenon is consistent with the results presented in refs. [16,17]. For example, under a fixed DOD of 50%, shown in Figure 3c, the battery degradation rate was the highest under a SOC swing range of [45–95%], which decreased to the lowest under a range of [5–55%]. Additionally, we also discovered that the battery’s capacity decay rate was significantly faster during the ranges [35–85%] and [45–95%] compared to other SOC ranges in Figure 3c. These variable aging trajectories imply that different aging mechanisms are experienced by batteries when cycled with different SOC ranges, which contribute differently to the battery capacity loss. This aging phenomenon is investigated in detail in the following. It can be observed that when the battery was cycled with high SOC ranges of [65–95%], [55–95%], [45–95%], [35–95%], a ‘knee point’ occurred in the capacity degradation curve. This rapid nonlinear degradation phenomenon, which reduces the battery life drastically, is discussed in detail in Section 4.1.2. Figure 3e depicts the capacity decay rate per cycle with different mean SOC values. When SOC ¯ remained constant, the greater the DOD, the greater the battery capacity declined. Note that SOC ¯ = SOC upper limit DOD / 2 or SOC ¯ = SOC lower limit + DOD / 2 .

4.1.1. Aging Mechanisms Analysis under Different SOC Ranges

To investigate the evolution process of different aging mechanisms inside the battery under various SOC ranges and their impact on the battery life, we selected a battery with a DOD of 50% and with five different SOC ranges. Figure 4 shows aging parameter variations with different SOC swing ranges at 50% DOD.
Figure 4a depicts the particle concentration distribution on the negative electrode separator side, where the lower the SOC swing range, the higher the particle internal concentration. According to Equations (12) and (13), a higher particle concentration induced larger alternating stress, making active particles more susceptible to fatigue and thus resulting in particle cracking more easily. As shown in Figure 4b, the particle crack length was longer with a lower SOC range, leading to more severe particle cracking. Particle cracking results in the loss of active material (LAM). The LAM of the negative electrode, depicted in Figure 4c, appeared more severe as the SOC cycling range decreased. LAM could lower the interfacial area between the active material and the electrolyte, resulting in an increase in the interfacial current density, which further increases the concentration within the particle and mechanical stress during battery operation. This positive feedback mechanism indirectly accelerates particle cracking.
Two aging mechanisms, including the SEI layer formation (red line) and Li plating (purple dashed line), are depicted in Figure 4d. The SEI formation involves the growth of the SEI layer on the electrode surface as well as the newly created SEI layer on the cracking surface of the active particles. Figure 4d illustrates that the loss of battery capacity caused by the growth of the SEI layer and Li plating slowed down as the battery aged. According to Equation (4), the SEI is a self-limiting growth whose thickness is proportional to the square root of time. However, the occurrence of lithium plating is influenced by the growth of the SEI layer. First, as the SEI layer grows, the reduction in recyclable lithium in the electrolyte avoids the high-lithiation state of the anode when it starts plating, thereby inhibiting the occurrence of lithium plating. Additionally, in Equation (8), when k L i > 10 9 m s 1 , the battery capacity decay is more sensitive to γ 0 than to k L i [26]. Additionally, the formation rate of dead lithium is negatively proportional to the thickness of the SEI layer, as indicated in Equation (11). Figure 4d shows that Li plating was more sensitive to the SOC cycling range than SEI growth. When the battery cycled in a high SOC range of [45–95%], the capacity loss caused by lithium plating was approximately five times greater than that in a low SOC range of [5–55%]. Furthermore, the rate of lithium plating was significantly faster in the ranges of [35–85%] and [45–95%] compared to the other three ranges, resulting in a significant difference in the rate of the battery capacity decline (Figure 3). It can be noted that the growth of the SEI layer and lithium plating resulted in a decrease in porosity. Figure 4e depicts the change in porosity on the anode side near the separator, and this changing trend was opposite to the growing trend of the curve shown in Figure 4d. The porosity decreased more rapidly as the SOC cycle range increased. It is also worth noting that the porosity was less than 0.05 near the late life of the battery with a SOC range of [45–95%], indicating that the pore was clogged [9]. This was the cause of the abrupt capacity drop shown in Figure 3, and a detailed analysis is presented in the following section.
Figure 5 depicts the capacity loss caused by SEI growth and li plating under different DODs and SOC swing ranges. Figure 5a illustrates that the difference in the capacity loss caused by SEI was very small, even with different SOC ¯ and DOD values. However, a greater loss in the battery capacity due to li plating was observed (Figure 5b) with higher DODs. Figure 5 indicates that li plating was the primary factor for accelerated battery capacity degradation when DOD increased.

4.1.2. Nonlinear Degradation Due to Pore Clogging

We took the SOC swing range of [45–95%] to analyze the ‘knee point’ of the battery capacity degradation. Figure 6 displays the battery potential characteristics at a 0.3 C discharge under different SOHs. Figure 6a shows that the battery voltage decreased slightly at the beginning of the discharge as the battery aged. However, at a SOH of 48.2%, the battery’s initial discharge voltage dropped sharply, indicating a dramatically increased battery resistance at a low SOH. A detailed analysis of the voltage loss in both fresh and aged batteries was undertaken to investigate the causes of this phenomenon. The overall voltage loss was mostly induced by: (1) electrode resistance; (2) electrolyte concentration polarization resistance and ion conduction resistance (unified as electrolyte resistance); (3) the internal concentration polarization resistance of active particles. The evolution of individual voltage loss during discharge for fresh and aged batteries is depicted in Figure 6b,c. Figure 6c shows that the rise in resistance in an aged battery was mostly attributed to the resistance increase in the anode electrolyte, whereas the electrode resistance and internal concentration polarization resistance of the active particles were close to 0. Comparing the anode electrolyte resistance in Figure 6b,c, it can be seen that the anode electrolyte resistance increased sharply during the nonlinear aging stage of the battery (SOH < 80% generally).
It can be noted that there was a positive correlation between the resistance increase and the potential gradient of the negative electrolyte. Figure 6d shows the potential gradient change in the anode electrolyte at different SOHs. During the discharging process, lithium was deintercalated from the negative electrode and became lithium ions, which flowed to the positive electrode via the electrolyte, causing the electrolyte potential to drop along the current collector to the separator. In a new cell, the electrolyte gradient decreased at the anode by a smaller amount, implying a smaller overall potential drop in the electrolyte. As the battery aged, the electrolyte potential gradient dropped quickly. The electrolyte potential gradient exhibited a dramatic decline near the anode/separator interface after the nonlinear degradation of the battery. This result indicates that the potential of the negative electrolyte dropped sharply and that its resistance increased violently after the ‘knee point’ of battery capacity degradation.
The dramatic drop in the electrolyte potential gradient at the anode during battery degradation was primarily caused by a decrease in the anode porosity. Figure 7a depicts the local porosity distributions of the anode at different SOHs. The porosity was relatively uniform across the anode in both fresh cells and cells with high SOHs. However, after the ‘knee point’ (SOH < 80%), the porosity of the anode near the separator was reduced substantially, thus resulting in pore clogging. According to Equation (6), the SEI layer growth could lead to a porosity decrease. Furthermore, as previously claimed, lithium plating also resulted in a porosity decrease. Figure 7b shows the volume fraction of pores occupied by an SEI layer and lithium plating during cycling. It could be seen that the SEI layer’s growth was relatively uniform across the anode thickness under different aging stages of the battery, while the li plating was relatively low near the current collector and increased exponentially after the 0.6 anode thickness (dimensionless) until the separator. And as the battery degraded, the lithium plating growth rate was higher.
That is, the decrease in porosity during the battery’s early health stages could be primarily attributed to the SEI growth. The accelerated porosity decreased during the battery’s late health stages mainly due to the more severe li plating. The extremely low porosity made the conduction of ionic charges and the diffusion of lithium ions very difficult, which led to the potential gradient reduction in the anode electrolyte (Figure 6d). Figure 7c,d shows the evolution of the li plating potential at three distinct sites of the anode during charging for a new battery and an aged battery with SOH = 84.96%. It shows that during CC charging, the li plating potential decreased at each site until the voltage reached the cutoff voltage, after which it started to increase back. The difference was that for the new battery, the li plating potential at the anode was higher than 0 V vs. Li/Li+, and thus, the lithium plating rate was slow. While for aged cells, the li plating potential dropped quickly during charging and to a negative value near the separator; this exacerbated Li deposition, as shown in Figure 7b.

4.2. Simulation Results with Different Temperatures

Figure 8 illustrates the battery capacity degradation at different temperatures, and SOC swing ranges with a DOD of 50%. Figure 8a–d shows that at different temperatures, the battery degraded more slowly as the SOC cycling range decreased, which was consistent with the battery degradation results at a temperature of 25 °C. It was observed that at T = 5 °C and T = 15 °C, the battery capacity fading rate with SOC swing ranges of [35–85%] and [45–95%] was larger than other SOC cycling ranges. But as the temperature increased, this difference in capacity degradation gradually reduced. Note that at T = 35 °C and T = 45 °C, the ‘knee point’ in the battery capacity degradation was also observed as that at T = 25 °C. Figure 8e depicts the capacity loss per cycle under different temperatures and SOC ¯ values. It shows that at T = 5 °C, the capacity degraded the fastest. Among the five temperatures, the battery capacity decline rate was ranked as T = 5 °C > T = 15 °C > T = 45 °C > T = 25 °C ≈ T = 35 °C. A detailed analysis of the degradation mechanisms under different temperatures is shown as the following.

Aging Mechanisms with Different Temperatures

Figure 9 shows the battery aging characteristics at 50% DOD and different aging characteristics. Figure 9a shows the battery capacity loss caused by SEI, which indicates that the SOC cycling range was limited while the temperature had a greater effect on the SEI layer growth. For example, the capacity loss due to SEI at 45 °C was approximately three times that at 5 °C for the same EFCs. The high SEI growth rate at high temperatures was due to the increased intercalation capability of solvent molecules at elevated temperature rises, which was indicated by an increase in the solvent diffusion coefficient of Equation (5). Figure 9b depicts the battery capacity loss due to li plating. As shown in Figure 9b, lithium plating was highly sensitive to both the SOC cycling ranges and temperatures. For instance, at the same EFCs, the battery capacity loss caused by lithium plating at 5 °C was four times that at 45 °C, indicating that low temperatures facilitated li plating. The reason for this was that the graphite anode kinetics deteriorated as the temperature decreased. That is, on the one hand, the li-ion intercalation rate into the negative electrode was reduced at low temperatures, resulting in the intensified polarization of the negative electrode electrolyte, and many li-ions directly obtained electrons at the negative electrode/electrolyte interface and became metallic lithium directly. On the other hand, at lower temperatures, the SEI layer growth was slower, which promoted the formation of dead Li (Equation (11)). Figure 9a,b shows that at low temperatures, li plating was the main aging mechanism, and the SEI layer growth caused less battery capacity loss than li plating.
Figure 9c depicts the crack length in the negative active material particles, which shows that the decrease in the temperature accelerated particle cracking. The main reason is that during a low-temperature discharge, the active material particles of the negative electrode shrank, increasing the concentration gradient inside the particles and, thus, promoting the LAM of the negative electrode. Figure 9d shows the LAM of the negative electrode, indicating positive feedback between the LAM and particle cracking, as discovered in Section 4.1.1. However, because Young’s modulus of the Li-ion battery in this paper was set to a large value, the LAM of the negative electrode had a limited effect on the battery’s capacity loss. Therefore, the capacity degradation rate per cycle at different temperatures (Figure 8e) was the cooperation results under different aging mechanisms, including the SEI’s layer growth, lithium-ion plating, and so on.

5. Conclusions

By coupling the four aging mechanisms of solid electrolyte interphase (SEI) growth, lithium (li) plating, particle cracking, and the loss of active material (LAM), this paper systematically studied the electrochemical evolution of battery aging at different depths of discharge (DODs), state of charge (SOC) swing ranges, and ambient temperatures. The relationship between different aging mechanisms was analyzed, and the mechanisms leading to the non-linear capacity degradation of the battery were discussed. The four discoveries are summarized as follows.
  • There is an aging-minimal operation state at a specific SOC swing range, DOD and temperature for the battery. This minimal aging state of the battery was determined by the trade-off between different aging mechanisms under specific operating conditions. For example, the optimal operating temperature range for this cell was around 25–35 °C, and the cell degraded faster under temperatures outside this range, necessitating the health conscious-control of battery operations for an extended lifetime in practice.
  • There was a negative feedback mechanism between the SEI growth and Li plating. By consuming cyclable lithium, SEI growth could prevent the negative electrode from becoming highly lithiated during Li plating, thereby restraining Li plating. Furthermore, SEI growth could inhibit the formation of dead lithium. However, particle cracking and LAM clearly had a positive feedback mechanism between each other. That is, LAM could reduce the interface area between the active material and the electrolyte, increasing the interface current density, the internal concentration of the particles and the mechanical stress, thus further promoting active particle cracking.
  • Lithium plating is highly sensitive to ambient temperatures and SOC swing ranges, while SEI growth is mainly sensitive to ambient temperatures. Low temperatures caused accelerated battery capacity fading and an increase in resistance. The main cause was that lithium plating occurred relatively easily at low temperatures. Furthermore, low temperatures can also speed up particle cracking, resulting in increased LAM. If the temperature is too high, lithium plating is inhibited, and the SEI layer growth is accelerated. At different temperatures, the battery capacity decline rate can be ranked as T = 5 °C > T = 15 °C > T = 45 °C > T = 25 °C ≈ T = 35 °C.
  • The clogging of the anode pores near the separator caused a significant accumulation of the lithium ions there. These circumstances aggravate the increase in the local electrolyte potential gradient in the anode, which, in turn, causes a sudden increase in the anode electrolyte’s resistance and, thus, nonlinear capacity degradation.

Supplementary Materials

The following supporting information can be downloaded at: https://www.mdpi.com/article/10.3390/en16104232/s1, Table S1: Default degradation parameters; Table S2: Test matrix for lifetime cycling.

Author Contributions

Conceptualization, Y.Z.; Methodology, G.L. and Y.Z.; Software, Investigation, and Validation, G.L.; Writing-Original Draft, G.L. and Y.Z.; Reviewing & Editing, Y.Z. and A.T. All authors have read and agreed to the published version of the manuscript.

Funding

This research was partly funded by Sichuan Province Science and Technology Support Program (No. 2023YFG0067) and National Natural Science Foundation of China (No. 52277213).

Conflicts of Interest

The authors declare no conflict of interest.

References

  1. Bresser, D.; Hosoi, K.; Howell, D.; Li, H.; Zeisel, H.; Amine, K.; Passerini, S. Perspectives of automotive battery R&D in China, Germany, Japan, and the USA. J. Power Sources 2018, 382, 176–178. [Google Scholar]
  2. Zheng, Y.; Ouyang, M.; Lu, L.; Li, J.; Han, X.; Xu, L.; Ma, H.; Dollmeyer, T.A.; Freyermuth, V. Cell state-of-charge inconsistency estimation for LiFePO4 battery pack in hybrid electric vehicles using mean-difference model. Appl. Energy 2013, 111, 571–580. [Google Scholar] [CrossRef]
  3. Ouyang, M.; Feng, X.; Han, X.; Lu, L.; Li, Z.; He, X. A dynamic capacity degradation model and its applications considering varying load for a large format Li-ion battery. Appl. Energy 2016, 165, 48–59. [Google Scholar] [CrossRef]
  4. Matsuda, T.; Ando, K.; Myojin, M.; Matsumoto, M.; Sanada, T.; Takao, N.; Imai, H.; Imamura, D. Investigation of the influence of temperature on the degradation mechanism of commercial nickel manganese cobalt oxide-type lithium-ion cells during long-term cycle tests. J. Energy Storage 2019, 21, 665–671. [Google Scholar] [CrossRef]
  5. Wang, J.; Purewal, J.; Liu, P.; Hicks-Garner, J.; Soukazian, S.; Sherman, E.; Sorenson, A.; Vu, L.; Verbrugge, M.W. Degradation of lithium ion batteries employing graphite negatives and nickel–cobalt–manganese oxide+ spinel manganese oxide positives: Part 1, aging mechanisms and life estimation. J. Power Sources 2014, 269, 937–948. [Google Scholar] [CrossRef]
  6. Vetter, J.; Novák, P.; Wagner, M.R.; Veit, C.; Möller, K.-C.; Besenhard, J.O.; Winter, M.; Wohlfahrt-Mehrens, M.; Vogler, C.; Hammouche, A. Ageing mechanisms in lithium-ion batteries. J. Power Sources 2005, 147, 269–281. [Google Scholar] [CrossRef]
  7. Wang, Q.; Sun, J.; Yao, X.; Chen, C. Thermal stability of LiPF6/EC+ DEC electrolyte with charged electrodes for lithium ion batteries. Thermochim. Acta 2005, 437, 12–16. [Google Scholar] [CrossRef]
  8. Petzl, M.; Kasper, M.; Danzer, M.A. Lithium plating in a commercial lithium-ion battery–A low-temperature aging study. J. Power Sources 2015, 275, 799–807. [Google Scholar] [CrossRef]
  9. Yang, X.G.; Leng, Y.; Zhang, G.; Ge, S.; Wang, C.-Y. Modeling of lithium plating induced aging of lithium-ion batteries: Transition from linear to nonlinear aging. J. Power Sources 2017, 360, 28–40. [Google Scholar] [CrossRef]
  10. Han, X.; Ouyang, M.; Lu, L.; Li, J.; Zheng, Y.; Li, Z. A comparative study of commercial lithium ion battery cycle life in electrical vehicle: Aging mechanism identification. J. Power Sources 2014, 251, 38–54. [Google Scholar] [CrossRef]
  11. Feng, X.; Ouyang, M.; Liu, X.; Lu, L.; Xia, Y.; He, X. Thermal runaway mechanism of lithium ion battery for electric vehicles: A review. Energy Storage Mater. 2018, 10, 246–267. [Google Scholar] [CrossRef]
  12. Lin, C.K.; Ren, Y.; Amine, K.; Qin, Y.; Chen, Z. In situ high-energy X-ray diffraction to study overcharge abuse of 18650-size lithium-ion battery. J. Power Sources 2013, 230, 32–37. [Google Scholar] [CrossRef]
  13. Edge, J.S.; O’Kane, S.; Prosser, R.; Kirkaldy, N.D.; Patel, A.N.; Hales, A.; Ghosh, A.; Ai, W.; Chen, J.; Yang, J.; et al. Lithium ion battery degradation: What you need to know. Phys. Chem. Chem. Phys. 2021, 23, 8200–8221. [Google Scholar] [CrossRef]
  14. Wang, J.; Liu, P.; Hicks-Garner, J.; Sherman, E.; Soukiazian, S.; Verbrugge, M.; Tataria, H.; Musser, J.; Finamore, P. Cycle-life model for graphite-LiFePO4 cells. J. Power Sources 2011, 196, 3942–3948. [Google Scholar] [CrossRef]
  15. Watanabe, S.; Kinoshita, M.; Hosokawa, T.; Morigaki, K.; Nakura, K. Capacity fade of LiAlyNi1−x−yCoxO2 cathode for lithium-ion batteries during accelerated calendar and cycle life tests (surface analysis of LiAlyNi1−x−yCoxO2 cathode after cycle tests in restricted depth of discharge ranges). J. Power Sources 2014, 258, 210–217. [Google Scholar] [CrossRef]
  16. Wikner, E.; Björklund, E.; Fridner, J.; Brandell, D.; Thiringer, T. How the utilised SOC window in commercial Li-ion pouch cells influence battery ageing. J. Power Sources Adv. 2021, 8, 100054. [Google Scholar] [CrossRef]
  17. Gao, Y.; Jiang, J.; Zhang, C.; Zhang, W.; Jiang, Y. Aging mechanisms under different state-of-charge ranges and the multi-indicators system of state-of-health for lithium-ion battery with Li (NiMnCo)O2 cathode. J. Power Sources 2018, 400, 641–651. [Google Scholar] [CrossRef]
  18. Zhu, J.; Knapp, M.; Sørensen, D.R.; Heere, M.; Darma, M.S.; Müller, M.; Mereacre, L.; Dai, H.; Senyshyn, A.; Wei, X.; et al. Investigation of capacity fade for 18650-type lithium-ion batteries cycled in different state of charge (SoC) ranges. J. Power Sources 2021, 489, 229422. [Google Scholar] [CrossRef]
  19. Wikner, E.; Thiringer, T. Extending battery lifetime by avoiding high SOC. Appl. Sci. 2018, 8, 1825. [Google Scholar] [CrossRef]
  20. Saxena, S.; Hendricks, C.; Pecht, M. Cycle life testing and modeling of graphite/LiCoO2 cells under different state of charge ranges. J. Power Sources 2016, 327, 394–400. [Google Scholar] [CrossRef]
  21. Preger, Y.; Barkholtz, H.M.; Fresquez, A.; Campbell, D.L.; Juba, B.W.; Romàn-Kustas, J.; Ferreira, S.R.; Chalamala, B.R. Degradation of commercial lithium-ion cells as a function of chemistry and cycling conditions. J. Electrochem. Soc. 2020, 167, 120532. [Google Scholar] [CrossRef]
  22. Fuller, T.F.; Doyle, M.; Newman, J. Simulation and optimization of the dual lithium ion insertion cell. J. Electrochem. Soc. 1994, 141, 1. [Google Scholar] [CrossRef]
  23. Single, F.; Latz, A.; Horstmann, B. Identifying the mechanism of continued growth of the solid–electrolyte interphase. ChemSusChem 2018, 11, 1950–1955. [Google Scholar] [CrossRef] [PubMed]
  24. Safari, M.; Morcrette, M.; Teyssot, A.; Delacourt, C. Multimodal physics-based aging model for life prediction of Li-ion batteries. J. Electrochem. Soc. 2008, 156, A145. [Google Scholar] [CrossRef]
  25. O’Kane SE, J.; Campbell, I.D.; Marzook, M.W.; Offer, G.J.; Marinescu, M. Physical origin of the differential voltage minimum associated with lithium plating in Li-ion batteries. J. Electrochem. Soc. 2020, 167, 090540. [Google Scholar] [CrossRef]
  26. O’Kane SE, J.; Ai, W.; Madabattula, G.; Alonso-Alvarez, D.; Timms, R.; Sulzer, V.; Edge, J.S.; Wu, B.; Offer, J.G.; Marinescu, M. Lithium-ion battery degradation: How to model it. Phys. Chem. Chem. Phys. 2022, 24, 7909–7922. [Google Scholar] [CrossRef]
  27. Reniers, J.M.; Mulder, G.; Howey, D.A. Review and performance comparison of mechanical-chemical degradation models for lithium-ion batteries. J. Electrochem. Soc. 2019, 166, A3189. [Google Scholar] [CrossRef]
  28. Purewal, J.; Wang, J.; Graetz, J.; Soukiazian, S.; Tataria, H.; Verbrugge, M.W. Degradation of lithium ion batteries employing graphite negatives and nickel–cobalt–manganese oxide+ spinel manganese oxide positives: Part 2, chemical–mechanical degradation model. J. Power Sources 2014, 272, 1154–1161. [Google Scholar] [CrossRef]
  29. Sulzer, V.; Marquis, S.G.; Timms, R.; Robinson, M.; Chapman, S.J. Python battery mathematical modelling (PyBaMM). J. Open Res. Softw. 2021, 9, 14. [Google Scholar] [CrossRef]
  30. Andersson JA, E.; Gillis, J.; Horn, G.; Rawlings, J.B.; Diehl, M. CasADi: A software framework for nonlinear optimization and optimal control. Math. Program. Comput. 2019, 11, 1–36. [Google Scholar] [CrossRef]
  31. Ai, W.; Kraft, L.; Sturm, J.; Jossen, A.; Wu, B. Electrochemical thermal-mechanical modelling of stress inhomogeneity in lithium-ion pouch cells. J. Electrochem. Soc. 2019, 167, 013512. [Google Scholar] [CrossRef]
Figure 1. Illustration of the main aging mechanisms of battery.
Energies 16 04232 g001
Figure 2. Flow chart of test procedure.
Energies 16 04232 g002
Figure 3. Battery capacity degradation with different DODs and SOC swing ranges. (a) DOD = 30%. (b) DOD = 40%. (c) DOD = 50%. (d) DOD = 60%. (e) Capacity loss per cycle before the ‘knee point’ with different DODs and mean SOC values.
Energies 16 04232 g003
Figure 4. Aging parameter variations with different SOC swing ranges at 50% DOD. (a) Concentration distribution of negative electrode particles near the separator at a 0.3 C discharge in the last RPT test of the cell. (b) Variations in negative particle crack length as battery ages. (c) Variations in x-averaged negative active material fraction as battery ages. (d) Capacity loss due to SEI formation (red lines)/Li plating (purple dotted lines). (e) Variations in negative electrode porosity at separator as battery ages.
Energies 16 04232 g004
Figure 5. Capacity loss under different DODs and SOC swing ranges due to (a) SEI growth, and (b) Li plating.
Energies 16 04232 g005
Figure 6. Characteristic analysis of battery potential at an SOC range of [45%–95%]: (a) Discharge voltage at 0.3 C under different SOHs. (b) Voltage loss caused by different components for a fresh cell. (c) Voltage loss caused by different components for an aged cell. (d) Gradient of electrolyte potential across the anode thickness under different SOHs.
Energies 16 04232 g006
Figure 7. Distributions of local anode porosity (a) and pore volume occupation by SEI and li plating (b) under different SOHs. Variations in li deposition potential during charging at different sites for a fresh cell (c) and an aged cell (d).
Energies 16 04232 g007
Figure 8. Capacity degradation under different SOC swing ranges with a DOD of 50% under temperatures of (a) T = 5 °C, (b) DOD = 15 °C, (c) T = 35 °C, (d) T = 45 °C, (e) Capacity loss per cycle under different temperatures and SOC ¯ values.
Energies 16 04232 g008
Figure 9. Battery aging characteristics at different temperatures and 50% DOD. (a) Capacity loss due to SEI. (b) Capacity loss due to plating. (c) Negative particle crack length. (d) x-averaged negative active material fraction.
Energies 16 04232 g009
Table 1. Specifications of the LGM50 lithium-ion battery.
Battery TypeLGM 50
Anode/Cathode materialGraphite and SiOy/LiNi0.8Co0.1MnO0.1
Cut-off voltages (V)2.5–4.2
Nominal voltage (V)3.63
Nominal capacity (Ah)5
Operating temperature (°C)0–50
Max discharge current (A)1.5 C
Dimensions (mm) ϕ 20 × 70
Battery mass (g)68.3
Table 2. Degradation parameters.
Negative ElectrodePositive Electrode
SymbolDefinitionDefault ValueReferenceDefault ValueReference
D s o l Solvent diffusivity in SEI2 × 10−21[23]--
k L i Li plating/stripping rate constant7.5 × 10−5[26]--
γ 0 Rate constant for dead Li formation1 × 10−9[26]--
k c r Paris’ law cracking rate3.9 × 10−20[28]3.9 × 10⁻²⁰[28]
β Loss of active material proportional term2.78 × 10−8[31]2.78 × 10⁻⁸[31]
Table 3. Cycling protocol for the degradation modeling.
TestsProcedure
Reference performance test (RPT)(1)  Constant current (CC) charge at 0.5 C to 4.2 V
(2)  Constant voltage (CV) charge at 4.2 V until current < C/100
(3)  Rest for 1 h
(4)  CC discharge at 0.3 C to 2.5 V
(5)  Rest for 1 h
Cycling test(1)  CC charge at 0.5 C to SOC upper limit
(2)  Rest for 60 s
(3)  CC discharge at 1 C to SOC lower limit
(4)  Rest for 60 s
(5)  Loop Step (1) to (4) for 100 equivalent full cycles
Disclaimer/Publisher’s Note: The statements, opinions and data contained in all publications are solely those of the individual author(s) and contributor(s) and not of MDPI and/or the editor(s). MDPI and/or the editor(s) disclaim responsibility for any injury to people or property resulting from any ideas, methods, instructions or products referred to in the content.

