Article

Average Model of Switched-Energy-Tank Battery Equalizer for Accelerated Performance Assessment †

Department of Electrical, Electronic and Computer Engineering, University of Ulsan, Ulsan 44610, Republic of Korea
*
Author to whom correspondence should be addressed.
This paper is an extended version of our paper published in P.-H. La; S.-J. Choi Unified Average Model of Switched-Passive-Network Equalizer for Performance Assessment in Long-Term Simulations. In Proceedings of the 2022 IEEE Transportation Electrification Conference and Expo (ITEC), Anaheim, CA, USA, 15–17 June 2022.
Energies 2024, 17(3), 631; https://doi.org/10.3390/en17030631
Submission received: 22 December 2023 / Revised: 17 January 2024 / Accepted: 25 January 2024 / Published: 28 January 2024
(This article belongs to the Special Issue Advanced Energy Storage Technologies and Applications (AESAs))

Abstract

:
Assessing the performance of active balancing methods poses a significant challenge due to the time required to replicate the equalization of various balancing techniques under identical initial cell conditions. Conventional circuit simulation methods, designed for high-frequency switching behavior, impose a considerable computational burden when applied to the long-term equalization of battery cells. To address this challenge, this paper presents an efficient performance evaluation method employing an average equivalent model of the equalizers. By representing the charge transfer mechanism inherent to the equalization process, the proposed approach is compatible with the most widely used switched-energy-tank equalizers. The validity of this method is confirmed through simulation and experimental results. In the case of four series-connected battery cells, our proposed approach can assess the performance of a three-hour equalization process in just one minute of execution time. The use cases in the paper highlight the practical feasibility of the AM in facilitating performance comparisons of SET-Es under various initial conditions.

1. Introduction

Energy storage systems are the backbone of electric vehicles (EVs) and battery energy storage systems (BESSs), since they take over 50% of the cost breakdown analysis [1]. To make a battery pack, battery cells are connected in parallel to enlarge the pack capacity and in series to increase the operating voltage of the battery pack. For illustrative purposes, an EV battery pack consists of various modules connected in series. For one battery module, if m cells are connected in parallel to form a group or a brick and n groups are docked in series, this configuration is called an nSmP module. While these cells undergo screening and classification for their characteristics before assembly [2,3,4], inherent manufacturing tolerances result in performance disparities [5,6]. As time elapses, the influence of aging exacerbates these discrepancies, thereby raising the risk of partial overcharging or over-discharging within individual cells [7,8] in both series and parallel connections. Since the number of series connections is much higher than the parallel connection number, the cell inconsistency in series connections is more serious [9].
Many research efforts have observed the importance of battery equalization for the performance of the series battery string. The equalizing techniques are classified into passive and active methods [10,11,12]. Although passive methods are widely adopted in industrial applications, the energy dissipation scheme suffers from poor equalizing speed and efficiency [13,14,15,16]. On the contrary, various active equalization methods have been introduced to overcome the disadvantages of passive methods. Active methods transfer energy from high-voltage cells to low-voltage cells via an energy tank. Such an energy tank can be a converter [17,18,19,20,21,22,23], an inductor in the switched-inductor equalizer (SI-E) [24,25,26], a capacitor in the switched-capacitor equalizer (SC-E) [27,28,29,30,31], or a resonance circuit in the switched-resonance equalizer (SR-E) [32,33,34]. Due to their high equalizing capabilities and efficiency, as well as the similarity of their operations, they can be referred to as switched-energy-tank equalizers (SET-Es).
Performance assessment by simulation is a critical step before hardware implementation in order to minimize the trial and error in achieving a good equalizer design [35,36]. In order to ensure a fair comparison for various equalizers, the simulations are preferred to the actual battery experiments since it is difficult to completely exclude the extraneous effects in the actual experiments [37,38,39,40]. Additionally, the simulation is most effective when testing multiple scenarios with different cell voltage distributions in order to verify the performance consistency and reliability of the equalizers.
In general, the charge transfer of SET-Es is steered by high-frequency switching of the equalizer. Thus, the switching-model-based simulation of SET-Es usually requires a small simulation time step size [41]. Therefore, a long execution time is needed to complete the hours of the equalizing process [42]. In addition, large computation and memory resources are required to process the simulated data [43,44,45]. Therefore, exact switching simulations in the most popular circuit simulators such as PSIM, Plecs, or MATLAB are not so effective in assessing a long-term battery equalizing process [46,47,48].
Two viable approaches to mitigate the issue are battery capacity scale-down and hardware-in-the-loop simulation. The most simple approach is the scaling technique, where the battery capacity is scaled down to accelerate the equalizing process; thus, the execution time can be reduced [33,49]. For a similar purpose, the battery is replaced by a capacitor with a large capacitance value to simplify the battery behavior to reduce the overall computational burden. However, the behavior of the equalizer in the miniaturized system deviates from the original one [50].
On the other hand, real-time simulation based on hardware-in-the-loop (HIL) equipment, such as Typhoon HIL, RT-box, or OPAL-RT, can be an alternative way to accelerate the equalizer simulation [42,51,52]. By virtue of their strong computation power, without capacity scale-down, the execution time exactly reflects the simulation time. However, the equipment is costly, and the number of circuit components to be simulated is usually limited by the number of computational cores in the HIL equipment. Furthermore, the real-time simulator only guarantees an execution time equal to the simulation time, which remains inefficient for testing multiple cell balancing scenarios and prolongs the development process. For an illustration, the following assumptions should be taken into account. If 1 A constant current equalizes 100 Ah battery, days of execution time are required to finish a single process, and more time is essential for the multiple test scenarios.
Like the state-space average model that substitutes the switching cell in the DC/DC converter, it is necessary to represent the switching elements in the equalizer by an average model to accelerate the simulation for evaluating the long-term equalizing performance under various scenarios [53,54,55,56,57]. Furthermore, the average model should be universal, such that it is compatible with the most popular SET-Es. Although conventional studies of the dedicated models for the individual equalizer topology exist, a versatile average model should be developed to fairly compare their performance under different scenarios with a fast execution time. Therefore, this paper introduces an average model (AM)-based simulation that will accelerate the long-term simulations for effective evaluation of the equalizing performance. This paper proposes an accelerated performance assessment for the switched-energy-tank equalizers. In the remainder of this paper, Section 2 describes the proposed AM simulation, Section 3 verifies the feasibility with several comparative tests, Section 4 provides the use cases of the AM to assess the equalizing performance in various test scenarios, and Section 5 draws the conclusions.

2. Accelerated Performance Assessment of the Long-Term Operation

2.1. Model Configuration

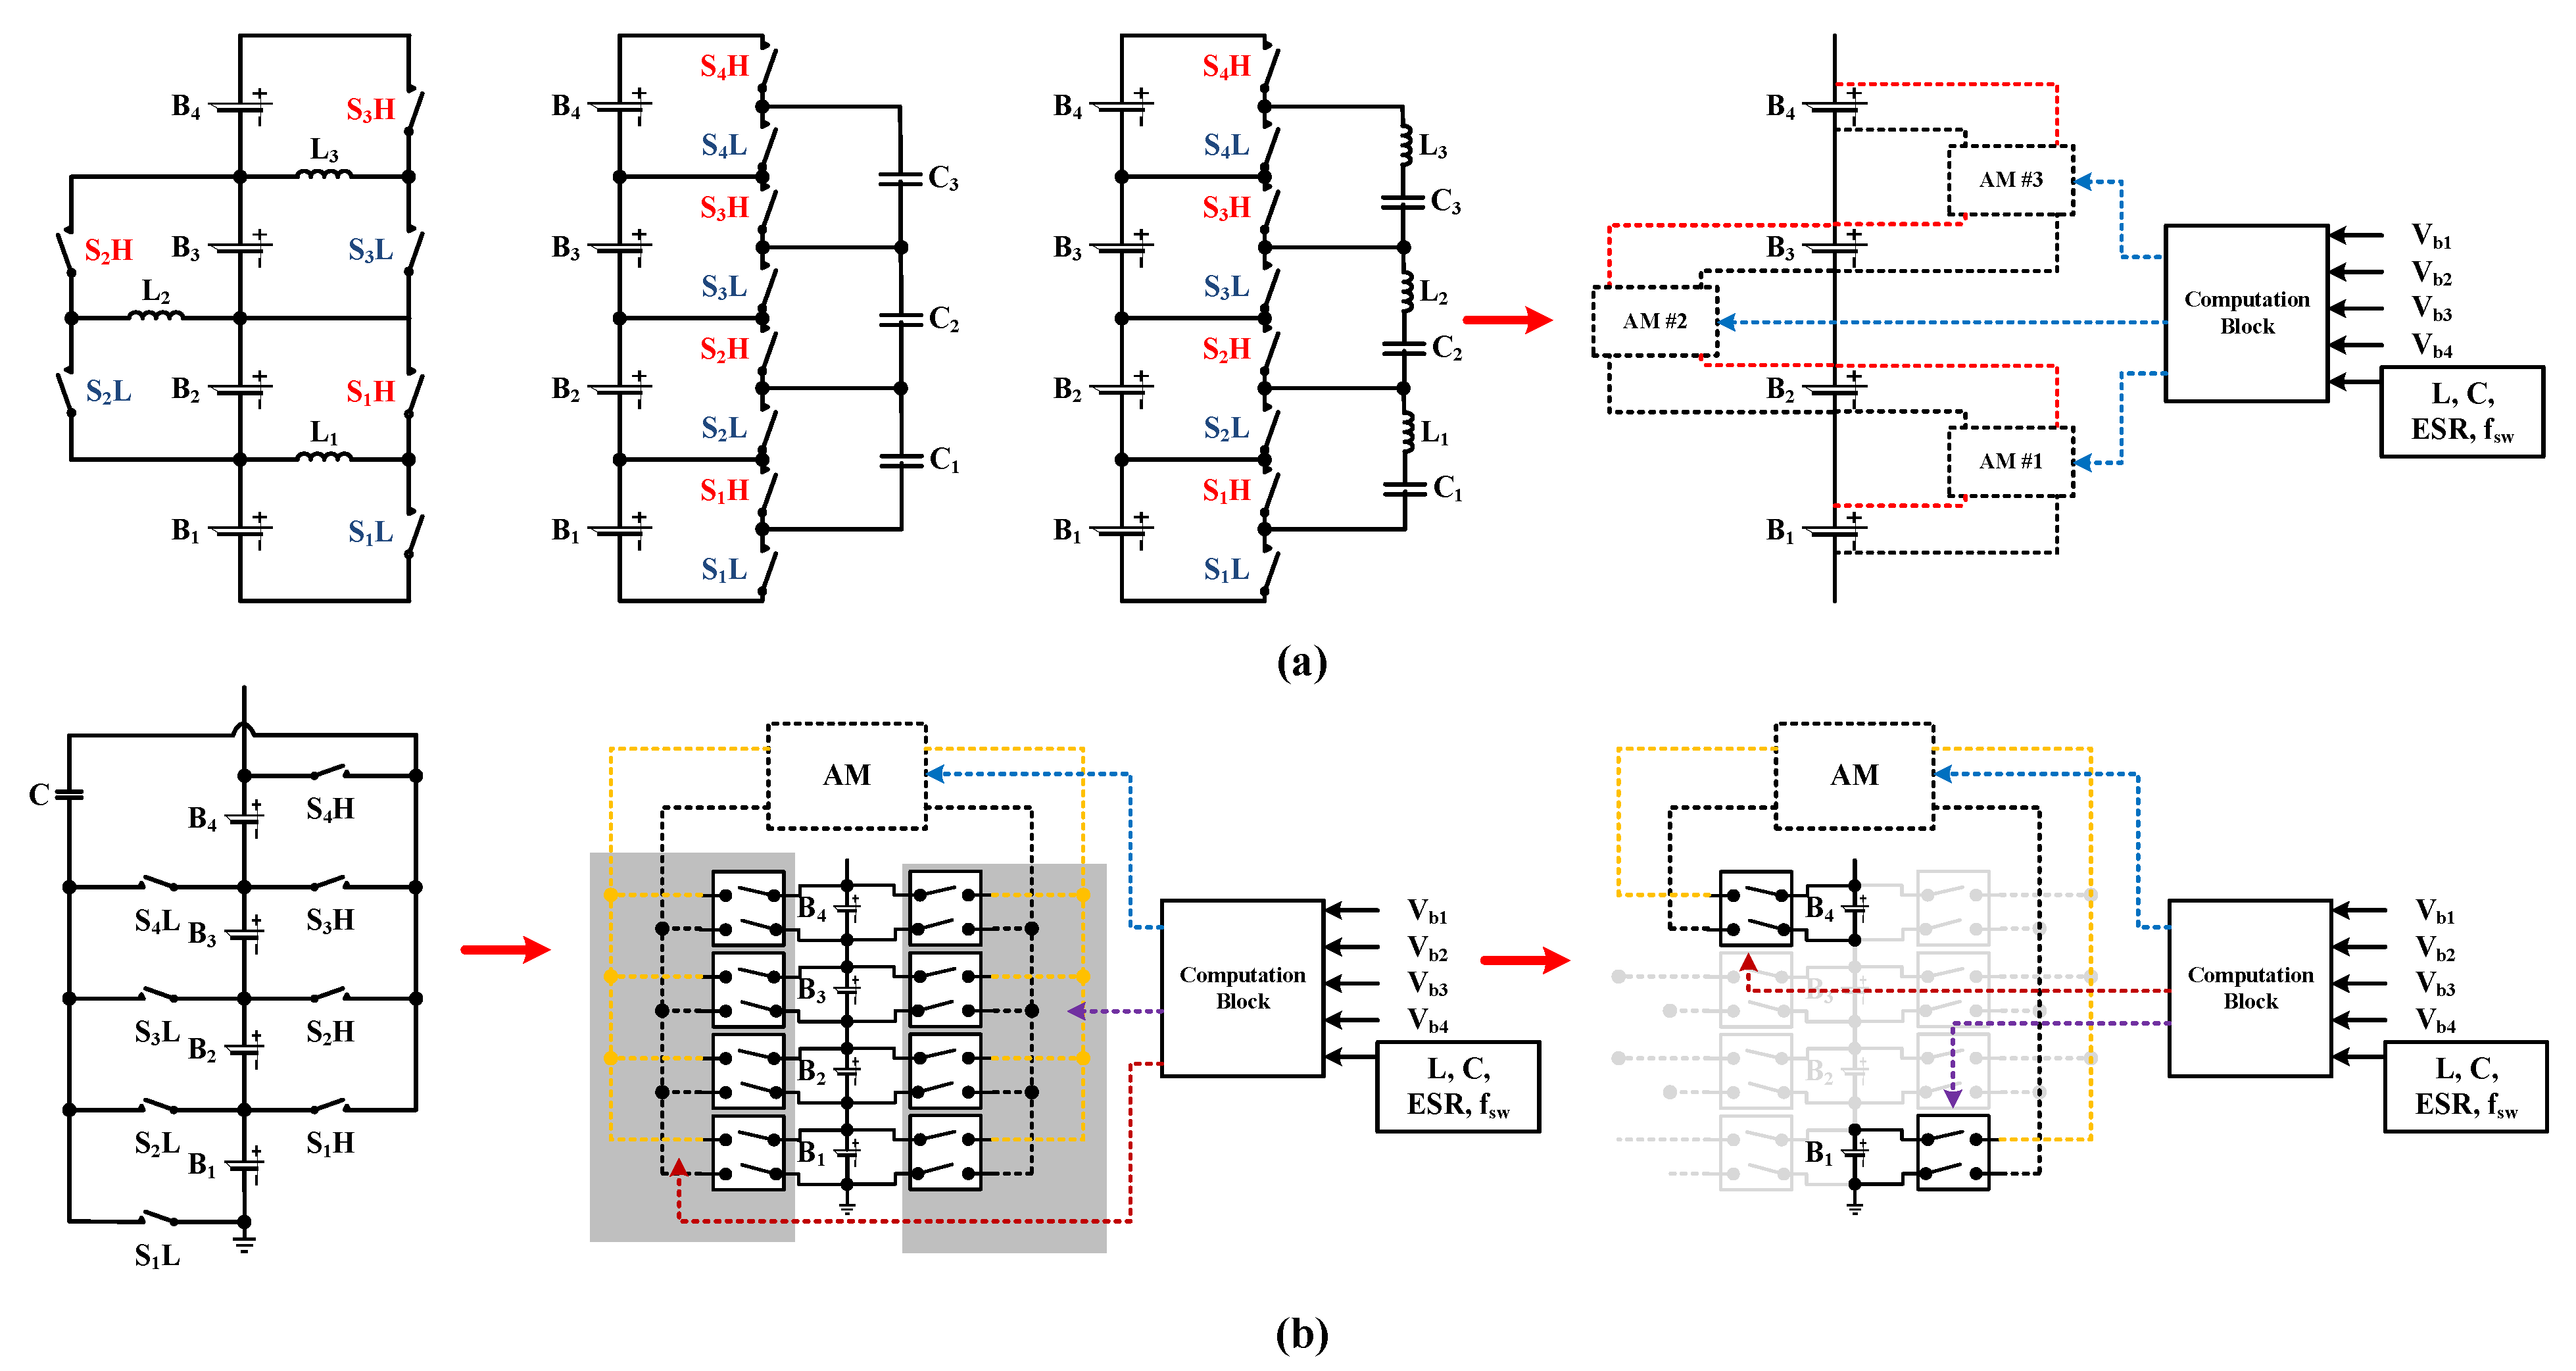
As mentioned, the SET-Es are the most effective methods among active balancing catalogs. Although various topology configurations and control principles for SET-Es have been introduced, they have a similar energy exchange mechanism. For illustrative purposes, the following topology configurations are assessed in this paper: the switched-inductor equalizer (SI-E) [24], the switched-capacitor equalizer (SC-E) [27], the switched-resonance equalizer (SR-E) [32], and the switch-matrix capacitor equalizer (SMC-E) [31]. Based on the step-by-step operation in Figure 1a–d, the energy exchange mechanism of the SET-Es can be presented as the simplified circuit for two adjacent cells in Figure 2a, where an energy tank acts as an energy carrier. Assuming that cell B 1 has a higher energy level than cell B 2 , one equalizing cycle is divided into two phases.
  • Phase A: In Figure 1a–c, the switches S 1 H and S 2 H are turned on, and thus, the energy tank is charged from cell B 1 . By the same token, the switches S 1 H and S 1 L are activated for the SMC-E, as in Figure 1d. In the sense of average, the energy tank is charged by an average equalizing current, I a v g 1 .
  • Phase B: The switching pattern is changed to transfer the energy from the energy tank to cell B 2 . In Figure 1a–c, the switches S 1 L and S 2 L are activated while the other switches are turned off. Similarly, the switches S 2 H and S 2 L of the SMC-E in Figure 1d are turned on to do the same task. Likewise, cell B 2 is charged by an average current, I a v g 2 .
By alternating phase A and phase B, energy is gradually transferred from the high-voltage cell to the low-voltage cell. Depending on the control algorithm, the energy transfer process can be executed either in an autonomous or governed way.
In order to average the circuit in Figure 2a, the equivalent resistor, R E Q , model is proposed in [58,59]. In this model, the switching block SET-E enclosed by the dashed box in Figure 2a is replaced by an equivalent resistor in Figure 2b, so that the energy exchange occurs due to the voltage difference between the two cells. However, the average balancing currents of two cells are arranged to be the same in this model, which is far from the operation principle of the SET-Es. Since the average value of the tank current, i b a l , is not completely zero, the balancing currents of the two cells can be different from each other. Furthermore, the R E Q model only considers conduction losses; it fails to accurately describe the equalizing process [54,60].
Instead, the equalizing process should be represented by the amount of charge that flows into or out of two cells. In the proposed average model (AM) shown in Figure 2c, two controlled-current sources, I a v g 1 and I a v g 2 , are utilized to emulate the energy exchange. The direction of two dependent current sources in the model denotes the discharging current for each cell. Hence, the actual direction of the equalizing current will be determined by the sign of the voltage deviation between two cells. A detailed analysis is provided in Section 2.2.
Since one AM block represents just one equalizer block consisting of two switches and one energy tank, the topological configuration and control strategy determine the required number of AMs. For the purpose of illustration, the AM is applied to the various SET-Es, as shown in Figure 3. For the single-tier autonomous equalizer types, such as SI-E, SC-E, and SR-E in Figure 3a, a string of N battery cells requires ( N 1 ) blocks of the AM to represent the equalizing process between the adjacent cells. On the other hand, the governed SET-Es are replaced by just one AM block and a switch-matrix to route the energy transfer path, as in Figure 3b. In this case, the energy is transferred directly from the highest-voltage cell to the lowest-voltage cell by virtue of the switch-matrix function.

2.2. Average Model Derivation

A critical step in constructing an AM is identifying the average current flowing in or out of the cell during the equalizing process. In this subsection, the average current is formulated for various balancing schemes.

2.2.1. Switched-Capacitor Equalizer (SC-E) and Switch-Matrix Capacitor Equalizer (SMC-E)

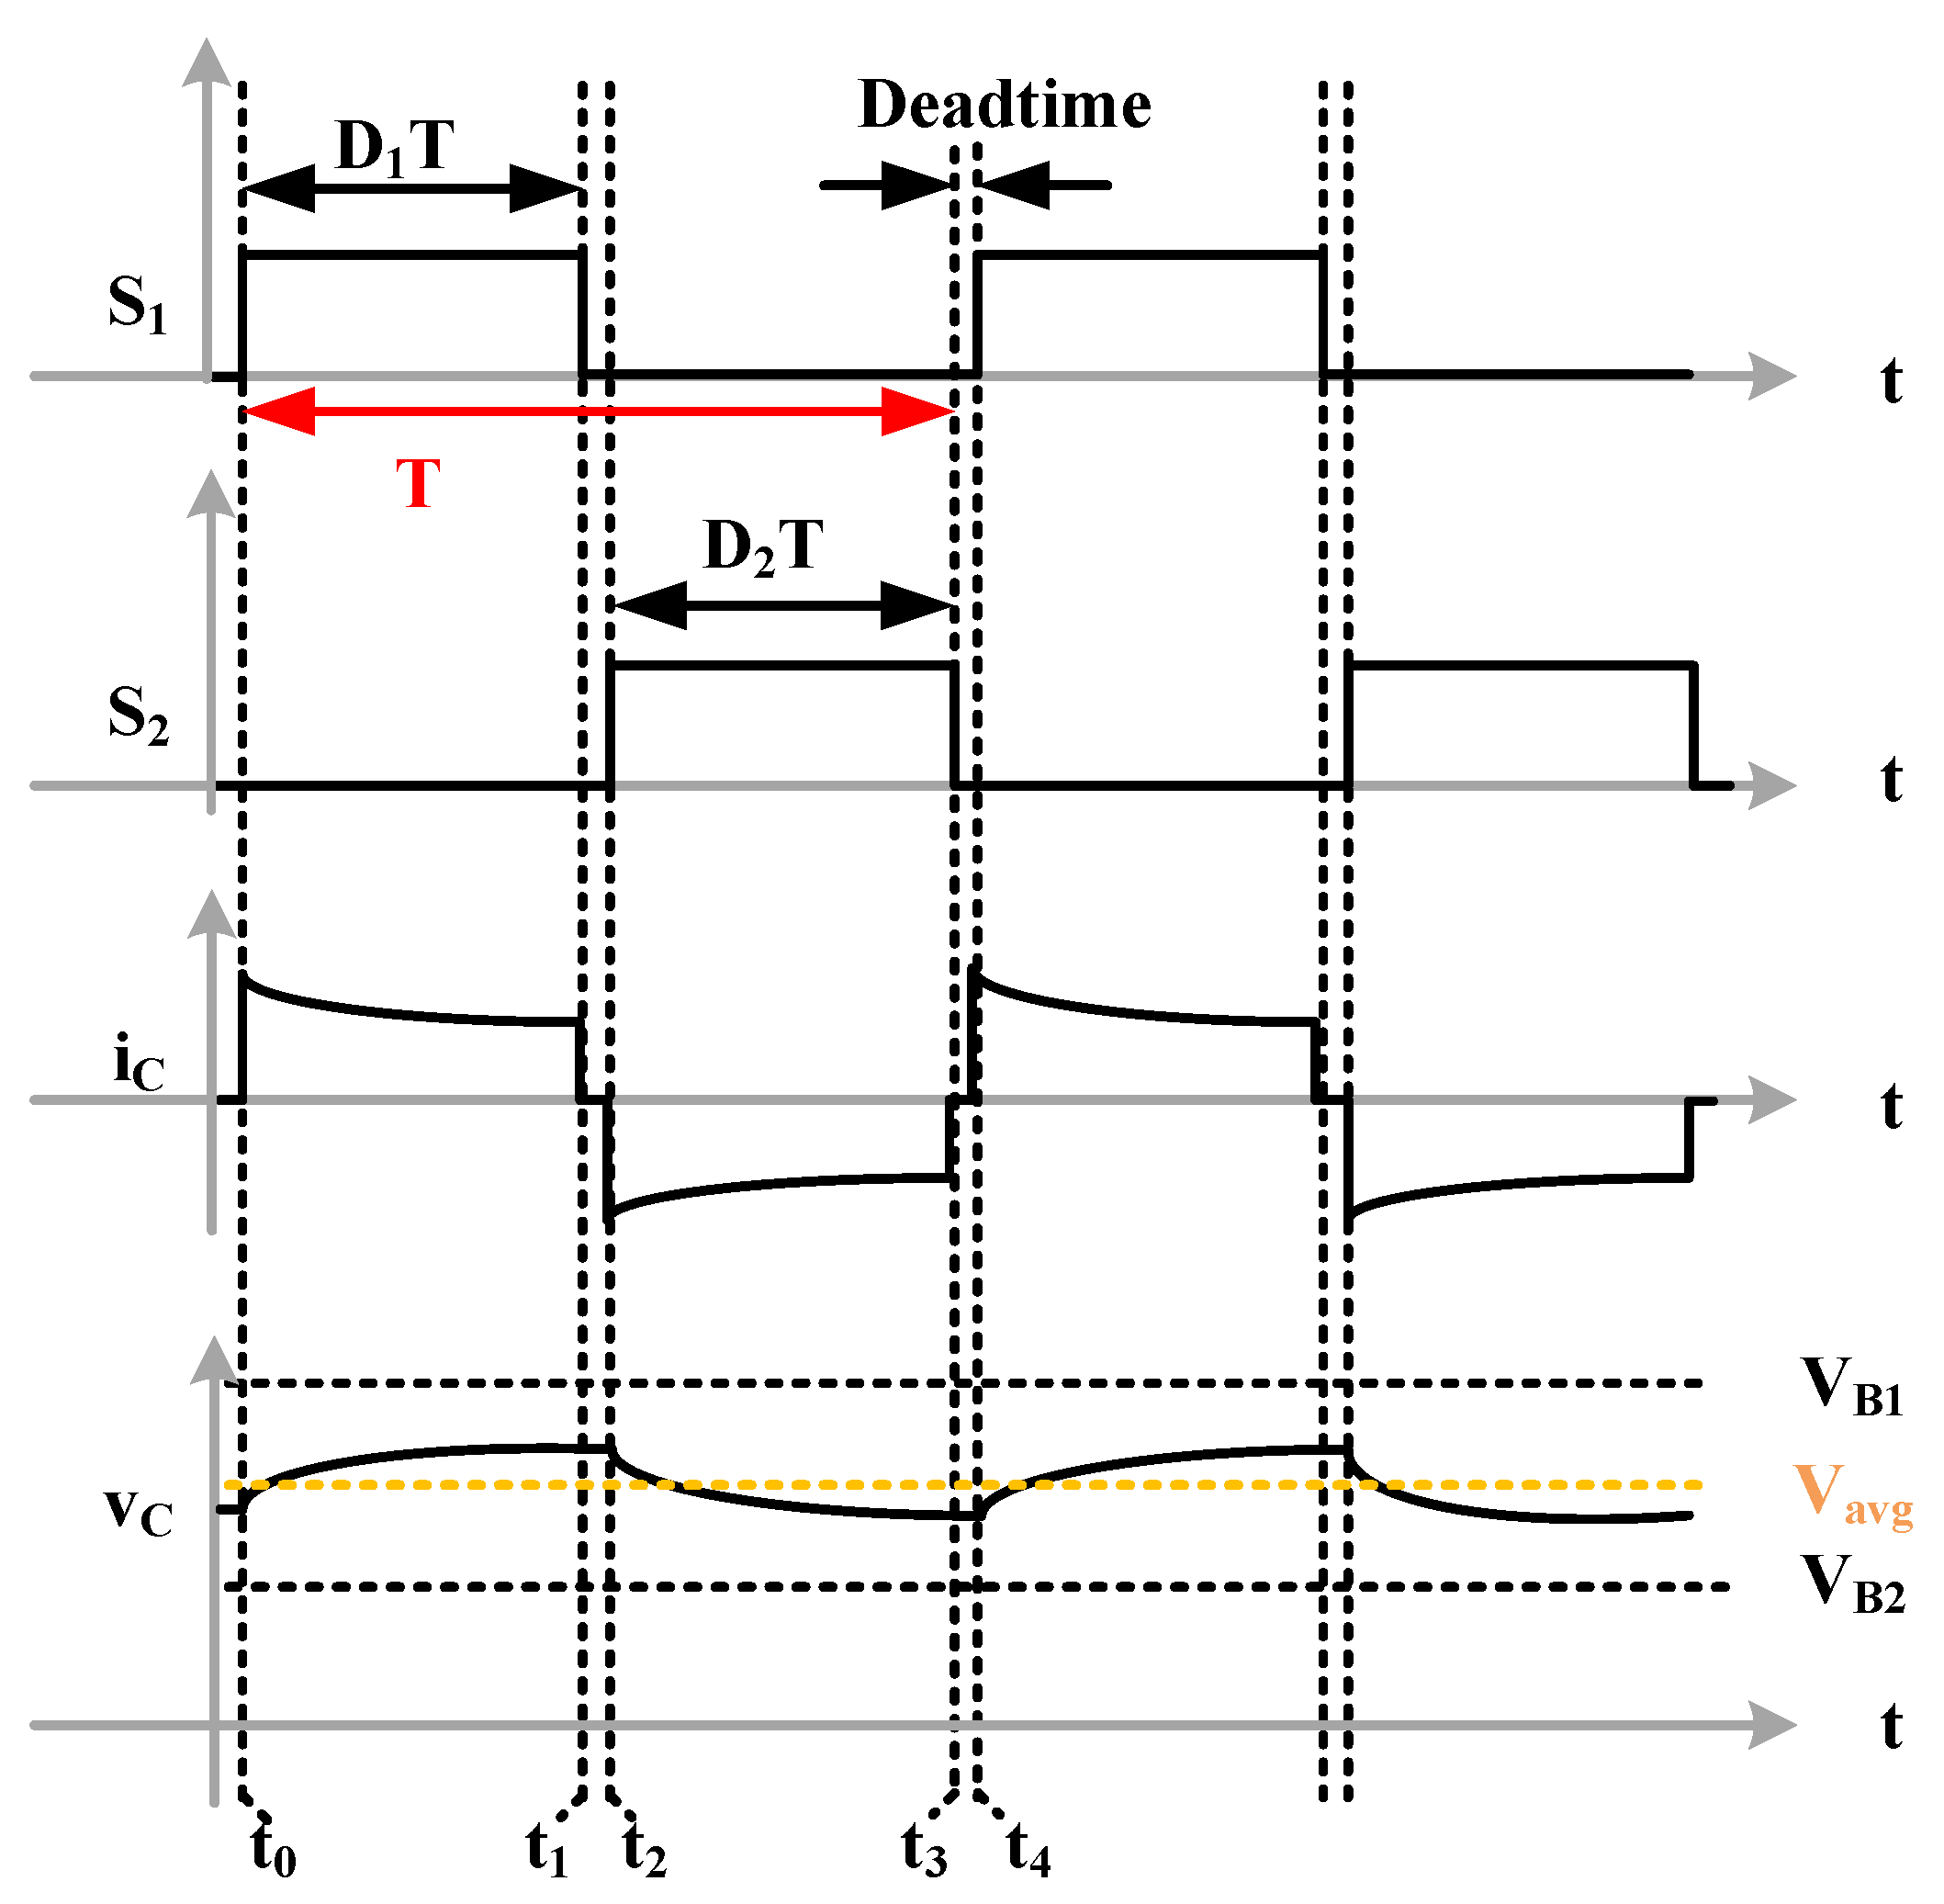
In terms of the operation principle, both SC-Es and SMC-Es have a similar switching scheme, which can be represented by the equivalent circuit in Figure 2a. In more detail, the theoretical waveform in Figure 4 shows the voltage and current of the capacitor. We denote R 1 and R 2 as the total circuit resistance, including the wiring resistances, the battery internal impedance, the ESR of the energy tank, and the on-resistance of the MOSFET. Since the energy tank in the SC-E and SMC-E is a capacitor, we can denote τ 1 and τ 2 as the R C time constants and v c ( t ) as the instantaneous voltage of the capacitor at t. Please note that t 0 to t 1 demonstrate phase A of the equalizing process, t 2 to t 3 reflect phase B, while t 1 to t 2 and t 3 to t 4 are the deadtime between the two phases. Therefore, the instantaneous current in cell # 1 is expressed as
τ 1 = R 1 C ,
i 1 ( t ) = V B 1 v c ( t 0 ) R 1 e x p t + t 0 τ 1 .
Next, the amount of charge stored in the capacitor from cell # 1 is calculated by
Q i n = t 0 t 1 i 1 ( t ) d t = C V B 1 v c ( t 0 ) 1 e x p D 1 f s w τ 1
where f s w is the switching frequency of the switches and D 1 is the duty cycle ratio of the phase A ( t = t 0 t 1 ).
Similarly, the instantaneous current and the charge increment of cell # 2 are calculated, respectively, by
τ 2 = R 2 C ,
i 2 ( t ) = v c ( t 2 ) V B 2 R 2 e x p t + t 2 τ 2
Q o u t = t 2 t 3 i 2 ( t ) d t = C ( v c t 2 ) V B 2 1 e x p D 2 f s w τ 2 e x p 1 2 f s w τ 2 .
where D 2 is their duty cycle ratio of the phase B ( t = t 2 t 3 ). In most cases, the time constant τ 1 and τ 2 are much larger than the period of one equalizing cycle. Hence, the average capacitor voltage is approximately equal to the duty weighted time average of two cell voltages.
V c _ a v g = D 1 V B 1 + D 2 V B 2 D 1 + D 2 .
Furthermore, if the duty ratio of phase A and phase B of the SC-E and the SMC-E are equal, D 1 = D 2 , the average voltage becomes V c _ a v g = V B 1 + V B 2 2 . Therefore, the averaged balancing current of cells # 1 and # 2 are calculated by
I a v g 1 = Q i n f s w = 1 2 C f s w V B 1 V B 2 1 e x p D 1 f s w τ 1
and
I a v g 2 = Q o u t f s w = 1 2 C f s w V B 2 V B 1 1 e x p D 2 f s w τ 2 e x p 1 2 f s w τ 2 .
By applying (8) and (9) to the AM in Figure 2c, the equalizing process can be simulated. The direction of the equalizing currents, I a v g 1 and I a v g 2 , is decided by the voltage difference between the two cells. Hence, cell # 1 is discharged by I a v g 1 while cell # 2 is charged by I a v g 2 . The amplitude and the direction of the average equalizing currents are continuously updated by (8) and (9) during the simulation.

2.2.2. Switched-Resonant Equalizer (SR-E)

The SR-E is an extension of the SC-E, where one additional inductor, L, is connected in series to the equalizing capacitor for the resonant operation. The charge transfer process is similar to the SC-E. Note that the damped resonant frequency for the m-th cell is
ω r m = 1 L C β m 2
where β m = R m 2 L with ( m = 1 , 2 ), and R m is the loop resistance. Then, the charge increment and decrement in the capacitor are calculated by
Q i n = C V B 1 V c _ a v g 1 + e x p β 1 π ω r 1
Q o u t = C V c _ a v g V B 2 1 + e x p β 2 π ω r 2 .
By the same token as the SC-E in Section 2.2.1, the average equalizing currents of the cells are expressed by
I a v g 1 = 1 2 C f s w V B 1 V B 2 1 + e x p β 1 π ω r 1
I a v g 2 = 1 2 C f s w V B 2 V B 1 1 + e x p β 2 π ω r 2 .

2.2.3. Switched-Inductor Equalizer (SI-E)

In the SI-E, two switches and one inductor operate as a buck-boost converter. The average inductor current is studied in [24] and is summarized as follows:
I L = D V B 1 ( 1 D ) V B 2 D 2 ( R 1 + R L ) + ( 1 D ) 2 ( R 2 + R L )
where D is the duty ratio of phase A; R 1 and R 2 are the total series resistance, including on-resistance of the switch and the battery internal resistance for each cell, respectively; R L is the internal resistance of the inductor. Therefore, the equalizing currents of two cells are calculated, respectively, by
I a v g 1 = D I L
I a v g 2 = ( 1 D ) I L .

3. Model Verification

In Section 3.1, to test the accuracy of the proposed AM, the cell voltage profiles obtained by three different methods—hardware experiments, a switching model implemented on a real-time simulation system (RTSS), and a proposed model implemented on PSIM—are compared for SMC-E topology. In Section 3.2, the AM is applied for various topological configurations, and the simulation results of the proposed model are compared with those of other conventional methods.

3.1. Validation of Model Accuracy

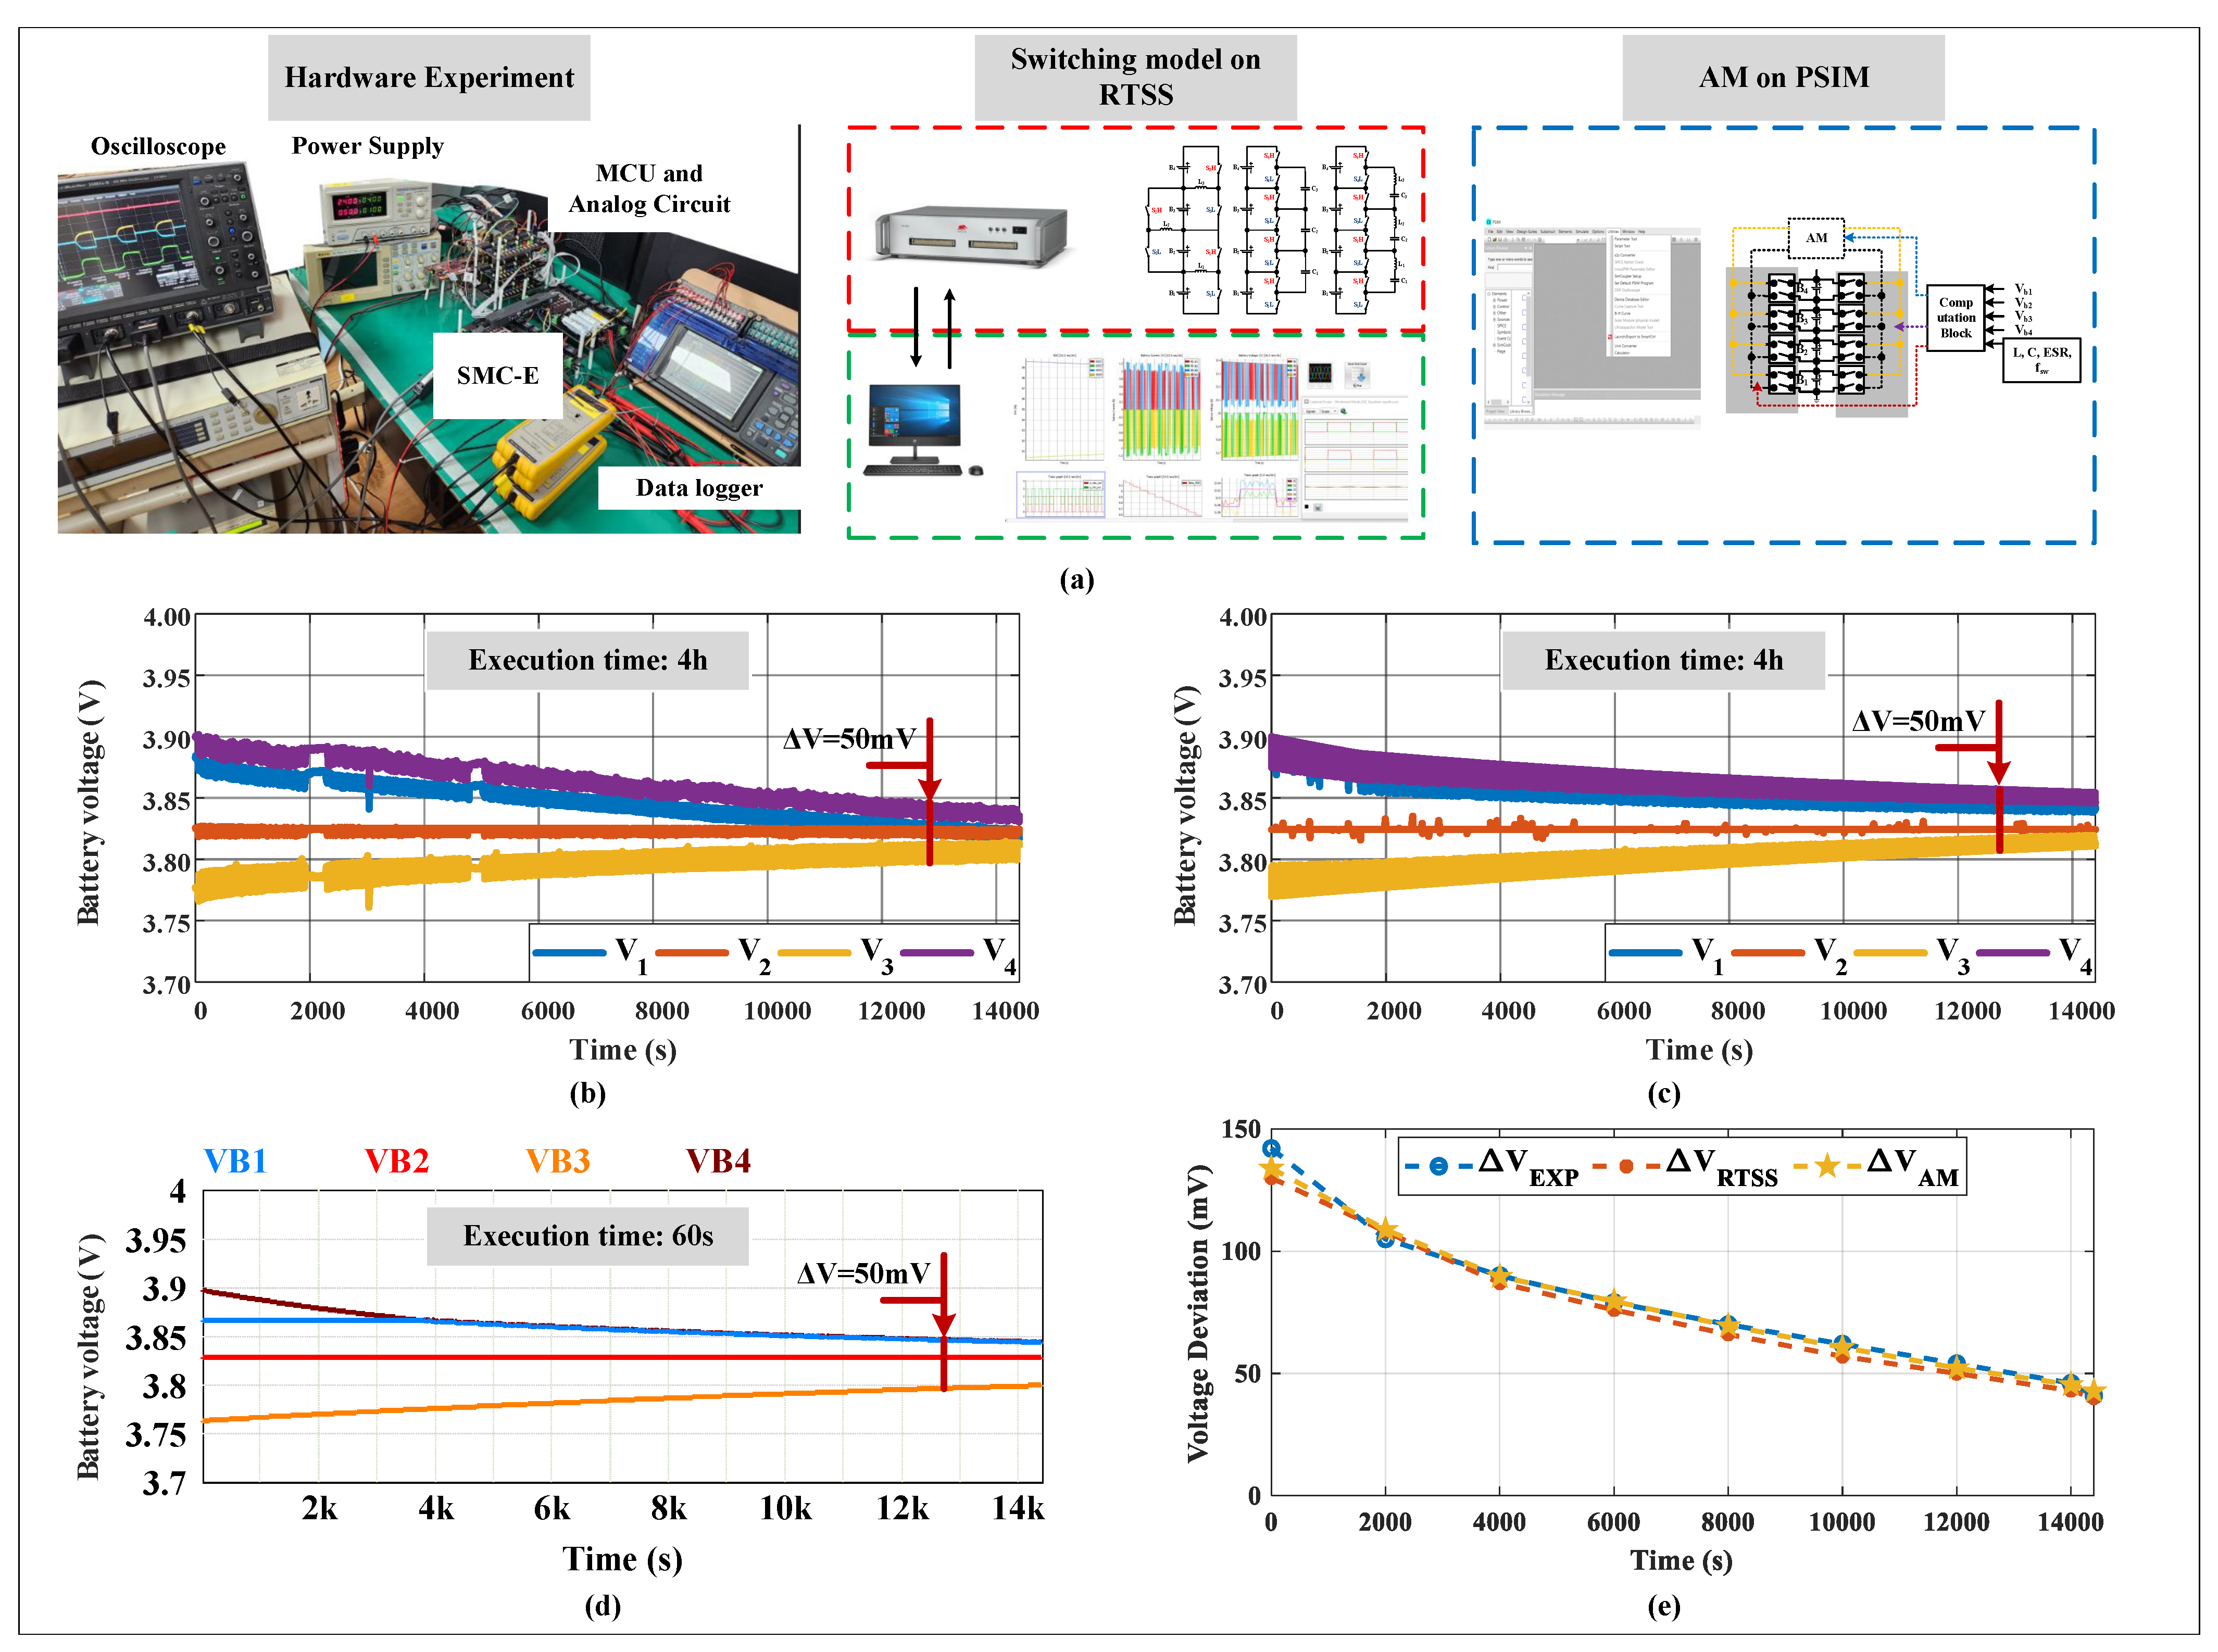
To assess the accuracy of the proposed average model, the cell voltage profiles are compared for the SMC-E. The profiles are observed from the equalizing process by the hardware experiment, by the switching model using the RTSS, and by the AM using the PSIM. In every test, 4 h (14,400 s) of the equalizing process for a 4S1P battery string (four cells are connected in series) is evaluated, and the test setups of each platform are illustrated in Figure 5a. In the tests, the RTSS is implemented by the Typhoon HIL 602+ system, which provides the battery model and the switching model of the equalizers. One second of simulation in the RTSS corresponds to one second in real time. Thus, the execution time of the RTSS can be used as a reference for the speed comparison. The battery models in the RTSS and AM are configured based on the characteristics of the 18650 NMC 3.6 V/2.6 Ah cells. In the hardware experiment and the RTSS, the cell voltage profiles are recorded by a data logger and then are plotted by MATLAB software, version R2022B. Similarly, the cell voltage profile of the AM is plotted directly by the PSIM simulation software, version 2022.2.
In every test, the switching frequency is 20 kHz, the duty ratios of two phases, D 1 and D 2 , are evenly set to 0.45, the equalizing capacitance, C, is 2200 µF, and the series circuit resistance in two phases, R 1 and R 2 , is 0.2 Ω . In addition, the initial SOC levels of the cells are set to S O C 1 , 2 , 3 , 4 = 65 , 58 , 40 , 70 [ % ] . To set the initial SOC levels of the cells in the hardware experiment, the cells are fully charged and then discharged to those SOC levels.
The cell voltage profiles obtained from the hardware experiment, RTSS simulation, and AM simulation are illustrated in Figure 5b–d, respectively. The trend lines of the profiles show a homogeneous equalizing pattern of the SMC-E, where the voltage deviation between the highest-voltage cell and the lowest-voltage cell reaches less than 50 mV after nearly the same amount of time for each case. For clearer visualization, the cell voltage deviation profiles are calculated and illustrated as shown in Figure 5e. The cell voltage deviation profiles show just a trivial difference between the three methods, which verifies the accuracy of the proposed model. From the perspective of the execution time, both the hardware experiment and the RTSS test require approximately 4 h to finish the equalizing process, while the AM simulation only needs 60 s to do the same task. Therefore, the proposed method can dramatically accelerate the equalizer simulation.

3.2. Performance Comparison with the R E Q Model for Various Equalizer Topologies

Once the model’s accuracy of the AM-based simulations for the SMC-E is verified, the AM-based simulation is also compared with the conventional average method, the R E Q model, for three other autonomous single-tier equalizers (SI-E, SC-E, and SR-E). Because the switching model in the RTSS and the hardware experiment show similar performances, the RTSS-based simulation is utilized as a reference for the other tests.
The main idea of the R E Q model is to average the equalizer as an equivalent resistor [49,59,61]. In this method, the series connection of the cells is transformed into a parallel connection [62], as shown in Figure 6. The R E Q formula for the various equalizer structures is inherited and is summarized as follows:
  • The SC-E and the SMC-E [31]:
    R E Q = 1 f s w C e D 1 f s τ 1 e D 2 f s τ 2 1 e D 1 f s τ 1 1 e D 2 f s τ 2 1
    where the parameters are defined in Section 2.2.1.
  • The SR-E [55]:
    R E Q = 1 f s w C t a n h 1 2 β 1 π ω r 1 + t a n h 1 2 β 2 π ω r 2
    where the parameters are defined in Section 2.2.2.
  • The SI-E [24]:
    R E Q = R L + ( 1 D ) R 1 + D R 2 ,
    where the parameters are defined in Section 2.2.3.
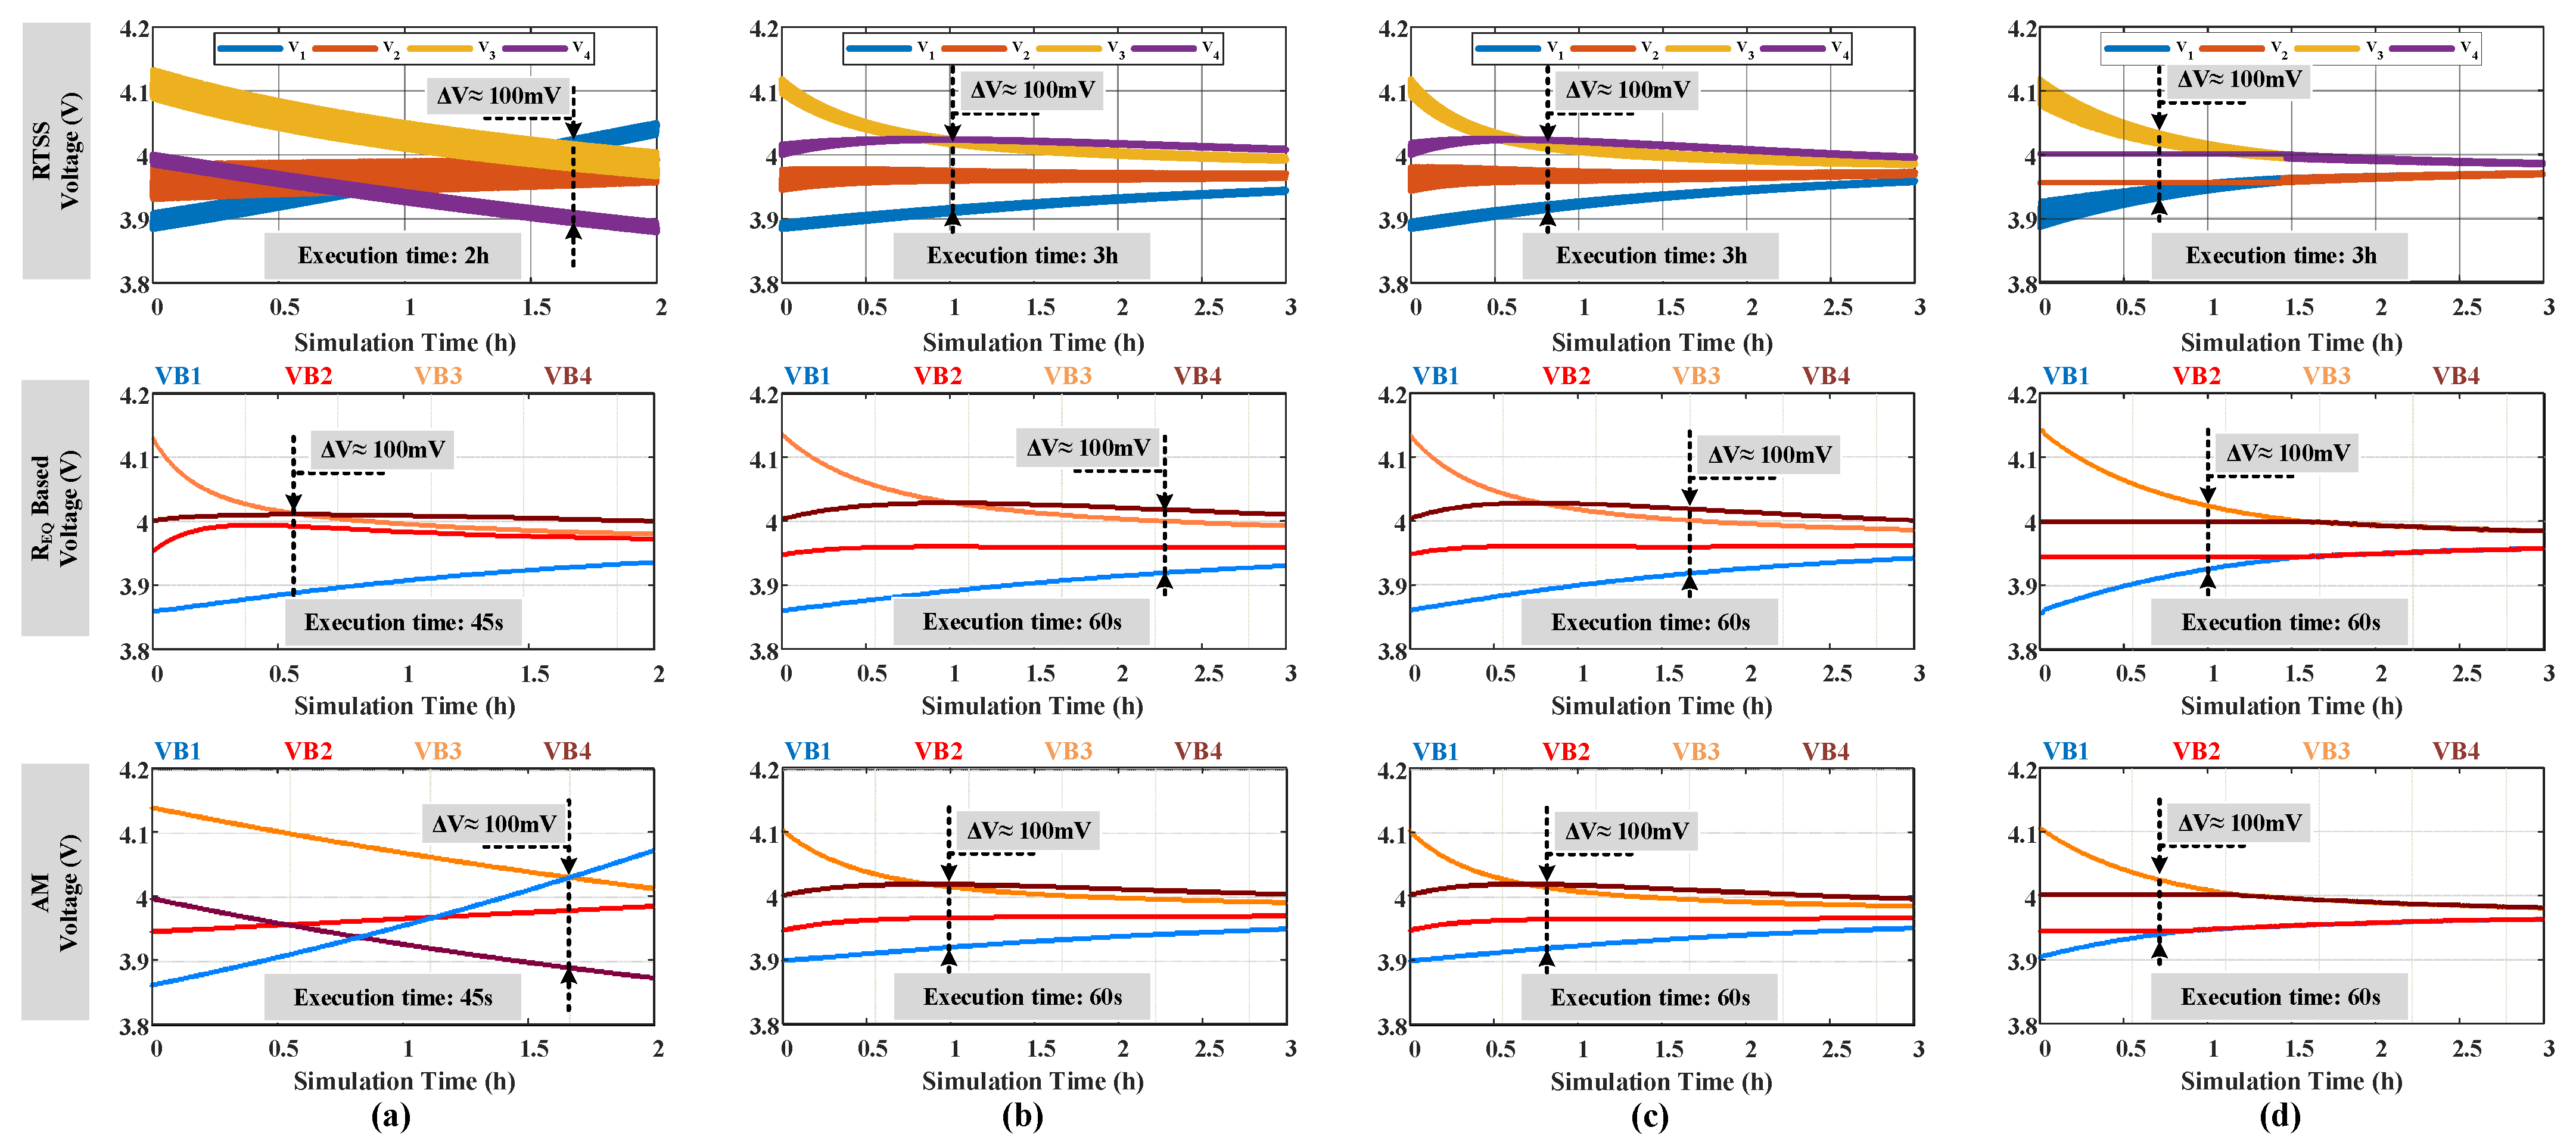
Four equalizers are implemented for a 4S1P battery string (18650 NMC cell 3.6 V/2.6 Ah) by the RTSS, R E Q model, and AM simulations. In addition, the circuit parameters are summarized in Table 1, where f s w is the switching frequency; L is the equalizing inductance; C is the equalizing capacitance; R 1 and R 2 are the series resistances, including the parasitic resistances of the components and wiring; D and D 1 are the duty ratio for phase A; D 2 is the duty ratio for phase B. In every test, the initial voltage of the balancing capacitor, v c ( t k ) , is set to zero. For the SI-E, SC-E, and SR-E, energy can be exchanged between two adjacent cells, and thus, the switches are controlled by a complementary PWM signal-pair to autonomously transfer energy, as in Figure 3a. On the contrary, the SMC-E can directly transfer energy from the highest voltage cell to the lowest voltage cell by switch-matrix routing, as in Figure 3b. Considering the inherent speed difference, the total simulation time is set to 2 h for the SI-E and 3 h for the others.
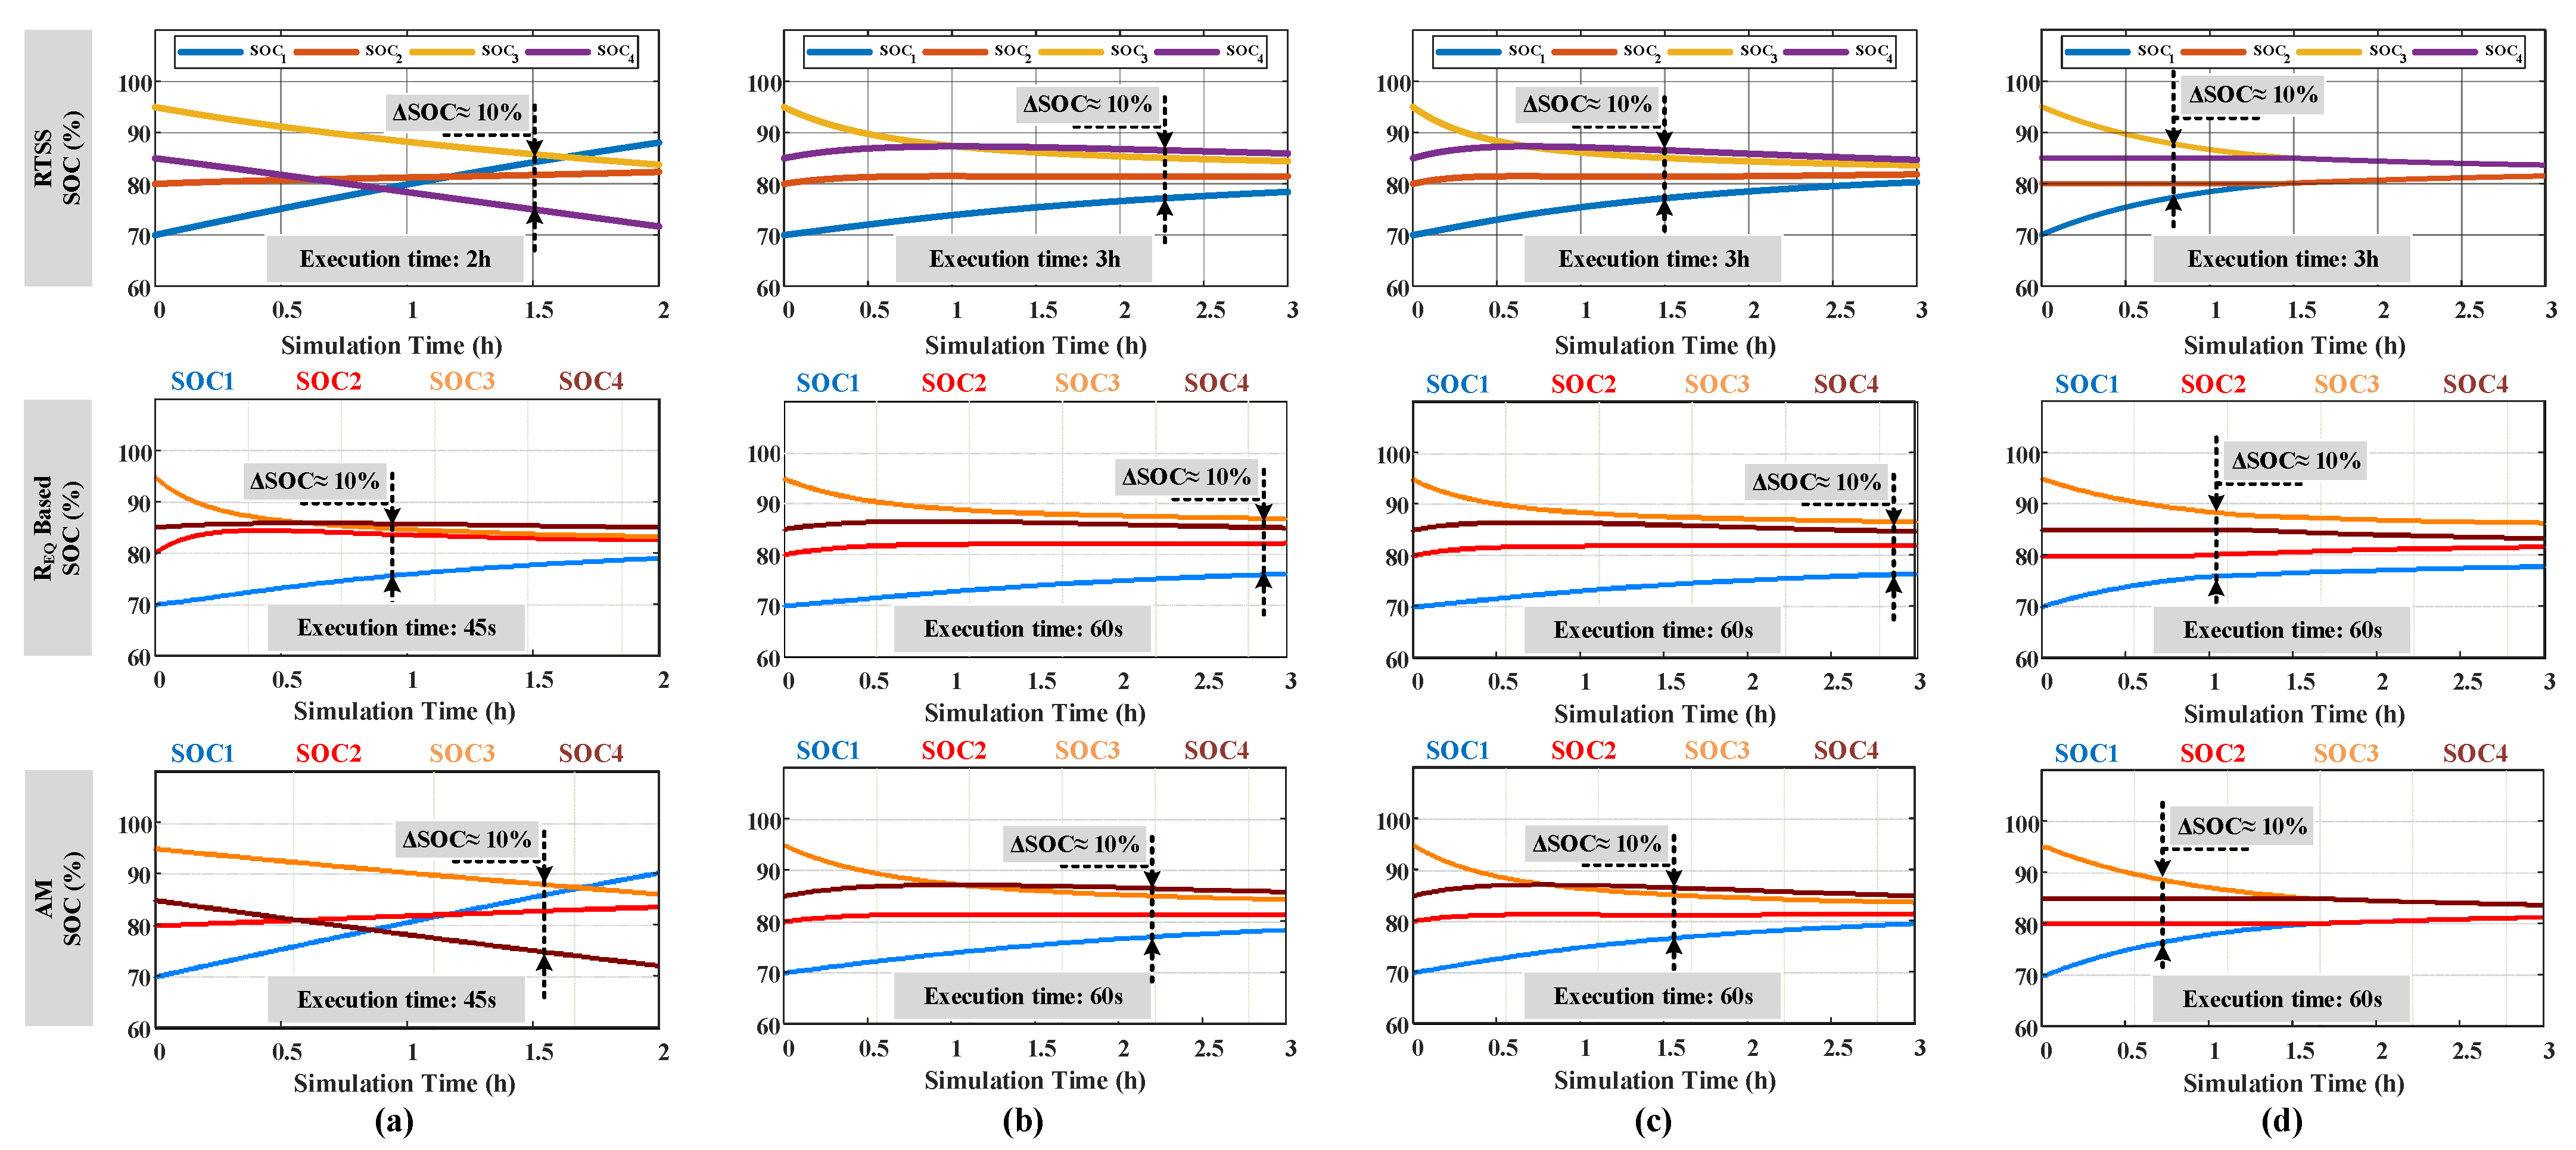
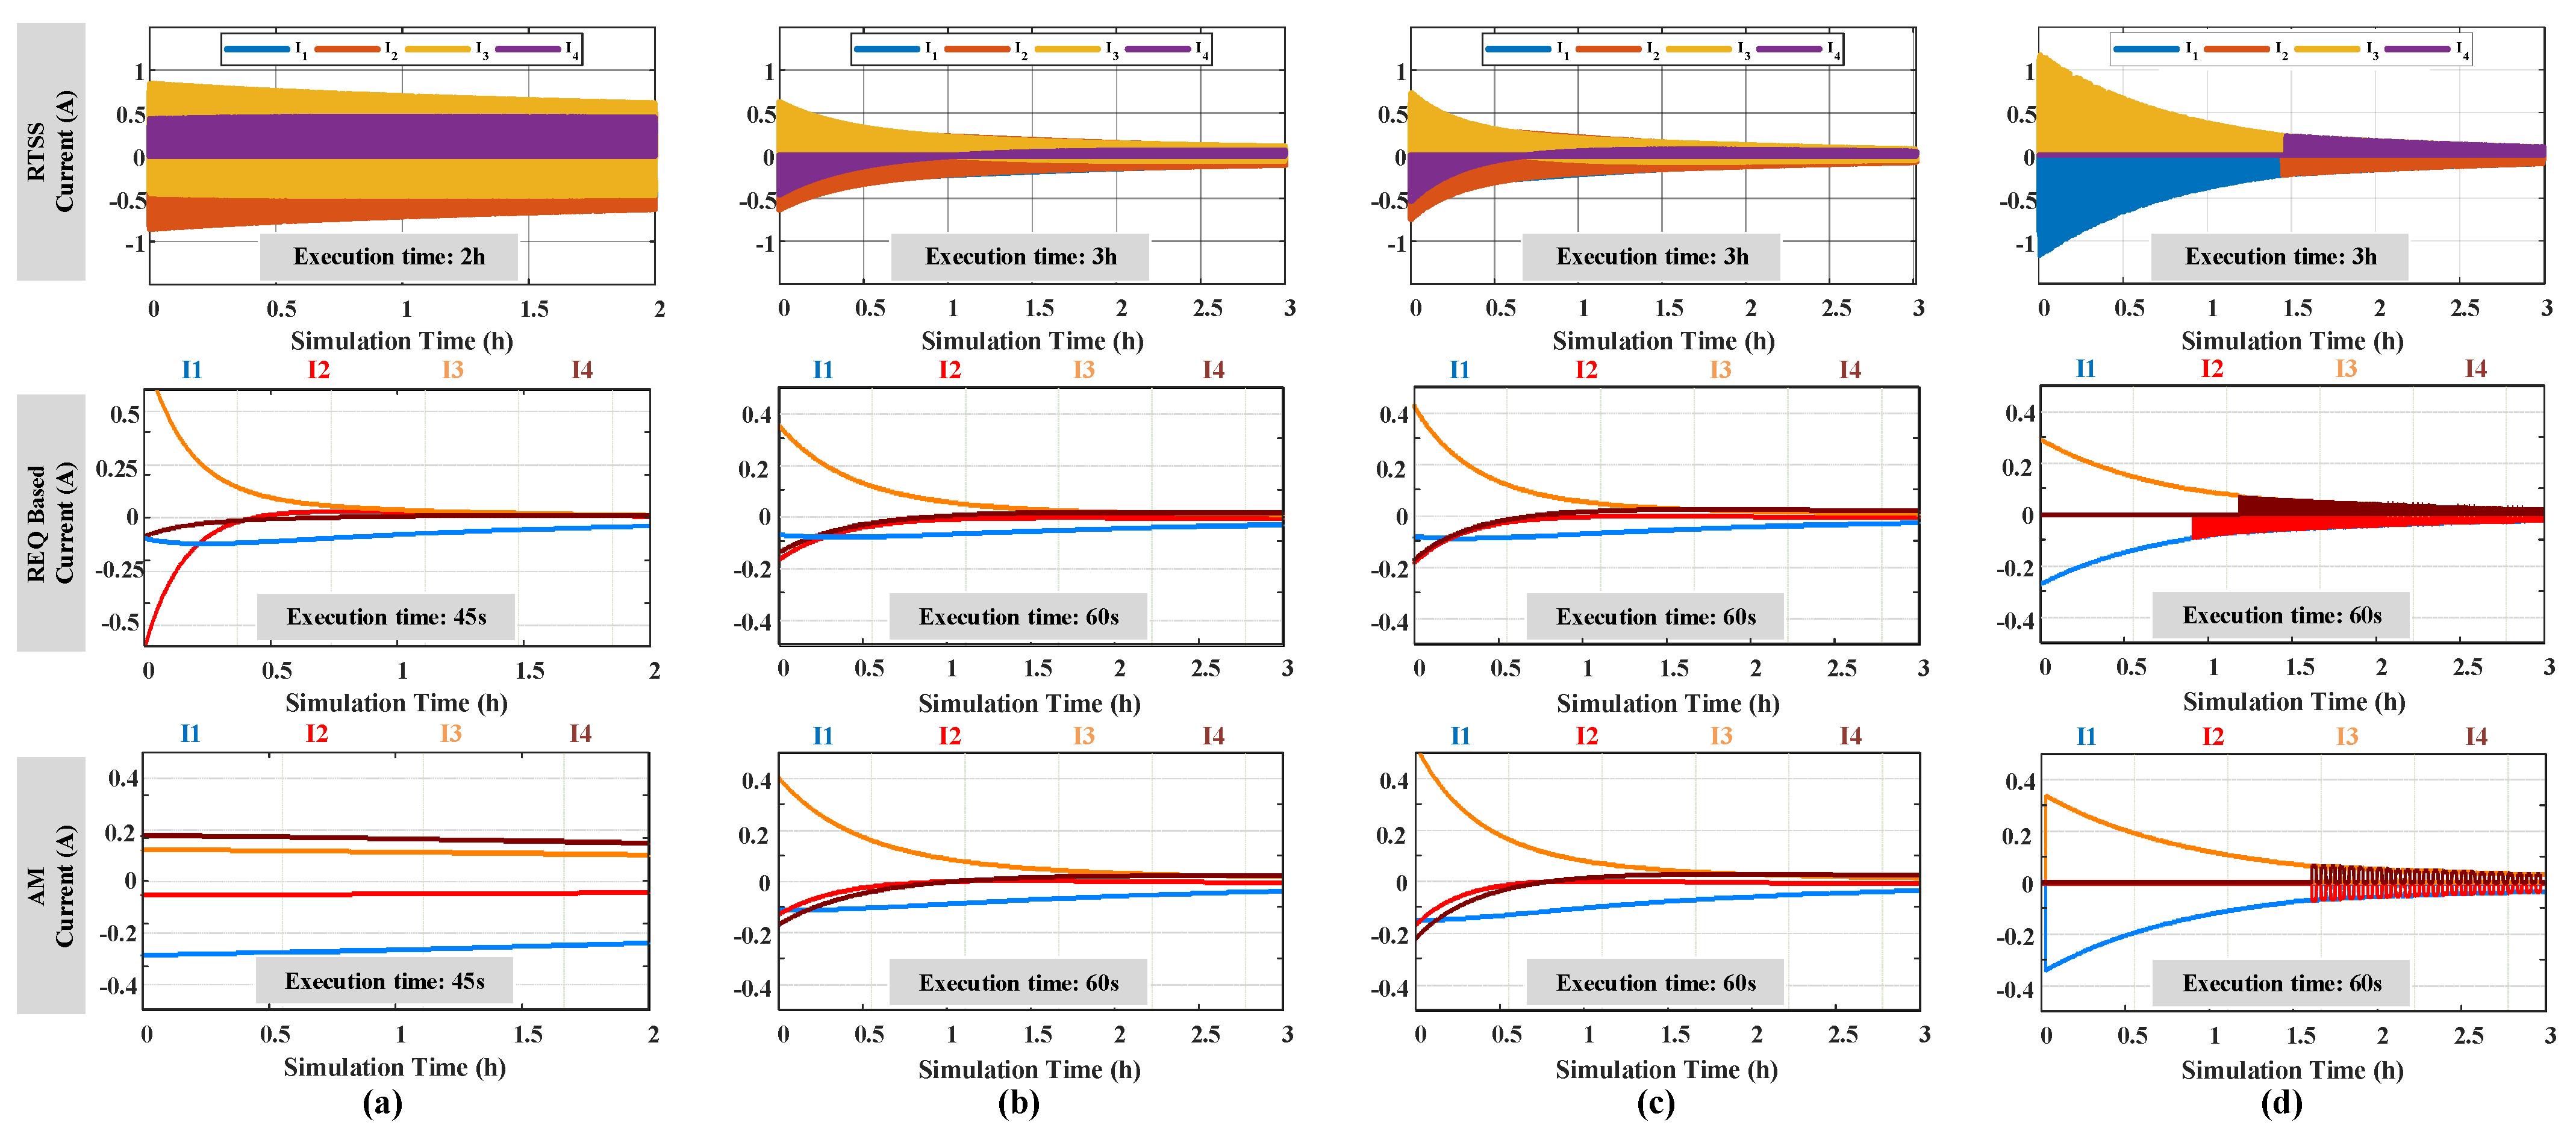
The cell voltages, SOC levels, and current profiles of the equalizing process by the switching model on the RTSS, R E Q model, and AM on PSIM are compared in Figure 7, Figure 8 and Figure 9, respectively. It is observed that the R E Q model fails to describe the equalizing operation of the SI-E because its operation profiles are different from the other platforms. In addition, the R E Q model also shows inaccurate simulation results for the other equalizers (SC-E, SR-E, and SMC-E), where the performances are undervalued compared to the actual results of the switching model on the RTSS-based simulation.
In contrast, similar equalization profiles can be obtained in both the AM-based simulation and the RTSS-based simulation. The voltage and SOC deviations of the RTSS and AM in Figure 7, Figure 8 and Figure 9 are so similar that they confirm the accuracy of the AMs. Although the equalizing currents in the AM only represent the averaged value of the switching waveform of RTSS, the current profiles from both simulations have a similar pattern.
In terms of the execution time, the AM requires only about 60 s to simulate 3 h of the equalizing process, while the RTSS needs exactly 3 h to perform the same task. It is also observed that the R E Q model-based simulation has a similar execution time to the AM-based simulation, but it is not as accurate as the AM. Therefore, the AM can evaluate the performance of the equalizer with an accelerated speed as well as good accuracy.

4. AM Case Study

The proposed AM is especially useful in the performance assessment of battery equalizers. During the development, a lot of tests under various conditions are essential to ensure the consistent and reliable performance of the equalizers. In addition, various equalizer topological configurations should be compared together under the same initial conditions.
As the first use case, the AMs can be utilized to assess the performance of SI-E, SC-E, SR-E, and SMC-E under various scenarios, as illustrated in Figure 10. In this example, the same circuit parameters and the battery capacity in Table 1 are adopted, while the initial SOC levels of the cells are intentionally distributed as follows:
  • Scenario # 1 : The SOC levels of cells # 1 to # 4 are descending, as in Figure 10a.
  • Scenario # 2 : The SOC distribution exhibits a convex shape, where the high−SOC cells are located in the middle of the battery string, as in Figure 10b.
  • Scenario # 3 : The SOC distribution exhibits a concave shape, where the high−SOC cells are located at two ends of the string, as in Figure 10c.
  • Scenario # 4 : The number of cells is increased from Scenario # 1 to assess the dependency on the number of cells.
Under the four SOC distribution scenarios, the equalizers have been assessed by the evaluation criteria in Figure 10e, including equalizing capability, equalizing speed, Coulombic efficiency, scenario dependency (performance consistency), component count, volume, and cost.

4.1. Equalizing Capability

In terms of the equalizing capability, the degree of SOC (DoSE) or voltage equalizing (DoVE) is assessed.
D o S E = Δ S O C i n i t i a l Δ S O C f i n a l Δ S O C i n i t i a l
or
D o V E = Δ V i n i t i a l Δ V f i n a l Δ V i n i t i a l
where Δ S O C i n i t i a l and Δ V i n i t i a l are the initial SOC deviation and the initial voltage deviation between the cells, and Δ S O C f i n a l and Δ V f i n a l are the deviation levels after a given elapsed time. A higher DoVE or DoSE indicates higher equalizing capability.
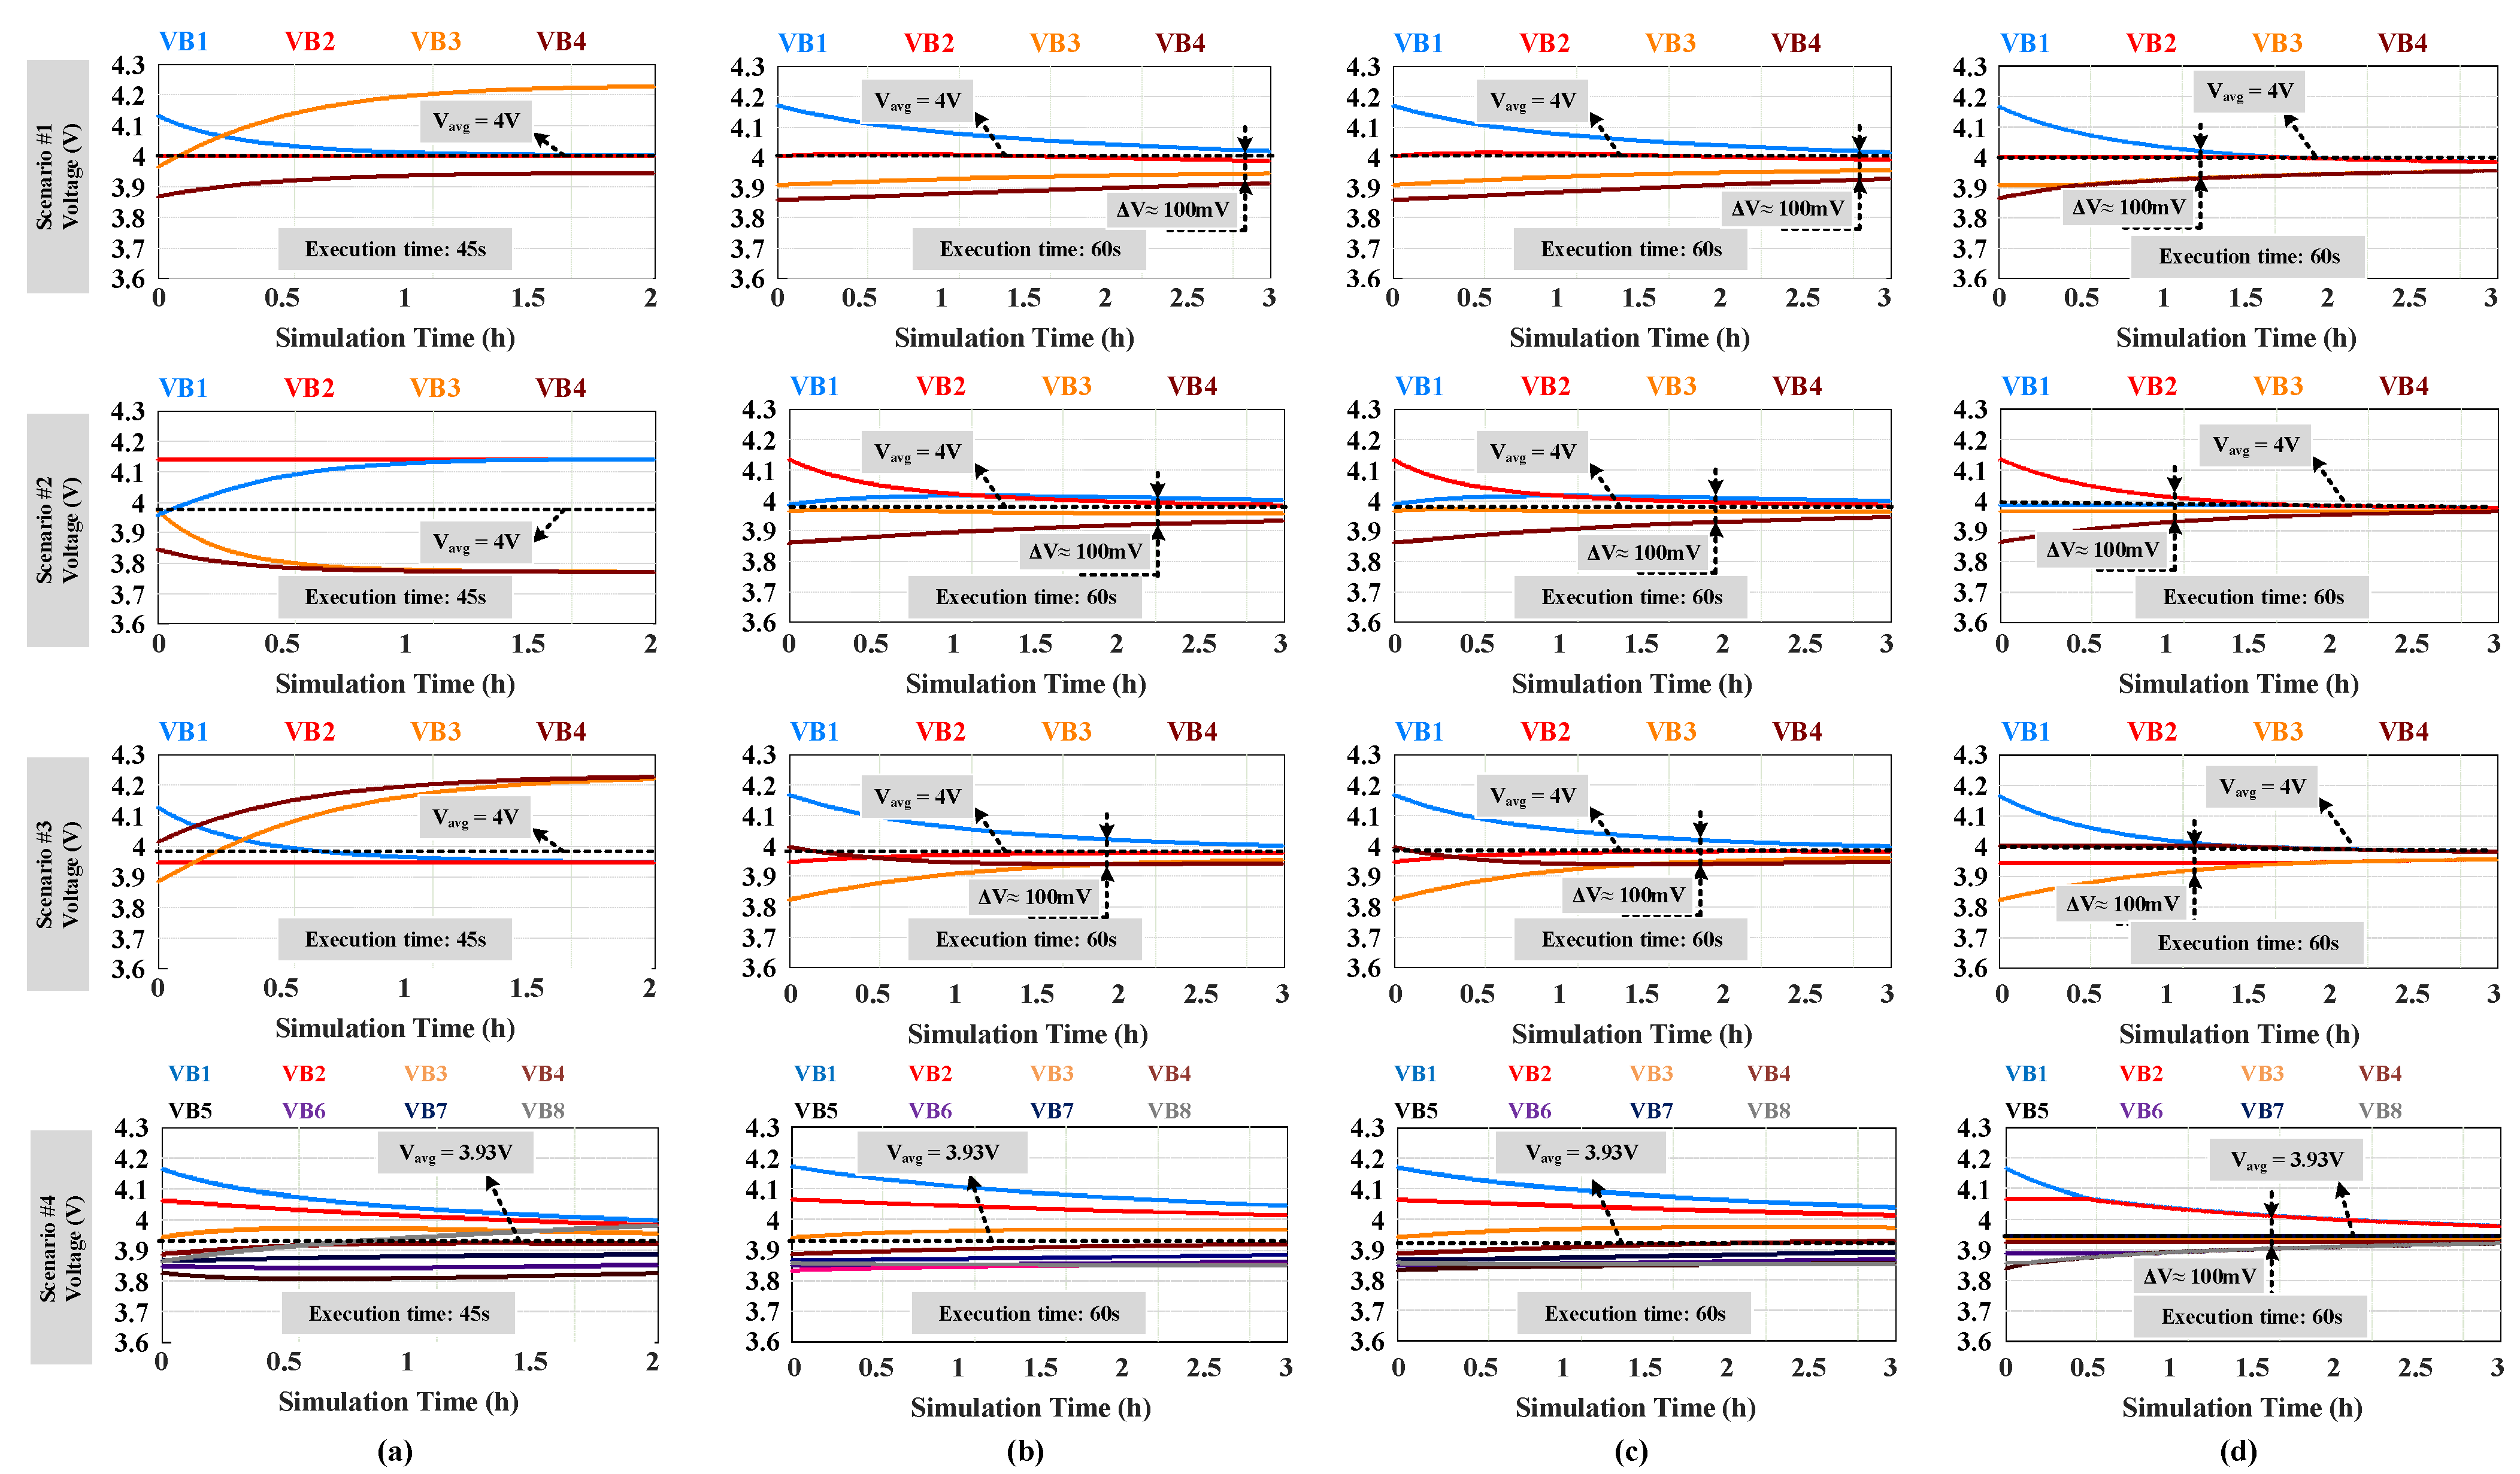
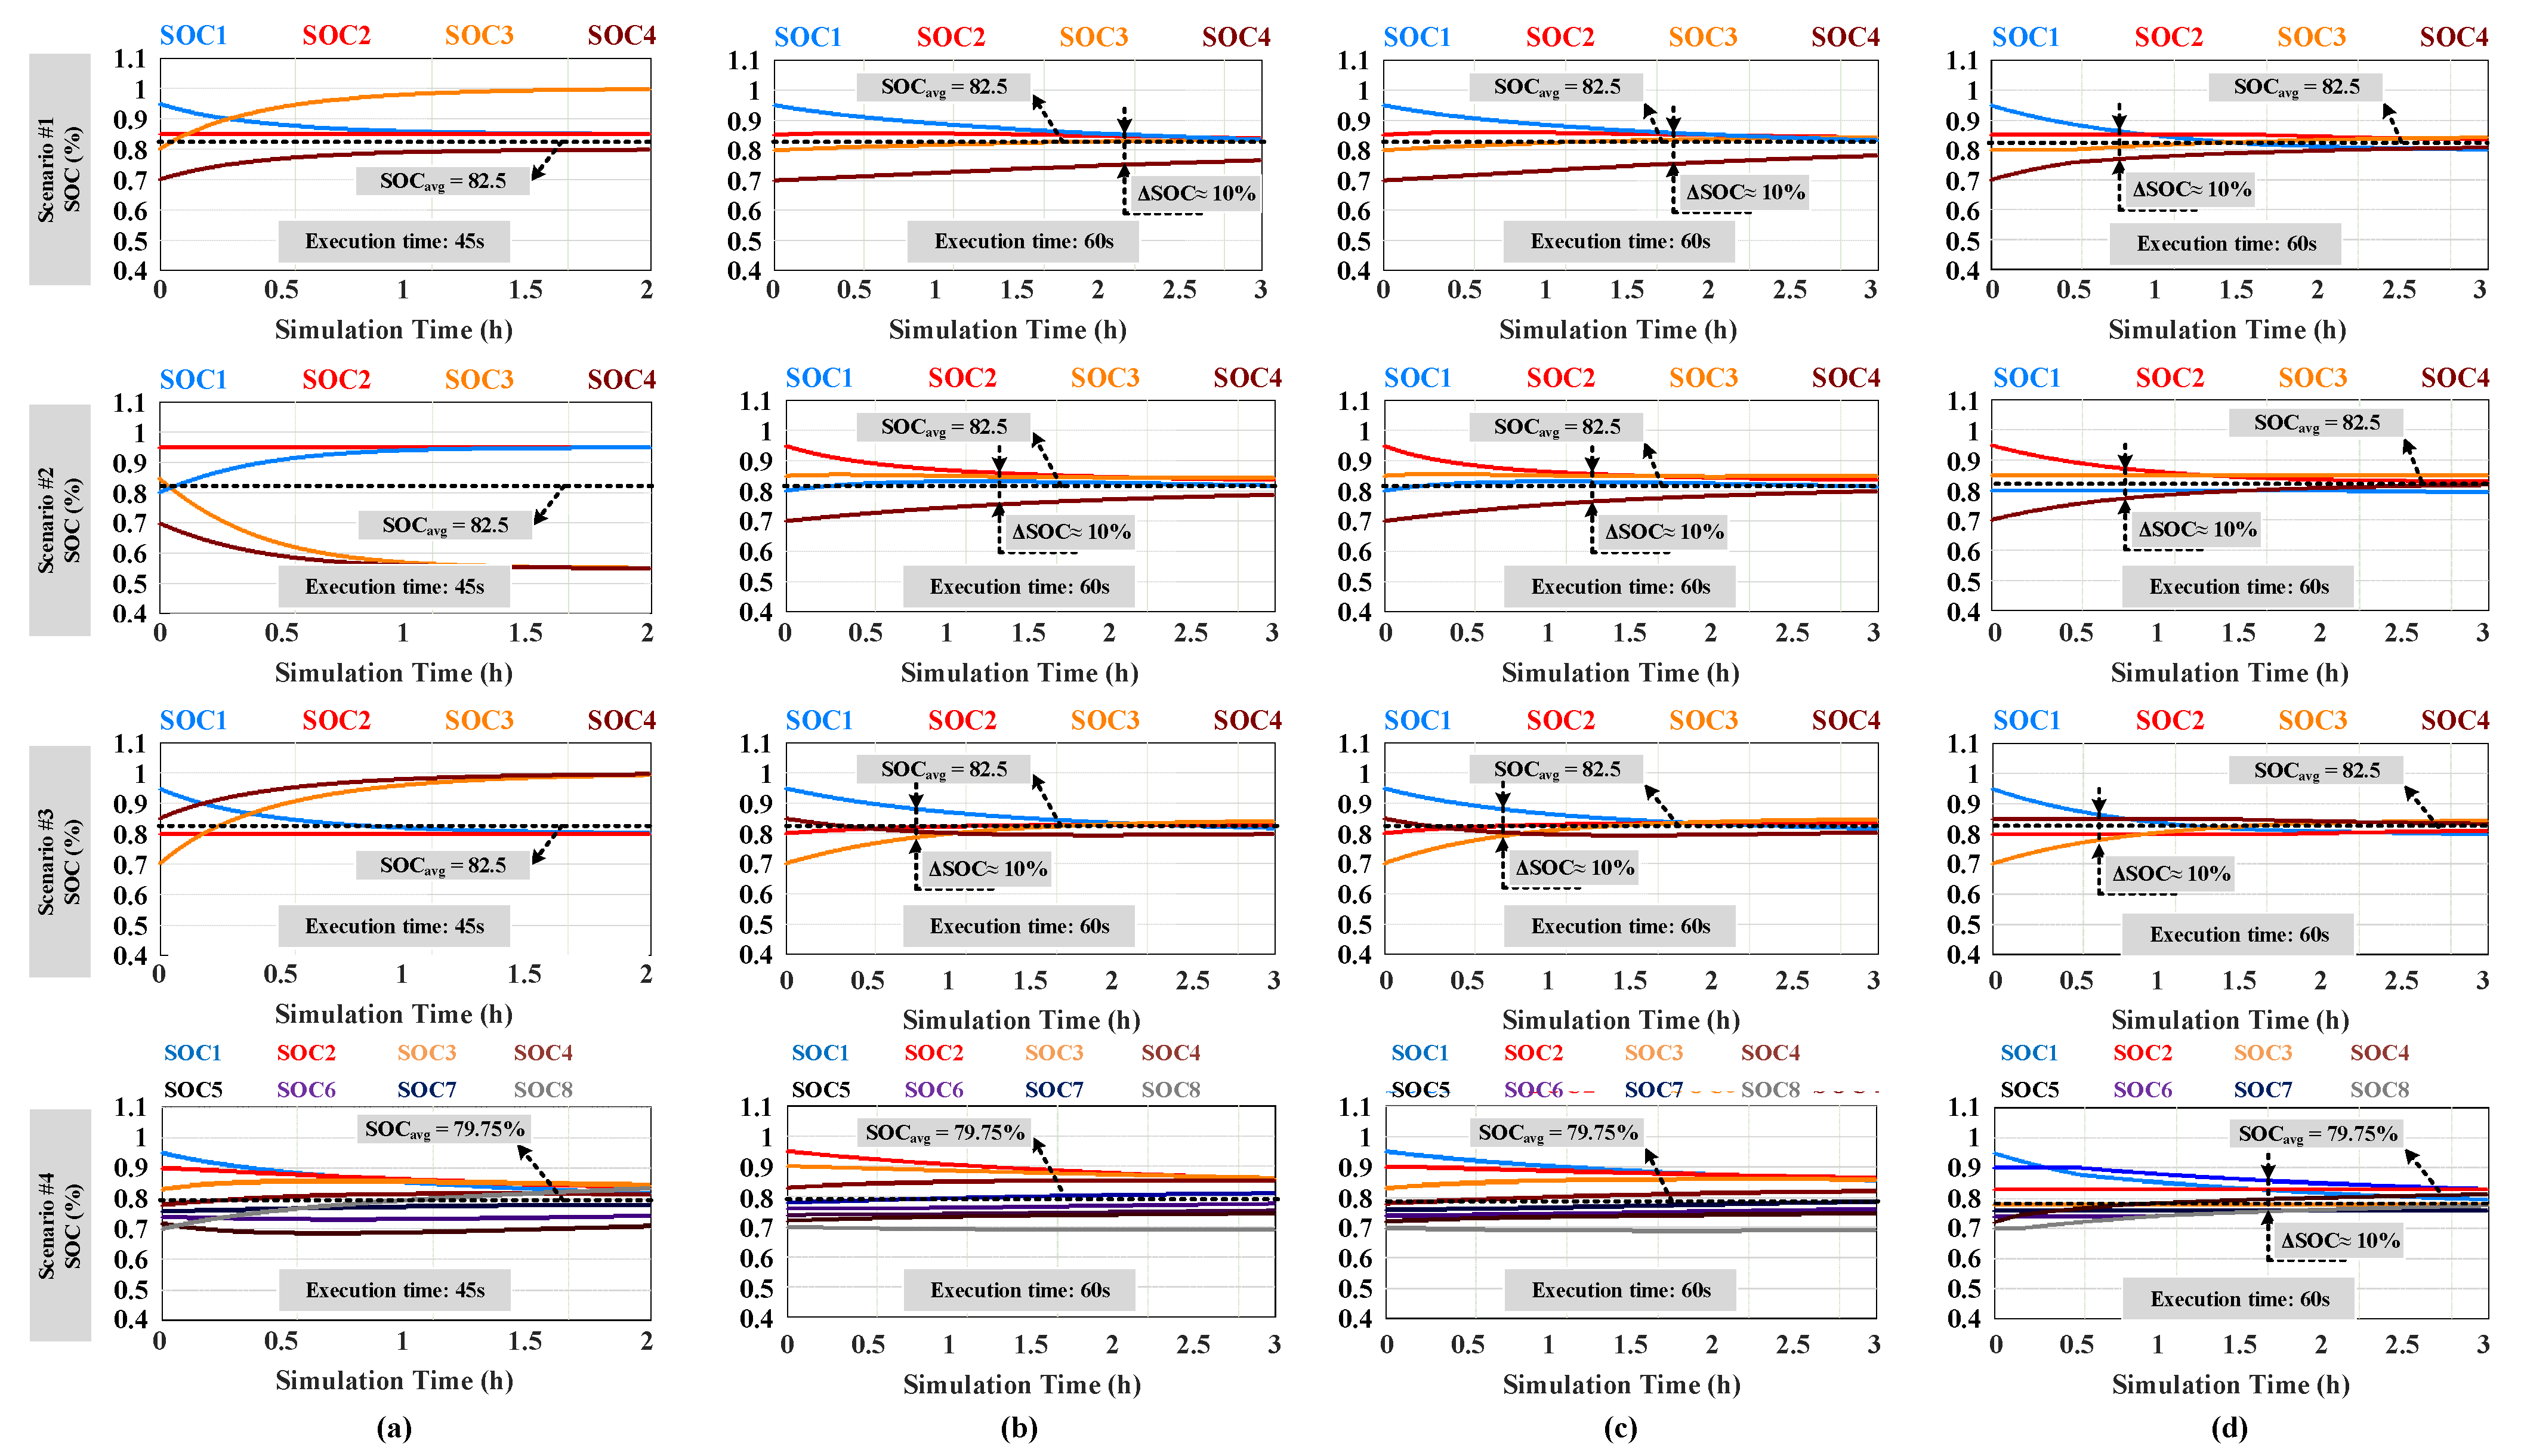
Based on the voltage and SOC profiles in Figure 11 and Figure 12, SMC-E shows the best performance by virtue of the switch−matrix routing algorithm, achieving over 96 %DoVE and DoSE in all test scenarios. However, it requires a monitoring circuit to detect the highest voltage and lowest voltage cells, and the number of control signals is also larger than that of the other equalizers. Meanwhile, the autonomous single−tier SR-E and SC-E achieve more than 80% DoVE and DoSE in all test scenarios, showing that the equalizing capabilities are almost similar. Since the energy equalization is autonomously processed, the sensing circuits can be omitted. On the other hand, SI-E shows poor performance under the autonomous control scheme. Thus, SI-E usually requires a sophisticated duty−control algorithm.

4.2. Equalizing Speed

When the number of cells increases from four to eight, the equalizing performance of the autonomous single−tier SR-E and SC-E becomes the worst among them, as shown in Figure 11 and Figure 12. This is because the energy is only exchanged between two adjacent cells in those structures. The required time for equalization is much longer than that of the four−cell case. On the contrary, SMC-E shows a trivial performance degradation thanks to the switch−matrix configuration. The energy level of the cells is also equalized within 3 h, as in the four−cell case.
The equalizing speed of the equalizers can be assessed by the slew rate of the voltage equalization ( S R V : mV/h) or the slew rate of the SOC equalization ( S R S O C : %/h), which are defined by
S R V = Δ V i n i t Δ V f i n a l t p r o c e s s
or
S R S O C = Δ S O C i n i t Δ S O C f i n a l t p r o c e s s
where Δ V i n i t and Δ S O C i n i t are the initial voltage deviation and the initial SOC deviation of the cells; Δ V f i n a l and Δ S O C f i n a l are the final voltage deviation and the final SOC deviation of the cells; t p r o c e s s is the total equalizing time.
Based on voltage and SOC profiles, the slew rates have been calculated to assess the equalizing speed of the equalizers. The slew rates of voltage and SOC equalization of SI-E are very low. In contrast, SC-E, SR-E, and SMC-E show a higher slew rate, and SMC-E achieves the highest slew rate (80 mV/h S R V and 8%/h S R S O C ). The detailed slew rates of the equalizers are summarized in Figure 13 for comparison.

4.3. Coulombic Efficiency

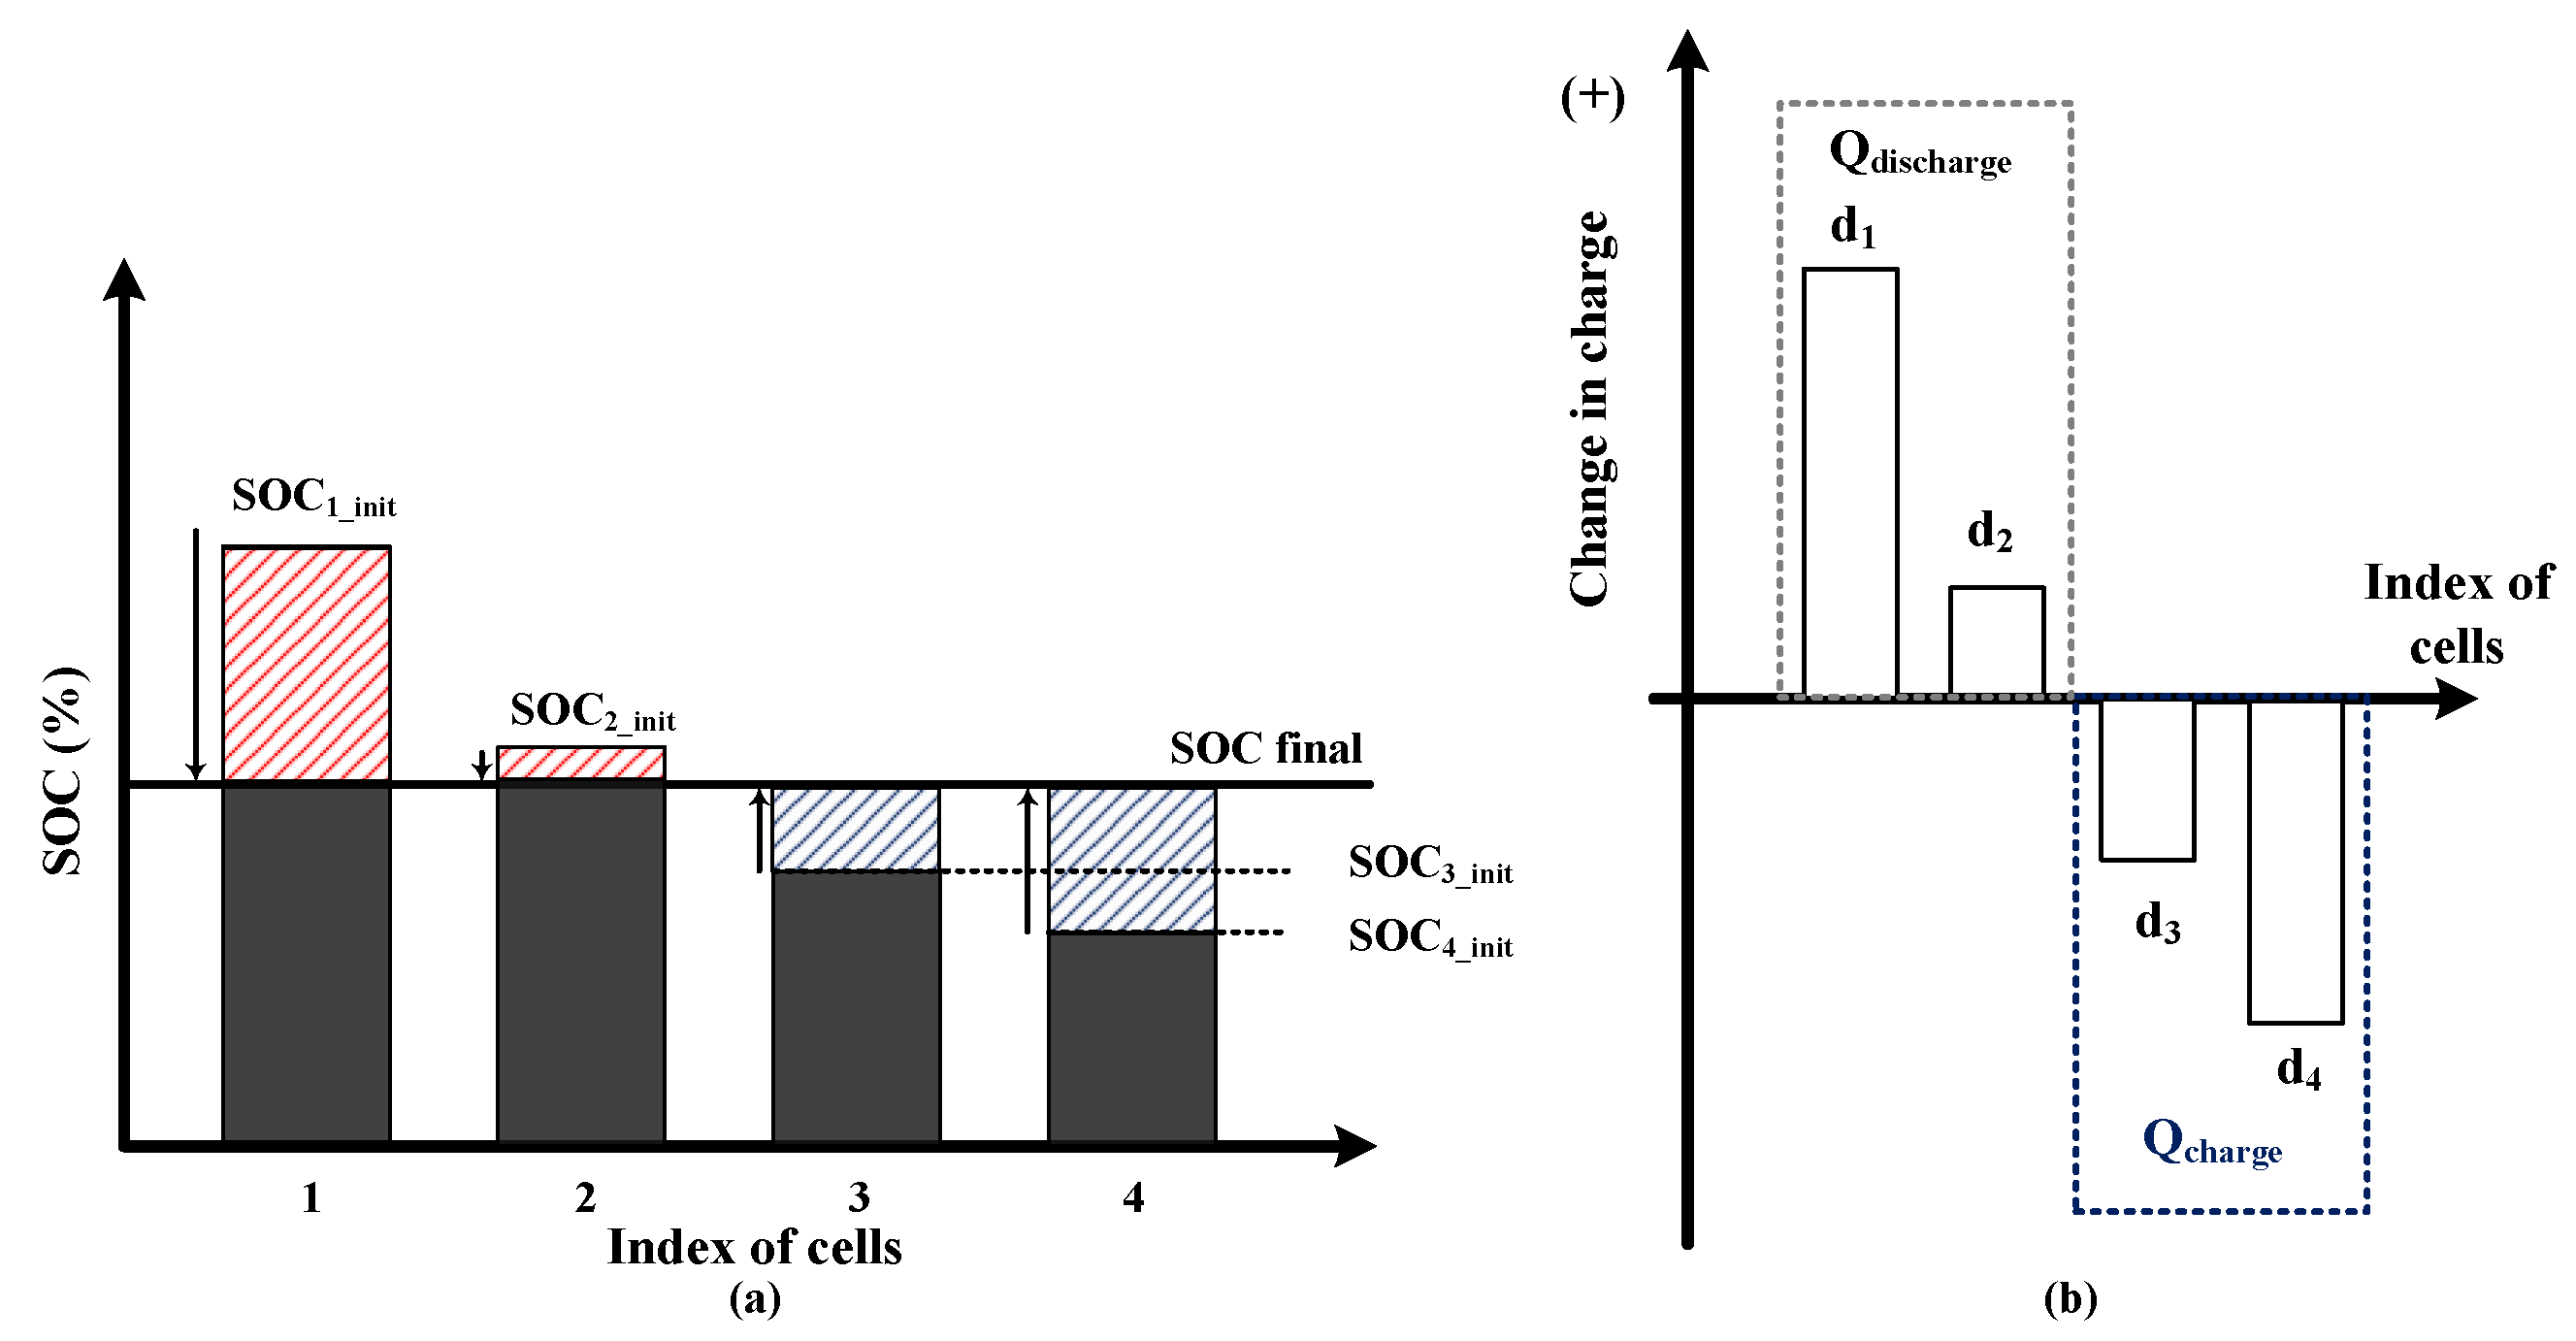
To assess the effectiveness of the equalizer, the Coulombic efficiency of the balancing process is introduced. Figure 14 describes the basic principle of charge transfer among cells. The Coulombic efficiency is calculated based on the amount of transferred charge during the equalizing process. Since the energy level of the battery cell can be represented by the amount of charge, the total exchanged charges in a specific cell during the equalizing process are calculated by
d k = ( S O C k _ i n i t S O C k _ f i n a l ) Q k ,
where S O C k _ i n i t is the initial SOC level of the cells before the equalizing process; S O C k _ f i n a l is the final SOC level of the cells after the equalizing process; Q k is the full capacity of the cell at the current condition; and k is the index of cells ( k = 1 , 2 , , N ). When S O C k _ i n i t is higher than S O C k _ f i n a l , d k is positive. The positive d k s are summed to set the total charge decrement, Q d i s c h a r g e .
i f d k > 0 , Q d i s c h a r g e = d k .
Vice versa, Q c h a r g e represents the charge increment of the cells, which is obtained by the summation of the negative d k s.
i f d k < 0 , Q c h a r g e = d k .
Due to the loss in the equalizer circuit, Q d i s c h a r g e is always larger than Q c h a r g e and the Coulombic efficiency is expressed as
η c o u = Q c h a r g e Q d i s c h a r g e .
Therefore, the energy loss of the equalizers can be assessed. The higher the η c o u , the lower the loss will be.

4.4. Performance Consistency

Finally, the scenario−dependency of the equalizers is assessed by the spider chart in Figure 13. The performance indices of the equalizer under the four worst−case scenarios are plotted for each method. As can be seen from the results, SMC-E shows consistent performance across the test scenarios, as in Figure 13d. On the other hand, the performance of the other equalizers (single−tier SI-E, SC-E, and SR-E) in the three test scenarios is heavily dependent on the initial voltage distribution of the cells. For example, the performance of the autonomous single-tier SET-E shows good performance when the high-voltage cell and low-voltage cell are adjacent; otherwise, the energy from the high-voltage cell should be transferred to the low-voltage cell through multiple intermediate equalizers and battery cells. In addition, the voltage and SOC profiles in Figure 11 and Figure 12 also reflect the impact of the number of cells. It is observed that SI-E, SC-E, and SR-E have difficulty equalizing the cells within the limited time when the number of cells is large. On the contrary, the performance degradation of SMC-E is insignificant.

5. Conclusions

This paper presents an efficient performance evaluation method, employing an average equivalent model of the equalizers. The proposed method is fully compatible with the most widely adopted switched-energy-tank equalizers and has had its efficiency evaluated through comprehensive simulations. Notably, when applied to four series-connected battery cells, the AM provides a precise evaluation of a three-hour equalization process in a one-minute execution time. Compared to the switching model on the real-time simulation system, the AM achieves both accuracy and execution time reductions and thus enables accelerated testing of the battery equalizers. The use cases in the paper highlight the practical feasibility of the AM in facilitating performance comparisons of SET-Es under various initial conditions.
With its verified advantages, this paper provides an effective method to assess the performance of various equalizer topologies. The following practical applications are suggested:
  • To choose a suitable equalizer topology to fit the purpose.
  • To verify and optimize the design parameters of an equalizer through various design options and initial test conditions.
  • To reduce the cost and effort by minimizing trial and error tests.
In future research, other topological configurations will be explored and considered to be embedded into the proposed method.

Author Contributions

Conceptualization, P.-H.L., N.-A.N. and S.-J.C.; methodology, P.-H.L.; validation, P.-H.L. and N.-A.N.; data curation, P.-H.L.; writing—original draft preparation, P.-H.L. and N.-A.N.; writing—review and editing, S.-J.C.; visualization, S.-J.C.; supervision, S.-J.C. All authors have read and agreed to the published version of the manuscript.

Funding

This work was supported by the National Research Foundation of Korea (NRF) grant funded by the Korea government (MSIT) (RS-2023-00240194) and by the Regional Innovation Strategy (RIS) through the National Research Foundation of Korea (NRF), funded by the Ministry of Education (MOE) (2021RIS-003).

Data Availability Statement

The participants of this study did not give written consent for their data to be shared publicly, so due to the sensitive nature of the research supporting data is not available.

Conflicts of Interest

The authors declare no conflicts of interest.

References

  1. Fu, R.; Remo, T.W.; Margolis, R.M. 2018 US Utility-Scale Photovoltaics-Plus-Energy Storage System Costs Benchmark; Technical Report; National Renewable Energy Lab (NREL): Golden, CO, USA, 2018. [Google Scholar]
  2. Kim, J.; Cho, B. Screening process-based modeling of the multi-cell battery string in series and parallel connections for high accuracy state-of-charge estimation. Energy 2013, 57, 581–599. [Google Scholar] [CrossRef]
  3. Kampker, A.; Wessel, S.; Fiedler, F.; Maltoni, F. Battery pack remanufacturing process up to cell level with sorting and repurposing of battery cells. J. Remanuf. 2021, 11, 1–23. [Google Scholar] [CrossRef]
  4. Zwicker, M.; Moghadam, M.; Zhang, W.; Nielsen, C. Automotive battery pack manufacturing—A review of battery to tab joining. J. Adv. Join. Process. 2020, 1, 100017. [Google Scholar] [CrossRef]
  5. Gong, X.; Xiong, R.; Mi, C.C. Study of the characteristics of battery packs in electric vehicles with parallel-connected lithium-ion battery cells. IEEE Trans. Ind. Appl. 2014, 51, 1872–1879. [Google Scholar] [CrossRef]
  6. Baumann, M.; Wildfeuer, L.; Rohr, S.; Lienkamp, M. Parameter variations within Li-Ion battery packs—Theoretical investigations and experimental quantification. J. Energy Storage 2018, 18, 295–307. [Google Scholar] [CrossRef]
  7. Zheng, Y.; Ouyang, M.; Lu, L.; Li, J. Understanding aging mechanisms in lithium-ion battery packs: From cell capacity loss to pack capacity evolution. J. Power Sources 2015, 278, 287–295. [Google Scholar] [CrossRef]
  8. Kuntz, P.; Lonardoni, L.; Genies, S.; Raccurt, O.; Azas, P. Evolution of Safety Behavior of High-Power and High-Energy Commercial Li-Ion Cells after Electric Vehicle Aging. Batteries 2023, 9, 427. [Google Scholar] [CrossRef]
  9. Zhang, C.; Jiang, Y.; Jiang, J.; Cheng, G.; Diao, W.; Zhang, W. Study on battery pack consistency evolutions and equilibrium diagnosis for serial-connected lithium-ion batteries. Appl. Energy 2017, 207, 510–519. [Google Scholar] [CrossRef]
  10. Cao, J.; Schofield, N.; Emadi, A. Battery balancing methods: A comprehensive review. In Proceedings of the 2008 IEEE Vehicle Power and Propulsion Conference, Harbin, China, 3–5 September 2008; pp. 1–6. [Google Scholar]
  11. Ziegler, A.; Oeser, D.; Hein, T.; Montesinos-Miracle, D.; Ackva, A. Reducing Cell to Cell Variation of Lithium-Ion Battery Packs During Operation. IEEE Access 2021, 9, 24994–25001. [Google Scholar] [CrossRef]
  12. Hemavathi, S. Overview of cell balancing methods for Li-ion battery technology. Energy Storage 2021, 3, e203. [Google Scholar]
  13. Koseoglou, M.; Tsioumas, E.; Jabbour, N.; Mademlis, C. Highly Effective Cell Equalization in a Lithium-Ion Battery Management System. IEEE Trans. Power Electron. 2019, 35, 2088–2099. [Google Scholar] [CrossRef]
  14. Stuart, T.A.; Zhu, W. Fast equalization for large lithium ion batteries. IEEE Aerosp. Electron. Syst. Mag. 2009, 24, 27–31. [Google Scholar] [CrossRef]
  15. Lee, W.C.; Drury, D.; Mellor, P. Comparison of passive cell balancing and active cell balancing for automotive batteries. In Proceedings of the 2011 IEEE Vehicle Power and Propulsion Conference, Chicago, IL, USA, 6–9 September 2011; pp. 1–7. [Google Scholar]
  16. Di Monaco, M.; Porpora, F.; Tomasso, G.; D’Arpino, M.; Attaianese, C. Design methodology for passive balancing circuit including real battery operating conditions. In Proceedings of the 2020 IEEE Transportation Electrification Conference and Expo (ITEC), Chicago, IL, USA, 23–26 June 2020; pp. 467–471. [Google Scholar]
  17. Einhorn, M.; Guertlschmid, W.; Blochberger, T.; Kumpusch, R.; Permann, R.; Conte, F.V.; Kral, C.; Fleig, J. A current equalization method for serially connected battery cells using a single power converter for each cell. IEEE Trans. Veh. Technol. 2011, 60, 4227–4237. [Google Scholar] [CrossRef]
  18. Hannan, M.A.; Hoque, M.M.; Peng, S.E.; Uddin, M.N. Lithium-ion battery charge equalization algorithm for electric vehicle applications. IEEE Trans. Ind. Appl. 2017, 53, 2541–2549. [Google Scholar] [CrossRef]
  19. Lee, K.M.; Lee, S.W.; Choi, Y.G.; Kang, B. Active balancing of Li-ion battery cells using transformer as energy carrier. IEEE Trans. Ind. Electron. 2016, 64, 1251–1257. [Google Scholar] [CrossRef]
  20. Lim, C.S.; Lee, K.J.; Ku, N.J.; Hyun, D.S.; Kim, R.Y. A modularized equalization method based on magnetizing energy for a series-connected lithium-ion battery string. IEEE Trans. Power Electron. 2013, 29, 1791–1799. [Google Scholar] [CrossRef]
  21. Park, Y.H.; Kim, R.Y.; Choi, Y.J. An Active Cascaded Battery Voltage Balancing Circuit Based on Multi-Winding Transformer with Small Magnetizing Inductance. Energies 2021, 14, 1302. [Google Scholar] [CrossRef]
  22. Ceylan, M.; Balikci, A. An Intermodular Active Balancing Topology for Efficient Operation of High Voltage Battery Packs in Li-Ion Based Energy Storage Systems: Switched (Flying) DC/DC Converter. Energies 2023, 16, 5608. [Google Scholar] [CrossRef]
  23. Nguyen, N.A.; La, P.H.; Choi, S.J. Coordinated operation algorithm of pack-chargers and cell-equalizers for SOC adjustment in second-life batteries. J. Power Electron. 2022, 22, 105–115. [Google Scholar] [CrossRef]
  24. Phung, T.H.; Collet, A.; Crebier, J.C. An optimized topology for next-to-next balancing of series-connected lithium-ion cells. IEEE Trans. Power Electron. 2013, 29, 4603–4613. [Google Scholar] [CrossRef]
  25. Kim, M.Y.; Kim, J.H.; Moon, G.W. Center-cell concentration structure of a cell-to-cell balancing circuit with a reduced number of switches. IEEE Trans. Power Electron. 2013, 29, 5285–5297. [Google Scholar] [CrossRef]
  26. Farzan Moghaddam, A.; Van den Bossche, A. A Ćuk Converter Cell Balancing Technique by Using Coupled Inductors for Lithium-Based Batteries. Energies 2019, 12, 2881. [Google Scholar] [CrossRef]
  27. Pascual, C.; Krein, P.T. Switched capacitor system for automatic series battery equalization. In Proceedings of the APEC 97-Applied Power Electronics Conference, Atlanta, GA, USA, 27 February 1997; Volume 2, pp. 848–854. [Google Scholar]
  28. Alvarez-Diazcomas, A.; Estévez-Bén, A.A.; Rodríguez-Reséndiz, J.; Carrillo-Serrano, R.V.; Álvarez-Alvarado, J.M. A High-Efficiency Capacitor-Based Battery Equalizer for Electric Vehicles. Sensors 2023, 23, 5009. [Google Scholar] [CrossRef] [PubMed]
  29. Hua, C.C.; Chuang, C.W.; Fang, Y.H. Low-cost switched capacitor charge equaliser with cancellation mechanism of alternating current. IET Power Electron. 2016, 9, 1454–1461. [Google Scholar] [CrossRef]
  30. Kim, M.Y.; Kim, C.H.; Kim, J.H.; Moon, G.W. A chain structure of switched capacitor for improved cell balancing speed of lithium-ion batteries. IEEE Trans. Ind. Electron. 2013, 61, 3989–3999. [Google Scholar] [CrossRef]
  31. La, P.H.; Choi, S.J. Direct Cell-to-Cell Equalizer for Series Battery String Using Switch-Matrix Single-Capacitor Equalizer and Optimal Pairing Algorithm. IEEE Trans. Power Electron. 2022, 37, 8625–8639. [Google Scholar] [CrossRef]
  32. Zeltser, I.; Evzelman, M.; Kuperman, A.; Peretz, M.M. Zero Current Switching Resonant Converter Based Parallel Balancing of Serially Connected Batteries String. IEEE Trans. Ind. Appl. 2019, 55, 7452–7460. [Google Scholar] [CrossRef]
  33. Liu, L.; Mai, R.; Xu, B.; Sun, W.; Zhou, W.; He, Z. Design of Parallel Resonant Switched-Capacitor Equalizer for Series-Connected Battery Strings. IEEE Trans. Power Electron. 2021, 36, 9160–9169. [Google Scholar] [CrossRef]
  34. Shang, Y.; Zhang, Q.; Cui, N.; Duan, B.; Zhou, Z.; Zhang, C. Multicell-to-Multicell Equalizers Based on Matrix and Half-Bridge LC Converters for Series-Connected Battery Strings. IEEE J. Emerg. Sel. Top. Power Electron. 2020, 8, 1755–1766. [Google Scholar] [CrossRef]
  35. Mohan, N.; Robbins, W.P.; Undeland, T.M.; Nilssen, R.; Mo, O. Simulation of power electronic and motion control systems-an overview. Proc. IEEE 1994, 82, 1287–1302. [Google Scholar] [CrossRef]
  36. Mihalič, F.; Truntič, M.; Hren, A. Hardware-in-the-loop simulations: A historical overview of engineering challenges. Electronics 2022, 11, 2462. [Google Scholar] [CrossRef]
  37. Hanselmann, H. Hardware-in-the-Loop Simulation as a Standard Approach for Development, Customization, and Production Test; Technical Report, SAE Technical Paper; SAE International: Warrendale, PA, USA, 1993. [Google Scholar]
  38. Bélanger, J.; Venne, P.; Paquin, J.N. The what, where and why of real-time simulation. Planet Rt 2010, 1, 25–29. [Google Scholar]
  39. Estrada, L.; Vázquez, N.; Vaquero, J.; de Castro, Á.; Arau, J. Real-time hardware in the loop simulation methodology for power converters using labview FPGA. Energies 2020, 13, 373. [Google Scholar] [CrossRef]
  40. Montoya, J.; Brandl, R.; Vishwanath, K.; Johnson, J.; Darbali-Zamora, R.; Summers, A.; Hashimoto, J.; Kikusato, H.; Ustun, T.S.; Ninad, N.; et al. Advanced laboratory testing methods using real-time simulation and hardware-in-the-loop techniques: A survey of smart grid international research facility network activities. Energies 2020, 13, 3267. [Google Scholar] [CrossRef]
  41. Migoni, G.; Romero, M.E.; Bergero, F.; Kofman, E. A mixed modeling approach for efficient simulation of PWM switching mode power supplies. IEEE Trans. Power Electron. 2019, 34, 9758–9767. [Google Scholar] [CrossRef]
  42. Lee, W.C.; Drury, D. Development of a hardware-in-the-loop simulation system for testing cell balancing circuits. IEEE Trans. Power Electron. 2013, 28, 5949–5959. [Google Scholar] [CrossRef]
  43. Benigni, A.; Monti, A. A parallel approach to real-time simulation of power electronics systems. IEEE Trans. Power Electron. 2014, 30, 5192–5206. [Google Scholar] [CrossRef]
  44. Racewicz, S.; Kutt, F.; Sienkiewicz, Ł. Power hardware-in-the-loop approach for autonomous power generation system analysis. Energies 2022, 15, 1720. [Google Scholar] [CrossRef]
  45. Kumar, P.; Kashyap, Y.; Castelino, R.V.; Karthikeyan, A.; Sharma K, M.; Karmakar, D.; Kosmopoulos, P. Laboratory-Scale Airborne Wind Energy Conversion Emulator Using OPAL-RT Real-Time Simulator. Energies 2023, 16, 6804. [Google Scholar] [CrossRef]
  46. Li, F.; Wang, Y.; Wu, F.; Huang, Y.; Liu, Y.; Zhang, X.; Ma, M. Review of real-time simulation of power electronics. J. Mod. Power Syst. Clean Energy 2020, 8, 796–808. [Google Scholar] [CrossRef]
  47. Sidwall, K.; Forsyth, P. A Review of Recent Best Practices in the Development of Real-Time Power System Simulators from a Simulator Manufacturer’s Perspective. Energies 2022, 15, 1111. [Google Scholar] [CrossRef]
  48. Sobanski, P.; Miskiewicz, M.; Bujak, G.; Szlosek, M.; Oikonomou, N.; Pietilaeinen, K. Real Time Simulation of Power Electronics Medium Voltage DC-Grid Simulator. Energies 2021, 14, 7368. [Google Scholar] [CrossRef]
  49. Ye, Y.; Cheng, K.W.E.; Fong, Y.C.; Xue, X.; Lin, J. Topology, modeling, and design of switched-capacitor-based cell balancing systems and their balancing exploration. IEEE Trans. Power Electron. 2016, 32, 4444–4454. [Google Scholar] [CrossRef]
  50. Pillai, P.; Sundaresan, S.; Kumar, P.; Pattipati, K.R.; Balasingam, B. Open-circuit voltage models for battery management systems: A review. Energies 2022, 15, 6803. [Google Scholar] [CrossRef]
  51. La, P.H.; Choi, S.J. Novel Dynamic Resistance Equalizer for Parallel-Connected Battery Configurations. Energies 2020, 13, 3315. [Google Scholar] [CrossRef]
  52. Nemeş, R.; Ruba, M.; Raia, R.; Marţiş, C.; Oprea, C. X-in the Loop based high accuracy test facility for industrial development of electric vehicles. IEEE Trans. Transp. Electrif. 2022, 9, 2778–2791. [Google Scholar] [CrossRef]
  53. Vorpérian, V. Simplified analysis of PWM converters using model of PWM switch. II. Discontinuous conduction mode. IEEE Trans. Aerosp. Electron. Syst. 1990, 26, 497–505. [Google Scholar] [CrossRef]
  54. Kimball, J.W.; Krein, P.T.; Cahill, K.R. Modeling of capacitor impedance in switching converters. IEEE Power Electron. Lett. 2005, 3, 136–140. [Google Scholar] [CrossRef]
  55. Ben-Yaakov, S.; Evzelman, M. Generic and unified model of switched capacitor converters. In Proceedings of the 2009 IEEE Energy Conversion Congress and Exposition, San Jose, CA, USA, 20–24 September 2009; pp. 3501–3508. [Google Scholar]
  56. Plakhtyna, O.; Kutsyk, A.; Semeniuk, M. Real-Time Models of Electromechanical Power Systems, Based on the Method of Average Voltages in Integration Step and Their Computer Application. Energies 2020, 13, 2263. [Google Scholar] [CrossRef]
  57. Rolak, M.; Twardy, M.; Soból, C. Generalized Average Modeling of a Dual Active Bridge DC-DC Converter with Triple-Phase-Shift Modulation. Energies 2022, 15, 6092. [Google Scholar] [CrossRef]
  58. Sun, W.; Li, Y.; Liu, L.; Mai, R. A switched-capacitor battery equalization method for improving balancing speed. IET Electr. Power Appl. 2021, 15, 555–569. [Google Scholar] [CrossRef]
  59. Ye, Y.; Cheng, K.W.E. Modeling and analysis of series–parallel switched-capacitor voltage equalizer for battery/supercapacitor strings. IEEE J. Emerg. Sel. Top. Power Electron. 2015, 3, 977–983. [Google Scholar] [CrossRef]
  60. Evzelman, M.; Ben-Yaakov, S. Average-current-based conduction losses model of switched capacitor converters. IEEE Trans. Power Electron. 2012, 28, 3341–3352. [Google Scholar] [CrossRef]
  61. Yang, L.; Wu, B.; Zhang, X.; Smedley, K.; Li, G.P. Dynamic modeling and analysis of constant on time variable frequency one-cycle control for switched-capacitor converters. IEEE Trans. Circuits Syst. Regul. Pap. 2017, 64, 630–641. [Google Scholar] [CrossRef]
  62. La, P.H.; Choi, S.J. Synthesis of balancing topologies for parallel-connected battery cells by principle of duality. In Proceedings of the 2019 10th International Conference on Power Electronics and ECCE Asia (ICPE 2019-ECCE Asia), Busan, Republic of Korea, 27–30 May 2019; pp. 1455–1459. [Google Scholar]
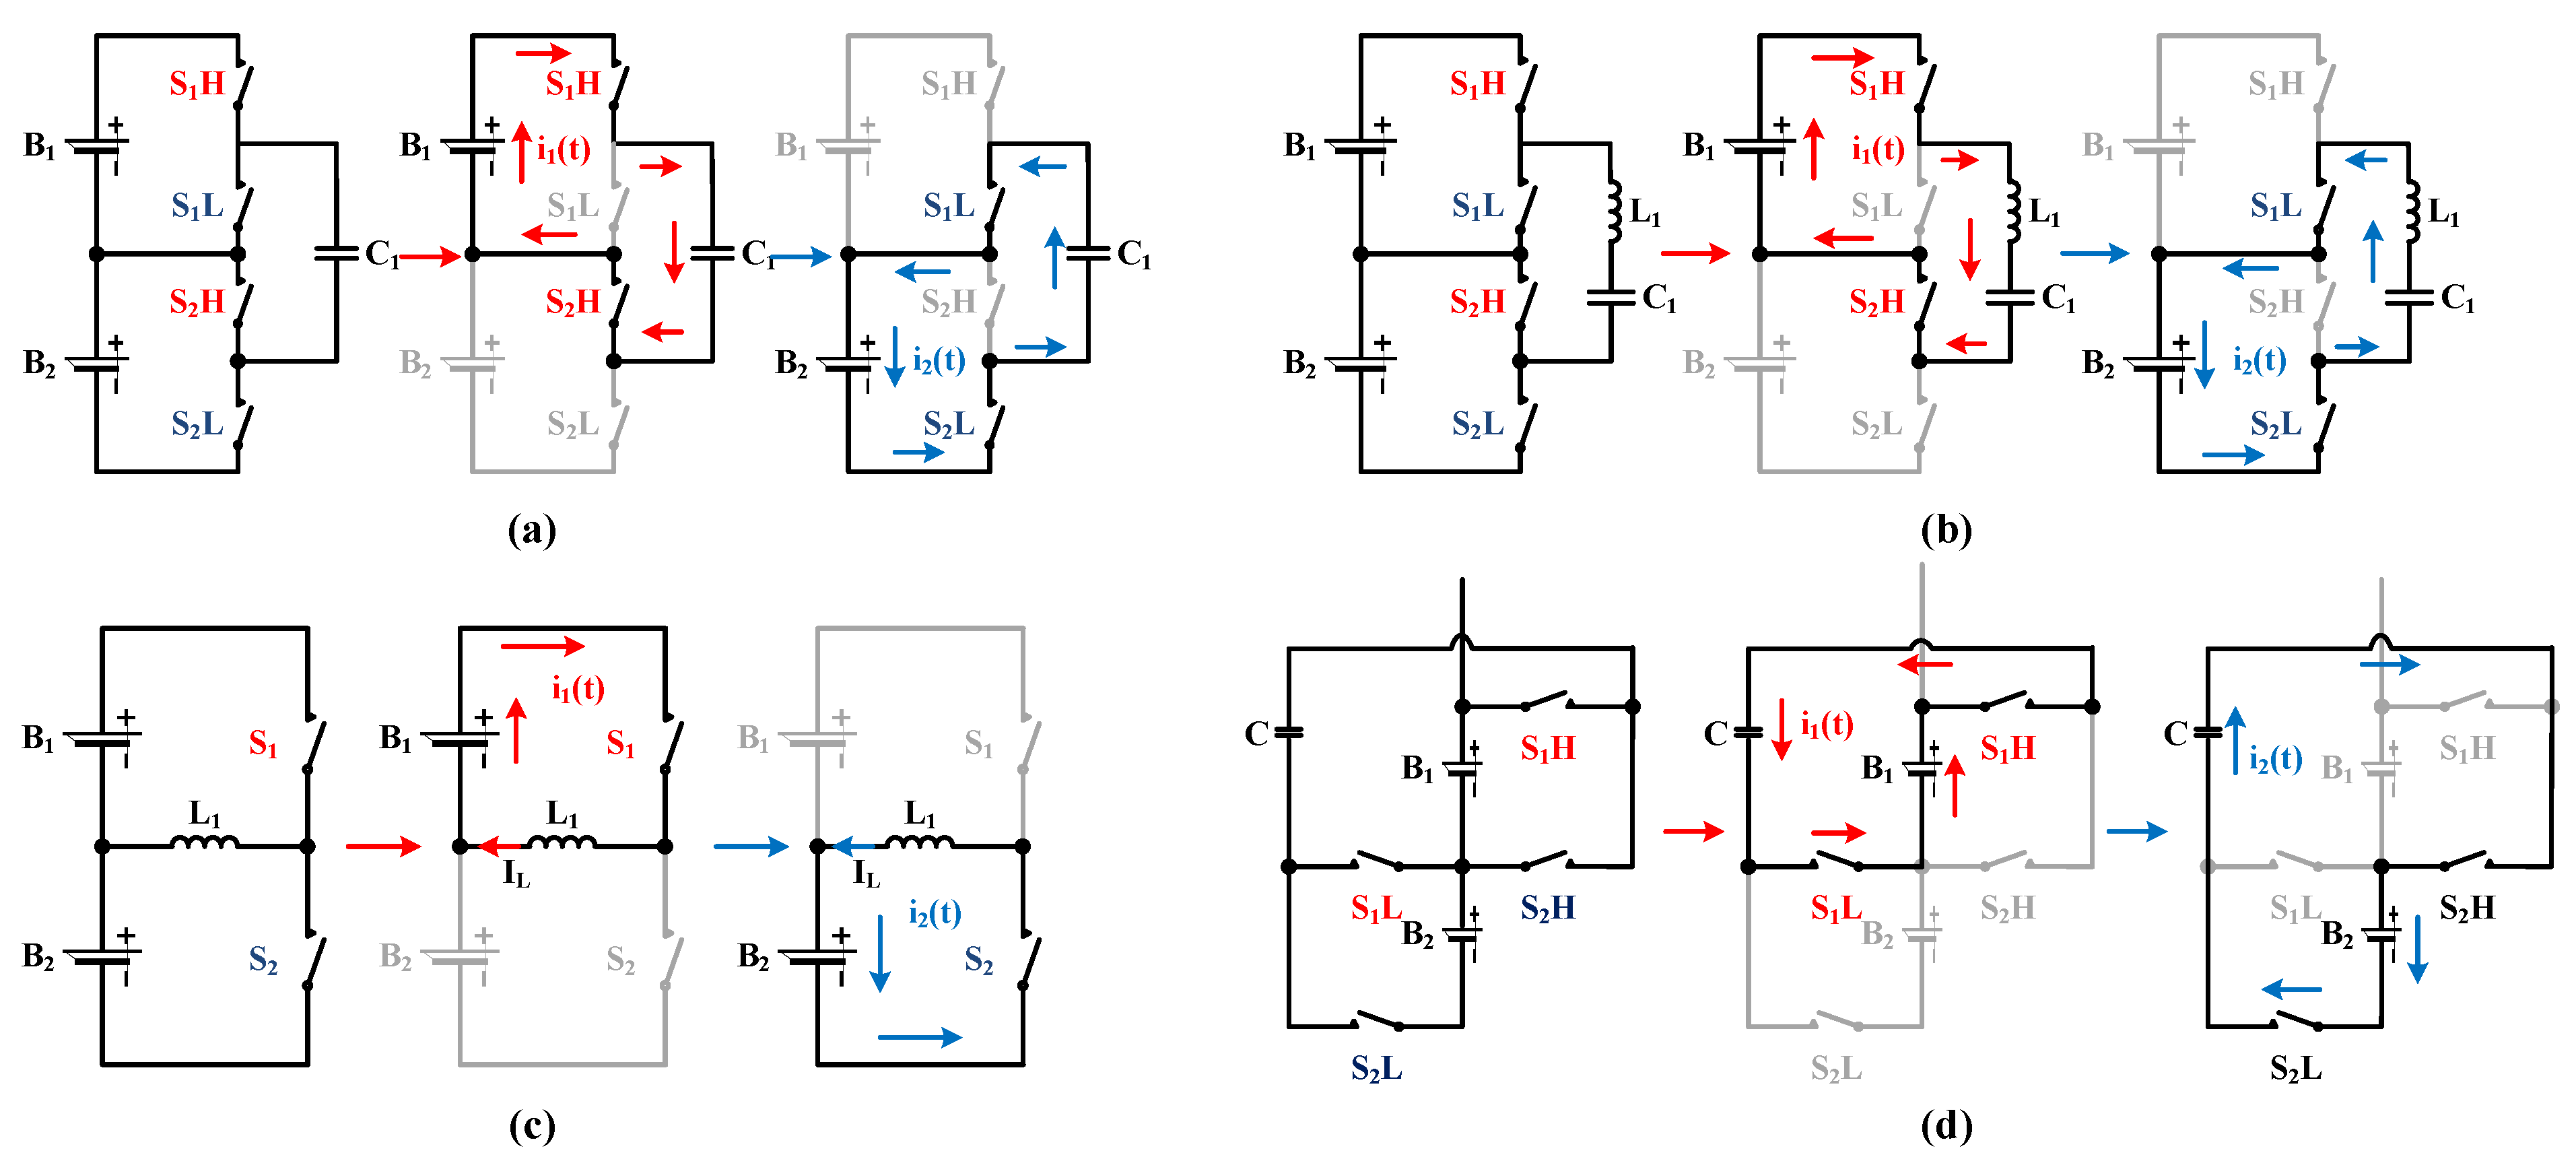
Figure 1. Operation principle of various equalizers: (a) SC-E [27], (b) SR-E [32], (c) SI-E [24], (d) SMC-E [34].
Energies 17 00631 g001
Figure 2. Evolution of average model of SET-Es: (a) simplified circuit for SET-Es, (b) conventional equivalent resistance model, (c) proposed AM.
Energies 17 00631 g002
Figure 3. SET-Es and their AM representations: (a) single-tier SI-E, SC-E, and SR-E; (b) SMC-E.
Energies 17 00631 g003
Figure 4. Theoretical waveform of the SC-E and the SMC-E.
Energies 17 00631 g004
Figure 5. Operating profiles during the equalizing process of a 4S1P battery string: (a) test setups of three platforms; (b) the hardware experiments; (c) the switching model on RTSS; (d) the AM on PSIM; (e) voltage deviation profiles from three platforms.
Energies 17 00631 g005
Figure 6. Implementation of the R E Q -based model for the simulation of the equalizing process.
Energies 17 00631 g006
Figure 7. Voltage profiles of the cells during the equalizing by RTSS, R E Q model, and AM: (a) SI-E; (b) SC-E; (c) SR-E; and (d) SMC-E.
Energies 17 00631 g007
Figure 8. SOC profiles of the cells during the equalizing by RTSS, R E Q model, and AM: (a) SI-E; (b) SC-E; (c) SR-E; (d) SMC-E.
Energies 17 00631 g008
Figure 9. Current profiles of the cells during the equalizing by RTSS, R E Q model, and AM: (a) SI-E; (b) SC-E; (c) SR-E; (d) SMC-E.
Energies 17 00631 g009
Figure 10. Initial SOC distribution of the cells in: (a) scenario # 1 ; (b) scenario # 2 ; (c) scenario # 3 ; (d) scenario # 4 ; (e) evaluation criteria.
Energies 17 00631 g010
Figure 11. Voltage profiles of the cells by: (a) SI-E; (b) SC-E; (c) SR-E; (d) SMC-E.
Energies 17 00631 g011
Figure 12. SOC profiles of the cells by: (a) SI-E; (b) SC-E; (c) SR-E; (d) SMC-E.
Energies 17 00631 g012
Figure 13. Performance consistency under various test scenarios of: (a) SI-E; (b) SC-E; (c) SR-E; (d) SMC-E.
Energies 17 00631 g013
Figure 14. Charge exchange between the cells during the equalizing process: (a) capacity level of the cells before and after the equalizing process; (b) amount of change in charge of the cells.
Energies 17 00631 g014
Table 1. Simulation settings.
TopologySI-ESC-ESR-ESMC-E
Circuit Parameters f s w = 20  kHz f s w = 20  kHz f s w = 15  kHz f s w = 20  kHz
L = 400  µH C = 2200  µF C = 200  µF C = 2200  µF
R 1 = R 2 = 0.15 Ω R 1 = R 2 = 0.15 Ω L = 0.47  µH R 1 = R 2 = 0.15 Ω
R L = 0.01 Ω D 1 = D 2 = 0.45 R 1 = R 2 = 0.15 Ω D 1 = D 2 = 0.45
D = 0.5 D 1 = D 2 = 0.45
Initial SOC S O C 1 , 2 , 3 , 4 = 70 , 80 , 95 , 85 [ % ]
Disclaimer/Publisher’s Note: The statements, opinions and data contained in all publications are solely those of the individual author(s) and contributor(s) and not of MDPI and/or the editor(s). MDPI and/or the editor(s) disclaim responsibility for any injury to people or property resulting from any ideas, methods, instructions or products referred to in the content.