1. Introduction
The transportation industry is witnessing a notable trend toward adopting electric vehicles (EVs). The International Energy Agency (IEA) reported that in 2020, the number of EVs in use globally exceeded 10 million, marking a 41% increase from the previous year, and EV sales reached a record 3.1 million, despite the impact of the COVID-19 pandemic [
1]. The growth of the EV market is projected to continue in the coming years, driven by government policies, technological advancements, and consumer demand for ecofriendly transportation. The IEA predicts that by 2030, the number of EVs on the road will be between 140 million and 245 million, depending on the level of government support and climate goals [
1]. As EV adoption increases, the demand for electricity to power these vehicles is also increasing rapidly, with EVs consuming approximately 20 billion kWh of electricity worldwide in 2020. The IEA estimates that by 2030, EVs could consume up to 280 billion kWh of electricity annually, equivalent to countries such as Indonesia and the Netherlands. Although the shift towards electric vehicles (EVs) can enhance air quality and decrease greenhouse gas emissions, it also introduces novel obstacles for the electricity domain, such as coping with the surge in electricity demand and constructing enough charging stations to cater to the expanding number of EVs on the streets [
2].
As electric vehicle (EV) adoption grows, significant challenges arise for the energy grid, particularly concerning charging stations. Firstly, the energy grid must be able to manage the increased demand for electricity to power the charging stations, leading to grid congestion and increased energy prices, particularly during peak charging periods. Secondly, renewable energy sources intermittently (such as solar and wind) can create challenges for charging stations that rely on these sources for power. Thirdly, the location of charging stations can also pose challenges for the energy grid, as they may require significant upgrades to the local distribution network to support increased power demand. Finally, there is a need for charging technology and infrastructure standardization to ensure interoperability and ease of use for EV drivers [
3]. Addressing these challenges will be critical in enabling the widespread adoption of EVs and the development of a sustainable, low-emission transportation system [
4].
Predicting the energy consumption of electric vehicle (EV) charging stations is crucial for planning and managing the charging infrastructure and optimizing the use of energy resources. Various techniques have been proposed to predict the energy consumption of EV charging stations, which can be broadly categorized into model-based and data-driven approaches [
5].
Model-based approaches involve developing mathematical models that describe the charging process and the energy consumption of EVs. These models take into account various factors, such as the battery characteristics of the EV, the charging station’s power output, and the charging protocol used. Model-based approaches can provide accurate energy consumption predictions but require a significant amount of data and computational resources [
6].
Data-driven approaches, on the other hand, use machine learning algorithms to analyze historical charging data and predict future energy consumption. These approaches are data-driven, which means that they do not rely on prior knowledge about the charging process. Data-driven techniques can be less accurate than model-based approaches, but they are easier to implement and require fewer computational resources [
7].
Several studies have investigated different techniques for predicting the energy consumption of EV charging stations. For example, some studies have proposed using artificial neural networks (ANNs) to predict the energy consumption of EV charging stations based on historical charging data. Other studies have explored the use of clustering techniques to group EV charging sessions based on charging behavior and predict future energy consumption based on these clusters. Overall, predicting the energy consumption of EV charging stations is an important research area with numerous challenges and opportunities for improvement. By accurately predicting energy consumption, charging infrastructure can be better planned and managed, leading to a more efficient and sustainable transportation system [
8,
9].
Climate change is one of the significant global challenges that the world community is facing. Due to the threat of global warming, there are public health risks arising from poor air quality and harmful fine particles. Nuclear and renewable energy sources, which were previously considered separate, may now have found common ground and can work together to address these challenges. Recent technological advancements now allow nuclear power, which has traditionally provided baseload power, to provide load-following flexibility, making it an ideal partner for renewable energy. This can help to manage the uncertainty and unpredictability associated with renewables. Additionally, the progress in the small modular reactor (SMR) technology means that it can be deployed to remote areas, further facilitating the integration of the two energy resources [
10].
Nuclear-renewable hybrid energy systems are increasingly being recognized as a promising solution to meet the world’s increasing energy demands while reducing greenhouse gas emissions. According to the International Atomic Energy Agency (IAEA), in 2020, nuclear power plants generated approximately 10% of the world’s electricity, while renewable energy sources (excluding hydro) generated 10.3%. By combining these two sources, hybrid energy systems can provide a stable and reliable source of energy, reduce carbon emissions, and increase the overall efficiency of the energy system [
11].
One of the benefits of nuclear-renewable hybrid energy systems is their ability to provide continuous power while adapting to fluctuating demand. Nuclear power provides a stable and reliable source of baseload power, while renewable energy sources such as solar and wind can provide variable power based on environmental conditions. By combining these sources, hybrid systems can provide a stable source of energy that adapts to the changing energy demands. Another advantage of hybrid energy systems is their ability to reduce greenhouse gas emissions. According to a study by the Massachusetts Institute of Technology (MIT), hybrid systems that combine nuclear and renewable energy sources can reduce carbon emissions by up to 90% compared to fossil fuel-based systems [
12]. By reducing carbon emissions, hybrid energy systems can help mitigate the impacts of climate change.
In addition, an N-RHES can provide surplus energy that can be used to produce hydrogen as a storage system and charge fuel cell vehicles. Hydrogen is a flexible energy carrier that can be used to power electric vehicles, heat houses, and produce electricity. According to the International Energy Agency (IEA), hydrogen has the potential to account for up to 18% of the world’s final energy consumption by 2050. In addition, hydrogen fuel cell vehicles (FCVs) are becoming increasingly popular, with FCV sales reaching over 10,000 units in 2020 [
13,
14].
In an N-RHES, the surplus energy generated by nuclear and renewable energy sources is used to power an electrolyzer, which produces hydrogen from water. The hydrogen is then stored in a tank and can be used to power fuel cell vehicles or be converted back into electricity via a fuel cell. This approach can help to integrate intermittent renewable energy sources into the energy system while providing a clean and sustainable energy carrier [
15]. Several countries, including Japan, Germany, and the United States, have invested in developing hydrogen fuel cell vehicles and infrastructure. The Japanese government has set a target of having 800,000 FCVs on the road by 2030, and Germany has announced plans to invest over 9 billion euros in hydrogen technology by 2023. In the United States, the Department of Energy has set a target of reducing the cost of hydrogen production to USD 2 per kilogram by 2028, making hydrogen competitive with gasoline on a cost-per-mile basis [
16]. By using surplus energy from an N-RHES to produce hydrogen, countries can further promote the use of hydrogen fuel cell vehicles and reduce their dependence on fossil fuels.
Overall, the power system is evolving into a larger, more complex, and integrated system that is closely linked with transportation and other energy systems. This evolution has a significant impact on the reliability and operation of power systems, as well as the competitiveness of nuclear plants and the tools used for planning power systems analysis. Therefore, this paper aims to develop a predictive and adaptive control strategy to optimize the energy management of Nuclear Renewable-Hybrid Energy Systems for Fast Charging Stations. The focus is on evaluating the performance of load following in nuclear reactors and its integration with a hybrid energy system. The model analyses the options for powering a fast-charging station, including the use of nuclear reactors, photovoltaics, and wind turbines, as well as the possible storage media, such as a hydrogen storage fuel cell system. In the hydrogen storage system, surplus power is used to produce hydrogen through an electrolyzer, which is then stored in a tank and consumed by the fuel cell as needed.
Additionally, a dynamic model of a fast-charging station is presented to predict electricity consumption behavior during charging processes by generating probabilistic forecasting of electricity consumption time-series profiling. Key performance indicators (KPIs) and sensitivity analyses have been carried out to demonstrate the feasibility of the proposed system. Furthermore, energy management with a control system is modeled to achieve optimum system performance.
1.1. EV Charging Infrastructure
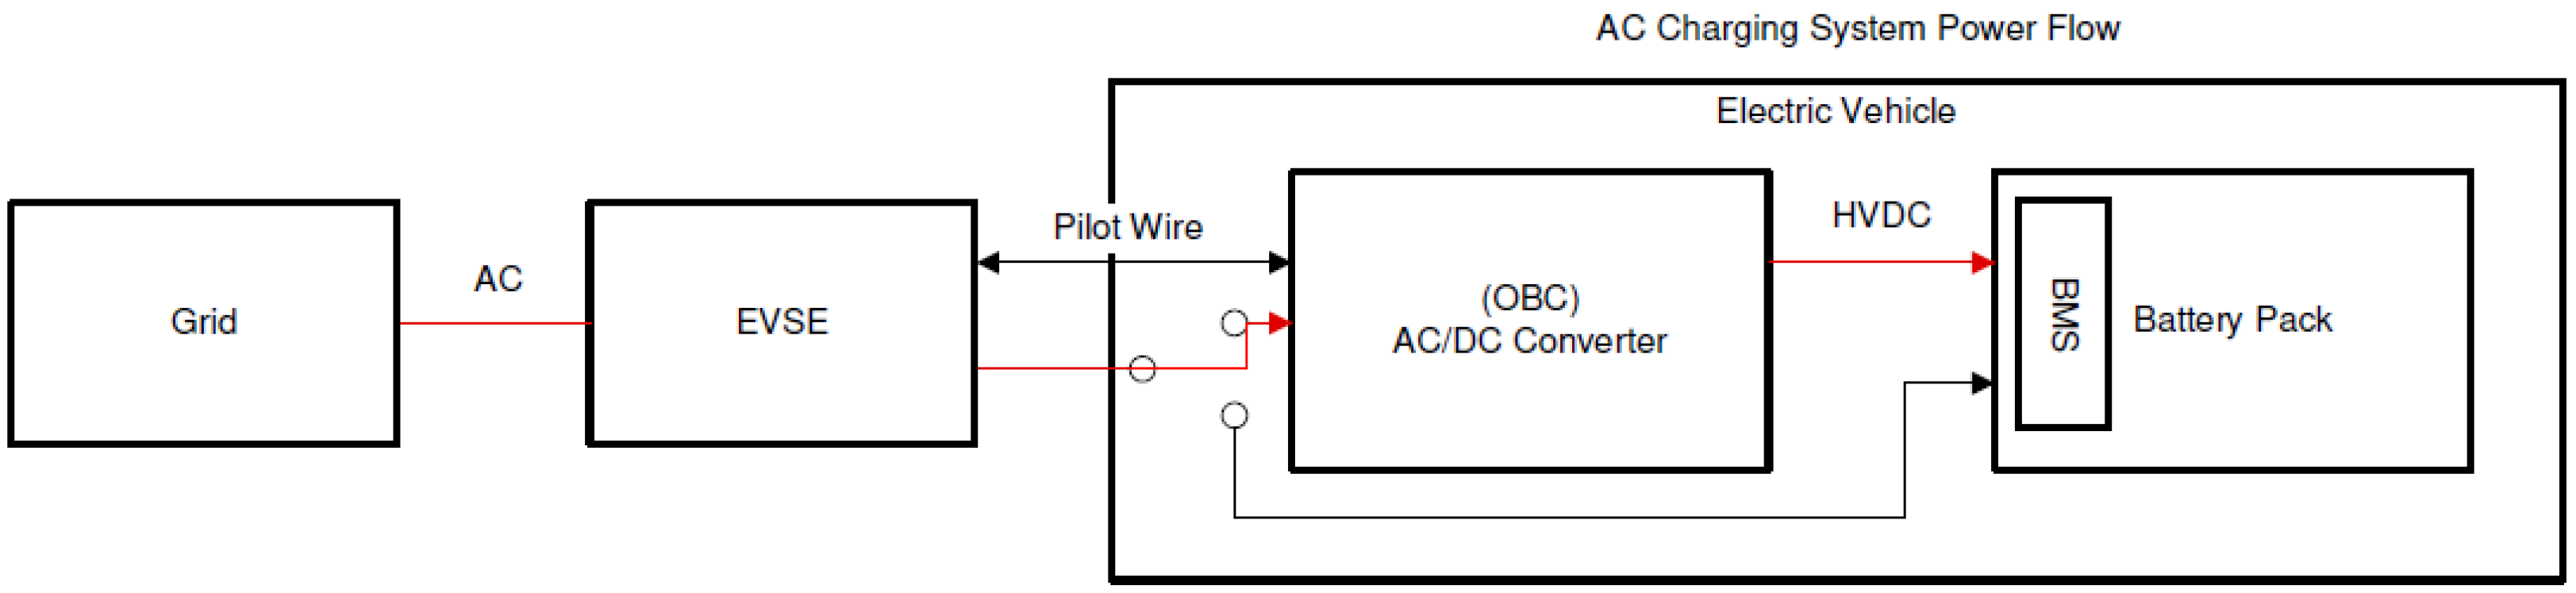
Electric vehicle charging stations are infrastructure providing power to vehicles to charge their batteries. Two types of energy networks exist: direct current (DC) and alternating current (AC). The primary distinction between these two systems is that, in an AC system, the vehicle’s onboard charger typically uses a converter to charge the battery, as shown in
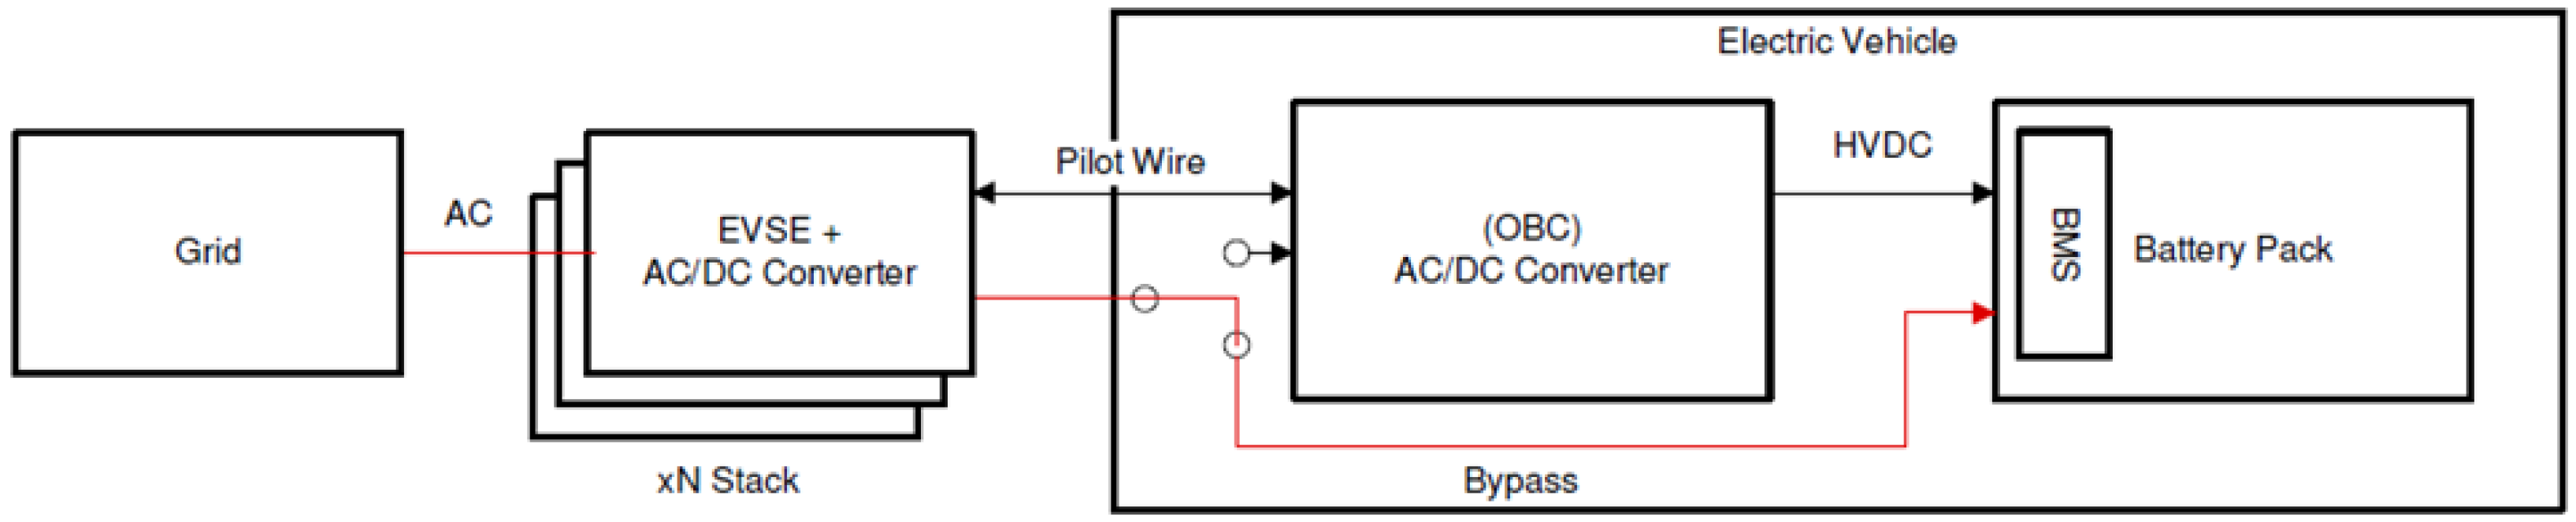
Figure 1. Conversely, a DC charger directly charges the battery of the vehicle, as shown in
Figure 2. [
17].
A charging station is also categorized into levels, as shown in
Table 1. A Level 1 charger typically employs 120 VAC/230 VAC power sources that draw current within a range of 12 A to 16 A. It can take around 12 to 17 h to fully charge a 24-kWh battery, and L1 chargers can provide a maximum power of 2 kW, suitable for residential applications. On the other hand, a Level 2 charger uses poly-phase 240 VAC sources to power a more robust vehicle charger, and the current drawn can range between 15 A and 80 A. These chargers can fully charge a 24-kWh battery in approximately 8 h, providing a power level of up to 20 kW [
18].
The DC charging station, also called the Level 3 charger, has a high-power output range of 120 to 240 kW and can typically recharge batteries up to 80% State of Charge (SOC) in less than 30 min. To achieve this fast charging, modular converters that can be stacked are used. However, if these converters are placed inside the vehicle, it increases its size and weight. The converters are installed outside the vehicle to avoid this issue, forming the EV charging station. The charging station bypasses the onboard charger by connecting directly to the vehicle’s battery [
18,
19].
1.2. The Nuclear Reactor as a Load-Following Source
For many years, nuclear reactors have primarily been used as baseload energy sources, providing a reliable and steady supply of electricity to the grid. This is because traditional nuclear reactors are designed to operate at a constant power output, and changing their power output can be challenging [
20].
However, with the increasing use of renewable energy sources, such as solar and wind, which are often intermittent in nature, there is a growing need for flexible and adaptable energy sources that can adjust their power output to match changes in electricity demand. As a result, some nuclear reactors are now being designed with load-following capabilities in mind [
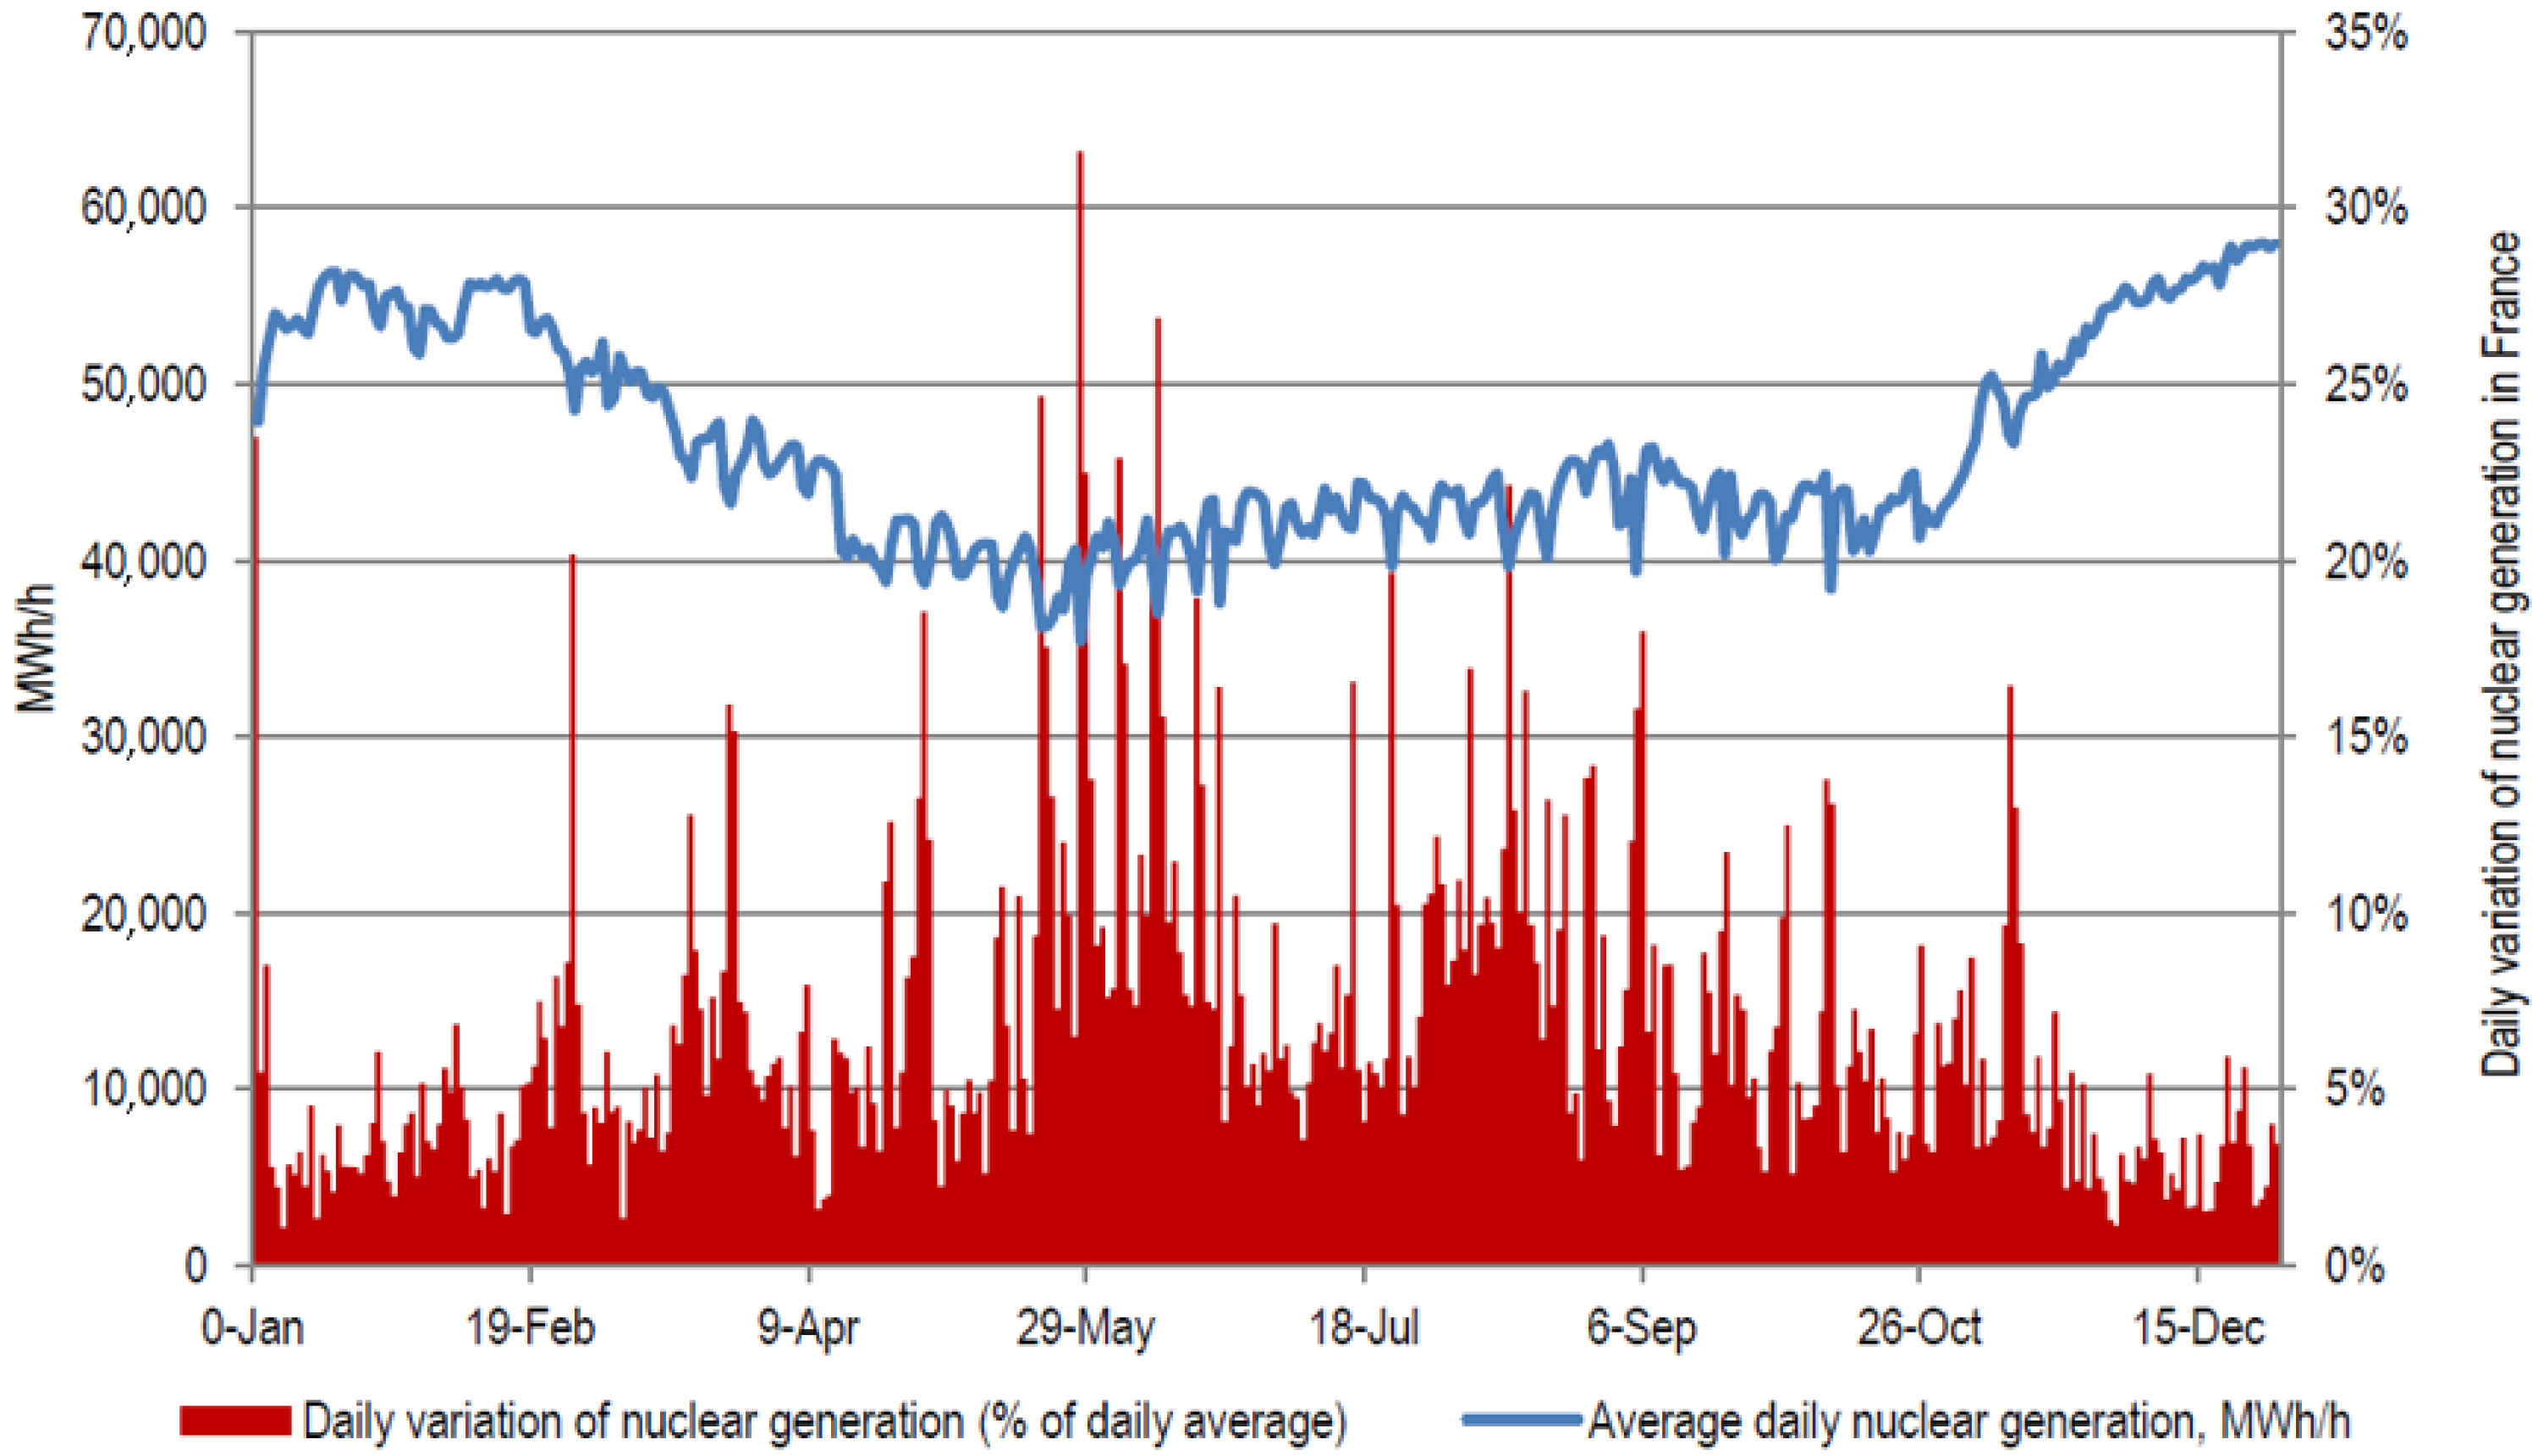
21]. Moreover, that is the case in France, where more than 75% of electricity is generated from NPPs, and the rest comes from hydropower plants, coal, gas, and fuel oil plants due to this high share of nuclear power.
Figure 3 presents the history of the total nuclear generation in France during 2010, where the average daily variation is about 6.7%. However, for some periods, the daily variation reached over 20% [
22,
23].
The deployment of renewable energy systems has seen a significant increase due to advancements in sustainable energy systems. However, the intermittence of renewable sources, particularly solar and wind, presents challenges. The development of load-following capabilities in nuclear power plants has become increasingly important as more renewable and nuclear energy sources are integrated into the same electricity grid [
21].
Nuclear power plants must be able to operate in a load-following mode to stabilize power generation fluctuations. This can be accomplished through different methods, such as controlling rod movements, adjusting boric acid concentration, or using a recirculation system. However, selecting the appropriate method depends on the design technology and power variation required [
24].
While load following is technically feasible in most nuclear reactors, it may not be economically viable due to several physical effects of power generation and regulations that limit power variations, such as the moderator effect, doppler effect, fission product poisoning, and fuel burnup. Therefore, load following requires higher control technologies for reactors than during the baseload operation [
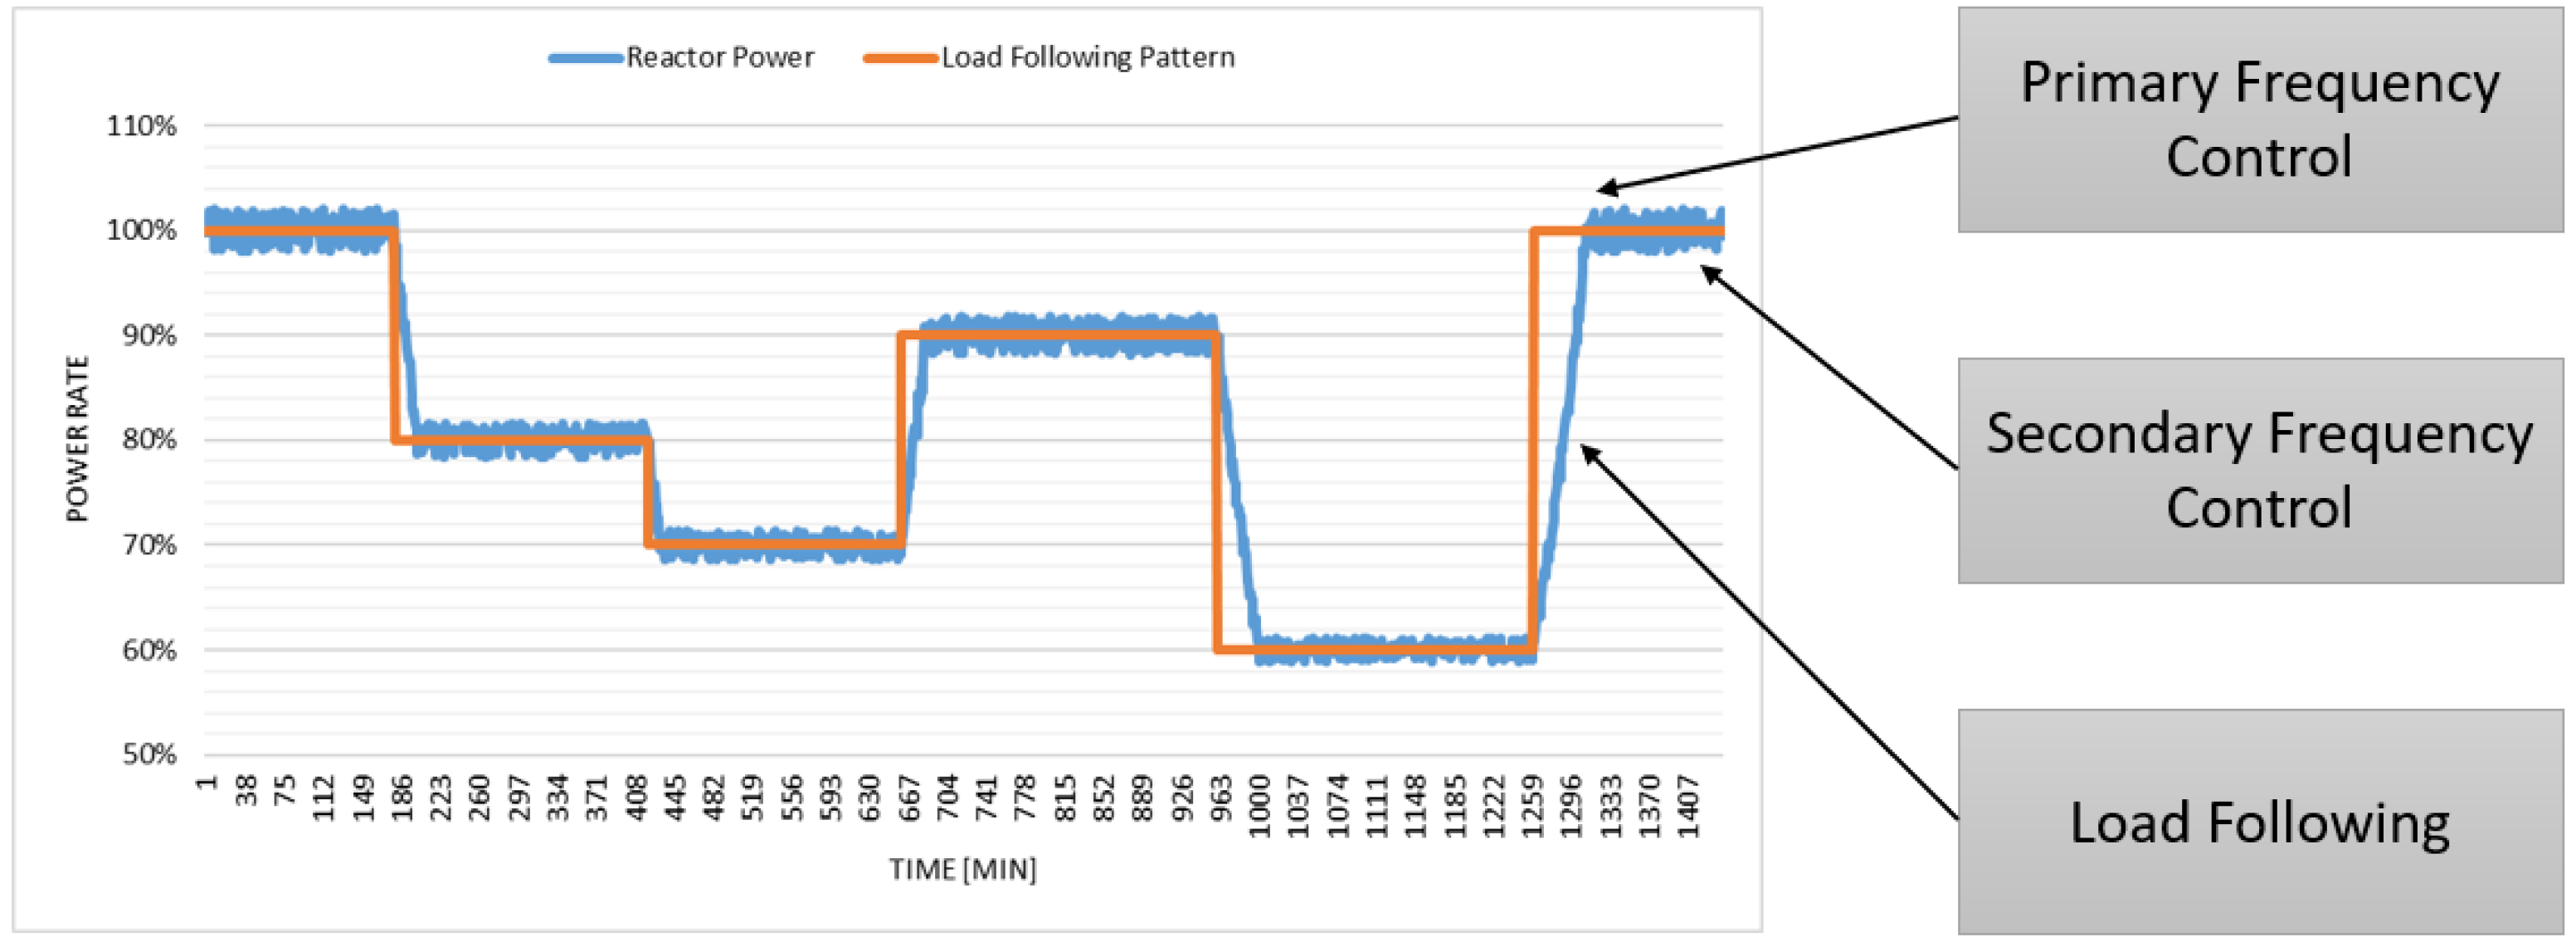
25]. Currently, nuclear power plants operate in four modes: baseload generation mode, which is the most common mode and involves operating the reactor at constant power for most of the fuel cycle, and three methods for power regulation, namely primary frequency control, secondary frequency control, and load following [
26], exemplified in
Figure 4.
As nonconventional energy grids like hybrid microgrids become more prevalent, accurately predicting power demand variations becomes more difficult. This unpredictability can result in frequency fluctuations, making it essential for Nuclear Power Plants (NPPs) to constantly monitor grid frequency and adjust their generation levels accordingly to maintain stability [
23].
Primary frequency control involves short-term adjustments to electricity production and demand in response to observed deviations in frequency. Secondary frequency control operates over longer timeframes, from seconds to several minutes, and restores precise frequency levels by calculating average frequency deviations over a period [
26].
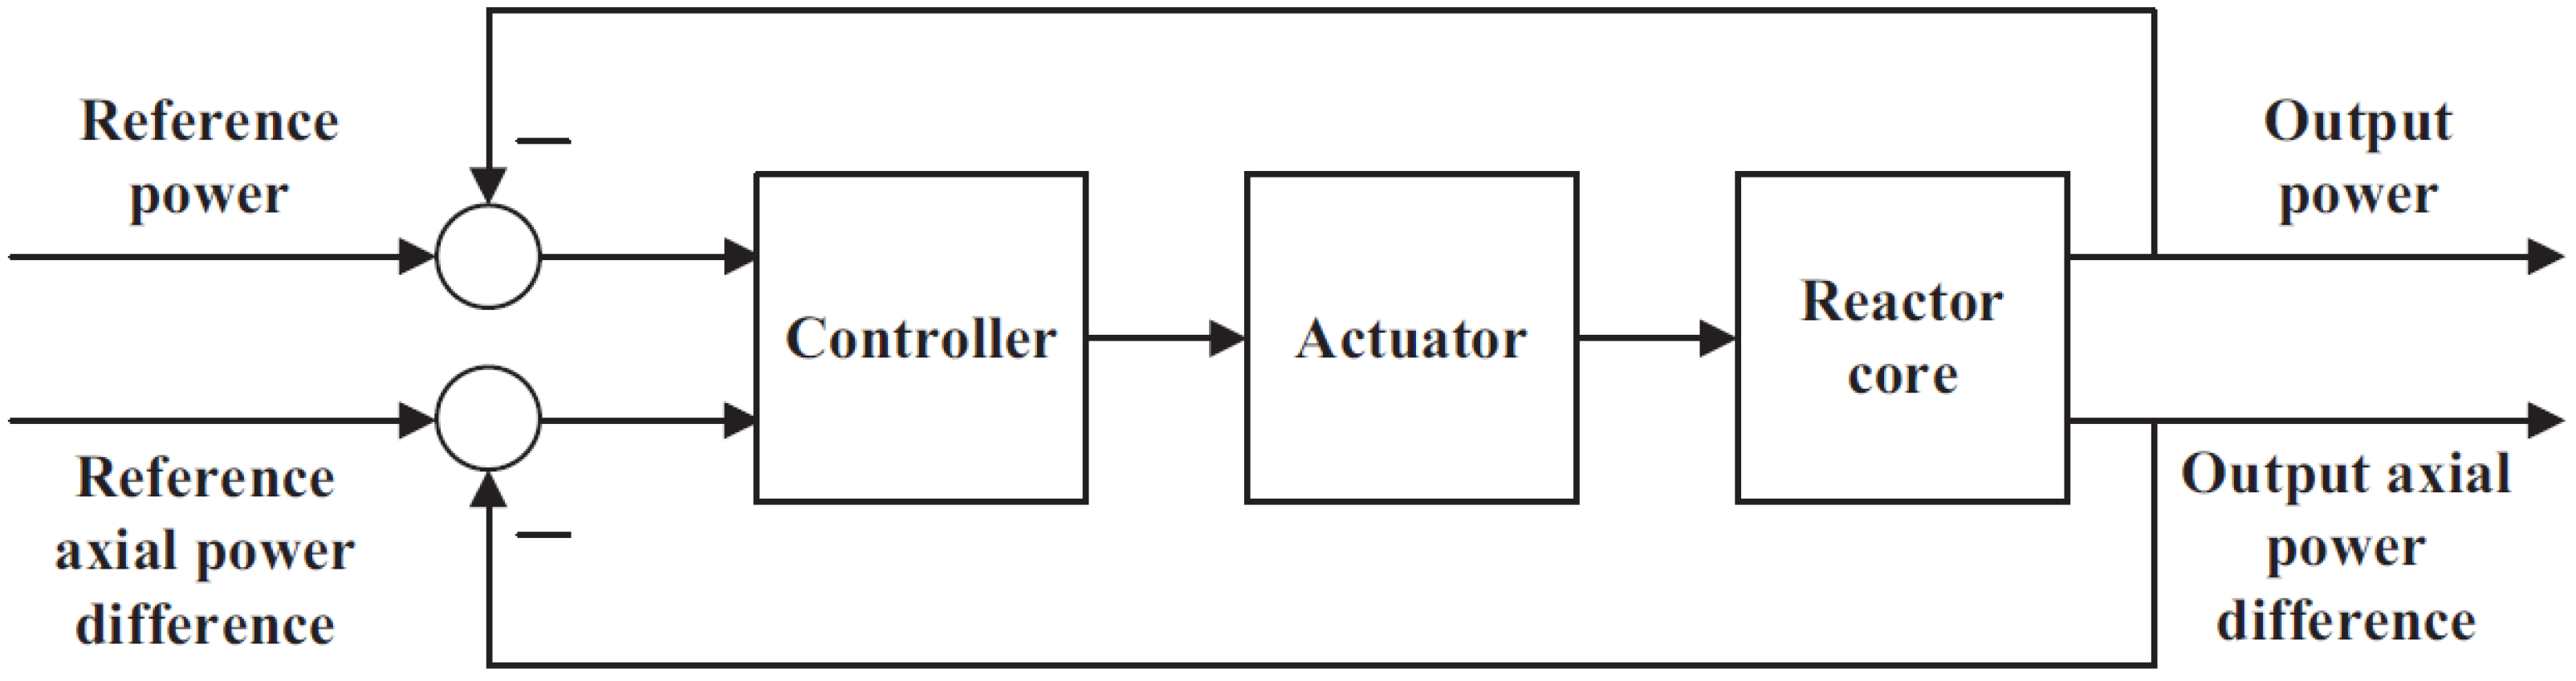
Load following is a power regulation system that enables the plant to follow a variable load power trajectory, programmed to change over time. The energy grid operators set the LF pattern based on power demand and the plant’s maneuvering capabilities. The reactor core load following control is schematically shown in
Figure 5. The control system drives the actuator, such as control rods or boron adjustments, to make the output power trajectories of the reactor core follow the reference power trajectories in real time while ensuring that the output axial power difference stays within a required target band [
24].
The load-following operation is crucial for NPPs to stabilize total power generation fluctuations, mainly when there is a significant share of nuclear and renewable energy sources on the same electricity grid. While LF is technically possible in most nuclear reactors, it may not always be economically desirable due to the significant physical effects of power generation and regulatory limitations. However, LF still requires higher control technologies for reactors than during baseload operations [
25].
Achieving reliable control of core power and the axial power difference is crucial for secure and economical operations of large reactors, such as PWRs, during load following. This operation involves significant load maneuvers on grids and multivariable regulations, which require advanced control technologies for reactors compared to traditional baseload operations.
1.3. Nuclear-Renewable Hybrid Energy System
A nuclear-renewable hybrid energy system is a type of energy system that combines the benefits of nuclear and renewable energy sources to provide a reliable, sustainable, and cost-effective source of electricity. This type of energy system utilizes both nuclear power plants (NPPs) and renewable energy sources, such as solar, wind, or hydroelectric power, to complement each other and provide a consistent and stable source of energy.
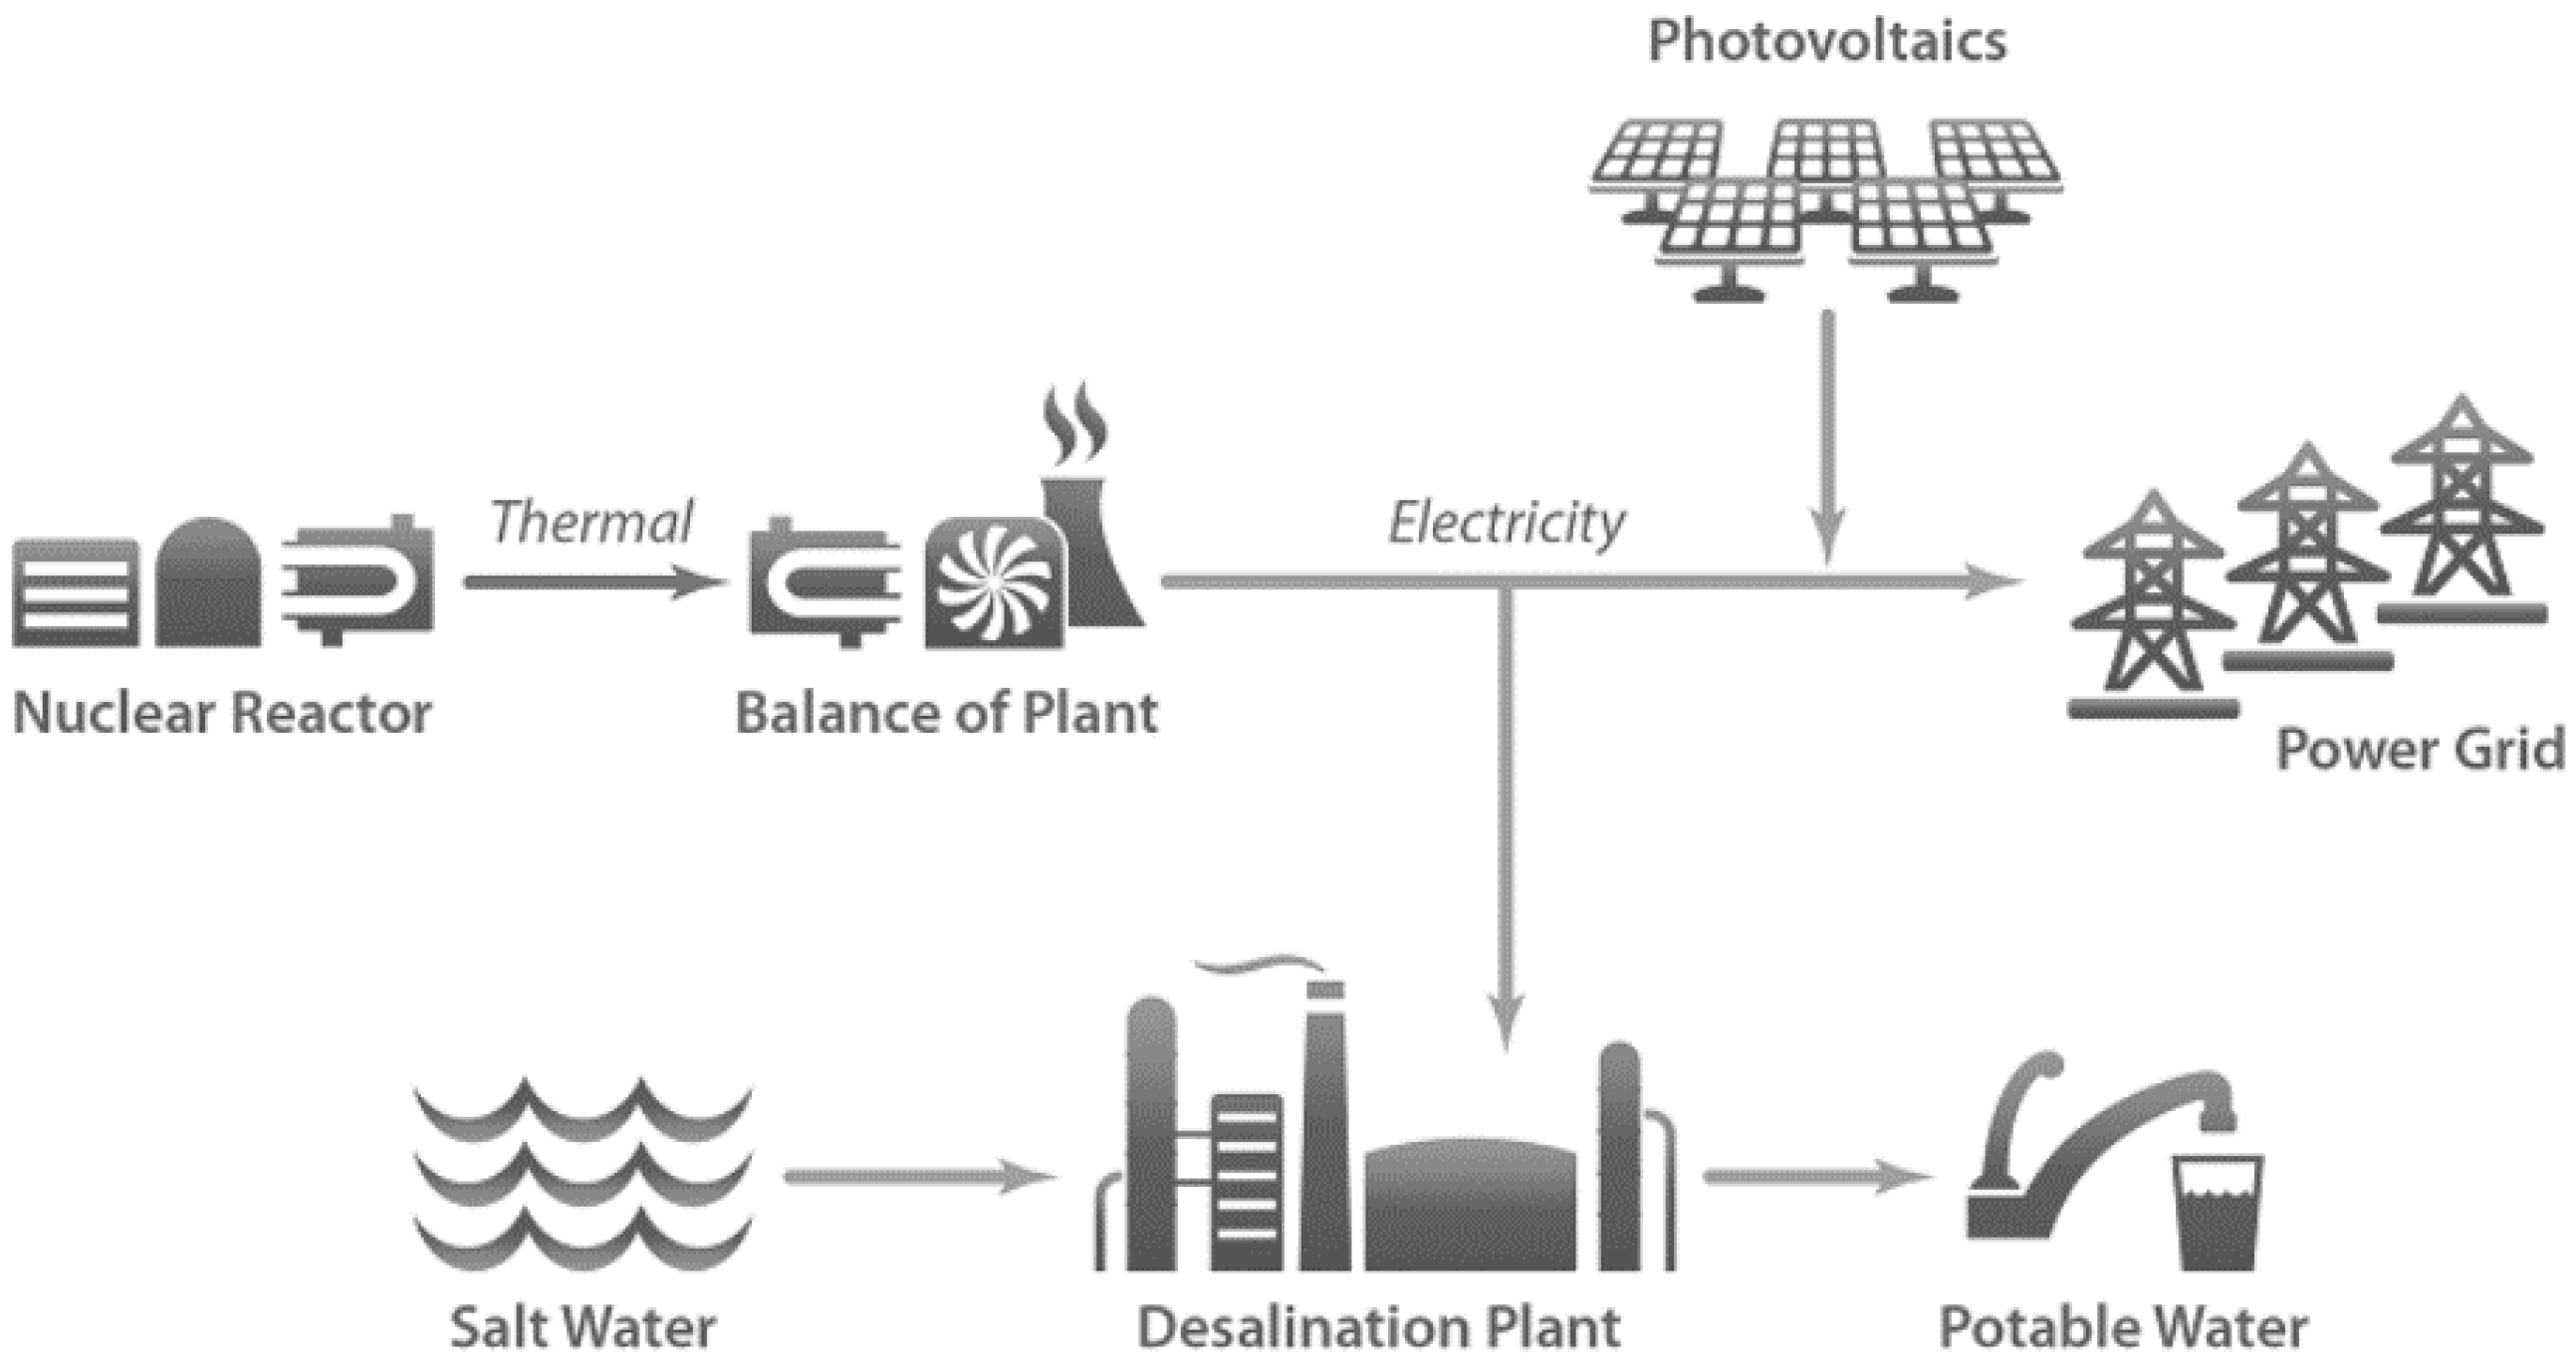
Figure 6 exemplifies the benefits of integrating novel systems for maximizing energy [
27].
The primary advantage of a nuclear-renewable hybrid energy system is that it can leverage the benefits of both nuclear and renewable energy sources to provide a sustainable and reliable source of electricity. Nuclear power plants are known for their high reliability, low carbon emissions, and ability to provide baseload power, while renewable energy sources are known for their low carbon emissions, scalability, and ability to generate power from abundant natural resources [
28].
By combining these two types of energy sources, a nuclear-renewable hybrid energy system can provide a stable and consistent source of electricity, even during periods of high demand or fluctuating weather conditions. Additionally, this type of energy system can reduce the overall carbon emissions associated with electricity generation, which is crucial in the fight against climate change [
29,
30].
Overall, a nuclear-renewable hybrid energy system has the potential to provide a sustainable and reliable source of electricity for the future, making it a critical component of global energy transition.
1.4. Hydrogen System
Recently, hydrogen has gained prominence as a potential energy carrier for decarbonizing different sectors, including power generation, industry, and transportation. The global hydrogen market size was valued at USD 131.2 billion in 2020 and is predictable to increase at a compound annual growth rate (CAGR) of 6.2% from 2021 to 2028. The demand for hydrogen is projected to increase due to the rising focus on clean energy and the adoption of hydrogen in fuel-cell vehicles [
31].
Hydrogen can be produced through various methods, including steam methane reforming, electrolysis, and coal gasification. Among these, steam methane reforming is the most used method, accounting for approximately 95% of hydrogen production globally. However, this process is highly dependent on natural gas and releases a significant amount of carbon dioxide into the atmosphere [
32]. On the other hand, the electrolysis method of hydrogen production is gaining attention due to its potential to utilize renewable energy sources, such as wind and solar, to produce hydrogen. The global electrolysis market size was valued at USD 0.8 billion in 2020 and is expected to grow at a CAGR of 24.6% from 2021 to 2028. The increasing investments in renewable energy systems and the development of hydrogen fueling infrastructure are expected to drive the growth of the electrolysis market [
33].
Moreover, hydrogen can be stored and transported efficiently, making it a versatile energy carrier. The transportation sector accounts for approximately 25% of global energy-related CO
2 emissions, and hydrogen fuel cell vehicles can play a crucial role in reducing these emissions. According to IEA, the number of hydrogen fuel cell vehicles on the road worldwide reached 11,200 in 2020, a 20% increase from the previous year [
34].
Overall, developing a sustainable hydrogen system can contribute significantly to the transition to a low-carbon economy and address the challenges posed by climate change.
2. Hybrid Energy System for Charging Stations
Charging stations, especially public ones, are unpredictable in terms of how many vehicles will charge, what power level will be used, and the initial level of the battery. Therefore, it is difficult to estimate how long the vehicle will be connected to the charging station. These stations are considered peak-demand devices, requiring high power from the grid in a short period of time. This is particularly challenging for fast-charging large vehicles, such as buses and trucks, which can require up to 450 kW of power for about 20 min. For instance, a charging station with 10 units, each with a 450 kW power charger, could demand anywhere between 0 to 4.5 MW of energy in a short period.
Ensuring grid reliability is a challenge, particularly for microgrids. The complexity increases in net-zero scenarios, such as Nuclear-Renewable Hybrid Energy Systems. To address these issues, a predictive and adaptive control strategy is needed to optimize the energy management of Nuclear-Renewable Hybrid Energy Systems for fast charging stations. This paper aims to evaluate the performance of load following in nuclear reactors and its integration with a hybrid energy system to develop such a strategy [
35].
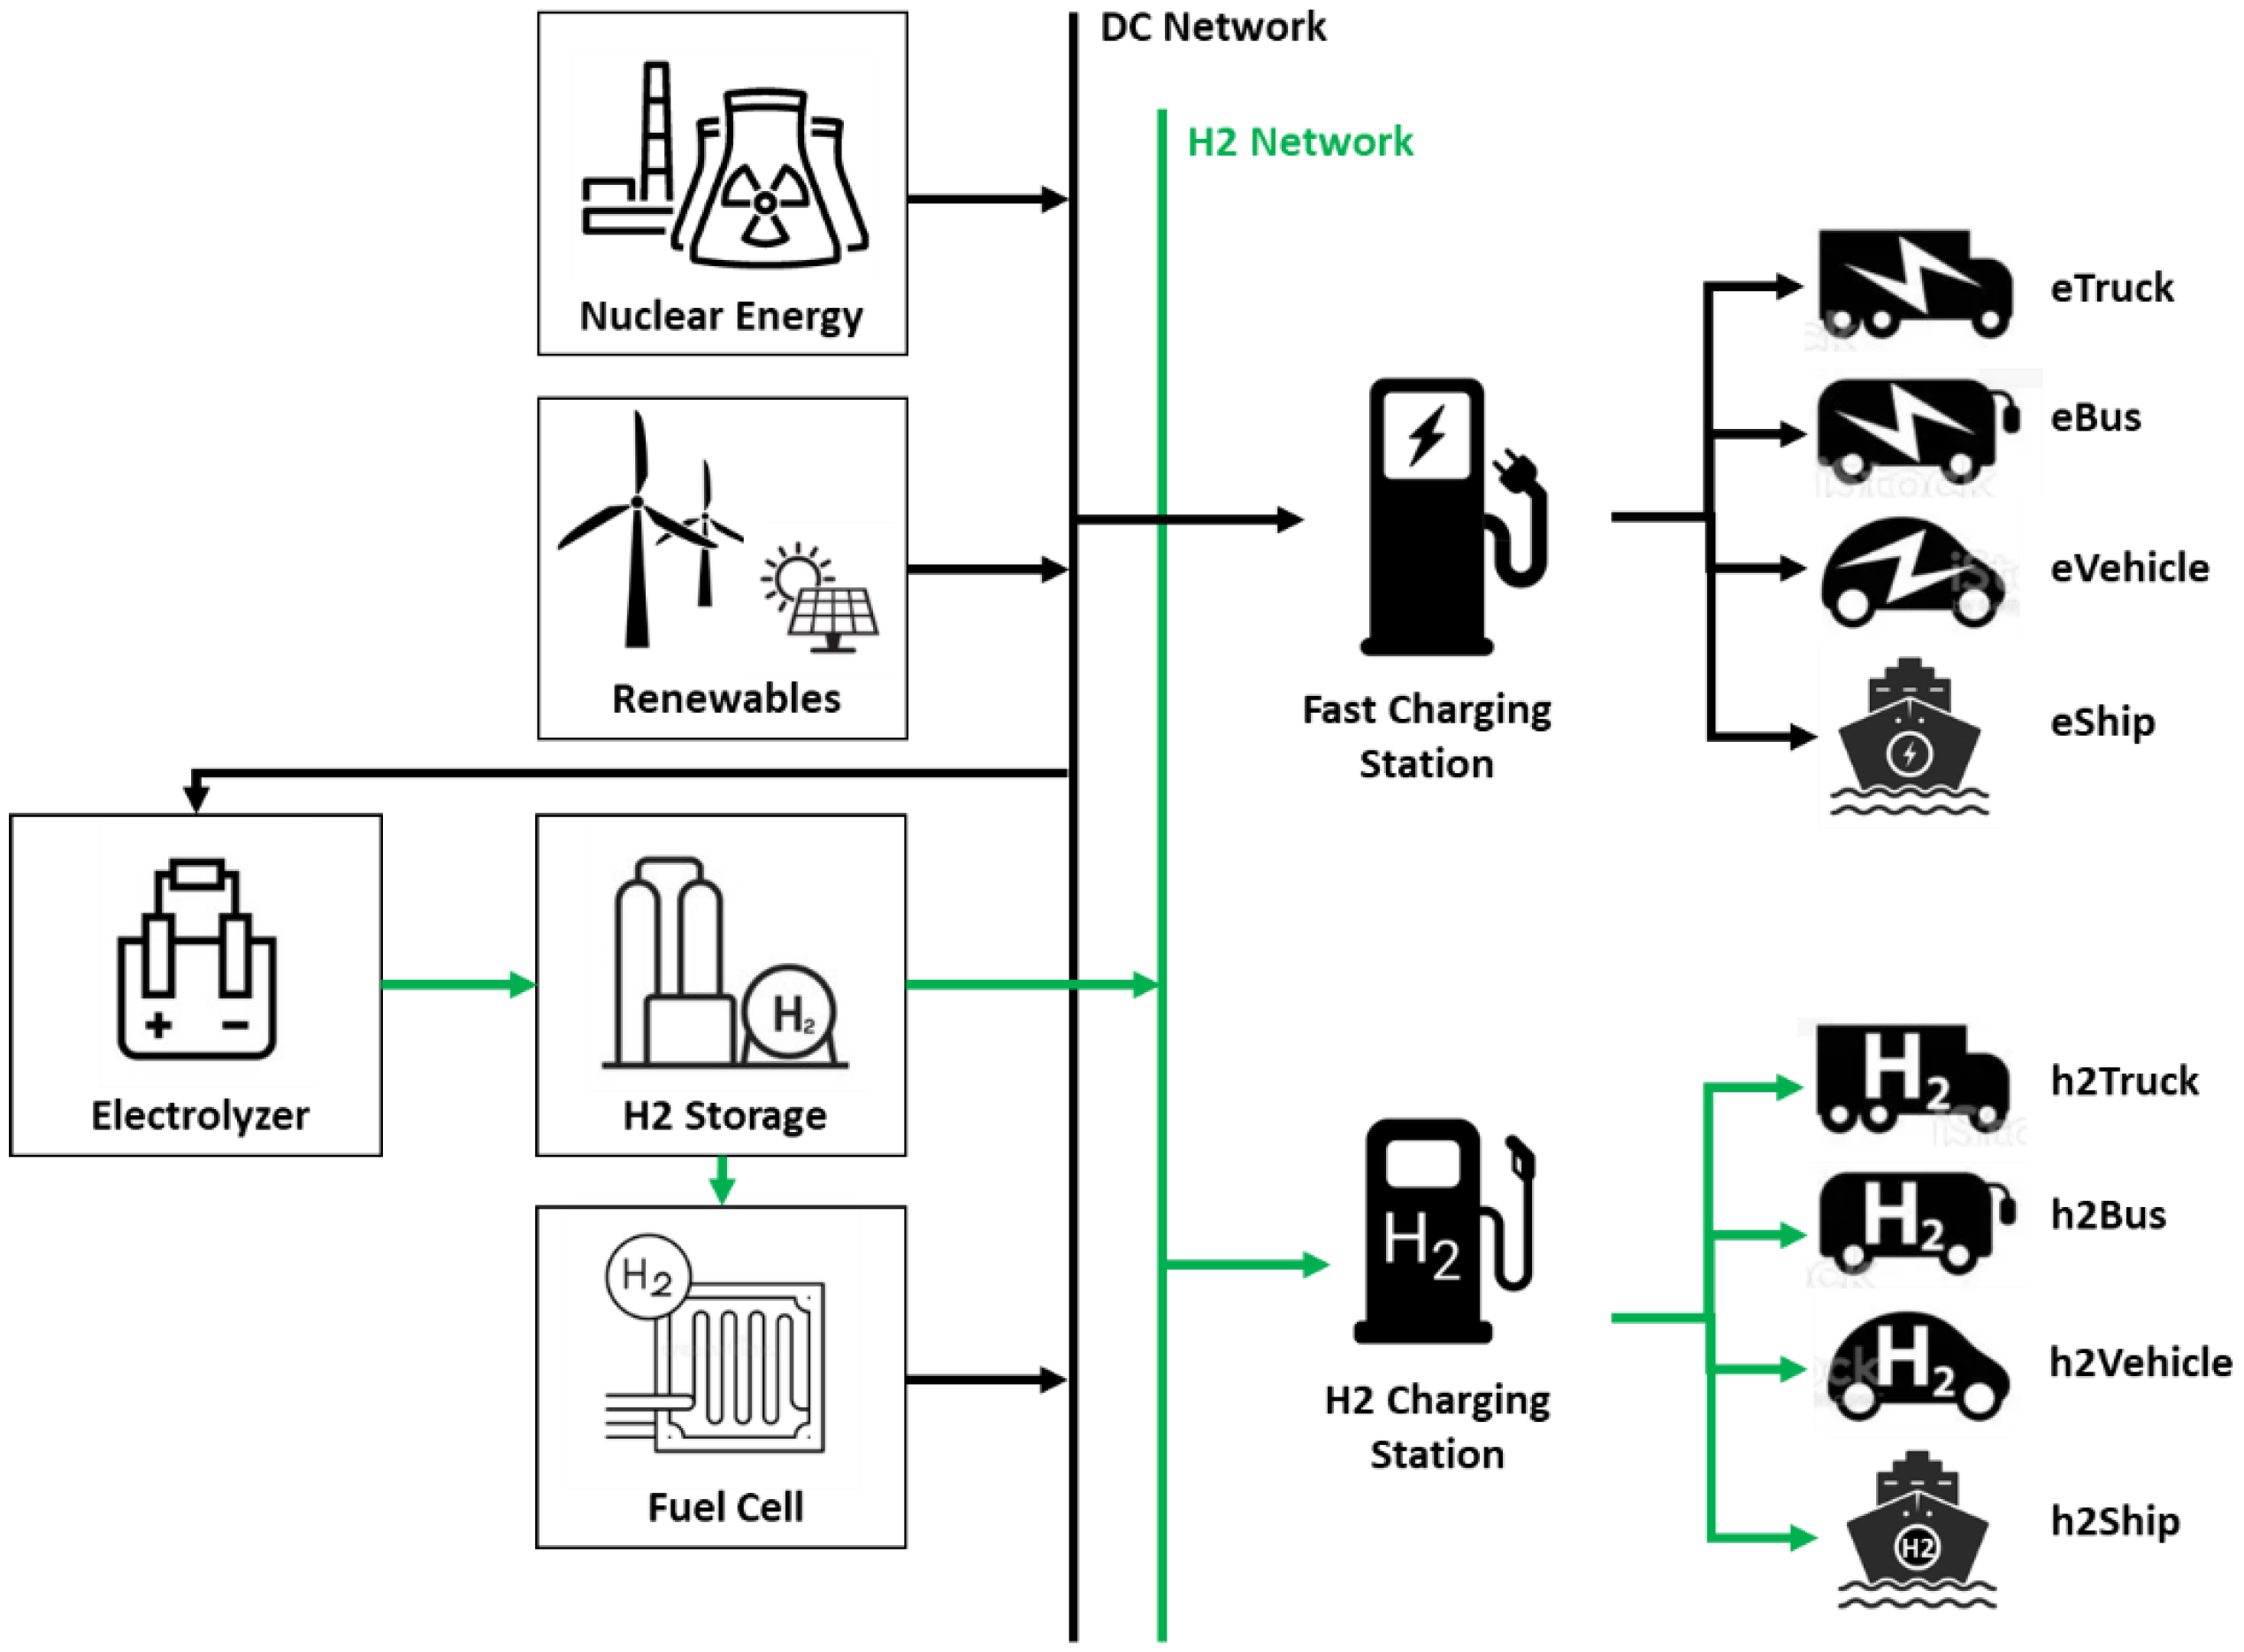
The purpose is to explore the power options available for a fast-charging station, as shown in
Figure 7. A nuclear reactor, photovoltaics, or wind turbines can power the system. A hydrogen storage fuel cell system is used to store excess energy. This system converts surplus power to hydrogen via an electrolyzer, which is stored in a tank and can be consumed by the fuel cell when required.
To accurately predict real-world conditions, a dynamic model of a fast-charging station has been developed. This model generates probabilistic forecasts of electricity consumption time-series profiling during the charging process. Two different charging station systems have been presented in
Figure 7: an electrical fast charging station, which will be used for the case study, and a hydrogen charging station, which is an alternative that utilizes the hydrogen generated from the excess energy.
2.1. Modeling Nuclear Reactor with Load Following
This study used a typical Pressurized Water Reactor (PWR) based on Rashid’s work, which utilized the H. B. Robinson Steam Electric Plant model with a four-loop PWR and U-tube steam generator [
36]. The aim of the modeling was to couple the reactor core dynamics with the steam generator dynamics, but this was a challenging task due to the nonlinearity of the nuclear steam generator system model. To overcome this, the study employed the advanced simulation software MATLAB-Simulink, which utilized state space representation to facilitate the modeling calculations. State space representation is a computational approach that organizes multivariable systems with input, output, and state variables.
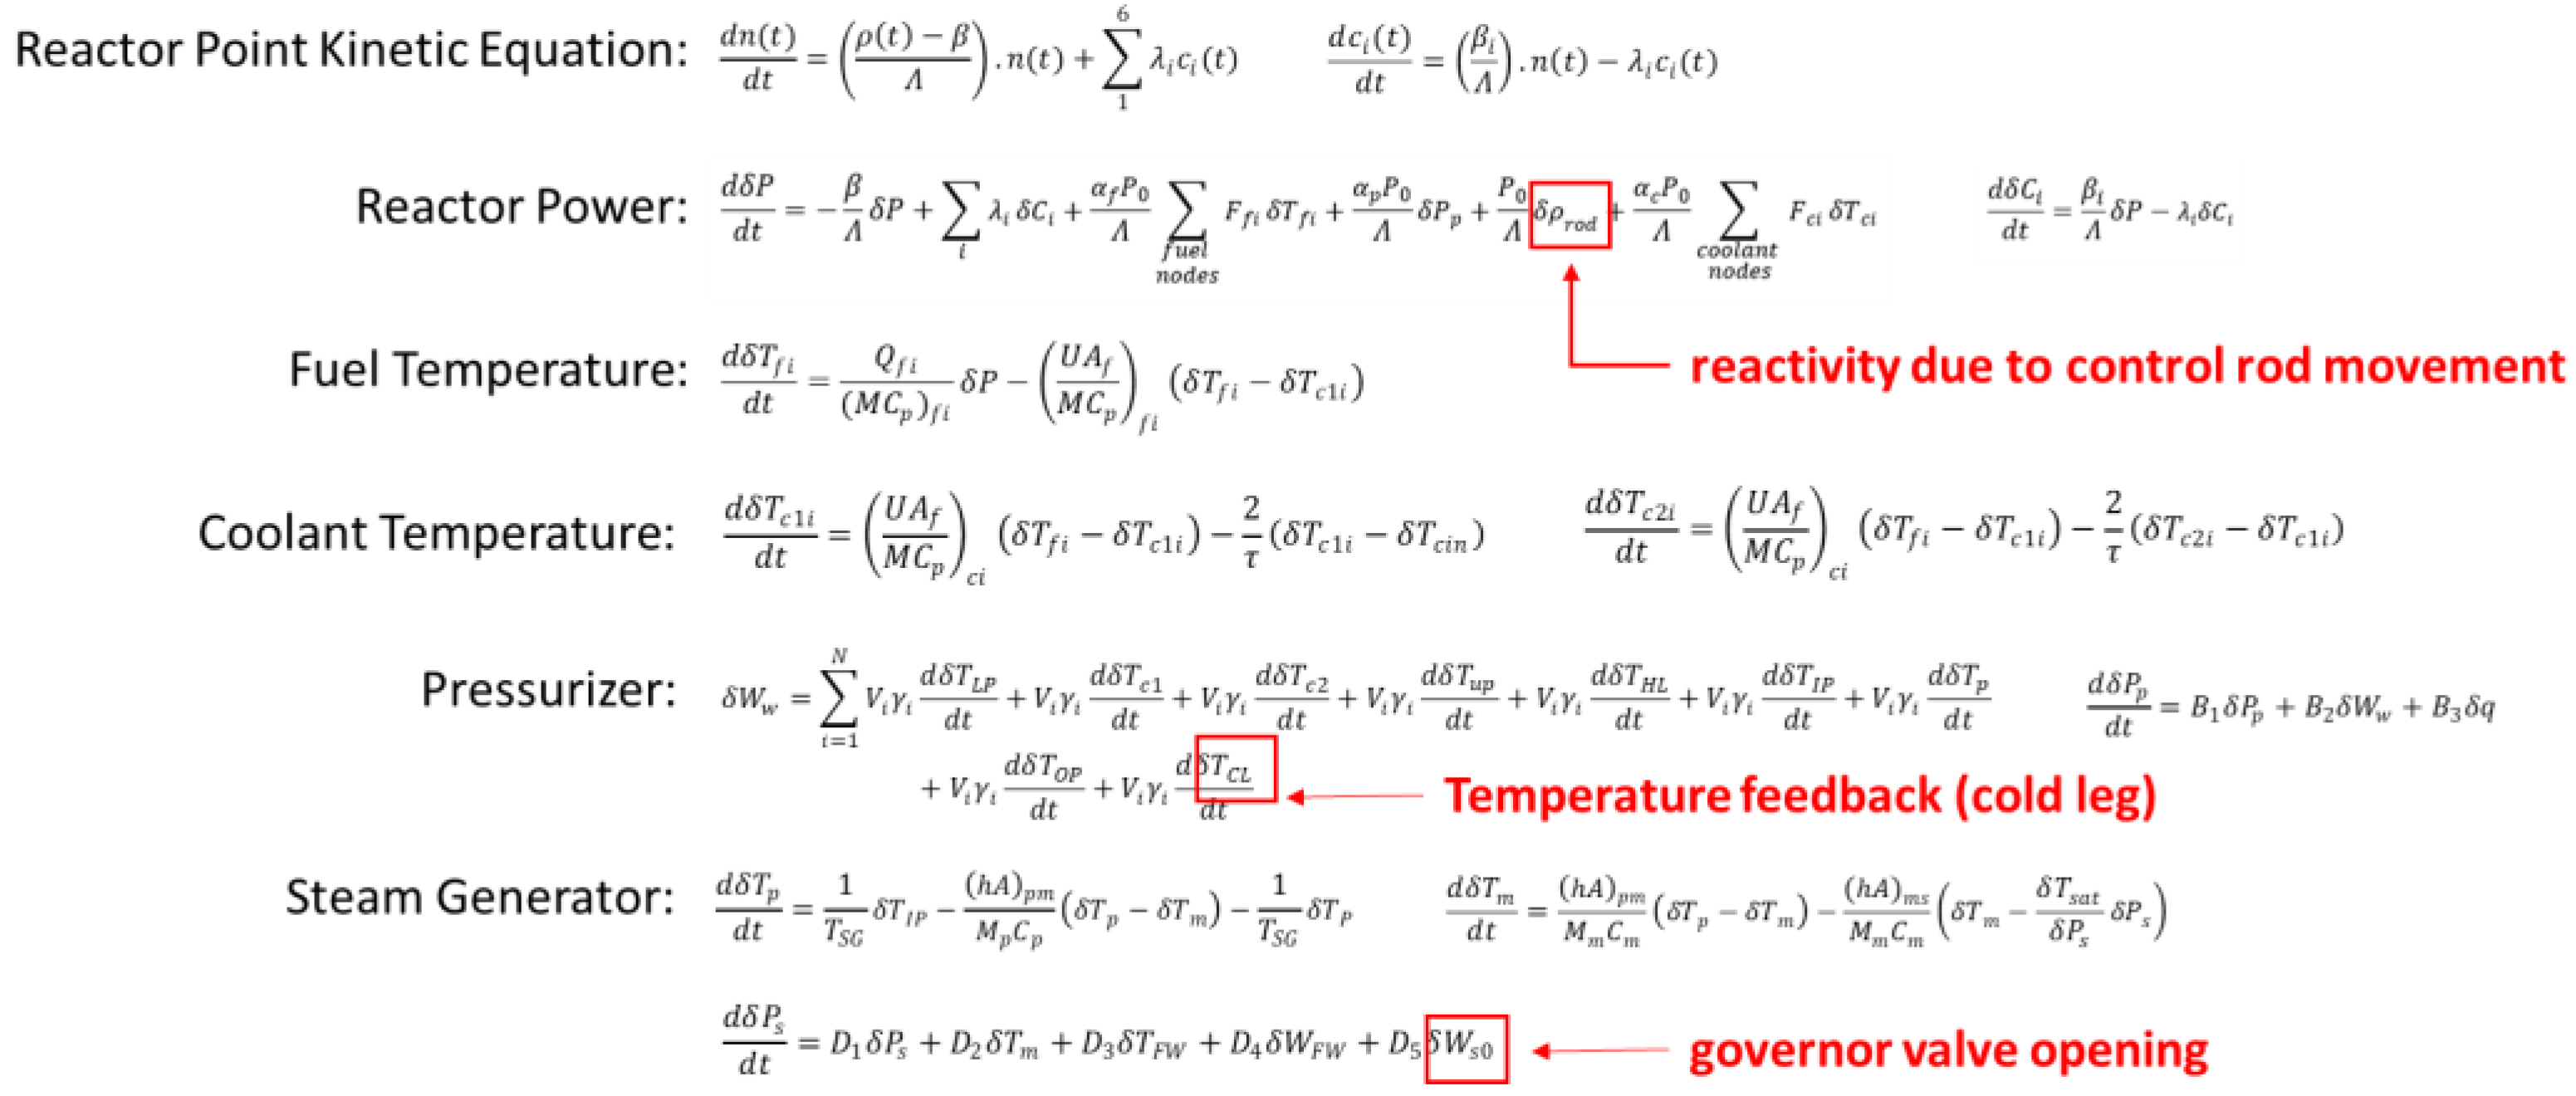
The nuclear model comprised several subsystems, including neutronics, core thermal-hydraulics, a T-average controller, piping and plenums, a pressurizer and its controller, and a U-tube steam generator modeling and control. The neutronics subsystem used point kinetics with six delayed neutron groups and included nonlinear terms. The core thermal−hydraulic model had three axial sections, with each section consisting of one fuel node and two coolant nodes, resulting in nine differential equations. The T-average controller utilized the average coolant temperature as input to adjust the reactivity introduced by control rods. The piping and plenums included two piping systems for the hot and cold leg, four plenums for the steam generator input and output, and the reactor upper and lower, assuming mixed volumes. The pressurizer was represented by determining energy and volume balance, as well as the mass in the pressurizer, reflected by water expansion in the coolant nodes in the primary loop. Finally, the U-tube steam generator model and control used a simple steam generator schematic with three subsystems: the primary fluid, the secondary fluid, and the tube metal. The paper also assumed no control action for the steam generator and that the proposed design would only be applied for small perturbations. For a comprehensive understanding of all modeling processes, it is recommended that readers refer to the cited sources [
37] for a detailed description of modeling and transient simulation. Due to space limitations, mathematical approaches and equations are omitted in this text. The software MATLAB/Simulink was utilized in this study to facilitate state space representation calculation and system time response analysis.
Figure 8 demonstrates the primary function of controlling reactor output power by identifying the variables influencing power variation.
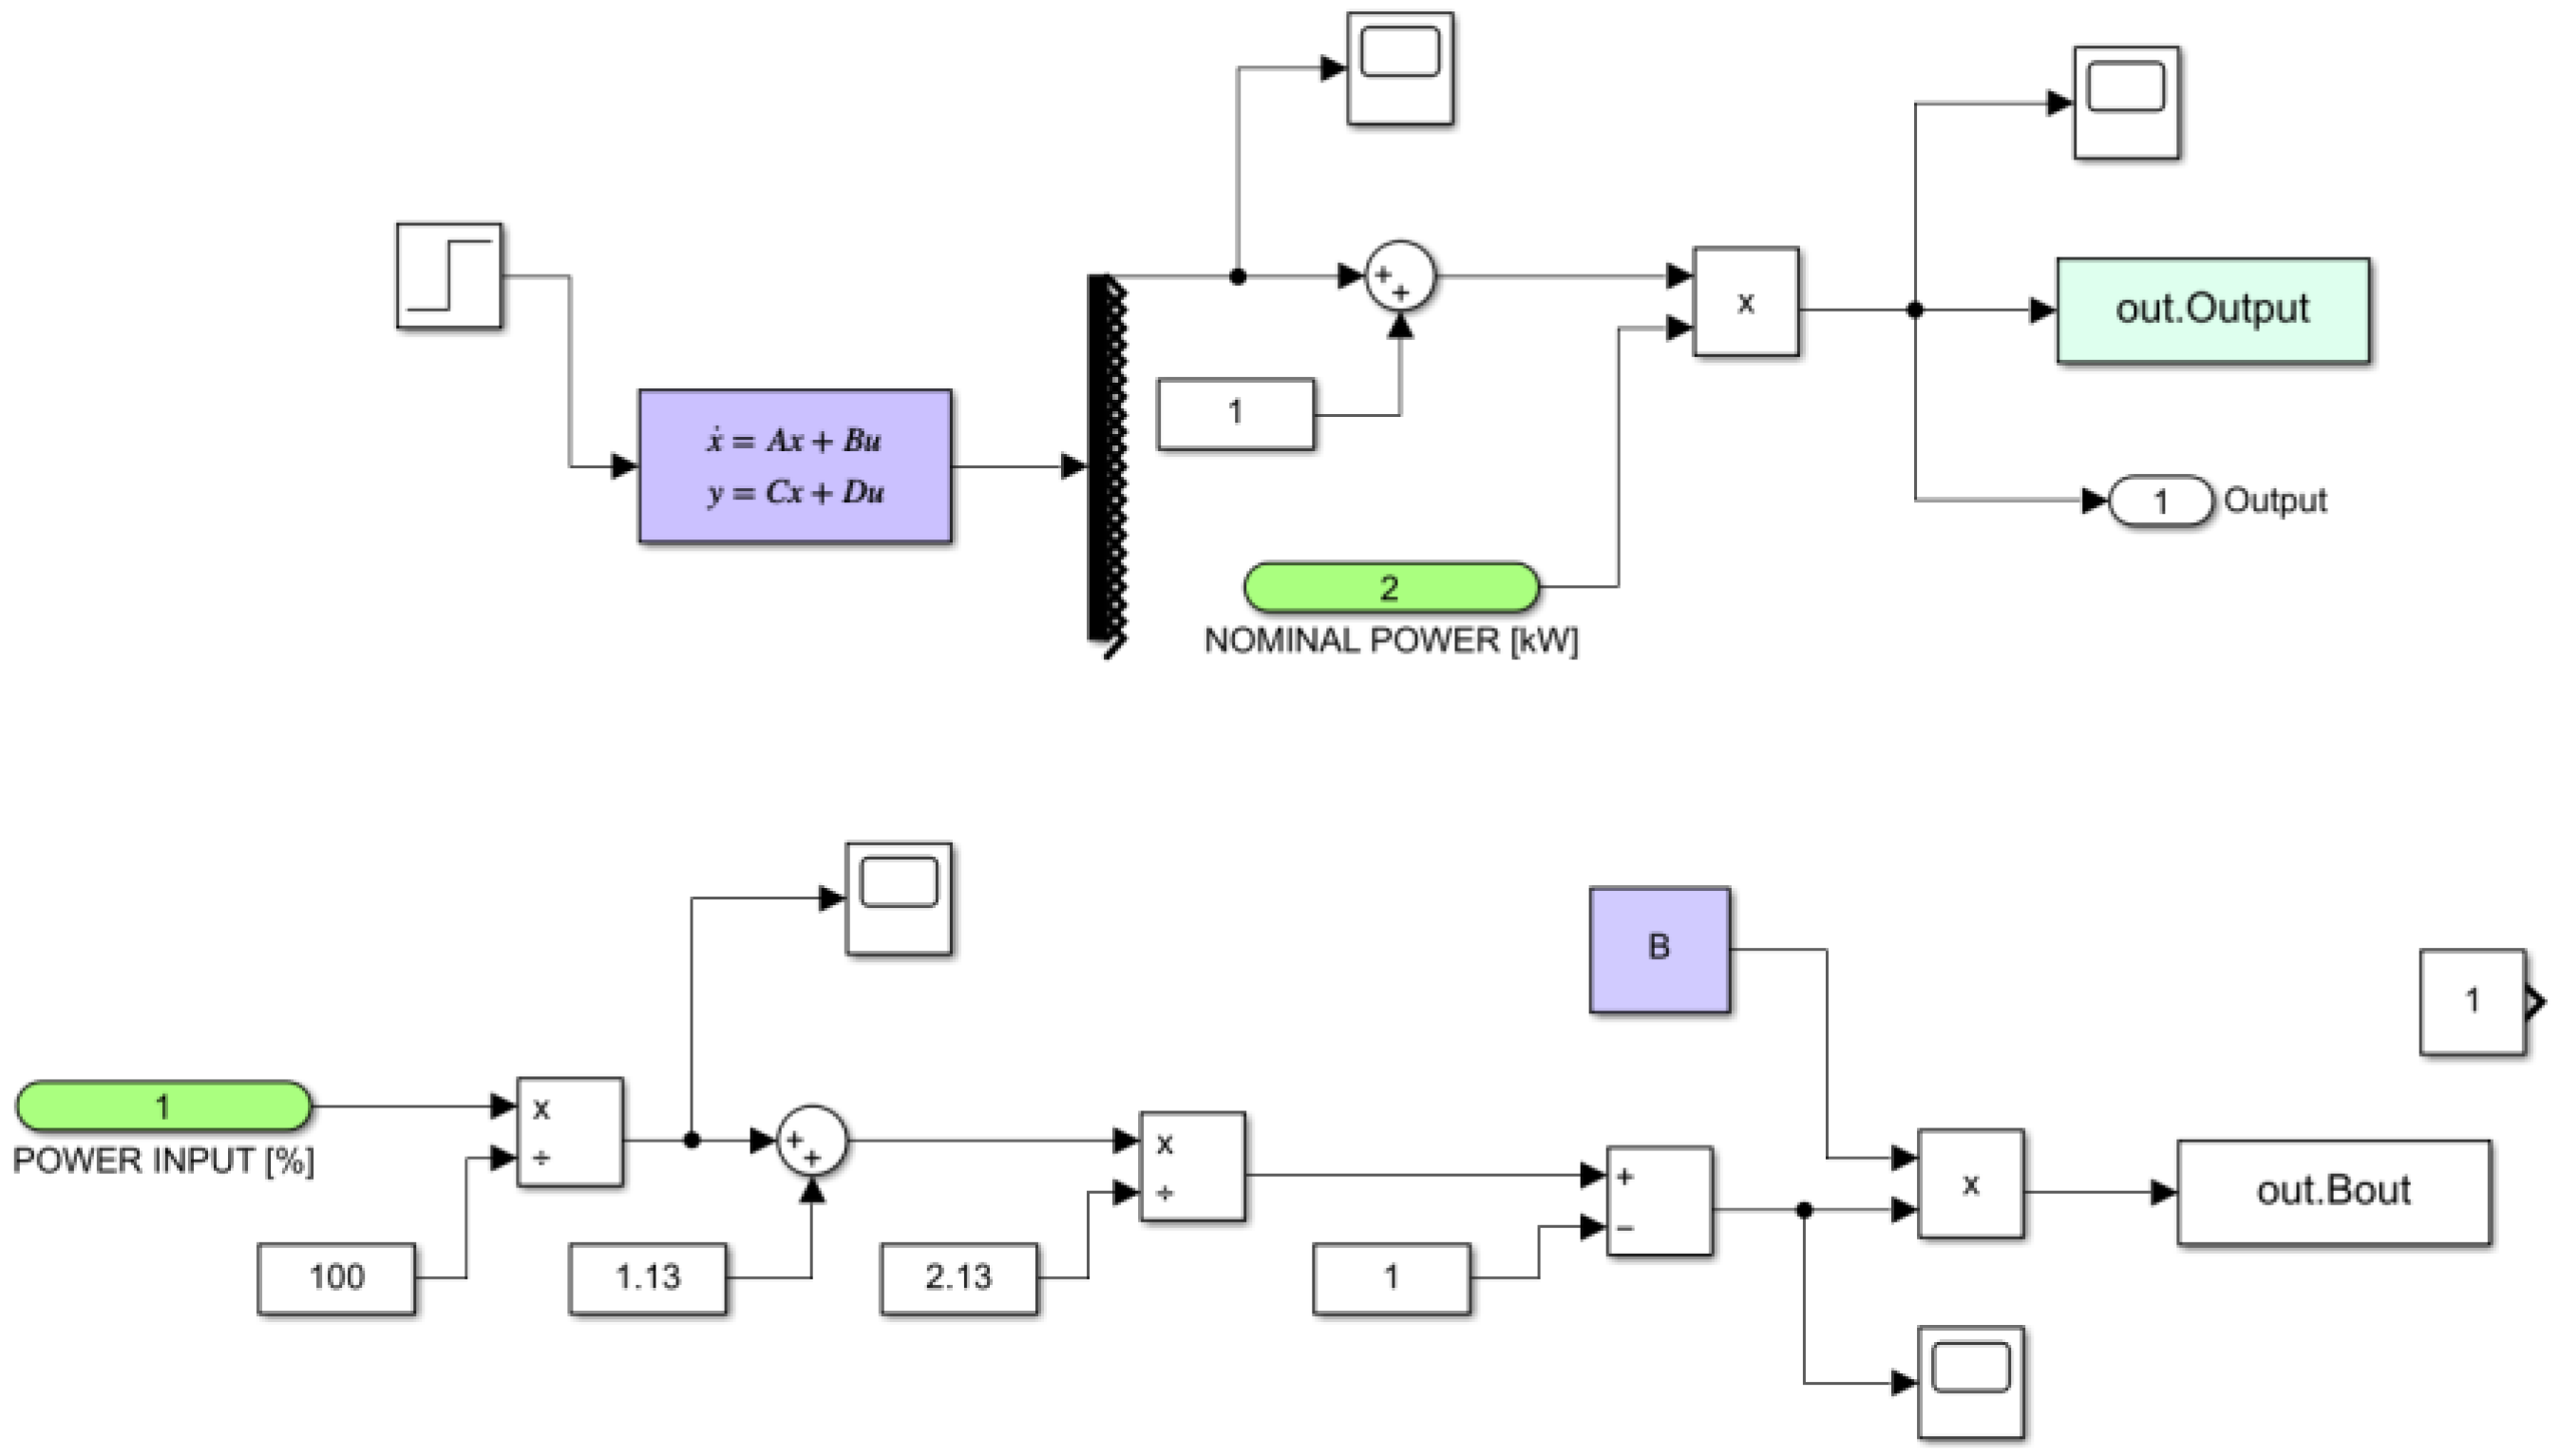
The software MATLAB/Simulink was employed in this study to simplify calculations and generate the system’s time response. A comprehensive Simulink schematic is presented in
Figure 9.
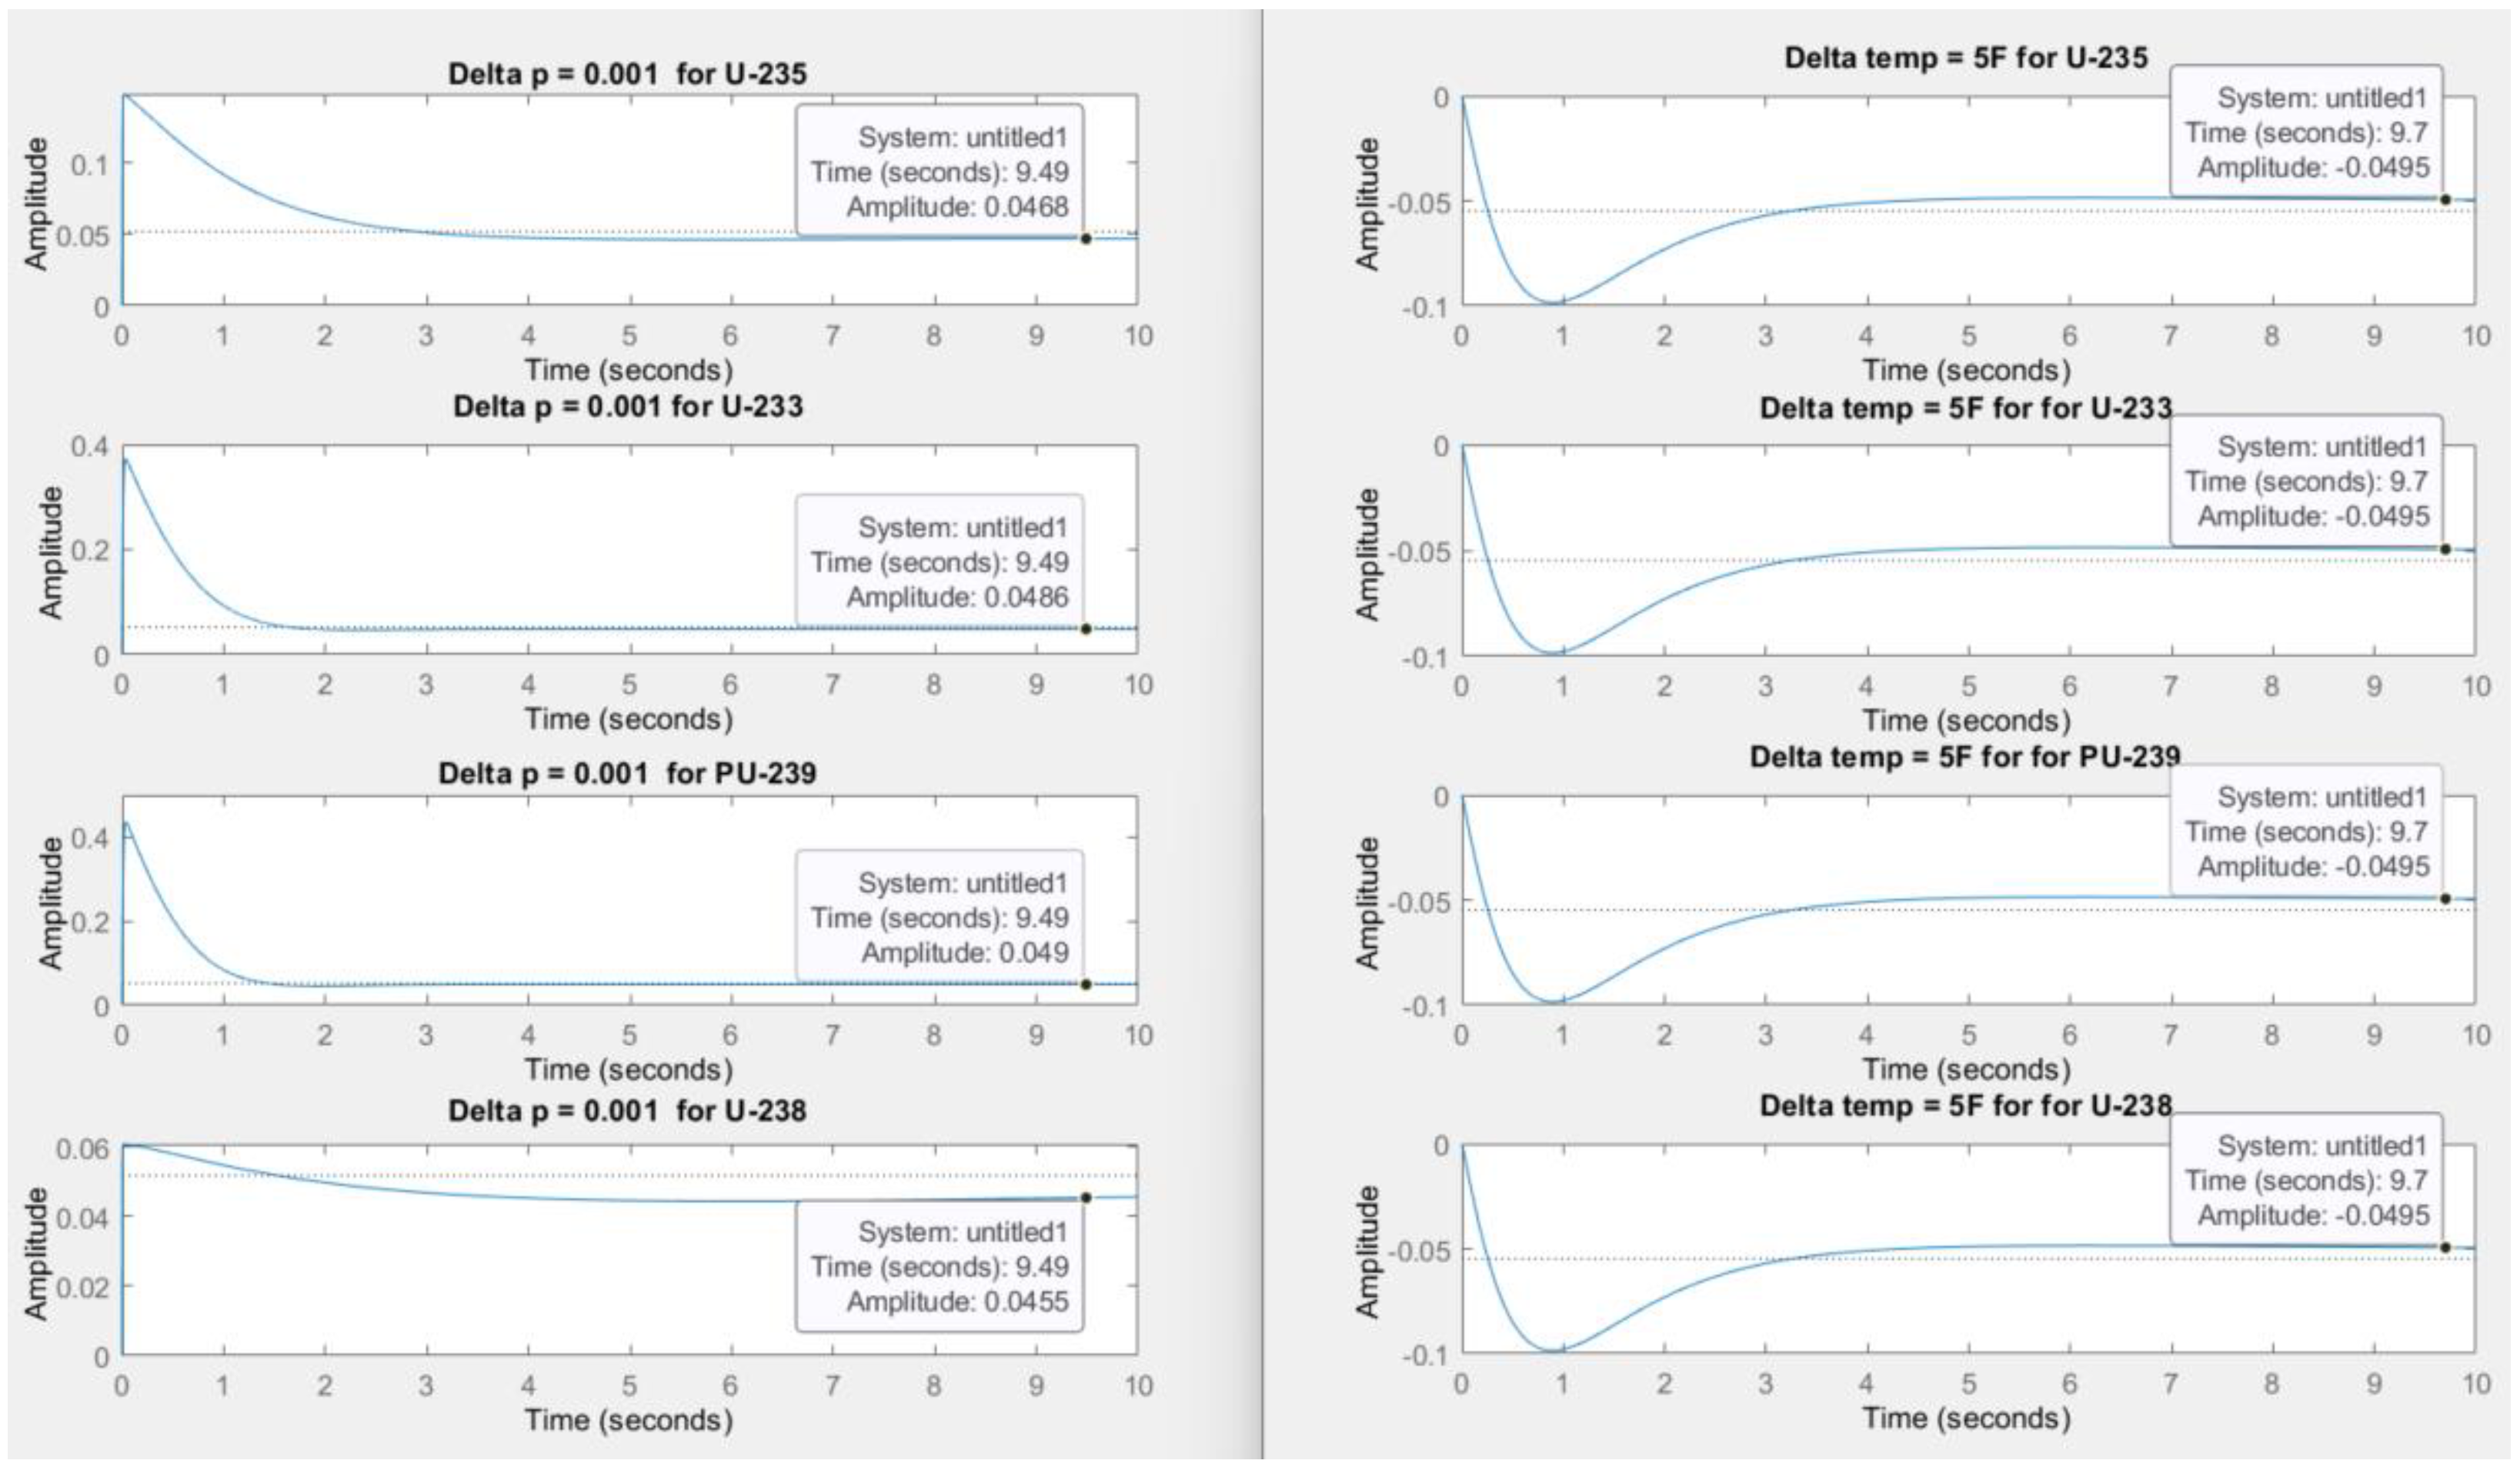
This modeling study incorporated four distinct types of fuel: PU-239, U-233, U-235, and U-238. The primary objective was to assess the behavior of transient effects and resulting power variations by altering the fuel properties.
Figure 10 illustrates the simulation results for each nuclear fuel, considering an external reactivity perturbation of 0.001 and a 5-degree Fahrenheit increase in the moderator’s temperature. The findings indicate that a 0.001 external perturbation leads to an approximate 4.7% increase in power rate. U-233 and PU-239 demonstrate similar behavior, with the power rate stabilizing within approximately 2 s, while U-238 takes longer to stabilize, at around 5 s. The fractional power rate resulting from a change in moderator temperature is comparable across all nuclear fuels, settling at −4.7% of the power rate after 4 s.
Although the previous simulation examined different fuels, this work solely focuses on the parameters for U-235. U-235 is enriched uranium, characterized by a higher concentration of uranium-235 isotopes, and is commonly utilized in nuclear reactors.
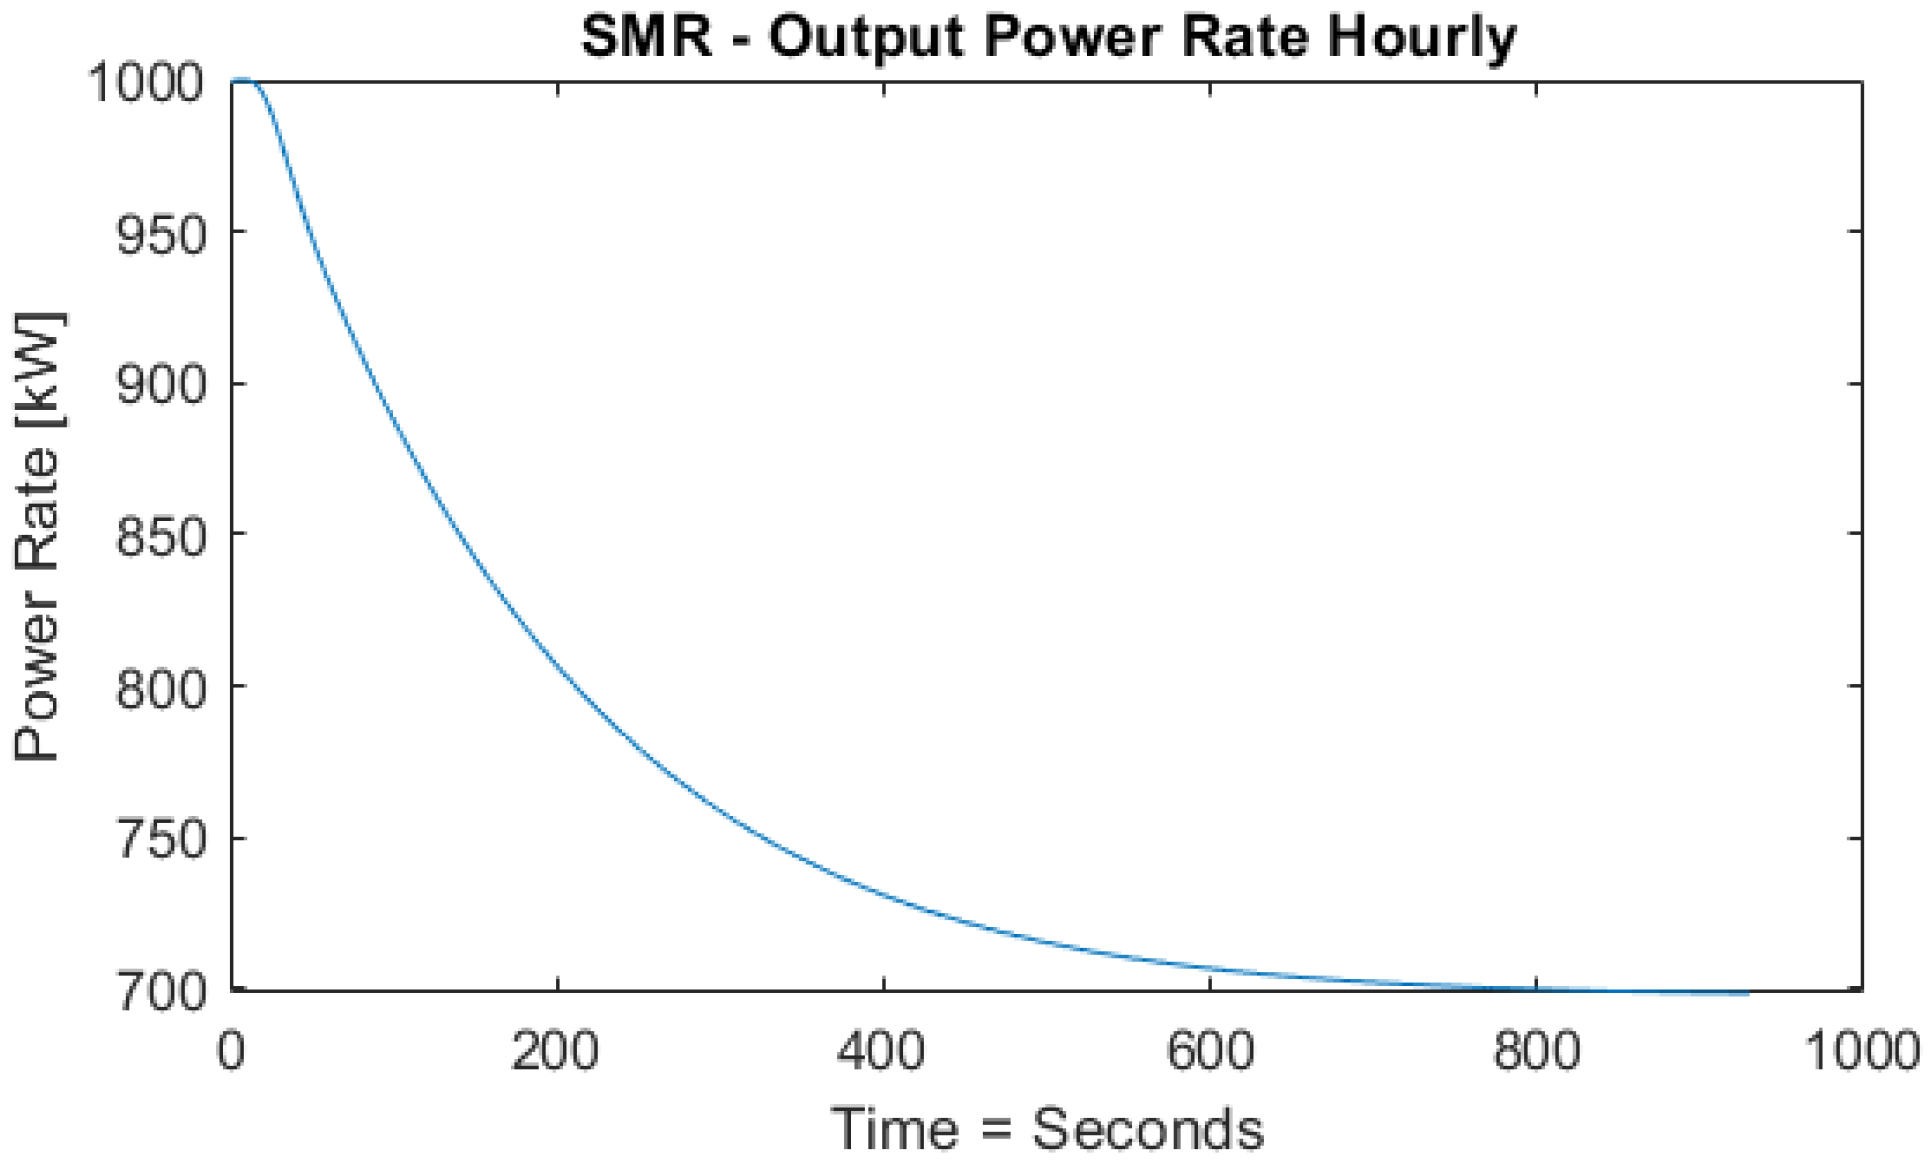
In order to evaluate the power generation performance of a nuclear reactor, the study simulated the output response by using a target power rate of 70% of the full power as the input signal. As shown in
Figure 11, the resulting output curve allows for an analysis of the system’s behavior and the time it takes to stabilize the output power at the target level, which occurs around 800 s after the input signal is introduced. This time response is crucial for assessing the integration of nuclear power plants with renewable and fluctuating demand profiles, where the reactor control system must adjust the output to maintain a consistent energy supply.
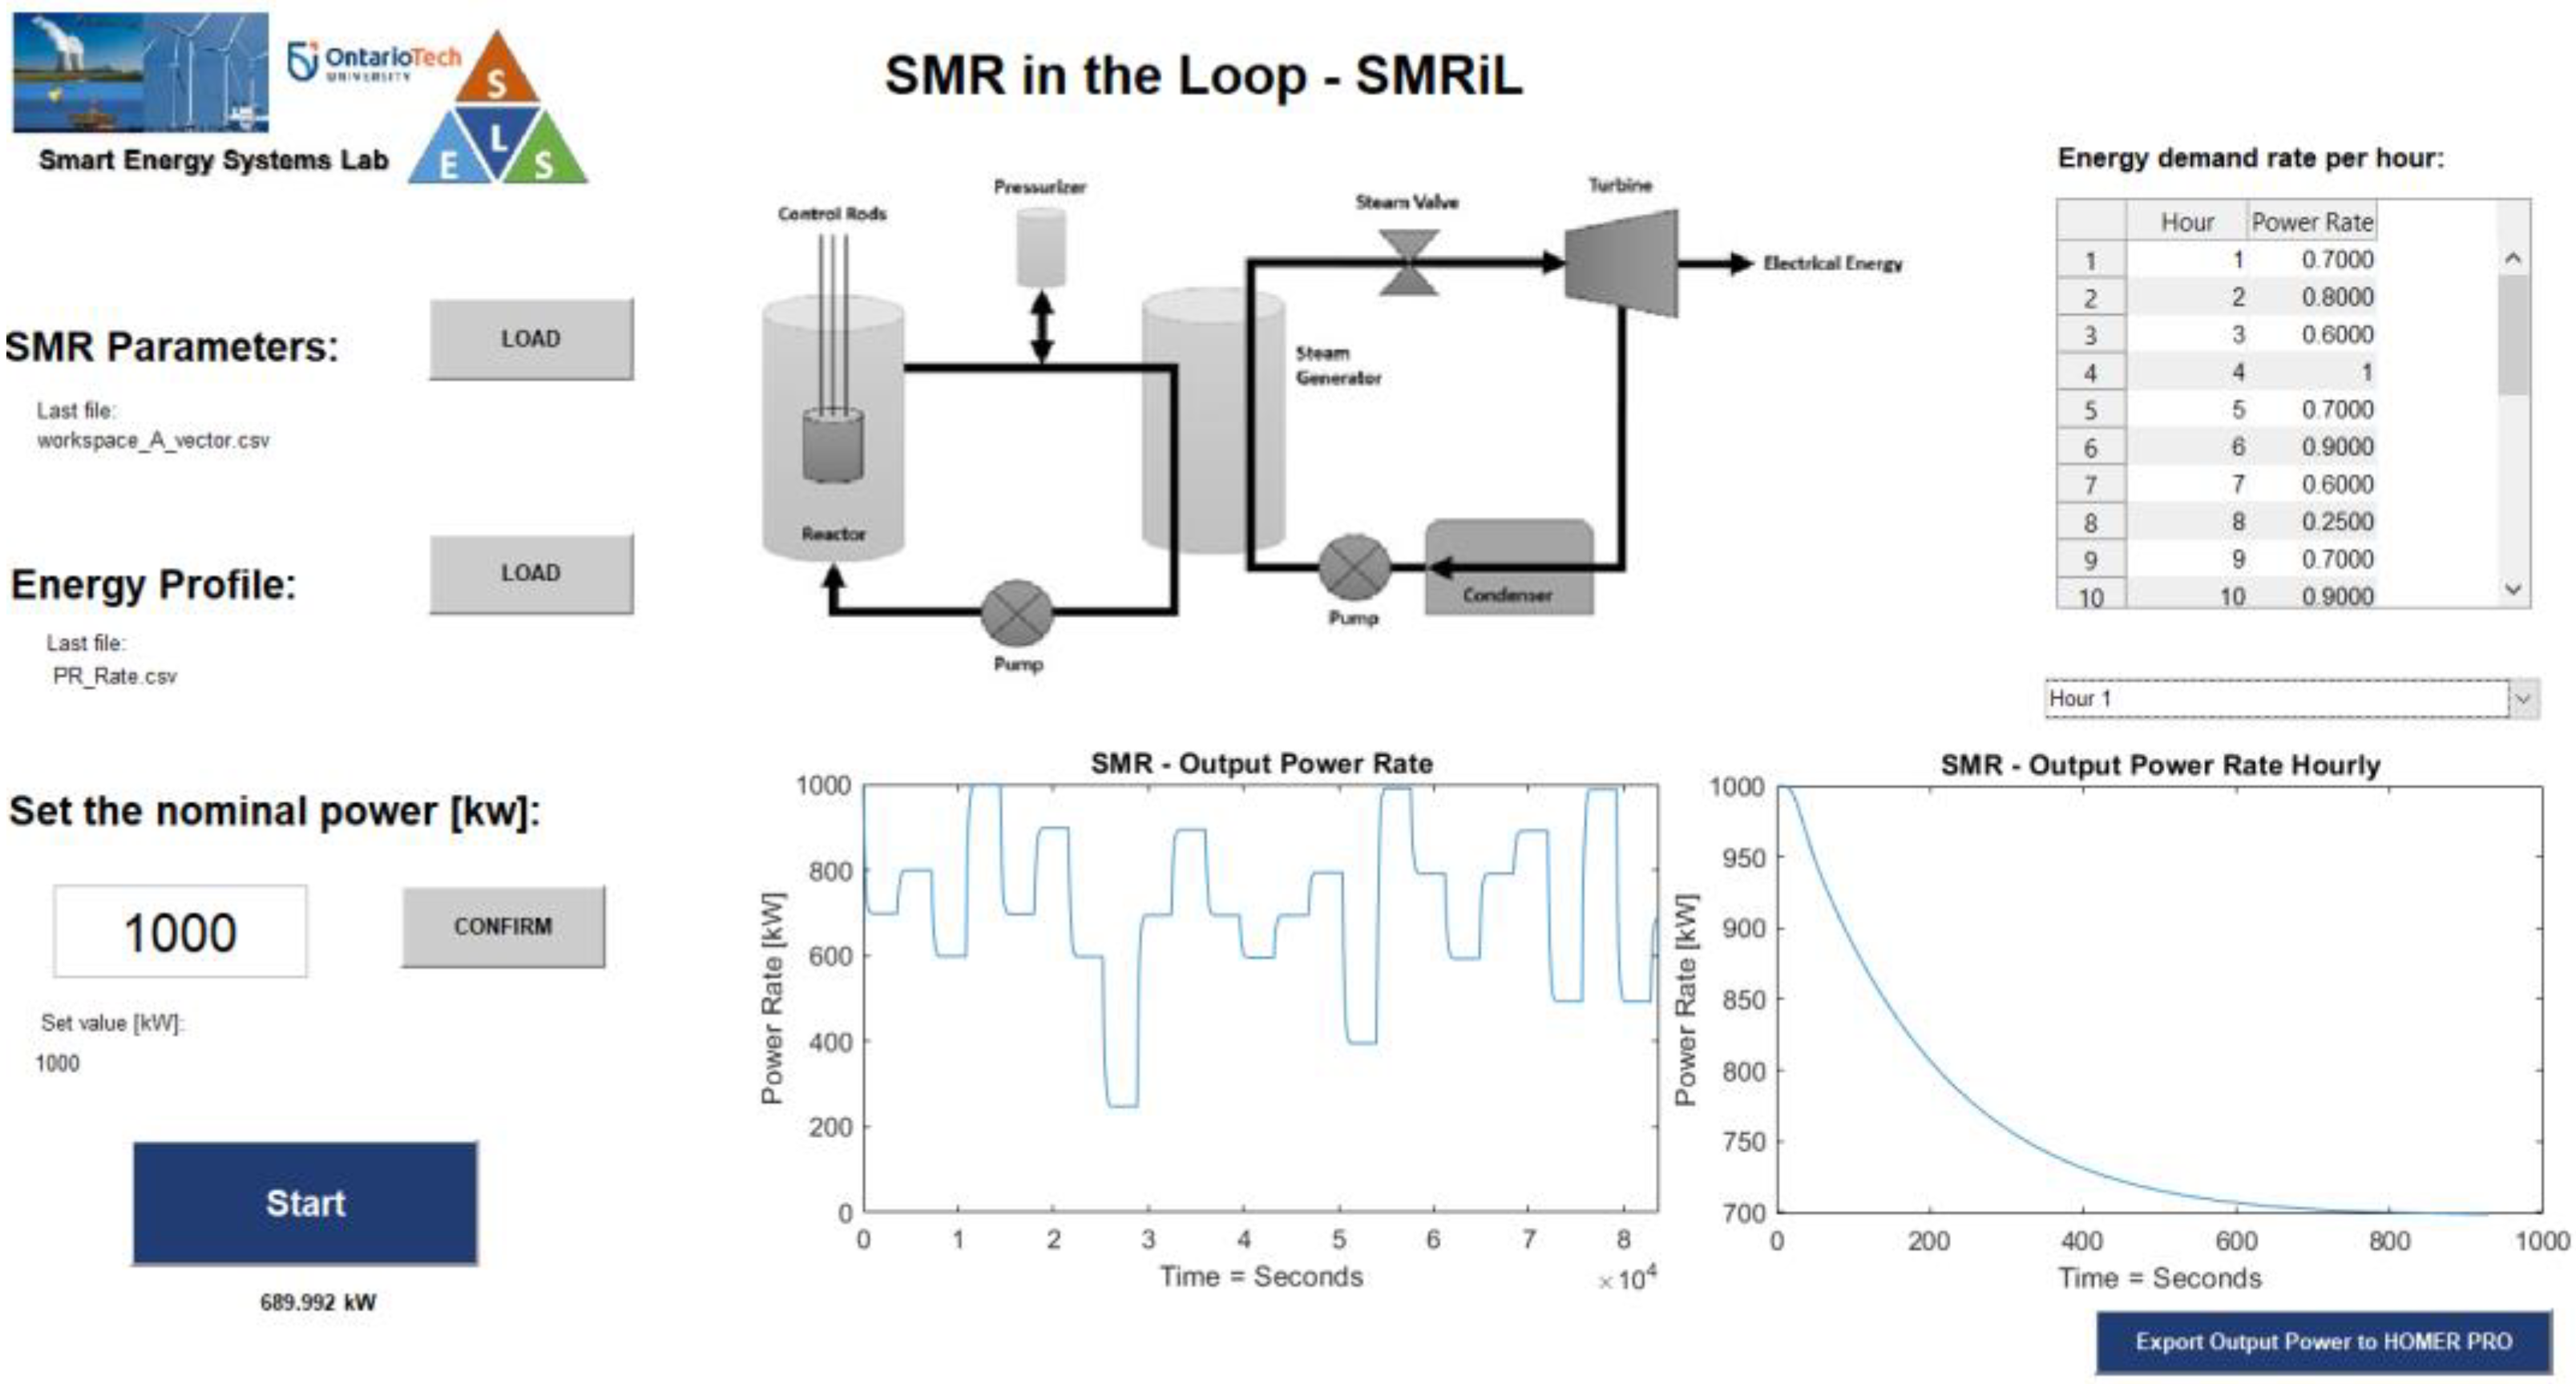
An energy generation profile from a nuclear reactor was generated by developing a user interface, which can be used to conduct experiments with renewable sources.
Figure 12 demonstrates that the interface enables the user to input the nuclear reactor parameters, along with the load profile, which can be used to configure the load-following parameters in the control center of the nuclear power plant.
The interface also provides the capability to determine the reactor’s nominal power, facilitating simulations under different scenarios. The daily generation profile of the nuclear reactor is presented as an output on the interface, reflecting the configured load profile input while considering the delay in stabilizing the output power at the desired level. Additionally, the interface displays the generation curve at each output power change.
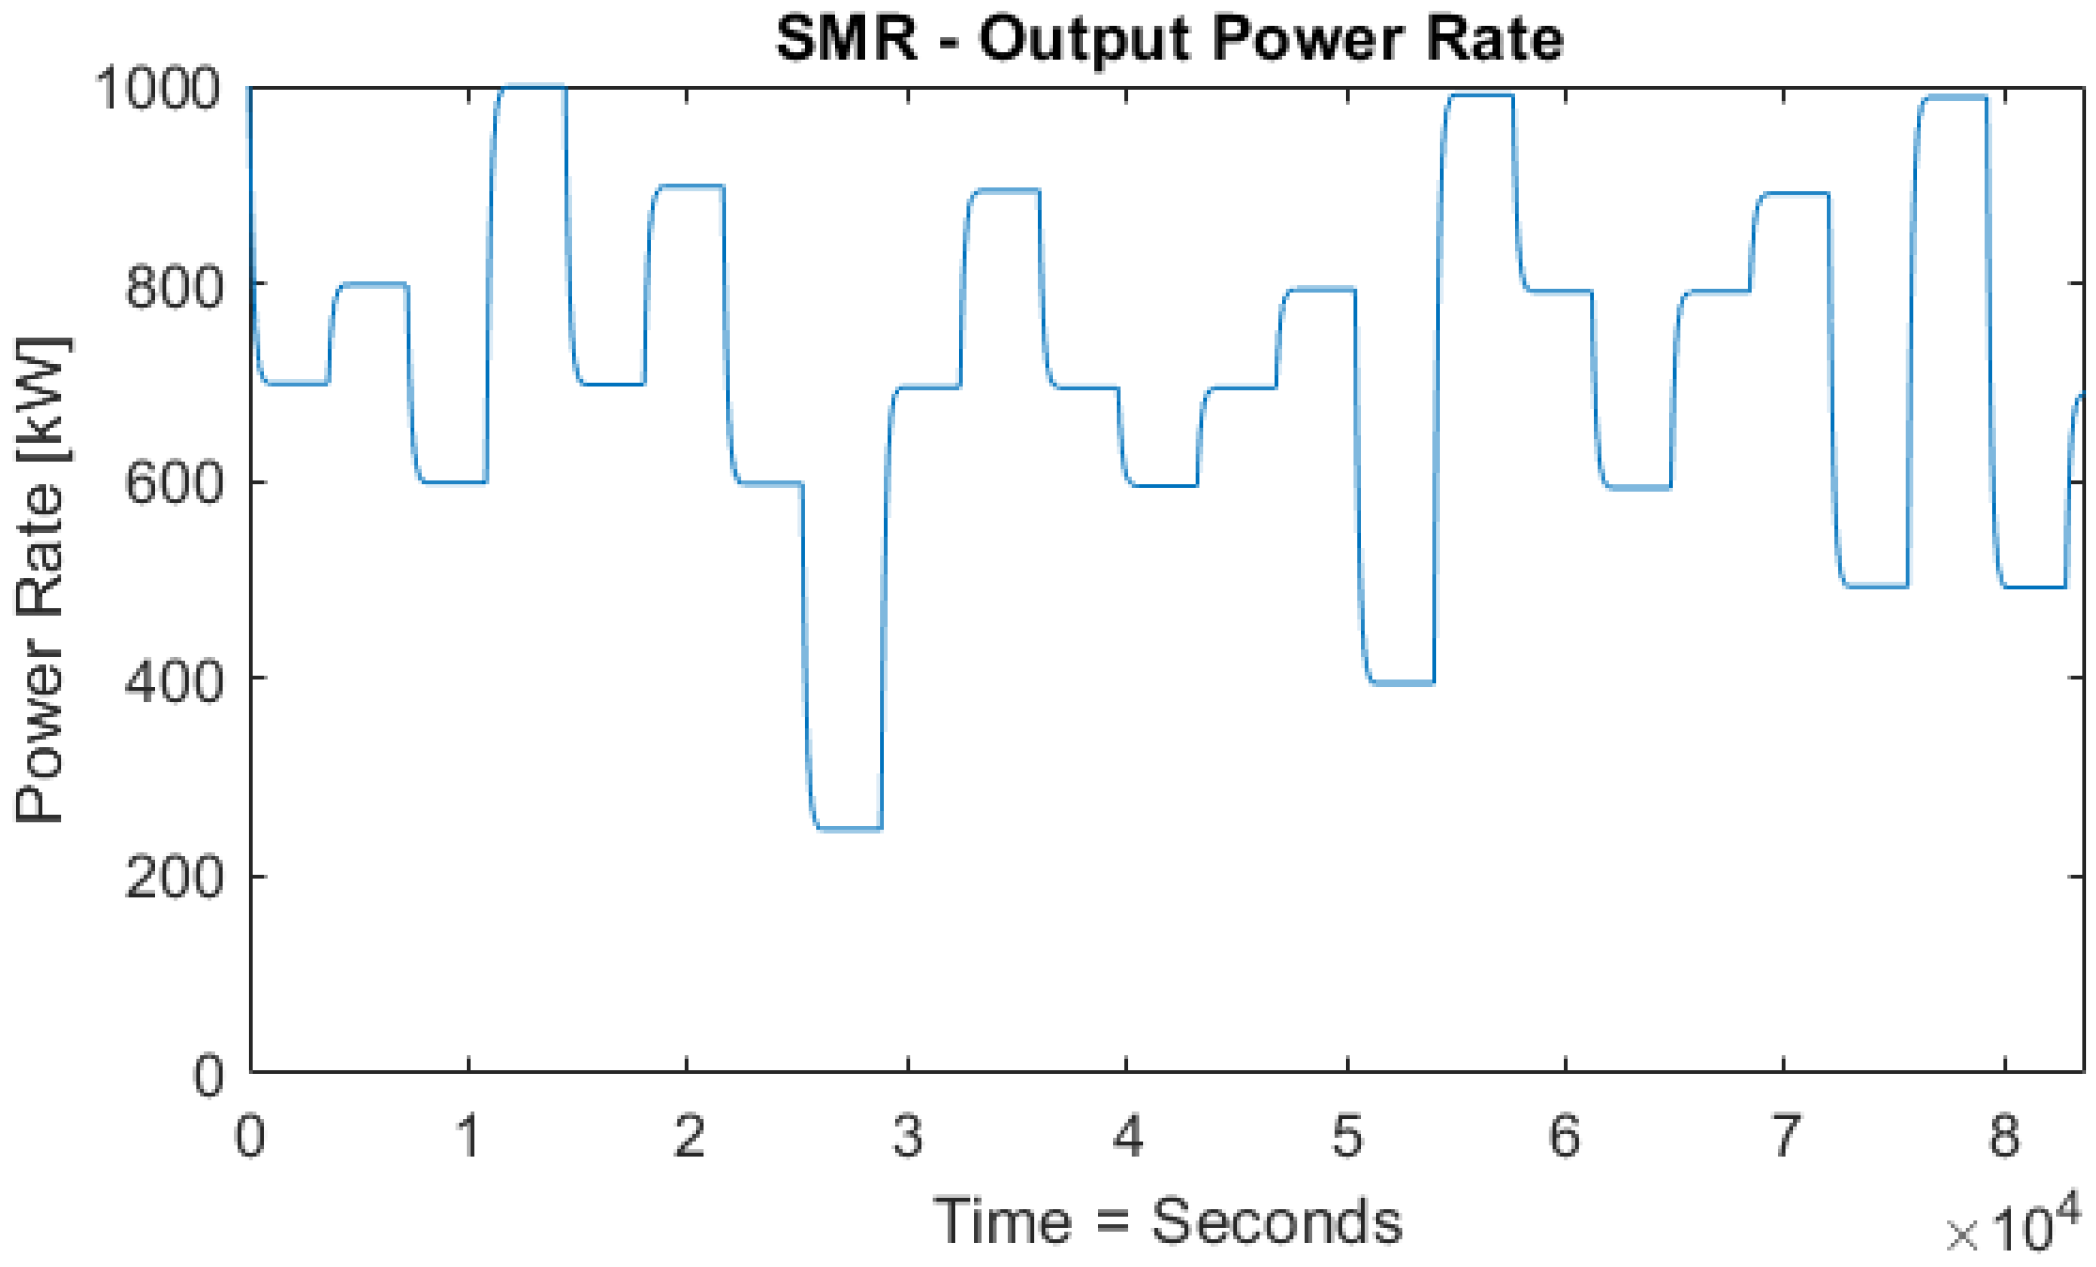
The output signal, which approximates the SMR power output and is illustrated in
Figure 13, is exported to HOMER Pro software for simulation purposes, evaluating the integration of nuclear energy with renewable energy sources and energy storage systems.
2.2. Modeling Fast Charging Stations
Installing public charging infrastructure networks has played a vital role in facilitating the shift towards electric vehicle (EV) technology and must continue to support its adoption. DC fast charging (DCFC) reduces charging time, increases customer convenience, enables long-distance travel, and may facilitate the electrification of high-mileage fleets. Further simulations, based on a uniform vehicle population, have been conducted, and formulae have been derived to estimate the queue’s charging time and waiting duration. The optimization of the DCFC station design is also discussed, including the number and capacity of ports.
This project’s objective is to develop a dynamic model for a fast-charging station that predicts the electricity consumption behavior during the charging process, thereby contributing to the deployment of the energy system. The aim is to create a probabilistic forecast of electricity consumption time-series profiling by constructing an adaptive model that predicts the electricity consumption of fast-charging stations. This project aspires to create time-series profiling that can be used in hybrid energy system simulations.
2.2.1. System Parameters
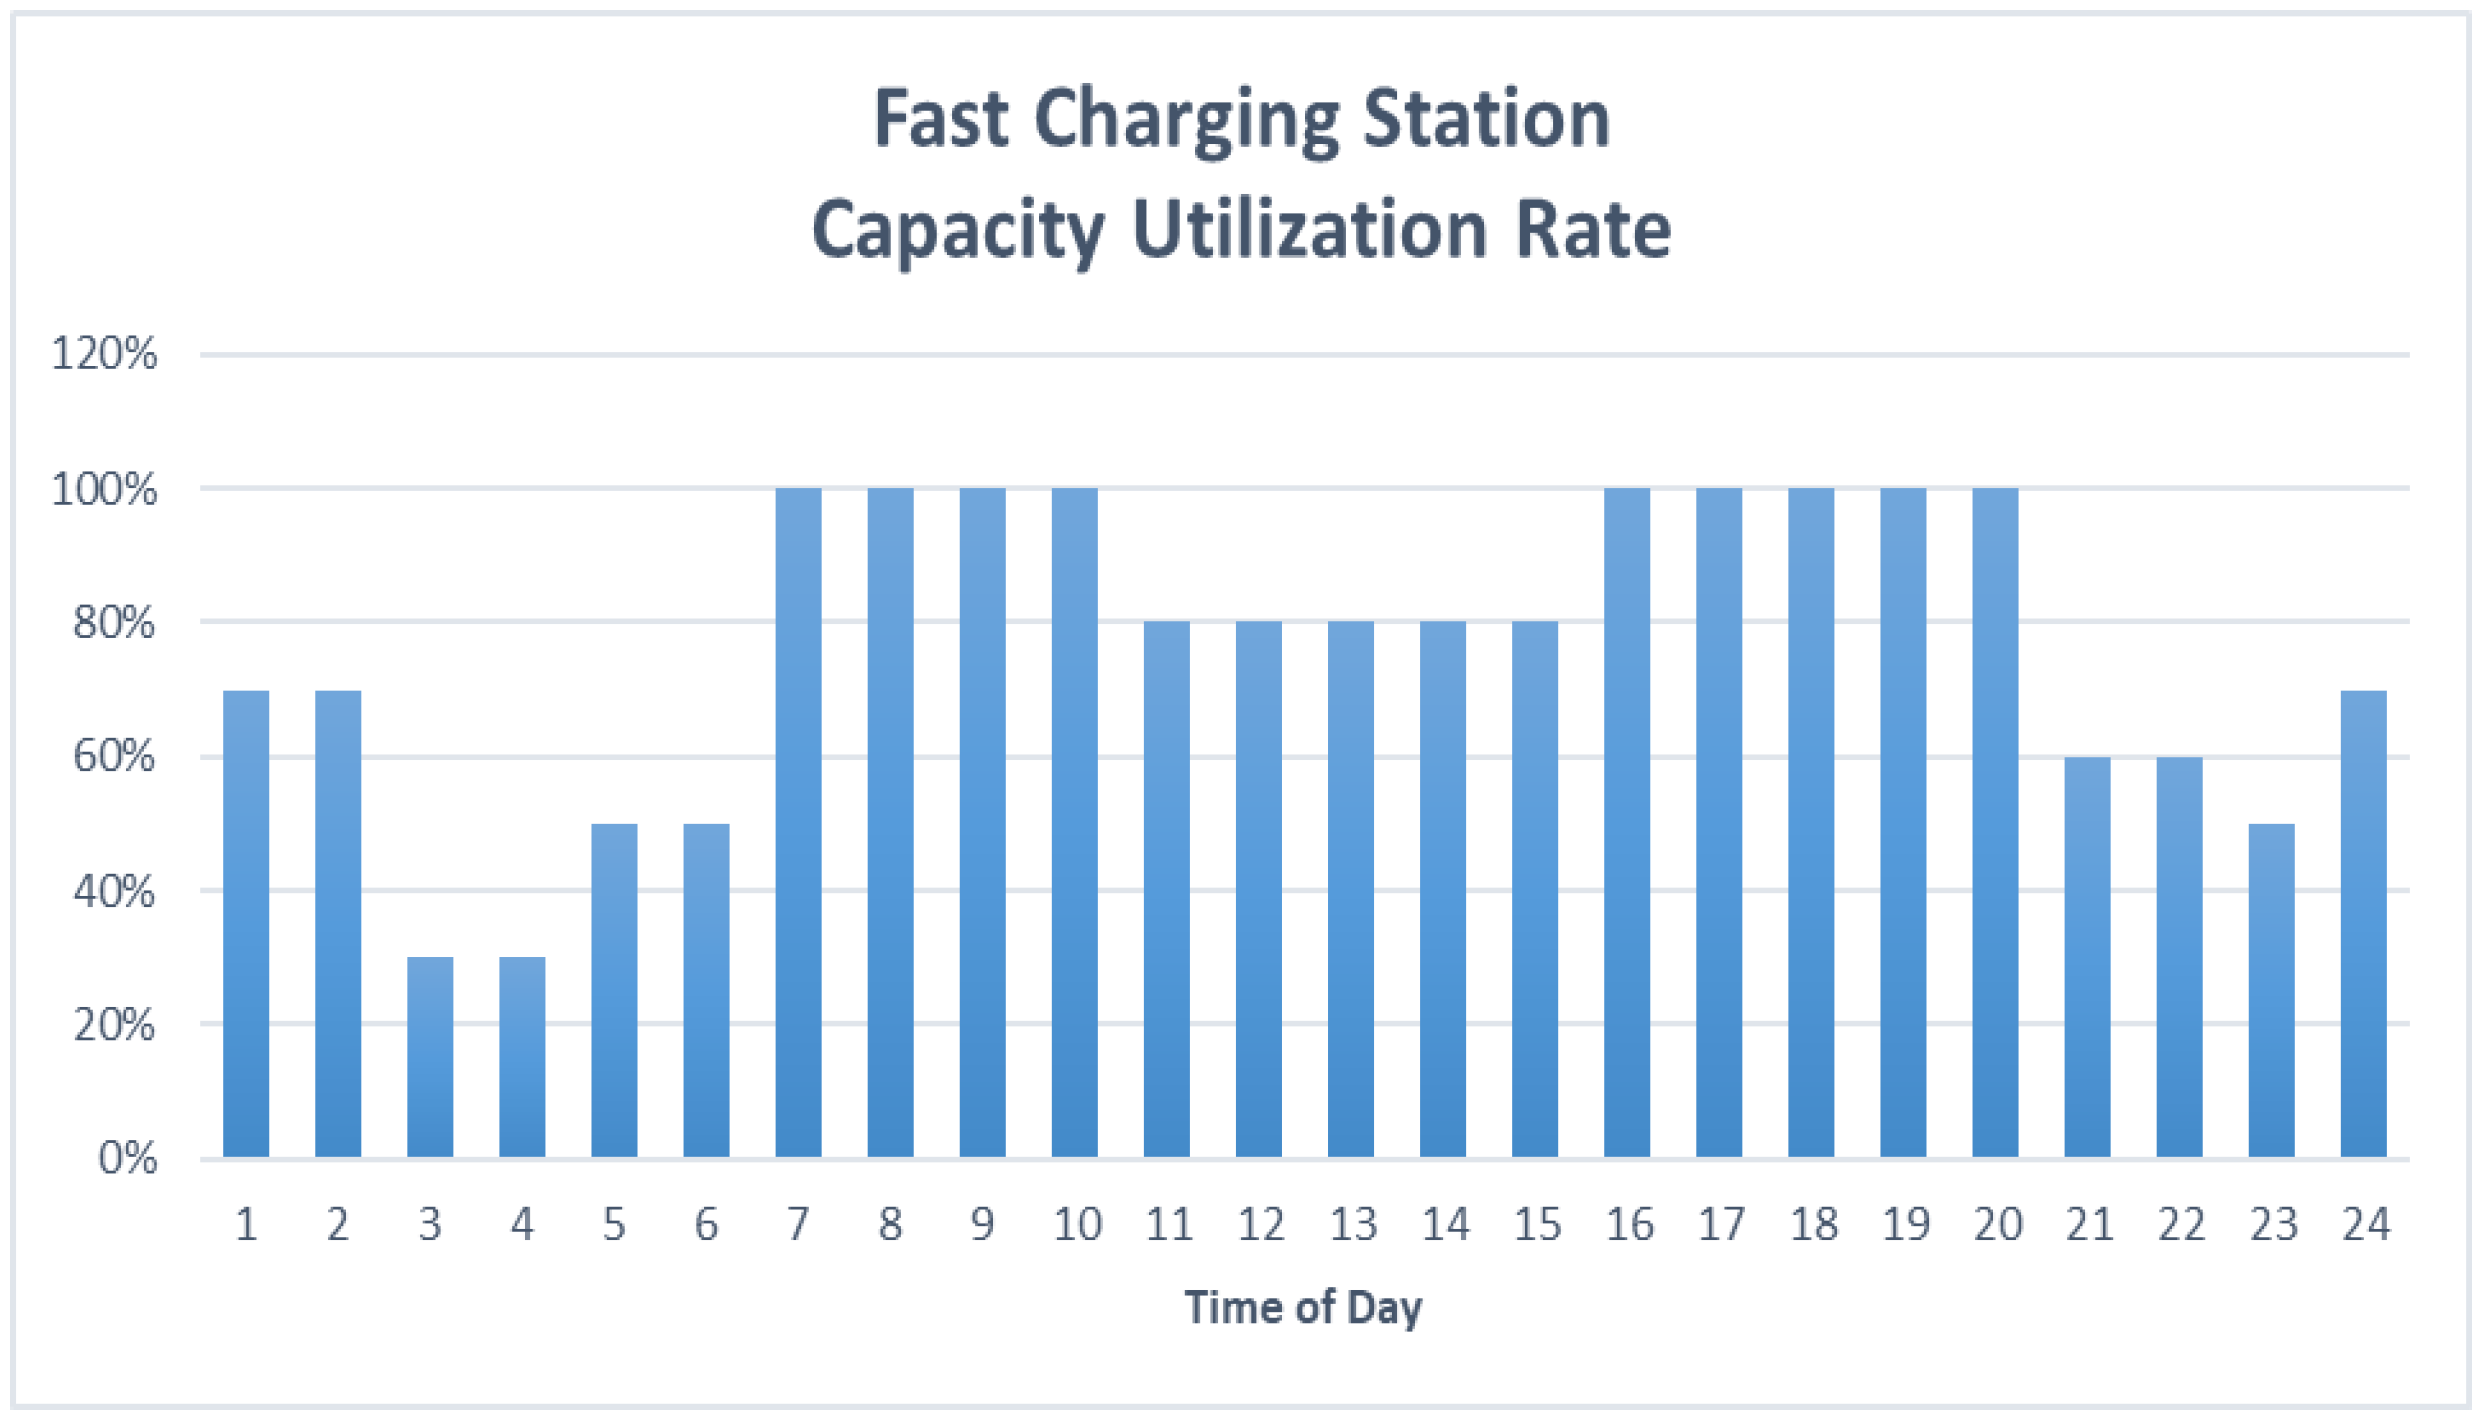
The proposed system consists of six electric vehicle models, each with specific parameters. These parameters for simulation include the nominal charging power, which represents the maximum power required to charge the electric vehicle, battery size, and population proportion. These parameters are summarized in
Table 2. The population proportion indicates the likelihood of a particular vehicle accessing the charging station and will be utilized in probabilistic analysis to forecast which model will be charged during a given period. The probabilistic analysis involves determining the average number of chargers per hour and the probability of a specific model initiating the charging process. The system can generate an energy load profile by adjusting these two parameters.
Figure 14 displays the average number of chargers utilized per hour randomly in this simulation. For example, at 1 pm, the average number of visits is 70%, indicating that 70% of the available charging units will be utilized at various intervals during this hour.
2.2.2. System Simulation
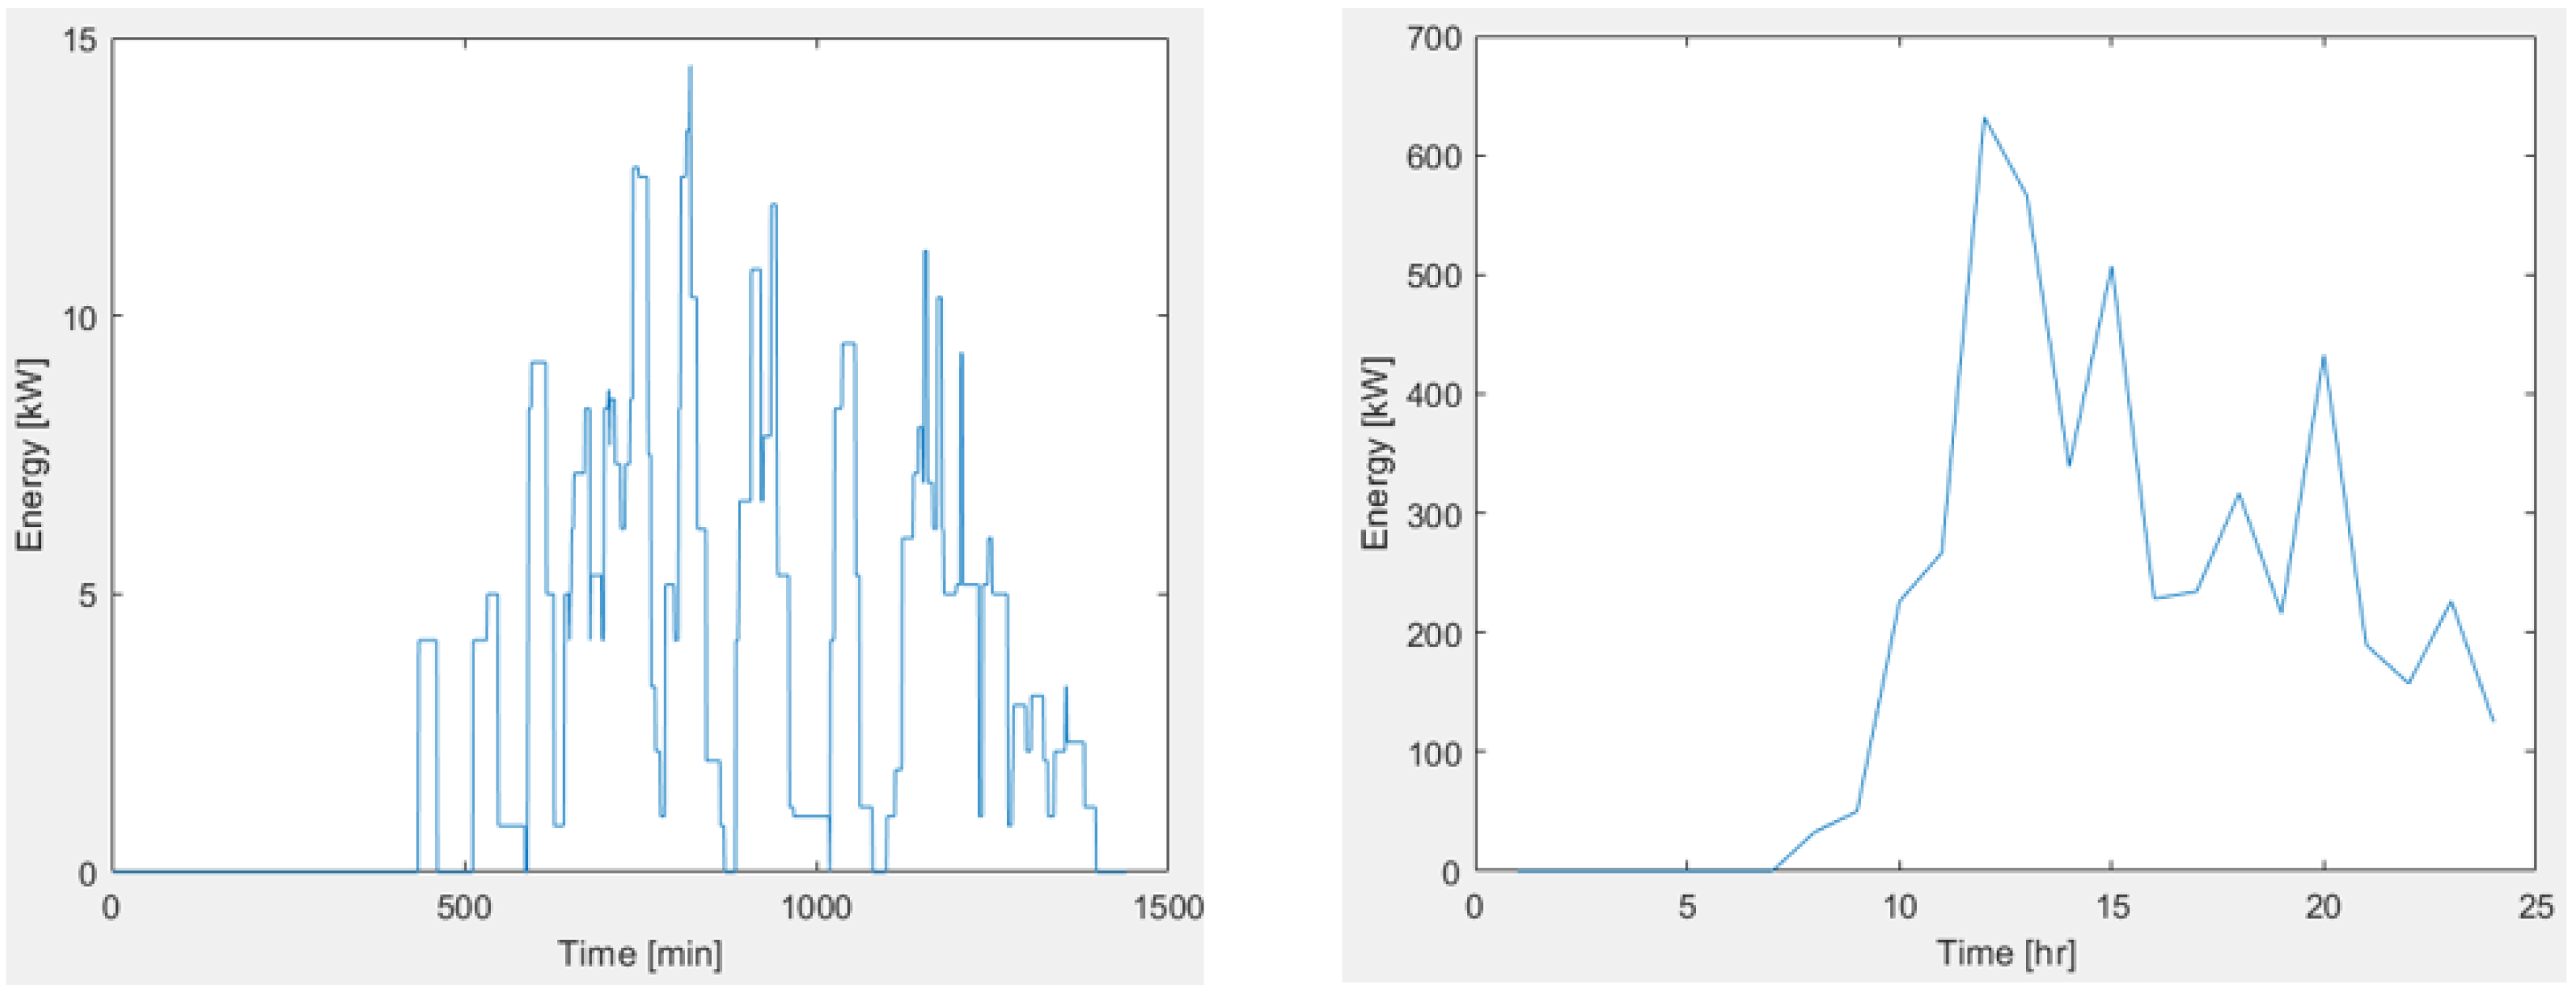
One of the potential outcomes from the 24-h simulation is illustrated in
Figure 15. The chart on the left displays the time series results in minute intervals, while the chart on the right exhibits the results in hourly intervals.
Since the modeling relies on probabilistic analysis, each simulation run produces different outcomes even when utilizing the same energy profile pattern. The use of a probabilistic system is crucial due to the unpredictable nature of energy consumption at EV charging stations, which poses a challenge in maintaining energy system reliability, particularly for microgrids where any unanticipated load changes can significantly impact energy generation operations.
3. Simulation
As previously mentioned, the primary aim of this paper is to assess the optimal configuration of a hybrid energy system that can offer a reliable, flexible, and sustainable power supply for a fast-charging station.
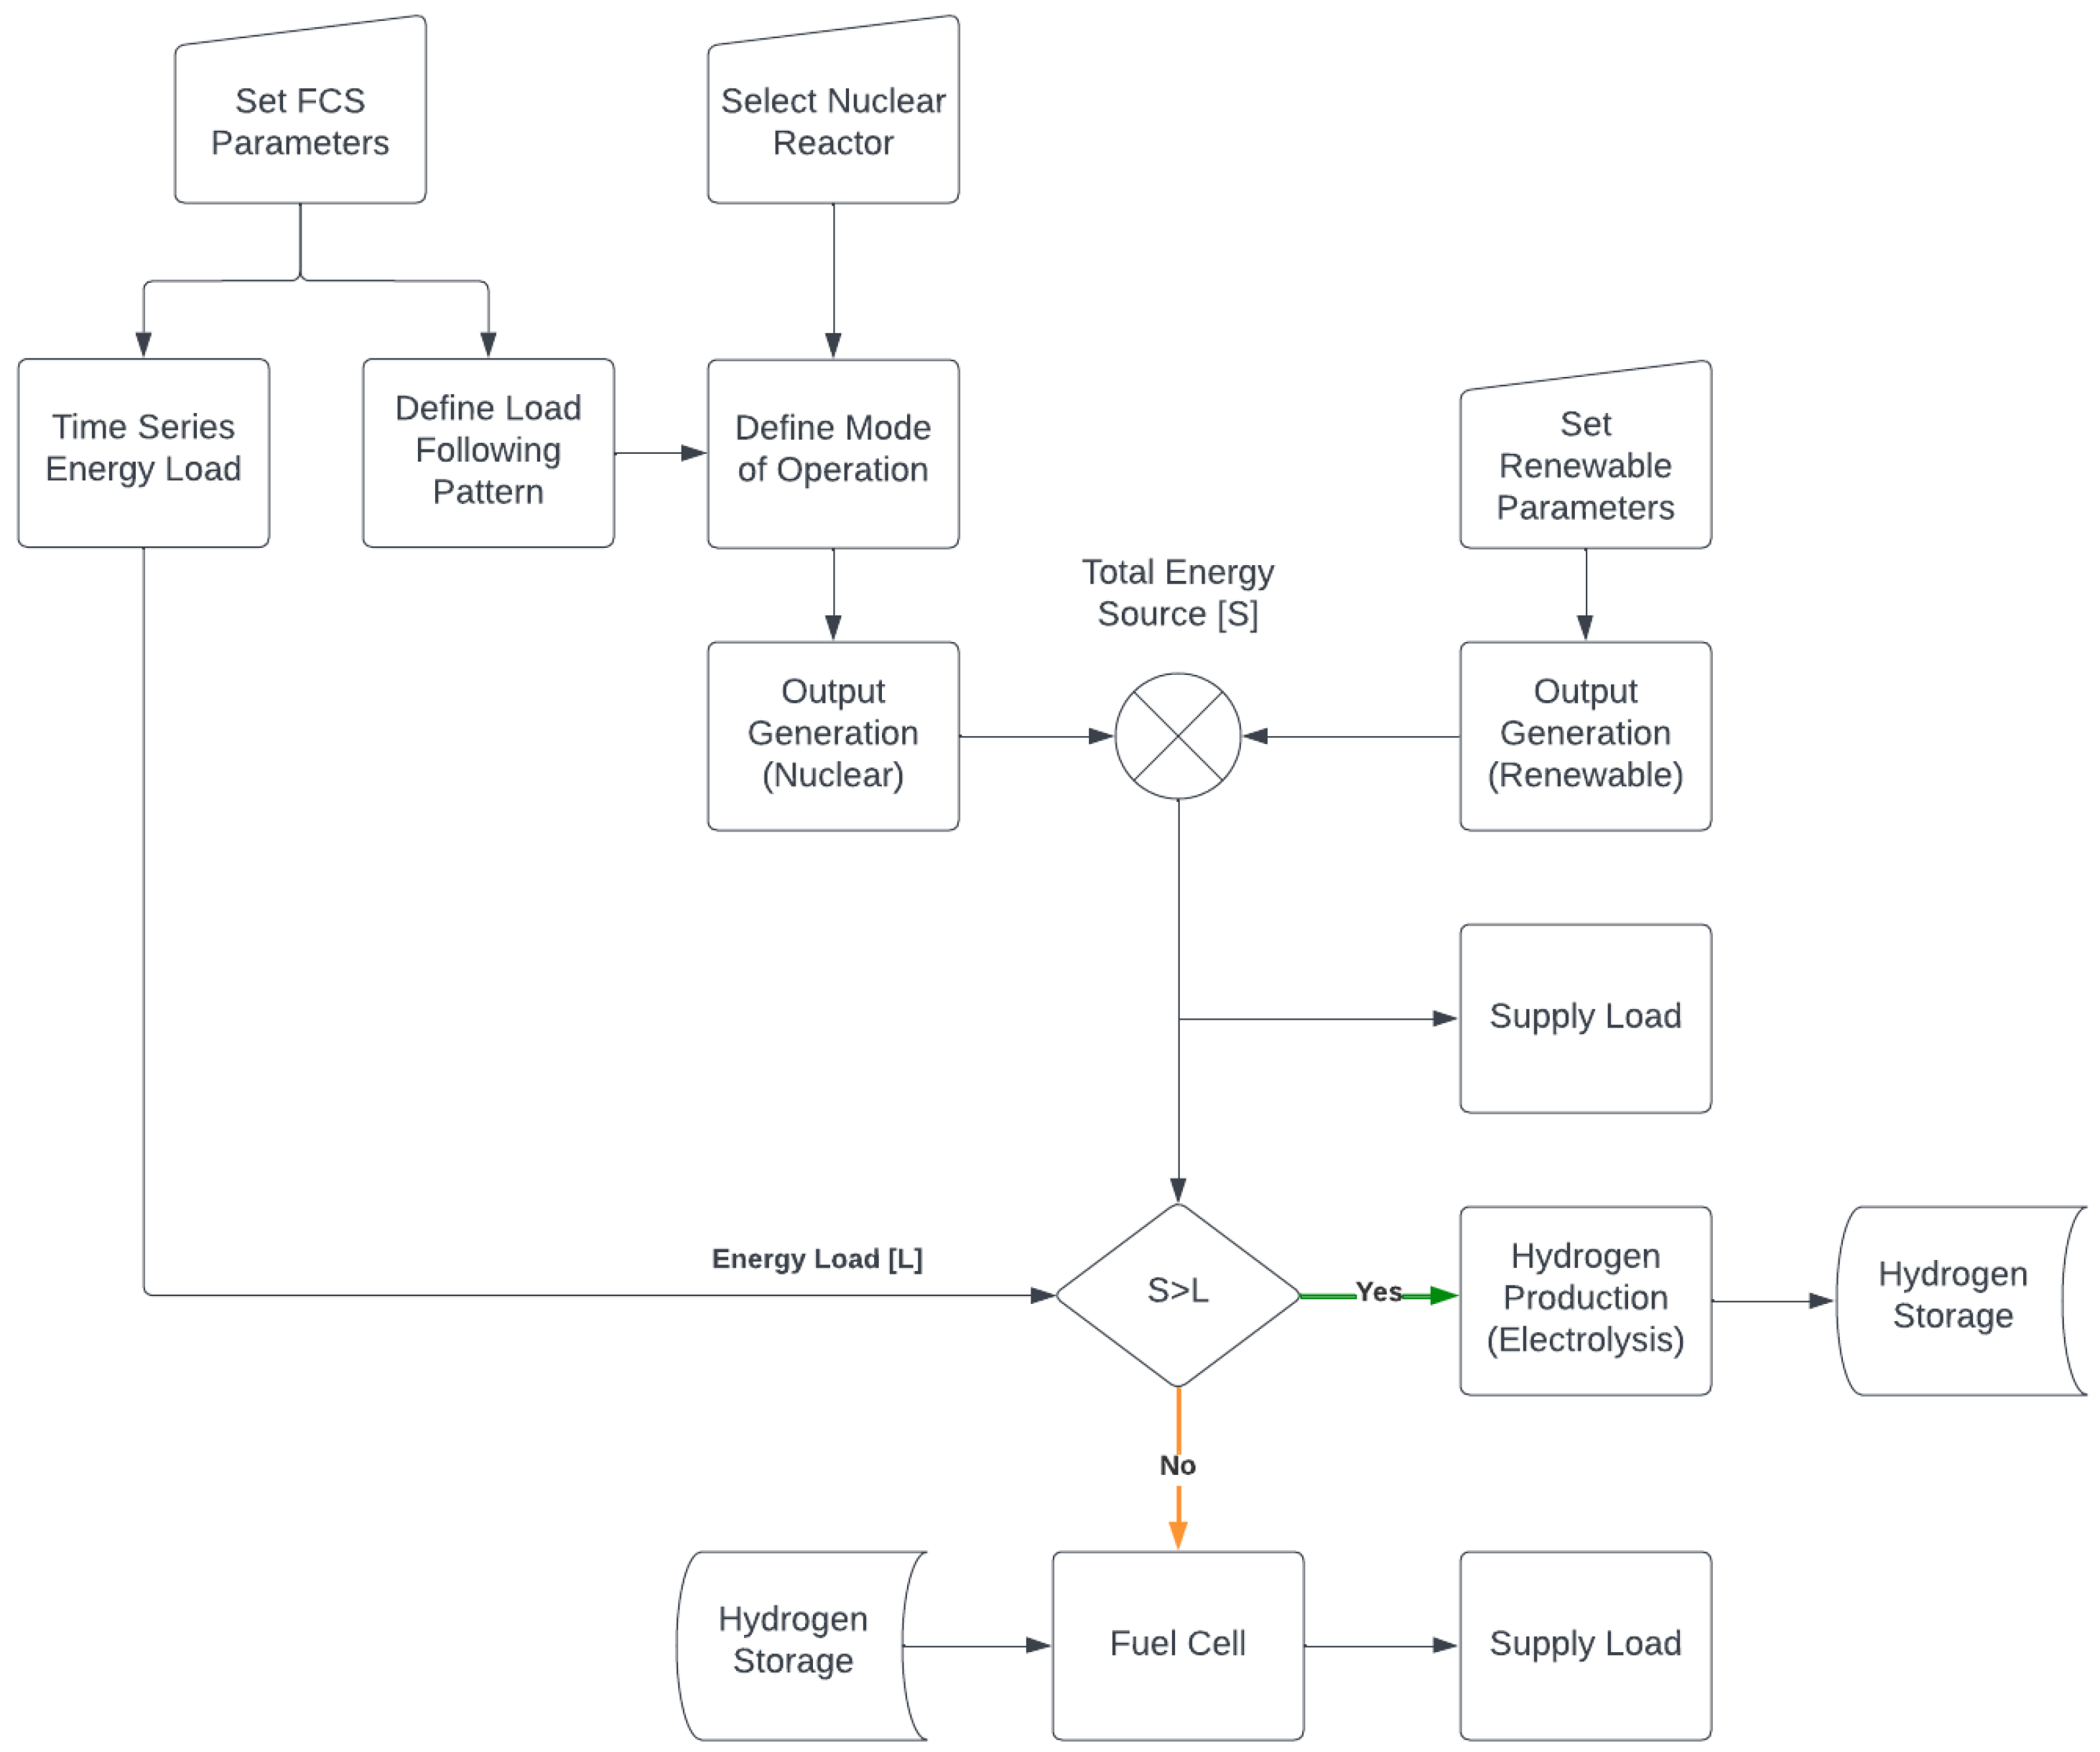
Figure 16 depicts a flowchart illustrating the energy management process for this system.
The first step is to determine the parameters for the fast-charging station, including the historical capacity rate (as displayed in
Figure 14) and the model parameters for the most common type of electric vehicle that will utilize the system (as outlined in
Table 2). Using these parameters, the energy management system will generate a time-series energy load (created through the modeling outlined in
Section 2.2) and a load-following pattern that will be utilized to set the nuclear reactor.
The nuclear reactor’s user interface (as presented in
Section 2.1) will utilize the energy pattern provided by the fast-charging station to set the reactor mode of operation and generate energy output using the load-following method. The system will then evaluate the conditioning for the solar, wind, and hydrogen systems to achieve an optimal energy flow for the entire system.
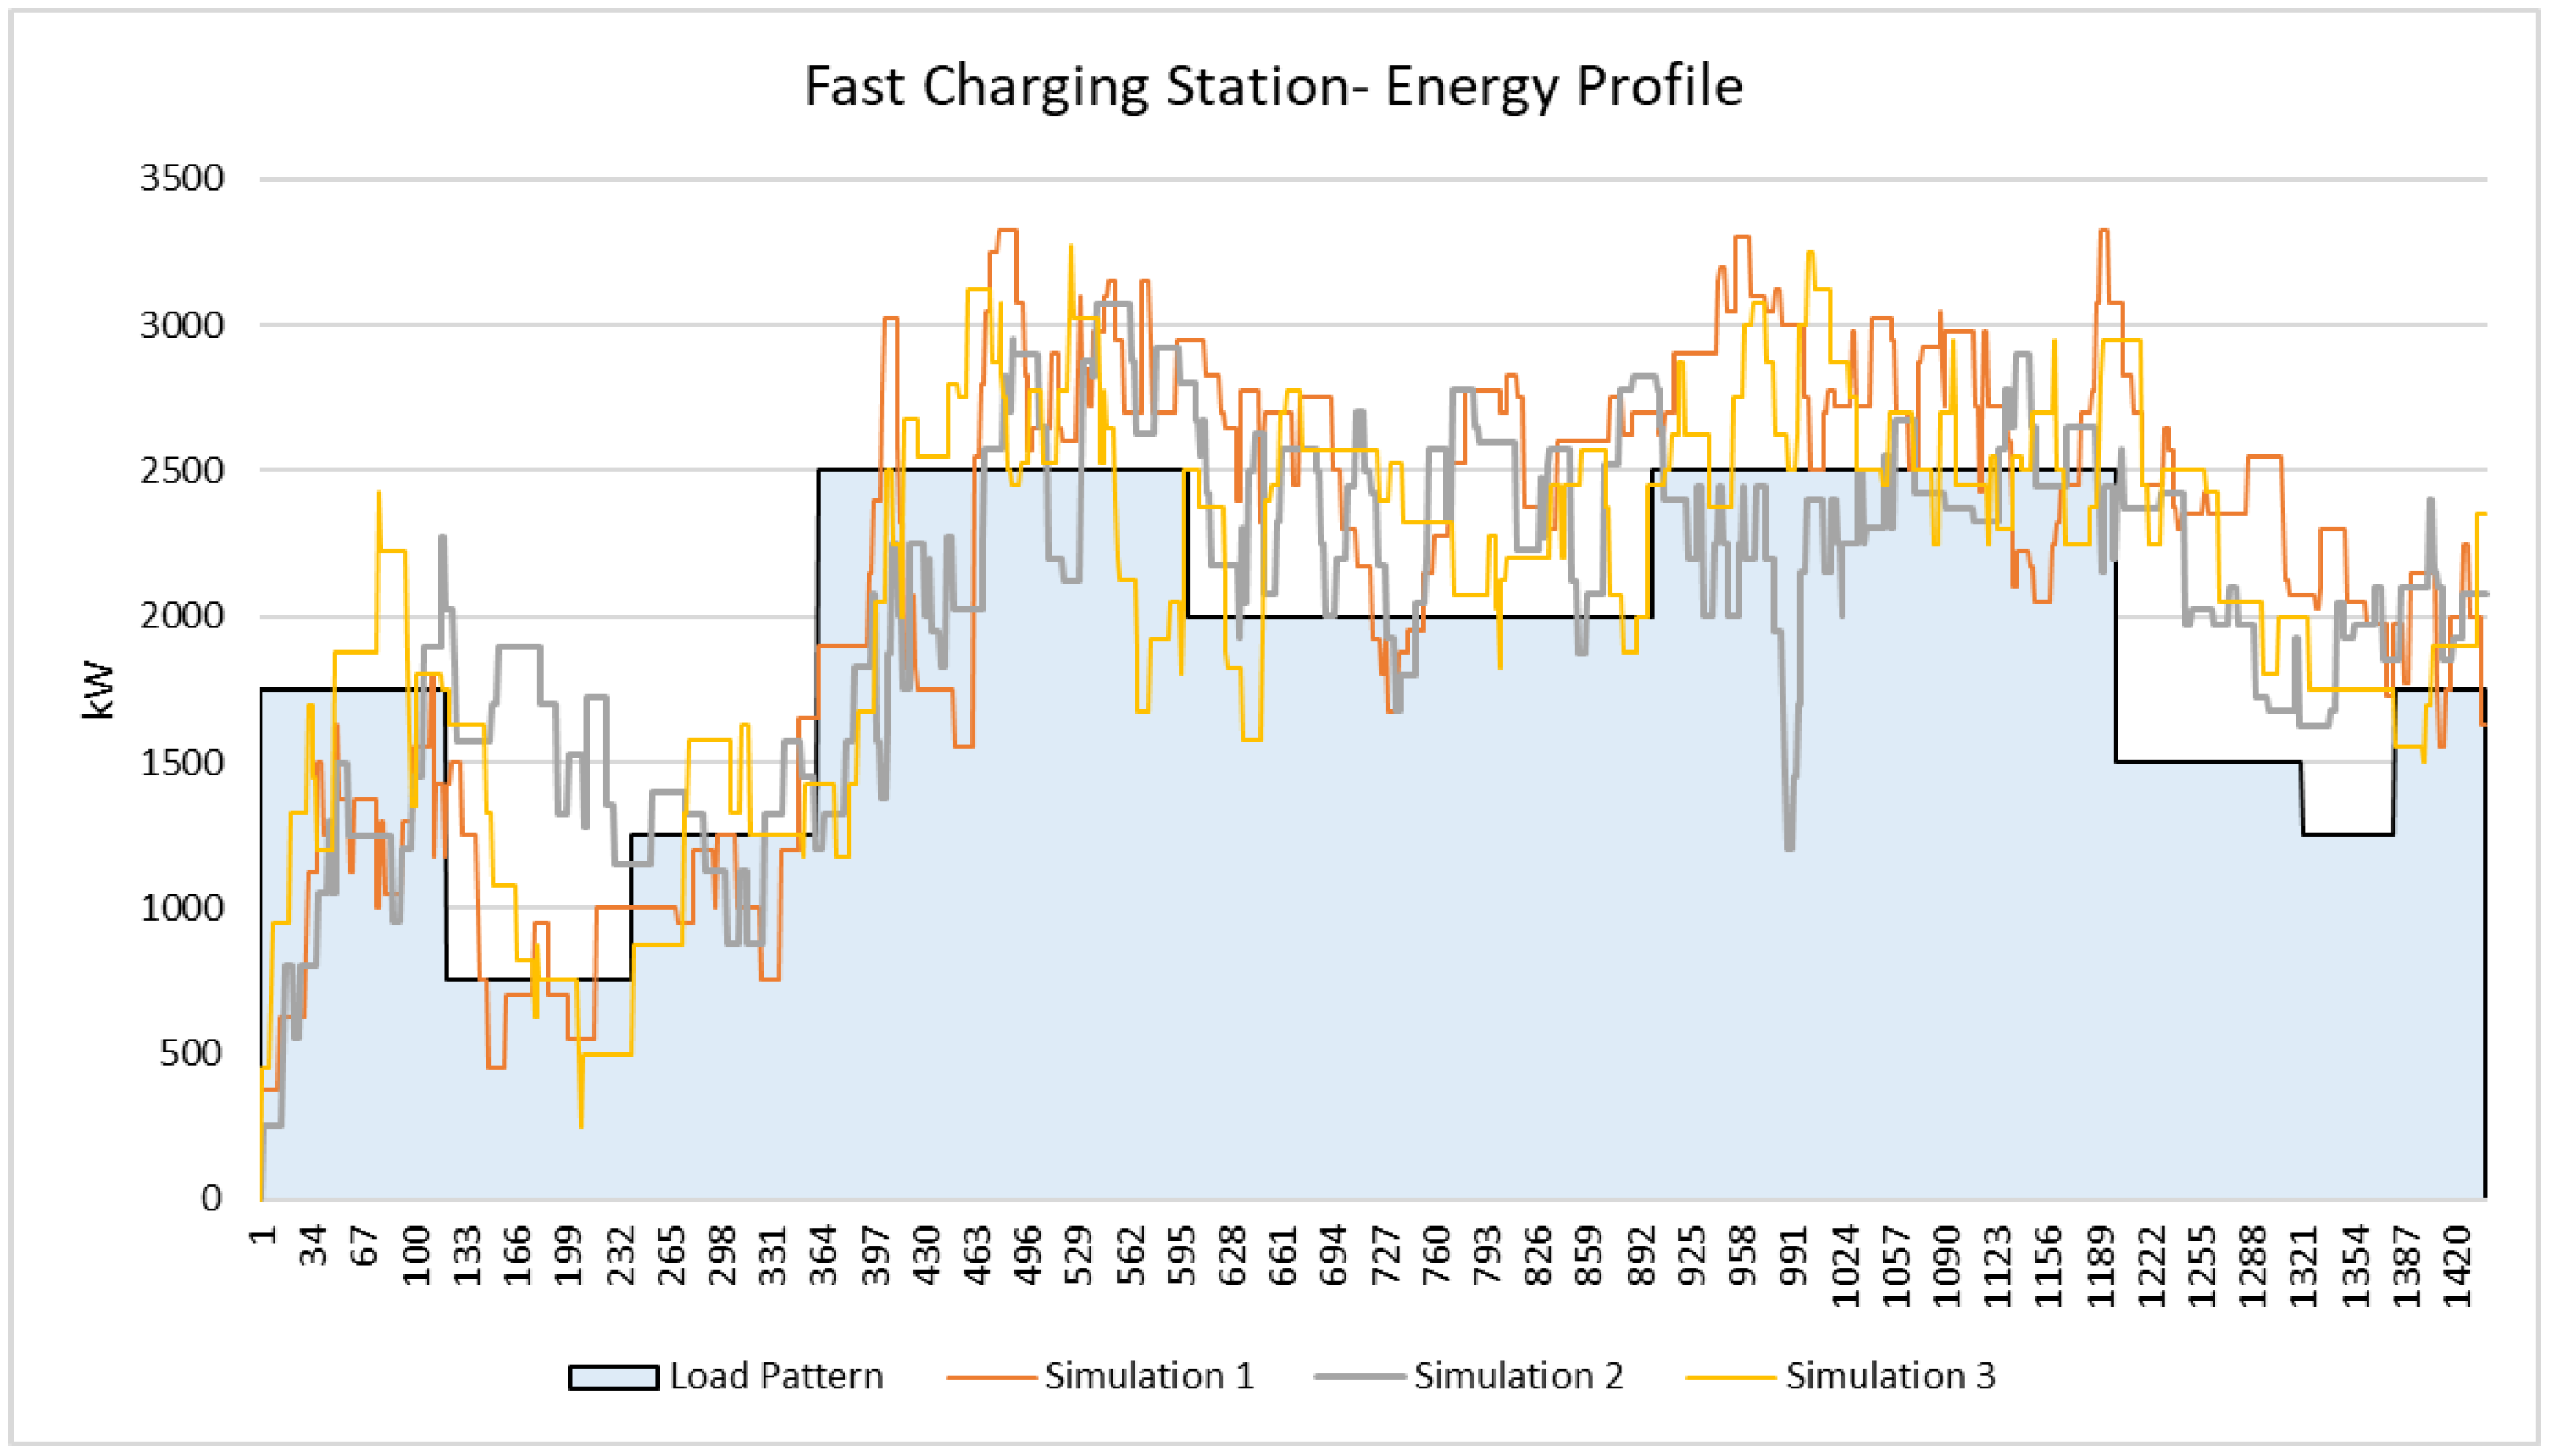
Figure 17 compares the energy load pattern used to simulate both the energy profile for the fast-charging station and to set the load following for the nuclear reactor, as well as three different simulation results. It is evident that, although the energy load follows a pattern, the high variability of the load poses a critical issue for maintaining a constant energy flow, thus highlighting the importance of integrating nuclear with renewable and energy storage systems.
During the simulation, certain assumptions were made. Given that an NPP can provide reliable and cost-effective energy, it is considered the primary source for the system, operating as load following based on the energy load pattern. However, as mentioned earlier, the load pattern does not accurately represent the energy profile. In a realistic scenario, the energy profile has rapid daily fluctuations that the NPP cannot accommodate. Therefore, the system requires additional energy sources to ensure reliability. Renewable sources will generate additional energy for the system. Since solar and wind energies are intermittent, any excess energy will be stored using a hydrogen system (through electrolysis and fuel cells) to provide energy to the system when neither nuclear nor renewable energy sources are available.
3.1. Natural Resource Availability
In projects involving generation systems, it is crucial to consider weather data that impact electricity generation. As this study focuses on solar and wind energy, radiation, temperature, and wind velocity profiles were necessary to determine the potential generation.
The HOMER Pro software was used to obtain solar irradiation and wind speed data for a system located in Toronto, Canada. The data were obtained from the NASA Surface Meteorology and Solar Energy Database.
For the technical and economic analyses, a 1-kW generic flat plate solar panel with a 25-year lifespan was considered for the solar system, while a 10-kW generic turbine was considered for the wind system.
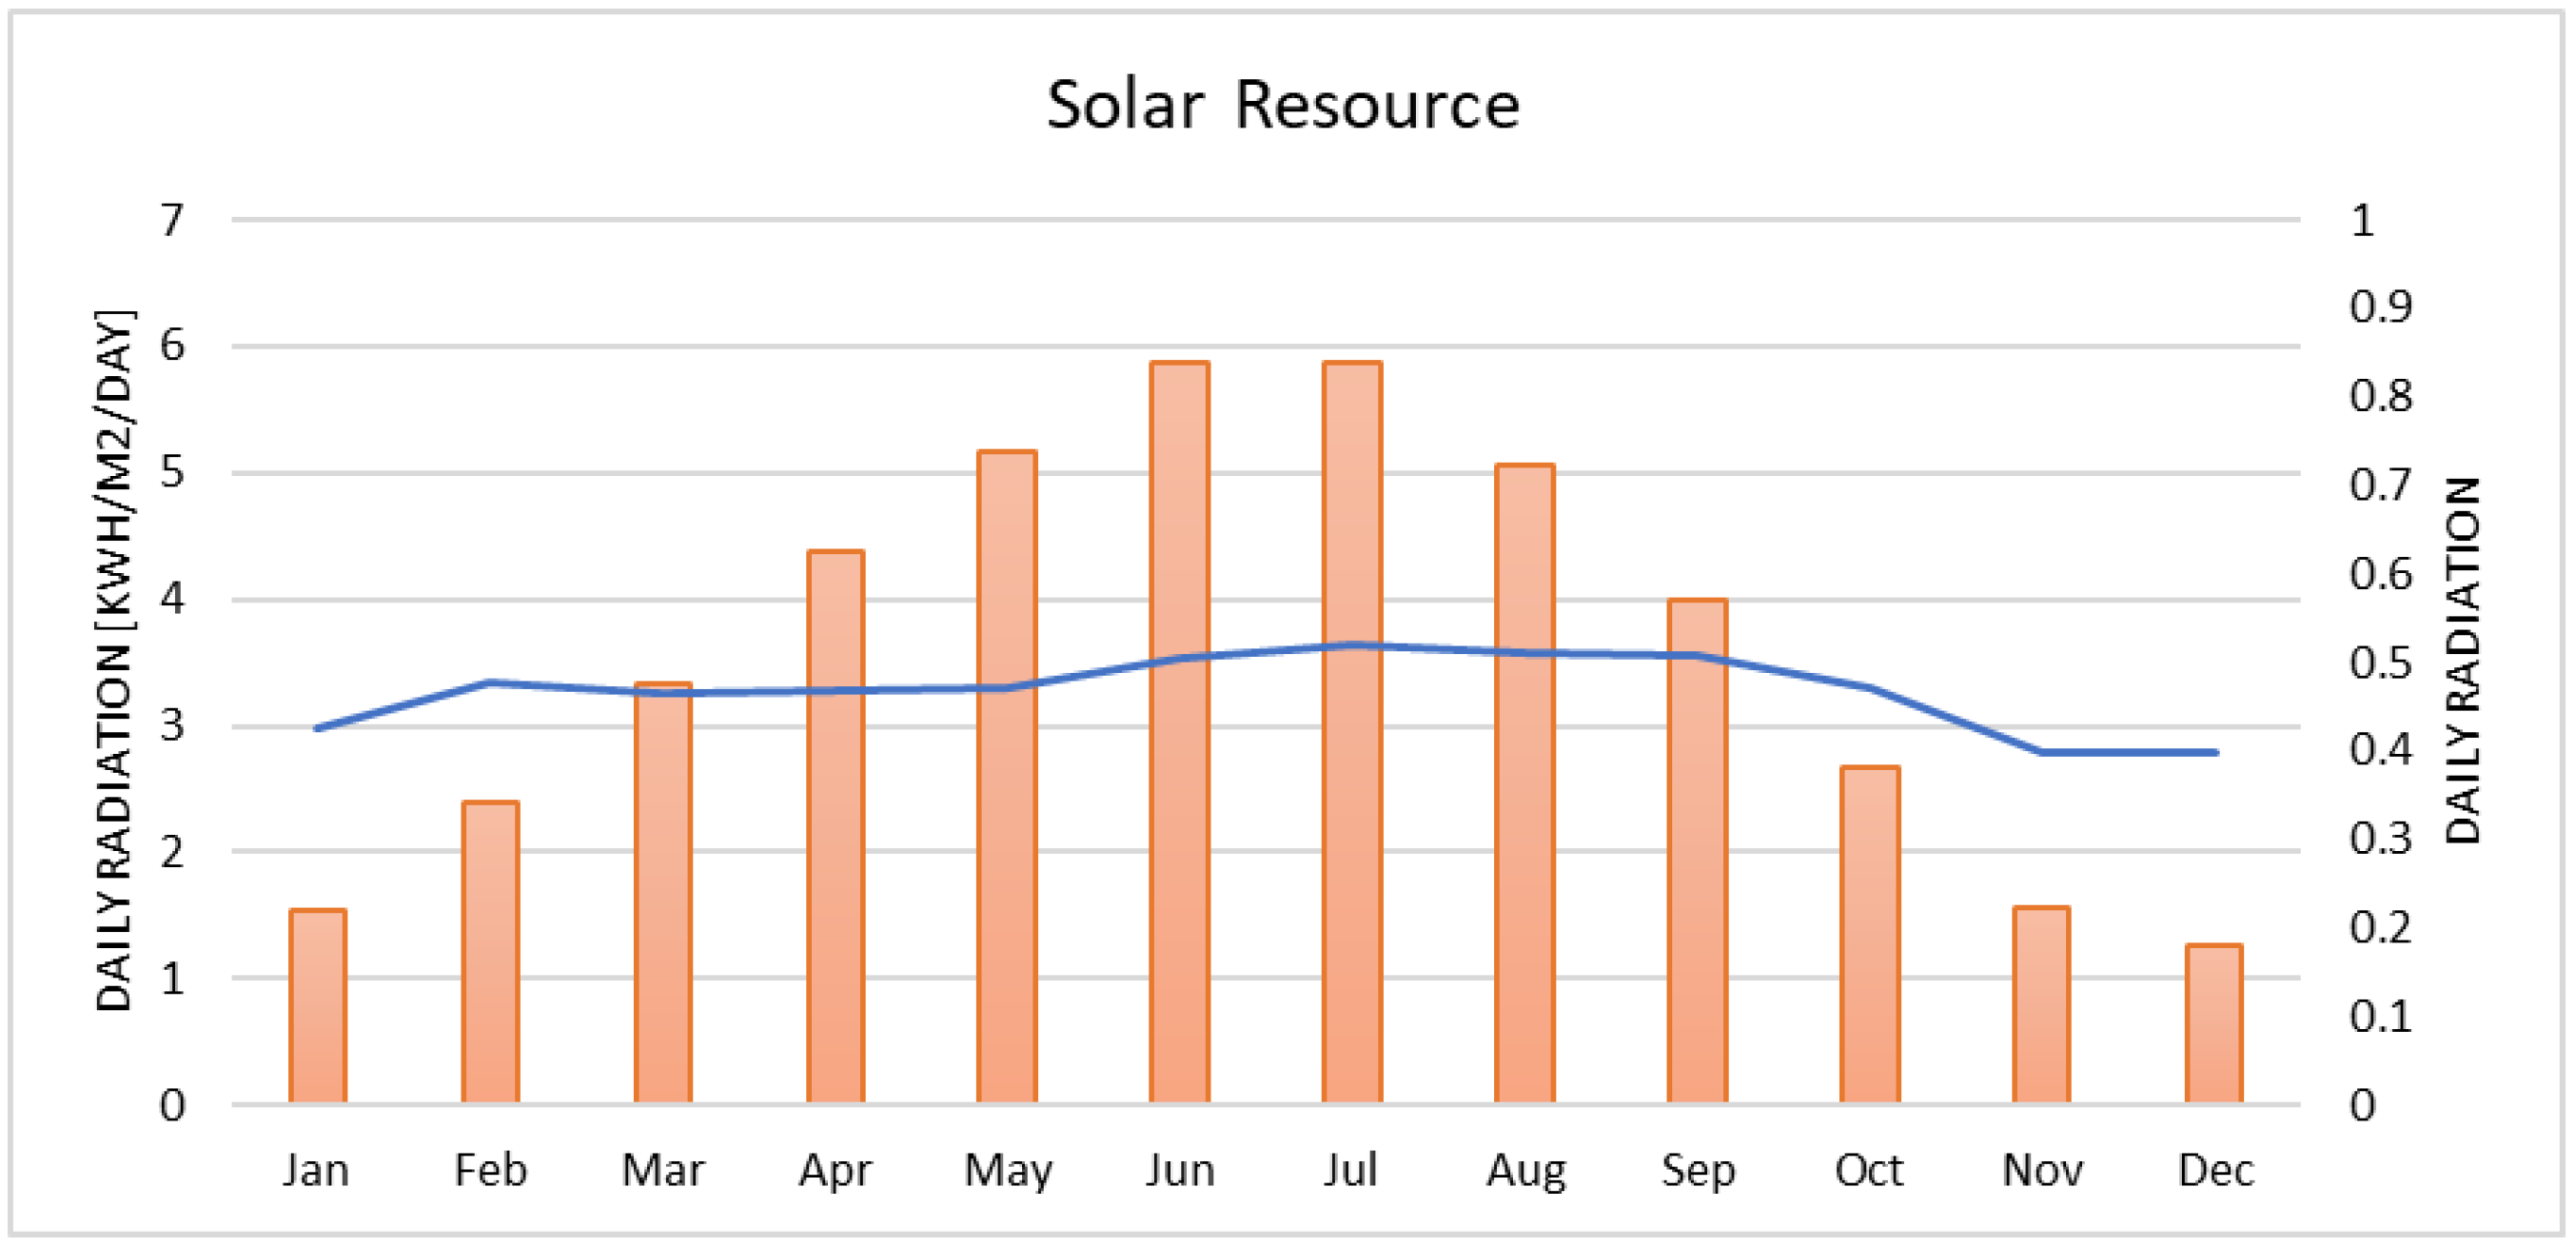
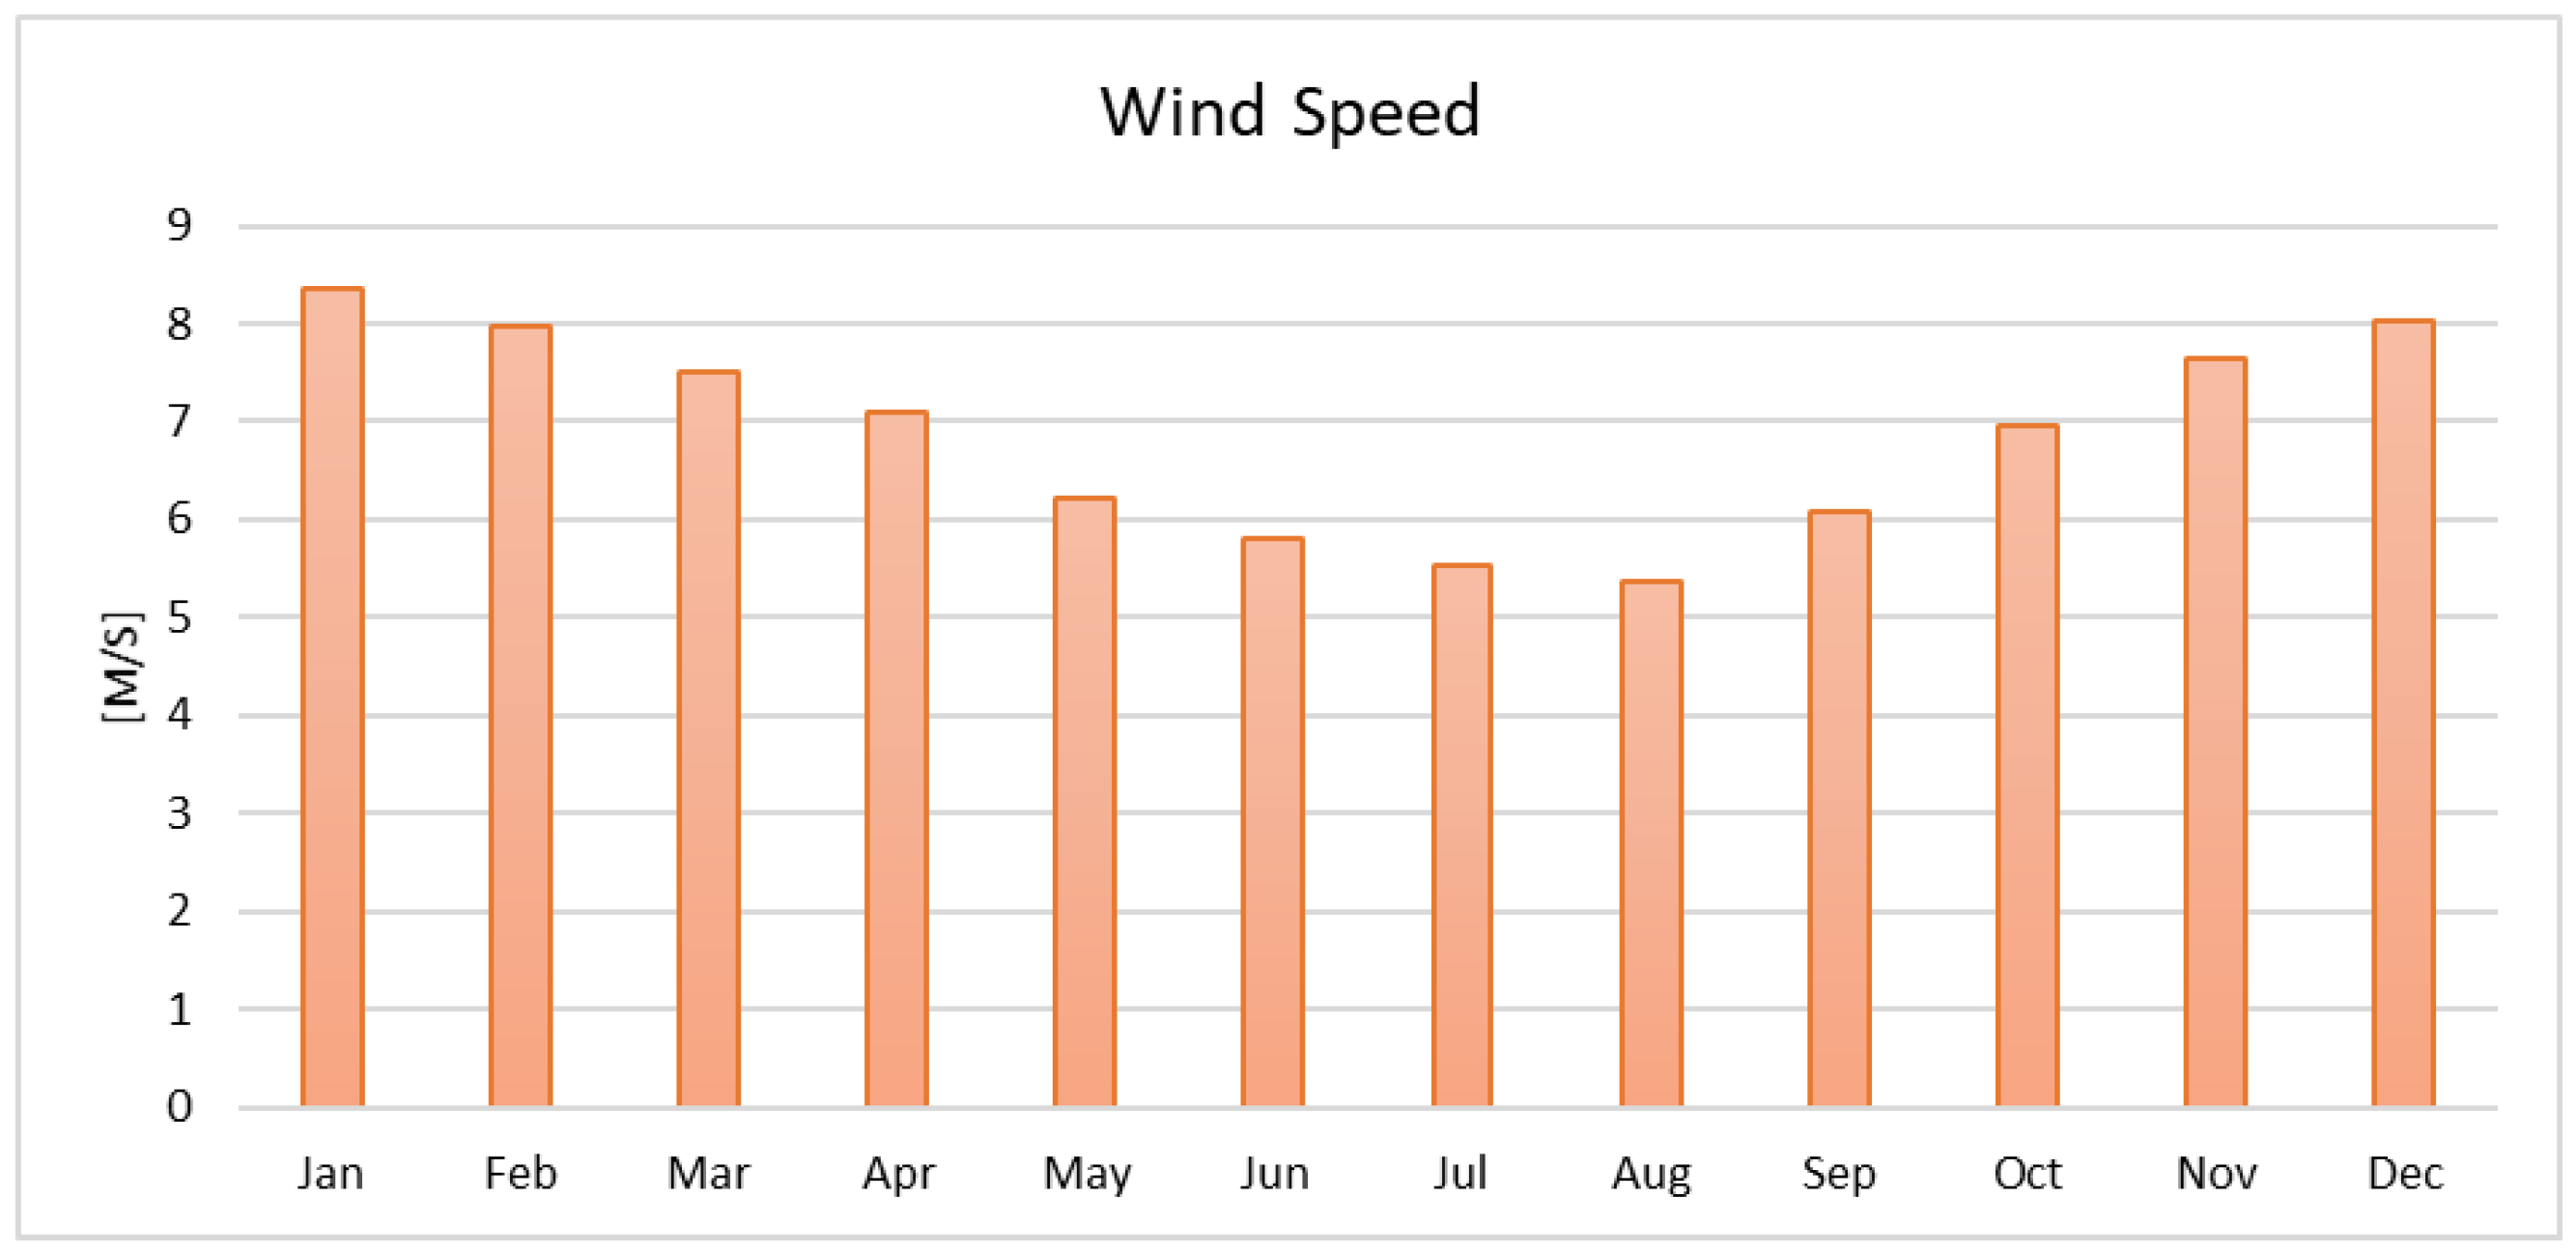
Figure 18 shows the solar radiation and clearness index profile, while
Figure 19 depicts the monthly average wind speed profile.
3.2. Component Parameters
3.2.1. Nuclear Power Plant
Estimating the cost of implementing a Small Modular Reactor (SMR) can be challenging due to several factors, including:
Design variability: SMRs come in different designs, sizes, and configurations, making it difficult to generalize cost estimates. Each design has unique cost drivers and complexities.
Limited operating experience: With SMRs being a relatively new technology, there is limited historical cost data available, making accurate cost estimation based on past performance challenging.
Licensing and regulatory uncertainty: The complex and time-consuming regulatory process for SMRs introduces uncertainties in estimating costs related to licensing and regulatory compliance.
Site-specific considerations: Costs can vary based on site-specific factors such as land acquisition, site preparation, infrastructure availability, and environmental assessments, requiring thorough site evaluations for accurate estimation.
Supply chain and manufacturing considerations: Establishing an efficient supply chain for SMR components can be challenging, impacting cost estimates. Factors like skilled labor availability, manufacturing capacity, and quality control play a role.
Financing and project management: Financing SMR projects and managing capital costs, interest rates, and financing terms pose challenges due to perceived risks associated with new technologies.
Overcoming these challenges necessitates the cooperation of various industry stakeholders, including reactor vendors, engineering firms, regulators, and project developers. Through ongoing research, development, and deployment of SMRs, coupled with operational experience gained from early projects, we can enhance cost estimation models and gain a better understanding of the cost drivers specific to SMR implementation.
In this work, certain parameters from larger nuclear plants were considered [
37] and scaled down to create a generic model based on the proposed power capacity, as summarized in
Table 3. It is important to note that these estimates are solely intended for illustrative and simulation purposes and may not accurately reflect the actual costs associated with an SMR.
3.2.2. Additional Components
The technical and economic parameters of the components used in this study were determined based on literature values. These values were used to identify the optimal scenario based on key indicators such as Present Net Cost and Cost of Energy.
The parameters for the Solar and Wind Systems are presented in
Table 4. These parameters include the maximum size limit for each system, as well as investment cost, replacement cost, maintenance cost, and expected lifetime.
Table 5 provides the parameters for the hydrogen system, including those for the fuel cell generator and the DC converter.
3.3. Economic Analysis
To conduct this study, the HOMER Pro software was utilized, as it is a valuable tool for sizing power generation systems that incorporate multiple energy sources. The software can conduct hourly simulations of energy flow for both the load and other system components, allowing for accurate optimization procedures. In addition, it can estimate the initial installation and operating costs and provide recommended economic indicators for proper economic analysis. The software considers project lifespan and factors in variables that impact the analysis procedure, including the price and power ratio of available solar modules, inverters, and wind turbines. These advantages make HOMER Pro a reliable choice for sizing power generation systems.
The software calculates several economic factors, including:
: Total annualized cost (USD);
: Capital Recovery factor;
: Interest rate (%);
: Project lifetime (years).
: The AC primary load;
: The DC primary load;
: number of years;
: annual real interest rate.
: real interest rate;
: nominal interest rate;
F: annual inflation rate.
All the parameters used as input to the economic analysis were presented previously in
Table 3,
Table 4 and
Table 5.
4. Results and Discussion
The proposed system was simulated using HOMER Pro software, a tool for designing and optimizing microgrids. Developed by HOMER Energy LLC, a company specializing in renewable energy system design, the software allows users to model and simulate different energy systems based on specific requirements and constraints, such as renewable energy sources, storage, and backup generators. HOMER Pro can also optimize system design to minimize costs, reduce carbon emissions, or achieve other goals. However, while the software is highly advanced, it lacks nuclear reactor components and an advanced algorithm for predicting electric vehicle energy consumption.
To overcome these limitations, HOMER provides a custom tool where users can import data from other software and use it in simulations. In this work, output power from the nuclear reactor and the fast-charging station’s energy load was generated using the models presented in
Section 3.1 and
Section 3.2, respectively. These time series were then uploaded into HOMER Pro as custom components. By doing so, the proposed system was successfully simulated, and its performance was evaluated.
As an outcome, HOMER Pro provides a range of simulation results that enable us to evaluate the performance of the proposed microgrid design. The software generates reports and graphic outputs that summarize the simulation results and provide insights into various aspects of the microgrid’s performance, such as the energy balance, cost analysis, performance metrics, and sensitivity analysis.
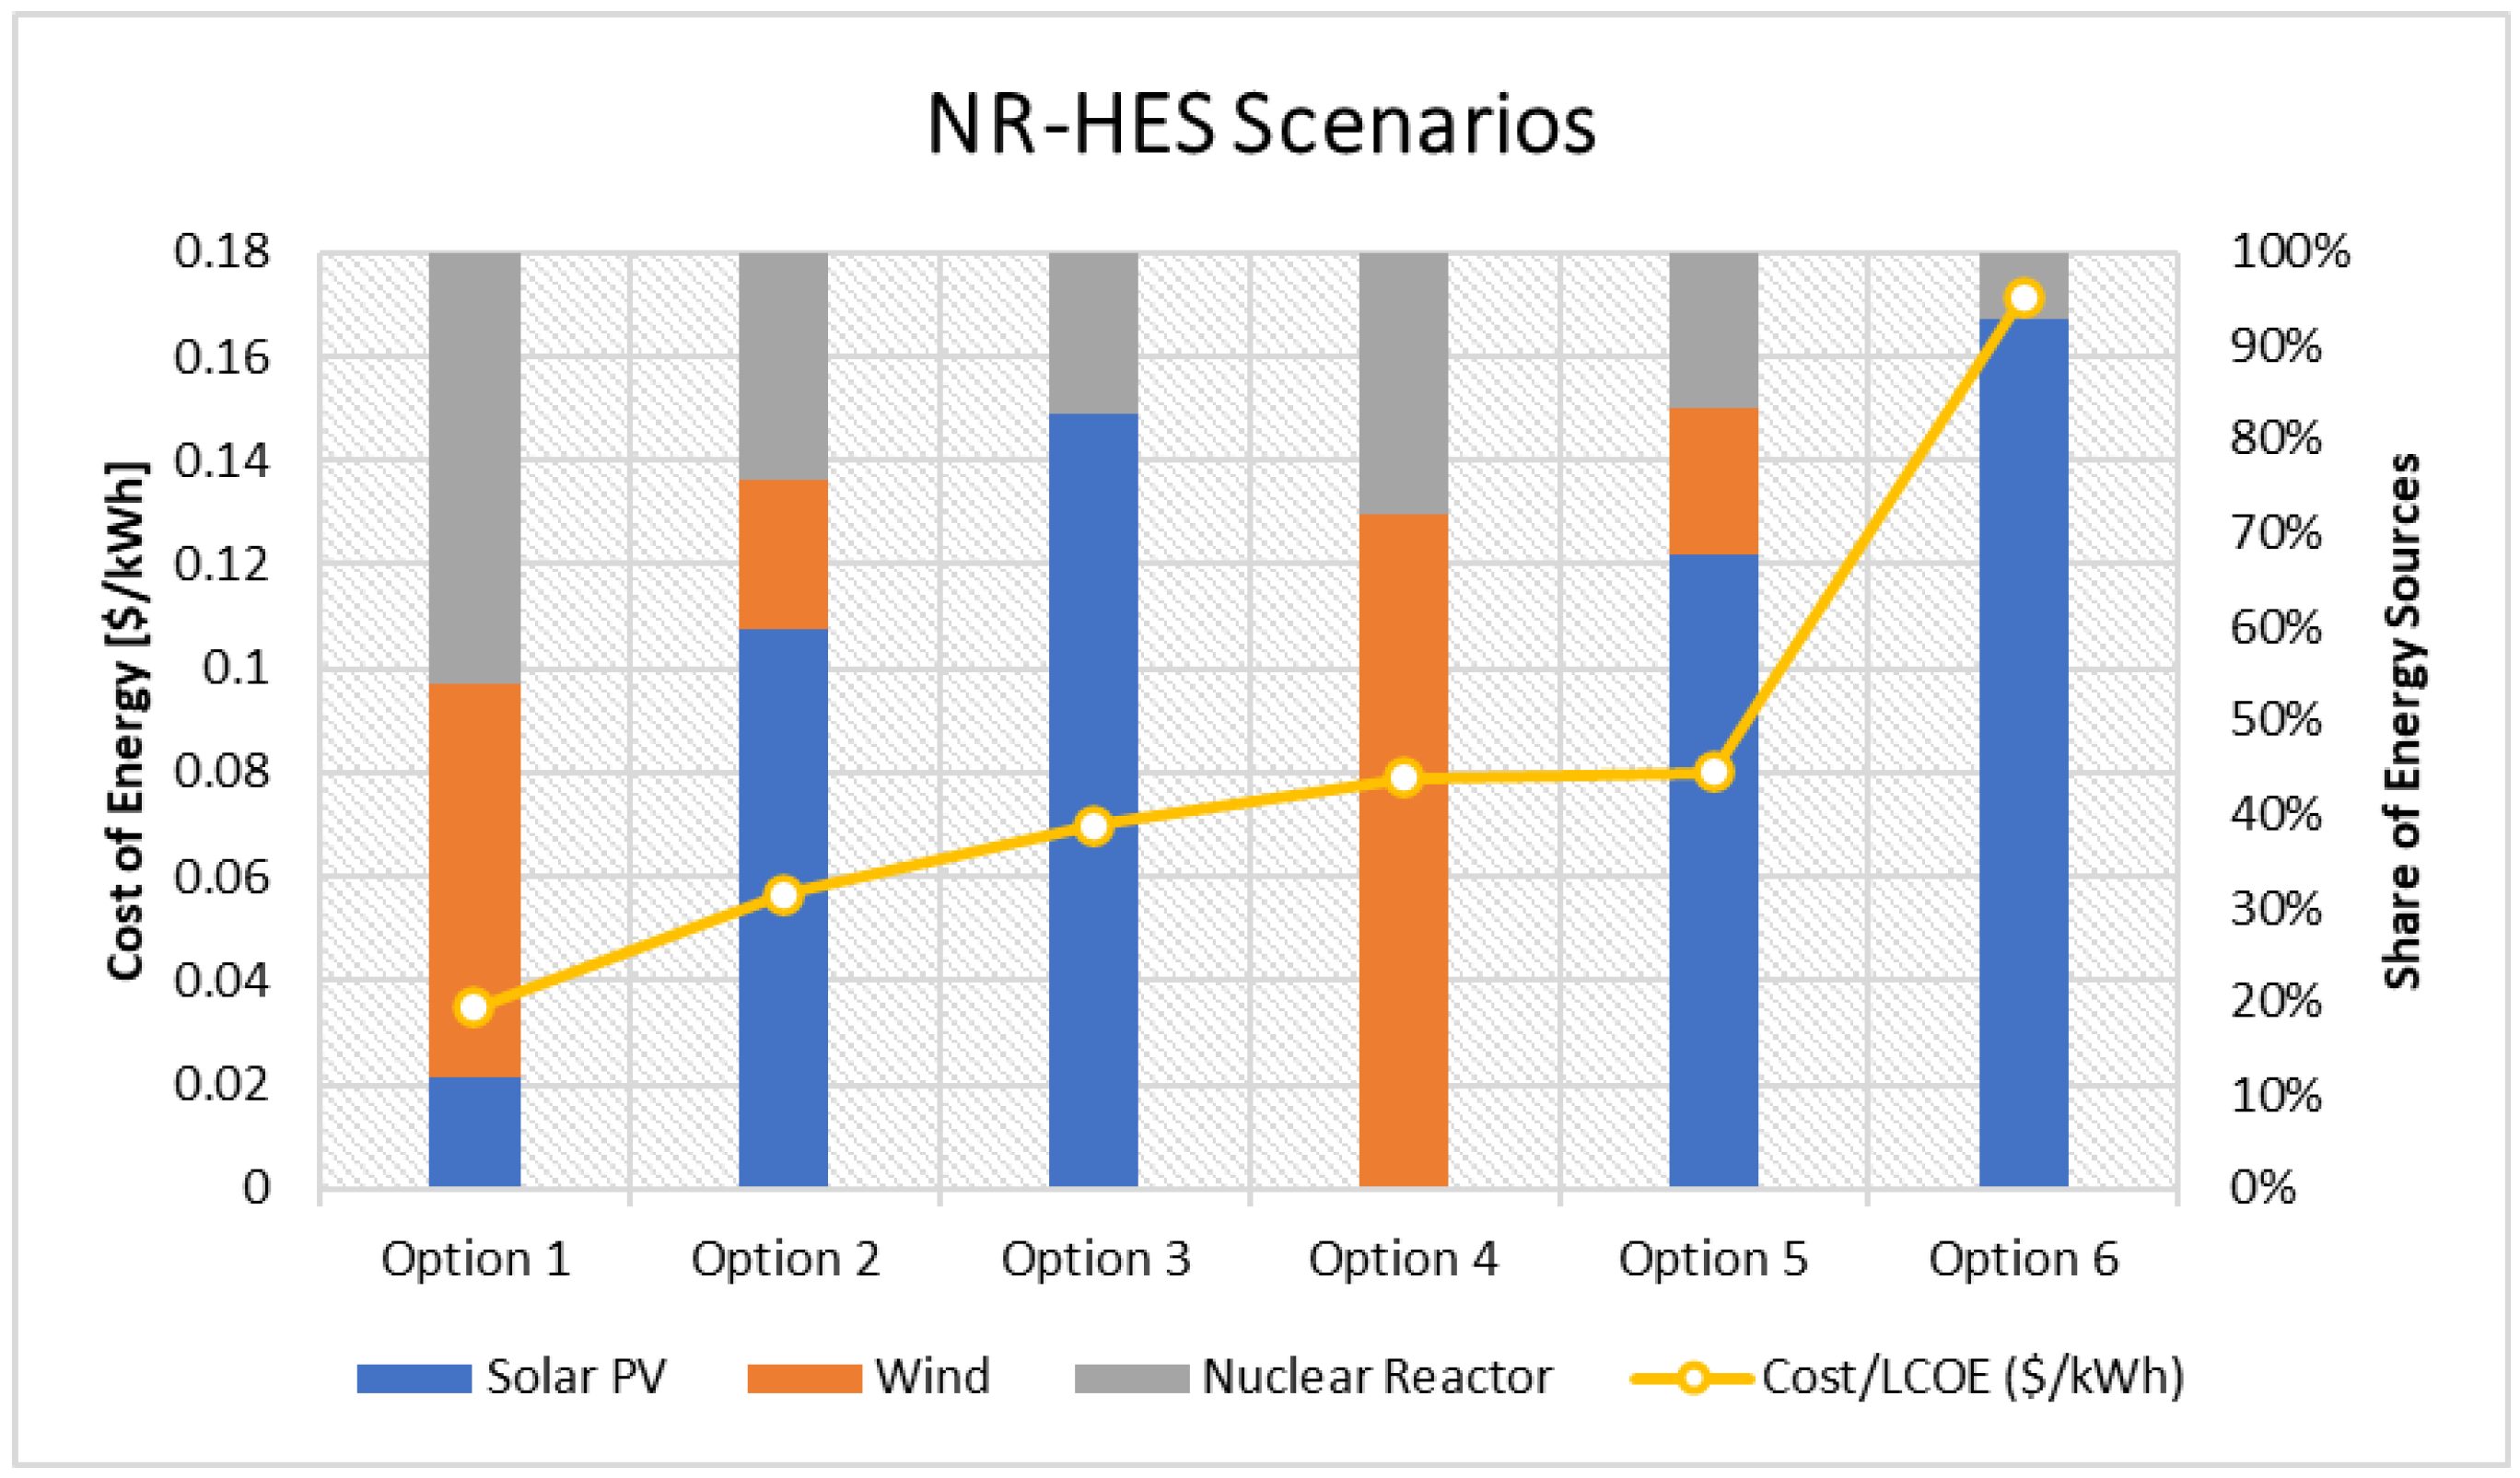
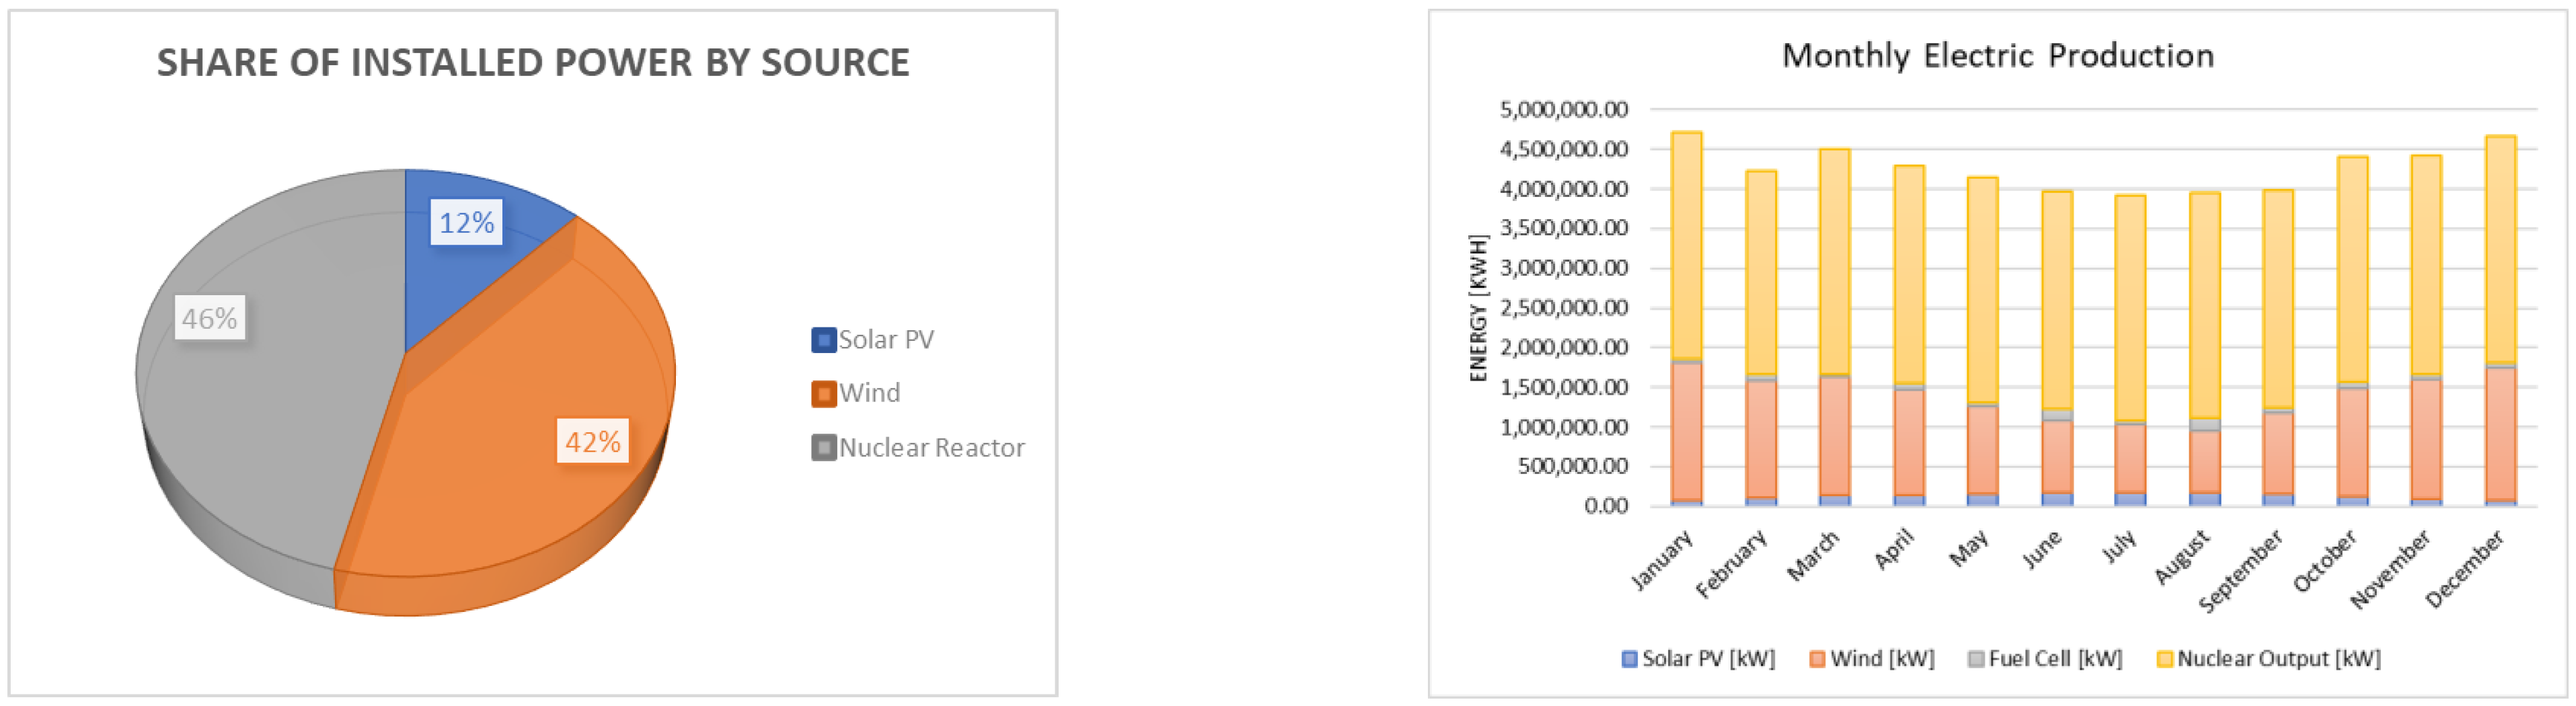
Figure 20 shows the simulation results of six system configuration options, including their energy source shares and energy cost. The cost of energy is a crucial parameter because it considers all costs related to each technology, as well as the energy production capacity of the system, and determines which system presents better economic feasibility.
Figure 20 summarizes several system configuration options, with option 1 being the most feasible. It has a cost of energy of USD 0.35 per kWh and an energy mix comprising 46% nuclear reactor, 42% wind energy, and 12% solar energy, as displayed in the left chart of
Figure 21. The right chart in
Figure 21 shows the monthly energy production by source, which also includes the fuel cell representing the use of hydrogen as energy storage to supply the load when the primary sources are insufficient.
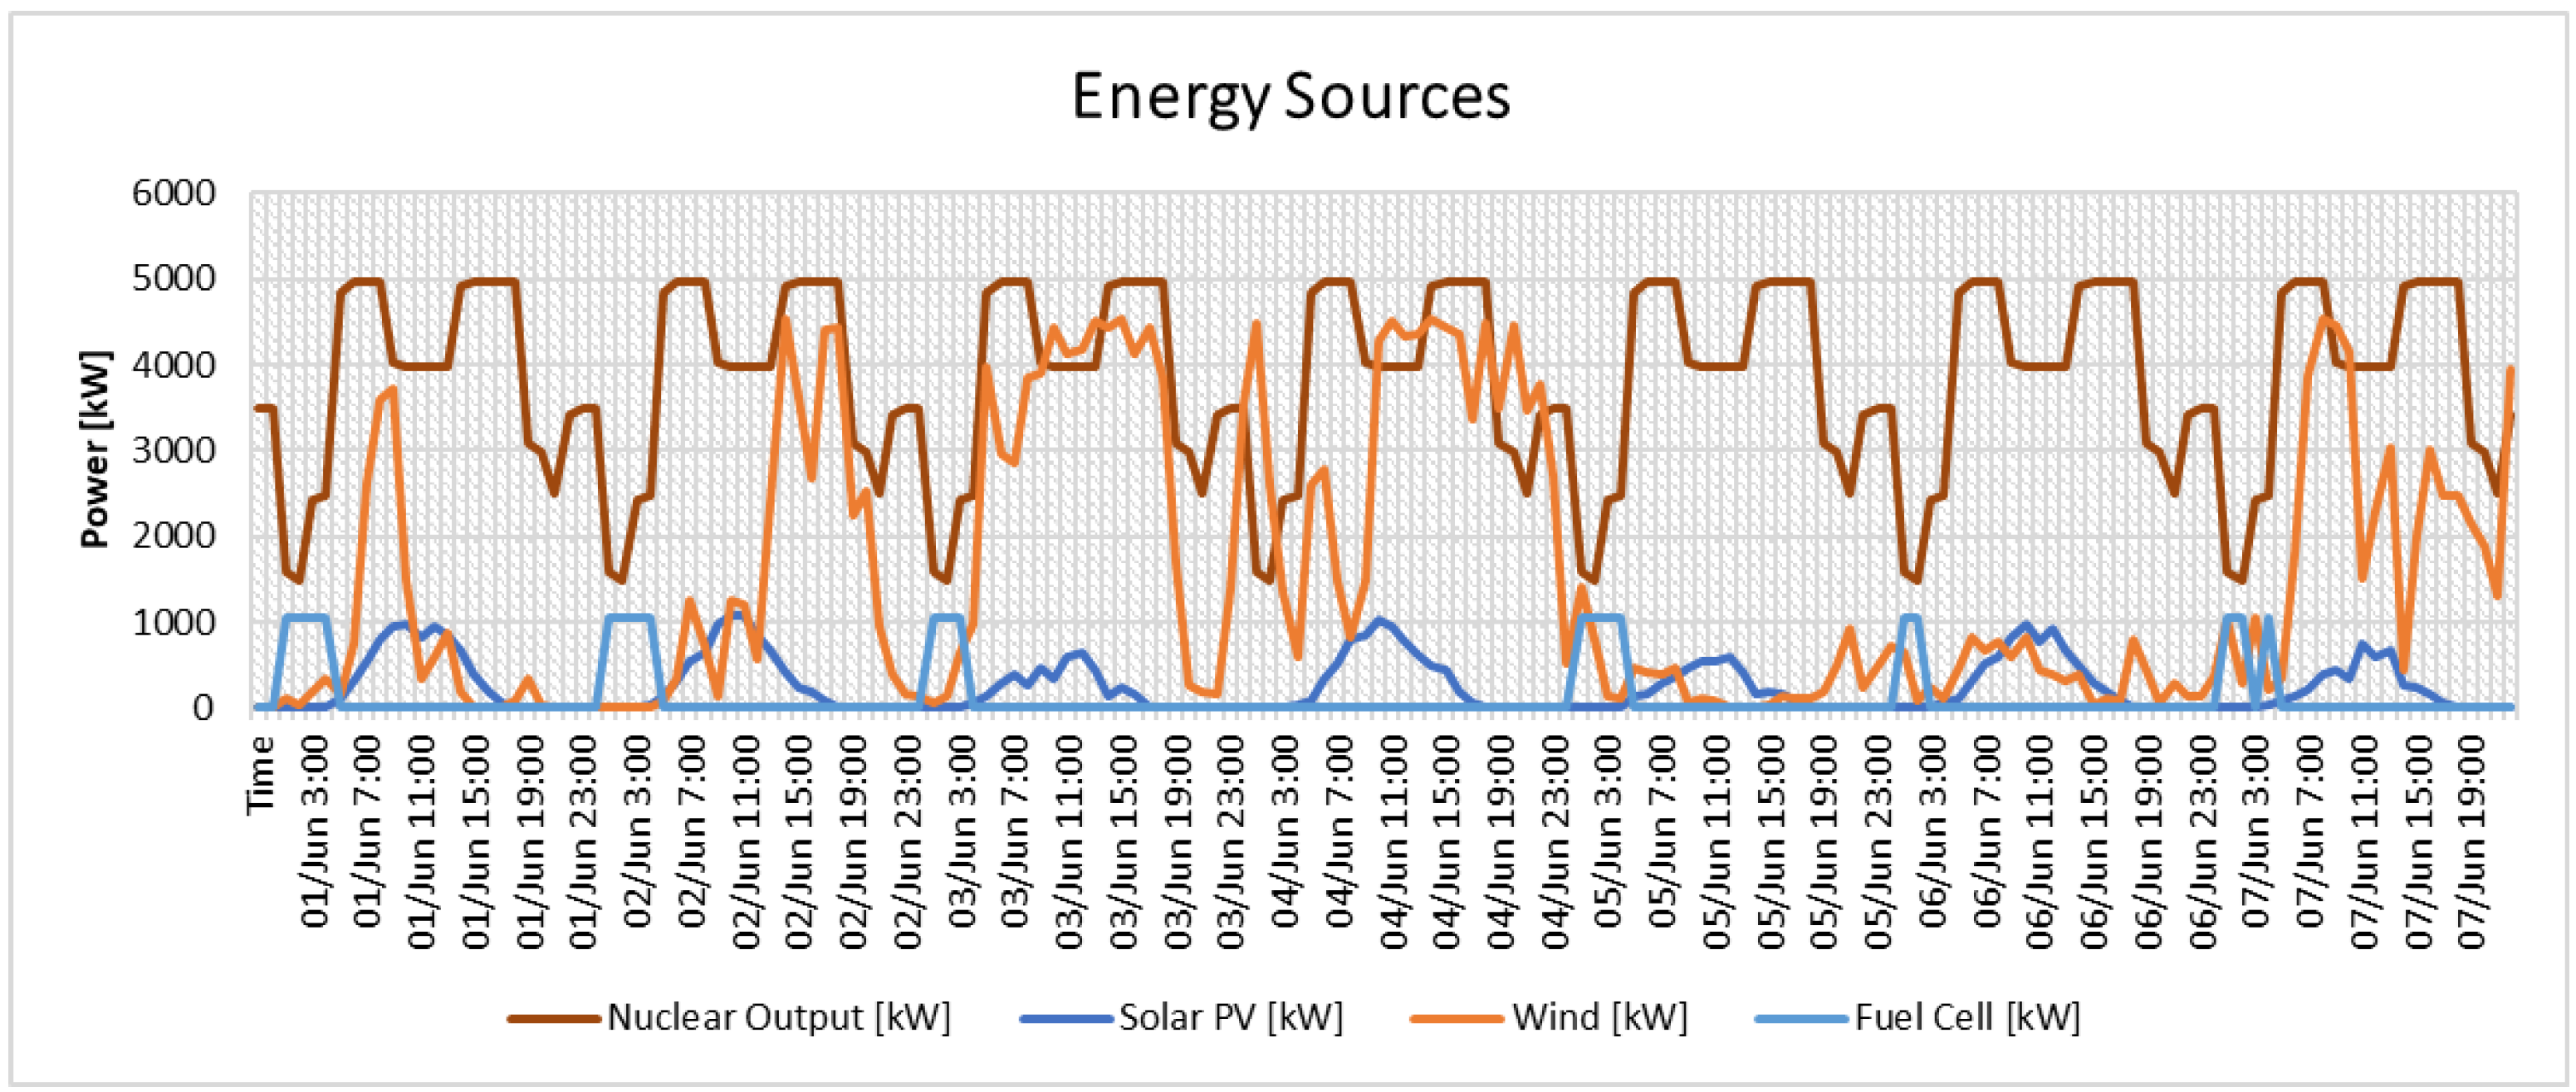
The energy system’s production is illustrated in
Figure 22, showcasing a 7-day sample of energy flow based on the energy management methodology introduced in
Figure 16.
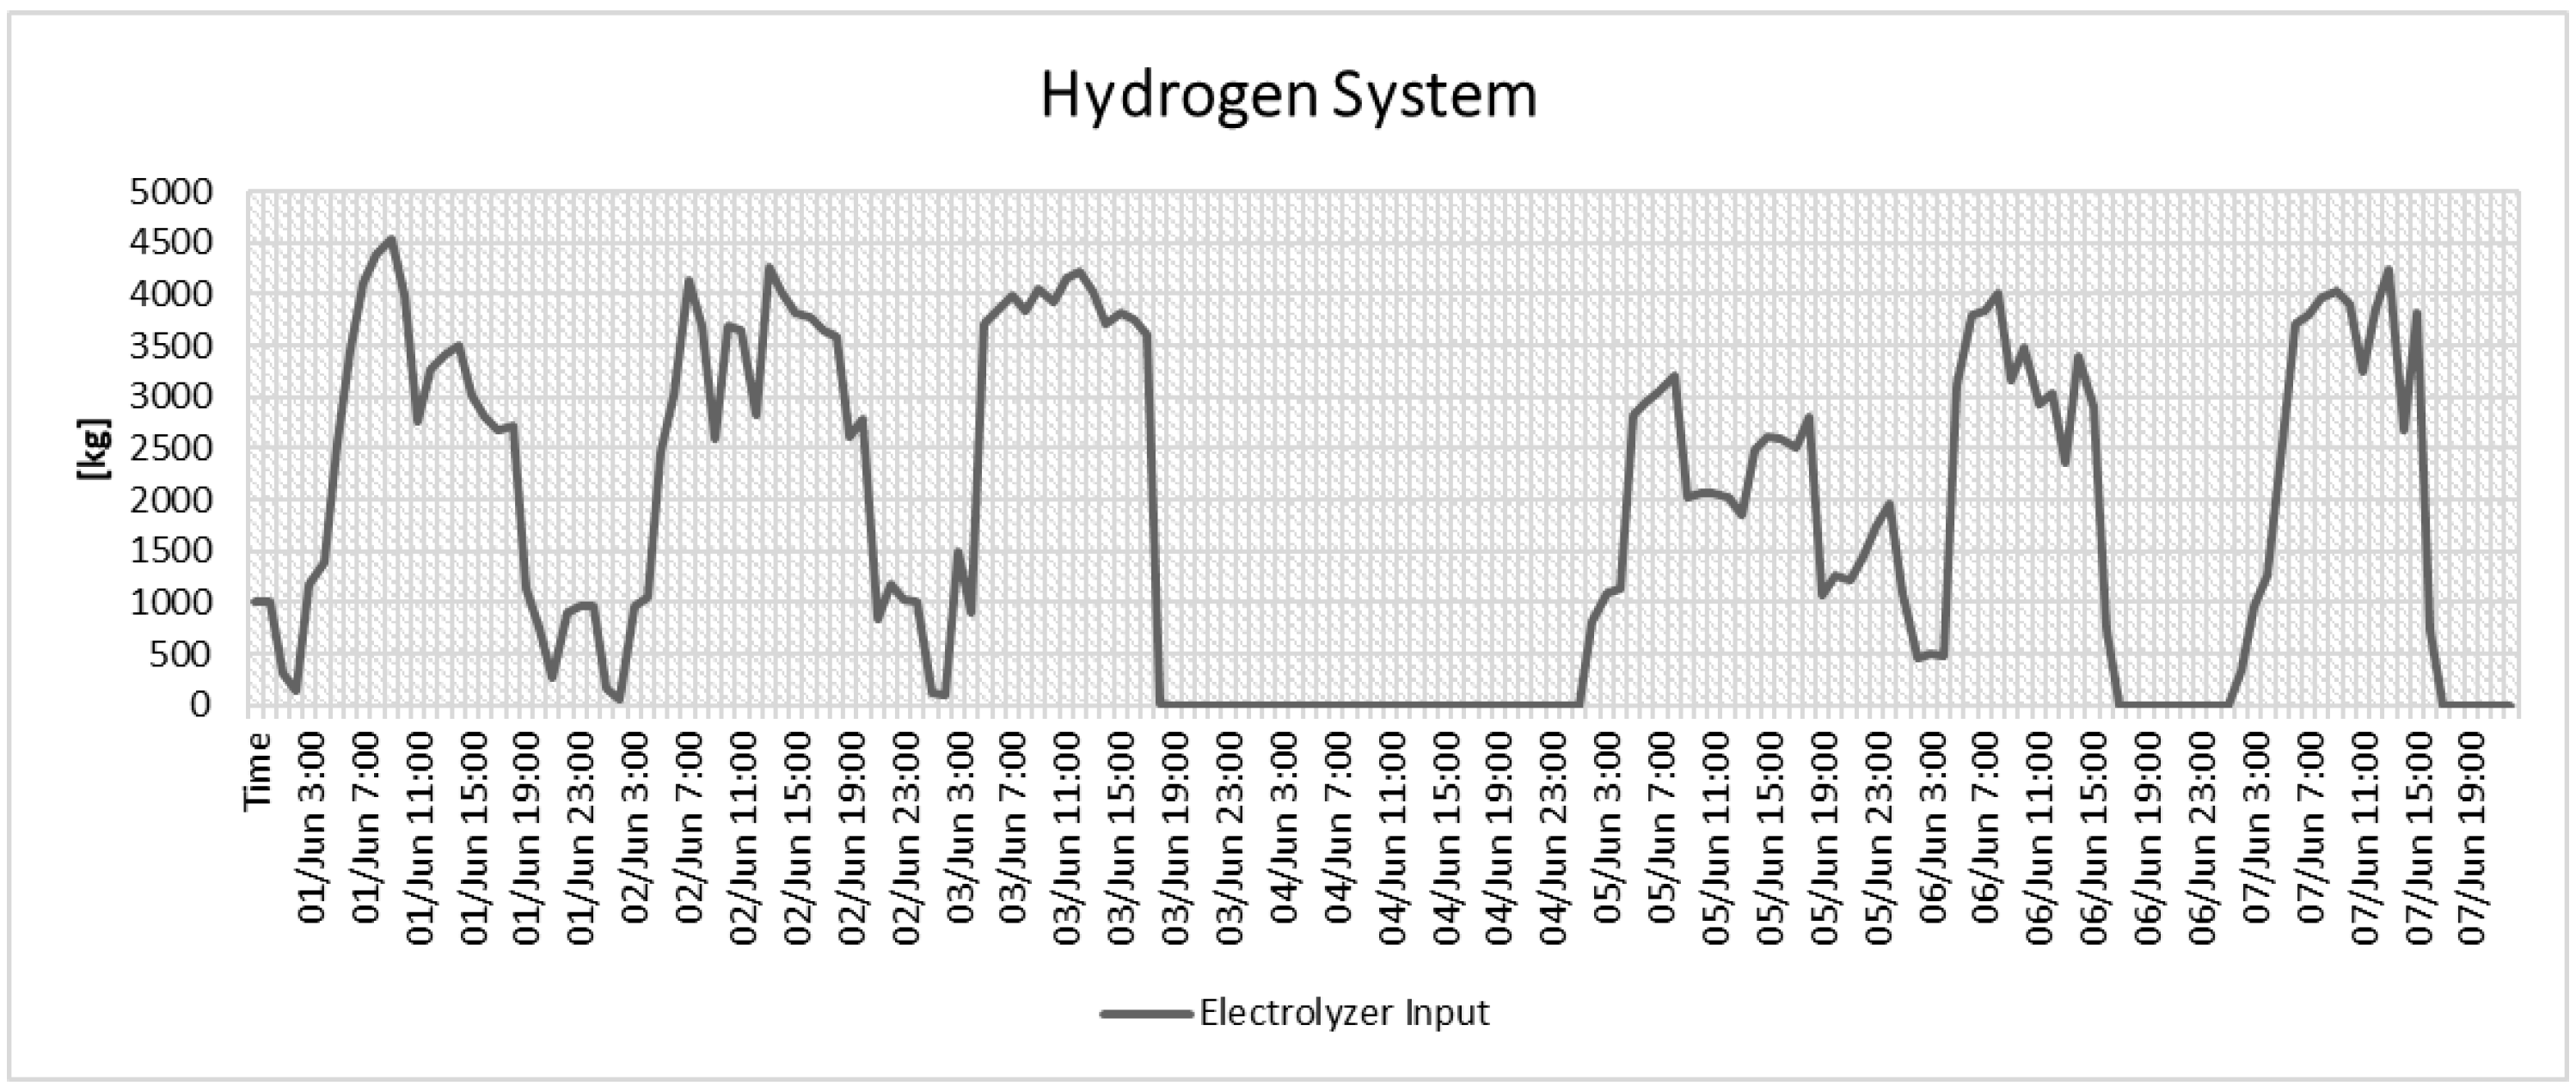
Figure 23 displays a 7-day timeframe demonstrating the hydrogen system utilized as an energy storage method. It shows the quantity of hydrogen produced in kilograms from the excess energy generated by the energy sources. The hydrogen generated is stored in a tank to be utilized as fuel for the fuel cell generator, producing electricity when necessary.
This study also conducted a sensitivity analysis to assess the impact of input variables on the system outcome. This analysis involves simulating a particular scenario by varying multiple values of an input variable. It is often difficult to determine an exact value for a variable, especially when considering future scenarios, hence the need for a sensitivity analysis.
By defining a range of values, it is possible to assess the impact of a variable and understand how the solution varies according to its value. In other words, it is possible to determine the degree of sensitivity of the system’s outputs to changes in that variable. By conducting a sensitivity analysis, users can identify the optimal values for these variables in a particular scenario and evaluate their impact on the system’s energy cost.
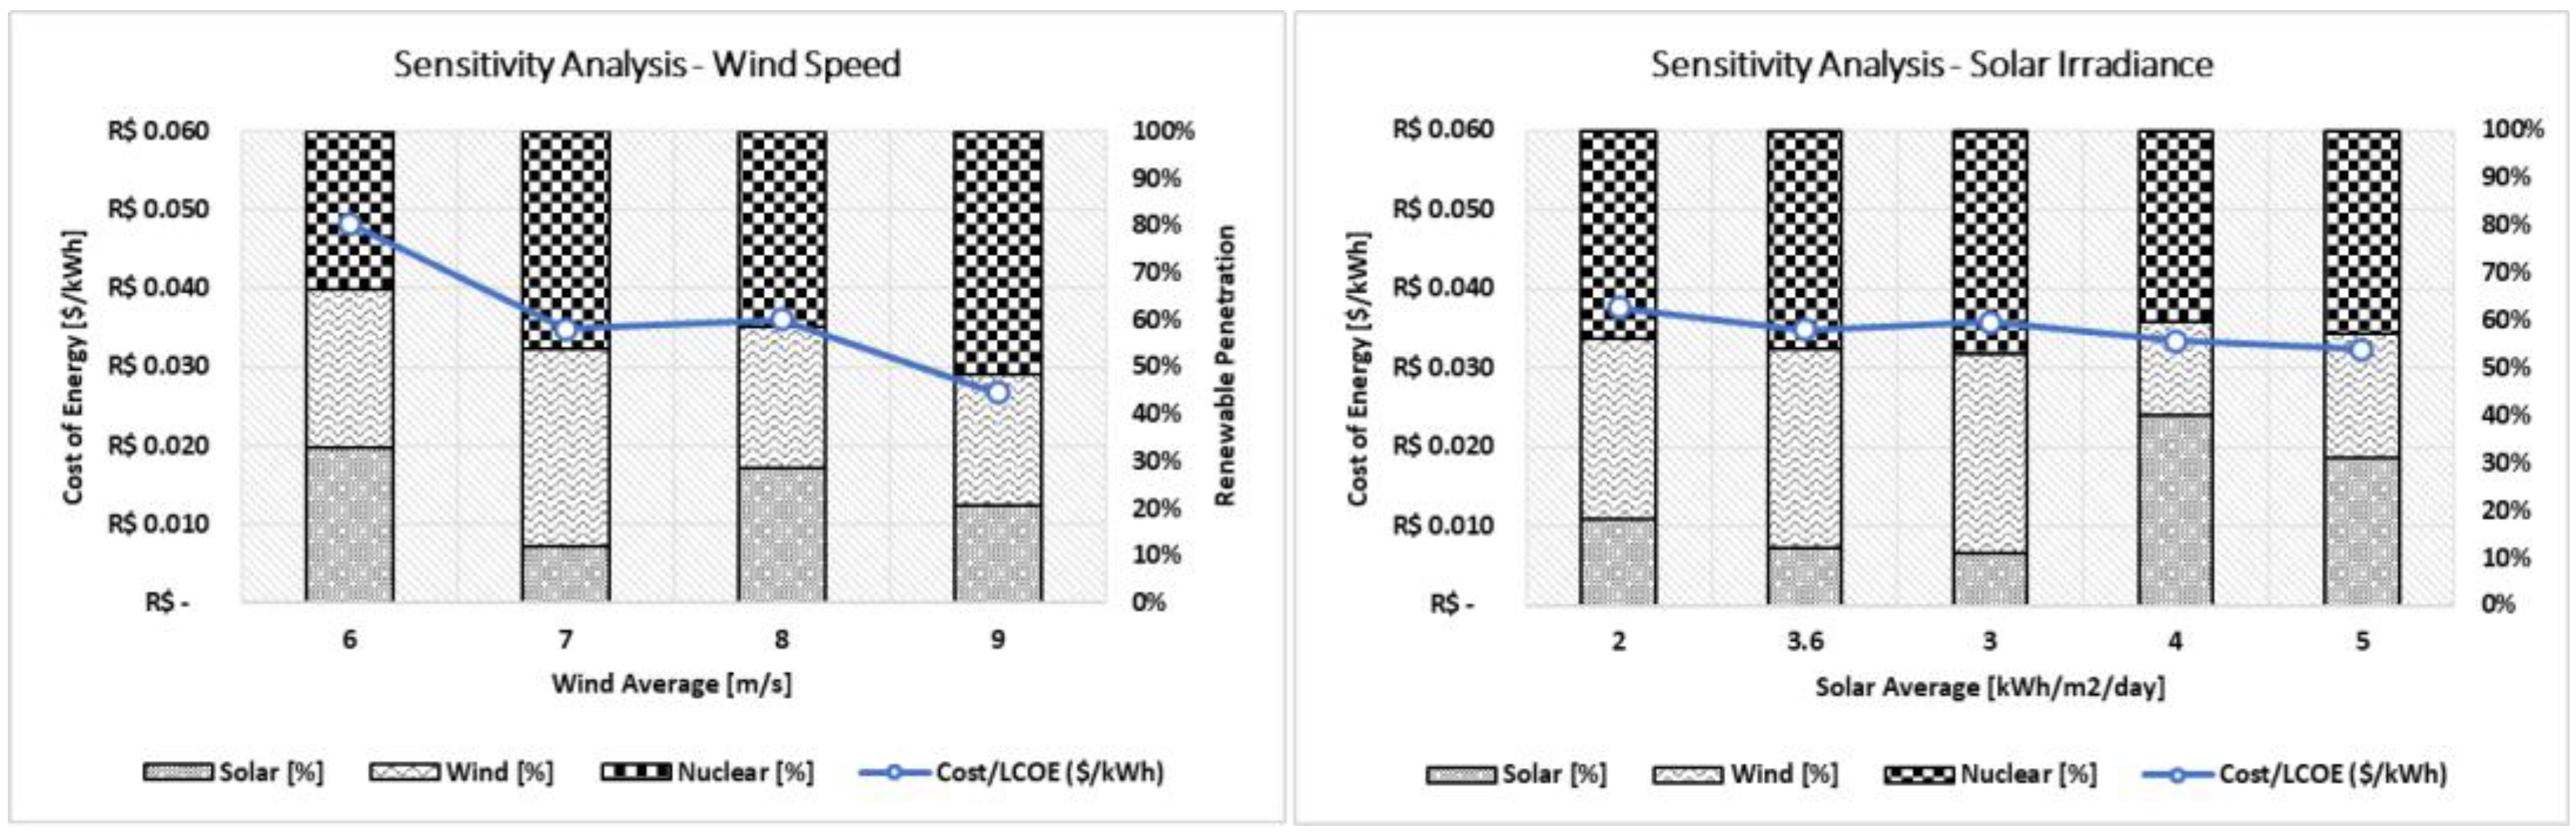
The sensitivity analysis in this paper considered two parameters: solar irradiance and wind speed. Varying these parameters results in a recalculation of the optimal rates of solar and wind, which in turn affects the energy cost. The default value for average wind speed used in this paper is 7 m/s, but the sensitivity analysis considered four additional values: 5 m/s, 6 m/s, 8 m/s, and 9 m/s. Similarly, the default average value for solar irradiance is 3.6 kWh per square meter per day, but the sensitivity analysis also simulated values of 2, 3, 4, and 5 kWh per square meter per day.
The left graph in
Figure 24 displays the sensitivity analysis for the wind system, while the right graph presents the same for the solar system. The steeper line on the wind speed graph indicates that changes in wind speed can have a greater impact on the cost of energy. Therefore, obtaining a precise wind speed estimate is crucial for creating an optimal energy system and may require additional time and resources. Another advantage of performing a sensitivity analysis is assessing a single system’s suitability for multiple installations. If the sites are similar except for wind speed, several wind speeds within the appropriate range can be specified. Since hybrid energy systems require consideration of numerous environmental and economic factors at the installation site, each system must be tailored to its specific location.
5. Conclusions
The transportation industry significantly contributes to global carbon emissions and air pollution, posing environmental and health hazards. To mitigate these issues, electric vehicles (EVs) have emerged as a promising solution by reducing carbon emissions and improving air quality. However, the sustainability of EVs is closely tied to the source of electricity used to charge them. Nuclear-Renewable Hybrid Energy Systems offer a potential solution to power EV charging stations sustainably. These systems combine nuclear and renewable energy sources, providing a dependable and resilient power supply, reducing carbon emissions, and decreasing overall energy production costs.
This project aims to enhance previous research by developing a predictive and adaptive control strategy to optimize the energy management of Nuclear Renewable-Hybrid Energy Systems for fast charging stations. The focus is on assessing the load-following performance in nuclear reactors and their integration into a hybrid energy system. The model analyzes different options to power a fast-charging station, including nuclear reactors, photovoltaics, wind turbines, and storage media such as hydrogen storage fuel cell systems. In the hydrogen storage system, excess power is used to produce hydrogen through an electrolyzer stored in a tank and consumed by the fuel cell as needed. A dynamic model of a fast-charging station is presented to predict electricity consumption behavior during charging processes by generating probabilistic forecasting of electricity consumption time-series profiling.
HOMER Pro software, a tool for designing and optimizing microgrids, is used to conduct the simulation.
Figure 20 compares various scenarios for N-RHES that modify the distribution of energy sources, consequently affecting energy costs. This analysis is crucial for assessing each technology’s impact and determining the system’s physical constraints. For instance, option 1, which offers the lowest energy cost, incorporates a 47% share of wind farms. However, it is important to note that wind farms require a substantial land area for implementation. In cases where limited territory is a constraint for wind turbines, option 2 might be more favorable. Although it has a slightly higher energy cost, the proportion of wind energy is lower.
Additionally, a sensitivity analysis is an effective method to evaluate feasibility by comparing different parameters.
Figure 24 illustrates the sensitivity analysis results, which examine the influence of input variables such as solar irradiance and wind speed on the system’s outcomes. Adjusting these parameters recalculates the optimal solar and wind energy ratios, impacting energy costs. Performing a sensitivity analysis offers the advantage of assessing the suitability of a single system for multiple installations. If the sites share similarities except for wind speed, various wind speeds within an appropriate range can be specified. Hybrid energy systems require consideration of multiple environmental and economic factors unique to each installation site, necessitating customization.
For future work, several features could be included in the proposed system. Firstly, developing and implementing new technologies for storing surplus power generated by renewable energy sources, such as hydrogen storage fuel cell systems, could ensure a reliable and resilient power supply for fast charging stations. Additionally, conducting further sensitivity analyses to assess the suitability of hybrid energy systems for multiple installations, considering environmental and economic factors at each installation site, would be valuable. Another promising feature would be integrating a hybrid network that includes thermal, water, and hydrogen networks using cogeneration systems.
Furthermore, the economic feasibility of N-RHES projects is greatly influenced by the cost of implementing a nuclear reactor. Therefore, an important step towards advancing the sector would involve developing a methodology that enables more accurate scaling of Small Modular Reactor (SMR) costs. This methodology should consider various factors such as economies of scale, the balance of plants, licensing and regulatory considerations, design modifications, supply chain, and site-specific considerations. Addressing these aspects reliably and comprehensively would contribute to a more promising and financially viable future for N-RHES projects.


