Article

Developing a Simulation Model to Numerically Estimate Energy Parameters and Wave Energy Converter Efficiency of a Floating Wave Power Plant

1
Department of Technology and Equipment of Mechanical Engineering, Nizhny Novgorod State Technical University n.a. R.E. Alekseev, 603155 Nizhny Novgorod, Russia
2
Department of Applied Mathematics, Nizhny Novgorod State Technical University n.a. R.E. Alekseev, 603155 Nizhny Novgorod, Russia
3
Department of Electric Power Engineering, Power Supply and Power Electronics, Nizhny Novgorod State Technical University n.a. R.E. Alekseev, 603155 Nizhny Novgorod, Russia
4
Department of Electrical Equipment, Electric Drive and Automation, Nizhny Novgorod State Technical University n.a. R.E. Alekseev, 603155 Nizhny Novgorod, Russia
*
Author to whom correspondence should be addressed.
Energies 2023, 16(10), 4150; https://doi.org/10.3390/en16104150
Submission received: 19 April 2023 / Revised: 11 May 2023 / Accepted: 14 May 2023 / Published: 17 May 2023
(This article belongs to the Special Issue Smart Distributed Generation Systems)

Abstract

:
The significance of coastal zone object protection using wave electrical energy complexes (WEECs) is dealt with. The authors suggest using a floating wave power plant (FWPP), which comprises electrical energy functions and provides coastal zone protection. Features of simulating FWPP in computational fluid dynamics (CFD) modules are considered. The main simulation stages, construction order, the necessary initial and boundary conditions, calculation objectives and results are described and analyzed. Analysis and adjustment of input parameters (wave amplitude, wave disturbance frequency, FWPP geometric parameters) determining the FWPP fluid flow output parameters (dynamic, total pressure, flow rate, flow velocity) were carried out. Calculation process optimization was carried out by comparing the data obtained using a 2-D solver. The main stages of wave disturbances-with-FWPP-structure interaction have been determined. Epures of flow velocity, pressure, flow path and volume flow rate were constructed and analyzed.

1. Introduction

Currently, there is a technical, economic and social demand for carrying on developments to create electric power generation systems based on sea wave energy [1,2,3,4,5]. Furthermore, wave power development is perspective and feasible for several Russian Federation regions (e.g., the Black Sea coast, Russia’s Far East coast, Russian Arctic shelve), EU countries [6,7,8] and other parts of the world [9,10,11,12]. Research results and international experience of using wave power plants show [13,14,15] that it is practical to revamp, design and build coast-protecting structures with additional modifications in the form of wave power plants.
In order to increase wave power plant efficiency, it is crucial to ensure the protection of onshore facilities and to lower wave farm seabed erosion [16,17]. In order to install wave farms as part of wave electrical energy complexes (WEECs), it is necessary to analyze surface and internal wave dynamics and to calculate the wave power concentrator structure. These concentrators also function as wave-slamming shock absorbers in several directions and form water flows directed at the hydroturbine drive of electric generating units. Herewith, it is desirable to provide maximum wave energy absorption.
As soon as a wave power plant’s energy production is based on receiving wave energy, these installations can be effectively applied to protect onshore facilities and reduce seabed erosion [18,19], the latter serving as wave absorbers, which makes wave farms more feasible. Due to global climate change, the threat created by coastal erosion and coastal floods in the last decade forces the scientific community to find coastal protection schemes unaffected by sea-level rise. In this context, wave energy converters could find combined applications both as coastal protection and energy harvesting tools.
The scientific novelties of this paper include developing methodological approaches to create systems using green energy sources and solving a task complex, dealing with the assessment of wave climate impact (both surface and internal waves) on wave electrical energy complex (WEEC) efficiency, as well as designing the optimal wave farm unit layout (combination of several WEECs, which are cast according to a certain geometric layout) for maximum wave energy absorption and coastal ocean shelve object protection.
The studied complex is a floating wave power plant (FWPP)—a floating structure mounted to the seabed, in which the kinetic energy of waves above the mean water level is converted into potential energy; thereafter, the backwash, which is formed as a result of a drop, rotates the generator’s turbines. The FWPP structure, which is shown in Figure 1, consists of single-type sections lined up crosswise to the wave motion direction, comprising bearing and adjusting floats, positioned one after another in the direction of wave motion. In the gaps between them, spoilers and water traps are located at different heights and joined by a carcass, drawn to the bottom near the bearing float using a tensioner system, with a circular pipeline going water column depthward from the traps. Generator stator windings are mounted on the pipe surface in a circle, with turbines concentrically located inside the windings, simultaneously playing the role of generator rotors due to permanent magnets mounted on their outer diameter.
In order to make the structure adaptable to the wave form, the FWPP can be performed with an adjusting float lengthened along the wave motion direction. The adjusting float is divided into leak-tight sections that are partly or completely filled with water or air for the optimal position of spoilers and traps. An FWPP in its simplified form for waterbodies unaffected by tides can be performed without a tensioner system. In this design variant, the electric power plant section is mounted by a wire rope to the anchor outright at the bottom of the waterbody. Figure 1a shows a cross-sectional view of an FWPP at the moment of impacting the wave. The outrigger bearing float and the tensioner system wire rope, which is fixed nearby, stabilize the whole structure creating a type of bearing point, relating to which FWPP functional units are able to go up and down affected by waves. The required slope angle of the structure is set with an adjusting float. The function of spoilers is to possibly convert kinetic wave energy into potential, at the same time providing maximum water level rise at the traps’ inlet. The traps are designed to collect volumes of water in a wave and sort them according to the height of the rise. The objective of the structure in the watering phase is to accumulate a volume of water, while possibly avoiding losses in the potential energy stored in each layer. As soon as the water level in the traps at this moment is evidently higher than the waterbody averaged level, the water is directed downward along rounding pipelines to face generator turbines, affected by the force of gravity and water inertia in the incoming wave.
Figure 1b shows a cross-sectional view of an FWPP section in the gap between waves (water discharge phase). The goal of the structure at the given moment is to possibly distribute the accumulated water power equally over time before the next wave run-up in order to provide the generator’s stable mode. As soon as the length of the wave changes, the adjusting float can be positioned by the control system upwell of the incoming wave halfway through the wave’s length with respect to spoilers and traps. When the traps appear in the gap between the waves, the adjusting float is already on the top of the next wave, due to which the traps with accumulated water rise, and the water level in them still remains higher than the waterbody averaged level. Affected by the force of gravity, water continues flowing down the pipelines, providing continuous operation of the generators.
There are computer programs that can be used to simulate hydrodynamic processes in various fluid flows and gases and to determine characteristics such as pressure, flow velocity and discharge. ANSYS CFX, LOGOS, SolidWorks Flow Simulation, OpenFoam and others are used to simulate fluid and gas flows. They are based on numerical solutions of Navier–Stokes complete equations, using the computational methods of aerohydrodynamics, and they allow the simulation of turbulent, laminar and mixed flows [20,21,22].
Fluid flow simulation is a digital description of flow dynamics in the fluid surface layer and, in particular, in its collection systems allowing one to forecast and analyze the geometry of structure impact on operating fluid flows [23,24,25,26].
The purpose of this article is wave disturbance numerical simulation taking into account surface and internal waves and FWPP structure optimization.
Computer modeling of the object in question was carried out using ANSYS Fluent software suite. Verification of the obtained differential models was carried out using SolidWorks Flow Simulation. In order to solve hydraulic gas dynamics tasks, a mathematical model method was used, based on the system of differential equation numerical integration in partial derivatives, in the general case—three-dimensional and unsteady ones, expressing general laws of conservation of mass, momentum and energy in viscous fluid and gas flows. For the numerical simulation of spatial turbulent flows, a Reynolds-averaged Navier–Stokes (RANS) unsteady model was applied in this paper [27].
The numerical simulation stages include:
(1)
Developing the 3-D model structure with dimensional parameters;
(2)
Determining the computational region with flow boundaries;
(3)
Setting initial and boundary conditions taking into consideration the operating medium properties;
(4)
Calculation, monitoring and precision analysis of results;
(5)
Visual representation of the calculation results, i.e., graph plotting the target parameters.

2. Simulation Model Development

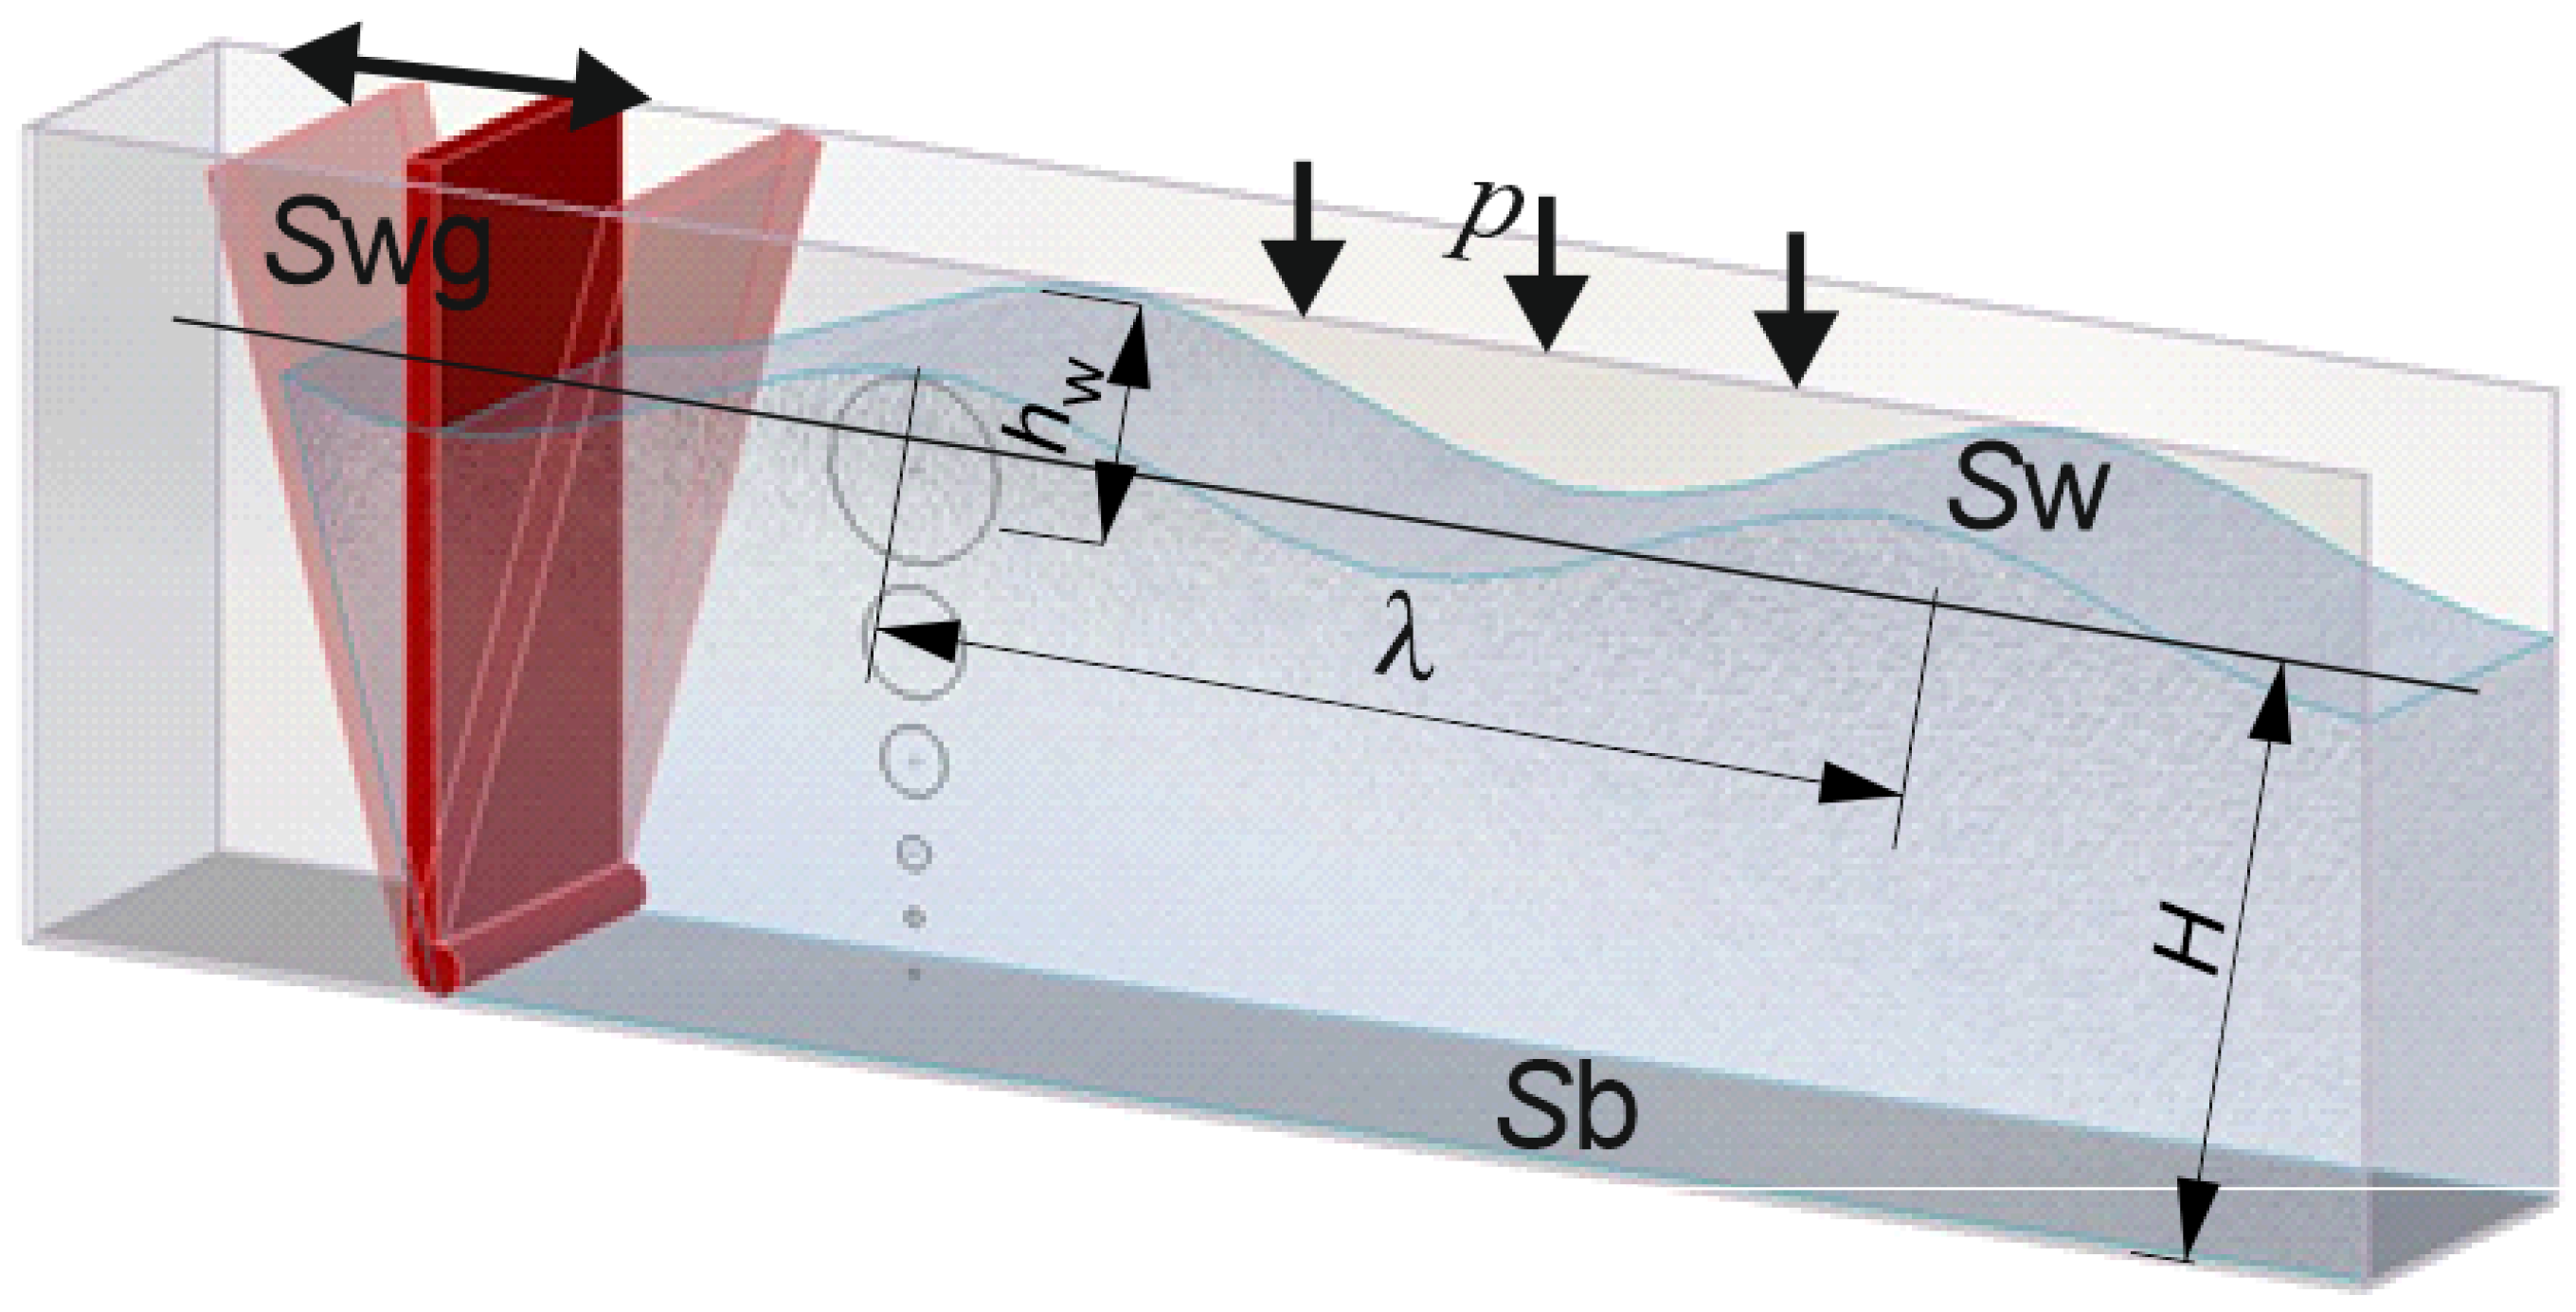
2.1. Developing the Body 3-D Model with Parametric Dimensions

Figure 1a,b shows a watershed model composed of a wave machine and a spoiler water inlet with wave machine parameters: length 5 m, modular structure width unlimited, depth with reference to bearing float 2.4 m and watershed parameters: length 21 m, width unlimited, operating medium maximum depth 2.4 m and coastal area profiles: deep, shallow, surf and swash zone with adjustable bottom slope.

2.2. Determining the Computational Region (Grid) with the Indication of Flow Region Boundaries

The accuracy of a simulation, as well as calculation and experimental data precision, are largely determined by a finite volume grid.
In the task’s simulating fluid flow processes, the flows originating in various geometrical constructions are considered. In order to simulate such flows, the finite elements method (FEM) and control volume method (CVM) are widely used. The CVM’s key feature is that conservation laws are locally applied, making it possible to directly and physically interpret the resulting difference equations. This resulted in the CVM becoming the preferable technique for use in many commercial codes (Fluent, Star-CD, CFX). A cell-centered variant of the control volume method (CVM) is the most widely used [28].
The CVM (numerical method for solving differential equations) is the main finite element analysis method used in software. To find the numerical solution sought, a continuous mathematical model of physical processes is discretized both in space (the whole computational region is covered with a finite element grid) and in time. According to the CVM, the task of spatial discretization is carried out by dividing the computational region into small adjacent volumes, a balance ratio is written for each one in the form of [29,30]:
Ω ρ φ t d Ω + k S k n q d S = Ω Q d Ω ,         q = ρ   V φ     α φ ,
where q—flux density vector of φ value, comprising convection and diffusion components, Q—spatial sources distribution density, V—velocity vector, ρ—medium density and α—diffusion coefficient. Flowing medium internal energy, for instance, or doping concentration, turbulence kinetic energy, etc., can function as φ.
One reference point sought on the grid solution is located inside each control volume. In most developments aimed at solving 3-D tasks for complex geometry regions, computational grid cells are used as the control volume: grid nodes are located in the vertices of a polyhedron (for structured grids—hexahedron, see Figure 2), grid lines run along its edges and the values of the sought variables are attributed to the cell geometrical center.
The control volume method envisages the calculation of variable values in finite volume centers (not in computational grid nodes) within the selected time step. Finite elements have the form of parallelepipeds. When solving internal tasks, i.e., calculating intermixing medium behavior in the volume, a fictitious domain method is used, which means that formally the computational grid is constructed in the parallelepipedic domain covering the geometrical model with the intermixing medium inside. Calculations are made only in the cells that are included in the computational region.
Along with automatic computational grid generation, manual grid setting was used to control the grid concentration on marked details of the system in question. Thus, for grid calculation, it is important to determine a minimum gap between the elements of the object in question and to take into consideration the object’s dimensions in order to cover all the elements in the structure. In the model concerned, minimum gaps are the flow cross-section between the spoilers and the outlet collector parameter. The grid manual adjustment was carried out in three stages: first, a primary coarse grid was constructed manually, next, it was filled up by increasing the number of cross-sections along the axes, and finally, it was concentrated where necessary. In order to improve the calculation accuracy, the grid periodic adaptation was applied with a 0.2 s step, entailing splitting of the grid cells to get the specified resolution. The maximum number of cells was 275 × 104.
Figure 3 shows the CVM grid adaptation for the model in question. In the vortex flow region and where the wave disturbance velocity considerably differs from the reference velocity, the grid density was increased.
Figure 4 shows the 3-D grid adaptation of the model for simulation over a time of 2.3 s.
Mesh independence was investigated in order to assess the dependence of the calculated flow velocity values in the FWPP local regions on the grid model dimensions. Figure 5 shows the dependence of the calculated flow velocity steady-state mean value at the most efficient operating mode and at 0.9 m amplitude input actions, 6 s wave disturbance frequency on the collector output surface, on the computational grid dimension. According to the mesh independence results, the dimension of the computational grid was selected to be 2.75 mln cells. This is determined by the fact that the relative deviation in the flow velocity change at the FWPP collector outfall for 2 mln grid dimensions from 0.7 mln is 27%, while for 2.75 mln, it is 3.7%. Further splits and increases in the grid dimension will lead to a deviation reduction. However, increasing the grid dimension is also impractical for the reason of saving computational resources.
For the resolution of the grid model geometrical peculiarities, splitting is applied to the local grid cells in the region where the solid body contacts the flowing medium. The resolution of other regions with other target parameters in solid bodies of the calculation model is carried out using analogy.

2.3. Setting Initial and Boundary Conditions with Operating Medium Property Adjustment

In order to analyze the aerohydrodynamic indices of the process, an air–water interaction model is developed taking into consideration random time-varying parameters of wind dynamics [31]. In order to obtain the wave profile Sw (Figure 6), we set the environment pressure p, height H of fluid level in relation to bottom profile Sb, wave length λ and wave height hw. Waves are set by the movable profile of the wave generator Swg. Waves are simulated likewise in laboratory tanks.
The profile of the wave generator Swg is set using a pressure change function (100.325–110.325 kPa) time relative within the range of 0.5–3 s. Table 1 shows the recalculation of wave-product value parameters into wave-disturbance parameters.
Air and water in the model are fluid media. The water state initial condition is set with reference to the bottom profile, with a modeling time of 0–30 s and an iteration step of 0.005 s. Gravitation parameters, fluid flow type (laminar/turbulent) and the k-e turbulence parameters are determined [31].
In order to solve the water dynamics analysis problem (water flowing through the FWPP and comprising internal and external flow combinations) an internal analysis type was used. In order to determine transient processes with reference to the free surface, a nonstationary problem was solved [32]. The simulated watershed internal surfaces were selected as the boundary conditions, where 101.325 Pa atmospheric pressure acts on the free surface of phase boundaries.
A preliminary analysis of wavy flow parameters was carried out to find the optimal initial conditions.
Let us analyze the impact of input parameters (wave amplitude, wave disturbance frequency) on the change in the FWPP collector output parameters: water flow velocity and total pressure distribution in the FWPP spoiler water inlet structure. A multifactor task is solved with different combinations of input parameters variable values, set by ranges with their change step according to Table 1.
Wave mode parameters were considered based on the sources [33,34].
Wave height in a water reservoir usually reaches 2.5–3.0 m, while in lakes, it can reach up to 3.5 m. In rivers and canals, wave height is usually lower at 0.6 m; however, sometimes, especially in spring water periods, it can reach 1 m.
Maximum wave height in the oceans can reach up to 20 m. In the seas, lakes and water reservoirs, they can be different, for example: in the North Sea—9, the Mediterranean—8, in the Sea of Okhotsk—7, in Baikal and Ladoga Lakes—6, in the Black Sea—6 and in the Caspian Sea—10, in the Bratsk reservoir—4.5 (in the places where the depth is up to 100 m), in the Rybinsk reservoir 2.7, in the Tsimlyansk reservoir—4.5, in the Kuybyshevsky reservoir—3 and in the White Sea and Gulf of Finland—2.5 m. In the Lower Volga, waves can reach up to 1.2 m in a gale.
According to the swell conditions scale [35], the wave height was accepted according to the special state of the sea scale (wind–sea) from 0 (calm) to 4 (moderate), which corresponds to a certain period from 1 to 10 s.
Thus, the following wavy flow parameters were selected: wave amplitude 0.5–2.0 m and wave frequency 0.1–1.0 Hz. The diagrams are shown in Figure 7.
One can see from the diagrams that the concerned indicator values (flow velocity, circumferential velocity, total and dynamic pressure) differ depending on the frequency and amplitude of the wave profile. For instance, at a wave amplitude value of 0.9 m and a 6 s period, the maximum values of flow velocity indicators are 1.9 m/s, and the dynamic pressure is –1600 Pa. The change in the wave amplitude parameter range within the limits of 0.4 to 0.7 m has a negligible impact and is characterized by the decrease in the concerned output parameter.
Analyzing the diagrams, it is possible to conclude that at the given wave disturbance reference conditions, the most energy-intensive parameters in the wavy flow were selected with A wave amplitude equal to 0.9 m, and T wave period equal to 6 s.
In order to estimate the investigated parameters from the point of view of the processes in progress regardless of base water volume and reverse flow in the collector, a 2-D analysis with limited width equal to 0.4 m was used (Figure 8).
A 3-D analysis with a 3 m unit width was used to assess one FWPP unit power rating and volume and mass flow rate coefficients. The outlet collector diameter was chosen to be 0.4 m (Figure 9).

2.4. Calculation with Monitoring and Task Convergence Analysis

A crucial simulation stage is objective setting, i.e., the investigated parameters and range specification (at the point, in the plane, in three-dimensional measurement, in the whole computational region). The outlet collector surface involving the calculation of mean, minimum and maximum values of the selected parameters was chosen to be the research objective (Figure 10). Table 2 shows the calculation with monitoring and task convergence analysis.
Figure 10 shows a list of objectives created in the model. It shows values and diagrams for each objective change with time, as well as the convergence of the objective expressed as a percentage. The objective convergence value is approximate and as a rule, increases over time.
Analytic expression was set as an objective. It comprises the above objectives and variable parameters in the form of input data, bound by functional dependencies. This made it possible to calculate the investigated parameter, which in our case consists of the hydrodynamic head, total mechanical energy and power, and to apply this information in the project according to the following formulas. The expression to find fluid flow total energy, in which summands correspond to kinetic and potential energy of position and potential pressure energy, is:
E = mv2/2 + mgh + vP,
where m—mass, v—flow velocity, g—gravitational acceleration, h—the height at which the fluid element is positioned and P—areal atmospheric pressure at the point of fluid element mass center.
The expression to find momentary power at a specific time point is:
N = 9.81·Q·H·ηturb·ηgen,
where Q—the discharge rate of water flowing through the collector (m/s), H—water head (m); ηturb—turbine efficiency coefficient and ηgen—generator efficiency coefficient.
The expression to find the hydrodynamic head (Figure 11) is:
H = Z + p ρ g + v 2 2 g ,
where Z—distance from the gravity center of the cross-section in question to the reference plane; p/(ρg)—piezometric height; p—hydrodynamic pressure; ρ—water density; g—gravitational acceleration; v2/(2g)—velocity head and v—fluid velocity.

3. Results Obtained

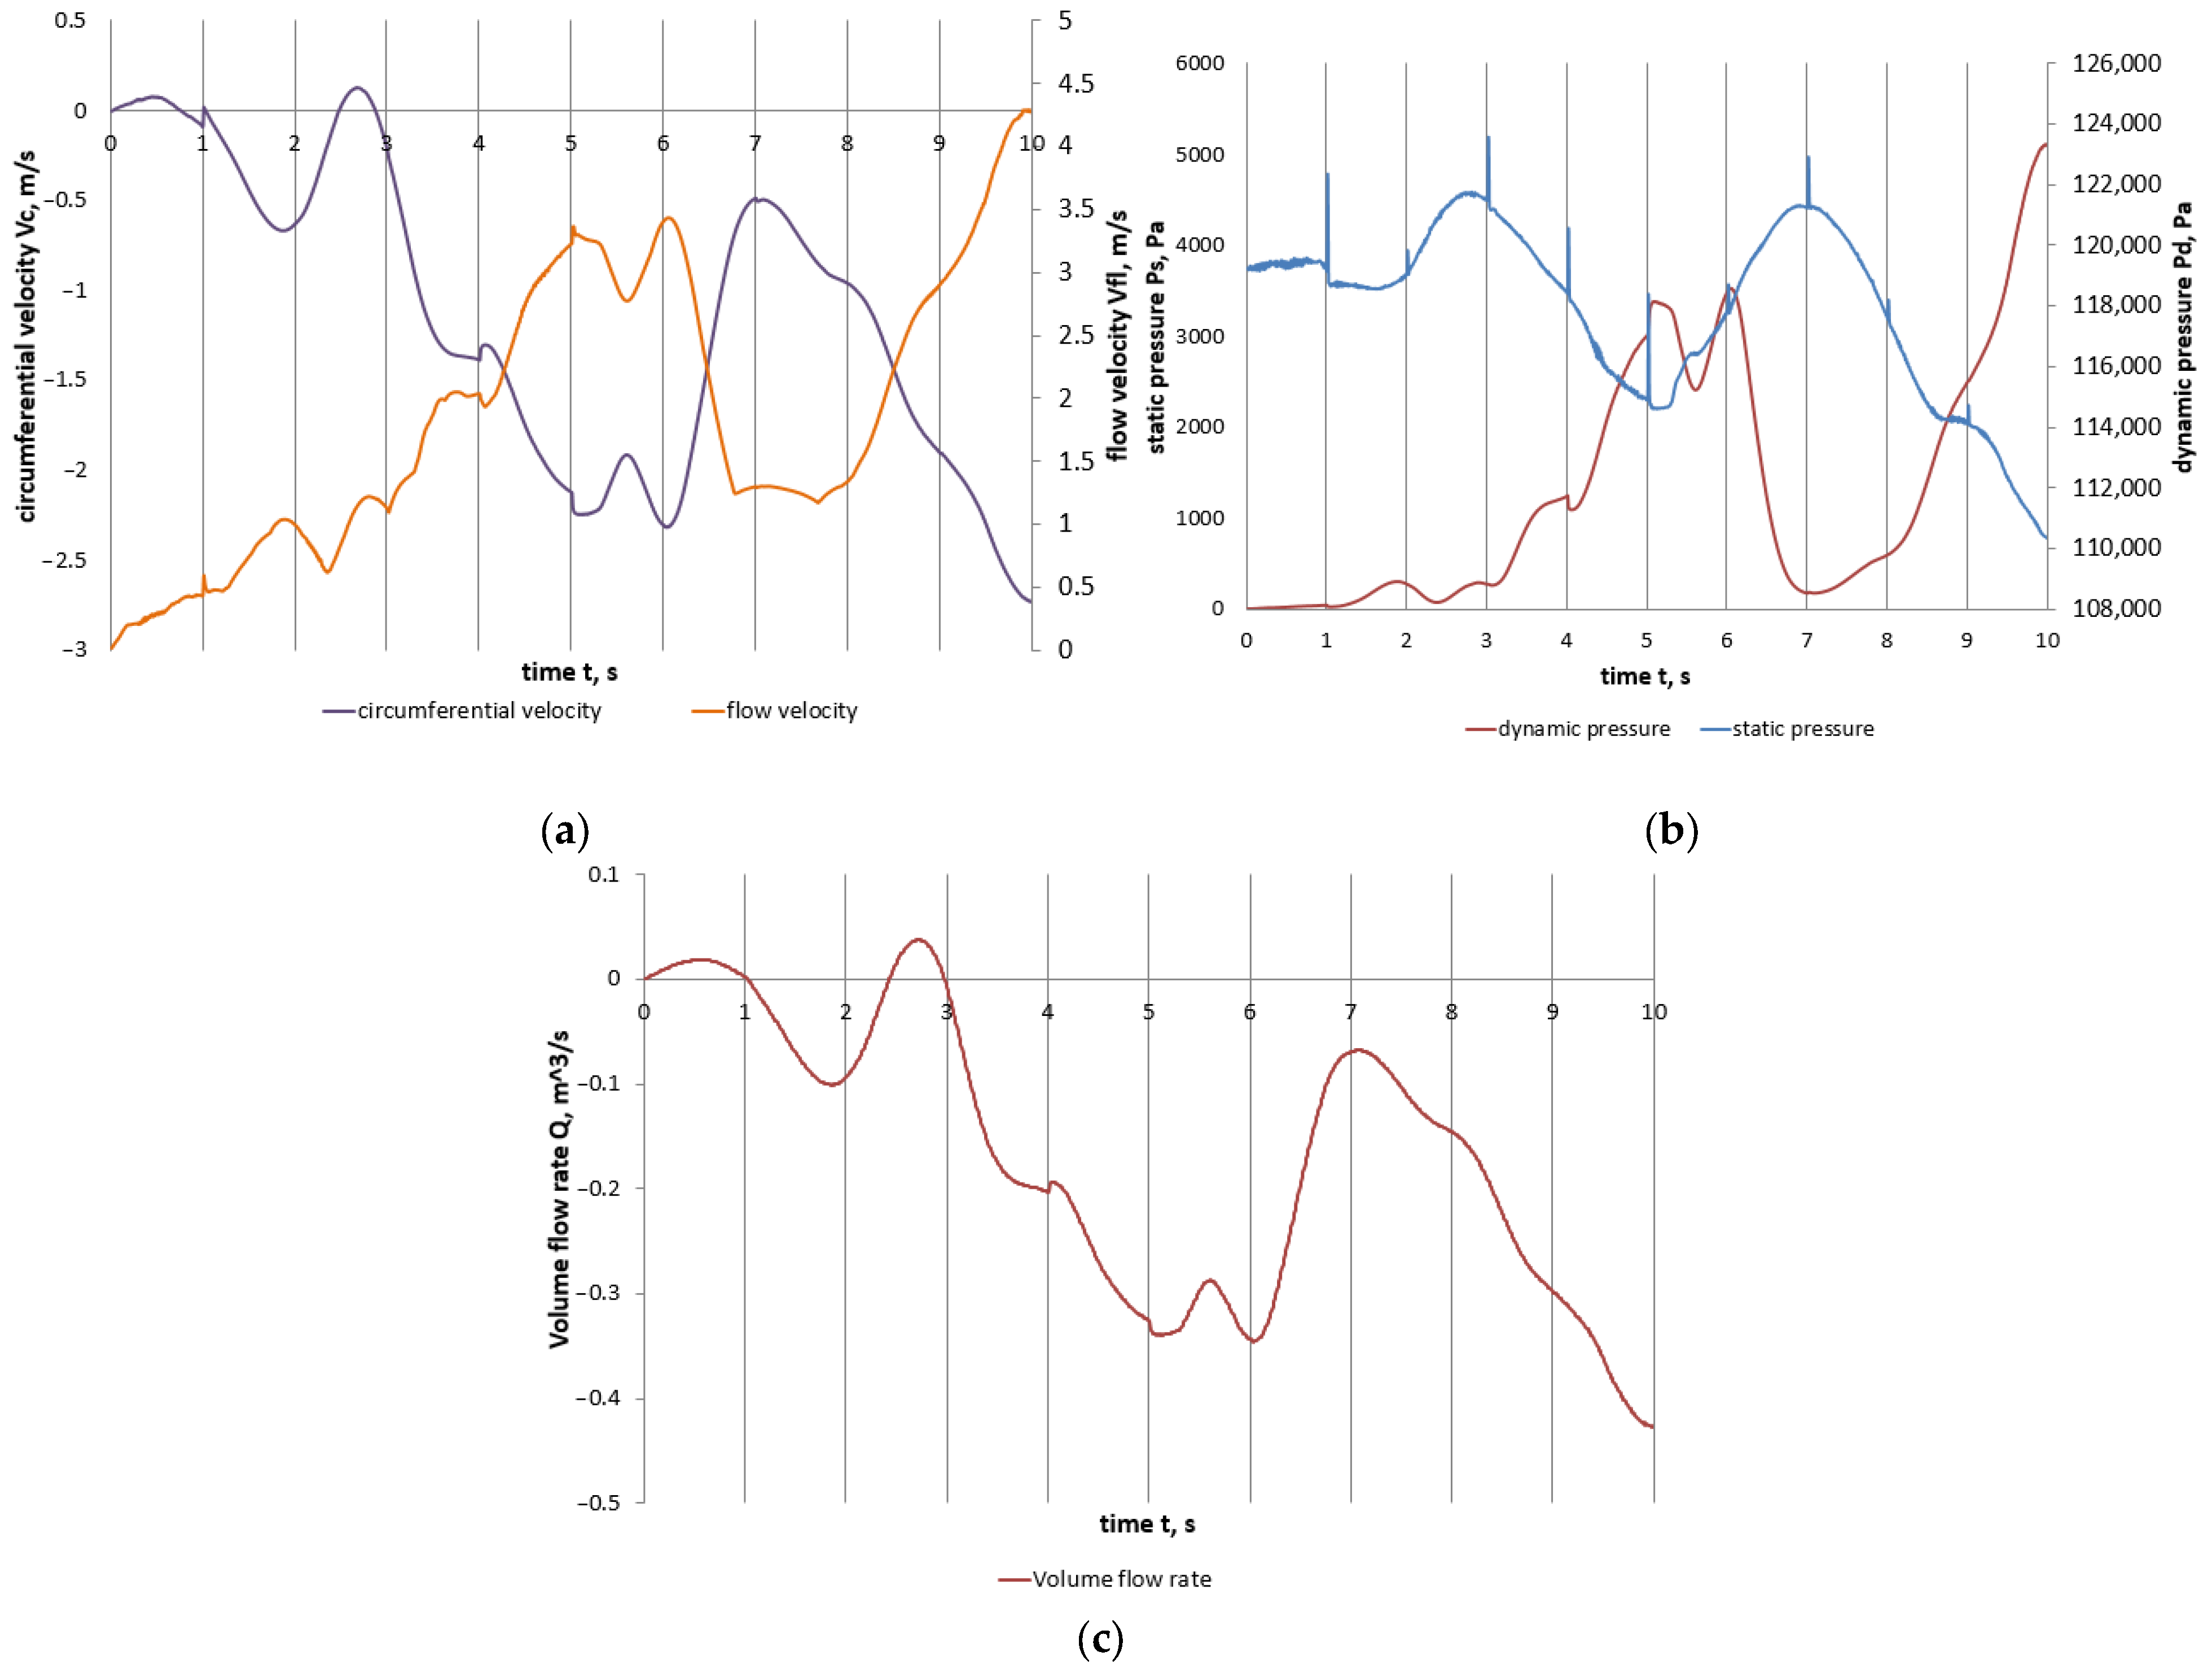
3.1. Results of the Problem Solved in 2-D Arrangement for One Wave Period

Several wave disturbance periods with a 10 s total modeling time were simulated. Figure 12 shows the simulation results for the water flow average velocity vfl and flow circumferential velocity vc, dynamic pd, and static ps pressure at the collector outfall of the FWPP spoiler water inlets for one wave disturbance period.
The circumferential velocity vc, a flowing fluid velocity component along the circumferential velocity vector of a rotating coordinate system about the Z axis, was selected as the absolute (i.e., fixed) coordinate system.
Wave disturbance behavior can be clearly traced in the diagrams. The water flow maximum velocity vfl at the installation outfall was 1.51 m/s. The sign change in the circumferential velocity diagram characterizes the water flow motion taking into account reverse flow initiation in the watershed and as a result, the reverse flow in the collector. The total pressure diagram shows relative pressure sum change (static relative pressure, including hydrostatic component) and dynamic pressure.
In the diagram, one can see a dynamic pressure change from 0 to 1100 Pa, caused by water as it is moving along the FWPP spoilers, i.e., in the direction of its flow motion. Dynamic pressure is caused by the moving water flow kinetic energy. Static pressure is caused by the potential energy of the fluid under pressure. As the flow velocity increases, the dynamic pressure component increases as well, while the static one decreases, as can be seen in the diagrams. The pressure falls from 119 to 108 kPa due to decreases in the velocity and hydrodynamic heads.
At first glance, water discharge may seem to have a stochastic nature; however, comparing several diagrams, one can see conformity in the volume flow rate value change to circumferential velocity value. As soon as we consider a 2-D problem, the specific volume flow rate values are disregarded.
Negative values in the diagrams are caused by the flow incongruence (or direction change) in the Y-direction.

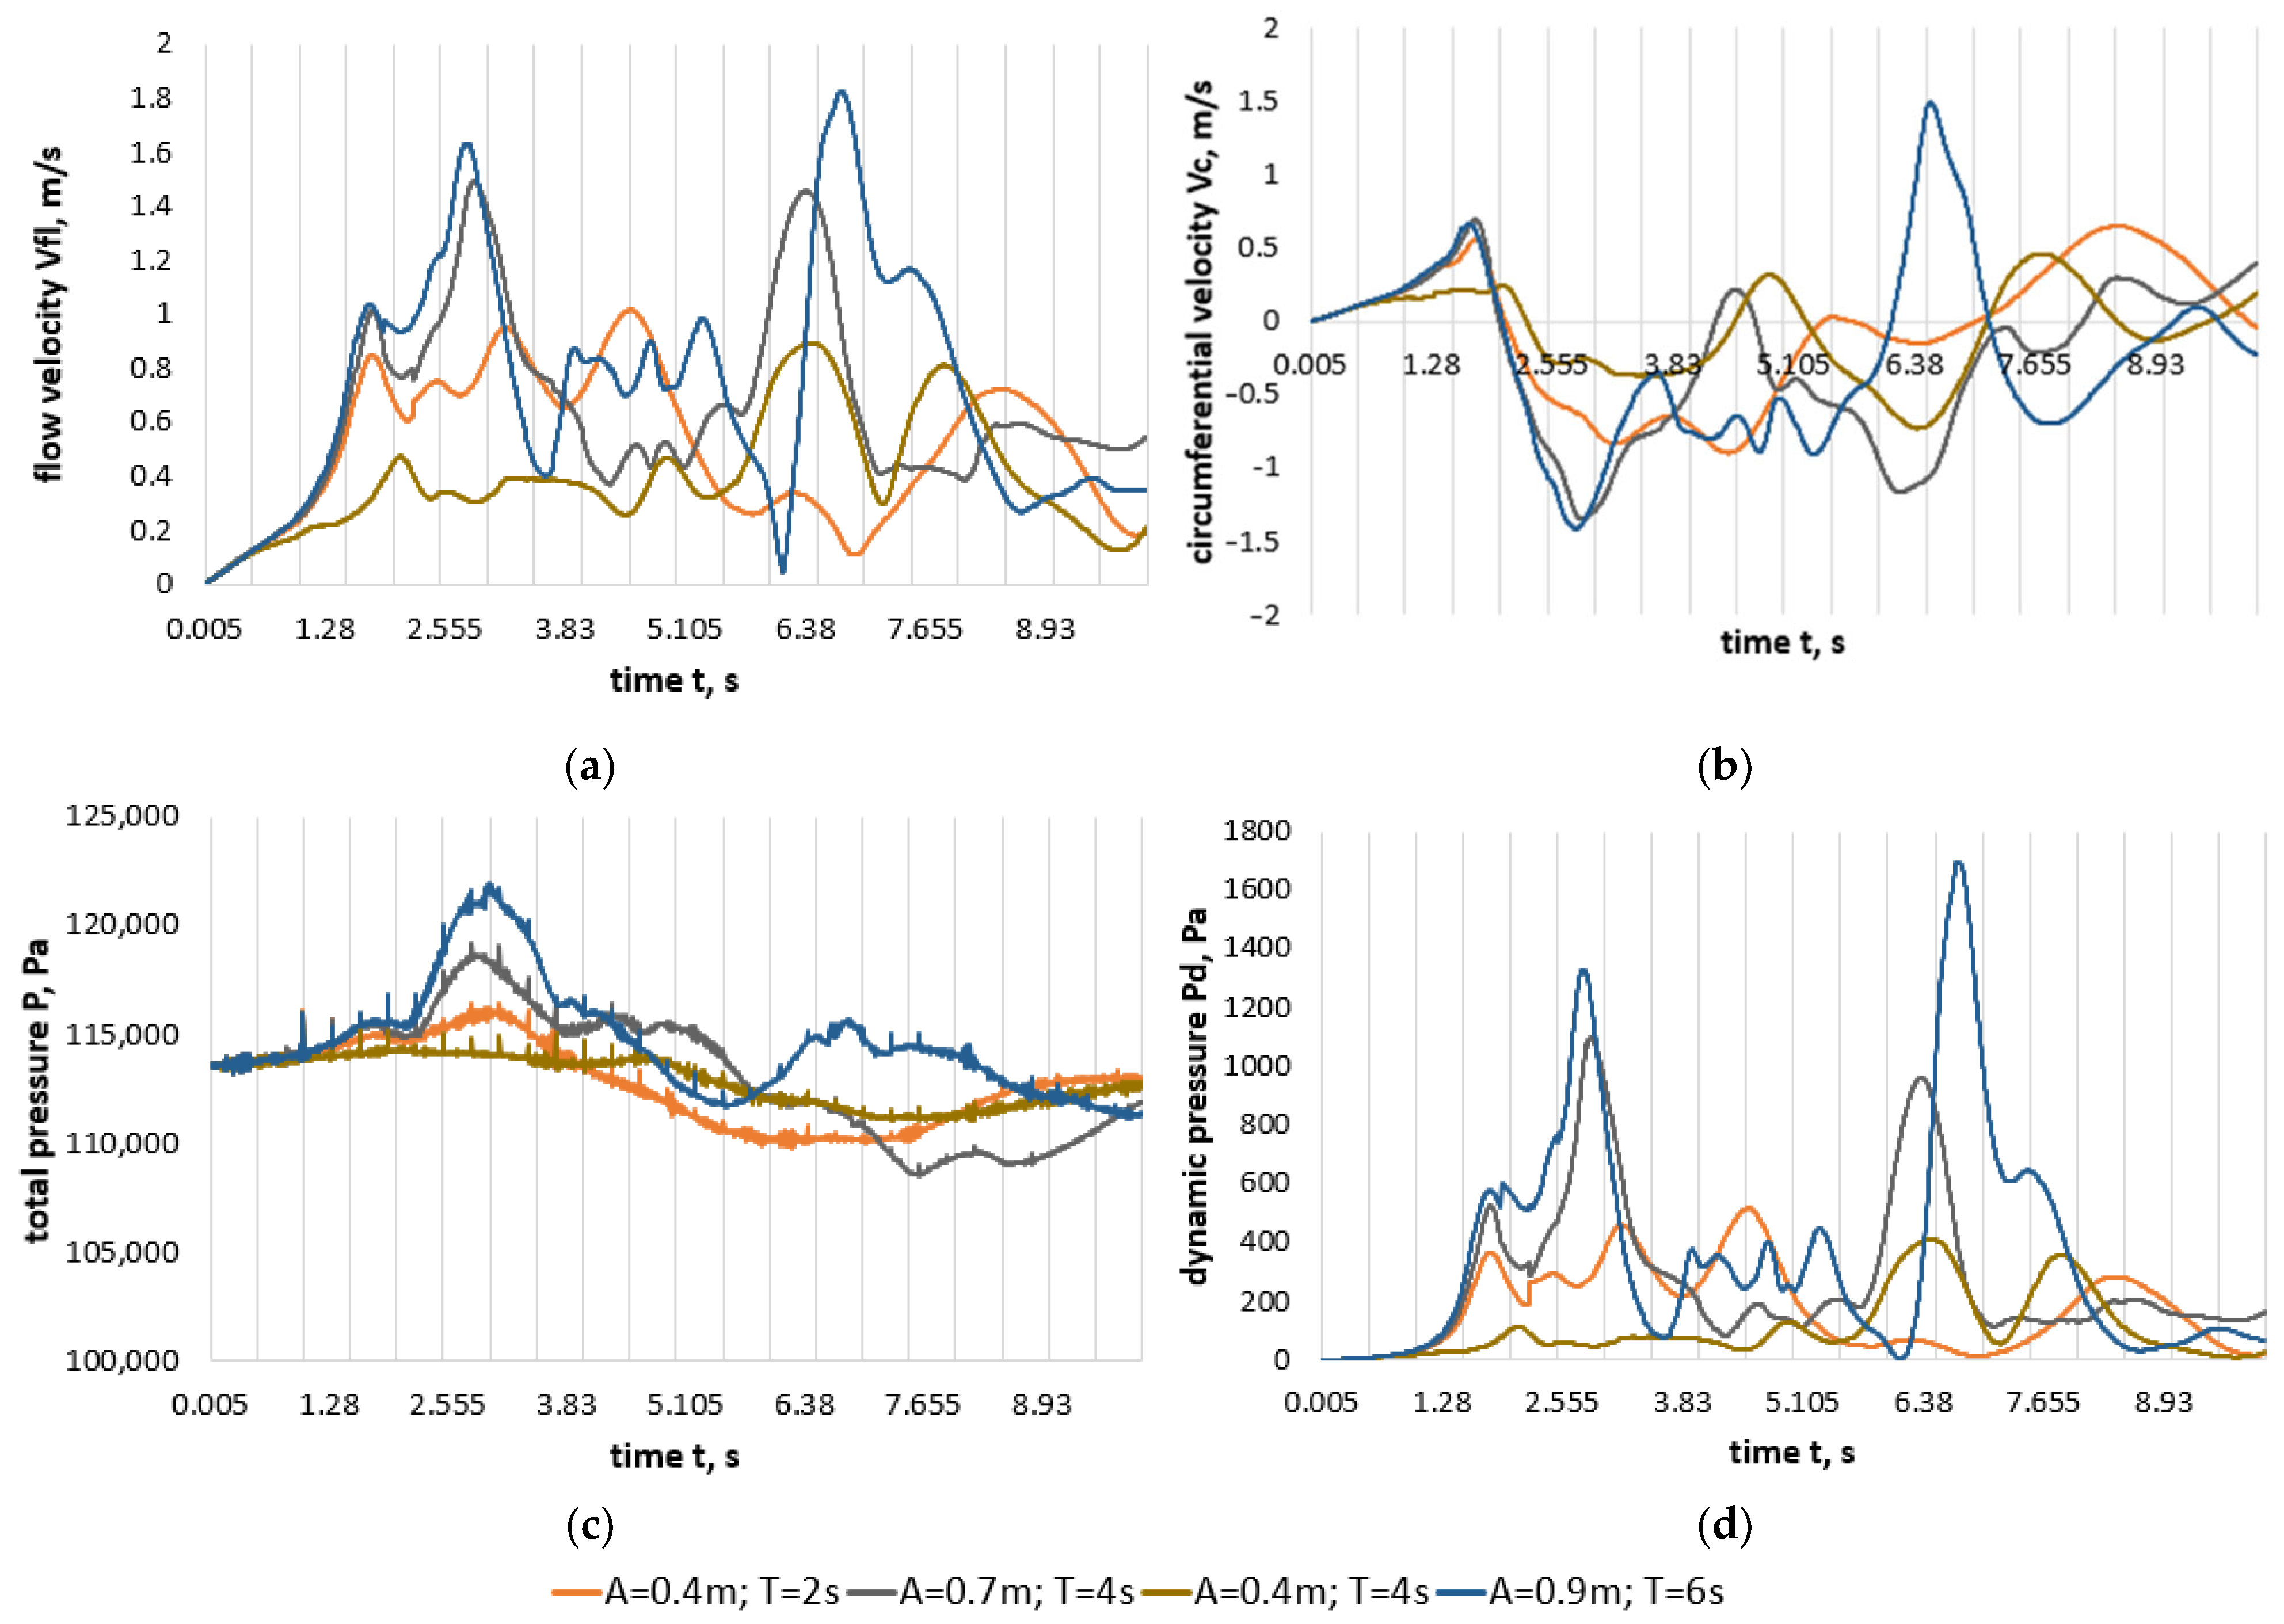
3.2. Results of the Problem Solved in a 2-D Arrangement for Three Wave Periods

Several wave disturbance periods were simulated with a 30 s total modeling time.
According to Figure 13, the nature of dependences has not changed, being a pulse-periodic one. In addition, the reverse water withdrawal by the collector at pressure differences can be seen in the circumferential velocity diagram. The data presented herein helped to single out several stages in the processes taking place in the FWPP system [36,37].
Below, one can see a correlation between the diagrams showing fluid flow velocity, circumferential velocity and dynamic pressure with the stages in the wave-with-FWPP interaction process (Figure 14). Thus, Stages 2 and 4 appear to be of interest in order to calculate and estimate the FWPP efficiency from the point of view of the energy capacity of the processes in question.
Stage 1—in front of the incoming wave, before the water gets into the system of spoiler water inlets, reverse water withdrawal by the collector takes place due to slight increases in the hydrodynamic pressure difference, circumferential velocity value changes, dynamic pressure and flow velocity.
Stage 2—wavy water flow gets directly into the spoiler water inlet system, accompanied by fluid flow maximum velocity, maximum dynamic pressure at the collector output and initiation of turbulent eddies shoreward.
Stage 3—reverse flow initiation due to the hydrostatic head static pressure difference between the coastal zone after the FWPP and before it. It is accompanied by flow velocity and dynamic pressure decreases.
Stage 4—reverse flow initiation, due to which flow velocity and dynamic pressure increase.
Stage 5—liquid level equalization before and after the FWPP complex; thereafter, the cycle is repeated.

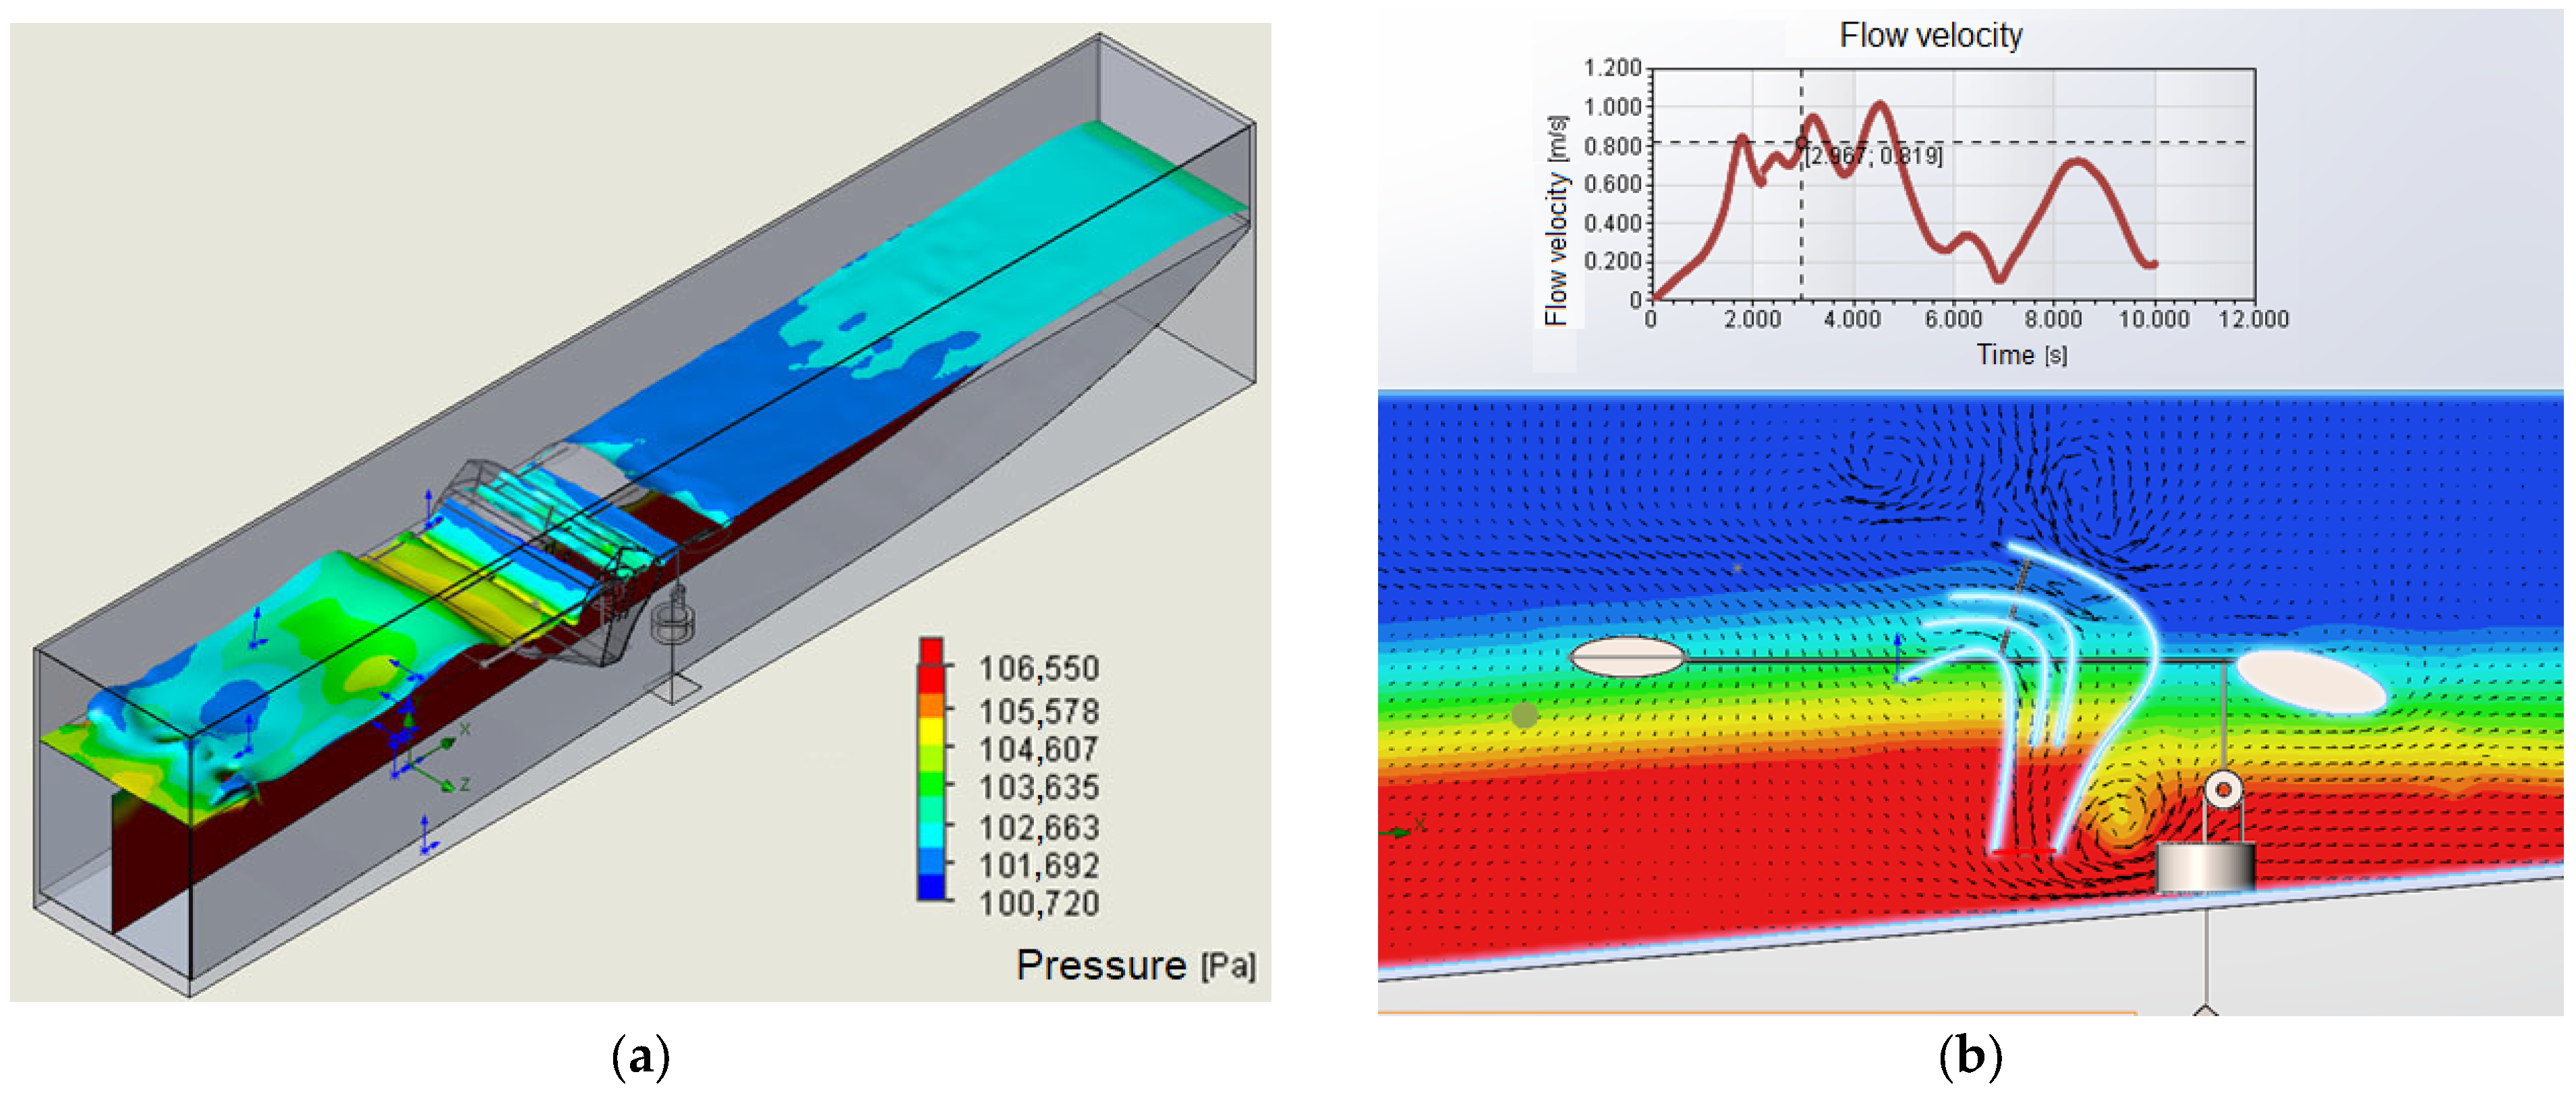
3.3. Analyzing Results to Solve a 3-D Problem for One Period

In order to assess volume flow rate parameters and power generated using the FWPP, a simulation in a 3-D arrangement was carried out. According to the diagrams (Figure 15), the stage of reverse water withdrawal into the collector is disregarded, but it does not have any considerable impact on velocity indices, circumferential velocity (liquid flows out in one direction) and volume flow rate indices Q, due to water volume increase when carrying out a 3-D analysis.
The total analysis results for water flow dynamics in the FWPP outlet collector are given in Table 3.
According to the results in the diagrams, it is possible to conclude that an adapted 2-D model can be used to study the velocity and dynamic characteristics of the water flow in the FWPP model. In order to analyze volume–mass properties, it is necessary to use a 3-D model with grid model adaptation ensuring the model’s convergence.
Comparative indices show that key indicators of water flow velocity and pressure do not change considerably; the parameter which significantly impacts FWPP system efficiency is the module width. The greater the FWPP module width, the greater the volume flow rate provided by the system, as shown in the 3-D system analysis result.

4. Calculation Result Visualization: Obtaining Target Parameter Diagrams

In order to analyze the calculation results, it would be practical to apply a 3-D visualization.
Figure 16 shows a wave disturbance generation picture with 0.25 Hz frequency and 0.4 m amplitude.
Figure 17 shows pressure distribution fields in the watershed with an FWPP with flow direction vectors obtained using calculations. Apart from the pressure color grading, different arrows (vectors) of different sizes are used. It can be observed that as the depth increases, the pressure increases as well. In addition, there is a pressure difference in front of the incoming wave into the spoiler water inlet.
Figure 18 presents a diagram showing the water velocity distribution fields. The size of the arrow corresponds to a certain flow velocity. The flow velocity at the collector output was 1.58 m/s. The simulated flow is directed depthward of the watershed, i.e., there is reverse water flow in the coastal zone.
The diagrams obtained serve an illustrative purpose for the simulated process. The watershed lateral surface and internal surfaces of spoiler water inlets were selected as default surfaces.
Figure 19 presents a vector diagram showing the water flow velocity distribution in the watershed with FWPP installation. Its analysis shows that reverse flow is formed alongside with outward flow at the output.

5. Conclusions

Due to global climate change, the threat created by coastal erosion and coastal floods [18,19] in the last decade forces the scientific community to find innovative coastal protection schemes. The studied complex is a floating wave power plant (FWPP)—a floating structure mounted to the seabed, in which kinetic energy of waves above the mean water level is converted into potential energy. Thereafter, the backwash, which is formed as a result of a drop, rotates the generator’s turbines.
The contributions of this article include developing methodological approaches to create systems using green energy sources and solving a task complex, dealing with the assessment of wave climate impact on wave electrical energy complex (WEEC) efficiency, as well as designing the optimal wave farm unit layout for maximum wave energy absorption and coastal ocean shelf object protection.
In order to analyze FWPP hydropower resources, a computational fluid dynamics module was used, the principal simulation stages were analyzed and the basic input and output parameters were determined. Analysis and adjustment to the input parameters were carried out, thus determining FWPP fluid flow output parameters. Wave disturbance effective parameters with a 0.9 m amplitude and 6 s recurrence period were determined for the relevant FWPP geometrical configuration. Calculation process optimization was carried out by comparing the data obtained using a 2-D solver. It was shown that it is possible to use a 2-D model in order to assess fluid flow velocity and dynamic parameters, while a 3-D model is necessary to assess volume–mass indicators. Optimal geometric parameters for adjusting float were found, as well as the FWPP spoiler slope angle at which water flow velocity and dynamic pressure values reach their maximum. It was proven that FWPP module width is a crucial parameter for its volume–mass characteristics. The obtained results were analyzed. The main stages of wave disturbances-with-FWPP-structure interaction were determined. Epures of flow velocity, pressure, flow path and volume flow rate were constructed and analyzed.
Step-by-step solutions to FWPP efficiency problems when used in coastal waters are suggested for further research. First, it is necessary to experimentally determine the FWPP optimal parameters. Next, the dependences of output parameters on wavy flow parameters are determined. Following this, the impact of the coastal zone profile parameters on the whole system output parameters is determined. Lastly, using the data obtained, a mathematical model to calculate hydropower resources and various configurations of WEEC efficiency is created, which can be further applied to develop a real-time monitoring system when operating WEECs.

Author Contributions

Conceptualization, A.L., A.K. and A.P.; methodology, A.K. and D.M.; software, M.Z.; validation, A.P. and D.M.; formal analysis, M.Z.; investigation, A.L., A.K., A.P. and M.Z.; resources, A.L.; data curation, A.P.; writing—original draft preparation, A.L., A.K. and A.P.; writing—review and editing, A.L., A.K., A.P., M.Z. and E.K.; visualization, M.Z.; supervision, A.L. and A.K.; project administration, A.L. and E.K.; funding acquisition, E.K. All authors have read and agreed to the published version of the manuscript.

Funding

This work was supported by the Russian Science Foundation, grant project No. 22-19-00424.

Data Availability Statement

Not applicable.

Conflicts of Interest

The authors declare no conflict of interest.

References

  1. Balmer, M.; Spreng, D. Hydroelectric Power. In Future Energy; Elsevier: Amsterdam, The Netherlands, 2008; pp. 193–209. [Google Scholar]
  2. World Energy Council. Survey of Energy Resources (PDF); Tidal Energy; World Energy Council: London, UK, 2009; Volume 12, pp. 75–77. [Google Scholar]
  3. European Parliament and of the Council of 23 April 2009 on the Promotion of the Use of Energy from Renewable Sources; Directive 2009/28/EC. 2009. Available online: https://eur-lex.europa.eu/LexUriServ/LexUriServ.do?uri=OJ:L:2009:140:0016:0062:en:PDF (accessed on 13 May 2023).
  4. O’Rourke, F.; Boyle, F.; Reynolds, A. Tidal Energy Update 2009. Appl. Energy 2010, 87, 398–409. [Google Scholar] [CrossRef]
  5. Bildirici, M.E.; Gökmenoğlu, S.M. Environmental pollution, hydropower energy consumption and economic growth: Evidence from G7 countries. Renew. Sustain. Energy Rev. 2017, 75, 68–85. [Google Scholar] [CrossRef]
  6. Walczak, N. Operational Evaluation of a Small Hydropower Plant in the Context of Sustainable Development. Water 2018, 10, 1114. [Google Scholar] [CrossRef]
  7. Larinier, M. Fish passage experience at small-scale hydro-electric power plants in France. Hydrobiologia 2008, 609, 97–108. [Google Scholar] [CrossRef]
  8. Başkaya, Ş.; Başkaya, E.; Sari, A. The principal negative environmental impacts of small hydropower plants in Turkey. Afr. J. Agric. Res. 2011, 6, 3284–3290. [Google Scholar]
  9. Valero, E. Characterization of the water quality status on a stretch of River Lérez around a small hydroelectric power station. Water 2012, 4, 815–834. [Google Scholar] [CrossRef]
  10. Jesus, T.; Formigo, N.; Santos, P.; Tavares, G.R. Impact evaluation of the Vila Viçosa small hydroelectric power plant (Portugal) on the water quality and on the dynamics of the benthic macroinvertebrate communities of the Ardena River. Limnetica 2004, 23, 241–255. [Google Scholar] [CrossRef]
  11. Pang, M.; Zhang, L.; Ulgiati, S.; Wang, C. Ecological impacts of small hydropower in China: Insights from an emergy analysis of a case plant. Energy Policy 2015, 76, 112–122. [Google Scholar] [CrossRef]
  12. Mayor, B.; Rodríguez-Muñoz, I.; Villarroya, F.; Montero, E.; López-Gunn, E. The role of large and small scale hydropower for energy and water security in the Spanish Duero Basin. Sustainability 2017, 9, 1807. [Google Scholar] [CrossRef]
  13. Botelho, A.; Ferreira, P.; Lima, F.; Pinto, L.M.C.; Sousa, S. Assessment of the environmental impacts associated with hydropower. Renew. Sustain. Energy Rev. 2017, 70, 896–904. [Google Scholar] [CrossRef]
  14. Singal, S.K.; Saini, R.P. Analytical approach for development of correlations for cost of canal-based SHP schemes. Renew. Energy 2008, 33, 2549–2558. [Google Scholar] [CrossRef]
  15. Vougioukli, A.Z.; Didaskalou, E.; Georgakellos, D. Financial appraisal of small hydro-power considering the cradle-to-grave environmental cost: A case from Greece. Energies 2017, 10, 430. [Google Scholar] [CrossRef]
  16. Punys, P.; Dumbrauskas, A.; Kvaraciejus, A.; Vyciene, G. Tools for small hydropower plant resource planning and development: A review of technology and applications. Energies 2011, 4, 1258–1277. [Google Scholar] [CrossRef]
  17. Zeleňáková, M.; Fijko, R.; Diaconu, D.C.; Remeňáková, I. Environmental impact of small hydro power plant—A case study. Environments 2018, 5, 12. [Google Scholar] [CrossRef]
  18. López Solano, C.; Turki, E.I.; Hamdi, Y.; Soloy, A.; Costa, S.; Laignel, B.; Gutiérrez Barceló, Á.D.; Abcha, N.; Jacono, D.; Lafite, R. Dynamics of Nearshore Waves during Storms: Case of the English Channel and the Normandy Coasts. Water 2022, 14, 321. [Google Scholar] [CrossRef]
  19. Didier, D.; Bernatchez, P.; Boucher-Brossard, G.; Lambert, A.; Fraser, C.; Barnett, R.L.; Van-Wierts, S. Coastal Flood Assessment Based on Field Debris Measurements and Wave Runup Empirical Model. J. Mar. Sci. Eng. 2015, 3, 560–590. [Google Scholar] [CrossRef]
  20. Chin, D.A.; Mazumdar, A.; Roy, P.K. Water-Resources Engineering; Prentice Hall: Englewood Cliffs, NJ, USA, 2000. [Google Scholar]
  21. Parameshwaran, R.; Dhulipalla, S.J.; Yendluri, D.R. Fluid-Structure Interactions and Flow Induced Vibrations: A Review. Procedia Eng. 2016, 144, 1286–1293. [Google Scholar] [CrossRef]
  22. Arias, I.; Knap, J.; Chalivendra, V.B.; Hong, S.; Ortiz, M.; Rosakis, A.J. Numerical Modelling and Experimental Validation of Dynamic Fracture Events along Weak Planes. Comput. Methods Appl. Mech. Eng. 2007, 196, 3833–3840. [Google Scholar] [CrossRef]
  23. Hou, G.; Wang, J.; Layton, A. Numerical Methods for Fluid-Structure Interaction—A Review. Commun. Comput. Phys. 2012, 12, 337–377. [Google Scholar] [CrossRef]
  24. Zawawi, M.H.; Saleha, A.; Salwa, A.; Hassan, N.H.; Zahari, N.M.; Ramli, M.Z.; Muda, Z.C. A Review: Fundamentals of Computational Fluid Dynamics (CFD). AIP Conf. Proc. 2018, 2030, 20252. [Google Scholar] [CrossRef]
  25. Singarella, P.N.; Adams, E.E. Physical and Numerical Modeling of the External Fluid Mechanics of OTEC Pilot Plants; Massachusetts Institute of Technology, Energy Laboratory: Cambridge, MA, USA, 1982. [Google Scholar]
  26. Hellgren, R. Influence of Fluid Structure Interaction on a Concrete Dam during Seismic Excitation: Parametric Analyses of an Arch Dam-Reservoir-Foundation System. In Proceedings of the Second International Dam World Conference, Lisbon, Portugal, 21–24 April 2015. [Google Scholar]
  27. Salem-Said, A.-H.; Fayed, H.; Ragab, S. Numerical Simulations of Two-Phase Flow in a Dorr-Oliver Flotation Cell Model. Minerals 2013, 3, 284–303. [Google Scholar] [CrossRef]
  28. Bertolazzi, E.; Manzini, G. A cell-centered second-order accurate finite volume method for convection-diffusion problems on unstructured meshes. Math. Model. Methods Appl. Sci. 2004, 14, 1235–1260. [Google Scholar] [CrossRef]
  29. Soucek, O. A Brief Introduction to Fluid-Structure Interactions Fluid-Structure Interactions Teaching Slides. 2012. Available online: https://geo.mff.cuni.cz/jednooci_slepym/os-FSI-intro.pdf (accessed on 29 March 2023).
  30. Fu, C.; Hafliðason, B. Progressive Failure Analyses of Concrete Buttress Dams: Influence of Crack Propagation on the Structural Dam Safety in Concrete Structures; Stockholm University: Stockholm, Sweden, 2015. [Google Scholar]
  31. Zawawi, M.H.; Hassan, N.H.; Ramli, M.Z.; Zahari, N.M.; Radzi, M.R.M.; Saleha, A.; Salwa, A.; Sidek, L.M.; Muda, Z.C.; Kamaruddin, M.A. Fluid-Structure Interactions Study on Hydraulic Structures: A Review. AIP Conf. Proc. 2018, 2030, 20244. [Google Scholar]
  32. Chizhiumov, S.D.; Kamenskih, I.V. The Models of Sea Waves Energy Converters. In Proceedings of the Tenth ISOPE Pacific-Asia Offshore Mechanics Symposium (PACOMS 2012), Vladivostok, Russia, 3–5 October 2012. [Google Scholar]
  33. Morton, I.D.; Bowers, J.; Mould, G. Estimating return period wave heights and wind speeds using a seasonal point process model. Coast. Eng. 1997, 3, 305–326. [Google Scholar] [CrossRef]
  34. Owens, E.H.; Schwartz, M. (Eds.) Beaches and Coastal Geology; Encyclopedia of Earth Sciences Series; Springer US: New York, NY, USA, 1984; p. 722. ISBN 9780879332136. [Google Scholar] [CrossRef]
  35. Reference material, Waves. The Bureau of Meteorology Provides Forecasts of Wave (Sea and Swell) Heights in Metres. 2023. Available online: http://www.bom.gov.au/marine/knowledge-centre/reference/waves.shtml (accessed on 5 May 2023).
  36. Wang, R.; Wan, J.; Cheng, R.; Wang, Y.; Wang, Z. Physical and Numerical Simulation of the Mechanism Underpinning Accumulation Layer Deformation, Instability, and Movement Caused by Changing Reservoir Water Levels. Water 2023, 15, 1289. [Google Scholar] [CrossRef]
  37. Zhou, J.; Li, Y. Modeling of the Free-Surface-Pressurized Flow of a Hydropower System with a Flat Ceiling Tail Tunnel. Water 2020, 12, 699. [Google Scholar] [CrossRef]
Figure 1. Geometrical parameters in the models: spoiler water inlets (a) and the spoiler water inlet water discharge phase (b).
Energies 16 04150 g001
Figure 2. Control volume structured grid showing each variable’s reference to the cell center.
Energies 16 04150 g002
Figure 3. CVM grid adaptation: (a) preliminary grid; (b) and (c)—simulation results in 0.5 and 2.3 s.
Energies 16 04150 g003
Figure 4. A 3-D grid adaptation of the model showing the simulation results after 2.3 s.
Energies 16 04150 g004
Figure 5. Diagram showing the flow velocity value change depending on the number of computational grid cells.
Energies 16 04150 g005
Figure 6. Flowchart showing wave disturbance generation by wave-product.
Energies 16 04150 g006
Figure 7. Diagrams showing the change in output parameters depending on various wave disturbances: (a) flow velocity; (b) circumferential velocity; (c) total pressure and (d) dynamic pressure.
Energies 16 04150 g007
Figure 8. Geometric parameters when calculating the task in a 2-D arrangement.
Energies 16 04150 g008
Figure 9. Geometric parameters when calculating the problem in a 3-D arrangement.
Energies 16 04150 g009
Figure 10. Diagrams showing the convergence and adaptation stages for the objectives in the simulation process with convergence parameters.
Energies 16 04150 g010
Figure 11. Analytical model for the total fluid head: 1—piezometer; 2—pitot tube; O–O—reference plane and p0—pressure on the fluid-free surface.
Energies 16 04150 g011
Figure 12. Diagrams showing changes in the output parameters when solving the problem in a 2-D arrangement for one wave period: (a) flow velocity and circumferential velocity and (b) dynamic and static pressure.
Energies 16 04150 g012
Figure 13. Diagrams showing changes in the output parameters when solving the problem in a 2-D arrangement for three wave periods: (a) flow velocity and circumferential velocity and (b) dynamic and static pressure.
Energies 16 04150 g013
Figure 14. Correlation between diagrams showing the fluid flow velocity, circumferential velocity and dynamic pressure with stages in the wave-with-FWPP interaction process.
Energies 16 04150 g014
Figure 15. Diagrams showing changes in the output parameters when solving a 3-D problem for one period: (a) flow velocity and circumferential velocity; (b) dynamic and static pressure and (c) volume flow rate.
Energies 16 04150 g015
Figure 16. Calculation visualization showing a wave disturbance generation with 0.5 Hz frequency and 375 mm amplitude: (a) 3-D visualization and (b) longitudinal cross-section visualization.
Energies 16 04150 g016
Figure 17. Pressure distribution diagram showing a watershed longitudinal cross-section with FWPP installation: (a) 3-D visualization and (b) longitudinal cross-section visualization.
Energies 16 04150 g017
Figure 18. Diagram showing the water flow velocity distribution in the watershed longitudinal cross-section with FWPP installation: (a) 3-D visualization and (b) longitudinal cross-section visualization.
Energies 16 04150 g018
Figure 19. Vector diagram showing the water flow velocity in the watershed with FWPP installation: (a) 3-D visualization and (b) longitudinal cross-section visualization.
Energies 16 04150 g019
Table 1. Recalculation of wave-product value parameters into wave-disturbance parameters.
Wave-Product Parameter Value
(A—Amplitude, kPa; T—Period, s)
Wave Parameter Value
(A—Amplitude (Maximum), m; T—Period, s)
A = 103 kPa, T = 1 sA = 0.4 m; T = 4 s
A = 106 kPa, T = 2 sA = 0.9 m; T = 6 s
A = 106 kPa, T = 0.5 sA = 0.4 m; T = 2 s
A = 106 kPa, T = 1 sA = 0.7 m; T = 4 s
Table 2. Calculation with monitoring and task convergence analysis.
NameCurrent ValueConvergence ProgressCriterionMean Value
Mass water discharge rate−0.238142 kg/s==37%0.015869 kg/s−0.24 kg/s
Volume water discharge rate−0.00023844 m3/s==37%1.59e-05 m3/s−0.0002 m3/s
Mean dynamic pressure141.535 Pa=====100%1.96204 Pa142.273 Pa
Mean circumferential velocity−0.02909867 m/s==36%0.00225 m/s−0.03236 m/s
Mean total pressure111622 Pa===55%20.7976 Pa111707 Pa
Mean velocity0.481418 m/s===59%0.002217 m/s0.48223 m/s
Mean static pressure111480 Pa===51%20.0992 Pa111565 Pa
Table 3. Estimates of water flow dynamics in the FWPP outlet collector.
ValuePressure p, PaQm,
kg/s
vav,
m/s
vmax,
m
StaticTotalDynamic
Mean110,505110,5159.97166.30.330.80
Minimum110,414110,4249.45−36.20.120.20
Maximum
(time, s)
115,500
(1.005)
115,517
(1.005)
384
(2.455)
405.8
(10)
0.93
(2.455)
1.61
(2.455)
Disclaimer/Publisher’s Note: The statements, opinions and data contained in all publications are solely those of the individual author(s) and contributor(s) and not of MDPI and/or the editor(s). MDPI and/or the editor(s) disclaim responsibility for any injury to people or property resulting from any ideas, methods, instructions or products referred to in the content.

